shoes for - brown shoe investor center |
TRANSCRIPT

2012 ANNUAL REPORT
SHOES FOR ALL OF LIFE’S WALKS

FINANCIAL HIGHLIGHTS(in millions, except per share data) 2012 2011 2010 2009 2008
Consolidated net sales . . . . . . . . . . . $ 2,598.1 $2,582 .8 $ 2,504 .1 $ 2,242 .0 $ 2,276 .4 Famous Footwear . . . . . . . . . . . 1,514.3 1,456 .3 1,486 .5 1,363 .6 1,320 .0 Wholesale Operations . . . . . . . . . 845.2 870 .9 754 .4 631 .8 703 .8 Specialty Retail . . . . . . . . . . . . . 238.5 255 .6 263 .2 246 .6 252 .5 Gross profit . . . . . . . . . . . . . . . . . . $ 1,010.4 $ 996 .6 $ 1,003 .6 $ 903 .1 $ 882 .2 Margin 38.9% 38 6% 40 1 % 40 3% 38 8%SG&A expenses . . . . . . . . . . . . . . . $ 919.0 $ 937 .3 $ 923 .0 $ 859 .7 $ 851 .8 Percent of net sales 35.4% 36 3% 36 9% 38 4% 37 4%Operating earnings (loss) . . . . . . . . . $ 61.6 $ 35 .6 $ 72 .7 $ 31 .5 ($ 173 .3) Percent of net sales 2.4% 1 4% 2 9% 1 4% - 7 6%Net earnings (loss) . . . . . . . . . . . . . $ 27.5 $ 24 .6 $ 37 .2 $ 9 .5 ($ 133 .2) Per share, diluted 0.64 0 56 0 85 0 22 (3 21) Adjusted per share, diluted* 1.13 0 70 0 97 0 40 0 47
* Non-GAAP financial measure
ABOUT US
GLOBAL
$2.6 BILLION
REVENUE
BrOwn ShOe COmpAny iS A $2.6 BilliOn, glOBAl fOOTweAr COmpAny whOSe ShOeS Are wOrn By peOple Of All AgeS, frOm All wAlkS Of life. ThrOUgh OUr BrOAd rAnge Of prOdUCTS, we Serve Three key mArkeT SegmenTS wiTh OUr fAmily, heAlThy living And COnTempOrAry fAShiOn BrAndS. At Famous Footwear, we provide consumers with a differentiated family footwear concept . Across the country, the Famous Footwear name is recognized as a distinctive and valued brand by consumers, for offering a unique and powerful proposition — an edited assortment of popular brands in an easy to shop experience — not easily replicated by competitors .
Our Healthy Living brands — Naturalizer, Dr . Scholl’s Shoes, LifeStride, Avia and Ryka — and our Contemporary Fashion brands — Via Spiga, Vince, Vera Wang, Sam Edelman, Franco Sarto, Carlos Santana and Fergie Footwear — are part of our compelling portfolio of wholesale demand brands . These are authentic brands that connect deeply with our target consumers on an emotional level .
Our engaged and empowered workforce means we have highly productive and motivated employees who not only share a vision of the company’s strategies and direction, but also have a feeling of personal responsibility for ensuring its outcome . Together, we operate under an efficient and cost-effective infrastructure, with functional systems, processes and people that effectively support the growth and profitability of our business .
Combined, this is just part of what helps us to inspire people to feel good and live better . . . feet first!
COmPELLINGAUTHENTICDIFFERENTIATEDPOwERFUL

+Our missiOn is tO inspire peOple tO feel gOOd and live better...
feet first!
LIVINGBETTER
2012 Brown Shoe Company annual report 1
DEAR SHAREHOLDERS
At BROwn SHOE COmpAny, 2012 wAS tERRifiC yEAR, By Any numBER Of mEASuRES. the combined efforts across our entire corporate organization
— and the continued focus on our strategic framework —
helped deliver on our portfolio realignment strategies, resulting
in a 106% increase in our stock price for the calendar year.
For 2012, we reported sales of $2,598 million, an improvement of 0.6% over
2011 sales of $2,583 million. excluding sales in both years for brands exited
as part of our portfolio realignment efforts, consolidated sales were up 2.6%.
our adjusted earnings per share improved more than 60% in 2012 to $1.13,
and we maintained our dividend return of $0.28 to shareholders in 2012.
we also strengthened our balance sheet, by reducing short-term borrowings
by nearly $100 million and by lowering our interest expense by approximately
$2.7 million. on the cost side of the equation, we worked to eliminate
corporate costs where possible and to institute good expense management
for other areas. as a result, we accomplished our 2012 goal of taking out more
than $18 million of SG&a expenses.
From a talent perspective, we made changes at the executive level with
the addition of russ hammer as CFo and mark Schmitt as CIo. with these
changes, we embarked on a more structured path to long-term success,
designed to help drive improved processes in both finance and It and across
the overall company.
INSPIRINGPEOPLE
fOcusedprOductivedriveninnOvative
FEELINGGOOD

2 2012 Brown Shoe Company annual report
turning to our business units, starting with Famous Footwear led by rick ausick. we had a record 2012 in terms of sales – crossing the $1.5 billion mark – and we also achieved gross profit of $666 million and record operating earnings of $94 million. Famous Footwear remains at the leading edge of our strategic efforts to build brand differentiation and brand equity.
our real estate strategy continued to drive improved revenue per square foot of $199 versus $186 in 2011, as we continued to put our Famous Footwear stores in the right places in 2012. we drove consumers to our stores with our new Victory marketing campaign, especially during back-to-school when same-store-sales were up 5.5%. Famous Footwear also delivered an overall record setting third quarter, with same-store-sales up 6.8%.
In 2012, we focused on omni-channel growth to maximize our investments in real estate, inventory assortment and marketing at Famous Footwear, and our efforts are paying off. Famous.com was up 22% in 2012, and we logged more than 60 million visits, with a quarter of those via mobile. In total, mobile revenue grew by more than 190% in 2012.
at wholesale, sales were up 1.6% over 2011, excluding exited brands. our contemporary fashion platform sales were up 11.0%, with our Sam edelman brand closing in on the $100 million sales threshold. For healthy living, sales were down 3.5%, as we saw mixed results across this platform.
For both wholesale platforms, we have been concentrating our efforts around our best performing brands to drive better results and deliver value for our shareholders, but there is still work to be done in 2013.
to this end, we aligned our contemporary fashion brands — including our celebrity brands — under Jay Schmidt, president of contemporary fashion, and 2012 was the first full year of this structure. Franco and Fergie benefitted greatly from focused attention at the platform level, with revenue for each up 20% and 55%, respectively.
TRENDRIGHTEVERYDAY

2012 Brown Shoe Company annual report 3
WELLNESSCOMFORTEVERYDAY
Similarly, we moved all of our healthy living brands to report to John mazurk, president of healthy living, so that we could leverage our long-standing history across this platform. we continued to see steady improvement across these brands, with Dr. Scholl’s Shoes delivering an improvement in operating earnings of more than 200% in 2012. meanwhile, lifeStride and ryka continued their quiet pattern of over performance, with revenue up 9% and 11%, respectively in 2012.
Sam edelman maintained its hot streak, with sales up 17% and with the successful launch of its flagship Soho store in new york — in the midst of hurricane Sandy. Sam capped off an amazing 2012 by being named brand of the year by Footwear news, in november.
today, we are a slightly smaller but leaner and more profitable company — with adjusted operating earnings up 45% over 2011. throughout the year, we worked hard to execute on our portfolio realignment efforts, at the infrastructure, retail and brand levels. I’m proud of what our entire team has accomplished over the past year, and I’m appreciative of our shareholders’ support as we worked each quarter to deliver on expectations. we will continue to provide details of our strategies and plans, as we develop them, and update you as we execute against them.
engagedempOweredaccOuntablepassiOnate
Diane m. SullivanPresident and Chief Executive Officer

4 2012 Brown Shoe Company annual report
2012 Net Sales dollars in millions
WHOLESALE
$845
RETAIL
$1,75367%
33%
Famous Footwear Average StoreRevenue Per Square Foot dollars
$199
$186$187
$167$168
$62
($173)$32
$73$36
Operating Earnings (Loss) dollars in millions
Wholesale Consumer Platform MixNet Sales dollars in millions
Contemporary Fashion
Healthy Living
Other $845$871
$754
$632$704
2008 2009 2010 2011 2012
Net Sales dollars in millions
$2,598
$2,276$2,242
$2,504$2,583
2008 2009 2010 2011 2012
2008 2009 2010 2011 2012
2008 2009 2010 2011 2012
0.0
36.5
73.0
Dividends and Adjusted Diluted Earnings* dollars per share
* Non-GAAP financial measure
2008 2009 2010 2011 2012
$1 .13$0.28
Dividends
Adjusted EPS, diluted
$0.47$0.28
$0.40$0.28
$0.97$0.28
$0.70$0.28
TRENDRIGHTEVERYDAY
finAnCiAL tREnDS AnD HiGHLiGHtS

2012 Brown Shoe Company, inC. form 10-k 5
UNITED STATES SECURITIES AND EXCHANGE COMMISSIONwashington, D.C. 20549
FORM 10-K(mark one)
Q annUaL reporT pUrSUanT To SeCTion 13 or 15(d) of The SeCUriTieS eXChanGe aCT of 1934 for the fiscal year ended february 2, 2013 or h TranSiTion reporT pUrSUanT To SeCTion 13 or 15(d) of The SeCUriTieS eXChanGe aCT of 1934 for the transition period from ____________ to ______________
Commission file number 1-2191
BROWN SHOE COMPANY, INC.(Exact name of registrant as specified in its charter)
new york 43-0197190 (State or other jurisdiction of incorporation or organization) (IRS Employer Identification Number) 8300 maryland avenue 63105 St. Louis, missouri (Zip Code) (Address of principal executive offices)
(314) 854-4000(Registrant’s telephone number, including area code)
Securities registered pursuant to Section 12(b) of the act:
Title of each class Name of each exchange on which registered Common Stock — par value $0.01 per share new york Stock exchange
Securities registered pursuant to Section 12(g) of the act: none
indicate by check mark if the registrant is a well-known seasoned issuer, as defined in rule 405 of the Securities act. yes h no Q
indicate by check mark if the registrant is not required to file reports pursuant to Section 13 or Section 15(d) of the act. yes h no Q
indicate by check mark whether the registrant: (1) has filed all reports required to be filed by Section 13 or 15(d) of the Securities exchange act of 1934 during the preceding 12 months (or for such shorter period that the registrant was required to file such reports), and (2) has been subject to such filing requirements for the past 90 days. yes Q no h
indicate by check mark whether the registrant has submitted electronically and posted on its corporate web site, if any, every interactive Data file required to be submitted and posted pursuant to rule 405 of regulation S-T (§ 232.405 of this chapter) during the preceding 12 months (or for such shorter period that the registrant was required to submit and post such files). yes Q no h
indicate by checkmark if disclosure of delinquent filers pursuant to item 405 of regulation S-k is not contained herein, and will not be contained, to the best of registrant’s knowledge, in definitive proxy or information statements incorporated by reference in part iii of this form 10-k or any amendment to this form 10-k. Q
indicate by checkmark whether the registrant is a large accelerated filer, an accelerated filer, a non-accelerated filer, or a smaller reporting company. See the definitions of “large accelerated filer,” “accelerated filer” and “smaller reporting company” in rule 12b-2 of the exchange act:
Large accelerated filer h accelerated filer Q non-accelerated filer h Smaller reporting company h
indicate by check mark whether the registrant is a shell company (as defined in rule 12b-2 of the act). yes h no Q
The aggregate market value of the stock held by non-affiliates of the registrant as of July 27, 2012, the last business day of the registrant’s most recently completed second fiscal quarter, was approximately $570.9 million.
as of march 1, 2013, 42,930,966 common shares were outstanding.
DoCUmenTS inCorporaTeD By referenCe
portions of the proxy Statement for the 2013 annual meeting of Shareholders are incorporated by reference into part iii.

6 2012 Brown Shoe Company, inC. form 10-k
INTRODUCTION
This annual report on form 10-k is a document that U.S. public companies file with the Securities and exchange Commission on an annual basis. part ii of the form 10-k contains the business information and financial statements that many companies include in the financial sections of their annual reports. The other sections of this form 10-k include further information about our business that we believe will be of interest to investors. we hope investors will find it useful to have all of this information in a single document.
The SeC allows us to report information in the form 10-k by “incorporating by reference” from another part of the form 10-k or from the proxy statement. you will see that information is “incorporated by reference” in various parts of our form 10-k. The proxy statement will be available on our website after it is filed with the SeC in april 2013.
Unless the context otherwise requires, “we,” “us,” “our,” “the Company” or “Brown Shoe Company” refers to Brown Shoe Company, inc. and its subsidiaries.
information in this form 10-k is current as of april 2, 2013, unless otherwise specified.
CAUTION REGARDING FORWARD-LOOKING STATEMENTS
in this report, and from time to time throughout the year, we share our expectations for our company’s future performance. These forward-looking statements include statements about our business plans; the potential development, regulatory approval and public acceptance of our products; our expected financial performance, including sales performance, and the anticipated effect of our strategic actions; the anticipated benefits of acquisitions; the outcome of contingencies, such as litigation; domestic or international economic, political and market conditions; and other factors that could affect our future results of operations or financial position, including, without limitation, statements under the captions “Business,” “Legal proceedings” and “management’s Discussion and analysis of financial Condition and results of operations.” any statements we make that are not matters of current reportage or historical fact should be considered forward-looking. Such statements often include words such as “believe,” “expect,” “anticipate,” “intend,” “plan,” “estimate,” “will” and similar expressions. By their nature, these types of statements are uncertain and are not guarantees of our future performance.
our forward-looking statements represent our estimates and expectations at the time that we make them. however, circumstances change constantly, often unpredictably, and investors should not place undue reliance on these statements. many events beyond our control will determine whether our expectations will be realized. we disclaim any current intention or obligation to revise or update any forward-looking statements, or the factors that may affect their realization, whether in light of new information, future events or otherwise, and investors should not rely on us to do so. in the interests of our investors, and in accordance with the “safe harbor” provisions of the private Securities Litigation reform act of 1995, part i. item 1a. Risk Factors below explain some of the important reasons that actual results may be materially different from those that we anticipate.

2012 Brown Shoe Company, inC. form 10-k 7
bROWN SHOE COMpANy, INC.2012 FORM 10-K
INDEX
pART I page
item 1 Business . . . . . . . . . . . . . . . . . . . . . . . . . . . . . . . . . . . . . . . . . . . . . . . . . . . . . . . . . . . . . . . . . . . . . . . . . . . . . . . . . . . . . . . . . . . . . . . . . . 8item 1a risk factors . . . . . . . . . . . . . . . . . . . . . . . . . . . . . . . . . . . . . . . . . . . . . . . . . . . . . . . . . . . . . . . . . . . . . . . . . . . . . . . . . . . . . . . . . . . . . . . 15item 1B Unresolved Staff Comments. . . . . . . . . . . . . . . . . . . . . . . . . . . . . . . . . . . . . . . . . . . . . . . . . . . . . . . . . . . . . . . . . . . . . . . . . . . . . . . . . 21item 2 properties . . . . . . . . . . . . . . . . . . . . . . . . . . . . . . . . . . . . . . . . . . . . . . . . . . . . . . . . . . . . . . . . . . . . . . . . . . . . . . . . . . . . . . . . . . . . . . . . . 21item 3 Legal proceedings. . . . . . . . . . . . . . . . . . . . . . . . . . . . . . . . . . . . . . . . . . . . . . . . . . . . . . . . . . . . . . . . . . . . . . . . . . . . . . . . . . . . . . . . . . 22item 4 mine Safety Disclosures . . . . . . . . . . . . . . . . . . . . . . . . . . . . . . . . . . . . . . . . . . . . . . . . . . . . . . . . . . . . . . . . . . . . . . . . . . . . . . . . . . . . . 22
pART II
item 5 market for registrant’s Common equity, related Stockholder matters and issuer purchases of equity Securities . . . . . . 22item 6 Selected financial Data . . . . . . . . . . . . . . . . . . . . . . . . . . . . . . . . . . . . . . . . . . . . . . . . . . . . . . . . . . . . . . . . . . . . . . . . . . . . . . . . . . . . . 24item 7 management’s Discussion and analysis of financial Condition and results of operations . . . . . . . . . . . . . . . . . . . . . . . . . . 25item 7a Quantitative and Qualitative Disclosures about market risk. . . . . . . . . . . . . . . . . . . . . . . . . . . . . . . . . . . . . . . . . . . . . . . . . . . . . 42item 8 financial Statements and Supplementary Data . . . . . . . . . . . . . . . . . . . . . . . . . . . . . . . . . . . . . . . . . . . . . . . . . . . . . . . . . . . . . . . . 42 management’s report on internal Control over financial reporting . . . . . . . . . . . . . . . . . . . . . . . . . . . . . . . . . . . . . . . . . 42 report of independent registered public accounting firm . . . . . . . . . . . . . . . . . . . . . . . . . . . . . . . . . . . . . . . . . . . . . . . . . 43 report of independent registered public accounting firm . . . . . . . . . . . . . . . . . . . . . . . . . . . . . . . . . . . . . . . . . . . . . . . . . 44 Consolidated Balance Sheets . . . . . . . . . . . . . . . . . . . . . . . . . . . . . . . . . . . . . . . . . . . . . . . . . . . . . . . . . . . . . . . . . . . . . . . . . . . 45 Consolidated Statements of earnings . . . . . . . . . . . . . . . . . . . . . . . . . . . . . . . . . . . . . . . . . . . . . . . . . . . . . . . . . . . . . . . . . . . . 46 Consolidated Statements of Comprehensive income. . . . . . . . . . . . . . . . . . . . . . . . . . . . . . . . . . . . . . . . . . . . . . . . . . . . . . . 47 Consolidated Statements of Cash flows. . . . . . . . . . . . . . . . . . . . . . . . . . . . . . . . . . . . . . . . . . . . . . . . . . . . . . . . . . . . . . . . . . 48 Consolidated Statements of Shareholders’ equity . . . . . . . . . . . . . . . . . . . . . . . . . . . . . . . . . . . . . . . . . . . . . . . . . . . . . . . . . 49 notes to Consolidated financial Statements . . . . . . . . . . . . . . . . . . . . . . . . . . . . . . . . . . . . . . . . . . . . . . . . . . . . . . . . . . . . . . 50 Schedule ii – Valuation and Qualifying accounts . . . . . . . . . . . . . . . . . . . . . . . . . . . . . . . . . . . . . . . . . . . . . . . . . . . . . . . . . . 83item 9 Changes in and Disagreements with accountants on accounting and financial Disclosure . . . . . . . . . . . . . . . . . . . . . . . . . 83item 9a Controls and procedures . . . . . . . . . . . . . . . . . . . . . . . . . . . . . . . . . . . . . . . . . . . . . . . . . . . . . . . . . . . . . . . . . . . . . . . . . . . . . . . . . . . . 83 evaluation of Disclosure Controls and procedures . . . . . . . . . . . . . . . . . . . . . . . . . . . . . . . . . . . . . . . . . . . . . . . . . . . . . . . . . 83 internal Control over financial reporting . . . . . . . . . . . . . . . . . . . . . . . . . . . . . . . . . . . . . . . . . . . . . . . . . . . . . . . . . . . . . . . . 84item 9B other information . . . . . . . . . . . . . . . . . . . . . . . . . . . . . . . . . . . . . . . . . . . . . . . . . . . . . . . . . . . . . . . . . . . . . . . . . . . . . . . . . . . . . . . . . . 84
pART III
item 10 Directors, executive officers and Corporate Governance. . . . . . . . . . . . . . . . . . . . . . . . . . . . . . . . . . . . . . . . . . . . . . . . . . . . . . . . 84item 11 executive Compensation. . . . . . . . . . . . . . . . . . . . . . . . . . . . . . . . . . . . . . . . . . . . . . . . . . . . . . . . . . . . . . . . . . . . . . . . . . . . . . . . . . . . 84item 12 Security ownership of Certain Beneficial owners and management and related Stockholder matters . . . . . . . . . . . . . . . 85item 13 Certain relationships and related Transactions, and Director independence . . . . . . . . . . . . . . . . . . . . . . . . . . . . . . . . . . . . . . 85item 14 principal accounting fees and Services. . . . . . . . . . . . . . . . . . . . . . . . . . . . . . . . . . . . . . . . . . . . . . . . . . . . . . . . . . . . . . . . . . . . . . . 85
pART IV
item 15 exhibits and financial Statement Schedules. . . . . . . . . . . . . . . . . . . . . . . . . . . . . . . . . . . . . . . . . . . . . . . . . . . . . . . . . . . . . . . . . . . 86

8 2012 Brown Shoe Company, inC. form 10-k
pART I
ITEM 1 bUSINESS
Brown Shoe Company, inc., founded in 1878 and incorporated in 1913, is a global footwear retailer and wholesaler. Current activities include the operation of retail shoe stores and e-commerce websites as well as the design, sourcing and marketing of footwear for women and men. our mission is to inspire people to feel good and live better...feet first! we are a global footwear company with annual net sales of $2.6 billion that puts consumers and their needs first, by targeting family, healthy living and contemporary fashion platforms. our business is seasonal in nature due to consumer spending patterns, with higher back-to-school and Christmas and easter holiday season sales. Traditionally, the third fiscal quarter accounts for a substantial portion of our earnings for the year.
our accounting period is based upon a traditional retail calendar, which ends on the Saturday nearest January 31. periodically, this results in a fiscal year that includes 53 weeks. our 2012 fiscal year included 53 weeks, while both our 2011 and 2010 fiscal years had only 52 weeks. The difference in the number of weeks included in our fiscal years can affect annual comparisons.
During 2012, categories of our consolidated net sales were approximately 62% women’s footwear, 24% men’s footwear, 10% children’s footwear and 4% accessories. This composition has remained relatively constant over the past few years. approximately 67% of 2012 footwear sales represented retail sales, including sales through our e-commerce websites, compared to 66% in 2011 and 70% in 2010, and the remaining 33%, 34% and 30% in the respective years represented wholesale sales. See note 7 to the consolidated financial statements for additional information regarding our business segments and financial information by geographic area.
we had approximately 14,100 full-time and part-time employees as of february 2, 2013. in the United States, there are no employees subject to union contracts. in Canada, we employ approximately 20 warehousing employees under a union contract, which expires in october 2013.
RETAIL OpERATIONS
our retail operations at february 2, 2013, included 1,277 retail shoe stores in the United States, Canada, China and Guam. The number of our retail footwear stores at the end of each of the last three fiscal years was as follows:
2012 2011 2010famous footwear . . . . . . . . . . . . . . . . . . . . . . . . . . 1,055 1,089 1 ,1 10Specialty retail . . . . . . . . . . . . . . . . . . . . . . . . . . . . 222 234 259Total . . . . . . . . . . . . . . . . . . . . . . . . . . . . . . . . . . 1,277 1,323 1,369
During 2012, famous footwear opened 55 stores and closed 89 stores. During 2012, Specialty retail opened 29 stores and closed 41 stores.
with many companies operating retail shoe stores and shoe departments, we compete in a highly fragmented market. Competitors include local, regional and national shoe store chains, department stores, discount stores, mass merchandisers, numerous independent retail operators of various sizes and internet retailers. Quality of products and services, store location, trend-right merchandise selection and availability of brands, pricing, advertising and consumer service are all factors that impact retail competition.
Famous Footwearour family platform includes famous footwear, which is one of america’s leading family branded footwear retailers based on 1,055 stores at the end of 2012, net sales of $1.5 billion in 2012 and published information on our direct competitors. our target consumers are women who buy brand-name fashionable shoes at a value for themselves and their families. in addition to our retail footwear stores, we operate famous.com. our omni-channel strategy provides our customer numerous shopping experiences, access to a wider range of products and a variety of delivery options.
famous footwear stores feature a wide selection of brand-name, athletic, casual and dress shoes for the entire family. Brands carried include, among others, nike, Skechers, new Balance, Converse, adidas, DC, LifeStride, reebok, Sperry, asics, puma, Dr. Scholl’s Shoes, Vans, BoC by Born, Sof Sole, fergalicious and Bearpaw. we work closely with our vendors to provide our consumers with fresh product and, in some cases, product exclusively designed for and available only in our stores. famous footwear’s average retail price is approximately $39 for footwear with retail price points typically ranging from $22 for shoes up to $120 for boots.
famous footwear sells various Brown Shoe Company owned and licensed products. Such products are sold to famous footwear by our wholesale operations segment at a profit and represent approximately 14% of famous footwear net sales.

2012 Brown Shoe Company, inC. form 10-k 9
famous footwear stores are located in strip shopping centers as well as outlet and regional malls in all 50 states and Guam. The breakdown by venue is as follows at the end of each of the last three fiscal years:
2012 2011 2010Strip centers . . . . . . . . . . . . . . . . . . . . . . . . . . . . . 726 744 762outlet malls . . . . . . . . . . . . . . . . . . . . . . . . . . . . . . 167 169 174regional malls . . . . . . . . . . . . . . . . . . . . . . . . . . . . 162 176 174Total . . . . . . . . . . . . . . . . . . . . . . . . . . . . . . . . . . 1,055 1,089 1 ,1 10
Stores open at the end of 2012 and 2011 averaged approximately 6,800 and 6,900 square feet, respectively. Total square footage at the end of 2012 decreased 3.7% to 7.2 million square feet compared to 7.5 million at the end of 2011. we expect to open approximately 55 new stores and close approximately 60 stores in 2013. new stores typically experience an initial start-up period characterized by lower sales and operating earnings than what is generally achieved by more mature stores or the division as a whole. while the duration of this start-up period may vary by type of store, economic environment and geographic location, new stores typically reach a normal level of profitability within approximately four years.
Sales per square foot were $199 in 2012, which was up from $186 in 2011. Same-store sales increased 4.5% during 2012, on a 52-week basis. Same-store sales changes are calculated by comparing the sales in stores that have been open at least 13 months. relocated stores are treated as new stores, and closed stores are excluded from the calculation. Sales change from new and closed stores, net, reflects the change in net sales due to stores that have been opened or closed during the period and are thereby excluded from the same-store sales calculation. e-commerce sales for those e-commerce websites that function as an extension of a retail chain are included in the same-store sales calculation.
famous footwear relies on merchandise allocation systems and processes that use allocation criteria, consumer segmentation and inventory data in an effort to ensure stores are adequately stocked with products and to differentiate the needs of each store based on location, consumer segmentation and other factors. famous footwear’s distribution systems allow for merchandise to be delivered to each store weekly, or on a more frequent basis, as needed. famous footwear also utilizes regional third-party pooled distribution sites across the country. famous footwear’s in-store point-of-sale systems provide detailed sales transaction data to our corporate office for daily update and analysis in the perpetual inventory and merchandise allocation systems. Certain of these systems also are used for training employees and communication between the stores and corporate office.
famous footwear’s marketing programs include national television, print, digital marketing and social networking, in-store advertisements and radio, all of which are designed to further develop and reinforce the famous footwear concept and strengthen our connection with consumers. we believe the success of our campaigns is attributable to highlighting key categories and tailoring the timing of such messaging to adapt to seasonal shopping patterns. in 2012, we spent approximately $55.9 million to advertise and market famous footwear to our target consumer, a portion of which was recovered from suppliers. famous footwear has a robust loyalty program (“rewards”), which informs and rewards frequent consumers with product previews, earned incentives based upon purchase continuity and other periodic promotional offers. in 2012, approximately 66% of our famous footwear net sales were generated by our rewards members. During the year, we expanded our efforts to connect with and engage our customers to build a strong brand preference for famous footwear through our loyalty program. in 2013, we will continue to seek new and expand existing channels for consumers to connect with famous footwear (beyond email, facebook, Twitter, youTube and proprietary mobile applications) to drive our fans from the digital world into profitable and loyal consumers in our omni-channel selling environments.
Specialty Retailour Specialty retail segment, composed of 222 stores as of february 2, 2013, includes the following retail concepts, Shoes.com and our other e-commerce businesses, with the exception of famous.com, which is included in the famous footwear segment.
Naturalizernaturalizer retail stores are a showcase for our naturalizer brand of women’s shoes. These stores are designed and merchandised to appeal to the naturalizer consumer, who is style and comfort conscious and seeks quality and value in her footwear selections. The naturalizer stores offer a selection of women’s footwear styles, including casual, dress, sandals and boots, primarily under the naturalizer brand. retail price points typically range from $69 for shoes to $199 for boots. The majority of products sold in our retail stores are purchased from our wholesale operations segment at a customary gross profit rate.
at the end of 2012, we operated 100 naturalizer stores in the United States (including a store in Guam) and 90 naturalizer stores in Canada. of the total 190 stores, approximately 55% are located in regional malls, with a few stores having street locations, and average approximately 1,200 square feet in size. The other 45% of stores are located in outlet malls and

10 2012 Brown Shoe Company, inC. form 10-k
average approximately 2,400 square feet in size. Total square footage at the end of 2012 was 332,000 compared to 335,000 in 2011. in 2012, we closed 20 stores in the United States and Canada, primarily in regional malls and we opened 13 stores, primarily in outlet malls. we expect to open 10 stores and close 25 stores in 2013.
at the end of 2012, through our majority-owned subsidiary, B&h footwear Company Limited (“B&h footwear”), we also operated 26 stores in several of China’s largest cities. we expect to open five stores in China in 2013. in addition, our joint venture partner, hongguo international holdings Limited (“hongguo”), operated 79 stores at the end of 2012 and expects to add approximately 22 stores in 2013. naturalizer footwear is distributed through these stores operated by B&h footwear and hongguo. See note 16 to the consolidated financial statements for additional information about B&h footwear.
marketing programs for our naturalizer stores have complemented our naturalizer brand advertising by building on the brand’s consumer recognition and value proposition, and reinforcing the brand’s focus on effortless style, comfort and quality. naturalizer utilizes a database-marketing program, which targets frequent consumers through catalogs and other mailings that display the brand’s product offerings. Consumers can purchase the products in these catalogs from our stores, online at naturalizer.com and naturalizer.ca or by phone.
E-Commerce/Direct-To-Consumerwe own and operate Shoes.com, inc., a pure-play internet retailing company. Shoes.com offers a diverse selection of footwear and accessories for women, men and children, including footwear purchased from third-party suppliers and Brown Shoe Company.
in connection with our omni-channel approach to reach consumers, we also operate famous.com (included in our famous footwear segment), naturalizer.com, naturalizer.ca and DrSchollsShoes.com, which offer substantially the same product selection to consumers as sold in their respective retail stores, except famous.com which offers an expanded assortment as a result of the vendor drop ship program. additional websites such as ViaSpiga.com, LifeStride.com and ryka.com function as retail outlets for the online consumer and serve as additional brand-building vehicles for us.
references to our website addresses do not constitute incorporation by reference of the information contained on the websites and the information contained on the websites is not part of this report.
Other Store Conceptsat the end of 2012, our Specialty retail segment also included a total of six retail stores operated under the Dr. Scholl’s Shoes and Sam edelman names. During 2013, we plan on opening one Sam edelman store.
WHOLESALE OpERATIONS
our wholesale operations segment designs, sources and markets branded footwear for women and men at a variety of price points. Certain of our branded footwear products are developed pursuant to licensing agreements. we also receive royalty revenues for licensing owned brands to third-parties. our footwear is distributed to over 3,000 retailers, including national chains, department stores, independent retailers, mass merchandisers, online retailers and catalogs throughout the United States and Canada as well as approximately 60 other countries (including sales to our retail segments). The most significant wholesale customers include many of the nation’s largest retailers: national chains such as DSw, TJX Corporation (including TJ maxx and marshalls), kohl’s and ross Stores; department stores such as macy’s, nordstrom, Bon-Ton, Belk and Dillard’s; and mass merchandisers such as wal-mart and Target; and online retailers, such as Zappos.com, amazon.com, piperlime.com and famous.com. we also sell product to a variety of international retail customers and distributors. The loss of any one or more of our significant customers could have a material negative impact on our wholesale operations and the Company.
The vast majority of our wholesale customers also sell shoes purchased from competing footwear suppliers. Those competing footwear suppliers own and license brands, many of which are well-known and marketed aggressively. many retailers, who are our wholesale customers, are increasing the amount of private brand-name footwear that they source directly from factories or through agents. The wholesale footwear business has low barriers to entry, which further intensifies competition. in addition, some competitors have successfully branded their trademarks as lifestyle brands, resulting in a greater competitive advantage to those companies.
in 2012, our wholesale operations segment sold approximately 56 million pairs of shoes. we sell footwear to wholesale customers on both a landed and first-cost basis. Landed sales are those in which we obtain title to the footwear from our overseas suppliers and maintain title until the footwear clears United States customs and is shipped to our wholesale customers. Landed sales generally carry a higher profit rate than first-cost sales as a result of the brand equity associated with the product along with the additional customs, warehousing and logistics services provided to customers and the risks associated with inventory ownership. first-cost sales are those in which we obtain title to footwear from our overseas suppliers and typically relinquish title to customers at a designated overseas port. many of these customers then import this product into the United States. To allow for the prompt shipment on reorders, we carry inventories of certain high-volume styles.

2012 Brown Shoe Company, inC. form 10-k 11
Marketingwe continue to build on the recognition of our wholesale brands to create differentiation and consumer loyalty. marketing teams are responsible for the development and implementation of marketing programs for each brand, both for us and for our retail partners. in 2012, we spent approximately $21.5 million in advertising and marketing support, including public relations, tradeshows, consumer media advertising, production, cooperative advertising, advertising agencies and digital advertising with our wholesale customers. The marketing teams are also responsible for driving the development of branding and content for our brand websites. we continually focus on enhancing the effectiveness of these marketing efforts through market research, product development and marketing communications that collectively address the ever-changing lives and needs of our consumers. in 2012, the marketing teams were instrumental in the development and execution of new product launches, including target consumer identification, branding, positioning and marketing to both the consumer and trade audiences. we intend to continue the growth of our social media presence as we believe increasing our focus on social media will help drive us into the next generation of marketing, allowing us to connect even more intimately with consumers.
portfolio of brandswholesale operations offers retailers a portfolio of leading brands from our healthy living and contemporary fashion platforms. The following is a listing of our principal brands and licensed products:
Healthy LivingNaturalizer: introduced in 1927, naturalizer has become a global family of comfort lifestyle footwear brands meeting the needs of women across the marketplace with uncompromising comfort, fit and style. our flagship naturalizer brand is sold primarily at naturalizer retail stores, national chains, department stores, online retailers, catalog retailers and independent retailers. The brand is distributed in 60 countries around the world. Suggested retail price points range from $69 for shoes to $199 for boots. naturalizer held the no. 2 market share position in the moderate zone within the women’s fashion footwear category across npD tracked point-of-sale channels at the end of 2012, according to The npD Group/retail Tracking Service. natural Soul by naturalizer provides women with uncompromising value and is sold primarily in national chains, our naturalizer outlet stores and famous footwear retail stores. The brand held the no. 6 market share position in the moderate zone within the women’s fashion footwear category across npD tracked point-of-sale channels at the end of 2012, according to The npD Group/retail Tracking Service. Suggested retail price points range from $69 for shoes to $109 for boots.
Dr. Scholl’s Shoes: Dr. Scholl’s Shoes is an authentic brand of innovative footwear designed with uncomplicated, playful style for a healthier life. Dr. Scholl’s Shoes delivers proprietary comfort technology across all distribution tiers. Dr. Scholl’s Shoes crafts unique styles that offer men and women the freedom to live active lives of discovery and play with ease; inspires them with designs that express their youthful spirit; and champions an optimistic lifestyle of relaxed confidence and spontaneity. This footwear reaches consumers at a wide range of distribution channels: mass merchandisers, national chains, on-line and catalogs, specialty and independent retailers and department stores and our famous footwear retail stores. Suggested price points range from $25 to $150. Dr. Scholl’s Shoes held the no. 8 market share position in the comfort zone within the women’s fashion footwear category across npD tracked point-of-sale channels (defined as department stores, national chains, athletic specialty/sporting goods and shoe chains) at the end of 2012, according to The npD Group/retail Tracking Service. we have a long-term license agreement with mSD Consumer Care, inc. (formerly Schering-plough healthcare products, inc.) to sell Dr. Scholl’s Shoes, which is renewable through 2026 for the United States and Canada and 2014 for Latin america.
LifeStride: for more than 70 years, LifeStride has created quality footwear for women who value style and comfort. offering work-to-weekend styles, LifeStride is both versatile and comfortable for all-day wear. LifeStride’s rich history and attention to comfort create delight at first sight with trend-right styling, feminine, details and great value. with the introduction of SoftSystem® comfort technology, LifeStride offers comfortable, work-to-weekend footwear that dresses up or down at the right value. The brand is sold in department stores, national chains, on-line and our famous footwear retail stores. Suggested retail price points range from $50 to $100. LifeStride ranked no. 3 in market share position in the moderate zone within the women’s fashion footwear category across npD tracked point-of-sale channels at the end of 2012, according to The npD Group/retail Tracking Service.
Avia: avia is a sports enthusiast and fitness brand offering shoes for serious and recreational athletes. The brand is primarily distributed through national chains, mass merchandisers and our famous footwear retail stores at retail price points from $50 to $110. The brand held the no. 15 market share position in the athletic zone within the women’s footwear category across npD tracked point-of-sale channels at the end of 2012, according to The npD Group/retail Tracking Service.
Ryka: ryka is a women’s performance lifestyle brand focused on fitness. ryka is managed, designed and solely dedicated to creating women’s performance footwear. The brand is distributed through department stores, specialty retailers and our famous footwear retail stores at retail price points from $45 to $85.
Nevados: nevados is focused on satisfying the needs of men and women outdoor enthusiasts. The brand is primarily distributed through national chains and mass merchandisers at retail price points from $35 to $90.

12 2012 Brown Shoe Company, inC. form 10-k
Contemporary FashionSam Edelman: Sam captures the imagination of women with on trend styling and unique materials. in 2012, the brand opened its flagship store in new york City. The brand is sold primarily through department stores and independent retailers at suggested retail price points starting at $65 for sandals, $90 for flats, $100 for heels and $200 for boots. Sam edelman held the no. 6 market share position in the bridge/designer zone within the women’s fashion footwear category across npD tracked point-of-sale channels at the end of 2012, according to The npD Group/retail Tracking Service. Sam edelman was named brand of the year by footwear news.
Franco Sarto: The franco Sarto brand has a loyal, career-focused consumer who is passionate about the brand’s modern italian-inspired style, fit and quality. The brand is sold in major national chains, department stores and independent retailers at suggested retail price points from $79 for shoes to $225 for boots. franco Sarto ranked no. 5 in market share position in the better zone within the women’s fashion footwear category across npD tracked point-of-sale channels at the end of 2012, according to The npD Group/retail Tracking Service. we have a license agreement with fashion Shoe Licensing LLC to sell franco Sarto footwear that expires in 2019.
Via Spiga: Via Spiga provides chic, sophisticated footwear for the cosmopolitan woman who wants to make a fashion statement every day. The brand is primarily sold in the bridge/designer zone in premier department stores and upscale boutiques. This brand sells at suggested retail price points from $50 for shoes to $398 for boots. The brand held the no. 7 market share position in the bridge/designer zone within the women’s fashion footwear category across npD tracked point-of-sale channels at the end of 2012, according to The npD Group/retail Tracking Service.
Fergie and Fergalicious by Fergie: we have created two namesake footwear lines in collaboration with entertainment superstar fergie (Stacy ferguson) to fully capture the multifaceted aspects of fergie’s life as an award-winning singer, songwriter and actress. fergie footwear portrays the artist’s confident, individual style in a line of sophisticated, sexy footwear with a glam rock influence. The brand launched in spring of 2009 and is currently being sold at better department stores, boutiques, independent retailers and online at retail price points of $60 for shoes to $200 for boots. fergalicious by fergie shoes have a fun, funky attitude inspired by her pop rock persona. fergalicious by fergie also launched in spring 2009 and is available at famous footwear, famous.com and other national chains at retail price points of $40 for shoes to $100 for boots. fergalicious held the no. 9 market share position in the moderate zone within the women’s fashion footwear category across npD tracked point-of-sale channels at the end of 2012, according to The npD Group/retail Tracking Service. we have a license agreement with krystal Ball productions to sell fergie/fergalicious footwear that expires in 2014.
Carlos by Carlos Santana: The Carlos by Carlos Santana collection of women’s footwear is sold at major department stores, national chains and our famous footwear stores. marketed under a license agreement with legendary musician Carlos Santana, this brand targets trend-conscious consumers with hot, fashionable shoes inspired by the passion and energy of Santana’s music. Suggested retail price points range from $89 for shoes to $225 for boots. Carlos by Carlos Santana holds the no. 16 market share position in the better zone within the women’s fashion footwear category across npD tracked point-of-sale channels at the end of 2012, according to npD Group. we have a license from Santana Tesoro, LLC to sell Carlos by Carlos Santana footwear that expires in 2014 with extension options through 2020.
Vera Wang: The Vera wang shoe collection interprets Vera’s strong, edgy attitude and offers the consumer unique product for her contemporary, fashion-savvy lifestyle. The brand is sold in the designer section in premier department stores at retail prices ranging from $150 for shoes to $550 for boots. we have a license agreement with Vera wang Licensing LLC to sell Vera wang footwear that expires in 2013, with an extension option through 2016.
Vince: The Vince shoe collection launched in the fall of 2012 at premier department stores and upscale boutiques. Vince delivers contemporary casual footwear that a sophisticated, modern woman wears effortlessly, serving as a functional luxury basic for all her lifestyle needs. Suggested price points range from $150 for shoes and $595 for boots. we have a license agreement with kellwood Company to sell Vince footwear that expires in 2015, with an extension option through 2020.
products sold under license agreements accounted for wholesale operations’ net sales of approximately 47% in 2012, 37% in 2011 and 44% in 2010. Brown Shoe Company also receives royalty revenues for licensing owned brands, including brands listed above, to third-parties.
portfolio RealignmentDuring 2012, we substantially completed our portfolio realignment initiatives that began in 2011. These portfolio realignment initiatives included selling The Basketball marketing Company, inc. (“TBmC”) (markets and sells footwear bearing the anD 1 brand name, which was acquired with american Sporting Goods Corporation (“aSG”)); exiting certain women’s specialty and private label brands; exiting the children’s wholesale business; closing two U.S. distribution centers; closing or relocating numerous underperforming or poorly aligned retail stores; closing facilities in China; and other infrastructure changes.

2012 Brown Shoe Company, inC. form 10-k 13
During 2012, we terminated our etienne aigner license agreement (“former license agreement”), due to a dispute with the licensor. in conjunction with the termination, the Company recognized an impairment charge of $5.8 million to reduce the remaining unamortized value of the licensed trademark intangible asset to zero. The termination of the etienne aigner license agreement is also considered part of our portfolio realignment initiatives.
brown Shoe Company Sourcing and product Development OperationsBrown Shoe Company sourcing and product development operations source and develop footwear for our wholesale operations and Specialty retail segments and also a portion of the footwear sold by our famous footwear segment. we have sourcing and product development offices in China, hong kong, italy, macau, St. Louis, Los angeles and new york.
Sourcing Operationsin 2012, the sourcing operations sourced approximately 52 million pairs of shoes through a global network of third-party independent footwear manufacturers. of the approximate 52 million pairs sourced in 2012, our owned and operated factories in central China produced approximately six million pairs for our avia, ryka, Dr. Scholl’s Shoes and naturalizer brands. This structure enables us to source footwear at various price levels from key shoe manufacturing regions of the world. The majority of our footwear sourced is provided by approximately 55 manufacturers operating approximately 80 manufacturing facilities.
in certain countries, we utilize agents to facilitate and manage the development, production and shipment of product. we attribute our ability to achieve consistent quality, competitive prices and on-time delivery to the breadth of these established relationships. while we do not have any significant contractual commitments with our suppliers, we do enter into sourcing agreements with certain independent sourcing agents.
prior to production, we monitor the quality of all of our footwear components and also inspect the prototypes of each footwear style. we have leading lab testing facilities in our Dongguan, putian and JiangXi, China offices, which provide high quality footwear for our customers. we also perform random in-line quality control checks during production and before any footwear leaves the manufacturing facility.
in 2012, approximately 97% of the footwear we sourced was from manufacturing facilities in China. The following table provides an overview of our foreign sourcing in 2012:
Country Millions of pairsChina. . . . . . . . . . . . . . . . . . . . . . . . . . . . . . . . . . . . . . . . 50.6all other . . . . . . . . . . . . . . . . . . . . . . . . . . . . . . . . . . . . . . 1 .8Total . . . . . . . . . . . . . . . . . . . . . . . . . . . . . . . . . . . . . . . . 52.4
Product Development Operationsin our Dongguan, putian and JiangXi, China offices, we operate a total of four sample-making facilities with unique and diverse capabilities. By operating these facilities, we have greater control over our product development, in terms of accuracy, execution and time to market.
we maintain design teams for our brands in St. Louis, Los angeles, new york and China as well as other select fashion locations, including italy. These teams, which include independent designers, are responsible for the creation and development of new product styles. our designers monitor trends in apparel and footwear fashion and work closely with retailers to identify consumer footwear preferences. our design teams create collections of footwear and work closely with our product development and sourcing offices to convert our designs into new footwear styles.
our long range plans include expanding into new markets outside China, developing more progressive processes to improve factory capacity and material planning and continuing to understand ways to drive excellence in product value and execution in a rapidly changing manufacturing landscape.
backlogat february 2, 2013, our wholesale operations segment had a backlog of unfilled orders of approximately $302.0 million compared to $296.8 million on January 28, 2012. most orders are for delivery within the next 90 to 120 days, and although orders are subject to cancellation, we have not experienced significant cancellations in the past. The backlog at any particular time is affected by a number of factors, including seasonality, the continuing trend among customers to reduce the lead time on their orders and capacity shifts in China. accordingly, a comparison of backlog from period to period is not necessarily meaningful and may not be indicative of eventual actual shipments or the growth rate of sales from one period to the next.

14 2012 Brown Shoe Company, inC. form 10-k
AVAILAbLE INFORMATION
our internet address is www.brownshoe.com. our internet address is included in this annual report on form 10-k as an inactive textual reference only. The information contained on our website is not incorporated by reference into this annual report on form 10-k and should not be considered part of this report. we file annual, quarterly and current reports, proxy statements and other information with the Securities and exchange Commission (“SeC”). we make available free of charge our annual report on form 10-k, quarterly reports on form 10-Q, current reports on form 8-k and amendments to those reports filed or furnished, as required by Section 13(a) or 15(d) of the Securities exchange act of 1934, through our internet website as soon as reasonably practicable after we electronically file such material with or furnish it to the SeC. you may access these SeC filings via the hyperlink to a third-party SeC filings website that we provide on our website.
EXECUTIVE OFFICERS OF THE REGISTRANT
The following is a list of the names and ages of the executive officers of the Company and of the offices held by each person. There is no family relationship between any of the named persons. The terms of the following executive officers will expire in may 2013 or upon their respective successors being chosen and qualified.
Name Age Current position Diane m. Sullivan 57 president and Chief executive officerrichard m. ausick 59 Division president – retailDaniel r. friedman 52 Division president – Global Supply Chainrussell C. hammer 56 Senior Vice president and Chief financial officerDouglas w. koch 61 Senior Vice president and Chief Talent and Strategy officerJohn r. mazurk 59 Division president – healthy Living Brandsmichael i. oberlander 44 Senior Vice president, General Counsel and Corporate SecretaryJohn w. Schmidt 52 Division president – Contemporary fashion Brandsmark a. Schmitt 49 Senior Vice president and Chief information officer The period of service of each officer in the positions listed and other business experience are set forth below.
Diane M. Sullivan, president and Chief executive officer since may 2011. president and Chief operating officer from march 2006 to may 2011. president from January 2004 to march 2006.
Richard M. Ausick, Division president – retail since January 2011. Division president – famous footwear from January 2010 to January 2011. Division president, Brown Shoe wholesale from July 2006 to January 2010. Senior Vice president and Chief merchandising officer of famous footwear from January 2002 to July 2006.
Daniel R. Friedman, Division president – Global Supply Chain since January 2010. Senior Vice president, product Development and Sourcing from July 2006 to January 2010. managing Director at Camuto Group, inc. from 2002 to July 2006.
Russell C. Hammer, Senior Vice president and Chief financial officer since June 2012. Chief financial officer of orbitz from January 2011 to June 2012. Chief financial officer of Crocs from January 2008 to December 2010.
Douglas W. Koch, Senior Vice president and Chief Talent and Strategy officer since January 2011. Senior Vice president and Chief Talent officer from may 2005 to January 2011. Senior Vice president, human resources from march 2002 to may 2005.
John R. Mazurk, Division president – healthy Living Brands since may 2012. Senior Vice president, Consumer and retail Business Development from January 2010 to may 2012. Senior Vice president and General manager, naturalizer from 2008 to 2010. Senior Vice president Specialty retail from 2004 to 2008, and Senior Vice president, Stores for famous footwear from 2002 to 2004.
Michael I. Oberlander, Senior Vice president, General Counsel and Corporate Secretary since march 2006. Vice president, General Counsel and Corporate Secretary from July 2001 to march 2006. Vice president and General Counsel from September 2000 to July 2001.
John W. Schmidt, Division president – Contemporary fashion Brands since January 2011. Senior Vice president, Better and image Brands from January 2010 to January 2011. Senior Vice president and General manager, Better and image Brands from march 2008 until January 2010. Various positions, including Vice president, president, Group president of wholesale footwear for nine west Group from September 1998 to february 2008.
Mark A. Schmitt, Senior Vice president and Chief information officer since January 2012. Senior Director of management information Systems for express Scripts from 2010 through 2011. Various management information systems positions including Group Director with anheuser-Busch inBev from 1996 to 2009.

2012 Brown Shoe Company, inC. form 10-k 15
ITEM 1A RISK FACTORS
Economic conditions have adversely impacted, and may continue to adversely impact, consumer demand for our products. over the last several years, worldwide economic conditions deteriorated in many countries and regions, including the United States. Despite some positive trends throughout 2012, business conditions may remain uncertain for the foreseeable future due in part to cautious consumer spending. Consumer confidence and spending are strongly influenced by general economic conditions, including U.S. fiscal policy, changing tax and regulatory environment, interest rates, inflation, consumer debt levels, the availability of consumer credit, the liquidity of consumers’ assets, health care costs, currency exchange rates, taxation, gasoline prices, real estate values, foreclosure rates, unemployment trends and the economic consequences of military action or terrorist activities. negative economic conditions generally decrease disposable income and, consequently, consumer purchases of discretionary items like our products. negative trends in economic conditions also drive up the cost of our products, which may require us to increase the price of our products. These increases in our product costs, and possibly prices, may not be offset by comparable increases in consumer disposable income. as a result, our customers may choose to purchase fewer of our products or purchase the lower-priced products of our competitors, and our business, results of operations, financial condition and cash flows could be adversely affected.
If we are unable to anticipate and respond to consumer preferences and fashion trends and successfully apply new technology, we may not be able to maintain or increase our net sales and earnings. The footwear industry is subject to rapidly changing consumer demands and fashion trends. our products must appeal to a broad range of consumers whose preferences cannot be predicted with certainty and are subject to rapid change. accordingly, the success of both our wholesale and retail operations depends largely on our ability to anticipate, understand and react to changing consumer demands and preferences. our performance athletic and outdoor footwear brands are subject to additional challenges related to rapid changes in footwear technology, the availability of high quality endorsers and the possibility of negative expert opinions on the unique technologies and designs of our performance footwear brands. if we fail to successfully anticipate and respond to changes in consumer demand and fashion trends, develop new products and designs and implement effective, responsive merchandising and marketing strategies and programs, we could experience lower sales, excess inventories and lower gross margins, any of which could have an adverse effect on our results of operations and financial condition.
We operate in a highly competitive industry. Competition is intense in the footwear industry. Certain of our competitors are larger and have greater financial, marketing and technological resources than we do; others are able to offer footwear on a lateral basis alongside their apparel products; and others have successfully branded their trademarks as lifestyle brands, resulting in greater competitive advantages to those competitors. Low barriers to entry into this industry further intensify competition by allowing new companies to easily enter the markets in which we compete. in addition, retailers aggressively compete on the basis of price, which puts competitive pressure on us to keep our prices low. Some of our suppliers further compound these competitive pressures by allowing consumers to purchase their products directly through supplier maintained internet sites and retail stores.
we believe that our ability to compete successfully in the footwear industry depends on a number of factors, including style, price, performance, quality, location and service as well as the strength of our brand-names. we remain competitive by increasing awareness of our brands, improving the efficiency of our supply chain and enhancing the style, comfort, fashion and perceived value of our products. however, our competitors may implement more effective marketing campaigns, adopt more aggressive pricing policies, make more attractive offers to potential employees, distribution partners and manufacturers, or respond more quickly to changes in consumer preferences than us. as a result, we may not be able to compete successfully in the future, and increased competition may result in price reductions, reduced gross margins, loss of market share and an inability to generate cash flows that are sufficient to maintain or expand the development and marketing of our products, which could adversely impact our financial results.
Our operating results depend on preparing accurate sales forecasts and properly managing our inventory levels. Using sales forecasts, we place orders with manufacturers for some of our products prior to the time we receive all of our customers’ orders to minimize purchasing costs, the time necessary to fill customer orders and the risk of non-delivery. we also maintain an inventory of certain products that we anticipate will be in greater demand. however, the global economic slowdown and rapidly changing consumer preferences can make it difficult for us and our customers to accurately forecast product trends in order to match production with demand. if we fail to accurately assess consumer fashion tastes and the impact of economic factors on consumer spending or to effectively differentiate our retail and wholesale offerings, our inventory levels may exceed customer demand, resulting in inventory write-downs, higher carrying costs, lower gross margins or the sale of excess inventory at discounted prices, which could significantly impair our financial results. Conversely, if we underestimate consumer demand for our products or if our manufacturers fail to supply the quality products that we require in a timely manner, we may experience inventory shortages. inventory shortages may delay shipments to customers (and possibly require us to offer discounts or costly expedited shipping), negatively impact retailer and distributor relationships, adversely impact our sales results and diminish brand awareness and loyalty.

16 2012 Brown Shoe Company, inC. form 10-k
We rely on foreign sources of production, which subjects our business to risks associated with international trade. we rely on foreign sourcing for our footwear products primarily through third-party manufacturing facilities located in China. at times, we are the exclusive customer of these third-party manufacturing facilities. as is common in the industry, we do not have any long-term contracts with our third-party foreign manufacturers. foreign sourcing is subject to numerous risks, including trade relations, disease outbreaks, work stoppages, transportation delays, political instability, foreign currency fluctuations, variable economic conditions, expropriation, nationalization, natural disasters, terrorist acts and military conflict and changes in governmental regulations (including the U.S. foreign Corrupt practices act and climate change legislation). at the same time, potential changes in Chinese manufacturing preferences, including, but not limited to the following, pose additional risk and uncertainty:
• Manufacturing capacity in China may shift from footwear to other industries with manufacturing margins that are perceived to be higher.
• Growth in domestic footwear consumption in China could lead to a significant decrease in factory space available for the manufacture of footwear to be exported.
• Currently, many footwear manufacturers in China are facing labor shortages as migrant workers seek better wages and working conditions in other industries and vocations.
as a result of these risks, there can be no assurance that we will not experience reductions in the available production capacity, increases in our manufacturing costs, late deliveries or terminations of our supplier relationships. furthermore these risks are compounded by the lack of diversification in the geographic location of our foreign sourcing and manufacturing. with almost all of our supply originating in China, a substantial portion of our supply could be at risk in the event of any negative development related to China.
although we believe we could find alternative manufacturing sources for the products that we currently source from China through other third-party manufacturing facilities in China or other countries, we may not be able to locate alternative manufacturers on terms as favorable as our current terms, including pricing, payment terms, manufacturing capacity, quality standards and lead times for delivery. in addition, there is substantial competition in the footwear industry for quality footwear manufacturers. accordingly, our future results will partly depend on our ability to maintain positive working relationships with, and offer competitive terms to, our foreign manufacturers. if supply issues cause us to be unable to provide products consistent with our standards or manufacture our footwear in a cost and time efficient manner, our customers may cancel orders, refuse to accept deliveries or demand reductions in purchase prices, any of which could have a material adverse effect on our business and results of operations.
Customer concentration and other trends in customer behavior may lead to a reduction in or loss of sales. our wholesale customers include national chains, department stores, independent retailers, mass merchandisers, online retailers and catalogs. Several of our customers operate multiple department store divisions. furthermore, we often sell multiple types of licensed, branded and private-label footwear to these same national chains, department stores, independent retailers, mass merchandisers, online retailers and catalogs. while we believe purchasing decisions in many cases are made independently by the buyers and merchandisers of each of the customers, a decision by a significant customer to decrease the amount of footwear products purchased from us could have a material adverse effect on our business, financial condition or results of operations.
in addition, with the growing trend toward retail trade consolidation, we and our wholesale customers increasingly depend upon a reduced number of key retailers whose bargaining strength is growing. This consolidation may result in the following adverse consequences:
• Our wholesale customers may seek more favorable terms for their purchases of our products, which could limit our ability to raise prices, recoup cost increases or achieve our profit goals.
• The number of stores that carry our products could decline, thereby exposing us to a greater concentration of accounts receivable risk and negatively impacting our brand visibility.
we also face the following risks with respect to our customers:
• Our customers could develop in-house brands or utilize a higher mix of private label footwear products, which would negatively impact our sales.
• As we sell our products to customers and extend credit based on an evaluation of each customer’s financial condition, the financial difficulties of a customer could cause us to stop doing business with that customer, reduce our business with that customer or be unable to collect from that customer.
• If any of our major wholesale customers experiences a significant downturn in its business or fails to remain committed to our products or brands, then these customers may reduce or discontinue purchases from us.
• Retailers are directly sourcing more of their products directly from manufacturers overseas and reducing their reliance on wholesalers, which could have a material adverse effect on our business and results of operations.

2012 Brown Shoe Company, inC. form 10-k 17
We are reliant upon our information technology systems, and any major disruption of these systems could adversely impact our reputation and our ability to effectively operate our business. our computer network and systems are essential to all aspects of our operations, including design, pricing, production, forecasting, ordering, manufacturing, transportation, sales and distribution. our ability to manage and maintain our inventory and to deliver products in a timely manner depends on these systems. if any of these systems fails to operate as expected, we experience problems with transitioning to upgraded or replacement systems, a breach in security occurs or a natural disaster interrupts system functions, we may experience delays in product fulfillment and reduced efficiency in our operations or be required to expend significant capital to correct the problem, which may have an adverse effect on our results of operations and financial condition.
A disruption in the effective functioning of our distribution centers could adversely affect our ability to deliver inventory on a timely basis.we currently utilize several distribution centers, which are leased or third-party managed. These distribution centers serve as the source of replenishment of inventory for our footwear stores operated by our famous footwear and Specialty retail segments and serve our wholesale operations segment. we may be unable to successfully manage, negotiate or renew our third-party distribution center agreements, or we may experience complications with respect to our distribution centers, such as substantial damage to or destruction of such facilities due to natural disasters or ineffective information technology systems. in such an event, our other distribution centers may not be able to support the resulting additional distribution demands and we may be unable to locate alternative persons or entities capable of fulfilling our distribution needs, resulting in an adverse effect on our ability to deliver inventory on a timely basis. while we maintain business interruption insurance, it may not adequately protect us from adverse effects caused by significant disruptions in our distribution centers.
Foreign currency fluctuations may result in higher costs and decreased gross profits.although we purchase most of our products from foreign manufacturers in United States dollars and otherwise engage in foreign currency hedging transactions, we cannot ensure that we will not experience cost variations with respect to exchange rate changes. for example, although we purchase footwear made in China using United States dollars, Chinese manufacturers have been increasing their United States dollar prices to compensate for the appreciation of the Chinese currency against the United States dollar. Currency exchange rate fluctuations may also adversely impact third parties who manufacture the Company’s products by making their purchases of raw materials or other production costs more expensive and more difficult to finance, resulting in higher prices and lower margins for the Company, its distributors and licensees.
Additional duties, quotas, tariffs and other trade restrictions may be imposed on our foreign sourced products, adversely affecting our sales and profitability. our foreign sourced products are subject to duties collected by customs authorities when imported to the United States or other countries. we cannot predict whether additional customs duties, quotas, tariffs, anti-dumping duties, safeguard measures, cargo restrictions or other trade restrictions may be imposed on the importation of our products in the future. Such additional charges may result in increases in the cost of our products and may adversely affect our sales and profitability.
Our business, sales and brand value could be harmed by violations of labor, trade or other laws. we focus on doing business with those suppliers who share our commitment to responsible business practices and the principles set forth in our production Code of Conduct (the “pCoC”). By requiring our suppliers to comply with the pCoC, we encourage our suppliers to promote best practices and work towards continual improvement throughout their production operations. The pCoC sets forth standards for working conditions and other matters, including compliance with applicable labor practices, workplace environment and compliance with laws. although we promote ethical business practices, we do not control our suppliers or their labor practices. a failure by any of our suppliers to adhere to these standards or laws could cause us to incur additional costs for our products, could cause negative publicity and harm our business and reputation. we also require our suppliers to meet our standards for product safety, including compliance with applicable laws and standards with respect to safety issues, including lead content in paint. a failure by any of our suppliers to adhere to product safety standards could lead to a product recall, which could result in critical media coverage, harm our business and reputation and cause us to incur additional costs. in addition, if we, or our suppliers or foreign manufacturers, violate United States or foreign trade laws or regulations, we may be subject to additional duties, significant monetary penalties, the seizure and forfeiture of the products we are attempting to import or the loss of our import privileges. possible violations of United States or foreign laws or regulations could include inadequate record keeping of our imported products, misstatements or errors as to the origin, classification, marketing or valuation of our imported products, fraudulent visas or labor violations. The effects of these factors could render our conduct of business in a particular country undesirable or impractical and have a negative impact on our operating results.
We face additional risks relating to operating manufacturing facilities in China.we operate manufacturing facilities in China. These manufacturing facilities are subject to many of the same risks as our third-party foreign sourcing arrangements, described above, but we may be more directly impacted by any negative

18 2012 Brown Shoe Company, inC. form 10-k
developments in China with respect to our manufacturing facilities. our operations in China and, consequently, our ability to deliver products on time and on terms satisfactory to us may be subject to risks such as the following:
• inflation or changes in political and economic conditions;• unstable regulatory environments;• changes in import and export duties;• not maintaining appropriate capacity;• domestic and foreign customs and tariffs;• potentially adverse tax consequences;• trade restrictions;• possible expropriation and nationalization;• restrictions on the transfer of funds into or out of China;• natural disasters;• labor unrest and/or shortages; and• logistical and communications challenges.
in addition, we lease the land on which these Chinese manufacturing facilities are located from the Chinese government through land use rights agreements. although we believe that we have a positive relationship with the Chinese government, if the Chinese government decided to terminate our land use rights agreements, our ability to fulfill our customers’ orders may be negatively impacted. These risks may have an adverse effect on our Chinese manufacturing operations and our overall business and results of operations.
We may fail to protect the integrity and security of consumer and associate information. we routinely possess sensitive consumer and associate information as well as provide certain customer and employee data to third-parties for analysis, benefit distribution or compliance purposes. we have taken reasonable and appropriate steps to protect that information. however, hackers and data thieves operate sophisticated, large scale attacks that could result in a breach of our security. in addition, we are required to comply with increasingly complex regulations designed to protect our business and personal data. any breach of our network security, a third-party’s network security or failure to comply with applicable regulations may result in (a) the loss of valuable business data and/or our consumers’ or associates’ personal information, (b) increased costs associated with implementing additional protections and processes, (c) a disruption of our business and a loss of sales, (d) negative media attention, (e) damage to our consumer and associate relationships and reputation, and (f) fines or lawsuits.
Our success depends on our ability to retain senior management and recruit and retain other key associates. our success depends on our ability to attract, retain and motivate qualified management, administrative, product development and sales personnel to support existing operations and future growth. in addition, our ability to successfully integrate acquired businesses often depends on our ability to retain incumbent personnel, many of whom possess valuable institutional knowledge and operating experience. Competition for qualified personnel in the footwear industry is intense, and we compete for these individuals with other companies that in many cases have superior financial and other resources. The loss of the services of any member of our senior management, the inability to attract and retain other qualified personnel or the inability to effectively transition senior management positions could adversely affect the sales, design and production of our products as well as the implementation of our strategic initiatives.
Our reputation and competitive position are dependent on our ability to license well-recognized brands, license our own brands under successful licensing arrangements and protect our intellectual property rights.
Licenses – Company as Licenseealthough we own many of our wholesale brands, we also rely on our ability to attract, retain and maintain good relationships with licensors that have strong, well-recognized brands and trademarks. our license agreements are generally for an initial term of two to four years, subject to renewal, and there can be no assurance that we will be able to renew these licenses. even our longer-term or renewable licenses are typically dependent upon our ability to market and sell the licensed products at specified levels, and the failure to meet such levels may result in the termination or non-renewal of such licenses. furthermore, many of our license agreements require minimum royalty payments, and if we are unable to generate sufficient sales and profitability to cover these minimum royalty requirements, we may be required to make additional payments to the licensors that could have a material adverse effect on our business and results of operations. in addition, because certain of our license agreements are non-exclusive, new or existing competitors may obtain licenses with overlapping product or geographic terms, resulting in increased competition for a particular market.
Licenses – Company as Licensorwe have entered into numerous license agreements with respect to the brands and trademarks that we own. while we have significant control over our licensees’ products and advertising, we generally cannot control their operational and financial issues. if our licensees are not able to meet annual sales and royalty goals, obtain financing, manage their supply chain,

2012 Brown Shoe Company, inC. form 10-k 19
control quality and maintain positive relationships with their customers, our business, results of operations and financial position may be adversely affected. while we would likely have the ability to terminate an underperforming license, it may be difficult and costly to locate an acceptable substitute distributor or licensee, and we may experience a disruption in our sales and brand visibility. in addition, although many of our license agreements prohibit the licensees from entering into licensing arrangements with certain of our competitors, they are generally not prohibited from offering, under other brands, the types of products covered by their license agreements with us.
Trademarks we believe that our trademarks and trade names are important to our success and competitive position because our distinctive marks create a market for our products and distinguish our products from other products. we cannot, however, guarantee that we will be able to secure protection for our intellectual property in the future or that such protection will be adequate for future operations. furthermore, we face the risk of ineffective protection of intellectual property rights in jurisdictions where we source and distribute our products, some of which do not protect intellectual property rights to the same extent as the United States. if we are unsuccessful in challenging a party’s products on the basis of infringement of our intellectual property rights, continued sales of these products could adversely affect our sales, devalue our brands and result in a shift in consumer preference away from our products. we may face significant expenses and liability in connection with the protection of our intellectual property rights, and if we are unable to successfully protect our rights or resolve intellectual property conflicts with others, our business or financial condition could be adversely affected.
Our retail business depends on our ability to secure affordable and desirable leased locations without creating a competitive concentration of stores. our famous footwear and Specialty retail segments operate leased retail footwear stores. accordingly, the success of our retail business depends, in part, on our ability to secure affordable, long-term leases in desirable locations and to secure renewals of such leases. no assurance can be given that we will be able to successfully negotiate lease renewals for existing stores or obtain acceptable terms for new stores in desirable locations. in addition, opening new famous footwear stores in our existing markets may result in reduced net sales in existing stores as our stores become more concentrated in the markets we serve. as a result, the number of consumers and financial performance of individual stores may decline and the average sales per square foot at our stores may be reduced.
If we are unable to maintain working relationships with our major branded suppliers, our business, results of operations, financial condition and cash flows may be adversely impacted. our famous footwear segment purchases a substantial portion of its footwear products from major branded suppliers. as is common in the industry, we do not have any long-term contracts with our suppliers. in addition, the success of our financial performance is dependent on the ability of famous footwear to obtain products from our suppliers on a timely basis and on acceptable terms. while we believe our relationships with our current suppliers are good, the loss of any of our major suppliers or product developed exclusively for famous footwear could have a material adverse effect on our business, financial condition and results of operations. in addition, negative trends in global economic conditions may adversely impact our suppliers. if these third-parties do not perform their obligations or are unable to provide us with the materials and services we need at prices and terms that are acceptable to us, our ability to meet our consumers’ demand could be adversely affected.
Our quarterly sales and earnings may fluctuate, and securities analysts may not accurately estimate our financial results, which may result in volatility in, or a decline in, our stock price. our quarterly sales and earnings can vary due to a number of factors, many of which are beyond our control, including the following:
• Our Famous Footwear retail business is seasonally weighted to the back-to-school season, which falls in our third fiscal quarter. as a result, the success of our back-to-school offering, which is affected by our ability to anticipate consumer demand and fashion trends, could have a disproportionate impact on our full year results.
• In our wholesale business, sales of footwear are dependent on orders from our major customers, and they may change delivery schedules, change the mix of products they order or cancel orders without penalty.
• Our wholesale customers set the delivery schedule for shipments of our products, which could cause shifts of sales between quarters.
• Our estimated annual tax rate is based on projections of our domestic and international operating results for the year, which we review and revise as necessary each quarter.
• Our earnings are also sensitive to a number of factors that are beyond our control, including manufacturing and transportation costs, changes in product sales mix, geographic sales trends, consumer sentiment and currency exchange rate fluctuations.
as a result of these specific and other general factors, our operating results will vary from quarter to quarter, and the results for any particular quarter may not be indicative of results for the full year. any shortfall in sales or earnings from the levels expected by investors or securities analysts could cause a decrease in the trading price of our common stock.

20 2012 Brown Shoe Company, inC. form 10-k
in addition, various securities analysts follow our financial results and issue reports on us. These reports include information about our historical financial results as well as the analysts’ estimates of our future performance. The analysts’ estimates are based upon their own opinions and are often different from our estimates or expectations. if our operating results are below the estimates or expectations of public market analysts and investors, our stock price could decline.
Changes in tax laws, policies and treaties could result in higher taxes, lower profitability and increased volatility in our financial results. our financial results are significantly impacted by our effective tax rates, for both domestic and international operations. our effective income tax rate could be adversely affected by factors such as changes in the mix of earnings in countries with differing statutory tax rates, changes in the valuation of deferred tax assets and liabilities, changes in permitted deductions, changes in tax laws, interpretations, policies and treaties, the outcome of income tax audits in various jurisdictions and any repatriation of earnings from our international operations. The occurrence of such events may result in higher taxes, lower profitability and increased volatility in our financial results.
Transitional challenges with acquisitions and/or joint ventures could result in unexpected expenditures of time and resources. periodically, we pursue acquisitions of other companies or businesses and/or joint ventures. although we review the records of acquisition candidates, the review may not reveal all existing or potential problems. as a result, we may not accurately assess the value of the business and may, accordingly, ultimately assume unknown adverse operating conditions and/or unanticipated liabilities. in addition, the business may not perform as well as expected. we face the risk that the returns on acquisitions and/or joint ventures will not support the expenditures or indebtedness incurred to acquire or launch such businesses. we also face the risk that we will not be able to integrate acquisitions and/or joint ventures into our existing operations effectively without substantial expense, delay or other operational or financial problems. integration may be hindered by, among other things, differing procedures, including internal controls, business practices and technology systems. we may need to allocate more management resources to integration than we planned, which may adversely affect our ability to pursue other profitable activities.
Our business, results of operations, financial condition and cash flows could be adversely affected by the failure of financial institutions to fulfill their commitments under our Credit Agreement. our Third amended and restated Credit agreement (the “Credit agreement”), which matures on January 7, 2016, is provided by a syndicate of financial institutions, with each institution agreeing severally (and not jointly) to make revolving credit loans to us in an aggregate amount of up to $530.0 million in accordance with the terms of the Credit agreement. in addition, the Credit agreement provides for up to an additional $150.0 million of optional availability pursuant to a provision commonly referred to as an “accordion feature.” if one or more of the financial institutions participating in the senior secured revolving credit facility were to default on its obligation to fund its commitment, the portion of the facility provided by such defaulting financial institution might not be available to us.
If we are unable to maintain our credit rating, our ability to access capital and interest rates may be negatively impacted. The credit rating agencies periodically review our capital structure and the quality and stability of our earnings. any negative ratings actions could constrain the capital available to our company or our industry and could limit our access to long-term funding or cause such access to be available at a higher borrowing cost for our operations. we are dependent upon our ability to access capital at rates and on terms we determine to be attractive. if our ability to access capital becomes constrained, our interest expense will likely increase, which could adversely affect our financial condition and results of operations.
We may be unable to gain the expected efficiencies from our key strategic initiatives.in 2011, we conducted a review of our portfolio to identify and take action around businesses that either do not fit our target consumer platforms – family, healthy living and contemporary fashion – or that are underperforming. as a result of this review, we announced that we would be exiting certain unprofitable portions of our business, closing certain stores and making other infrastructure changes. we continue to take actions to respond to this review in an effort to focus on our target consumer platforms, maximize operating efficiency and shareholder value and reduce costs. achievement of our strategic goals depends in part on our ability to identify, develop and execute initiatives appropriately and effectively. There can be no assurance that we will gain the expected efficiencies from our strategic initiatives within a targeted timeframe or within targeted costs.
our ability to grow in the future depends upon, among other things, the continued success of our efforts to maintain our brand image and expand our footwear offerings and retail and wholesale distribution channels. as our business grows, we may need to improve and enhance our overall financial and managerial controls, reporting systems and procedures to effectively manage our growth. we may be unable to successfully implement our current growth strategy or other growth strategies or effectively manage our growth, any of which would negatively impact our business, results of operations and financial condition.

2012 Brown Shoe Company, inC. form 10-k 21
We are subject to periodic litigation and other regulatory proceedings, which could result in the unexpected expenditure of time and resources. we are a defendant from time to time in lawsuits and regulatory actions (including environmental matters) relating to our business and to our past operations. Due to the inherent uncertainties of litigation and regulatory proceedings, we cannot accurately predict the ultimate outcome of any such proceedings. an unfavorable outcome could have a material adverse impact on our business, financial condition and results of operations. in addition, regardless of the outcome of any litigation or regulatory proceedings, such proceedings are expensive and will require that we devote substantial resources and executive time to defend, thereby diverting management’s attention and resources that are needed to successfully run our business. See item 3, Legal Proceedings, for further discussion of pending matters.
Rising insurance costs could adversely affect our results of operations, financial condition and cash flows. we self-insure a significant portion of our expected losses under our workers’ compensation, employment practices, health, disability, cyber risk, general liability, automobile and property programs, among others. The liabilities associated with the risks that are retained by us are estimated by considering our historical claims experience and data from actuarial sources. The estimated accruals for these liabilities could be affected if claims differ from the assumptions used and historical trends. Unanticipated changes in the estimates underlying our reserves for these losses, such as claims experience, inflation and regulatory changes, could have a material adverse effect on our financial condition and results of operations.
Comprehensive health care reform legislation provisions have become effective which, among other things, includes guaranteed coverage requirements, eliminates pre-existing condition exclusions and annual lifetime maximum limits, restricts the extent to which policies can be rescinded and imposes new and significant taxes on healthy insurers and health care benefits. possible adverse effects of the health reform legislation include increased costs, exposure to expanded liability and requirements for us to revise ways in which we conduct business.
We are subject to legislative or regulatory initiatives related to global warming/climate change concerns, which could negatively affect our business. There has been an increasing focus and debate on global climate change, including increased attention from regulatory agencies and legislative bodies. This increased focus may lead to new initiatives directed at regulating an unspecified array of environmental matters. Legislative, regulatory or other efforts to globally combat climate change could have negative implications, including, but not limited to, future tax increases, increased costs of transportation and utilities and other cost increases imposed on foreign sources of production, all of which could decrease our operating earnings. we are unable to predict the potential effects that any such future initiatives may have on our business.
ITEM 1b UNRESOLVED STAFF COMMENTS
There are no unresolved written comments that were received from the SeC staff 180 days or more before the end of our fiscal year relating to our periodic or current reports under the Securities exchange act of 1934, as amended.
ITEM 2 pROpERTIES
we own our principal executive, sales and administrative offices located in Clayton (“St. Louis”), missouri.
our retail footwear operations are conducted throughout the United States, Canada, China and Guam and involve the operation of 1,277 shoe stores, including 90 in Canada and 26 in China. all store locations are leased, with approximately 56% of them having renewal options. famous footwear operates a leased 800,000 square-foot distribution center, including mezzanine levels, in Lebanon, Tennessee, and a leased 380,000 square-foot distribution center, including a mezzanine level, in Bakersfield, California. we also operate an owned 150,000 square-foot distribution facility in perth, ontario.
our wholesale operations segment utilizes leased office space in new york, new york, where we also maintain showrooms for our wholesale brands, and leased office space located in irvine, California (“Los angeles”). our Canada wholesale division operates from an owned building in perth, ontario and from leased office space in Laval, Quebec. we also lease office space in China, hong kong, macau and italy, four sample-making facilities in Dongguan, putian and JiangXi, China and we lease two manufacturing facilities in JiangXi, China. The footwear sold through our domestic wholesale operations is processed through one of two main distribution centers: a third-party facility in Chino, California and a 320,000 square-foot leased facility in fontana, California. During 2012, we began to close our owned Sikeston, missouri, distribution center, which has 720,000 square feet, including mezzanine levels.
we own a vacant manufacturing facility in Stirling, ontario; an office building in perth, ontario, which is leased to a third-party; a building in Denver, Colorado, which is leased to a third-party; and undeveloped land in Colorado and new york. See item 3, Legal Proceedings, for further discussion of certain of these properties.

22 2012 Brown Shoe Company, inC. form 10-k
ITEM 3 LEGAL pROCEEDINGS
we are involved in legal proceedings and litigation arising in the ordinary course of business. in the opinion of management, the outcome of such ordinary course business proceedings and litigation currently pending will not have a material adverse effect on our results of operations or financial position.
we are involved in environmental remediation and ongoing compliance activities at several sites. we are remediating, under the oversight of Colorado authorities, contamination at and beneath our owned facility in Colorado (also known as the “redfield” site) and groundwater and indoor air in residential neighborhoods adjacent to and near the property, which have been affected by solvents previously used at the site and surrounding facilities. See note 17 to the consolidated financial statements for additional information related to the redfield matter.
our prior operations included numerous manufacturing and other facilities for which we may have responsibility under various environmental laws to address conditions that may be identified in the future.
ITEM 4 MINE SAFETy DISCLOSURES
not applicable.
pART II
ITEM 5 MARKET FOR REGISTRANT’S COMMON EQUITy, RELATED STOCKHOLDER MATTERS AND ISSUER pURCHASES OF EQUITy SECURITIES
our common stock is listed on the new york Stock exchange (“nySe”) under the trading symbol “BwS.” as of february 2, 2013, we had approximately 3,250 shareholders of record. The following table sets forth for each fiscal quarter during 2012 and 2011 the high and low sales prices per share of our common stock as reported on the nySe and the dividends paid per share.
2012 2011 Dividends Dividends Low High paid Low high paid1st Quarter . . . . . . . . . . . . . . . . . $ 8.49 $11.30 $0.07 $10.39 $15.77 $0.07 2nd Quarter . . . . . . . . . . . . . . . . . 8.28 14.24 0.07 8.85 12.79 0.07 3rd Quarter . . . . . . . . . . . . . . . . . 13.22 16.88 0.07 5.85 10.31 0.07 4th Quarter . . . . . . . . . . . . . . . . . 14.76 19.64 0.07 7.51 9.72 0.07
Restrictions on the payment of Dividendsour Third amended and restated Credit agreement (the “Credit agreement”) and our 7.125% senior notes due in 2019 (the “2019 Senior notes”) limit the amount of dividends that can be declared and paid. however, we do not believe this limitation materially restricts the Board of Directors’ ability to declare or our ability to pay regular quarterly dividends to our common stockholders.
in addition to this limitation, the declaration and payment of dividends and the amount of dividends will depend on our results of operations, financial conditions, future prospects and other factors deemed relevant by our Board of Directors.
Issuer purchases of Equity SecuritiesThe following table represents issuer purchases of equity securities.
Total Number of Maximum Number Total Number Shares purchased of Shares that May of Shares Average price as part of publicly yet be purchased Fiscal period purchased paid per Share Announced program Under the program (1)
october 28, 2012 – november 24, 2012 . . 658 (2) $16. 1 1 – 2,500,000 november 25, 2012 – December 29, 2012 . 7,456 (2) 18.54 – 2,500,000 December 30, 2012 – february 2, 2013 . . 533 (2) 17.54 – 2,500,000 Total . . . . . . . . . . . . . . . . . . . . . . 8,647 (2) $18.29 – 2,500,000
(1) on august 25, 2011, the Board of Directors approved a stock repurchase program authorizing the repurchase of up to 2.5 million shares of our outstanding common stock. we can utilize the repurchase program to repurchase shares on the open market or in private transactions from time to time, depending on market conditions. The repurchase program does not have an expiration date. Under this plan, no shares were repurchased during 2012; therefore, there were 2.5 million shares authorized to be purchased under the program as of february 2, 2013. repurchases of common stock are limited under our debt agreements.
(2) reflects shares that were tendered by employees related to certain share-based awards. These shares were tendered in satisfaction of the exercise price of stock options and/or to satisfy minimum tax withholding amounts for non-qualified stock options, restricted stock and stock performance awards. accordingly, these share purchases are not considered a part of our publicly announced stock repurchase program.

2012 Brown Shoe Company, inC. form 10-k 23
Stock performance Graph The following performance graph compares the cumulative total return on our common stock with the cumulative total return of the following indices: (i) the S&p© SmallCap 600 Stock index and (ii) a peer group of companies believed to be engaged in similar businesses. our peer group consists of Genesco, inc., Shoe Carnival, inc., DSw, inc., Skechers U.S.a., inc., Steven madden, Ltd. and wolverine world wide, inc. in october 2012, Collective Brands, inc. (formerly included in peer group) was acquired by wolverine world wide, inc. The results of Collective Brands, inc. are included within the graph through the date of acquisition.
our fiscal year ends on the Saturday nearest to each January 31; accordingly, share prices are as of the last business day in each fiscal year. The graph assumes that the value of the investment in our common stock and each index was $100 at february 2, 2008. The graph also assumes that all dividends were reinvested and that investments were held through february 2, 2013. These indices are included for comparative purposes only and do not necessarily reflect management’s opinion that such indices are an appropriate measure of the relative performance of the stock involved and are not intended to forecast or be indicative of possible future performance of the common stock.
2/2/2008 1/31/2009 1/30/2010 1/29/2011 1/28/2012 2/2/2013Brown Shoe Company, inc. . . . . . $100.00 $27.81 $76.33 $ 80.90 $ 63.61 $115.00peer Group . . . . . . . . . . . . . . 100.00 63.27 87.92 1 15 .1 1 123.75 142.87S&p© SmallCap 600 Stock index . . 100.00 57.62 84.98 109.88 138.68 144.54
$0
$80
$40
$120
$160
COMPARISON OF 5 YEAR CUMULATIVE TOTAL RETURN* Among Brown Shoe Company, Inc. the S&P SmallCap 600 Index, and a Peer Group
* $100 invested on 2/2/08 in stock or 1/31/08 in index, including reinvestment of dividends. Indexes calculated on month-end basis.
Copyright© 2013 S&P, a division of The McGraw-Hill Companies Inc. All rights reserved.
Peer GroupBrown Shoe Company, Inc. S&P SmallCap 600 Index
2/2/2008 1/31/2009 1/30/2010 1/29/2011 1/28/2012 2/2/2013

24 2012 Brown Shoe Company, inC. form 10-k
ITEM 6 SELECTED FINANCIAL DATA
The selected financial data set forth below should be read in conjunction with the consolidated financial statements and notes thereto and the other information contained elsewhere in this report. 2012 2011 2010 2009 2008($ thousands, except per share amounts) (53 Weeks) (52 weeks) (52 weeks) (52 weeks) (52 weeks)
Operations:net sales. . . . . . . . . . . . . . . . . . . . . . . . . . . . . . . . . . . $ 2,598,065 $ 2,582,824 $ 2,504,091 $ 2,241,968 $ 2,276,362 Cost of goods sold . . . . . . . . . . . . . . . . . . . . . . . . . . . . . 1,587,706 1,586,184 1,500,537 1,338,829 1,394,126 Gross profit . . . . . . . . . . . . . . . . . . . . . . . . . . . . . . . . . 1,010,359 996,640 1,003,554 903,139 882,236 Selling and administrative expenses . . . . . . . . . . . . . . . . . . . 918,957 937,419 922,976 859,693 851,893 restructuring and other special charges, net . . . . . . . . . . . . . . 24,018 23,671 7,914 1 1 ,923 54,278 impairment of goodwill and intangible assets(4) . . . . . . . . . . . . . 5,777 – – – 149,150 equity in net loss of nonconsolidated affiliate . . . . . . . . . . . . . . – – – – 216 operating earnings (loss) . . . . . . . . . . . . . . . . . . . . . . . . . 61,607 35,550 72,664 31,523 (173,301) interest expense . . . . . . . . . . . . . . . . . . . . . . . . . . . . . . (23,382) (26,141) (19,647) (20,195) (17,105)Loss on early extinguishment of debt . . . . . . . . . . . . . . . . . . – (1,003) – – – interest income . . . . . . . . . . . . . . . . . . . . . . . . . . . . . . . 322 644 203 374 1,800 earnings (loss) before income taxes from continuing operations . . . 38,547 9,050 53,220 1 1 ,702 (188,606) income tax (provision) benefit . . . . . . . . . . . . . . . . . . . . . . (11,343) (326) (16,160) (1,259) 53,793 net earnings (loss) from continuing operations . . . . . . . . . . . . . 27,204 8,724 37,060 10,443 (134,813) Discontinued operations: earnings from operations of subsidiary, net of tax . . . . . . . . . – 1,701 – – – Gain on sale of subsidiary, net of tax. . . . . . . . . . . . . . . . . – 13,965 – – – net earnings from discontinued operations . . . . . . . . . . . . . . . – 15,666 – – – net earnings (loss) . . . . . . . . . . . . . . . . . . . . . . . . . . . . . 27,204 24,390 37,060 10,443 (134,813) net (loss) earnings attributable to noncontrolling interests . . . . . . (287) (199) (173) 943 (1,575) net earnings (loss) attributable to Brown Shoe Company, inc. . . . . $ 27,491 24,589 $ 37,233 $ 9,500 $ (133,238)
Operations:return on net sales . . . . . . . . . . . . . . . . . . . . . . . . . . . . . 1 .1% 1.0% 1.5% 0.4% (5.9)%return on beginning Brown Shoe Company, inc. shareholders’ equity . 6.7% 5.9% 9.3% 2.4% (23.9)%return on average invested capital(1) . . . . . . . . . . . . . . . . . . . 5.5% 2.9% 7.5% 3.6% (17.2)%Dividends paid . . . . . . . . . . . . . . . . . . . . . . . . . . . . . . . $ 12,011 $ 12,076 $ 12,254 $ 12,009 $ 11,855 purchases of property and equipment . . . . . . . . . . . . . . . . . . $ 55,801 $ 27,857 $ 30,781 $ 24,880 $ 60,417 Capitalized software . . . . . . . . . . . . . . . . . . . . . . . . . . . . $ 7,928 $ 10,707 $ 24,046 $ 25,098 $ 16,327 Depreciation and amortization(2) . . . . . . . . . . . . . . . . . . . . . $ 57,344 $ 61,449 $ 52,51 7 $ 53,295 $ 56,510 per Common Share:Basic earnings (loss) per common share: from continuing operations . . . . . . . . . . . . . . . . . . . . . $ 0.64 $ 0.20 $ 0.85 $ 0.22 $ (3.21) from discontinued operations . . . . . . . . . . . . . . . . . . . . – 0.37 – – – Basic earnings (loss) per common share attributable to Brown Shoe Company, inc. shareholders . . . . . . . . . . . . . . 0.64 0.57 0.85 0.22 (3.21)Diluted earnings (loss) per common share: from continuing operations . . . . . . . . . . . . . . . . . . . . . 0.64 0.20 0.85 0.22 (3.21) from discontinued operations . . . . . . . . . . . . . . . . . . . . – 0.36 – – – Diluted earnings (loss) per common share attributable to Brown Shoe Company, inc. shareholders . . . . . . . . . . . . . . 0.64 0.56 0.85 0.22 (3.21) Dividends paid . . . . . . . . . . . . . . . . . . . . . . . . . . . . . . . 0.28 0.28 0.28 0.28 0.28ending Brown Shoe Company, inc. shareholders’ equity . . . . . . . . 9.91 9.83 9.45 9.38 9.31Financial position:receivables, net . . . . . . . . . . . . . . . . . . . . . . . . . . . . . . $ 125,683 $ 154,022 $ 113,937 $ 84,297 $ 84,252 inventories, net . . . . . . . . . . . . . . . . . . . . . . . . . . . . . . . 533,275 561,797 524,250 456,682 466,002 working capital . . . . . . . . . . . . . . . . . . . . . . . . . . . . . . . 303,319 290,558 296,376 294,186 279,297 property and equipment, net . . . . . . . . . . . . . . . . . . . . . . . 146,089 131,471 135,632 141,561 157,451 Total assets . . . . . . . . . . . . . . . . . . . . . . . . . . . . . . . . . 1,171,259 1,227,476 1,148,043 1,040,150 1,026,031 average net assets(3) . . . . . . . . . . . . . . . . . . . . . . . . . . . . 490,245 440,774 483,398 465,057 496,979 Borrowings under our revolving credit agreement . . . . . . . . . . . 105,000 201,000 198,000 94,500 112,500 Long-term debt. . . . . . . . . . . . . . . . . . . . . . . . . . . . . . . 198,823 198,633 150,000 150,000 150,000 Brown Shoe Company, inc. shareholders’ equity . . . . . . . . . . . . 425,129 412,669 415,080 402,171 394,104 average common shares outstanding – basic . . . . . . . . . . . . . . 40,659 41,126 42,156 41,585 41,525 average common shares outstanding – diluted . . . . . . . . . . . . . 40,794 41,668 42,487 41,649 41,525
all data presented reflects the fiscal year ended on the Saturday nearest to January 31. Certain prior-period amounts have been reclassified to conform to current-period presentation. These reclassifications did not affect net earnings (loss) attributable to Brown Shoe Company, inc. See item 7, Management’s Discussion and Analysis of Financial Condition and Results of Operations, for additional information related to the selected financial data above.
(1) return on average invested capital is calculated by dividing operating earnings (loss) for the period, adjusted for income taxes at the applicable effective rate, by the average of each month-end invested capital balance during the year. invested capital is defined as Brown Shoe Company, inc. shareholders’ equity plus long-term debt and borrowings under the Credit agreement.
(2) Depreciation and amortization includes depreciation of property and equipment and amortization of capitalized software, intangibles and debt issuance costs. The amortization of debt issuance costs is reflected within interest expense in our consolidated statement of earnings and totaled $2.6 million in 2012, $2.3 million in 2011, $2.2 million in 2010, $2.2 million in 2009 and $1.6 million in 2008.
(3) average net assets are calculated as the average of each month-end net asset balance during the year. net assets are calculated as the sum of working capital, property and equipment, net and capitalized software, net.
(4) During 2012, we recognized a non-cash impairment charge related to an intangible asset of $5.8 million. During 2008, we recognized non-cash impairment charges to goodwill and intangibles totaling $149.2 million.
2012 Brown Shoe Company, inC. form 10-k 25
ITEM 7 MANAGEMENT’S DISCUSSION AND ANALySIS OF FINANCIAL CONDITION AND RESULTS OF OpERATIONS
OVERVIEW
business Overviewwe are a global footwear company, with annual net sales of $2.6 billion, that puts consumers and their needs first, by targeting family, healthy living and contemporary fashion platforms. our mission is to inspire people to feel good and live better... feet first! we offer the consumer a powerful portfolio of footwear stores and global footwear brands. as both a retailer and a wholesaler, we have a perspective on the marketplace that enables us to serve consumers from different vantage points. we believe our diversified business model provides us with synergies by spanning consumer segments, categories and distribution channels. a combination of talent acquisition, thoughtful planning and rigorous execution is key to our success in optimizing our business and brand portfolio.
Retailin our retail business, our focus is on meeting the needs of a well-defined consumer by providing an assortment of trend-right, brand-name fashion and athletic footwear at a great price coupled with engaging marketing programs and exclusive products. our family platform includes famous footwear, which is one of america’s leading family branded footwear retailers with 1,055 stores. our Specialty retail segment operates 222 retail stores in the United States and Canada, primarily under the naturalizer name, including 26 stores in China. our Specialty retail segment also includes Shoes.com and our other e-commerce businesses, with the exception of famous.com, which is included in our famous footwear segment.
Wholesaleour wholesale business is consumer focused and we believe our success is dependent upon our ability to strengthen consumers’ preference for our brands by offering compelling style, quality, differentiated brand promises and innovative marketing campaigns. our healthy living and contemporary fashion platforms are comprised of the Dr. Scholl’s Shoes, naturalizer, Sam edelman, franco Sarto, LifeStride, avia, Via Spiga, ryka, fergie, Carlos, Vera wang, nevados and Vince brands. Through these brands we offer our customers a diversified portfolio, each designed and targeted to a specific consumer segment within the marketplace. we are able to showcase many of our brands in our retail stores, leveraging our wholesale and retail platforms, sharing consumer insights across our businesses and testing new and innovative products.
Financial Highlights2012 was a year of solid performance. we continue to successfully execute and deliver, due in part to our portfolio realignment initiatives. in 2012 we hit several milestones at famous footwear, by achieving record-breaking sales as well as our highest annual operating profit, both on a 52-week basis. we also strengthened our balance sheet, by reducing short-term borrowings by $96.0 million and reduced our selling and administrative expenses by $18.3 million. we continued to successfully execute and deliver under our portfolio realignment initiatives.
The following is a summary of the financial highlights for 2012:
• Consolidated net sales increased $15.3 million, or 0.6%, to $2,598.1 million in 2012, compared to $2,582.8 million last year. net sales of our famous footwear segment increased $58.0 million, while we experienced decreases at our wholesale operations and Specialty retail segments of $25.7 million and $17.1 million, respectively.
• Consolidated operating earnings were $61.6 million in 2012, compared to $35.6 million last year.• Consolidated net earnings attributable to Brown Shoe Company, Inc. were $27.5 million, or $0.64 per diluted share,
in 2012, compared to $24.6 million, or $0.56 per diluted share, last year. • Our accounting period is based upon a traditional retail calendar, which ends on the Saturday nearest January 31.
periodically, this results in a fiscal year that includes 53 weeks. our 2012 fiscal year included 53 weeks, while both our 2011 and 2010 fiscal years had only 52 weeks. The difference in the number of weeks included in our fiscal years can affect annual comparisons. The inclusion of the 53rd week resulted in an increase to net sales in our retail divisions of $21.2 million with an immaterial impact on net earnings in 2012.
The following items should be considered in evaluating the comparability of our results:
• Portfolio realignment – Our portfolio realignment initiatives include selling The Basketball Marketing Company, Inc. (“TBmC”) (markets and sells footwear bearing the anD 1 brand name, which was acquired with american Sporting Goods Corporation (“aSG”)); exiting certain women’s specialty and private label brands; exiting the children’s wholesale business; closing two U.S. distribution centers; closing or relocating numerous underperforming or poorly aligned retail stores; closing facilities in China; and other infrastructure changes. The termination of the etienne aigner license agreement is also considered part of the Company’s portfolio realignment initiatives. we incurred costs of $29.9 million ($19.3 million after-tax, or $0.45 per diluted share) related to our portfolio realignment initiatives during 2012. in 2011, we sold TBmC for a gain of $20.6 million ($14.0 million after-tax, or $0.32 per diluted share). also in 2011, we incurred costs related to portfolio realignment initiatives of $19.2 million ($12.0 million after-tax, or $0.28 per diluted share). There were no corresponding charges in 2010. See note 4 to the consolidated financial statements for additional information.
• incentive plans – our selling and administrative expenses were higher by $17.6 million during 2012, compared to last year, due to higher anticipated payments under our cash and stock-based incentive plans. our selling and administrative expenses were lower by $20.6 million during 2011, compared to 2010, due to lower anticipated payments under our cash and stock-based incentive plans.

26 2012 Brown Shoe Company, inC. form 10-k
• Organizational change – During 2012, we incurred costs of $2.3 million ($1.4 million after-tax, or $0.03 per diluted share) related to an organizational change made at our corporate headquarters, with no corresponding costs in 2011 or 2010. See note 4 to the consolidated financial statements for additional information related to this change.
• ASG acquisition and integration costs – We incurred costs of $0.7 million ($0.4 million after-tax, or $0.01 per diluted share) during 2012 related to the integration of aSG. in 2011, we incurred costs related to the acquisition and integration of aSG of $6.5 million ($4.5 million after-tax, or $0.11 per diluted share) and in 2010 we incurred costs related to the acquisition of aSG of $1.1 million ($0.7 million after-tax, or $0.02 per diluted share). all of these costs were recorded within restructuring and other special charges, net. See note 2 and note 4 to the consolidated financial statements for additional information.
• ERP stabilization – During 2011, our results were negatively impacted during the stabilization of our new ERP system (implemented in 2010) due to increases in allowances and customer charge backs, margin related to lost sales and incremental stabilization costs. we estimate that the impact of these items reduced earnings before income taxes by $12.8 million ($7.8 million after-tax, or $0.18 per diluted share), net of a $3.3 million recovery from a third-party service provider, in 2011.
• Acquisition related cost of goods sold adjustment – During 2011, we incurred costs of $4.2 million ($2.5 million after-tax, or $0.05 per diluted share), associated with the impact to cost of goods sold of the inventory fair value adjustment in connection with the acquisition of aSG, with no corresponding costs during 2012 or 2010. See note 2 to the consolidated financial statements for additional information related to these costs.
• Loss on early extinguishment of debt – During 2011, we incurred expenses of $1.0 million ($0.6 million after-tax, or $0.02 per diluted share) to extinguish our senior notes prior to maturity in 2012. There were no corresponding charges in 2012 or 2010.
• Information technology initiatives – We incurred expenses of $6.8 million ($4.6 million after-tax, or $0.10 per diluted share) in 2010, related to the implementation of our erp system that replaced select internally developed and certain other third-party applications. These expenses were included in restructuring and other special charges, net. See note 4 to the consolidated financial statements for additional information.
our debt-to-capital ratio, as defined in the Liquidity and Capital Resources – Working Capital and Cash Flow section, decreased to 41.6% as of february 2, 2013, compared to 49.1% at January 28, 2012, primarily due to our $96.0 million decrease in borrowings under our revolving credit agreement. our current ratio, as defined in the Liquidity and Capital Resources – Working Capital and Cash Flow section, was 1.65 to 1 at february 2, 2013, compared to 1.55 to 1 at January 28, 2012. inventories at february 2, 2013 were $533.3 million, down from $561.8 million at January 28, 2012, primarily driven by tight inventory management across our wholesale portfolio and the impact of wholesale operations brands we are exiting in conjunction with our portfolio realignment initiatives.
Outlook for 2013we’re pleased to have wrapped up a strong 2012. however, like many other peers, we continue to monitor consumer activity and reaction to changes in tax rates and other economic uncertainties. we expect same-store sales at famous footwear will grow in the low single digit percentage range in 2013 and that our wholesale operations net sales will decrease in the low to mid single digit percentage range in 2013.
following are the consolidated results and the results by segment for 2012, 2011 and 2010:
CONSOLIDATED RESULTS
2012 2011 2010 % of % of % of ($ millions) Net Sales net Sales net Sales
net sales. . . . . . . . . . . . . . . . . . . . . . . . . . . . . . . . . . $ 2,598.1 100.0% $ 2,582.8 100.0% $ 2,504.1 100.0%Cost of goods sold . . . . . . . . . . . . . . . . . . . . . . . . . . . . 1,587.7 61 .1% 1,586.2 61 .4% 1,500.5 59.9% Gross profit . . . . . . . . . . . . . . . . . . . . . . . . . . . . . . . . 1,010.4 38.9% 996.6 38.6% 1,003.6 40.1% Selling and administrative expenses . . . . . . . . . . . . . . . . . . 919.0 35.4% 937.3 36.3% 923.0 36.9%restructuring and other special charges, net . . . . . . . . . . . . . 24.0 0.9% 23.7 0.9% 7.9 0.3%impairment of intangible assets. . . . . . . . . . . . . . . . . . . . . 5.8 0.2% – – – – operating earnings . . . . . . . . . . . . . . . . . . . . . . . . . . . . 61.6 2.4% 35.6 1.4% 72.7 2.9% interest expense . . . . . . . . . . . . . . . . . . . . . . . . . . . . . (23.4) (0.9)% (26.1) (1.0)% (19.7) (0.8)%Loss on early extinguishment of debt . . . . . . . . . . . . . . . . . – – (1.0) (0.0)% – – interest income . . . . . . . . . . . . . . . . . . . . . . . . . . . . . . 0.3 0.0% 0.6 0.0% 0.2 0.0% earnings before income taxes from continuing operations. . . . . . 38.5 1.5% 9.1 0.4% 53.2 2.1% income tax provision . . . . . . . . . . . . . . . . . . . . . . . . . . . (11.3) (0.4)% (0.4) (0.1)% (16.1) (0.6)% net earnings from continuing operations . . . . . . . . . . . . . . . 27.2 1.1% 8.7 0.3% 37.1 1.5% Discontinued operations: earnings from operations of subsidiary, net of tax . . . . . . . . – – 1.7 0.1% – – Gain on sale of subsidiary, net of tax. . . . . . . . . . . . . . . . – – 14.0 0.5% – – net earnings from discontinued operations . . . . . . . . . . . . . . – – 15.7 0.6% – – net earnings . . . . . . . . . . . . . . . . . . . . . . . . . . . . . . . 27.2 1.1% 24.4 0.9% 37.1 1.5% net loss attributable to noncontrolling interests . . . . . . . . . . . (0.3) (0.0)% (0.2) (0.1)% (0.1) (0.0)% net earnings attributable to Brown Shoe Company, inc. . . . . . . . $ 27.5 1.1% $ 24.6 1.0% $ 37.2 1.5%

2012 Brown Shoe Company, inC. form 10-k 27
Net Salesnet sales increased $15.3 million, or 0.6%, to $2,598.1 million in 2012, compared to $2,582.8 million last year. famous footwear experienced an increase in net sales during 2012 as compared to last year, partially offset by decreases in wholesale operations and Specialty retail net sales during 2012. our famous footwear segment reported a $58.0 million increase in net sales, reflecting a 4.5% same-store sales increase, on a 52-week basis. our wholesale operations segment reported a $25.7 million, or 3.0%, decrease in net sales, primarily attributable to brands that we are exiting in conjunction with our portfolio realignment initiatives. The net sales of our Specialty retail segment decreased $17.1 million, primarily due to a lower store count and lower net sales at Shoes.com, partially offset by a same-store sales increase of 0.6%.
net sales increased $78.7 million, or 3.1%, to $2.6 billion in 2011, compared to $2.5 billion in 2010. wholesale operations experienced an increase in net sales during 2011 as compared to 2010, partially offset by decreases in famous footwear and Specialty retail net sales during 2011. our wholesale operations segment reported a $116.5 million, or 15.4%, increase in net sales (excluding $19.7 million of net sales attributable to TBmC that are reflected in net earnings from discontinued operations), primarily as a result of the acquisition of aSG during 2011, which contributed $135.5 million in net sales. our famous footwear segment reported a $30.2 million decrease in net sales, reflecting a 1.2% same-store sales decrease and a lower store count. The net sales of our Specialty retail segment decreased $7.6 million, primarily due to a decrease in store count, partially offset by a same-store sales increase of 1.7%.
Same-store sales changes are calculated by comparing the sales in stores that have been open at least 13 months. relocated stores are treated as new stores, and closed stores are excluded from the calculation. Sales change from new and closed stores, net, reflects the change in net sales due to stores that have been opened or closed during the period and are thereby excluded from the same-store sales calculation. e-commerce sales for those e-commerce websites that function as an extension of a retail chain are included in the same-store sales calculation.
Gross profitGross profit increased $13.8 million, or 1.4%, to $1,010.4 million in 2012, compared to $996.6 million last year resulting from higher gross profit rates at our famous footwear and Specialty retail segments. as a percent of net sales, our gross profit rate increased to 38.9% in 2012, from 38.6% last year. The increase in gross profit rate was primarily due to lower inventory markdowns at our famous footwear segment. our Specialty retail segment experienced a higher gross profit rate driven by an increased sales mix of higher-margin footwear. our wholesale operations gross profit rate decreased due to higher inventory markdowns and customer allowances. retail and wholesale net sales were 67.5% and 32.5%, respectively, in 2012 compared to 66.3% and 33.7% in 2011. Gross profit rates in our retail businesses are higher than in wholesale.
Gross profit decreased $7.0 million, or 0.7%, to $996.6 million in 2011, compared to $1.0 billion in 2010 resulting from a lower gross profit rate at our famous footwear and Specialty retail segments. as a percent of net sales, our gross profit rate decreased to 38.6% in 2011, from 40.1% in 2010. The decrease in gross profit rate was primarily due to famous footwear’s lower toning footwear sales and increased promotional activity. our Specialty retail segment experienced a lower gross profit rate due to lower sales of high-margin products, such as toning footwear and boots in 2011 as compared to 2010. our wholesale operations gross profit rate was flat as compared to 2010. while our wholesale operations segment benefited from the acquisition of aSG in 2011, the segment also experienced higher product costs and inventory markdowns in 2011. Gross profit rate at our wholesale operations segment was also negatively impacted by the stabilization of our erp system, including higher customer allowances, chargebacks and air freight charges (estimated to be $11.9 million), the impact to cost of goods sold of the inventory fair value adjustment in connection with the acquisition of aSG ($4.2 million) and other cost of goods sold adjustments associated with our portfolio realignment ($1.6 million). retail and wholesale net sales were 66.3% and 33.7%, respectively, in 2011 compared to 69.9% and 30.1% in 2010.
we classify warehousing, distribution, sourcing and other inventory procurement costs in selling and administrative expenses. accordingly, our gross profit and selling and administrative expenses rates, as a percent of net sales, may not be comparable to other companies.
Selling and Administrative ExpensesSelling and administrative expenses decreased $18.3 million, or 2.0%, to $919.0 million in 2012 compared to $937.3 million last year and increased $14.3 million, or 1.6%, in 2011 compared to $923.0 million in 2010.
Selling and administrative expenses decreased $18.3 million in 2012 compared to last year primarily due to our portfolio realignment actions, partially offset by new store and other investments, higher cash and stock-based incentive costs and the impact of a 53rd week in fiscal 2012. as a percent of net sales, selling and administrative expenses decreased to 35.4% in 2012 from 36.3% last year.
Selling and administrative expenses increased $14.3 million in 2011 compared to 2010 primarily due to the inclusion of aSG’s selling and administrative expenses ($41.2 million) and higher information systems related costs associated with our new erp platform. we also experienced higher selling and merchandising costs, partially offset by lower incentive plan costs due to lower expected payouts under both cash and stock-based plans ($20.6 million). as a percent of net sales, selling and administrative expenses decreased to 36.3% in 2011 from 36.9% in 2010.

28 2012 Brown Shoe Company, inC. form 10-k
Restructuring and Other Special Charges, Netrestructuring and other special charges, net, increased $0.3 million to $24.0 million during 2012, compared to $23.7 million last year as a result of the following items (see note 4 to the consolidated financial statements for additional information related to these charges and recoveries):
• Portfolio realignment – We incurred charges of $21.0 million in 2012 as compared to $17.2 million during 2011 related to our portfolio realignment initiatives.
• Organizational changes – We incurred costs of $2.3 million 2012, related to corporate organizational changes, with no corresponding costs in 2011.
• Acquisition and integration related costs – We incurred $0.7 million related to the integration of ASG in 2012 as compared to $6.5 million during 2011 related to the acquisition and integration of aSG.
as a percent of net sales, restructuring and other special charges, net, remained consistent at 0.9% from 2011 to 2012, reflecting the above named factors.
restructuring and other special charges, net, increased $15.8 million to $23.7 million during 2011, compared to $7.9 million in 2010 as a result of the following items:
• Portfolio realignment – We incurred charges of $17.2 million during 2011 related to our portfolio realignment initiatives with no corresponding charges in 2010.
• Acquisition and integration related costs – We incurred $6.5 million of costs during 2011 related to the acquisition and integration of aSG, which we purchased on february 17, 2011, with $1.1 million in corresponding charges in 2010.
• Information technology initiatives – We incurred no charges during 2011 related to our ERP system with $6.8 million in corresponding charges in 2010. Subsequent to going live on our erp system in the fourth quarter of 2010, all expenses related to our erp system were reflected in selling and administrative expenses.
as a percent of net sales, restructuring and other special charges, net increased to 0.9% in 2011, from 0.3% in 2010, reflecting the above named factors.
Impairment of Intangible AssetsDuring 2012, the Company terminated the etienne aigner license agreement due to a dispute with the licensor. in conjunction with the termination, the Company recognized an impairment charge of $5.8 million to reduce the remaining unamortized value of the licensed trademark intangible asset to zero.
Operating Earningsoperating earnings increased $26.0 million, or 73.3%, to $61.6 million in 2012, compared to $35.6 million last year due to lower selling and administrative expenses and higher gross profit, partially offset by an intangible impairment charge, as discussed above.
we reported operating earnings of $35.6 million in 2011 compared to $72.7 million in 2010 due to the increase in restructuring and other special charges, net and selling and administrative expenses and the decrease in gross profit, all partially offset by an increase in net sales, as discussed above.
Interest Expenseinterest expense decreased $2.7 million, or 10.6%, to $23.4 million in 2012 compared to $26.1 million last year and increased $6.4 million, or 33.1%, in 2011 compared to $19.7 million in 2010. The decrease in interest expense in 2012 was primarily due to lower average borrowings under our Credit agreement as compared to 2011.
The increase in interest expense in 2011 was primarily due to higher average borrowings under our Credit agreement and the increase in long-term debt in connection with the refinancing of our senior notes in early 2011 as a result of the additional capital needed in connection with our acquisition of aSG and the repurchase of 2.5 million shares of our common stock.
Loss on Early Extinguishment of DebtDuring 2011, we redeemed all of our senior notes due in 2012. we incurred certain debt extinguishment costs to retire these notes prior to maturity totaling $1.0 million, of which $0.6 million was non-cash charges related to unamortized debt issuance costs and $0.4 million represented cash paid for tender premiums. we did not incur such costs in 2012 or 2010.
Income Tax provisionour consolidated effective tax rate on continuing operations was a provision of 29.4% in 2012 compared to 3.6% in 2011 and 30.4% in 2010. our consolidated effective tax rate is generally below the federal statutory rate of 35% because our foreign earnings are subject to lower statutory tax rates.

2012 Brown Shoe Company, inC. form 10-k 29
in 2012, we recognized pretax earnings in both our domestic operations and foreign jurisdictions. our overall effective tax rate was less than the domestic statutory rate due to the mix of earnings in lower rate international jurisdictions. our foreign tax jurisdictions have lower tax rates than domestic. These factors resulted in an overall effective tax provision rate of 29.4% in 2012.
in 2011, we incurred a pretax loss in our domestic operations and pretax earnings in foreign jurisdictions. our domestic effective tax rate was less than the statutory rate due to the impact of non-deductible permanent items applied to the domestic loss and the impact of the earnings mix between domestic and international tax jurisdictions. our foreign tax jurisdictions have lower tax rates than domestic. These factors resulted in an overall effective tax provision rate of 3.6% on continuing operations in 2011.
in 2010, we experienced pretax earnings in both our domestic operations and foreign jurisdictions. This mix of domestic and foreign pretax earnings resulted in an overall effective tax provision rate of 30.4% in 2010.
See note 6 to the consolidated financial statements for additional information regarding our tax rates.
Net Earnings from Continuing Operationswe reported net earnings from continuing operations of $27.2 million in 2012 compared to $8.7 million in 2011 and $37.1 million in 2010, as a result of the factors described above.
Net Earnings from Discontinued OperationsDuring 2011, we sold TBmC, which markets and sells footwear bearing the anD 1 brand-name. The operations of TBmC and the gain on sale of this subsidiary were reported as discontinued operations. we reported net earnings from discontinued operations, net of tax, totaling $15.7 million in 2011, of which $1.7 million related to the operating results of TBmC, net of tax, and $14.0 million related to the gain on sale of the subsidiary, net of tax.
Net Earnings Attributable to brown Shoe Company, Inc.we reported net earnings attributable to Brown Shoe Company, inc. of $27.5 million in 2012, compared to $24.6 million last year and $37.2 million in 2010.
Geographic Resultswe have both domestic and foreign operations. Domestic operations include the nationwide operation of our famous footwear and Specialty retail footwear stores, the wholesale distribution of footwear to numerous retail customers and the operation of our e-commerce websites. foreign operations primarily consist of wholesale operations in the far east and Canada, retailing operations in Canada and China and the operation of our international e-commerce websites. in addition, we license certain of our trademarks to third parties who distribute and/or operate retail locations internationally. The far east operations include first-cost transactions, where footwear is sold at foreign ports to customers who then import the footwear into the United States and other countries. The breakdown of domestic and foreign net sales and earnings before income taxes was as follows: 2012 2011 2010 (Loss) Earnings before earnings Before earnings Before ($ millions) Net Sales Income Taxes net Sales income Taxes net Sales income Taxes
Domestic . . . . . . . . . . . . . . . $2,295.8 $10.5 $2,259.9 $(1 1 . 1) $2,179.7 $23.8 foreign . . . . . . . . . . . . . . . . 302.3 28.0 322.9 20.2 324.4 29.4 $2,598.1 $38.5 $2,582.8 $ 9.1 $2,504.1 $53.2
The pretax profitability on foreign sales is higher than on domestic sales because of a lower cost structure and the inclusion in domestic earnings of the unallocated corporate administrative and other costs.
we recognized earnings before income taxes both domestically and in foreign jurisdictions in 2012. our domestic earnings reflected increases in net sales at our famous footwear segment, a decrease in selling and administrative expenses and an increase in gross profit, all partially offset by an intangible impairment charge.
we incurred a domestic loss before income taxes and had foreign earnings before income taxes in 2011. our domestic loss reflected decreases in net sales at our famous footwear and Specialty retail segments, a decrease in gross profit, an increase in selling and administrative expenses and an increase in restructuring and other special charges, net.
we had domestic and foreign earnings before income taxes in 2010 primarily as a result of the strong sales results in both our retail and wholesale businesses, partially offset by higher selling and administrative expenses, a portion of which are variable with higher sales volumes. our performance is primarily attributable to the record sales results and operating earnings gains within our famous footwear segment and sales growth within our wholesale operations segment due to capitalization on key footwear trends.

30 2012 Brown Shoe Company, inC. form 10-k
FAMOUS FOOTWEAR
2012 2011 2010 % of % of % of ($ millions, except sales per square foot) Net Sales net Sales net Sales
Operating Resultsnet sales. . . . . . . . . . . . . . . . . . . . . . . . . . . . . . . . . . . $ 1,514.3 100.0% $ 1,456.3 100.0% $ 1,486.5 100.0%Cost of goods sold . . . . . . . . . . . . . . . . . . . . . . . . . . . . . 848.2 56.0% 821 .1 56.4% 817.5 55.0% Gross profit . . . . . . . . . . . . . . . . . . . . . . . . . . . . . . . . . 666.1 44.0% 635.2 43.6% 669.0 45.0% Selling and administrative expenses . . . . . . . . . . . . . . . . . . . 564.2 37.3% 569.9 39.1% 578.6 38.9%restructuring and other special charges, net . . . . . . . . . . . . . . 7.8 0.5% 2.8 0.2% – – operating earnings . . . . . . . . . . . . . . . . . . . . . . . . . . . . . $ 94.1 6.2% $ 62.5 4.3% $ 90.4 6.1%
Key MetricsSame-store sales % change (on a 52-week basis) . . . . . . . . . . . . 4.5% (1.2)% 10.5% Same-store sales $ change (on a 52-week basis) . . . . . . . . . . . . $ 62.2 $ (17.3) $ 138.0 Sales from 53rd week . . . . . . . . . . . . . . . . . . . . . . . . . . . $ 18.1 $ – $ – Sales change from new and closed stores, net (on a 52-week basis) . $ (22.3) $ (12.9) $ (15.1)
Sales per square foot, excluding e-commerce (on a 52-week basis) . $ 199 $ 186 $ 187 Square footage (thousand sq. ft.). . . . . . . . . . . . . . . . . . . . . 7,205 7,484 7,677
Stores opened . . . . . . . . . . . . . . . . . . . . . . . . . . . . . . . 55 49 32 Stores closed . . . . . . . . . . . . . . . . . . . . . . . . . . . . . . . . 89 70 51 ending stores . . . . . . . . . . . . . . . . . . . . . . . . . . . . . . . . 1,055 1,089 1 ,1 10
Net Salesnet sales increased $58.0 million, or 4.0%, to $1,514.3 million in 2012 compared to $1,456.3 million last year. During 2012, same-store sales increased 4.5%, or $62.2 million, reflecting improved average retail prices, conversion rate and customer traffic, partially offset by lower pairs per transaction. The impact of the 53rd week in 2012 increased sales by $18.1 million. in addition, we saw strong growth from boat shoes, athletic shoes and boots. as a result of the same-store sales increase, sales per square foot, excluding e-commerce, increased 7.3% to $199, compared to $186 last year. net closed stores resulted in a $22.3 million decrease in net sales due to the relocation of certain stores and the closure of underperforming stores. in 2012, we expanded our efforts to connect with and engage our customers to build a strong brand preference for famous footwear through our loyalty program, rewards. as a result, in 2012 approximately 66% of our net sales were to rewards members, compared to 62% in 2011 and 61% in 2010.
net sales decreased $30.2 million, or 2.0%, to $1,456.3 million in 2011 compared to $1,486.5 million in 2010. During 2011, same-store sales decreased 1.2%, or $17.3 million, reflecting lower consumer traffic and pairs per transaction, partially offset by higher average retail prices and an improved consumer conversion rate. The decrease in net sales was also due to a decline in sales of high-margin products, such as toning footwear. as a result of the same-store sales decrease, sales per square foot, excluding e-commerce, decreased 0.5% to $186, compared to $187 in 2010. net closed stores resulted in a $12.9 million decrease in net sales due to the relocation of certain stores and the closure of underperforming stores.
Gross profitGross profit increased $30.9 million, or 4.9%, to $666.1 million in 2012 compared to $635.2 million last year due to higher net sales and gross profit rate. as a percent of net sales, our gross profit rate increased to 44.0% in 2012 compared to 43.6% last year. The increase in our gross profit rate was driven by lower inventory markdown requirements resulting from a better aged inventory position.
Gross profit decreased $33.8 million, or 5.1%, to $635.2 million in 2011 compared to $669.0 million in 2010 due to a lower gross profit rate and net sales. as a percent of net sales, our gross profit rate decreased to 43.6% in 2011 compared to 45.0% in 2010. The decrease in our gross profit rate was driven by lower sales of toning footwear and an increase in promotional activity.
Selling and Administrative ExpensesSelling and administrative expenses decreased $5.7 million, or 1.0%, to $564.2 million during 2012 compared to $569.9 million last year. The decrease was primarily attributable to lower, net facilities costs, as our portfolio realignment actions more than offset new store costs, and lower marketing expenses, partially offset by an incremental week of expenses associated with the 53rd week and higher expected payouts under both our cash and stock-based plans. as a percent of net sales, selling and administrative expenses decreased to 37.3% in 2012 from 39.1% last year, reflecting higher net sales and the closure of underperforming stores.
Selling and administrative expenses decreased $8.7 million, or 1.5%, to $569.9 million during 2011 compared to $578.6 million in 2010. The decrease was primarily attributable to lower variable payroll and facilities expenses and a decrease in expected payouts under both our cash and stock-based plans ($3.8 million). These decreases were partially offset by higher marketing expenses. as a percent of net sales, selling and administrative expenses increased to 39.1% in 2011 from 38.9% in 2010, reflecting the lower net sales volume.
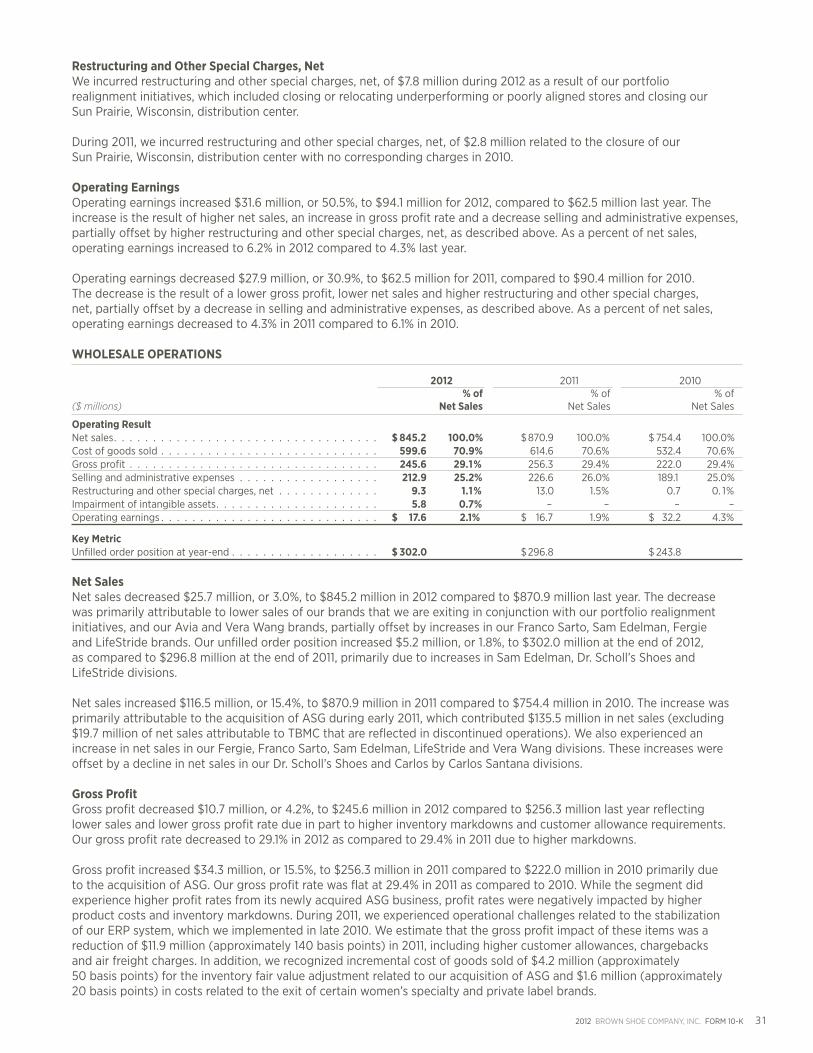
2012 Brown Shoe Company, inC. form 10-k 31
Restructuring and Other Special Charges, Netwe incurred restructuring and other special charges, net, of $7.8 million during 2012 as a result of our portfolio realignment initiatives, which included closing or relocating underperforming or poorly aligned stores and closing our Sun prairie, wisconsin, distribution center.
During 2011, we incurred restructuring and other special charges, net, of $2.8 million related to the closure of our Sun prairie, wisconsin, distribution center with no corresponding charges in 2010.
Operating Earningsoperating earnings increased $31.6 million, or 50.5%, to $94.1 million for 2012, compared to $62.5 million last year. The increase is the result of higher net sales, an increase in gross profit rate and a decrease selling and administrative expenses, partially offset by higher restructuring and other special charges, net, as described above. as a percent of net sales, operating earnings increased to 6.2% in 2012 compared to 4.3% last year.
operating earnings decreased $27.9 million, or 30.9%, to $62.5 million for 2011, compared to $90.4 million for 2010. The decrease is the result of a lower gross profit, lower net sales and higher restructuring and other special charges, net, partially offset by a decrease in selling and administrative expenses, as described above. as a percent of net sales, operating earnings decreased to 4.3% in 2011 compared to 6.1% in 2010.
WHOLESALE OpERATIONS
2012 2011 2010 % of % of % of ($ millions) Net Sales net Sales net Sales
Operating Resultnet sales. . . . . . . . . . . . . . . . . . . . . . . . . . . . . . . . . . $ 845.2 100.0% $ 870.9 100.0% $ 754.4 100.0%Cost of goods sold . . . . . . . . . . . . . . . . . . . . . . . . . . . . 599.6 70.9% 614.6 70.6% 532.4 70.6% Gross profit . . . . . . . . . . . . . . . . . . . . . . . . . . . . . . . . 245.6 29.1% 256.3 29.4% 222.0 29.4% Selling and administrative expenses . . . . . . . . . . . . . . . . . . 212.9 25.2% 226.6 26.0% 189.1 25.0%restructuring and other special charges, net . . . . . . . . . . . . . 9.3 1.1% 13.0 1.5% 0.7 0. 1%impairment of intangible assets. . . . . . . . . . . . . . . . . . . . . 5.8 0.7% – – – – operating earnings . . . . . . . . . . . . . . . . . . . . . . . . . . . . $ 17.6 2.1% $ 16.7 1.9% $ 32.2 4.3%
Key MetricUnfilled order position at year-end . . . . . . . . . . . . . . . . . . . $ 302.0 $ 296.8 $ 243.8
Net Salesnet sales decreased $25.7 million, or 3.0%, to $845.2 million in 2012 compared to $870.9 million last year. The decrease was primarily attributable to lower sales of our brands that we are exiting in conjunction with our portfolio realignment initiatives, and our avia and Vera wang brands, partially offset by increases in our franco Sarto, Sam edelman, fergie and LifeStride brands. our unfilled order position increased $5.2 million, or 1.8%, to $302.0 million at the end of 2012, as compared to $296.8 million at the end of 2011, primarily due to increases in Sam edelman, Dr. Scholl’s Shoes and LifeStride divisions.
net sales increased $116.5 million, or 15.4%, to $870.9 million in 2011 compared to $754.4 million in 2010. The increase was primarily attributable to the acquisition of aSG during early 2011, which contributed $135.5 million in net sales (excluding $19.7 million of net sales attributable to TBmC that are reflected in discontinued operations). we also experienced an increase in net sales in our fergie, franco Sarto, Sam edelman, LifeStride and Vera wang divisions. These increases were offset by a decline in net sales in our Dr. Scholl’s Shoes and Carlos by Carlos Santana divisions. Gross profitGross profit decreased $10.7 million, or 4.2%, to $245.6 million in 2012 compared to $256.3 million last year reflecting lower sales and lower gross profit rate due in part to higher inventory markdowns and customer allowance requirements. our gross profit rate decreased to 29.1% in 2012 as compared to 29.4% in 2011 due to higher markdowns. Gross profit increased $34.3 million, or 15.5%, to $256.3 million in 2011 compared to $222.0 million in 2010 primarily due to the acquisition of aSG. our gross profit rate was flat at 29.4% in 2011 as compared to 2010. while the segment did experience higher profit rates from its newly acquired aSG business, profit rates were negatively impacted by higher product costs and inventory markdowns. During 2011, we experienced operational challenges related to the stabilization of our erp system, which we implemented in late 2010. we estimate that the gross profit impact of these items was a reduction of $11.9 million (approximately 140 basis points) in 2011, including higher customer allowances, chargebacks and air freight charges. in addition, we recognized incremental cost of goods sold of $4.2 million (approximately 50 basis points) for the inventory fair value adjustment related to our acquisition of aSG and $1.6 million (approximately 20 basis points) in costs related to the exit of certain women’s specialty and private label brands.

32 2012 Brown Shoe Company, inC. form 10-k
Selling and Administrative ExpensesSelling and administrative expenses decreased $13.7 million, or 6.0%, to $212.9 million during 2012 compared to $226.6 million last year, due in part to our lower cost structure resulting from exiting certain brands under our portfolio realignment initiatives, partially offset by an increase in anticipated payments under our cash and stock-based incentive plans ($6.8 million) and incremental expenses associated with the 53rd week. as a percent of net sales, selling and administrative expenses decreased to 25.2% in 2012 from 26.0% last year, reflecting the above named factors.
Selling and administrative expenses increased $37.5 million, or 19.8%, to $226.6 million during 2011 compared to $189.1 million in 2010 due primarily to the acquisition of aSG, which contributed $41.2 million in operating expenses, and an increase in marketing, merchandising and selling expenses. The increase was partially offset by lower expected payouts under both our cash and stock-based plans ($8.9 million). as a percent of net sales, selling and administrative expenses increased to 26.0% in 2011 from 25.0% in 2010, reflecting the higher selling and administrative expenses from aSG and increased costs related to our erp system.
Restructuring and Other Special Charges, Netrestructuring and other special charges, net, decreased $3.7 million to $9.3 million with $13.0 million of corresponding charges last year as a result of the following items (see note 4 to the consolidated financial statements for additional information related to these charges and recoveries):
• Portfolio realignment – We incurred charges of $8.6 million during 2012 related to our portfolio realignment initiatives compared to $10.5 million in 2011.
• Acquisition and integration related costs – We incurred charges of $0.7 million during 2012 related to the integration of aSG as compared to $2.5 million of costs during 2011 related to the acquisition and integration of aSG.
as a percent of net sales, restructuring and other special charges, net, decreased to 1.1% in 2012, from 1.5% last year, reflecting the above named factors.
restructuring and other special charges, net, increased $12.3 million to $13.0 million in 2011 with $0.7 million of corresponding charges in 2010 as a result of the following items (see note 4 to the consolidated financial statements for additional information related to these charges and recoveries):
• Portfolio realignment – We incurred charges of $10.5 million during 2011 related to our portfolio realignment with no corresponding charges in 2010.
• Acquisition and integration related costs – We incurred $2.5 million of costs during 2011 related to the acquisition and integration of aSG, which we purchased on february 17, 2011.
• Information technology initiatives – We incurred no charges during 2011 related to our ERP system but incurred $0.7 million in charges in 2010.
as a percent of net sales, restructuring and other special charges, net, increased to 1.5% in 2011, from 0.1% in 2010 reflecting the above named factors.
Impairment of Intangible AssetsDuring 2012, the Company terminated the etienne aigner license agreement due to a dispute with the licensor. in conjunction with the termination, the Company recognized an impairment charge of $5.8 million to reduce the remaining unamortized value of the licensed trademark intangible asset to zero.
Operating Earningsoperating earnings increased $0.9 million, or 5.0%, to $17.6 million in 2012 compared to $16.7 million last year. The increase was primarily driven by lower selling and administrative expenses and restructuring and other special charges, net, partially offset by lower net sales and corresponding gross profit and an intangible asset impairment charge. as a percent of net sales, operating earnings increased to 2.1% in 2012 compared to 1.9% last year.
operating earnings decreased $15.5 million, or 48.1%, to $16.7 million in 2011 compared to $32.2 million in 2010. The decrease was primarily driven by higher selling and administrative expenses and restructuring and other special charges, net, partially offset by an increase in net sales. as a percent of net sales, operating earnings decreased to 1.9% in 2011 compared to 4.3% in 2010.

2012 Brown Shoe Company, inC. form 10-k 33
SpECIALTy RETAIL
2012 2011 2010 % of % of % of ($ millions, except sales per square foot) Net Sales net Sales net Sales
Operating Resultsnet sales. . . . . . . . . . . . . . . . . . . . . . . . . . . . . . . . . . . $ 238.5 100.0% $ 255.6 100.0% $ 263.2 100.0%Cost of goods sold . . . . . . . . . . . . . . . . . . . . . . . . . . . . . 139.8 58.6% 150.5 58.9% 150.7 57.2%Gross profit . . . . . . . . . . . . . . . . . . . . . . . . . . . . . . . . . 98.7 41.4% 105.1 41 .1% 1 12.5 42.8%Selling and administrative expenses . . . . . . . . . . . . . . . . . . . 103.9 43.5% 1 12.1 43.9% 1 18.5 45.1%restructuring and other special charges, net . . . . . . . . . . . . . . 3.7 1.6% 0.6 0.2% – – operating loss . . . . . . . . . . . . . . . . . . . . . . . . . . . . . . . $ (8.9) (3.7)% $ (7.6) (3.0)% $ (6.0) (2.3)%
Key MetricsSame-store sales % change (on a 52-week basis) . . . . . . . . . . . . 0.6% 1.7% 6.6% Same-store sales $ change (on a 52-week basis) . . . . . . . . . . . . $ 0.8 $ 2.8 $ 10.5 Sales from 53rd week . . . . . . . . . . . . . . . . . . . . . . . . . . . $ 3.1 $ – $ – Sales change from new and closed stores, net (on a 52-week basis) . $ (14.9) $ (10.7) $ (9.7)impact of changes in Canadian exchange rate on sales . . . . . . . . $ (0.4) $ 2.6 $ 6.0 Sales change of e-commerce subsidiary (on a 52-week basis) . . . . $ (5.7) $ (2.3) $ 9.8
Sales per square foot, excluding e-commerce (on a 52-week basis) . $ 396 $ 399 $ 381 Square footage (thousand sq. ft.). . . . . . . . . . . . . . . . . . . . . 346 369 417
Stores opened . . . . . . . . . . . . . . . . . . . . . . . . . . . . . . . 29 25 15 Stores closed . . . . . . . . . . . . . . . . . . . . . . . . . . . . . . . . 41 50 38 ending stores . . . . . . . . . . . . . . . . . . . . . . . . . . . . . . . . 222 234 259
Net Salesnet sales decreased $17.1 million, or 6.7%, to $238.5 million in 2012 compared to $255.6 million last year due to our lower store count, lower net sales at Shoes.com and a lower Canadian dollar exchange rate, partially offset by an increase in same-store sales of 0.6% and the impact of the 53rd week. on a 52-week basis, the net sales of Shoes.com decreased $5.7 million, or 7.5%, to $69.9 million in 2012 compared to $75.6 million last year. we opened 29 stores (including 13 naturalizer stores in China) and closed 41 stores (including 10 naturalizer stores in China) during 2012, resulting in a total of 222 stores (including 26 naturalizer stores in China) at the end of 2012 compared to 234 stores (including 23 naturalizer stores in China) at the end of last year. Sales per square foot, excluding e-commerce, decreased 0.9% to $396 compared to $399 last year due to lower net sales. The 53rd week contributed $3.1 million in net sales.
net sales decreased $7.6 million, or 2.9%, to $255.6 million in 2011 compared to $263.2 million in 2010 due to our lower store count, a decrease in sales of toning footwear and a decrease in net sales at Shoes.com. however, same-store sales increased 1.7% and we experienced an increase in the Canadian dollar exchange rate. The net sales of Shoes.com decreased $2.3 million, or 2.9%, to $75.6 million in 2011 compared to $77.9 million in 2010, reflecting a decrease in site visits. we opened 25 new stores (including nine new naturalizer stores in China) and closed 50 stores (including one naturalizer store in China) during 2011, resulting in a total of 234 stores (including 23 naturalizer stores in China) at the end of 2011 compared to 259 stores (including 15 naturalizer stores in China) at the end of 2010. Sales per square foot, excluding e-commerce, increased 4.7% to $399 compared to $381 in 2010 due to the closure of underperforming stores as part of our portfolio realignment.
Gross profitGross profit decreased $6.4 million, or 6.1%, to $98.7 million in 2012 compared to $105.1 million last year, reflecting lower net sales, partially offset by an increase in gross profit rate. as a percent of net sales, our gross profit rate increased to 41.4% in 2012, from 41.1% last year, driven by a better sales mix of higher-margin footwear.
Gross profit decreased $7.4 million, or 6.6%, to $105.1 million in 2011 compared to $112.5 million in 2010, reflecting lower net sales and a decrease in our gross profit rate. as a percent of net sales, our gross profit rate decreased to 41.1% in 2011, from 42.8% in 2010, due to lower sales of high-margin products, such as toning footwear and boots, partially offset by an increased gross profit rate for Shoes.com.
our naturalizer stores purchase the majority of their inventory from our wholesale operations segment. in general, we have priced the inventory to recognize a customary profit rate on these products in our wholesale operations segment. The Specialty retail segment recognizes an additional profit rate based on the retail sale to the consumer.
Selling and Administrative ExpensesSelling and administrative expenses decreased $8.2 million, or 7.4%, to $103.9 million during 2012 compared to $112.1 million last year, primarily resulting from the lower store count, partially offset by higher expected payouts under both our cash and stock-based plans and the impact of the 53rd week. as a percent of net sales, selling and administrative expenses decreased to 43.5% in 2012 compared to 43.9% last year.

34 2012 Brown Shoe Company, inC. form 10-k
Selling and administrative expenses decreased $6.4 million, or 5.4%, to $112.1 million during 2011 compared to $118.5 million in 2010, primarily resulting from the lower store count and lower expected payouts under both our cash and stock-based plans, partially offset by an increase in the Canadian dollar exchange rate. as a percent of net sales, selling and administrative expenses decreased to 43.9% in 2011 compared to 45.1% in 2010.
Restructuring and Other Special Charges, Netwe incurred restructuring and other special charges, net, of $3.7 million during 2012 compared to $0.6 million last year, as a result of closing our Via Spiga, f.X. LaSalle and Brown Shoe Closet stores as part of our portfolio realignment. no restructuring and other special charges were incurred in 2010.
Operating Lossour operating loss increased $1.3 million, or 16.0%, to $8.9 million for 2012 compared to $7.6 million for last year, primarily due to a decrease in net sales and an increase in restructuring and other special charges, net, partially offset by a decrease in selling and administrative expenses, as described above.
our operating loss increased $1.6 million, or 27.8%, to $7.6 million for 2011 compared to $6.0 million in 2010, primarily due to a decrease in net sales, a decline in gross profit rate and an increase in restructuring and other special charges, net, partially offset by lower selling and administrative expenses, as described above.
OTHER
The other segment includes unallocated corporate administrative and other costs and recoveries. The segment reported costs of $41.2 million, $36.1 million and $44.0 million in 2012, 2011 and 2010, respectively.
There were several factors impacting the $5.1 million increase in costs from 2011 to 2012, as follows:• Incentive compensation – Our selling and administrative expenses were higher by $6.9 million during 2012,
compared to last year, due to higher anticipated payments under our cash and stock-based incentive plans.• Director compensation – Our expenses related to director compensation increased $3.2 million during 2012,
compared to last year, primarily reflecting the impact of the Company’s higher share price on certain of the variable share-based compensation plans.
• Technology professional services and consulting fees – Our selling and administrative expenses were lower by $2.0 million during 2012, compared to last year.
• Organizational changes – We incurred costs of $2.3 million in 2012, related to corporate organizational changes, with no corresponding costs in 2011.
• Portfolio realignment costs – We incurred costs of $0.9 million during 2012, related to our portfolio realignment initiatives, as compared to $3.3 million in 2011.
• Acquisition and integration costs – We incurred costs of $4.0 million during 2011, related to the acquisition and integration of aSG, with no corresponding costs in 2012.
• ERP stabilization – We incurred professional fees of $1.9 million during 2011 to assist with the stabilization of our erp platform.
• Insurance settlement and contingent liabilities – During 2011, we resolved certain contingent liabilities related to legal matters and reversed $1.8 million of the associated accrued liabilities to income. in addition, we reached a settlement agreement with one of our insurers, whereby we recovered $0.8 million of prior expenses paid for environmental remediation costs. The legal contingencies and insurance settlement were recognized as income.
There were several factors impacting the $7.9 million decrease in costs from 2010 to 2011, as follows:
• Incentive plans – Our selling and administrative expenses were lower by $7.5 million in 2011, compared to 2010, due to lower anticipated payments under both our cash and stock-based incentive plans.
• Acquisition and integration costs – We incurred costs of $4.0 million during 2011, related to the acquisition and integration of aSG in february 2011, as compared to $1.1 million in 2010.
• Portfolio realignment – We incurred $3.3 million in costs related to our portfolio realignment in 2011 with no corresponding costs in 2010.
• ERP stabilization – We incurred professional fees of $1.9 million during 2011 to assist with the stabilization of our erp platform.
• Insurance settlement and contingent liabilities – During 2011, we resolved certain contingent liabilities related to legal matters and reversed $1.8 million of the associated accrued liabilities to income. in addition, we reached a settlement agreement with one of our insurers, whereby we recovered $0.8 million of prior expenses paid for environmental remediation costs. The legal contingencies and insurance settlement were recognized as income.
• Information technology initiatives – We incurred charges of $6.1 million during 2010 related to the integration of our erp system with no corresponding charges in 2011.

2012 Brown Shoe Company, inC. form 10-k 35
RESTRUCTURING AND OTHER SpECIAL CHARGES, NET
During 2012, we recorded restructuring and other special charges, net, of $24.0 million, including $21.0 million in expenses related to our portfolio realignment, $2.3 million related to an organizational change and $0.7 million related to the integration of aSG. See the Financial Highlights section above and note 2 and note 4 to the consolidated financial statements for additional information related to these charges and the acquisition and integration of aSG.
During 2011, we recorded restructuring and other special charges, net, of $23.7 million, including $17.2 million in expenses related to our portfolio realignment and $6.5 million in expenses related to the acquisition and integration of aSG. See the Financial Highlights section above and note 2 and note 4 to the consolidated financial statements for additional information related to these charges and the acquisition of aSG.
During 2010, we recorded restructuring and other special charges, net, of $7.9 million, including $6.8 million in expenses related to our information technology initiatives and $1.1 million in acquisition-related costs related to our february 17, 2011 acquisition of aSG. See the Financial Highlights section above and note 2 and note 4 to the consolidated financial statements for additional information related to these charges and the acquisition of aSG.
IMpACT OF INFLATION AND CHANGING pRICES
while we have felt the effects of inflation on our business and results of operations, it has not had a significant impact on our business over the last three years. inflation can have a long-term impact on our business because increasing costs of materials and labor may impact our ability to maintain satisfactory profit rates. for example, our products are manufactured in other countries, and a decline in the value of the U.S. dollar and the impact of labor shortages in China may result in higher manufacturing costs. Similarly, any potential significant shortage of quantities or increases in the cost of the materials that are used in our manufacturing process, such as leather and other materials or resources, could have a material negative impact on our business and results of operations. in addition, inflation is often accompanied by higher interest rates, which could have a negative impact on consumer spending, in which case our net sales and profit rates could decrease. moreover, increases in inflation may not be matched by increases in income, which also could have a negative impact on consumer spending. if we incur increased costs that are unable to be recovered through price increases, or if consumer spending decreases generally, our business, results of operations, financial condition and cash flows may be adversely affected. in an effort to mitigate the impact of these incremental costs on our operating results, we expect to pass on some portion of cost increases to our consumers and adjust our business model, as appropriate, to minimize the impact of higher costs. further discussion of the potential impact of inflation and changing prices is included in item 1a, Risk Factors.
LIQUIDITy AND CApITAL RESOURCES
borrowings ($ millions) February 2, 2013 January 28, 2012 (Decrease) increase
Borrowings under Credit agreement . . . . . . . . . . . . . $ 105.0 $ 201.0 $ (96.0) Senior notes . . . . . . . . . . . . . . . . . . . . . . . . . . 198.8 198.6 0.2 Total debt . . . . . . . . . . . . . . . . . . . . . . . . . . . . $ 303.8 $ 399.6 $ (95.8)
Total debt obligations decreased $95.8 million, or 24.0%, to $303.8 million at the end of 2012 compared to $399.6 million at the end of last year due to a decrease in borrowings under our revolving credit agreement. interest expense in 2012 was $23.4 million compared to $26.1 million in 2011 and $19.7 million in 2010.
Credit Agreementon January 7, 2011, Brown Shoe Company, inc. and certain of its subsidiaries (the “Loan parties”) entered into a Third amended and restated Credit agreement, which was further amended on february 17, 2011 (as so amended, the “Credit agreement”). The Credit agreement matures on January 7, 2016 and provides for a revolving credit facility in an aggregate amount of up to $530.0 million (effective february 17, 2011), subject to the calculated borrowing base restrictions, and provides for an increase at our option by up to $150.0 million from time to time during the term of the Credit agreement (the “general purpose accordion feature”) subject to satisfaction of certain conditions and the willingness of existing or new lenders to assume the increase.
on february 17, 2011, aSG and TBmC, the sole domestic subsidiary of aSG, became borrowers under the Credit agreement. in conjunction with the sale of TBmC on october 25, 2011, TBmC ceased to be a borrower under the Credit agreement. See note 2 to the consolidated financial statements for further information on the acquisition of aSG and the subsequent sale of TBmC.
Borrowing availability under the Credit agreement is limited to the lesser of the total commitments and the borrowing base, which is based on stated percentages of the sum of eligible accounts receivable and inventory, as defined, less applicable reserves. Under the Credit agreement, the Loan parties’ obligations are secured by a first-priority security interest in all accounts receivable, inventory and certain other collateral.

36 2012 Brown Shoe Company, inC. form 10-k
interest on borrowings is at variable rates based on the London inter-Bank offered rate (“LiBor”) or the prime rate, as defined in the Credit agreement, plus a spread. The interest rate and fees for letters of credit vary based upon the level of excess availability under the Credit agreement. There is an unused line fee payable on the unused portion under the facility and a letter of credit fee payable on the outstanding face amount under letters of credit. The Credit agreement limits the Company’s ability to incur additional indebtedness, create liens, make investments or specified payments, give guarantees, pay dividends, make capital expenditures and merge or acquire or sell assets. in addition, certain additional covenants would be triggered if excess availability were to fall below specified levels, including fixed charge coverage ratio requirements. furthermore, if excess availability falls below the greater of (i) 15.0% of the lesser of (x) the borrowing base or (y) the total commitments and (ii) $35.0 million for three consecutive business days, or an event of default occurs, the lenders may assume dominion and control over the Company’s cash (a “cash dominion event”) until such event of default is cured or waived or the excess availability exceeds such amount for 30 consecutive days. The Credit agreement contains customary events of default, including, without limitation, payment defaults, breaches of representations and warranties, covenant defaults, cross-defaults to other material indebtedness, certain events of bankruptcy and insolvency, judgment defaults in excess of a certain threshold, the failure of any guaranty or security document supporting the agreement to be in full force and effect and a change of control event. in addition, if the excess availability falls below the greater of (i) 12.5% of the lesser of (x) the borrowing base or (y) the total commitments and (ii) $35.0 million, and the fixed charge coverage ratio is less than 1.0 to 1.0, we would be in default under the Credit agreement. The Credit agreement also contains certain other covenants and restrictions. we were in compliance with all covenants and restrictions under the Credit agreement as of february 2, 2013.
at february 2, 2013, we had $105.0 million in borrowings outstanding and $9.0 million in letters of credit outstanding under the Credit agreement. Total additional borrowing availability was $380.6 million at february 2, 2013.
$200 Million Senior Notes Due 2019on may 11, 2011, we closed on an offering (the “offering”) of $200.0 million aggregate principal amount of 7.125% Senior notes due 2019 (the “2019 Senior notes”). we used a portion of the net proceeds to call and redeem our outstanding 8.75% senior notes due in 2012 (the “2012 Senior notes”). we used the remaining net proceeds for general corporate purposes, including repaying amounts outstanding under the Credit agreement.
The 2019 Senior notes are guaranteed on a senior unsecured basis by each of our subsidiaries that is an obligor under the Credit agreement. interest on the 2019 Senior notes is payable on may 15 and november 15 of each year beginning on november 15, 2011. The 2019 Senior notes mature on may 15, 2019. prior to may 15, 2014, we may redeem some or all of the 2019 Senior notes at a redemption price equal to the sum of the principal amount of the 2019 Senior notes to be redeemed, plus accrued and unpaid interest, plus a “make whole” premium. after may 15, 2014, we may redeem all or a part of the 2019 Senior notes at the redemption prices (expressed as a percentage of principal) set forth below plus accrued and unpaid interest, if redeemed during the 12-month period beginning on may 15 of the years indicated below:
year percentage
2014 . . . . . . . . . . . . . . . . . . . . . . . . . . . . . . . . . . . . . . . 105.344%2015 . . . . . . . . . . . . . . . . . . . . . . . . . . . . . . . . . . . . . . . 103.563%2016 . . . . . . . . . . . . . . . . . . . . . . . . . . . . . . . . . . . . . . . 101.781%2017 and thereafter. . . . . . . . . . . . . . . . . . . . . . . . . . . . . . . 100.000%
in addition, prior to may 15, 2014, we may redeem up to 35% of the 2019 Senior notes with the proceeds from certain equity offerings at a redemption price of 107.125% of the principal amount of the 2019 Senior notes to be redeemed, plus accrued and unpaid interest thereon, if any, to the redemption date.
The 2019 Senior notes also contain certain other covenants and restrictions that limit certain activities including, among other things, levels of indebtedness, payments of dividends, the guarantee or pledge of assets, certain investments, common stock repurchases, mergers and acquisitions and sales of assets. proceeds from the sale of TBmC were reinvested into our business as allowed by the 2019 Senior notes. as of february 2, 2013, we were in compliance with all covenants and restrictions relating to the 2019 Senior notes.
Loss on Early Extinguishment of DebtDuring 2011, we completed a cash tender offer for the 2012 Senior notes and called for redemption and repaid the remaining notes that were not tendered. we incurred a loss on the early extinguishment of the 2012 Senior notes prior to maturity totaling $1.0 million, of which approximately $0.6 million was non-cash.

2012 Brown Shoe Company, inC. form 10-k 37
Working Capital and Cash Flow February 2, 2013 January 28, 2012 increase (Decrease)
working capital ($ millions) (1) . . . . . . . . . . . . . . . . . $ 303.3 $290.6 $ 12.7Debt-to-capital ratio (2) . . . . . . . . . . . . . . . . . . . . . 41.6% 49.1% (7.5%) Current ratio (3) . . . . . . . . . . . . . . . . . . . . . . . . . 1.65:1 1.55:1
(1) working capital has been computed as total current assets less total current liabilities.(2) Debt-to-capital has been computed by dividing total debt by total capitalization. Total debt is defined as long-term debt
and borrowings under the Credit agreement. Total capitalization is defined as total debt and total equity.(3) The current ratio has been computed by dividing total current assets by total current liabilities.
increase (Decrease) in Cash and 2012 2011 Cash equivalents
net cash provided by operating activities . . . . . . . . . . . . . . $ 197.9 $ 48.1 $ 149.8 net cash used for investing activities. . . . . . . . . . . . . . . . . (68.7) (136.7) 68.0 net cash (used for) provided by financing activities . . . . . . . . (108.8) 9.9 (118.7)effect of exchange rate changes on cash and cash equivalents . . 0.1 (0.2) 0.3 increase (decrease) in cash and cash equivalents . . . . . . . . . . $ 20.5 $ (78.9) $ 99.4
working capital at february 2, 2013, was $303.3 million, which was $12.7 million higher than at January 28, 2012. our current ratio increased to 1.65 to 1 at february 2, 2013, from 1.55 to 1 at January 28, 2012. The increase in working capital is primarily attributable to lower borrowings under our revolving credit agreement, an increase in our cash balance and higher prepaid expenses and other current assets, partially offset by a decrease in accounts receivables, lower inventory levels and higher accounts payable. our ratio of debt-to-capital decreased to 41.6% as of february 2, 2013, compared to 49.1% at January 28, 2012, reflecting our $96.0 million decrease in total debt obligations driven by our strong cash provided by operating activities. at february 2, 2013, we had $68.2 million of cash and cash equivalents, most of which represented cash and cash equivalents of our foreign subsidiaries.
reasons for the major variances in cash provided (used) in the table above are as follows:
Cash flow from operating activities was $149.8 million higher in 2012 as compared to 2011, reflecting several factors:• A decrease in accounts receivable in 2012 as compared to an increase in 2011 due to improved customer collections;• An increase in accrued expenses and other liabilities in 2012 as compared to a decrease in 2011. Accrued expenses
increased in 2012 primarily due to incentive accruals under our cash based incentive plans, partially offset by a decrease in reserves related to our portfolio realignment initiatives. in 2011, accrued expenses declined as a result of payments under our incentive plans;
• A larger decrease in inventories during 2012 compared to a smaller decrease in 2011 primarily due to our Wholesale operations segment with better inventory management and brands that we are exiting in conjunction with our portfolio realignment initiatives; and,
• A larger increase in trade accounts payable in 2012 compared to a smaller increase in 2011 due to the timing and amount of purchases and payments to vendors.
Cash used for investing activities was lower by $68.0 million, reflecting the purchase of aSG, and subsequent sale of TBmC both of which occurred in 2011. in addition, our purchases of property and equipment were $27.9 million higher in 2012 as compared to the prior year due to investments in new and remodeled retail stores. in 2013, we expect purchases of property and equipment and capitalized software of approximately $50 million to $55 million, primarily related to new and remodeled retail stores and information technology infrastructure.
Cash used for financing activities was $118.7 million lower than last year, primarily due to lower borrowings, net of repayments, under our Credit agreement in 2012 as compared to the prior year as well as $25.5 million of common stock repurchases in 2011.
we paid dividends of $0.28 per share in each of 2012, 2011 and 2010. The 2012 dividends marked the 90th year of consecutive quarterly dividends. on march 14, 2013, the Board of Directors declared a quarterly dividend of $0.07 per share, payable april 1, 2013, to shareholders of record on march 25, 2013, marking the 361st consecutive quarterly dividend to be paid by the Company. The declaration and payment of any future dividend is at the discretion of the Board of Directors and will depend on our results of operations, financial condition, business conditions and other factors deemed relevant by our Board of Directors; however, we presently expect that dividends will continue to be paid.

38 2012 Brown Shoe Company, inC. form 10-k
CRITICAL ACCOUNTING pOLICIES AND ESTIMATES
Certain accounting issues require management estimates and judgments for the preparation of financial statements. our most significant policies requiring the use of estimates and judgments are listed below.
Revenue Recognitionretail sales, recognized at the point of sale, are recorded net of returns and exclude sales tax. wholesale sales and sales through our internet sites are recorded, net of returns, allowances and discounts, when the merchandise has been shipped and title and risk of loss have passed to the customer. retail items sold through our internet sites are made pursuant to a sales agreement that provides for transfer of both title and risk of loss upon our delivery to the carrier. reserves for projected merchandise returns, discounts and allowances are carried based on historical experience and current expectations. revenue is recognized on license fees related to our owned brand-names, where we are the licensor, when the related sales of the licensee are made.
Gift Cardswe sell gift cards to our consumers in our retail stores and through our internet sites. our gift cards do not have expiration dates or inactivity fees. we recognize revenue from gift cards when (i) the gift card is redeemed by the consumer, or (ii) the likelihood of the gift card being redeemed by the consumer is remote (“gift card breakage”), and we determine that we do not have a legal obligation to remit the value of unredeemed gift cards to the relevant jurisdictions. we determine our gift card breakage rate based upon historical redemption patterns. we recognize gift card breakage during the 24-month period following the sale of the gift card, according to our historical redemption pattern. Gift card breakage income is included in net sales in the consolidated statements of earnings and the liability established upon the sale of a gift card is included in other accrued expenses within the consolidated balance sheets. we recognized $0.5 million, $0.6 million and $0.6 million of gift card breakage in 2012, 2011 and 2010, respectively.
Inventoriesinventories are our most significant asset, representing approximately 46% of total assets at the end of 2012. we value inventories at the lower of cost or market with 86% of consolidated inventories using the last-in, first-out (“Lifo”) method. an actual valuation of inventory under the Lifo method can be made only at the end of each year based on the inventory levels and costs at that time. accordingly, interim Lifo calculations are based on management’s estimates of expected year-end inventory levels and costs and are subject to the final year-end Lifo inventory valuation.
we apply judgment in valuing our inventories by assessing the net realizable value of our inventories based on current selling prices. at our famous footwear segment, we recognize markdowns when it becomes evident that inventory items will be sold at retail prices less than cost, plus the cost to sell the product. This policy causes gross profit rate at famous footwear to be lower than the initial markup during periods when permanent price reductions are taken to clear product. at our other divisions, we generally provide markdown reserves to reduce the carrying values of inventories to a level where, upon sale of the product, we will realize our normal gross profit rate. we believe these policies reflect the difference in operating models between famous footwear and our other segments. famous footwear periodically runs promotional events to drive sales to clear seasonal inventories. The other segments rely on permanent price reductions to clear slower-moving inventory.
we physically count all merchandise inventory on hand at least annually and adjust the recorded balance to reflect the results of the physical counts. we record estimated shrinkage between physical inventory counts based on historical results. inventory shrinkage is included as a component of cost of goods sold.
Income Taxeswe record deferred taxes for the effects of timing differences between financial and tax reporting. These differences relate principally to employee benefit plans, accrued expenses, bad debt reserves, depreciation and amortization and inventory.
we evaluate our foreign investment opportunities and plans, as well as our foreign working capital needs, to determine the level of investment required and, accordingly, determine the level of foreign earnings that we consider indefinitely reinvested. Based upon that evaluation, earnings of our foreign subsidiaries that are not otherwise subject to United States taxation, except for our Canadian subsidiary, are considered to be indefinitely reinvested, and accordingly, deferred taxes have not been provided. if changes occur in future investment opportunities and plans, those changes will be reflected when known and may result in providing residual United States deferred taxes on unremitted foreign earnings.
at february 2, 2013, we have net operating loss carryforwards at certain of our subsidiaries. we evaluate these carryforwards for realization based upon their expiration dates and our expectations of future taxable income. as deemed appropriate, valuation reserves are recorded to adjust the recorded value of these carryforwards to the expected realizable value.

2012 Brown Shoe Company, inC. form 10-k 39
we are audited periodically by domestic and foreign tax authorities and tax assessments may arise several years after tax returns have been filed. Tax liabilities are recorded when, in management’s judgment, a tax position does not meet the more-likely-than-not threshold for recognition. for tax positions that meet the more-likely-than-not threshold, a tax liability may be recorded depending on management’s assessment of how the tax position will ultimately be settled. in evaluating issues raised in such audits and other uncertain tax positions, we provide reserves for exposures as appropriate.
Goodwill and Intangible AssetsGoodwill and intangible assets deemed to have indefinite lives are not amortized but are subject to annual impairment tests. we adopted the provisions of accounting Standards Codification (“aSC”), Intangibles-Goodwill and Other (ASC Topic 350) Testing Goodwill for Impairment, which permits, but does not require, a company to qualitatively assess indicators of a reporting unit’s fair value when it is unlikely that a reporting unit is impaired. if, after completing the qualitative assessment, a company believes it is likely that a reporting unit is impaired, a discounted cash flow analysis is prepared to estimate fair value. if the recorded values of these assets are not recoverable, based on either the assessment screen or discounted cash flow analysis, management performs the next step, which compares the fair value of the reporting unit to the recorded value of the tangible and intangible assets of the reporting units. Goodwill is considered impaired if the fair value of the tangible and intangible assets exceeds the fair value of the reporting unit.
for 2012, we reviewed goodwill for impairment utilizing a discounted cash flow analysis. a fair-value-based test is applied at the reporting unit level, which is generally at or one level below the operating segment level. The test compares the fair value of our reporting units to the carrying value of those reporting units. This test requires significant assumptions, estimates and judgments by management, and is subject to inherent uncertainties and subjectivity. The fair value of goodwill is determined using an estimate of future cash flows of the reporting unit and a risk-adjusted discount rate to compute a net present value of future cash flows. projected net sales, gross profit, selling and administrative expense, capital expenditures, depreciation, amortization and working capital requirements are based on our internal projections. Discount rates reflect market-based estimates of the risks associated with the projected cash flows of the reporting unit directly resulting from the use of its assets in its operations. we also considered assumptions that market participants may use. Both the estimates of the fair value of our reporting units and the allocation of the estimated fair value of the reporting units are based on the best information available to us as of the date of the assessment.
an adjustment to goodwill will be recorded for any goodwill that is determined to be impaired. impairment of goodwill is measured as the excess of the carrying amount of goodwill over the fair values of recognized assets and liabilities of the reporting unit. we perform impairment tests during the fourth quarter of each fiscal year unless events indicate an interim test is required. The goodwill impairment test performed as of the first day of our fourth fiscal quarter resulted in no impairment charges. Based on the results of our most recent impairment test, the fair value of a reporting unit exceeded its carrying value by less than 20%. as of february 2, 2013, the goodwill allocated to this reporting unit was $39.6 million.
During 2012, we terminated the etienne aigner license agreement, due to a dispute with the licensor and recognized an impairment charge of $5.8 million, to reduce the remaining unamortized value of the licensed trademark intangible asset to zero. other intangible assets are amortized over their useful lives and are reviewed for impairment if and when impairment indicators are present. See note 9 to the consolidated financial statements for additional information related to the impairment of goodwill and intangible assets.
Self-Insurancewe are self-insured and/or retain high deductibles for a significant portion of our workers’ compensation, employment practices, health, disability, cyber risk, general liability, automobile and property programs, among others. we purchase varying levels of insurance for losses in excess of our deductibles or self-insured retentions for these categories of loss. at february 2, 2013 and January 28, 2012, self-insurance reserves were $12.3 million and $11.5 million, respectively. we utilize (i) estimates from third-party actuaries and claims adjusters, (ii) statistical analyses of historical data for our industry and our Company and (iii) our own estimates to determine required self-insurance reserves. our reserves and assumptions are reviewed, monitored and adjusted when warranted by changing circumstances. actual experience may vary from estimates and result in adjustments to our self-insurance liabilities.
Store Closing and Impairment Chargeswe regularly analyze the results of all of our stores and assess the viability of underperforming stores to determine whether events or circumstances exist that indicate the stores should be closed or whether the carrying amount of their long-lived assets may not be recoverable. after allowing for an appropriate start-up period, unusual nonrecurring events or favorable trends, we write down to fair value the fixed assets of stores indicated as impaired.
Litigation Contingencieswe are the defendant in several claims and lawsuits arising in the ordinary course of business. we do not believe any of these ordinary- course-of-business proceedings will have a material adverse effect on our consolidated financial position or results of operations. we accrue our best estimate of the cost of resolution of these claims. Legal defense costs of such claims are recognized in the period in which we incur the costs. See note 17 to the consolidated financial statements for a further description of commitments and contingencies.

40 2012 Brown Shoe Company, inC. form 10-k
Environmental Matterswe are involved in environmental remediation and ongoing compliance activities at several sites. we are remediating, under the oversight of Colorado authorities, the groundwater and indoor air at our redfield site and residential neighborhoods adjacent to and near the property, which have been affected by solvents previously used at the facility. in addition, various federal and state authorities have identified us as a potentially responsible party for remediation at certain landfills. while we currently do not operate manufacturing facilities in the United States, prior operations included numerous manufacturing and other facilities for which we may have responsibility under various environmental laws to address conditions that may be identified in the future. See note 17 to the consolidated financial statements for a further description of specific properties.
environmental expenditures relating to an existing condition caused by past operations and that do not contribute to current or future revenue generation are expensed. Liabilities are recorded when environmental assessments and/or remedial efforts are probable and the costs can be reasonably estimated and are evaluated independently of any future claims recovery. Generally, the timing of these accruals coincides with completion of a feasibility study or our commitment to a formal plan of action, and our estimates of cost are subject to change as new information becomes available. Costs of future expenditures for environmental remediation obligations are discounted to their present value in those situations requiring only continuing maintenance and monitoring based upon a schedule of fixed payments.
business Combination Accountingwe allocate the purchase price of an acquired entity to the assets and liabilities acquired based upon their estimated fair values at the business combination date. we also identify and estimate the fair values of intangible assets that should be recognized as assets apart from goodwill. a single estimate of fair value results from a complex series of judgments about future events and uncertainties and relies heavily on estimates and assumptions. we have historically relied in part upon the use of reports from third-party valuation specialists to assist in the estimation of fair values for intangible assets other than goodwill. The carrying values of acquired receivables and trade accounts payable have historically approximated their fair values at the business combination date. with respect to other acquired assets and liabilities, we use all available information to make our best estimates of their fair values at the business combination date.
our purchase price allocation methodology contains uncertainties because it requires management to make assumptions and to apply judgment to estimate the fair value of acquired assets and liabilities. management estimates the fair value of assets and liabilities based upon quoted market prices, the carrying value of the acquired assets and widely accepted valuation techniques, including discounted cash flows. Unanticipated events or circumstances may occur which could affect the accuracy of our fair value estimates, including assumptions regarding industry economic factors and business strategies.
Share-based Compensationwe account for share-based compensation in accordance with aSC 718, Compensation – Stock Compensation, and aSC 505, Equity, which require all share-based payments to employees, including grants of employee stock options, to be recognized in the consolidated financial statements based on their fair values. The fair value of stock options is calculated by using the Black-Scholes option pricing formula that requires estimates for expected volatility, expected dividends, the risk-free interest rate and the term of the option. Stock options generally vest over four years, with 25% vesting annually, and expense is recognized on a straight-line basis separately for each vesting portion of the stock option award. expense for stock performance awards is recognized based upon the fair value of the awards on the date of grant and the anticipated number of shares or units to be awarded on a straight-line basis over the three-year service period. if any of the assumptions used in the Black-Scholes model or the anticipated number of shares to be awarded change significantly, share-based compensation expense may differ materially in the future from that recorded in the current period. See additional information related to share-based compensation in note 15 to the consolidated financial statements.
Retirement and Other benefit planswe sponsor pension plans in both the United States and Canada. our domestic pension plans cover substantially all United States employees, and our Canadian pension plans cover certain employees based on plan specifications. in addition, we maintain an unfunded Supplemental executive retirement plan (“Serp”) and sponsor unfunded defined benefit postretirement life insurance plans that cover both salaried and hourly employees who had become eligible for benefits by January 1, 1995.
we determine our expense and obligations for retirement and other benefit plans based on assumptions related to discount rates, expected long-term rates of return on invested plan assets, expected salary increases and certain employee-related factors, such as turnover, retirement age and mortality among others. our assumptions reflect our historical experiences and our best judgment regarding future expectations. additional information related to our assumptions is as follows:
• Expected long-term rate of return – The expected long-term rate of return on plan assets is based on historical and projected rates of return for current and planned asset classes in the plan’s investment portfolio. assumed projected rates of return for each asset class were selected after analyzing experience and future expectations of the returns. The overall expected rate of return for the portfolio was developed based on the target allocation for each asset class. The weighted-average expected rate of return on plan assets used to determine our pension expense for 2012 was 8.25%.

2012 Brown Shoe Company, inC. form 10-k 41
a decrease of 50 basis points in the weighted-average expected rate of return on plan assets would impact pension expense by approximately $1.5 million. The actual return on plan assets in a given year may differ from the expected long-term rate of return, and the resulting gain or loss is deferred and recognized into the plans’ expense over time.
• Discount rate – Discount rates used to measure the present value of our benefit obligations for our pension and other postretirement benefit plans are based on a yield curve constructed from a subset of high-quality bonds for which the timing and amount of cash outflows approximate the estimated payouts of the plans. The weighted-average discount rate selected to measure the present value of our benefit obligations under our pension and other postretirement benefit plans was 4.5% for each. a decrease of 50 basis points in the weighted-average discount rate would have increased the projected benefit obligation of the pension and other postretirement benefit plans by approximately $24.8 million and $0.1 million, respectively.
See note 5 to the consolidated financial statements for additional information related to our retirement and other benefit plans.
Impact of prospective Accounting pronouncementsrecent accounting pronouncements and their impact on the Company are described in note 1 to the consolidated financial statements.
OFF-bALANCE SHEET ARRANGEMENTS
at february 2, 2013, we were contingently liable for remaining lease commitments of approximately $0.2 million in the aggregate, which relate to former retail locations that we exited in prior years. These obligations will continue to decline over the next few years as leases expire. in order for us to incur any liability related to these lease commitments, the current lessees would have to default.
CONTRACTUAL ObLIGATIONS
The table below sets forth our significant future obligations by time period. further information on certain of these commitments is provided in the notes to our consolidated financial statements, which are cross-referenced in this table. our obligations outstanding as of february 2, 2013, include the following:
payments Due by period
Less Than 1-3 3-5 more Than ($ millions) Total 1 year years years 5 years
Borrowings under Credit agreement(1) . . . . . . . . . . . . . . . . . . . . . . . $ 105.0 $ 105.0 $ – $ – $ –Long-term debt(2) . . . . . . . . . . . . . . . . . . . . . . . . . . . . . . . . . . . 200.0 – – – 200.0interest on long-term debt(2) . . . . . . . . . . . . . . . . . . . . . . . . . . . . 92.6 14.2 28.5 28.5 21 .4operating lease commitments(3) . . . . . . . . . . . . . . . . . . . . . . . . . . 654.5 150.2 233.8 136.8 133.7minimum license commitments . . . . . . . . . . . . . . . . . . . . . . . . . . . 15.5 8.2 7.3 – –purchase obligations(4) . . . . . . . . . . . . . . . . . . . . . . . . . . . . . . . . 674.5 666.5 7.6 0.4 –obligations related to restructuring initiatives(5). . . . . . . . . . . . . . . . . . 2.7 2.7 – – –other(6) . . . . . . . . . . . . . . . . . . . . . . . . . . . . . . . . . . . . . . . . 11.4 1 .5 3.2 3.6 3.1 Total(7) (8) . . . . . . . . . . . . . . . . . . . . . . . . . . . . . . . . . . . . . . . . $ 1,756.2 $ 948.3 $ 280.4 $ 169.3 $ 358.2
(1) interest on borrowings is at variable rates based on LiBor or the prime rate, as defined in the Credit agreement, plus a spread. The interest rate and fees for letters of credit varies based upon the level of excess availability under the Credit agreement. There is an unused line fee payable on the excess availability under the facility and a letter of credit fee payable on the outstanding exposure under letters of credit. interest obligations, which are variable in nature, are not included in the table above. See note 10 to the consolidated financial statements.
(2) interest obligations in future periods have been reflected based on our $200.0 million principal value of Senior notes and a fixed interest rate of 7.125% as of fiscal year ended february 2, 2013. See note 10 to the consolidated financial statements.
(3) a majority of our retail operating leases contain provisions that allow us to modify amounts payable under the lease or terminate the lease in certain circumstances, such as experiencing actual sales volume below a defined threshold and/or co-tenancy provisions associated with the facility. The contractual obligations presented in the table above reflect the total lease obligation, irrespective of our ability to reduce or terminate rental payments in the future, as noted. See note 11 to the consolidated financial statements.
(4) purchase obligations include agreements to purchase goods or services that specify all significant terms, including quantity and price provisions.
(5) See note 4 to the consolidated financial statements for further information related to these obligations.
(6) includes obligations for our supplemental executive retirement plan and other postretirement benefits. See note 5 to the consolidated financial statements.
(7) excludes liabilities of $1.1 million, established pursuant to the provisions of aSC 740, income Taxes, due to their uncertain nature in timing of payments. See note 6 to the consolidated financial statements.
(8) excludes liabilities of $1.4 million, $1.1 million and $4.7 million for our non-qualified deferred compensation plan, deferred compensation plan for non-employee directors and restricted stock units for non-employee directors, respectively, due to the uncertain nature in timing of payments. See note 5 and note 15 to the consolidated financial statements.

42 2012 Brown Shoe Company, inC. form 10-k
SAFE HARbOR STATEMENT UNDER THE pRIVATE SECURITIES LITIGATION REFORM ACT OF 1995 AND FORWARD-LOOKING STATEMENTS
This Management’s Discussion and Analysis of Financial Condition and Results of Operations contains forward-looking statements within the meaning of the private Securities Litigation reform act of 1995. actual results could differ materially from those projected as they are subject to various risks and uncertainties. These risks and uncertainties include, without limitation, the risks detailed in item 1a, Risk Factors, and those described in other documents and reports filed from time to time with the SeC, press releases and other communications. we do not undertake any obligation or plan to update these forward-looking statements, even though our situation may change.
ITEM 7A QUANTITATIVE AND QUALITATIVE DISCLOSURES AbOUT MARKET RISK
FOREIGN CURRENCy EXCHANGE RATES
The market risk inherent in our financial instruments and positions represents the potential loss arising from adverse changes in foreign currency exchange rates and interest rates. To address these risks, we enter into various hedging transactions to the extent described below. all decisions on hedging transactions are authorized and executed pursuant to our policies and procedures, which do not allow the use of financial instruments for trading purposes. we also are exposed to credit-related losses in the event of nonperformance by counterparties to these financial instruments. Counterparties to these agreements, however, are major international financial institutions, and we believe the risk of loss due to nonperformance is minimal.
a description of our accounting policies for derivative financial instruments is included in notes 1 and 12 to the consolidated financial statements.
in addition, we are exposed to translation risk because certain of our foreign operations utilize the local currency as their functional currency and those financial results must be translated into United States dollars. as currency exchange rates fluctuate, translation of our financial statements of foreign businesses into United States dollars affects the comparability of financial results between years.
INTEREST RATES
our financing arrangements include $105.0 million of outstanding variable rate debt under the Credit agreement at february 2, 2013. we also have $200.0 million in principal value of Senior notes, which bear interest at a fixed rate of 7.125%. Changes in interest rates impact fixed and variable rate debt differently. for fixed rate debt, a change in interest rates will only impact the fair value of the debt, whereas a change in the interest rates on variable rate debt will impact interest expense and cash flows.
at february 2, 2013, the fair value of our long-term debt is estimated at approximately $208.0 million based upon the pricing of our Senior notes at that time. market risk is viewed as the potential change in fair value of our debt resulting from a hypothetical 10% adverse change in interest rates and would be $6.5 million for our long-term debt at february 2, 2013.
information appearing under the caption Risk Management and Derivatives in note 12 and Fair Value Measurements in note 13 to the consolidated financial statements is incorporated herein by reference.
ITEM 8 FINANCIAL STATEMENTS AND SUppLEMENTARy DATA
Management’s Report on Internal Control Over Financial Reportingour management is responsible for establishing and maintaining adequate internal control over financial reporting as such term is defined in exchange act rules 13a-15(f) and 15d-15(f). Under the supervision and with the participation of our management, including our principal executive officer and principal financial officer, we conducted an evaluation of the effectiveness of our internal control over financial reporting based on the framework in Internal Control — Integrated Framework issued by the Committee of Sponsoring organizations of the Treadway Commission. Based on our evaluation, our principal executive officer and principal financial officer have concluded that the Company’s internal control over financial reporting was effective as of february 2, 2013. The effectiveness of our internal control over financial reporting as of february 2, 2013, has been audited by ernst & young LLp, an independent registered public accounting firm, as stated in its report which is included herein.

2012 Brown Shoe Company, inC. form 10-k 43
Report of Independent Registered public Accounting Firm
The Board of Directors and ShareholdersBrown Shoe Company, inc.
we have audited Brown Shoe Company, inc.’s (the Company’s) internal control over financial reporting as of february 2, 2013, based on criteria established in Internal Control – Integrated Framework issued by the Committee of Sponsoring organizations of the Treadway Commission (the CoSo criteria). The Company’s management is responsible for maintaining effective internal control over financial reporting and for its assessment of the effectiveness of internal control over financial reporting included in the accompanying management’s report on internal Control over financial reporting. our responsibility is to express an opinion on the Company’s internal control over financial reporting based on our audit.
we conducted our audit in accordance with the standards of the public Company accounting oversight Board (United States). Those standards require that we plan and perform the audit to obtain reasonable assurance about whether effective internal control over financial reporting was maintained in all material respects. our audit included obtaining an understanding of internal control over financial reporting, assessing the risk that a material weakness exists, testing and evaluating the design and operating effectiveness of internal control based on the assessed risk, and performing such other procedures as we considered necessary in the circumstances. we believe that our audit provides a reasonable basis for our opinion.
a company’s internal control over financial reporting is a process designed to provide reasonable assurance regarding the reliability of financial reporting and the preparation of financial statements for external purposes in accordance with generally accepted accounting principles. a company’s internal control over financial reporting includes those policies and procedures that (1) pertain to the maintenance of records that, in reasonable detail, accurately and fairly reflect the transactions and dispositions of the assets of the company; (2) provide reasonable assurance that transactions are recorded as necessary to permit preparation of financial statements in accordance with generally accepted accounting principles and that receipts and expenditures of the company are being made only in accordance with authorizations of management and directors of the company; and (3) provide reasonable assurance regarding prevention or timely detection of unauthorized acquisition, use, or disposition of the company’s assets that could have a material effect on the financial statements.
Because of its inherent limitations, internal control over financial reporting may not prevent or detect misstatements. also, projections of any evaluation of effectiveness to future periods are subject to the risk that controls may become inadequate because of changes in conditions or that the degree of compliance with the policies or procedures may deteriorate.
in our opinion, Brown Shoe Company, inc., maintained, in all material respects, effective internal control over financial reporting as of february 2, 2013, based on the CoSo criteria.
we also have audited, in accordance with the standards of the public Company accounting oversight Board (United States), the consolidated balance sheets of Brown Shoe Company, inc. as of february 2, 2013 and January 28, 2012, and the related consolidated statements of earnings, comprehensive income, cash flows and shareholders’ equity for each of the three years in the period ended february 2, 2013, and our report dated april 2, 2013, expressed an unqualified opinion thereon.
St. Louis, missouriapril 2, 2013

44 2012 Brown Shoe Company, inC. form 10-k
Report of Independent Registered public Accounting Firm
The Board of Directors and Shareholders Brown Shoe Company, inc.
we have audited the accompanying consolidated balance sheets of Brown Shoe Company, inc. (the Company) as of february 2, 2013 and January 28, 2012, and the related consolidated statements of earnings, comprehensive income, cash flows and shareholders’ equity for each of the three years in the period ended february 2, 2013. our audits also included the financial statement schedule listed in the index at item 15(a). These financial statements and schedule are the responsibility of the Company’s management. our responsibility is to express an opinion on these financial statements and schedule based on our audits.
we conducted our audits in accordance with the standards of the public Company accounting oversight Board (United States). Those standards require that we plan and perform the audit to obtain reasonable assurance about whether the financial statements are free of material misstatement. an audit includes examining, on a test basis, evidence supporting the amounts and disclosures in the financial statements. an audit also includes assessing the accounting principles used and significant estimates made by management, as well as evaluating the overall financial statement presentation. we believe that our audits provide a reasonable basis for our opinion.
in our opinion, the financial statements referred to above present fairly, in all material respects, the consolidated financial position of Brown Shoe Company, inc. at february 2, 2013 and January 28, 2012, and the consolidated results of its operations and its cash flows for each of the three years in the period ended february 2, 2013, in conformity with U.S. generally accepted accounting principles. also, in our opinion, the related financial statement schedule, when considered in relation to the basic financial statements taken as a whole, presents fairly, in all material respects, the information set forth therein.
we also have audited, in accordance with the standards of the public Company accounting oversight Board (United States), Brown Shoe Company, inc.’s internal control over financial reporting as of february 2, 2013, based on criteria established in Internal Control – Integrated Framework issued by the Committee of Sponsoring organizations of the Treadway Commission, and our report dated april 2, 2013, expressed an unqualified opinion thereon.
St. Louis, missouriapril 2, 2013

2012 Brown Shoe Company, inC. form 10-k 45
Consolidated balance Sheets
($ thousands, except number of shares and per share amounts) February 2, 2013 January 28, 2012
ASSETSCurrent assets: Cash and cash equivalents . . . . . . . . . . . . . . . . . . . . . . . . . . . . . . . . . . . . . . . . . . . . . . $ 68,223 $ 47,682 receivables, net of allowances of $23,397 in 2012 and $25,851 in 2011 . . . . . . . . . . . . . . . . . . . . . . 125,683 154,022 inventories, net of adjustment to last-in, first-out cost of $4,395 in 2012 and $5,006 in 2011 . . . . . . . . . 533,275 561,797 Deferred income taxes . . . . . . . . . . . . . . . . . . . . . . . . . . . . . . . . . . . . . . . . . . . . . . . . – 14,432 income taxes . . . . . . . . . . . . . . . . . . . . . . . . . . . . . . . . . . . . . . . . . . . . . . . . . . . . . . 3,069 5,145 prepaid expenses and other current assets . . . . . . . . . . . . . . . . . . . . . . . . . . . . . . . . . . . . . 42,178 32,060 Total current assets. . . . . . . . . . . . . . . . . . . . . . . . . . . . . . . . . . . . . . . . . . . . . . . . . . . . . 772,428 815,138 prepaid pension costs . . . . . . . . . . . . . . . . . . . . . . . . . . . . . . . . . . . . . . . . . . . . . . . . . 54,532 68,054 property and equipment, net . . . . . . . . . . . . . . . . . . . . . . . . . . . . . . . . . . . . . . . . . . . . . 146,089 131,471 Deferred income taxes . . . . . . . . . . . . . . . . . . . . . . . . . . . . . . . . . . . . . . . . . . . . . . . . 1,461 – Goodwill . . . . . . . . . . . . . . . . . . . . . . . . . . . . . . . . . . . . . . . . . . . . . . . . . . . . . . . . 39,604 39,604 intangible assets, net . . . . . . . . . . . . . . . . . . . . . . . . . . . . . . . . . . . . . . . . . . . . . . . . . 93,024 100,986 other assets . . . . . . . . . . . . . . . . . . . . . . . . . . . . . . . . . . . . . . . . . . . . . . . . . . . . . . 64,121 72,223 Total assets . . . . . . . . . . . . . . . . . . . . . . . . . . . . . . . . . . . . . . . . . . . . . . . . . . . . . . . . . $ 1,171,259 $ 1,227,476
LIAbILITIES AND EQUITyCurrent liabilities: Borrowings under revolving credit agreement . . . . . . . . . . . . . . . . . . . . . . . . . . . . . . . . . . . $ 105,000 $ 201,000 Trade accounts payable . . . . . . . . . . . . . . . . . . . . . . . . . . . . . . . . . . . . . . . . . . . . . . . . 222,742 190,611 employee compensation and benefits . . . . . . . . . . . . . . . . . . . . . . . . . . . . . . . . . . . . . . . . 50,552 45,514 Deferred income taxes . . . . . . . . . . . . . . . . . . . . . . . . . . . . . . . . . . . . . . . . . . . . . . . . 748 – other accrued expenses . . . . . . . . . . . . . . . . . . . . . . . . . . . . . . . . . . . . . . . . . . . . . . . 90,067 87,455 Total current liabilities . . . . . . . . . . . . . . . . . . . . . . . . . . . . . . . . . . . . . . . . . . . . . . . . . . . 469,109 524,580 other liabilities: Long-term debt . . . . . . . . . . . . . . . . . . . . . . . . . . . . . . . . . . . . . . . . . . . . . . . . . . . . 198,823 198,633 Deferred rent . . . . . . . . . . . . . . . . . . . . . . . . . . . . . . . . . . . . . . . . . . . . . . . . . . . . . . 33,711 32,361 Deferred income taxes . . . . . . . . . . . . . . . . . . . . . . . . . . . . . . . . . . . . . . . . . . . . . . . . 13,862 31,136 other liabilities . . . . . . . . . . . . . . . . . . . . . . . . . . . . . . . . . . . . . . . . . . . . . . . . . . . . . 29,853 27,050 Total other liabilities . . . . . . . . . . . . . . . . . . . . . . . . . . . . . . . . . . . . . . . . . . . . . . . . . . . . 276,249 289,180 equity: preferred stock, $1.00 par value, 1,000,000 shares authorized; no shares outstanding . . . . . . . . . . . . – – Common stock, $0.01 par value, 100,000,000 shares authorized; 42,896,363 and 41,970,687 shares outstanding, net of 3,190,432 and 4,116,108 treasury shares in 2012 and 2011, respectively . . . . . . . . 429 420 additional paid-in capital . . . . . . . . . . . . . . . . . . . . . . . . . . . . . . . . . . . . . . . . . . . . . . . 121,593 1 15,869 accumulated other comprehensive income . . . . . . . . . . . . . . . . . . . . . . . . . . . . . . . . . . . . . 884 9,637 retained earnings . . . . . . . . . . . . . . . . . . . . . . . . . . . . . . . . . . . . . . . . . . . . . . . . . . . 302,223 286,743 Total Brown Shoe Company, inc. shareholders’ equity. . . . . . . . . . . . . . . . . . . . . . . . . . . . . 425,129 412,669 noncontrolling interests. . . . . . . . . . . . . . . . . . . . . . . . . . . . . . . . . . . . . . . . . . . . . . . . 772 1,047 Total equity . . . . . . . . . . . . . . . . . . . . . . . . . . . . . . . . . . . . . . . . . . . . . . . . . . . . . . . . . 425,901 413,716 Total liabilities and equity . . . . . . . . . . . . . . . . . . . . . . . . . . . . . . . . . . . . . . . . . . . . . . . . . $ 1,171,259 $ 1,227,476
See notes to consolidated financial statements.

46 2012 Brown Shoe Company, inC. form 10-k
Consolidated Statements of Earnings
($ thousands, except per share amounts) 2012 2011 2010
net sales. . . . . . . . . . . . . . . . . . . . . . . . . . . . . . . . . . . . . . . . . . . . . . . . . $ 2,598,065 $ 2,582,824 $ 2,504,091 Cost of goods sold . . . . . . . . . . . . . . . . . . . . . . . . . . . . . . . . . . . . . . . . . . . 1,587,706 1,586,184 1,500,537 Gross profit . . . . . . . . . . . . . . . . . . . . . . . . . . . . . . . . . . . . . . . . . . . . . . . 1,010,359 996,640 1,003,554 Selling and administrative expenses . . . . . . . . . . . . . . . . . . . . . . . . . . . . . . . . . 918,957 937,419 922,976 restructuring and other special charges, net . . . . . . . . . . . . . . . . . . . . . . . . . . . . 24,018 23,671 7,914 impairment of intangible assets. . . . . . . . . . . . . . . . . . . . . . . . . . . . . . . . . . . . 5,777 – – operating earnings . . . . . . . . . . . . . . . . . . . . . . . . . . . . . . . . . . . . . . . . . . . 61,607 35,550 72,664 interest expense . . . . . . . . . . . . . . . . . . . . . . . . . . . . . . . . . . . . . . . . . . . . (23,382) (26,141) (19,647)Loss on early extinguishment of debt . . . . . . . . . . . . . . . . . . . . . . . . . . . . . . . . – (1,003) –interest income . . . . . . . . . . . . . . . . . . . . . . . . . . . . . . . . . . . . . . . . . . . . . 322 644 203 earnings before income taxes from continuing operations. . . . . . . . . . . . . . . . . . . . . 38,547 9,050 53,220 income tax provision . . . . . . . . . . . . . . . . . . . . . . . . . . . . . . . . . . . . . . . . . . (11 ,343) (326) (16,160) net earnings from continuing operations . . . . . . . . . . . . . . . . . . . . . . . . . . . . . . 27,204 8,724 37,060 Discontinued operations: earnings from operations of subsidiary, net of tax of $1,312 in 2011. . . . . . . . . . . . . . – 1,701 – Gain on sale of subsidiary, net of tax of $6,670 in 2011 . . . . . . . . . . . . . . . . . . . . . – 13,965 – net earnings from discontinued operations . . . . . . . . . . . . . . . . . . . . . . . . . . . . . – 15,666 – net earnings . . . . . . . . . . . . . . . . . . . . . . . . . . . . . . . . . . . . . . . . . . . . . . 27,204 24,390 37,060 net loss attributable to noncontrolling interests . . . . . . . . . . . . . . . . . . . . . . . . . . (287) (199) (173) net earnings attributable to Brown Shoe Company, inc. . . . . . . . . . . . . . . . . . . . . . . $ 27,491 $ 24,589 $ 37,233
Basic earnings per common share: from continuing operations . . . . . . . . . . . . . . . . . . . . . . . . . . . . . . . . . . . $ 0.64 $ 0.20 $ 0.85 from discontinued operations . . . . . . . . . . . . . . . . . . . . . . . . . . . . . . . . . . – 0.37 – Basic earnings per common share attributable to Brown Shoe Company, inc. shareholders . . . . . . . . . . . . . . . . . . . . . . . . . . . . $ 0.64 $ 0.57 $ 0.85 Diluted earnings per common share: from continuing operations . . . . . . . . . . . . . . . . . . . . . . . . . . . . . . . . . . . $ 0.64 $ 0.20 $ 0.85 from discontinued operations . . . . . . . . . . . . . . . . . . . . . . . . . . . . . . . . . . – 0.36 – Diluted earnings per common share attributable to Brown Shoe Company, inc. shareholders . . . . . . . . . . . . . . . . . . . . . . . . . . . $ 0.64 $ 0.56 $ 0.85
See notes to consolidated financial statements.

2012 Brown Shoe Company, inC. form 10-k 47
Consolidated Statements of Comprehensive Income ($ thousands) 2012 2011 2010
net earnings . . . . . . . . . . . . . . . . . . . . . . . . . . . . . . . . . . . . . . . . . . . . . . $ 27,204 $ 24,390 $ 37,060 other comprehensive income (loss) (“oCi”), net of tax: foreign currency translation adjustment . . . . . . . . . . . . . . . . . . . . . . . . . . . . 475 207 2,150 pension and other postretirement benefits adjustments, net of tax of $5,777, $1,555 and $2,197 in 2012, 2011 and 2010, respectively . . . . . . . (9,061) 2,941 3,433 Unrealized (loss) gain on derivative financial instruments, net of tax of $154, $139 and $63 in 2012, 2011 and 2010, respectively . . . . . . . . . . (402) 343 171 net loss from derivatives reclassified into earnings, net of tax of $121, $22 and $124 in 2012, 2011 and 2010, respectively . . . . . . . . . . . . . 247 44 233 other comprehensive (loss) income, net of tax . . . . . . . . . . . . . . . . . . . . . . . . . . . (8,741) 3,535 5,987 Comprehensive income . . . . . . . . . . . . . . . . . . . . . . . . . . . . . . . . . . . . . . . . 18,463 27,925 43,047 Comprehensive loss attributable to noncontrolling interest . . . . . . . . . . . . . . . . . . . . (275) (160) (150) Comprehensive income attributable to Brown Shoe Company, inc. . . . . . . . . . . . . . . . . $ 18,738 $ 28,085 $ 43,197
See notes to consolidated financial statements.

48 2012 Brown Shoe Company, inC. form 10-k
Consolidated Statements of Cash Flows ($ thousands) 2012 2011 2010
Operating Activitiesnet earnings . . . . . . . . . . . . . . . . . . . . . . . . . . . . . . . . . . . . . . . . . . . . . . $ 27,204 $ 24,390 $ 37,060 adjustments to reconcile net earnings to net cash provided by (used for) operating activities: Depreciation . . . . . . . . . . . . . . . . . . . . . . . . . . . . . . . . . . . . . . . . . . . . 34,179 37,331 33,149 amortization of capitalized software . . . . . . . . . . . . . . . . . . . . . . . . . . . . . . 13,420 13,479 10,506 amortization of intangibles . . . . . . . . . . . . . . . . . . . . . . . . . . . . . . . . . . . . 7,184 8,301 6,667 amortization of debt issuance costs . . . . . . . . . . . . . . . . . . . . . . . . . . . . . . . 2,561 2,338 2,195 Loss on early extinguishment of debt . . . . . . . . . . . . . . . . . . . . . . . . . . . . . . – 1,003 – Share-based compensation expense. . . . . . . . . . . . . . . . . . . . . . . . . . . . . . . 6,489 5,633 6,144 Tax (benefit) deficiency related to share-based plans . . . . . . . . . . . . . . . . . . . . . (944) (1,000) 87 Loss on disposal of facilities and equipment . . . . . . . . . . . . . . . . . . . . . . . . . . 3,103 1,560 1,089 impairment charges for facilities and equipment . . . . . . . . . . . . . . . . . . . . . . . . 4,132 1,871 2,762 impairment of intangible assets . . . . . . . . . . . . . . . . . . . . . . . . . . . . . . . . . 5,777 – – Deferred rent . . . . . . . . . . . . . . . . . . . . . . . . . . . . . . . . . . . . . . . . . . . . 1,350 (2,317) (4,191) Deferred income taxes (benefit) provision . . . . . . . . . . . . . . . . . . . . . . . . . . . (3,555) (112) 27,229 provision for doubtful accounts . . . . . . . . . . . . . . . . . . . . . . . . . . . . . . . . . 360 1,284 516 Gain on sale of subsidiary, net . . . . . . . . . . . . . . . . . . . . . . . . . . . . . . . . . . – (13,965) – Changes in operating assets and liabilities, net of acquired and discontinued operations: receivables . . . . . . . . . . . . . . . . . . . . . . . . . . . . . . . . . . . . . . . . . . 27,984 (26,298) (30,088) inventories . . . . . . . . . . . . . . . . . . . . . . . . . . . . . . . . . . . . . . . . . . . 28,623 3,502 (66,568) prepaid expenses and other current and noncurrent assets . . . . . . . . . . . . . . . (9,169) 2,286 (9,440) Trade accounts payable . . . . . . . . . . . . . . . . . . . . . . . . . . . . . . . . . . . 32,091 13,660 (10,754) accrued expenses and other liabilities . . . . . . . . . . . . . . . . . . . . . . . . . . . 10,436 (35,1 17) 2,668 income taxes. . . . . . . . . . . . . . . . . . . . . . . . . . . . . . . . . . . . . . . . . . 2,076 12,512 (5,993) other, net . . . . . . . . . . . . . . . . . . . . . . . . . . . . . . . . . . . . . . . . . . . . . . 4,636 (2,255) (5,350) net cash provided by (used for) operating activities . . . . . . . . . . . . . . . . . . . . . . . . 197,937 48,086 (2,312)
Investing Activitiespurchases of property and equipment . . . . . . . . . . . . . . . . . . . . . . . . . . . . . . . . (55,801) (27,857) (30,781)Capitalized software . . . . . . . . . . . . . . . . . . . . . . . . . . . . . . . . . . . . . . . . . . (7,928) (10,707) (24,046)acquisition cost. . . . . . . . . . . . . . . . . . . . . . . . . . . . . . . . . . . . . . . . . . . . . (5,000) (156,636) –Cash recognized on initial consolidation . . . . . . . . . . . . . . . . . . . . . . . . . . . . . . . – 3,121 –net proceeds from sale of subsidiary. . . . . . . . . . . . . . . . . . . . . . . . . . . . . . . . . – 55,350 – net cash used for investing activities. . . . . . . . . . . . . . . . . . . . . . . . . . . . . . . . . (68,729) (136,729) (54,827)
Financing ActivitiesBorrowings under revolving credit agreement . . . . . . . . . . . . . . . . . . . . . . . . . . . 805,000 1,595,500 1,051,500 repayments under revolving credit agreement . . . . . . . . . . . . . . . . . . . . . . . . . . . (901,000) (1,592,500) (948,000)proceeds from issuance of 2019 Senior notes . . . . . . . . . . . . . . . . . . . . . . . . . . . . – 198,633 –redemption of 2012 Senior notes . . . . . . . . . . . . . . . . . . . . . . . . . . . . . . . . . . – (150,000) –Dividends paid . . . . . . . . . . . . . . . . . . . . . . . . . . . . . . . . . . . . . . . . . . . . . (12,011) (12,076) (12,254)Debt issuance costs . . . . . . . . . . . . . . . . . . . . . . . . . . . . . . . . . . . . . . . . . . – (6,428) (2,636)acquisition of treasury stock . . . . . . . . . . . . . . . . . . . . . . . . . . . . . . . . . . . . . – (25,484) –issuance of common stock under share-based plans, net . . . . . . . . . . . . . . . . . . . . . (1,700) 918 926 Tax benefit (deficiency) related to share-based plans . . . . . . . . . . . . . . . . . . . . . . . 944 1,000 (87)Contributions by noncontrolling interest . . . . . . . . . . . . . . . . . . . . . . . . . . . . . . . – 378 527 acquisition of noncontrolling interest . . . . . . . . . . . . . . . . . . . . . . . . . . . . . . . . – – (32,692) net cash (used for) provided by financing activities . . . . . . . . . . . . . . . . . . . . . . . . (108,767) 9,941 57,284 effect of exchange rate changes on cash and cash equivalents . . . . . . . . . . . . . . . . . . 100 (164) 570 increase (decrease) in cash and cash equivalents . . . . . . . . . . . . . . . . . . . . . . . . . . 20,541 (78,866) 715 Cash and cash equivalents at beginning of year. . . . . . . . . . . . . . . . . . . . . . . . . . . 47,682 126,548 125,833 Cash and cash equivalents at end of year . . . . . . . . . . . . . . . . . . . . . . . . . . . . . . $ 68,223 $ 47,682 $ 126,548
See notes to consolidated financial statements.

2012 Brown Shoe Company, inC. form 10-k 49
Consolidated Statements of Shareholders’ Equity
Total accumulated Brown Shoe additional other Company, inc. non- ($ thousands, except number of shares Common Stock paid-in Comprehensive retained Shareholders’ controlling Total and per share amounts) Shares Dollars Capital income earnings equity interests equity
bALANCE JANUARy 30, 2010 . . . . . . . . . 42,891,905 $ 429 $ 152,314 $ 177 $ 249,251 $ 402,171 $ 9,056 $ 411 ,227 net earnings . . . . . . . . . . . . . . . . . . . 37,233 37,233 (173) 37,060foreign currency translation adjustment . . . . 2,127 2,127 23 2,150Unrealized gains on derivative financial instruments, net of tax provision of $187 . 404 404 404pension and other postretirement benefits adjustments, net of tax provision of $2,197 . 3,433 3,433 3,433 Comprehensive income . . . . . . . . . . . . . 43,197 (150) 43,047Dividends ($0.28 per share) . . . . . . . . . . . (12,254) (12,254) (12,254)Contributions by noncontrolling interests . . . 527 527Stock issued in connection with acquisition of the noncontrolling interest. . . . . . . . 473,081 5 7,304 7,309 7,309Distribution to noncontrolling interest . . . . . (31,397) (31,397) (8,604) (40,001)Stock issued under employee and director benefit and restricted stock plans . . . . . 546,300 5 (8) (3) (3)Tax deficiency related to share-based plans . . (87) (87) (87)Share-based compensation expense . . . . . . 6,144 6,144 6,144 bALANCE JANUARy 29, 2011 . . . . . . . . . . 43,911 ,286 $ 439 $ 134,270 $ 6,141 $ 274,230 $ 415,080 $ 829 $ 415,909 net earnings . . . . . . . . . . . . . . . . . . . 24,589 24,589 (199) 24,390foreign currency translation adjustment . . . . 168 168 39 207Unrealized gains on derivative financial instruments, net of tax provision of $161. . 387 387 387pension and other postretirement benefits adjustments, net of tax provision of $1,555 . 2,941 2,941 2,941 Comprehensive income . . . . . . . . . . . . . 28,085 (160) 27,925Dividends ($0.28 per share) . . . . . . . . . . . (12,076) (12,076) (12,076)Contributions by noncontrolling interests . . . 378 378Stock issued under employee and director benefit and restricted stock plans . . . . . 559,401 6 425 431 431acquisition of treasury stock . . . . . . . . . . (2,500,000) (25) (25,459) (25,484) (25,484)Tax benefit related to share-based plans. . . . 1,000 1,000 1,000Share-based compensation expense . . . . . . 5,633 5,633 5,633 bALANCE JANUARy 28, 2012 . . . . . . . . . 41,970,687 $ 420 $ 1 15,869 $ 9,637 $ 286,743 $ 412,669 $ 1,047 $ 413,716 net earnings . . . . . . . . . . . . . . . . . . . 27,491 27,491 (287) 27,204foreign currency translation adjustment . . . . 463 463 12 475Unrealized loss on derivative financial instruments, net of tax benefit of $33 . . . (155) (155) – (155)pension and other postretirement benefits adjustments, net of tax benefit of $5,777. . (9,061) (9,061) – (9,061)Comprehensive income . . . . . . . . . . . . . 18,738 (275) 18,463Dividends ($0.28 per share) . . . . . . . . . . . (12,011) (12,011) (12,011)Contributions by noncontrolling interests . . . – –Stock issued under employee and director benefit and restricted stock plans . . . . . 925,676 9 (1,709) (1,700) (1,700)Tax benefit related to share-based plans. . . . 944 944 944Share-based compensation expense . . . . . . 6,489 6,489 6,489 bALANCE FEbRUARy 2, 2013. . . . . . . . . . 42,896,363 $ 429 $ 121,593 $ 884 $ 302,223 $ 425,129 $ 772 $ 425,901
See notes to consolidated financial statements.

50 2012 Brown Shoe Company, inC. form 10-k
Notes to Consolidated Financial Statements
1. SUMMARy OF SIGNIFICANT ACCOUNTING pOLICIES
OrganizationBrown Shoe Company, inc. (the “Company”), founded in 1878 and incorporated in 1913, is a global footwear retailer and wholesaler. The Company’s shares are traded under the “BwS” symbol on the new york Stock exchange.
The Company provides a broad offering of licensed, branded and private-label casual, dress and athletic footwear products to women, men and children. footwear is sold at a variety of price points through multiple distribution channels both domestically and internationally. The Company currently operates 1,277 retail shoe stores in the United States, Canada, China and Guam primarily under the famous footwear and naturalizer names. in addition, through its wholesale operations segment, the Company designs, sources and markets footwear to retail stores domestically and internationally, including national chains, department stores, independent retailers, mass merchandisers, online retailers and catalogs. in 2012, approximately 67% of the Company’s net sales were at retail compared to 66% in 2011 and 70% in 2010. See note 7 for additional information regarding the Company’s business segments.
The Company’s business is seasonal in nature due to consumer spending patterns with higher back-to-school and Christmas and easter holiday season sales. Traditionally, the third fiscal quarter accounts for a substantial portion of the Company’s earnings for the year.
ConsolidationThe consolidated financial statements include the accounts of the Company and its wholly-owned and majority-owned subsidiaries, after the elimination of intercompany accounts and transactions.
Noncontrolling Interestsnoncontrolling interests in the Company’s consolidated financial statements result from the accounting for noncontrolling interests in partially-owned consolidated subsidiaries or affiliates. noncontrolling interests represent partially-owned subsidiaries’ or consolidated affiliates’ losses and components of other comprehensive income that are attributable to the noncontrolling parties’ equity interests. The Company consolidates B&h footwear Company Limited (“B&h footwear”), a joint venture, into its consolidated financial statements. net losses attributable to noncontrolling interests represent the share of net losses that are attributable to the equity that is owned by the Company’s partners. Transactions between the Company and B&h footwear have been eliminated in the consolidated financial statements. The Company acquired the final 50% of the outstanding stock of edelman Shoe, inc. (“edelman Shoe”) on June 4, 2010. prior to that date, the equity interests held by other parties in edelman Shoe were accounted for as a noncontrolling interest. Subsequent to June 4, 2010, edelman Shoe became a wholly-owned subsidiary of the Company. See note 2 to the consolidated financial statements for further information on edelman Shoe.
Accounting periodThe Company’s fiscal year is the 52- or 53-week period ending the Saturday nearest to January 31. fiscal years 2012, 2011 and 2010 ended on february 2, 2013, January 28, 2012, and January 29, 2011, respectively. fiscal year 2012 included 53 weeks and fiscal years 2011 and 2010 each included 52 weeks. The impact of the 53rd week in 2012 was an increase to net sales at our retail segments of approximately $21.2 million. The net earnings impact of the 53rd week was immaterial to 2012.
basis of presentationCertain prior-period amounts on the consolidated financial statements have been reclassified to conform to current-period presentation. These reclassifications did not affect net earnings attributable to Brown Shoe Company, inc.
Use of EstimatesThe preparation of financial statements in conformity with generally accepted accounting principles (“Gaap”) requires management to make estimates and assumptions that affect the amounts reported in the financial statements and accompanying notes. actual results could differ from those estimates.
Cash and Cash EquivalentsThe Company considers all highly liquid investments with maturities of three months or less when purchased to be cash equivalents.
ReceivablesThe Company evaluates the collectibility of selected accounts receivable on a case-by-case basis and makes adjustments to the bad debt reserve for expected losses. The Company considers factors such as ability to pay, bankruptcy, credit ratings and payment history. for all other accounts, the Company estimates reserves for bad debts based on experience and past-due status of the accounts. if circumstances related to customers change, estimates of recoverability would be further adjusted. The Company recognized a provision for doubtful accounts of $0.4 million in 2012, $1.3 million in 2011 and $0.5 million in 2010.
Customer allowances represent reserves against our wholesale customers’ accounts receivable for margin assistance, product returns, customer deductions and co-op advertising allowances. we estimate the reserves needed for margin assistance by reviewing inventory levels on the retail floors, sell-through rates, historical dilution, current gross margin levels and other performance indicators of our major retail customers. product returns and customer deductions are estimated using historical experience and anticipated future trends. Co-op advertising allowances are estimated based on customer agreements. The Company recognized a provision for customer allowances of $52.5 million in 2012, $56.1 million in 2011 and $43.0 million in 2010.

2012 Brown Shoe Company, inC. form 10-k 51
Customer discounts represent reserves against our accounts receivable for discounts that our wholesale customers may take based on meeting certain order, payment or return guidelines. we estimate the reserve needed for customer discounts based upon customer net sales and respective agreement terms. The Company recognized a provision for customer discounts of $4.5 million in 2012, $3.8 million in 2011 and $6.9 million in 2010.
Inventoriesall inventories are valued at the lower of cost or market with 86% of consolidated inventories using the last-in, first-out (“Lifo”) method. an actual valuation of inventory under the Lifo method can be made only at the end of each year based on the inventory levels and costs at that time. accordingly, interim Lifo calculations are based on management’s estimates of expected year-end inventory levels and costs and are subject to the final year-end Lifo inventory valuation. if the first-in, first-out (“fifo”) method had been used, consolidated inventories would have been $4.4 million and $5.0 million higher at february 2, 2013 and January 28, 2012, respectively. Substantially all inventory is finished goods.
The costs of inventory, inbound freight and duties, markdowns, shrinkage and royalty expense are classified in cost of goods sold. Costs of warehousing and distribution are classified in selling and administrative expenses and are expensed as incurred. Such warehousing and distribution costs totaled $79.1 million, $76.5 million and $65.0 million in 2012, 2011 and 2010, respectively. Costs of overseas sourcing offices and other inventory procurement costs are reflected in selling and administrative expenses and are expensed as incurred. Such sourcing and procurement costs totaled $24.3 million, $21.7 million and $21.3 million in 2012, 2011 and 2010, respectively.
The Company applies judgment in valuing inventories by assessing the net realizable value of inventories based on current selling prices. at the famous footwear segment, markdowns are recognized when it becomes evident that inventory items will be sold at retail prices less than cost, plus the cost to sell the product. This policy causes gross profit rate at famous footwear to be lower than the initial markup during periods when permanent price reductions are taken to clear product. at the Company’s other divisions, generally markdown reserves reduce the carrying values of inventories to a level where, upon sale of the product, the Company will realize its normal gross profit rate. The Company believes these policies reflect the difference in operating models between famous footwear and other segments. famous footwear periodically runs promotional events to drive sales to clear seasonal inventories. The other segments rely on permanent price reductions to clear slower-moving inventory.
markdowns are recorded to reflect expected adjustments to sales prices. in determining markdowns, management considers current and recently recorded sales prices, the length of time the product is held in inventory and quantities of various product styles contained in inventory, among other factors. The ultimate amount realized from the sale of certain products could differ from management estimates. The Company physically counts all merchandise inventory on hand at least annually and adjusts the recorded balance to reflect the results of the physical counts. The Company records estimated shrinkage between physical inventory counts based on historical results.
Computer Software CostsThe Company capitalizes certain costs in other assets, including internal payroll costs incurred in connection with the development or acquisition of software for internal use. other assets on the consolidated balance sheets include $53.7 million and $59.4 million of unamortized computer software costs as of february 2, 2013 and January 28, 2012, respectively.
property and Equipmentproperty and equipment are stated at cost. Depreciation of property and equipment is provided over the estimated useful lives of the assets or the remaining lease terms, where applicable, using the straight-line method.
InterestCapitalized Interestinterest costs applicable to major asset additions are capitalized during the construction or development period and amortized over the lives of the related assets. The Company did not capitalize interest in 2012. in 2011 and 2010, the Company capitalized interest of less than $0.1 million and $1.3 million, respectively.
Interest Expenseinterest expense includes interest for borrowings under both the Company’s short-term and long-term debt. interest expense includes fees paid under the short-term revolving credit agreement for the unused portion of its line of credit. interest expense also includes the amortization of deferred debt issuance costs as well as the accretion of certain discounted noncurrent liabilities.
Goodwill and Intangible AssetsGoodwill and intangible assets deemed to have indefinite lives are not amortized but are subject to annual impairment tests. The Company adopted the provisions of accounting Standards Codification (“aSC”), intangibles-Goodwill and Other (ASC Topic 350) Testing Goodwill for Impairment, which permits, but does not require, a company to qualitatively assess indicators of a reporting unit’s fair value when it is unlikely that a reporting unit is impaired. if, after completing the qualitative assessment, a company believes it is likely that a reporting unit is impaired, a discounted cash flow analysis is prepared to estimate fair value. if the recorded values of these assets are not recoverable, based on either the assessment screen or discounted cash flow analysis, management performs the next step, which compares the fair value of the reporting unit to the recorded value of the tangible and intangible assets of the reporting units. Goodwill is considered impaired if the fair value of the tangible and intangible assets exceeds the fair value of the reporting unit.
The Company reviewed goodwill for impairment utilizing a discounted cash flow analysis. a fair-value-based test is applied at the reporting unit level, which is generally at or one level below the operating segment level. The test compares the fair value of the Company’s reporting units to the carrying value of those reporting units. This test requires significant assumptions, estimates and judgments by management, and is subject to inherent uncertainties and subjectivity. The fair value of goodwill is determined using an estimate of future cash flows of the reporting unit and a risk-adjusted discount rate to compute a net present value of future cash flows. projected net sales, gross profit, selling and administrative expense, capital expenditures, depreciation, amortization and working capital requirements are based on the Company’s internal

52 2012 Brown Shoe Company, inC. form 10-k
projections. Discount rates reflect market-based estimates of the risks associated with the projected cash flows of the reporting unit directly resulting from the use of its assets in its operations. The Company also considered assumptions that market participants may use. Both the estimates of the fair value of the Company’s reporting units and the allocation of the estimated fair value of the reporting units are based on the best information available to the Company’s management as of the date of the assessment.
an adjustment to goodwill will be recorded for any goodwill that is determined to be impaired. impairment of goodwill is measured as the excess of the carrying amount of goodwill over the fair values of recognized assets and liabilities of the reporting unit. The Company performs impairment tests during the fourth quarter of each fiscal year unless events indicate an interim test is required. The goodwill impairment test performed as of the first day of the Company’s fourth fiscal quarter resulted in no impairment charges. Based on the results of the Company’s most recent impairment test, the fair value of a reporting unit exceeded its carrying value by less than 20%. as of february 2, 2013, the goodwill allocated to the reporting unit was $39.6 million. other intangible assets are amortized over their useful lives and are reviewed for impairment if and when impairment indicators are present.
Self-Insurance ReservesThe Company is self-insured and/or retains high deductibles for a significant portion of its workers’ compensation, employment practices, health, disability, cyber risk, general liability, automobile and property programs, among others. Liabilities associated with the risks that are retained by the Company are estimated by considering historical claims experience, trends of the Company and the industry and other actuarial assumptions. The estimated accruals for these liabilities could be affected if development of costs on claims differ from these assumptions and historical trends. Based on information known at february 2, 2013, the Company believes it has provided adequate reserves for its self-insurance exposure. as of february 2, 2013 and January 28, 2012, self-insurance reserves were $12.3 million and $11.5 million, respectively.
Revenue Recognitionretail sales, recognized at the point of sale, are recorded net of returns and exclude sales tax. wholesale sales and sales through the Company’s internet sites are recorded, net of returns, allowances and discounts, when the merchandise has been shipped and title and risk of loss have passed to the customer. retail items sold through the Company’s internet sites are made pursuant to a sales agreement that provides for transfer of both title and risk of loss upon delivery to the carrier. reserves for projected merchandise returns, discounts and allowances are determined based on historical experience and current expectations. revenue is recognized on license fees related to Company-owned brand-names, where the Company is the licensor, when the related sales of the licensee are made.
Gift CardsThe Company sells gift cards to its consumers in its retail stores and through its internet sites. The Company’s gift cards do not have expiration dates or inactivity fees. The Company recognizes revenue from gift cards when (i) the gift card is redeemed by the consumer or (ii) the likelihood of the gift card being redeemed by the consumer is remote (“gift card breakage”) and the Company determines that it does not have a legal obligation to remit the value of unredeemed gift cards to the relevant jurisdictions. The Company determines its gift card breakage rate based upon historical redemption patterns. The Company recognizes gift card breakage during the 24-month period following the sale of the gift card, according to the Company’s historical redemption pattern. Gift card breakage income is included in net sales in the consolidated statements of earnings and the liability established upon the sale of a gift card is included in other accrued expenses within the consolidated balance sheets. The Company recognized $0.5 million, $0.6 million and $0.6 million of gift card breakage in 2012, 2011 and 2010, respectively.
Loyalty programThe Company maintains a loyalty program (“rewards”) for famous footwear stores in which consumers earn points toward savings certificates for qualifying purchases. Upon reaching specified point values, consumers are issued a savings certificate, which they may redeem for purchases at famous footwear stores. in addition to the savings certificates, the Company also offers exclusive member mailings that offer additional incentives to purchase. Savings certificates earned must be redeemed within stated expiration dates. The value of points and rewards earned by famous footwear’s rewards program members are recorded as a reduction of net sales and a liability is established within other accrued expenses at the time the points are earned based on historical conversion and redemption rates. approximately 66% of net sales in the Company’s famous footwear segment were made to its rewards members in 2012, compared to 62% in 2011 and 61% in 2010.
Store Closing and Impairment ChargesThe costs of closing stores, including lease termination costs, property and equipment write-offs and severance, as applicable, are recorded when the store is closed or when a binding agreement is reached with the landlord to close the store.
The Company regularly analyzes the results of all of its stores and assesses the viability of underperforming stores to determine whether events or circumstances exist that indicate the stores should be closed or whether the carrying amount of their long-lived assets may not be recoverable. after allowing for an appropriate start-up period, unusual nonrecurring events or favorable trends, property and equipment at stores indicated as impaired are written down to fair value using primarily a discounted cash flow method. The Company recorded asset impairment charges, primarily related to underperforming retail stores, of $4.1 million in 2012, $1.9 million in 2011 and $2.8 million in 2010.
Advertising and Marketing Expenseall advertising and marketing costs are expensed at the time the expense is incurred or the promotion first appears in media or in the store, except for direct response advertising that relates primarily to the production and distribution of the Company’s catalogs and coupon mailers. Direct response advertising costs are amortized over the expected future revenue stream, which is one to three months from the date materials are mailed.
in addition, the Company participates in co-op advertising programs with certain of its wholesale customers. for those co-op advertising programs where the Company has validated the fair value of the advertising received, co-op advertising costs are reflected as advertising expense within selling and administrative expenses. otherwise, co-op advertising costs are reflected as a reduction of net sales.

2012 Brown Shoe Company, inC. form 10-k 53
Total advertising and marketing expense was $86.2 million, $94.8 million and $91.4 million in 2012, 2011 and 2010, respectively. in 2012, 2011 and 2010, these costs were offset by co-op advertising allowances recovered by the Company’s retail divisions of $8.6 million, $7.8 million and $9.4 million, respectively. Total co-op advertising costs reflected as a reduction of net sales were $10.5 million in 2012, $11.5 million in 2011 and $7.7 million in 2010. Total advertising costs attributable to future periods that are deferred and recognized as a component of prepaid expenses and other current assets were $2.3 million and $2.6 million at february 2, 2013 and January 28, 2012, respectively.
Income TaxesThe Company recognizes deferred tax assets and liabilities for the expected future tax consequences of temporary differences between the consolidated financial statement carrying amounts and the tax bases of its assets and liabilities. The Company establishes valuation allowances if it believes that it is more-likely-than-not that some or all of its deferred tax assets will not be realized. The Company does not recognize a tax benefit unless it concludes that it is more-likely-than-not that the benefit will be sustained on audit by the taxing authority based solely on the technical merits of the associated tax position. if the recognition threshold is met, the Company recognizes a tax benefit measured at the largest amount of the tax benefit that, in its judgment, is greater than 50% likely to be realized. The Company records interest and penalties related to unrecognized tax positions within the income tax provision on the consolidated statements of earnings.
Operating LeasesThe Company leases its store premises and certain distribution centers under operating leases. approximately one-half of the leases entered into by the Company include options under which allows the Company to extend the lease term beyond the initial commitment period, subject to terms agreed to at lease inception. Some leases also include early termination options that can be exercised under specific conditions.
Contingent Rentalsmany of the leases covering retail stores require contingent rentals in addition to the minimum monthly rental charge based on retail sales volume. The Company records expense for contingent rentals during the period in which the retail sales volume exceeds the respective targets.
Construction Allowances Received From Landlordsat the time its retail facilities are initially leased, the Company often receives consideration from landlords to be applied against the cost of leasehold improvements necessary to open the store. The Company treats these construction allowances as a lease incentive. The allowances are recorded as a deferred rent obligation upon receipt and amortized to income over the lease term as a reduction of rent expense. The allowances are reflected as a component of other accrued expenses and deferred rent on the consolidated balance sheets.
Straight-Line Rents and Rent HolidaysThe Company records rent expense on a straight-line basis over the lease term for all of its leased facilities. for leases that have predetermined fixed escalations of the minimum rentals, the Company recognizes the related rental expense on a straight-line basis and records the difference between the recognized rental expense and amounts payable under the lease as deferred rent. at the time its retail facilities are leased, the Company is frequently not charged rent for a specified period of time, typically 30 to 60 days, while the store is being prepared for opening. This rent-free period is referred to as a rent holiday. The Company recognizes rent expense over the lease term, including any rent holiday, within selling and administrative expenses on the consolidated statements of earnings.
Preopening Costspreopening costs associated with opening retail stores, including payroll, supplies and facility costs, are expensed as incurred.
Earnings per Common Share Attributable to brown Shoe Company, Inc. Shareholders The Company uses the two-class method to calculate basic and diluted earnings per common share attributable to Brown Shoe Company, inc. shareholders. Unvested restricted stock awards are considered participating units because they entitle holders to non-forfeitable rights to dividends or dividend equivalents during the vesting term. Under the two-class method, basic earnings per common share attributable to Brown Shoe Company, inc. shareholders is computed by dividing the net earnings attributable to Brown Shoe Company, inc. after allocation of earnings to participating securities by the weighted-average number of common shares outstanding during the year. Diluted earnings per common share attributable to Brown Shoe Company, inc. shareholders is computed by dividing the net earnings attributable to Brown Shoe Company, inc. after allocation of earnings to participating securities by the weighted-average number of common shares and potential dilutive securities outstanding during the year. potential dilutive securities consist of outstanding stock options. See note 3 to the consolidated financial statements for additional information related to the calculation of earnings per common share attributable to Brown Shoe Company, inc. shareholders.
Comprehensive IncomeComprehensive income includes the effect of foreign currency translation adjustments, unrealized gains or losses from derivatives used for hedging activities and pension and other postretirement benefits adjustments.
Foreign Currency Translationfor certain of the Company’s international subsidiaries, the local currency is the functional currency. assets and liabilities of these subsidiaries are translated into United States dollars at the fiscal year-end exchange rate or historical rates as appropriate. Consolidated statements of earnings amounts are translated at average exchange rates for the period. The cumulative translation adjustments resulting from changes in exchange rates are included in the consolidated balance sheets as a component of accumulated other comprehensive income in total Brown Shoe Company, inc. shareholders’ equity. Transaction gains and losses are included in the consolidated statements of earnings.
Derivative Financial InstrumentsThe Company recognizes all derivative financial instruments as either assets or liabilities in the consolidated balance sheets and measures those instruments at fair value. The Company evaluates its exposure to volatility in foreign currency rates and may enter into derivative transactions as it deems necessary. These derivative financial instruments are viewed as risk

54 2012 Brown Shoe Company, inC. form 10-k
management tools and are not used for trading or speculative purposes. See additional information related to derivative financial instruments in note 12 to the consolidated financial statements.
Accumulated Other Comprehensive Income accumulated other comprehensive income consists of foreign currency translation gains, unrealized gains (losses) on derivative financial instruments and pension and other postretirement benefits adjustments (charges), which are shown net of tax. accumulated other comprehensive income, after tax, as of february 2, 2013 consisted of foreign currency translation gains of $6.9 million, unrealized losses on derivative financial instruments of $0.1 million and pension and other postretirement benefits charges of $5.9 million. as of January 28, 2012, accumulated other comprehensive income, after tax, consisted of foreign currency translation gains of $6.4 million, unrealized gains on derivative financial instruments of $0.1 million and pension and other postretirement benefits adjustments of $3.1 million. as of January 29, 2011, accumulated other comprehensive income, after tax, consisted of foreign currency translation gains of $6.3 million, unrealized losses on derivative financial instruments of $0.3 million and pension and other postretirement benefits adjustments of $0.1 million. See additional information related to derivative financial instruments in note 12 and note 13 to the consolidated financial statements and additional information related to pension and other postretirement benefits in note 5 to the consolidated financial statements.
business Combination AccountingThe Company allocates the purchase price of an acquired entity to the assets and liabilities acquired based upon their estimated fair values at the business combination date. The Company also identifies and estimates the fair values of intangible assets that should be recognized as assets apart from goodwill. a single estimate of fair value results from a complex series of judgments about future events and uncertainties and relies heavily on estimates and assumptions. The Company has historically relied in part upon the use of reports from third-party valuation specialists to assist in the estimation of fair values for intangible assets other than goodwill. The carrying values of acquired receivables and trade accounts payable have historically approximated their fair values at the business combination date. with respect to other acquired assets and liabilities, the Company uses all available information to make the best estimates of their fair values at the business combination date.
The Company’s purchase price allocation methodology contains uncertainties because it requires management to make assumptions and to apply judgment to estimate the fair value of acquired assets and liabilities. management estimates the fair value of assets and liabilities based upon quoted market prices, the carrying value of the acquired assets and widely accepted valuation techniques, including discounted cash flows. Unanticipated events or circumstances may occur which could affect the accuracy of the Company’s fair value estimates, including assumptions regarding industry economic factors and business strategies.
Share-based CompensationThe Company has share-based incentive compensation plans under which certain officers, employees and members of the Board of Directors are participants and may be granted stock option, restricted stock and stock performance awards. additionally, share-based grants may be made to non-employee members of the Board of Directors in the form of cash-equivalent restricted stock units (“rSUs”) at no cost to the non-employee member of the Board of Directors. The Company accounts for share-based compensation in accordance with the fair value recognition provisions of aSC 718, Compensation – Stock Compensation, and aSC 505, Equity, which require all share-based payments to employees and members of the Board of Directors, including grants of employee stock options, to be recognized in the consolidated financial statements based on their fair values. The fair value of stock options is calculated using the Black-Scholes option pricing formula that requires estimates for expected volatility, expected dividends, the risk-free interest rate and the expected term of the option. Stock options generally vest over four years, with 25% vesting annually, and expense is recognized on a straight-line basis separately for each vesting portion of the stock option award. expense for restricted stock is based on the fair value of the restricted stock on the date of grant and is recognized on a straight-line basis generally over a four-year vesting period. expense for stock performance awards is recognized based upon the fair value of the awards on the date of grant and the anticipated number of shares or units to be awarded on a straight-line basis over the three-year service period. expense for the initial grant of rSUs is recognized ratably over the one-year vesting period based upon the fair value of the rSUs, as remeasured at the end of each period. if any of the assumptions used in the Black-Scholes model or the anticipated number of shares to be awarded change significantly, share-based compensation expense may differ materially in the future from that recorded in the current period. See additional information related to share-based compensation in note 15 to the consolidated financial statements.
Impact of New Accounting pronouncementsin may 2011, the financial accounting Standards Board (“faSB”) issued accounting Standards Update (“aSU”) no. 2011-04, Fair Value Measurement, which amends prior fair value guidance. This standard requires additional disclosures related to fair value measurements. The Company adopted the standard on January 29, 2012 and it did not have an impact on the Company’s consolidated financial statements, although changes in related disclosures were required.
in June 2011, the faSB issued aSU no. 2011-05, Comprehensive Income (ASC Topic 220) Presentation of Comprehensive Income, which amends prior comprehensive income guidance. This standard eliminates the option to present the components of other comprehensive income as part of the statement of shareholders’ equity. instead, the Company must report comprehensive income in either a single continuous statement of comprehensive income that contains two sections, net earnings and other comprehensive income, or in two separate but consecutive statements. The Company adopted the standard on January 29, 2012 and it did not have an impact on the Company’s consolidated balance sheets, results of operations or cash flows as it only requires a change in the format of the current presentation and related disclosures.
in September 2011, the faSB issued aSU no. 2011-08, Intangibles-Goodwill and Other (ASC Topic 350) Testing Goodwill for Impairment, which amends prior goodwill impairment testing guidance. This standard will allow companies the option to first assess qualitative factors to determine whether it is more likely than not (a likelihood of more than 50%) that the fair value of a reporting unit is less than its carrying amount. if, after considering the totality of events and circumstances, an entity determines it is more likely than not that the fair value of a reporting unit is more than its carrying amount, performing the two-step impairment test is unnecessary. The Company adopted the standard on January 29, 2012 and it did not have an impact on the Company’s consolidated financial statements.

2012 Brown Shoe Company, inC. form 10-k 55
in July 2012, the faSB issued aSU no. 2012-02, Intangibles-Goodwill and Other (ASC Topic 350) Testing Indefinite-Lived Intangible Assets for Impairment, which amends prior indefinite-lived intangible asset impairment testing guidance. This standard allows companies the option to first assess qualitative factors to determine whether it is more likely than not (a likelihood of more than 50%) that an indefinite-lived intangible asset is impaired. if, after considering the totality of events and circumstances, an entity determines it is more likely than not that an indefinite-lived intangible asset is not impaired, then calculating the fair value is unnecessary. The Company adopted the standard on July 29, 2012 and it did not have an impact on the Company’s consolidated financial statements.
Impact of prospective Accounting pronouncementsin february 2013, the faSB issued aSU no. 2013-02, Comprehensive Income (ASC Topic 220) Reporting of Amounts Reclassified Out of Accumulated Other Comprehensive Income, which amends prior comprehensive income guidance. This standard requires an entity to present the amounts reclassified out of accumulated other comprehensive income by component and respective line items of net earnings on either the face of the statement of earnings or in the notes to the financial statements. The Company plans on adopting the standard in 2013. The adoption is not expected to have an impact on the Company’s consolidated balance sheets, results of operations or cash flows as it only requires a change in the format of the current presentation and related disclosures.
2. ACQUISITIONS AND DIVESTITURES
American Sporting Goods Corporation on february 17, 2011, the Company entered into a Stock purchase agreement with american Sporting Goods Corporation (“aSG”) and aSG’s stockholders, pursuant to which a subsidiary of the Company acquired all of the outstanding capital stock of aSG from the aSG stockholders on that date. The aggregate purchase price for the aSG Stock was $156.6 million in cash, including debt assumed by the Company of $11.6 million. The cost to acquire aSG was allocated to the assets acquired and liabilities assumed according to estimated fair values. The allocation resulted in acquired goodwill of $61.2 million and intangible assets related to trade names, licensing agreements and customer relationships of $46.7 million. The goodwill and intangible assets were allocated to the wholesale operations segment. The operating results of aSG have been included in the Company’s financial statements since february 17, 2011 and are consolidated within the wholesale operations segment.
aSG is a designer, manufacturer and marketer of a broad range of athletic footwear with a strong presence in walking, fitness and basketball. it was founded in 1983 and is now headquartered in irvine, California. The acquisition added performance and lifestyle athletic and outdoor footwear brands to the Company’s portfolio, including avia, ryka, anD 1 and nevados.
During 2012, the Company incurred integration related costs totaling $0.7 million ($0.4 million after-tax, or $0.01 per diluted share) all of which were reflected within the wholesale operations segment. During 2011, the Company incurred acquisition and integration related costs totaling $6.5 million ($4.5 million after-tax, or $0.11 per diluted share). of the $6.5 million costs recorded during 2011, $4.0 million was recorded in the other segment and $2.5 million was reflected within the wholesale operations segment. During 2010, the Company incurred acquisition-related costs totaling $1.1 million ($0.7 million after-tax, or $0.02 per diluted share). all of the costs incurred in 2010 were reflected within the other segment. all of the expenses incurred in 2012, 2011 and 2010 were recorded as a component of restructuring and other special charges, net. in addition, during 2011, the wholesale operations segment recognized an increase in cost of goods sold related to the impact of the inventory fair value adjustment in connection with the acquisition of aSG of $4.2 million ($2.5 million after-tax, or $0.05 per diluted share). See additional information related to acquisition and integration costs in note 4 to the consolidated financial statements.
The Company allocated the purchase price of aSG according to its estimate of the fair value of the assets and liabilities as of the acquisition date, february 17, 2011, as follows:
($ millions) as of february 17, 2011
Cash and cash equivalents . . . . . . . . . . . . . . . . . . . . . . . . . . . $ 3.1receivables . . . . . . . . . . . . . . . . . . . . . . . . . . . . . . . . . . . . 21.1inventories . . . . . . . . . . . . . . . . . . . . . . . . . . . . . . . . . . . . 46.5Deferred income taxes. . . . . . . . . . . . . . . . . . . . . . . . . . . . . . 3.4prepaid expense and other current assets . . . . . . . . . . . . . . . . . . 12.2Total current assets . . . . . . . . . . . . . . . . . . . . . . . . . . . . . . . 86.3other assets . . . . . . . . . . . . . . . . . . . . . . . . . . . . . . . . . . . 1.2Goodwill. . . . . . . . . . . . . . . . . . . . . . . . . . . . . . . . . . . . . . 61.2intangible assets . . . . . . . . . . . . . . . . . . . . . . . . . . . . . . . . . 46.7property and equipment . . . . . . . . . . . . . . . . . . . . . . . . . . . . 8.4Total assets . . . . . . . . . . . . . . . . . . . . . . . . . . . . . . . . . . . . $ 203.8
Trade accounts payable . . . . . . . . . . . . . . . . . . . . . . . . . . . . . $ 13.2other accrued expenses. . . . . . . . . . . . . . . . . . . . . . . . . . . . . 18.0Total current liabilities . . . . . . . . . . . . . . . . . . . . . . . . . . . . . . 31.2Deferred income taxes. . . . . . . . . . . . . . . . . . . . . . . . . . . . . . 16.0Total liabilities . . . . . . . . . . . . . . . . . . . . . . . . . . . . . . . . . . $ 47.2
net assets . . . . . . . . . . . . . . . . . . . . . . . . . . . . . . . . . . . . . $ 156.6

56 2012 Brown Shoe Company, inC. form 10-k
The Company’s purchase price allocation contained uncertainties because it required management to make assumptions and to apply judgment to estimate the fair value of acquired assets and liabilities. a single estimate of fair value results from a complex series of judgments about future events and uncertainties and relies heavily on estimates and assumptions. The judgments the Company used in estimating the fair values assigned to each class of acquired assets and assumed liabilities could materially affect the results of its operations. management estimated the fair value of assets and liabilities based upon quoted market prices, the carrying value of the acquired assets and widely accepted valuation techniques, including discounted cash flows. Unanticipated events or circumstances may occur, which could affect the accuracy of the Company’s fair value estimates, including assumptions regarding industry economic factors and business strategies.
The Company estimated the fair value of acquired receivables to be $21.1 million with a gross contractual amount of $22.1 million. The Company does not expect to collect $1.0 million of the acquired receivables. The Company also estimated the fair value of inventories based on the estimated selling price of the work-in-process and finished goods acquired at the closing date less the sum of the costs to complete the work-in-process, the costs of disposal and a reasonable profit allowance for our post acquisition selling efforts and current replacement cost for raw materials acquired at the closing date. in estimating the fair values for intangible assets other than goodwill, the Company relied in part upon the work of a third-party valuation specialist. with respect to other acquired assets and liabilities, the Company used all available information to make its best estimate of fair values at the business combination date. The Company’s allocation of purchase price was considered complete as of July 30, 2011.
Goodwill and intangible assets reflected above were determined to meet the criteria for recognition apart from tangible assets acquired and liabilities assumed. The goodwill recognized is primarily attributable to synergies and an assembled workforce and is not deductible for tax purposes.
The following table illustrates the unaudited pro forma effect on operating results as if the acquisition had been completed as of the beginning of 2010:
(in thousands, except per share amounts) 2011 2010
net sales. . . . . . . . . . . . . . . . . . . . . . . . . . . . . . . . . $2,589,581 $ 2,686,503 net earnings attributable to Brown Shoe Company, inc. . . . . . . 28,178 46,201 Basic earnings per common share attributable to Brown Shoe Company, inc. shareholders. . . . . . . . . . . . . 0.66 1.06 Diluted earnings per common share attributable to Brown Shoe Company, inc. shareholders. . . . . . . . . . . . . 0.65 1.05
The pro forma net sales for 2011 and 2010 exclude the discontinued operations of The Basketball marketing Company, inc. (“TBmC”), which was sold during 2011. The primary adjustments to the pro forma disclosures above for 2010 include: i) a non-cash cost of goods sold impact reflecting the sell-through of higher cost product due to a fair value adjustment to acquired inventory of $4.2 million; ii) amortization of acquired intangibles of $1.9 million; and iii) additional interest expense of $5.5 million assuming borrowings at the beginning of 2010 of $156.6 million at 3.5% interest under our Credit agreement to fund the acquisition. The primary adjustments for 2011 include: i) the elimination of a non-cash cost of goods sold impact related to the inventory fair value adjustment of $4.2 million; and ii) the elimination of $1.6 million of expenses related to the acquisition. The above unaudited pro forma financial information is presented for informational purposes only and does not purport to represent what the Company’s results of operations would have been had the Company completed the acquisition on the date assumed, nor is it necessarily indicative of the results of operations that may be expected in future periods.
During the period from the acquisition date through January 28, 2012, the Company’s consolidated statement of earnings included net sales from aSG of $135.5 million (net of intercompany eliminations and net sales from the discontinued operations of TBmC) and net earnings of $14.5 million, which included a net gain on the sale of TBmC of $14.0 million and an increase in cost of goods sold related to the impact of the inventory fair value adjustment in connection with the acquisition of aSG of $4.2 million ($2.5 million after-tax, or $0.05 per diluted share).
The basketball Marketing Company, Inc.on october 25, 2011, the Company sold TBmC for $55.4 million in cash. TBmC markets and sells footwear bearing the anD 1 brand-name and was acquired in the Company’s february 17, 2011 acquisition of aSG. TBmC was included in the wholesale operations segment of the Company. in conjunction with the sale, the Company recorded a gain of $20.6 million ($14.0 million after-tax, or $0.32 per diluted share), which is reflected in the consolidated statements of earnings as a component of discontinued operations. The Company also reduced goodwill by $21.6 million, intangible assets by $8.0 million and other net assets by $5.2 million.
accordingly, the results of TBmC are reflected in the consolidated statement of earnings as discontinued operations. earnings from the discontinued operations of TBmC for 2011 included $19.7 million of net sales and $3.0 million of earnings before income taxes.

2012 Brown Shoe Company, inC. form 10-k 57
Edelman Shoe, Inc.edelman Shoe is a leading designer and marketer of fashion footwear. in 2007, the Company invested cash of $7.1 million in edelman Shoe, acquiring 42.5% of the outstanding stock. on november 3, 2008, the Company invested an additional $4.1 million of cash in edelman Shoe, acquiring 7.5% of the outstanding stock, bringing the Company’s total equity interest to 50%.
Beginning november 3, 2008, the Company’s consolidated financial statements included the accounts of edelman Shoe as a result of the Company’s determination that edelman Shoe was a variable interest entity (“Vie”), for which the Company was the primary beneficiary. at the beginning of fiscal 2010, the Company adopted amended consolidation guidance applicable to Vies, evaluated the impact on the existing variable interests in edelman Shoe and determined that edelman Shoe continued to be a Vie that was appropriately consolidated by the Company.
on June 4, 2010, the Company acquired the remaining 50% of the outstanding stock of edelman Shoe for $40.0 million, consisting of a combination of $32.7 million of cash, including transaction fees, and $7.3 million in shares of the Company’s common stock. The stock consideration consisted of 473,081 shares of the Company’s common stock. The acquisition of the remaining interest in edelman Shoe was accounted for in accordance with the consolidation guidance applicable to noncontrolling interests, which requires changes in a parent’s ownership interest in a subsidiary, without loss of control, to be reflected as an adjustment to the carrying amount of the noncontrolling interest with excess consideration recognized directly to equity attributable to the controlling interest. as a result, the Company’s acquisition of the remaining interest in edelman Shoe resulted in a reduction to total equity of $32.7 million, consisting of a net reduction of $24.1 million to total Brown Shoe Company, inc. shareholders’ equity and the elimination of $8.6 million of the noncontrolling interest in edelman Shoe. as of June 4, 2010, edelman Shoe became a wholly-owned subsidiary of the Company.
3. EARNINGS pER SHARE
The following table sets forth the computation of basic and diluted earnings per common share attributable to Brown Shoe Company, inc. shareholders:
(in thousands, except per share amounts) 2012 2011 2010
NUMERATORnet earnings from continuing operations . . . . . . . . . . . . . . . . . . . . . . . . . . . . . . . . $ 27,204 $ 8,724 $ 37,060 net loss attributable to noncontrolling interests . . . . . . . . . . . . . . . . . . . . . . . . . . . . 287 199 173 net earnings allocated to participating securities . . . . . . . . . . . . . . . . . . . . . . . . . . . . (1,365) (529) (1,283) net earnings from continuing operations . . . . . . . . . . . . . . . . . . . . . . . . . . . . . . . . 26,126 8,394 35,950
net earnings from discontinued operations . . . . . . . . . . . . . . . . . . . . . . . . . . . . . . . – 15,666 – net earnings allocated to participating securities . . . . . . . . . . . . . . . . . . . . . . . . . . . . – (668) – net earnings from discontinued operations . . . . . . . . . . . . . . . . . . . . . . . . . . . . . . . – 14,998 – net earnings attributable to Brown Shoe Company, inc. after allocation of earnings to participating securities . . . . . . . . . . . . . . . . . . . . . . . $ 26,126 $ 23,392 $ 35,950
DENOMINATORDenominator for basic continuing and discontinued earnings per common share attributable to Brown Shoe Company, inc. shareholders . . . . . . . . . . 40,659 41,126 42,156 Dilutive effect of share-based awards . . . . . . . . . . . . . . . . . . . . . . . . . . . . . . . . . . 135 542 331 Denominator for diluted continuing and discontinued earnings per common share attributable to Brown Shoe Company, inc. shareholders . . . . . . . . . . 40,794 41,668 42,487
Basic earnings per common share: from continuing operations . . . . . . . . . . . . . . . . . . . . . . . . . . . . . . . . . . . . . . . . $ 0.64 $ 0.20 $ 0.85 from discontinued operations . . . . . . . . . . . . . . . . . . . . . . . . . . . . . . . . . . . . . . – 0.37 – Basic earnings per common share attributable to Brown Shoe Company, inc. shareholders . . . . $ 0.64 $ 0.57 $ 0.85
Diluted earnings per common share:from continuing operations . . . . . . . . . . . . . . . . . . . . . . . . . . . . . . . . . . . . . . . . $ 0.64 $ 0.20 $ 0.85 from discontinued operations . . . . . . . . . . . . . . . . . . . . . . . . . . . . . . . . . . . . . . – 0.36 – Diluted earnings per common share attributable to Brown Shoe Company, inc. shareholders . . . $ 0.64 $ 0.56 $ 0.85
options to purchase 998,701, 1,415,696 and 1,186,570 shares of common stock in 2012, 2011 and 2010, respectively, were not included in the denominator for diluted earnings per common share attributable to Brown Shoe Company, inc. shareholders because the effect would be antidilutive.

58 2012 Brown Shoe Company, inC. form 10-k
4. RESTRUCTURING AND OTHER SpECIAL CHARGES, NET
portfolio RealignmentThe Company’s portfolio realignment initiatives include selling the anD 1 division (TBmC, which was acquired with aSG); exiting certain women’s specialty and private label brands; exiting the children’s wholesale business; closing two U.S. distribution centers; closing or relocating numerous underperforming or poorly aligned retail stores; closing facilities in China; and other infrastructure changes. These portfolio realignment initiatives began in 2011 and continued throughout 2012. The termination of the etienne aigner license agreement is also considered part of the Company’s portfolio realignment initiatives. During 2012, the Company terminated the etienne aigner license agreement (“former license agreement”), due to a dispute with the licensor. in conjunction with the termination, the Company recognized an impairment charge of $5.8 million to reduce the remaining unamortized value of the licensed trademark intangible asset to zero. During 2012, the Company incurred costs related to its portfolio realignment activities of $29.9 million ($19.3 million after-tax, or $0.45 per diluted share). These costs are reflected on the condensed consolidated statement of earnings as $21.0 million in restructuring and other special charges, net, $5.8 million in impairment of intangible assets and $3.1 million in cost of goods sold. of the $21.0 million in restructuring and other special charges, net, $8.6 million is included in the wholesale operations segment, $7.8 million is included in the famous footwear segment, $3.7 million is included in the Specialty retail segment and $0.9 million is included in the other segment. of the $3.1 million in cost of goods sold, $2.7 million is included in the wholesale operations segment and $0.4 million is included in the Specialty retail segment. in conjunction with the sale of TBmC in 2011, the Company recorded a gain of $20.6 million ($14.0 million on an after-tax basis, or $0.32 per diluted share), which is reflected in the consolidated statements of earnings as a component of discontinued operations. also during 2011, the Company incurred costs related to its portfolio realignment activities of $19.2 million ($12.0 million on an after-tax basis, or $0.28 per diluted share). These costs are reflected on the consolidated statements of earnings as $17.2 million in restructuring and other special charges, net, and $2.0 million in costs of goods sold. of the $17.2 million, $10.5 million was recorded in the wholesale operations segment, $3.3 million was recorded in the other segment, $2.8 million was recorded in the famous footwear segment and $0.6 million was recorded in the Specialty retail segment. of the $2.0 million, $1.6 million was recorded in the wholesale operations segment and $0.4 million was recorded in the Specialty retail segment. The following is a summary of the charges and settlements by category of costs: markdowns and royalty ($ millions) employee Shortfalls facility other Total
original charges and reserve balance . . . . . . . . . . . . . . . . . . . . . . . . . . $ 8.9 $ 6.1 $ 1.4 $ 2.8 $ 19.2 amounts settled in 2011 . . . . . . . . . . . . . . . . . . . . . . . . . . . . . . . . . . (3.1) (4.5) (0.1) (1.5) (9.2)reserve balance at January 28, 2012 . . . . . . . . . . . . . . . . . . . . . . . . . . . $ 5.8 $ 1.6 $ 1.3 $ 1.3 $ 10.0 additional charges in 2012. . . . . . . . . . . . . . . . . . . . . . . . . . . . . . . . . 6.0 3.1 11.4 9.4 29.9 amounts settled in 2012 . . . . . . . . . . . . . . . . . . . . . . . . . . . . . . . . . . (10.1) (4.5) (9.4) (10.4) (34.4) reserve balance at february 2, 2013 . . . . . . . . . . . . . . . . . . . . . . . . . . . $ 1.7 $ 0.2 $ 3.3 $ 0.3 $ 5.5
Acquisition and Integration Related Costson february 17, 2011, the Company entered into a Stock purchase agreement with aSG’s stockholders, pursuant to which the Company acquired all of the outstanding capital stock of aSG. During 2012, the Company incurred integration related costs totaling $0.7 million ($0.4 million on an after-tax basis, or $0.01 per diluted share) all of which were reflected within the wholesale operations segment. During 2011, the Company incurred acquisition and integration related costs totaling $6.5 million ($4.5 million on an after-tax basis, or $0.11 per diluted share). of the $6.5 million costs recorded during 2011, $4.0 million was recorded in the other segment and $2.5 million was reflected within the wholesale operations segment. in 2011, $2.9 million of the aSG acquisition and integration costs related to severance. During 2010, the Company incurred acquisition-related costs totaling $1.1 million ($0.7 million on an after-tax basis, or $0.02 per diluted share). all of the costs incurred in 2010 were reflected within the other segment. all of the expenses incurred in 2012, 2011 and 2010 were recorded as a component of restructuring and other special charges, net. See note 2 to the consolidated financial statements for further information. Organizational ChangesDuring 2012, the Company incurred costs of $2.3 million ($1.4 million on an after-tax basis, or $0.03 per diluted share) related to an organizational change at its corporate headquarters. all of these costs were recorded in the other segment and as a component of restructuring and other special charges, net. no organizational change costs were incurred 2011 or 2010. Information Technology InitiativesDuring 2008, the Company began implementation of an integrated enterprise resource planning (“erp”) system provided by third-party vendors to replace certain existing internally developed and certain other third-party applications. The Company went live on the wholesale portion of its new erp system in the fourth quarter of 2010. During 2010, the Company incurred expenses of $6.8 million ($4.6 million on an after-tax basis, or $0.10 per diluted share) related to these initiatives. of the $6.8 million in expenses recorded during 2010, $6.1 million was recorded in the other segment, and the remaining expense was recorded in the wholesale operations segment. all expenses incurred were recorded as a component of restructuring and other special charges, net.

2012 Brown Shoe Company, inC. form 10-k 59
5. RETIREMENT AND OTHER bENEFIT pLANS
The Company sponsors pension plans in both the United States and Canada. The Company’s domestic pension plans cover substantially all United States employees. Under the domestic plans, salaried, management and certain hourly employees’ pension benefits are based on the employee’s highest consecutive five years of compensation during the 10 years before retirement. The Company’s Canadian pension plans cover certain employees based on plan specifications. Under the Canadian plans, employees’ pension benefits are based on the employee’s highest consecutive five years of compensation during the 10 years before retirement. The Company’s funding policy for all plans is to make the minimum annual contributions required by applicable regulations.
The Company also maintains an unfunded Supplemental executive retirement plan (“Serp”). as of february 2, 2013, the projected benefit obligation of this plan was $8.4 million and the accumulated benefit obligation was $6.9 million.
in addition to providing pension benefits, the Company sponsors unfunded defined benefit postretirement life insurance plans that cover both salaried and hourly employees who became eligible for benefits by January 1, 1995. The life insurance plans provide coverage of up to twenty-thousand dollars for qualifying retired employees.
benefit ObligationsThe following table sets forth changes in benefit obligations, including all domestic and Canadian plans:
pension Benefits other postretirement Benefits ($ thousands) 2012 2011 2012 2011 Benefit obligation at beginning of year . . . . . . . . . . . . . . . . . . . . $ 261,459 $ 215,373 $ 3,485 $ 3,230 Service cost . . . . . . . . . . . . . . . . . . . . . . . . . . . . . . . . . . . . 11,523 9,256 – –interest cost . . . . . . . . . . . . . . . . . . . . . . . . . . . . . . . . . . . . 12,727 12,533 148 176 plan participants’ contribution . . . . . . . . . . . . . . . . . . . . . . . . . 12 1 1 13 17 plan amendments . . . . . . . . . . . . . . . . . . . . . . . . . . . . . . . . – 153 – –actuarial loss (gain) . . . . . . . . . . . . . . . . . . . . . . . . . . . . . . . 16,259 42,746 (236) 315 Benefits paid . . . . . . . . . . . . . . . . . . . . . . . . . . . . . . . . . . . (11,464) (18,590) (203) (253)foreign exchange rate changes . . . . . . . . . . . . . . . . . . . . . . . . . 18 (23) – – Benefit obligation at end of year . . . . . . . . . . . . . . . . . . . . . . . . $ 290,534 $ 261,459 $ 3,207 $ 3,485
The accumulated benefit obligation for the United States pension plans was $263.8 million and $236.7 million as of february 2, 2013 and January 28, 2012, respectively. The accumulated benefit obligation for the Canadian pension plans was $4.9 million and $4.6 million as of february 2, 2013 and January 28, 2012, respectively. pension Benefits other postretirement Benefits weighted-average assumptions used to determine benefit obligations, end of year 2012 2011 2012 2011 Discount rate . . . . . . . . . . . . . . . . . . . . . . . . . . . . . . . . . . . 4.50% 4.75% 4.50% 4.75% rate of compensation increase . . . . . . . . . . . . . . . . . . . . . . . . . 3.50% 4.00% N/A n/a
plan Assetspension assets are managed in accordance with the prudent investor standards of the employee retirement income Security act (“eriSa”). The plan’s investment objective is to earn a competitive total return on assets, while also ensuring plan assets are adequately managed to provide for future pension obligations. This results in the protection of plan surplus and is accomplished by matching the duration of the projected benefit obligation using leveraged fixed income instruments and, while maintaining a 70% overall (United States and international) equity commitment, managing an equity overlay strategy. The overlay strategy is intended to protect the managed equity portfolios against adverse stock market environments. The Company delegates investment management to specialists in each asset class and regularly monitors manager performance and compliance with investment guidelines. The Company’s overall investment strategy is to achieve a mix of approximately 95% of investments for long-term growth and 5% for near-term benefit payments with a wide diversification of asset types, fund strategies and fund managers. The target allocations for plan assets for 2013 are 55% domestic equities, 30% debt securities and 15% foreign equities. allocations may change periodically based upon changing market conditions. Domestic equities did not include any Company stock at february 2, 2013 or January 28, 2012.
assets of the Canadian pension plans, which total approximately $5.0 million at february 2, 2013, were invested 56% in equity funds, 40% in bond funds and 4% in money market funds. The Canadian pension plans did not include any Company stock as of february 2, 2013 or January 28, 2012.
a financial instrument’s level within the valuation hierarchy is based upon the lowest level of input that is significant to the fair value measurement. See further discussion on the fair value hierarchy in note 13 to the consolidated financial statements. following is a description of the pension plan investments measured at fair value, including the general classification of such investments pursuant to the valuation hierarchy.

60 2012 Brown Shoe Company, inC. form 10-k
• Investments in corporate stocks – common, U.S. government securities, mutual fund, money market funds, real estate investment trusts and S&p 500 index put and call options (traded on security exchanges) are classified within Level 1 of the fair value hierarchy because the fair values are based on unadjusted quoted market prices in active markets with sufficient volume and frequency.
• Corporate debt instruments and interest rate swap agreements are valued at fair value based on vendor-quoted pricing for which inputs are observable and can be corroborated; therefore, these are classified within Level 2 of the fair value hierarchy.
• The limited partnership investment represents the pension plan’s undivided interest in a limited partnership. The limited partnership invests primarily in a diversified portfolio of equity securities of U.S. and non-U.S. issuers whose fair values are based on unadjusted quoted market prices in active markets with sufficient volume and frequency. Limited partnership assets are allocated to the pension plan by assigning the pension plan transactions that can be specifically identified and allocating non-specific transactions in proportion to the pension plan’s beneficial interest in the limited partnership. This contract is classified within Level 2 of the fair value hierarchy. There are currently no redemption restrictions on the limited partnership investment.
• The group trust investment is a unitized fund classified within Level 2 of the fair value hierarchy because the fair value is estimated using the naV per unit based on vendor-quoted pricing for which inputs are observable. There are currently no redemption restrictions on the group trust investment.
• The unallocated insurance contract is valued at contract value, which approximates fair value; therefore, this contract is classified within Level 3 of the fair value hierarchy. The unallocated insurance contract fair value was $0.1 million as of both february 2, 2013 and January 28, 2012.
The fair values of the Company’s pension plan assets at february 2, 2013 by asset category are as follows: Fair Value Measurements at February 2, 2013 ($ thousands) Total Level 1 Level 2 Level 3 Asset money market funds. . . . . . . . . . . . . . . . . . . . . . . . . . . . . . $ 4,729 $ 4,729 $ – $ – U.S. government securities . . . . . . . . . . . . . . . . . . . . . . . . . . 59,342 59,342 – – mutual fund. . . . . . . . . . . . . . . . . . . . . . . . . . . . . . . . . . . 75,168 75,168 – – Limited partnership . . . . . . . . . . . . . . . . . . . . . . . . . . . . . . 35,982 – 35,982 – real estate investment trusts . . . . . . . . . . . . . . . . . . . . . . . . . 3,239 3,239 – – Corporate debt instruments . . . . . . . . . . . . . . . . . . . . . . . . . 28,357 – 28,357 – Corporate stocks – common . . . . . . . . . . . . . . . . . . . . . . . . . 136,275 136,275 – – S&p 500 index options . . . . . . . . . . . . . . . . . . . . . . . . . . . . (2,495) (2,495) – – interest rate swap agreements . . . . . . . . . . . . . . . . . . . . . . . . (4,258) – (4,258) – Unallocated insurance contract. . . . . . . . . . . . . . . . . . . . . . . . 106 – – 106 Total . . . . . . . . . . . . . . . . . . . . . . . . . . . . . . . . . . . . . . . $ 336,445 $ 276,258 $ 60,081 $ 106 The fair values of the Company’s pension plan assets at January 28, 2012 by asset category are as follows: fair Value measurements at January 28, 2012 ($ thousands) Total Level 1 Level 2 Level 3 Asset money market funds. . . . . . . . . . . . . . . . . . . . . . . . . . . . . . $ 4,723 $ 4,723 $ – $ – U.S. government securities . . . . . . . . . . . . . . . . . . . . . . . . . . 68,667 68,667 – – mutual fund. . . . . . . . . . . . . . . . . . . . . . . . . . . . . . . . . . . 11,078 11,078 – – Limited partnership . . . . . . . . . . . . . . . . . . . . . . . . . . . . . . 31,461 – 31,461 – Group trust . . . . . . . . . . . . . . . . . . . . . . . . . . . . . . . . . . . 7,306 – 7,306 – real estate investment trusts . . . . . . . . . . . . . . . . . . . . . . . . . 2,047 2,047 – – Corporate debt instruments . . . . . . . . . . . . . . . . . . . . . . . . . 68,240 – 68,240 – Corporate stocks – common . . . . . . . . . . . . . . . . . . . . . . . . . 1 12,795 112,795 – – S&p 500 index options . . . . . . . . . . . . . . . . . . . . . . . . . . . . 1,472 1,472 – – interest rate swap agreements . . . . . . . . . . . . . . . . . . . . . . . . 13,406 – 13,406 – Unallocated insurance contract. . . . . . . . . . . . . . . . . . . . . . . . 104 – – 104 Total . . . . . . . . . . . . . . . . . . . . . . . . . . . . . . . . . . . . . . . $ 321,299 $ 200,782 $ 120,413 $ 104 The following table sets forth changes in the fair value of plan assets, including all domestic and Canadian plans: pension Benefits other postretirement Benefits ($ thousands) 2012 2011 2012 2011 fair value of plan assets at beginning of year . . . . . . . . . . . . . . . . $ 321,299 $265,848 $ – $ –actual return on plan assets . . . . . . . . . . . . . . . . . . . . . . . . . . 26,167 66,527 – –employer contributions . . . . . . . . . . . . . . . . . . . . . . . . . . . . 413 7,523 190 236 plan participants’ contributions . . . . . . . . . . . . . . . . . . . . . . . . 12 11 13 17 Benefits paid . . . . . . . . . . . . . . . . . . . . . . . . . . . . . . . . . . (11,464) (18,590) (203) (253)foreign exchange rate changes . . . . . . . . . . . . . . . . . . . . . . . . 18 (20) – – fair value of plan assets at end of year. . . . . . . . . . . . . . . . . . . . $ 336,445 $ 321,299 $ – $ –
The majority of employer contributions for 2011 related to payments due under our Serp. employer contributions and benefits paid in the above table include both those amounts contributed directly to and paid directly from plan assets and those amounts paid directly to plan participants.

2012 Brown Shoe Company, inC. form 10-k 61
Funded StatusThe over-funded status as of february 2, 2013 and January 28, 2012, for pension benefits was $45.9 million and $59.8 million, respectively. The under-funded status as of february 2, 2013 and January 28, 2012, for other postretirement benefits was $3.2 million and $3.5 million, respectively.
amounts recognized in the consolidated balance sheets consist of: pension Benefits other postretirement Benefits ($ thousands) 2012 2011 2012 2011 prepaid pension costs (noncurrent asset) . . . . . . . . . . . . . . . . . . . . $ 54,532 $ 68,054 $ – $ –accrued benefit liabilities (current liability) . . . . . . . . . . . . . . . . . . . (1,191) (226) (311) (322)accrued benefit liabilities (noncurrent liability) . . . . . . . . . . . . . . . . . (7,430) (7,988) (2,896) (3,163) net amount recognized at end of year . . . . . . . . . . . . . . . . . . . . . . $ 45,911 $ 59,840 $ (3,207) $ (3,485)
The projected benefit obligation, the accumulated benefit obligation and the fair value of plan assets for pension plans with a projected benefit obligation in excess of plan assets and for pension plans with an accumulated benefit obligation in excess of plan assets, which includes only the Company’s Serp, were as follows: projected Benefit accumulated Benefit obligation exceeds obligation exceeds the fair Value of plan assets the fair Value of plan assets ($ thousands) 2012 2011 2012 2011 End of yearprojected benefit obligation . . . . . . . . . . . . . . . . . . . . . . . . . . . . $ 8,393 $ 7,997 $ 8,393 $ 7,997 accumulated benefit obligation. . . . . . . . . . . . . . . . . . . . . . . . . . 6,872 6,208 6,872 6,208 fair value of plan assets . . . . . . . . . . . . . . . . . . . . . . . . . . . . . . − − − −
The accumulated postretirement benefit obligation exceeds assets for all of the Company’s other postretirement benefit plans.
The amounts in accumulated other comprehensive loss (income) that have not yet been recognized as components of net periodic benefit (income) cost at february 2, 2013 and January 28, 2012, and the expected amortization of the february 2, 2013 amounts as components of net periodic benefit (income) cost for the year ended february 1, 2014, are as follows: pension Benefits other postretirement Benefits ($ thousands) 2012 2011 2012 2011 Components of accumulated other comprehensive comprehensive loss (income), net of tax: net actuarial loss (gain) . . . . . . . . . . . . . . . . . . . . . . . . . . . . $ 6,475 $ (2,658) $ (587) $ (492) net prior service cost . . . . . . . . . . . . . . . . . . . . . . . . . . . . . . 59 67 − − net transition asset . . . . . . . . . . . . . . . . . . . . . . . . . . . . . . . − (31) − − $ 6,534 $ (2,622) $ (587) $ (492)
pension Benefits other postretirement Benefits ($ thousands) 2013 2013 Expected amortization, net of tax: amortization of net actuarial losses. . . . . . . . . . . . . . . . . . . . . . $539 $49 amortization of net prior service cost . . . . . . . . . . . . . . . . . . . . 8 − amortization of net transition asset . . . . . . . . . . . . . . . . . . . . . . – − $547 $49
Net periodic benefit Costnet periodic benefit (income) cost for 2012, 2011 and 2010 for all domestic and Canadian plans included the following components: pension Benefits other postretirement Benefits ($ thousands) 2012 2011 2010 2012 2011 2010 Service cost . . . . . . . . . . . . . . . . . . . . . . . . . . . . . $ 11,523 $ 9,256 $ 7,826 $ – $ – $ –interest cost . . . . . . . . . . . . . . . . . . . . . . . . . . . . . 12,727 12,533 12,102 148 176 186 expected return on assets . . . . . . . . . . . . . . . . . . . . . (25,073) (20,741) (20,183) – – –amortization of: actuarial loss (gain) . . . . . . . . . . . . . . . . . . . . . . 204 400 172 (82) (99) (112) prior service cost. . . . . . . . . . . . . . . . . . . . . . . . 13 (8) (8) – – – net transition asset . . . . . . . . . . . . . . . . . . . . . . (43) (47) (46) – – – Settlement cost . . . . . . . . . . . . . . . . . . . . . . . . . . . – 2,100 878 – – – Total net periodic benefit (income) cost . . . . . . . . . . . . . $ (649) $ 3,493 $ 741 $ 66 $ 77 $ 74
weighted-average assumptions used to determine net (income) cost: pension Benefits other postretirement Benefits 2012 2011 2010 2012 2011 2010 Discount rate . . . . . . . . . . . . . . . . . . . . . . . . . . . . 4.75% 5.75% 6.00% 4.75% 5.75% 6.00% rate of compensation increase . . . . . . . . . . . . . . . . . . 3.50% 4.00% 4.25% N/A n/a n/a expected return on plan assets . . . . . . . . . . . . . . . . . . 8.25% 8.50% 8.50% N/A n/a n/a

62 2012 Brown Shoe Company, inC. form 10-k
The prior service cost is amortized on a straight-line basis over the average future service of active plan participants benefiting under the plan at the time of each plan amendment. The net actuarial loss (gain) subject to amortization is amortized on a straight-line basis over the average future service of active plan participants as of the measurement date. The net transition asset is amortized over the estimated service life.
The expected long-term rate of return on plan assets is based on historical and projected rates of return for current and planned asset classes in the plan’s investment portfolio. assumed projected rates of return for each asset class were selected after analyzing experience and future expectations of the returns. The overall expected rate of return for the portfolio was developed based on the target allocation for each asset class.
Expected Cash Flowsinformation about expected cash flows for all pension and postretirement benefit plans follows:
pension Benefits other postretirement ($ thousands) funded plans Serp Total Benefits Employer Contributions2013 expected contributions to plan trusts . . . . . . . . . . . . . . . . . . . . $ 1,819 $ – $ 1 ,819 $ –2013 expected contributions to plan participants . . . . . . . . . . . . . . . . . – 1 ,191 1 ,191 311 Expected benefit payments2013 . . . . . . . . . . . . . . . . . . . . . . . . . . . . . . . . . . . . . . . . . . $ 10,076 $ 1 ,191 $ 1 1 ,267 $ 311 2014 . . . . . . . . . . . . . . . . . . . . . . . . . . . . . . . . . . . . . . . . . . 10,610 1 12 10,722 295 2015 . . . . . . . . . . . . . . . . . . . . . . . . . . . . . . . . . . . . . . . . . . 1 1 ,124 2,489 13 ,613 278 2016 . . . . . . . . . . . . . . . . . . . . . . . . . . . . . . . . . . . . . . . . . . 1 1 ,7 11 88 1 1 ,799 260 2017 . . . . . . . . . . . . . . . . . . . . . . . . . . . . . . . . . . . . . . . . . . 12,294 2,998 15,292 242 2018 – 2022 . . . . . . . . . . . . . . . . . . . . . . . . . . . . . . . . . . . . . . 71,688 2,167 73,855 915
Defined-Contribution plansThe Company’s domestic defined-contribution 401(k) plan covers salaried and certain hourly employees. Company contributions represent a partial matching of employee contributions, generally up to a maximum of 3.5% of the employee’s salary and bonus. The Company’s expense for this plan was $3.4 million, $4.1 million and $3.0 million in 2012, 2011 and 2010, respectively.
The Company’s Canadian defined contribution plan covers certain salaried and hourly employees. The Company makes contributions for all eligible employees, ranging from 3% to 5% of the employee’s salary. in addition, eligible employees may voluntarily contribute to the plan. The Company’s expense for this plan was $0.3 million in 2012, 2011 and 2010.
Deferred Compensation planin 2007, the Company established a non-qualified deferred compensation plan (the “Deferred Compensation plan”) for the benefit of certain management employees. The investment funds offered to the participants generally correspond to the funds offered in the Company’s 401(k) plan, and the account balance fluctuates with the investment returns on those funds. The Deferred Compensation plan permits the deferral of up to 50% of base salary and 100% of compensation received under the Company’s annual incentive plan. The deferrals are held in a separate trust, which has been established by the Company to administer the Deferred Compensation plan. The assets of the trust are subject to the claims of the Company’s creditors in the event that the Company becomes insolvent. Consequently, the trust qualifies as a grantor trust for income tax purposes (i.e., a “rabbi Trust”). The liabilities of the Deferred Compensation plan of $1.4 million and $1.1 million as of february 2, 2013 and January 28, 2012, respectively, are presented in employee compensation and benefits in the accompanying consolidated balance sheets. The assets held by the trust of $1.4 million as of february 2, 2013 and $1.1 million as of January 28, 2012 are classified as trading securities within prepaid expenses and other current assets in the accompanying consolidated balance sheets, with changes in the deferred compensation charged to selling and administrative expenses in the accompanying consolidated statements of earnings.
Deferred Compensation plan for Non-Employee Directors non-employee directors are eligible to participate in a deferred compensation plan, whereby deferred compensation amounts are valued as if invested in the Company’s common stock through the use of phantom stock units (“pSUs”). Under the plan, each participating director’s account is credited with the number of pSUs equal to the number of shares of the Company’s common stock that the participant could purchase or receive with the amount of the deferred compensation, based upon the fair value (as determined based on the average of the high and low prices) of the Company’s common stock on the last trading day of the fiscal quarter when the cash compensation was earned. Dividend equivalents are paid on pSUs at the same rate as dividends on the Company’s common stock and are re-invested in additional pSUs at the next fiscal quarter-end. The pSUs are payable in cash based on the number of pSUs credited to the participating director’s account, valued on the basis of the fair value at fiscal quarter-end on or following termination of the director’s service. The liabilities of the plan of $1.1 million as of february 2, 2013 and $0.6 million as of January 28, 2012, are based on 66,394 and 63,936 outstanding pSUs, respectively, and are presented in other liabilities in the accompanying consolidated balance sheets. Gains and losses resulting from changes in the fair value of the pSUs are charged to selling and administrative expenses in the accompanying consolidated statements of earnings.

2012 Brown Shoe Company, inC. form 10-k 63
6. INCOME TAXES
The components of earnings before income taxes from continuing operations consisted of domestic earnings (loss) before income taxes from continuing operations of $10.5 million, $(11.1) million and $23.8 million in 2012, 2011 and 2010, respectively, and foreign earnings before income taxes from continuing operations of $28.0 million, $20.2 million and $29.4 million in 2012, 2011 and 2010, respectively. in addition to the income tax expense associated with continuing operations, we also recorded income tax expense associated with net earnings from discontinued operations of $8.0 million in 2011. The Company did not record net earnings from discontinued operations in 2012 or 2010.
The components of income tax provision on earnings from continuing operations were as follows:
($ thousands) 2012 2011 2010
Federal Current . . . . . . . . . . . . . . . . . . . . . . . . . . . . . . . . . . . . . . . . . . . . . . . . . $ (1,275) $ (2,528) $ (3,001) Deferred . . . . . . . . . . . . . . . . . . . . . . . . . . . . . . . . . . . . . . . . . . . . . . . . 5,578 319 13,209 4,303 (2,209) 10,208 State Current . . . . . . . . . . . . . . . . . . . . . . . . . . . . . . . . . . . . . . . . . . . . . . . . . 591 (588) 885 Deferred . . . . . . . . . . . . . . . . . . . . . . . . . . . . . . . . . . . . . . . . . . . . . . . . 1,858 137 2,285 2,449 (451) 3,170 Foreign . . . . . . . . . . . . . . . . . . . . . . . . . . . . . . . . . . . . . . . . . . . . . . . . . . . 4,591 2,986 2,782 Total income tax provision . . . . . . . . . . . . . . . . . . . . . . . . . . . . . . . . . . . . . . $ 11,343 $ 326 $ 16,160
The Company made federal, state and foreign tax payments, net of refunds, of $5.7 million in 2012. The Company received federal, state and foreign tax refunds, net of payments, of $5.7 million and $4.6 million in 2011 and 2010, respectively.
The differences between the tax provision reflected in the consolidated financial statements and the amounts calculated at the federal statutory income tax rate of 35% were as follows:
($ thousands) 2012 2011 2010
income taxes at statutory rate . . . . . . . . . . . . . . . . . . . . . . . . . . . . . . . . . . . . . . $ 13,491 $ 3,168 $ 18,627 State income taxes, net of federal tax benefit . . . . . . . . . . . . . . . . . . . . . . . . . . . . . . 1,592 (293) 2,061 Tax impact of nondeductible stock option expense . . . . . . . . . . . . . . . . . . . . . . . . . . 16 76 285 foreign earnings taxed at lower rates . . . . . . . . . . . . . . . . . . . . . . . . . . . . . . . . . . (5,206) (4,090) (6,504)other. . . . . . . . . . . . . . . . . . . . . . . . . . . . . . . . . . . . . . . . . . . . . . . . . . . . . 1,450 1,465 1,691 Total income tax provision . . . . . . . . . . . . . . . . . . . . . . . . . . . . . . . . . . . . . . . . $ 11,343 $ 326 $ 16,160
The other category of income tax provision principally represents the impact of expenses that are not deductible for federal income tax purposes.
Significant components of the Company’s deferred income tax assets and liabilities were as follows:
($ thousands) February 2, 2013 January 28, 2012
Deferred Tax Assetsemployee benefits, compensation and insurance . . . . . . . . . . . . . . . . . . . . . . . . . . . . . . . . . . . . $ 12,913 $ 18,096 accrued expenses . . . . . . . . . . . . . . . . . . . . . . . . . . . . . . . . . . . . . . . . . . . . . . . . . . . . . 17,788 10,207 postretirement and postemployment benefit plans. . . . . . . . . . . . . . . . . . . . . . . . . . . . . . . . . . . 1,753 2,088 Deferred rent . . . . . . . . . . . . . . . . . . . . . . . . . . . . . . . . . . . . . . . . . . . . . . . . . . . . . . . . 381 2,411 accounts receivable reserves . . . . . . . . . . . . . . . . . . . . . . . . . . . . . . . . . . . . . . . . . . . . . . . 8,136 5,584 net operating loss (“noL”) carryforward/carryback . . . . . . . . . . . . . . . . . . . . . . . . . . . . . . . . . . 29,355 30,113 inventory capitalization and inventory reserves . . . . . . . . . . . . . . . . . . . . . . . . . . . . . . . . . . . . . 3,692 4,033 other. . . . . . . . . . . . . . . . . . . . . . . . . . . . . . . . . . . . . . . . . . . . . . . . . . . . . . . . . . . . . 12,956 7,394 Total deferred tax assets, before valuation allowance . . . . . . . . . . . . . . . . . . . . . . . . . . . . . . . . . 86,974 79,926 Valuation allowance . . . . . . . . . . . . . . . . . . . . . . . . . . . . . . . . . . . . . . . . . . . . . . . . . . . . (8,476) (6,946) Total deferred tax assets, net of valuation allowance . . . . . . . . . . . . . . . . . . . . . . . . . . . . . . . . . . 78,498 72,980
Deferred Tax Liabilitiesretirement plans . . . . . . . . . . . . . . . . . . . . . . . . . . . . . . . . . . . . . . . . . . . . . . . . . . . . . . (16,496) (22,550)Lifo inventory valuation . . . . . . . . . . . . . . . . . . . . . . . . . . . . . . . . . . . . . . . . . . . . . . . . . . (42,914) (36,139)Capitalized software . . . . . . . . . . . . . . . . . . . . . . . . . . . . . . . . . . . . . . . . . . . . . . . . . . . . (18,433) (13,469)other. . . . . . . . . . . . . . . . . . . . . . . . . . . . . . . . . . . . . . . . . . . . . . . . . . . . . . . . . . . . . (1,949) (1,288)Depreciation . . . . . . . . . . . . . . . . . . . . . . . . . . . . . . . . . . . . . . . . . . . . . . . . . . . . . . . . (892) (1,874)intangible assets . . . . . . . . . . . . . . . . . . . . . . . . . . . . . . . . . . . . . . . . . . . . . . . . . . . . . . (10,963) (14,364)Total deferred tax liabilities . . . . . . . . . . . . . . . . . . . . . . . . . . . . . . . . . . . . . . . . . . . . . . . . (91,647) (89,684)net deferred tax liability . . . . . . . . . . . . . . . . . . . . . . . . . . . . . . . . . . . . . . . . . . . . . . . . . . $ (13,149) $ (16,704)

64 2012 Brown Shoe Company, inC. form 10-k
at the end of 2012, the Company had a net operating loss carryforward with a tax value of $1.8 million related to Shoes.com, which expires in 2019, and various state net operating loss carryforwards with tax values totaling $11.6 million. a valuation allowance of $6.7 million has been established related to these operating loss carryforwards. The Company also has valuation allowances of $0.5 million related to share-based compensation and $1.3 million related to foreign tax credits. The remaining net operating loss will be carried forward to future tax years.
as of february 2, 2013, no deferred taxes have been provided on the accumulated unremitted earnings of the Company’s foreign subsidiaries that are not subject to United States income tax. The Company periodically evaluates its foreign investment opportunities and plans, as well as its foreign working capital needs, to determine the level of investment required and, accordingly, determine the level of foreign earnings that is considered indefinitely reinvested. Based upon that evaluation, earnings of the Company’s foreign subsidiaries that are not otherwise subject to United States taxation, except for the Company’s Canadian subsidiary, are considered to be indefinitely reinvested, and accordingly, deferred taxes have not been provided. if changes occur in future investment opportunities and plans, those changes will be reflected when known and may result in providing residual United States deferred taxes on unremitted foreign earnings. if the Company’s unremitted foreign earnings were not considered indefinitely reinvested as of february 2, 2013, additional deferred taxes of approximately $29.5 million would have been provided.
Uncertain Tax positionsaSC 740, Income Taxes, establishes a single model to address accounting for uncertain tax positions. The standard clarifies the accounting for income taxes by prescribing a minimum recognition threshold a tax position is required to meet before being recognized in the financial statements. The standard also provides guidance on derecognition, measurement classification, interest and penalties, accounting in interim periods, disclosure and transition.
a reconciliation of the beginning and ending amount of unrecognized tax benefits is as follows: ($ thousands)
Balance at January 30, 2010. . . . . . . . . . . . . . . . . . . . . . . . . . . . . . . . . . . . . . . . . . . . . . . . . . . . . . . . . . . . . . . $ 1,373
additions for tax positions of prior years . . . . . . . . . . . . . . . . . . . . . . . . . . . . . . . . . . . . . . . . . . . . . . . . . . . . . . . 624 Settlements . . . . . . . . . . . . . . . . . . . . . . . . . . . . . . . . . . . . . . . . . . . . . . . . . . . . . . . . . . . . . . . . . . . . . . . . (887) reductions for tax positions of prior years due to a lapse in the statute of limitations . . . . . . . . . . . . . . . . . . . . . . . . . . . . . . (358) Balance at January 29, 2011 . . . . . . . . . . . . . . . . . . . . . . . . . . . . . . . . . . . . . . . . . . . . . . . . . . . . . . . . . . . . . . . $ 752
Settlements . . . . . . . . . . . . . . . . . . . . . . . . . . . . . . . . . . . . . . . . . . . . . . . . . . . . . . . . . . . . . . . . . . . . . . . . (206)reductions for tax positions of prior years due to a lapse in the statute of limitations . . . . . . . . . . . . . . . . . . . . . . . . . . . . . . (337) Balance at January 28, 2012 . . . . . . . . . . . . . . . . . . . . . . . . . . . . . . . . . . . . . . . . . . . . . . . . . . . . . . . . . . . . . . . $ 209
additions for tax positions of prior years . . . . . . . . . . . . . . . . . . . . . . . . . . . . . . . . . . . . . . . . . . . . . . . . . . . . . . . 1,015 reductions for tax positions of prior years due to a lapse in the statue of limitations. . . . . . . . . . . . . . . . . . . . . . . . . . . . . . . (75) Balance at february 2, 2013 . . . . . . . . . . . . . . . . . . . . . . . . . . . . . . . . . . . . . . . . . . . . . . . . . . . . . . . . . . . . . . . $ 1,149
if the unrecognized tax benefits were to be recognized in full, the net amount that would be reflected in the income tax provision, thereby impacting the effective tax rate, would be $0.8 million at february 2, 2013, $0.2 million at January 28, 2012 and $0.7 million at January 29, 2011.
estimated interest related to the underpayment of income taxes was classified as a component of the income tax provision in the consolidated statements of earnings and was insignificant in 2012, 2011 and 2010. accrued interest was $0.1 million february 2, 2013 and $0.1 million at January 28, 2012.
for federal purposes, the Company’s tax years 2009 to 2011 (fiscal years ending January 30, 2010, January 29, 2011 and January 28, 2012) remain open to examination. The Company also files tax returns in various foreign jurisdictions and numerous states for which various tax years are subject to examination. The Company does not expect any significant changes to its liability for unrecognized tax benefits during the next 12 months.
7. bUSINESS SEGMENT INFORMATION
The Company’s reportable segments include famous footwear, wholesale operations, Specialty retail and other.
famous footwear, which represents the Company’s largest division, operated 1,055 stores at the end of 2012, primarily selling branded footwear for the entire family.
The wholesale operations segment sources and markets licensed, branded and private-label footwear primarily to national chains, department stores, independent retailers, mass merchandisers, online retailers and catalogs as well as Company-owned famous footwear and Specialty retail segments.
The Specialty retail segment included 106 stores in the United States, 90 stores in Canada and 26 stores in China at the end of 2012, selling primarily naturalizer brand footwear in regional malls and outlet centers as well as other e-commerce businesses.
The other segment includes corporate assets and administrative expenses and other costs and recoveries that are not allocated to the operating units.

2012 Brown Shoe Company, inC. form 10-k 65
The Company’s retail and wholesale reportable segments are operating units that market to different customers and are each managed separately. an operating segment’s performance is evaluated and resources are allocated based on operating earnings (loss). operating earnings (loss) represent gross profit, less selling and administrative expenses, restructuring and other special charges, net and impairment of intangible assets. The accounting policies of the reportable segments are the same as those described in note 1. intersegment sales are generally recorded at a profit to the selling segment. all intersegment earnings related to inventory on hand at the purchasing segment are eliminated against the earnings of the selling segment. famous wholesale Specialty($ thousands) footwear operations retail other Total Fiscal 2012external sales . . . . . . . . . . . . . . . . . . . . . . . . . . . . $ 1,514,349 $ 845,176 $ 238,540 $ − $ 2,598,065 intersegment sales . . . . . . . . . . . . . . . . . . . . . . . . . 2,311 229,206 − − 231,517 Depreciation and amortization . . . . . . . . . . . . . . . . . . 22,819 13,688 2,991 17,846 57,344 operating earnings (loss) . . . . . . . . . . . . . . . . . . . . . 94,096 17,581 (8,850) (41,220) 61,607 operating segment assets . . . . . . . . . . . . . . . . . . . . . 472,180 506,523 59,475 133,081 1,171,259 purchases of property and equipment . . . . . . . . . . . . . . 34,931 8,969 6,716 5,185 55,801 Capitalized software . . . . . . . . . . . . . . . . . . . . . . . . − 3 − 7,925 7,928
Fiscal 2011external sales . . . . . . . . . . . . . . . . . . . . . . . . . . . . $ 1,456,314 $ 870,873 $ 255,637 $ − $ 2,582,824 intersegment sales . . . . . . . . . . . . . . . . . . . . . . . . . 2,156 211,631 − − 213,787 Depreciation and amortization . . . . . . . . . . . . . . . . . . 26,116 15,521 3,517 16,295 61,449 operating earnings (loss) . . . . . . . . . . . . . . . . . . . . . 62,515 16,739 (7,627) (36,077) 35,550 operating segment assets . . . . . . . . . . . . . . . . . . . . . 435,344 595,355 56,151 140,626 1,227,476 purchases of property and equipment . . . . . . . . . . . . . . 16,272 5,991 3,901 1,693 27,857 Capitalized software . . . . . . . . . . . . . . . . . . . . . . . . 273 15 − 10,419 10,707
Fiscal 2010external sales . . . . . . . . . . . . . . . . . . . . . . . . . . . . $ 1,486,538 $ 754,389 $ 263,164 $ − $ 2,504,091 intersegment sales . . . . . . . . . . . . . . . . . . . . . . . . . 1,939 192,157 − − 194,096 Depreciation and amortization . . . . . . . . . . . . . . . . . . 26,017 9,410 3,852 13,238 52,517 operating earnings (loss) . . . . . . . . . . . . . . . . . . . . . 90,419 32,227 (5,970) (44,012) 72,664 operating segment assets . . . . . . . . . . . . . . . . . . . . . 473,098 401,700 56,941 216,304 1,148,043 purchases of property and equipment . . . . . . . . . . . . . . 22,066 2,619 2,730 3,366 30,781 Capitalized software . . . . . . . . . . . . . . . . . . . . . . . . 253 − − 23,793 24,046
following is a reconciliation of operating earnings to earnings before income taxes from continuing operations:
($ thousands) 2012 2011 2010
operating earnings . . . . . . . . . . . . . . . . . . . . . . . . . . . . . . . . . . . . . . . . . . . . . $ 61,607 $ 35,550 $ 72,664 interest expense . . . . . . . . . . . . . . . . . . . . . . . . . . . . . . . . . . . . . . . . . . . . . . (23,382) (26,141) (19,647)Loss on early extinguishment of debt . . . . . . . . . . . . . . . . . . . . . . . . . . . . . . . . . . − (1,003) − interest income . . . . . . . . . . . . . . . . . . . . . . . . . . . . . . . . . . . . . . . . . . . . . . . 322 644 203 earnings before income taxes from continuing operations. . . . . . . . . . . . . . . . . . . . . . . $ 38,547 $ 9,050 $ 53,220
in 2012, the impact of restructuring and other special charges, net, included in operating earnings was as follows:• Wholesale – $8.6 million of charges related to the Company’s portfolio realignment and $0.7 million related to
integration costs of aSG. • Famous Footwear – $7.8 million of charges related to the Company’s portfolio realignment initiatives.• Specialty Retail – $3.7 million of charges related to the Company’s portfolio realignment initiatives.• Other – $2.3 million of charges related to the organizational change at the Company’s corporate headquarters
and $0.9 million of charges related to the Company’s portfolio realignment initiatives.
in 2011, the impact of restructuring and other special charges, net, included in operating earnings was as follows:• Wholesale – $10.5 million of charges related to the Company’s portfolio realignment and $2.5 million related to
integration costs of aSG. • Other – $4.0 million of charges related to the Company’s acquisition and integration costs of ASG and $3.3 million
of charges related to portfolio realignment initiatives.• Famous Footwear – $2.8 million of charges related to the Company’s portfolio realignment initiatives.• Specialty Retail – $0.6 million of charges related to the Company’s portfolio realignment initiatives.
in 2010, the impact of restructuring and other special charges, net, included in operating earnings was as follows:• Other – $6.1 million of charges related to the Company’s information technology initiatives and $1.1 million of
charges related to the acquisition of aSG.• Wholesale Operations – $0.7 million of charges related to the Company’s information technology initiatives.
for geographic purposes, the domestic operations include the wholesale distribution of licensed, branded and private-label footwear to a variety of retail customers, including the Company’s famous footwear and Specialty retail stores and e-commerce business.

66 2012 Brown Shoe Company, inC. form 10-k
The Company’s foreign operations primarily consist of wholesale operations in the far east and retail operations in Canada, China and Guam. The far east operations include the manufacture of footwear at facilities owned by the Company and first-cost transactions, where footwear is sold at foreign ports to customers who then import the footwear into the United States and other countries.
a summary of the Company’s net sales and long-lived assets by geographic area were as follows:
($ thousands) 2012 2011 2010
Net SalesUnited States . . . . . . . . . . . . . . . . . . . . . . . . . . . . . . . . . . . . . . . . . . . . . . $ 2,295,739 $ 2,259,907 $ 2,179,658 far east . . . . . . . . . . . . . . . . . . . . . . . . . . . . . . . . . . . . . . . . . . . . . . . . . 233,843 215,263 217,346 Canada . . . . . . . . . . . . . . . . . . . . . . . . . . . . . . . . . . . . . . . . . . . . . . . . . 68,483 107,654 107,087 Total net sales. . . . . . . . . . . . . . . . . . . . . . . . . . . . . . . . . . . . . . . . . . . . . . $ 2,598,065 $ 2,582,824 $ 2,504,091
Long-Lived AssetsUnited States . . . . . . . . . . . . . . . . . . . . . . . . . . . . . . . . . . . . . . . . . . . . . . $ 381,459 $ 396,412 $ 331,092 far east . . . . . . . . . . . . . . . . . . . . . . . . . . . . . . . . . . . . . . . . . . . . . . . . . 9,478 10,632 3,749 Canada . . . . . . . . . . . . . . . . . . . . . . . . . . . . . . . . . . . . . . . . . . . . . . . . . 7,824 5,223 4,888 Latin america, europe and other . . . . . . . . . . . . . . . . . . . . . . . . . . . . . . . . . . . 70 71 33 Total long-lived assets . . . . . . . . . . . . . . . . . . . . . . . . . . . . . . . . . . . . . . . . . $ 398,831 $ 412,338 $ 339,762
Long-lived assets consisted primarily of property and equipment, intangible assets, prepaid pension costs, goodwill and other noncurrent assets.
8. pROpERTy AND EQUIpMENT
property and equipment consisted of the following: ($ thousands) February 2, 2013 January 28, 2012
Land and buildings . . . . . . . . . . . . . . . . . . . . . . . . . . . . . . . . . . . . . . . . . . . . . . . . . . . . $ 40,774 $ 42,049 Leasehold improvements . . . . . . . . . . . . . . . . . . . . . . . . . . . . . . . . . . . . . . . . . . . . . . . . 172,635 170,824 Technology equipment. . . . . . . . . . . . . . . . . . . . . . . . . . . . . . . . . . . . . . . . . . . . . . . . . . 48,448 47,371 machinery and equipment . . . . . . . . . . . . . . . . . . . . . . . . . . . . . . . . . . . . . . . . . . . . . . . . 54,871 64,085 furniture and fixtures . . . . . . . . . . . . . . . . . . . . . . . . . . . . . . . . . . . . . . . . . . . . . . . . . . 108,622 107,320 Construction in progress . . . . . . . . . . . . . . . . . . . . . . . . . . . . . . . . . . . . . . . . . . . . . . . . . 16,542 5,034 property and equipment. . . . . . . . . . . . . . . . . . . . . . . . . . . . . . . . . . . . . . . . . . . . . . . . . 441,892 436,683 allowances for depreciation . . . . . . . . . . . . . . . . . . . . . . . . . . . . . . . . . . . . . . . . . . . . . . . (295,803) (305,212) property and equipment, net . . . . . . . . . . . . . . . . . . . . . . . . . . . . . . . . . . . . . . . . . . . . . . $ 146,089 $ 131,471
Useful lives of property and equipment are as follows: Buildings. . . . . . . . . . . . . . . . . . . . . . . . . . . . . . . . . . . . . . . . . . . . . . . . . . . . . . . . . . . . . . . . . . . . . . . 15-30 yearsLeasehold improvements . . . . . . . . . . . . . . . . . . . . . . . . . . . . . . . . . . . . . . . . . . . . . . . . . . . . . . . . . . . . . 5-20 yearsTechnology equipment. . . . . . . . . . . . . . . . . . . . . . . . . . . . . . . . . . . . . . . . . . . . . . . . . . . . . . . . . . . . . . . 3-10 yearsmachinery and equipment . . . . . . . . . . . . . . . . . . . . . . . . . . . . . . . . . . . . . . . . . . . . . . . . . . . . . . . . . . . . . 8-20 yearsfurniture and fixtures . . . . . . . . . . . . . . . . . . . . . . . . . . . . . . . . . . . . . . . . . . . . . . . . . . . . . . . . . . . . . . . 3-10 years
The Company recorded charges for impairment, primarily for leasehold improvements and furniture and fixtures in the Company’s retail stores, of $4.1 million, $1.9 million and $2.8 million in 2012, 2011 and 2010, respectively. of the $4.1 million impairment charges in 2012, $3.6 million is included in restructuring and other special charges, net, and $0.5 million is included in selling and administrative expenses. all of the charges in 2011 and 2010 are included in selling and administrative expenses. fair value was based on estimated future cash flows to be generated by retail stores, discounted at a market rate of interest. 9. GOODWILL AND INTANGIbLE ASSETS
Goodwill and intangible assets were as follows: ($ thousands) February 2, 2013 January 28, 2012
Intangible Assets famous footwear . . . . . . . . . . . . . . . . . . . . . . . . . . . . . . . . . . . . . . . . . . . . . . . . . . . . . $ 2,800 $ 2,800 wholesale operations . . . . . . . . . . . . . . . . . . . . . . . . . . . . . . . . . . . . . . . . . . . . . . . . . . . 147,003 155,003 Specialty retail. . . . . . . . . . . . . . . . . . . . . . . . . . . . . . . . . . . . . . . . . . . . . . . . . . . . . . . 200 200 Total intangible assets . . . . . . . . . . . . . . . . . . . . . . . . . . . . . . . . . . . . . . . . . . . . . . . . . . . . . 150,003 158,003 accumulated amortization. . . . . . . . . . . . . . . . . . . . . . . . . . . . . . . . . . . . . . . . . . . . . . . . . . . (56,979) (57,017)Total intangible assets, net . . . . . . . . . . . . . . . . . . . . . . . . . . . . . . . . . . . . . . . . . . . . . . . . . . 93,024 100,986 Goodwill wholesale operations . . . . . . . . . . . . . . . . . . . . . . . . . . . . . . . . . . . . . . . . . . . . . . . . . . . 39,604 39,604 Total Goodwill. . . . . . . . . . . . . . . . . . . . . . . . . . . . . . . . . . . . . . . . . . . . . . . . . . . . . . . . . . 39,604 39,604 Goodwill and intangible assets, net. . . . . . . . . . . . . . . . . . . . . . . . . . . . . . . . . . . . . . . . . . . . . . $ 132,628 $ 140,590

2012 Brown Shoe Company, inC. form 10-k 67
intangible assets of $42.5 million as of february 2, 2013 and January 28, 2012 are not subject to amortization. all remaining intangible assets are subject to amortization and have useful lives ranging from four to 20 years. amortization expense related to intangible assets was $7.2 million, $8.3 million and $6.7 million in 2012, 2011 and 2010, respectively. The Company estimates the following amortization expense related to intangible assets: $6.9 million in 2013 and 2014 and $6.0 million in 2015, 2016 and 2017.
During 2012, the Company terminated the etienne aigner license agreement, due to a dispute with the licensor and recognized an impairment charge of $5.8 million, to reduce the remaining unamortized value of the licensed trademark intangible asset to zero. also during 2012, the Company acquired a trademark for $5.0 million. The trademark is being amortized over a 15 year useful life. The decrease in intangible assets of the wholesale operations segment from January 28, 2012 to february 2, 2013 is primarily related to the impairment of the etienne aigner licensed trademark and amortization, partially offset by the acquisition of a trademark.
as a result of its annual impairment testing, the Company did not record any other impairment charges during 2012 and 2011 related to intangible assets.
Goodwill is tested for impairment at least annually, or more frequently if events or circumstances indicate it might be impaired. a fair-value-based test is applied at the reporting unit level and compares the fair value of the reporting unit, with attributable goodwill, to the carrying value of such reporting unit. This test requires various judgments and estimates. The fair value of goodwill is determined using an estimate of future cash flows of the reporting unit and a risk-adjusted discount rate to compute a net present value of future cash flows. an adjustment will be recorded for any goodwill that is determined to be impaired. impairment of goodwill is measured as the excess of the carrying amount of goodwill over the fair values of recognized and unrecognized assets and liabilities of the reporting unit. The Company performed a goodwill impairment test as of the first day of the Company’s fourth fiscal quarter, resulting in no impairment charges.
10. LONG-TERM AND SHORT-TERM FINANCING ARRANGEMENTS
Credit Agreementon January 7, 2011, the Company and certain of its subsidiaries (the “Loan parties”) entered into a Third amended and restated Credit agreement (“former Credit agreement”), which was further amended on february 17, 2011 (as so amended, the “Credit agreement”). The Credit agreement matures on January 7, 2016 and provides for a revolving credit facility in an aggregate amount of up to $530.0 million (effective february 17, 2011), subject to the calculated borrowing base restrictions, and provides for an increase at the Company’s option by up to $150.0 million from time to time during the term of the Credit agreement (the “general purpose accordion feature”) subject to satisfaction of certain conditions and the willingness of existing or new lenders to assume the increase.
on february 17, 2011, aSG and TBmC, the sole domestic subsidiary of aSG, became borrowers under the Credit agreement. in conjunction with the sale of TBmC on october 25, 2011, TBmC ceased to be a borrower under the Credit agreement. See note 2 to the consolidated financial statements for further information on the acquisition of aSG and the subsequent sale of TBmC.
Borrowing availability under the Credit agreement is limited to the lesser of the total commitments and the borrowing base, which is based on stated percentages of the sum of eligible accounts receivable and inventory, as defined, less applicable reserves. Under the Credit agreement, the Loan parties’ obligations are secured by a first-priority security interest in all accounts receivable, inventory and certain other collateral.
interest on borrowings is at variable rates based on the London inter-Bank offered rate (“LiBor”) or the prime rate, as defined in the Credit agreement, plus a spread. The interest rate and fees for letters of credit vary based upon the level of excess availability under the Credit agreement. There is an unused line fee payable on the unused portion under the facility and a letter of credit fee payable on the outstanding face amount under letters of credit. The Credit agreement limits the Company’s ability to incur additional indebtedness, create liens, make investments or specified payments, give guarantees, pay dividends, make capital expenditures and merge or acquire or sell assets. in addition, certain additional covenants would be triggered if excess availability were to fall below specified levels, including fixed charge coverage ratio requirements. furthermore, if excess availability falls below the greater of (i) 15.0% of the lesser of (x) the borrowing base or (y) the total commitments and (ii) $35.0 million for three consecutive business days, or an event of default occurs, the lenders may assume dominion and control over the Company’s cash (a “cash dominion event”) until such event of default is cured or waived or the excess availability exceeds such amount for 30 consecutive days. The Credit agreement contains customary events of default, including, without limitation, payment defaults, breaches of representations and warranties, covenant defaults, cross-defaults to other material indebtedness, certain events of bankruptcy and insolvency, judgment defaults in excess of a certain threshold, the failure of any guaranty or security document supporting the agreement to be in full force and effect and a change of control event. in addition, if the excess

68 2012 Brown Shoe Company, inC. form 10-k
availability falls below the greater of (i) 12.5% of the lesser of (x) the borrowing base or (y) the total commitments and (ii) $35.0 million, and the fixed charge coverage ratio is less than 1.0 to 1.0, the Company would be in default under the Credit agreement. The Credit agreement also contains certain other covenants and restrictions. The Company was in compliance with all covenants and restrictions under the Credit agreement as of february 2, 2013.
The maximum amount of borrowings under either the Credit agreement or former Credit agreement at the end of any month was $230.0 million in 2012 and $373.0 million in 2011. The average daily borrowings during the year were $141.2 million in 2012 and $257.2 million in 2011. The weighted-average interest rates approximated 2.8% in 2012 and 2.9% in 2011.
at february 2, 2013, the Company had $105.0 million in borrowings outstanding and $9.0 million in letters of credit outstanding under the Credit agreement. Total additional borrowing availability was $380.6 million at february 2, 2013.
$200 Million Senior Notes Due 2019on may 11, 2011, the Company closed on an offering (the “offering”) of $200.0 million aggregate principal amount of 7.125% Senior notes due 2019 (the “2019 Senior notes”). The Company used a portion of the net proceeds to call and redeem the outstanding 8.75% senior notes due in 2012 (the “2012 Senior notes”). The Company used the remaining net proceeds for general corporate purposes, including repaying amounts outstanding under the Credit agreement.
The 2019 Senior notes are guaranteed on a senior unsecured basis by each of the subsidiaries of the Company that is an obligor under the Credit agreement. interest on the 2019 Senior notes is payable on may 15 and november 15 of each year beginning on november 15, 2011. The 2019 Senior notes mature on may 15, 2019. prior to may 15, 2014, the Company may redeem some or all of the 2019 Senior notes at a redemption price equal to the sum of the principal amount of the 2019 Senior notes to be redeemed, plus accrued and unpaid interest, plus a “make whole” premium. after may 15, 2014, the Company may redeem all or a part of the 2019 Senior notes at the redemption prices (expressed as a percentage of principal) set forth below plus accrued and unpaid interest, if redeemed during the 12-month period beginning on may 15 of the years indicated below:
year percentage
2014 . . . . . . . . . . . . . . . . . . . . . . . . . . . . . . . . . . . . . . . . 105.344%2015 . . . . . . . . . . . . . . . . . . . . . . . . . . . . . . . . . . . . . . . . 103.563%2016 . . . . . . . . . . . . . . . . . . . . . . . . . . . . . . . . . . . . . . . . 101.781%2017 and thereafter. . . . . . . . . . . . . . . . . . . . . . . . . . . . . . . . 100.000%
in addition, prior to may 15, 2014, the Company may redeem up to 35% of the 2019 Senior notes with the proceeds from certain equity offerings at a redemption price of 107.125% of the principal amount of the 2019 Senior notes to be redeemed, plus accrued and unpaid interest thereon, if any, to the redemption date.
The 2019 Senior notes also contain certain other covenants and restrictions that limit certain activities, including, among other things, levels of indebtedness, payments of dividends, the guarantee or pledge of assets, certain investments, common stock repurchases, mergers and acquisitions and sales of assets. proceeds from the sale of TBmC were reinvested into our business as allowed by the 2019 Senior notes. as of february 2, 2013, the Company was in compliance with all covenants and restrictions relating to the 2019 Senior notes.
Cash payments of interest for these financing arrangements during 2012, 2011 and 2010 were $20.3 million, $23.2 million and $18.0 million, respectively.
Loss on Early Extinguishment of DebtDuring 2011, the Company completed a cash tender offer for the 2012 Senior notes and called for redemption and repaid the remaining notes that were not tendered. The Company incurred a loss on the early extinguishment of the 2012 Senior notes prior to maturity totaling $1.0 million, of which approximately $0.6 million was non-cash.
11. LEASES
The Company leases all of its retail locations and certain office locations, distribution centers and equipment. The minimum lease terms for the Company’s retail stores generally range from five to 10 years. approximately one-half of the retail store leases are subject to renewal options for varying periods. The term of the leases for office facilities and distribution centers averages approximately 15 years with renewal options of five to 20 years.
at the time its retail facilities are initially leased, the Company often receives consideration from landlords for a portion of the cost of leasehold improvements necessary to open the store, which are recorded as a deferred rent obligation upon receipt and amortized to income over the lease term as a reduction of rent expense. in addition to minimum rental payments, certain of the retail store leases require contingent payments based on sales levels. a majority of the Company’s retail operating leases contain provisions that allow it to modify amounts payable under the lease or terminate the lease in certain circumstances, such as experiencing actual sales volume below a defined threshold and/or co-tenancy provisions associated with the facility.

2012 Brown Shoe Company, inC. form 10-k 69
rent expense for operating leases was: ($ thousands) 2012 2011 2010
minimum rent . . . . . . . . . . . . . . . . . . . . . . . . . . . . . . . . . . . . . . . . . . . . . . $148,225 $153,417 $150,282 Contingent rent . . . . . . . . . . . . . . . . . . . . . . . . . . . . . . . . . . . . . . . . . . . . . 567 408 314 Sublease income . . . . . . . . . . . . . . . . . . . . . . . . . . . . . . . . . . . . . . . . . . . . (1,145) (1,121) (299) Total . . . . . . . . . . . . . . . . . . . . . . . . . . . . . . . . . . . . . . . . . . . . . . . . . . . $147,647 $152,704 $150,297
future minimum payments under noncancelable operating leases with an initial term of one year or more were as follows at february 2, 2013:($ thousands)
2013 . . . . . . . . . . . . . . . . . . . . . . . . . . . . . . . . . . $ 150,207 2014 . . . . . . . . . . . . . . . . . . . . . . . . . . . . . . . . . . 129,224 2015 . . . . . . . . . . . . . . . . . . . . . . . . . . . . . . . . . . 104,634 2016 . . . . . . . . . . . . . . . . . . . . . . . . . . . . . . . . . . 80,857 2017 . . . . . . . . . . . . . . . . . . . . . . . . . . . . . . . . . . 55,912 Thereafter . . . . . . . . . . . . . . . . . . . . . . . . . . . . . . . 133,701 Total minimum operating lease payments . . . . . . . . . . . . . $ 654,535
12. RISK MANAGEMENT AND DERIVATIVES
General Risk ManagementThe Company maintains cash and cash equivalents and certain other financial instruments with various financial institutions. The financial institutions are located throughout the world and the Company’s policy is designed to limit exposure to any one institution or geographic region. The Company’s periodic evaluations of the relative credit standing of these financial institutions are considered in the Company’s investment strategy.
The Company’s wholesale operations segment sells to national chains, department stores, independent retailers, mass merchandisers, online retailers and catalogs primarily in the United States, Canada and China. receivables arising from these sales are not collateralized; however, a portion is covered by documentary letters of credit. Credit risk is affected by conditions or occurrences within the economy and the retail industry. The Company maintains an allowance for doubtful accounts based upon factors surrounding the credit risk of specific customers and historical trends.
Derivativesin the normal course of business, the Company’s financial results are impacted by currency rate movements in foreign-currency-denominated assets, liabilities and cash flows as it makes a portion of its purchases and sales in local currencies. The Company has established policies and business practices that are intended to mitigate a portion of the effect of these exposures. The Company uses derivative financial instruments, primarily forward contracts, to manage its currency exposures. These derivative financial instruments are viewed as risk management tools and are not used for trading or speculative purposes. Derivatives entered into by the Company are designated as cash flow hedges of forecasted foreign currency transactions.
Derivative financial instruments expose the Company to credit and market risk. The market risk associated with these instruments resulting from currency exchange movements is expected to offset the market risk of the underlying transactions being hedged. The Company does not believe there is a significant risk of loss in the event of non-performance by the counterparties associated with these instruments because these transactions are executed with major international financial institutions and have varying maturities through January 2014. Credit risk is managed through the continuous monitoring of exposures to such counterparties.
The Company principally uses foreign currency forward contracts as cash flow hedges to offset a portion of the effects of exchange rate fluctuations. The Company’s cash flow exposures include anticipated foreign currency transactions, such as foreign currency denominated sales, costs, expenses, intercompany charges, as well as collections and payments. The Company performs a quarterly assessment of the effectiveness of the hedge relationship and measures and recognizes any hedge ineffectiveness in the consolidated statement of earnings. hedge ineffectiveness is evaluated using the hypothetical derivative method. The amount of hedge ineffectiveness for 2012, 2011 and 2010 was not material.
The Company’s hedging strategy uses forward contracts as cash flow hedging instruments, which are recorded in the Company’s consolidated balance sheets at fair value. The effective portion of gains and losses resulting from changes in the fair value of these hedge instruments are deferred in accumulated other comprehensive income and reclassified to earnings in the period that the hedged transaction is recognized in earnings.

70 2012 Brown Shoe Company, inC. form 10-k
as of february 2, 2013, the Company had forward contracts maturing at various dates through January 2014. The contract amount represents the net amount of all purchase and sale contracts of a foreign currency. Contract amount (U.S. $ equivalent in thousands) February 2, 2013 January 28, 2012
Financial InstrumentsU.S. dollars (purchased by the Company’s Canadian division with Canadian dollars) . . . . . . . . . . . . . . . . . $ 18,442 $ 19,002 Chinese yuan . . . . . . . . . . . . . . . . . . . . . . . . . . . . . . . . . . . . . . . . . . . . . . . . . . . . . . . . . 15,544 43,407 euro . . . . . . . . . . . . . . . . . . . . . . . . . . . . . . . . . . . . . . . . . . . . . . . . . . . . . . . . . . . . . . 3,459 7,293 Japanese yen . . . . . . . . . . . . . . . . . . . . . . . . . . . . . . . . . . . . . . . . . . . . . . . . . . . . . . . . . 1,665 1,365 new Taiwanese dollars . . . . . . . . . . . . . . . . . . . . . . . . . . . . . . . . . . . . . . . . . . . . . . . . . . . . 734 830 Great Britain pounds sterling . . . . . . . . . . . . . . . . . . . . . . . . . . . . . . . . . . . . . . . . . . . . . . . . 63 2,947 other currencies . . . . . . . . . . . . . . . . . . . . . . . . . . . . . . . . . . . . . . . . . . . . . . . . . . . . . . . 729 1,107 $ 40,636 $ 75,951 The classification and fair values of derivative instruments designated as hedging instruments included within the consolidated balance sheet as of february 2, 2013 and January 28, 2012 are as follows: asset Derivatives Liability Derivatives ($ in thousands) Balance Sheet Location fair Value Balance Sheet Location fair Value Foreign exchange forwards contracts:February 2, 2013 . . . . . . . . . . . . . . prepaid expenses and other current assets $380 Other accrued expenses $373January 28, 2012 . . . . . . . . . . . . . . prepaid expenses and other current assets $839 other accrued expenses $633 During 2012 and 2011, the effect of derivative instruments in cash flow hedging relationships on the consolidated statement of earnings was as follows: ($ in thousands) Fiscal year Ended 2012 fiscal year ended 2011
Gain (Loss) Gain (Loss) Gain (Loss) Gain (Loss)foreign exchange forward contracts: Recognized in Reclassified from recognized in reclassifiedincome Statement Classification OCI on Accumulated OCI oCi on from accumulatedGains (Losses) - realized Derivatives into Earnings Derivatives oCi into earnings
net sales. . . . . . . . . . . . . . . . . . . . . . . . . . . . . . . $ 6 $ (27) $ (99) $ (145)Cost of goods sold . . . . . . . . . . . . . . . . . . . . . . . . . (546) (325) 335 (90)Selling and administrative expenses . . . . . . . . . . . . . . . (9) (16) 232 169interest expense . . . . . . . . . . . . . . . . . . . . . . . . . . (7) – 14 –
all of the gains and losses currently included within accumulated other comprehensive income associated with the Company’s foreign exchange forward contracts are expected to be reclassified into net earnings within the next 12 months. additional information related to the Company’s derivative financial instruments are disclosed within note 1 and note 13 to the consolidated financial statements.
13. FAIR VALUE MEASUREMENTS
Fair Value Hierarchyfair value measurement disclosures specify a hierarchy of valuation techniques based upon whether the inputs to those valuation techniques reflect assumptions other market participants would use based upon market data obtained from independent sources (“observable inputs”) or reflect the Company’s own assumptions of market participant valuation (“unobservable inputs”). in accordance with the fair value guidance, the hierarchy is broken down into three levels based on the reliability of the inputs as follows:
• Level 1 – Quoted prices in active markets that are unadjusted and accessible at the measurement date for identical, unrestricted assets or liabilities;
• Level 2 – Quoted prices for identical assets and liabilities in markets that are not active, quoted prices for similar assets and liabilities in active markets or financial instruments for which significant inputs are observable, either directly or indirectly; and
• Level 3 – Prices or valuations that require inputs that are both significant to the fair value measurement and unobservable.
in determining fair value, the Company utilizes valuation techniques that maximize the use of observable inputs and minimize the use of unobservable inputs to the extent possible as well as considers counterparty credit risk in its assessment of fair value. Classification of the financial or non-financial asset or liability within the hierarchy is determined based on the lowest level input that is significant to the fair value measurement.
Measurement of Fair ValueThe Company measures fair value as an exit price, the price to sell an asset or transfer a liability in an orderly transaction between market participants at the measurement date, using the procedures described below for all financial and non-financial assets and liabilities measured at fair value.

2012 Brown Shoe Company, inC. form 10-k 71
Money Market FundsThe Company has cash equivalents consisting of short-term money market funds backed by U.S. Treasury securities. The primary objective of these investing activities is to preserve its capital for the purpose of funding operations and it does not enter into money market funds for trading or speculative purposes. The fair value is based on unadjusted quoted market prices for the funds in active markets with sufficient volume and frequency (Level 1).
Deferred Compensation Plan Assets and LiabilitiesThe Company maintains a Deferred Compensation plan for the benefit of certain management employees. The investment funds offered to the participant generally correspond to the funds offered in the Company’s 401(k) plan, and the account balance fluctuates with the investment returns on those funds. The fair value of the assets and corresponding liabilities are based on unadjusted quoted market prices for the funds in active markets with sufficient volume and frequency (Level 1). additional information related to the Company’s Deferred Compensation plan is disclosed in note 5 to the consolidated financial statements.
Deferred Compensation Plan for Non-Employee Directors non-employee directors are eligible to participate in a deferred compensation plan, whereby deferred compensation amounts are valued as if invested in the Company’s common stock through the use of pSUs. Under the plan, each participating director’s account is credited with the number of pSUs equal to the number of shares of the Company’s common stock that the participant could purchase or receive with the amount of the deferred compensation, based upon the fair value (as determined based on the average of the high and low prices) of the Company’s common stock on the last trading day of the fiscal quarter when the cash compensation was earned. Dividend equivalents are paid on pSUs at the same rate as dividends on the Company’s common stock and are re-invested in additional pSUs at the next fiscal quarter-end. The pSUs are payable in cash based on the number of pSUs credited to the participating director’s account, valued on the basis of the fair value at fiscal quarter-end on or following termination of the director’s service. The fair value of the liabilities is based on an unadjusted quoted market price for the Company’s common stock in an active market with sufficient volume and frequency (Level 1). additional information related to the Company’s Deferred Compensation plan for non-employee Directors is disclosed in note 5 to the consolidated financial statements.
Derivative Financial InstrumentsThe Company uses derivative financial instruments, primarily foreign exchange contracts, to reduce its exposure to market risks from changes in foreign exchange rates. These foreign exchange contracts are measured at fair value using quoted forward foreign exchange prices from counterparties corroborated by market-based pricing (Level 2). additional information related to the Company’s derivative financial instruments is disclosed in note 1 and note 12 to the consolidated financial statements.
The following table presents the Company’s assets and liabilities that are measured at fair value on a recurring basis at february 2, 2013 and January 28, 2012. The Company did not have any transfers between Level 1 and Level 2 during 2012 or 2011.
fair Value measurements ($ thousands) Total Level 1 Level 2 Level 3
Asset (Liability)as of february 2, 2013: Cash equivalents – money market funds . . . . . . . . . . . . . . . . . . $ 27,223 $ 27,223 $ – $ – non-qualified deferred compensation plan assets . . . . . . . . . . . . . 1,411 1,411 – – non-qualified deferred compensation plan liabilities . . . . . . . . . . . (1,411) (1,411) – – Deferred compensation plan liabilities for non-employee directors . . . (1,139) (1,139) – – Derivative financial instruments, net . . . . . . . . . . . . . . . . . . . . . 7 – 7 –
as of January 28, 2012: Cash equivalents – money market funds . . . . . . . . . . . . . . . . . . $ 5,063 $ 5,063 $ – $ – non-qualified deferred compensation plan assets . . . . . . . . . . . . . 1,081 1,081 – – non-qualified deferred compensation plan liabilities . . . . . . . . . . . (1,081) (1,081) – – Deferred compensation plan liabilities for non-employee directors . . . (620) (620) – – Derivative financial instruments, net . . . . . . . . . . . . . . . . . . . . . 206 – 206 –
Impairment ChargesThe Company assesses the impairment of long-lived assets whenever events or changes in circumstances indicate that the carrying value may not be recoverable. factors the Company considers important that could trigger an impairment review include underperformance relative to expected historical or projected future operating results, a significant change in the manner of the use of the asset or a negative industry or economic trend. when the Company determines that the carrying value of long-lived assets may not be recoverable based upon the existence of one or more of the aforementioned factors, impairment is measured based on a projected discounted cash flow method. Certain factors, such as estimated store sales and expenses, used for this nonrecurring fair value measurement are considered Level 3 inputs. Long-lived assets held and used with a carrying amount of $61.5 million were written down to their fair value, resulting in impairment

72 2012 Brown Shoe Company, inC. form 10-k
charges of $4.1 million in 2012. of the $4.1 million impairment charges, $1.6 million related to the famous footwear segment, $1.4 million related to the wholesale operations segment and $1.1 million related to the Specialty retail segment. of the $1.6 million related to the famous footwear segment, $1.3 million is included in restructuring and other special charges, net, and $0.3 million is included in selling and administrative expenses. The $1.4 million related to the wholesale operations segment is included in restructuring and other special charges, net. of the $1.1 million related to the Specialty retail segment, $0.9 million is included in restructuring and other special charges, net, and $0.2 million is included in selling and administrative expenses.
The Company recognized impairment charges in selling and administrative expenses, primarily related to underperforming retail stores, of $1.9 million and $2.8 million during 2011 and 2010, respectively. of the $1.9 million in 2011, $1.4 million related to the famous footwear segment and $0.5 million related to the Specialty retail segment. of the $2.8 million in 2010, $1.9 million related to the famous footwear segment and $0.9 million related to the Specialty retail segment.
The Company performed its annual impairment tests of indefinite lived intangible assets, which involves estimating the fair value using significant unobservable inputs (Level 3). as a result of its annual impairment testing, the Company did not record any impairment charges during 2012 and 2011 related to intangible assets.
The Company performed its annual impairment test of goodwill, which involves estimating the fair value of its reporting units using significant unobservable inputs (Level 3). The 2012 impairment test, performed as of the first day of the Company’s fourth fiscal quarter, resulted in no impairment charges. See note 1 and note 9 for additional information related to the impairment test of goodwill.
Fair Value of the Company’s Other Financial InstrumentsThe fair values of cash and cash equivalents (excluding money market funds discussed above), receivables, trade accounts payable and borrowing under the revolving credit agreement approximate their carrying values due to the short-term nature of these instruments.
The carrying amounts and fair values of the Company’s other financial instruments subject to fair value disclosures are as follows:
February 2, 2013 January 28, 2012
Carrying Carrying ($ thousands) Amount Fair Value amount fair Value
Senior notes . . . . . . . . . . . . . . . . . . . . . . . . . . . . . . . . . . . . . . . $198,823 $208,000 $198,633 $190,000
The fair value of the Company’s Senior notes was based upon quoted prices in an inactive market as of the end of the respective periods (Level 2).
14. COMMON STOCK REpURCHASES
Stock Repurchase programin January 2008, the Board of Directors approved a stock repurchase program (“2008 program”) authorizing the repurchase of up to 2.5 million shares of the Company’s outstanding common stock. During 2011, the Company repurchased 2.5 million shares of its outstanding common stock for $25.5 million.
on august 25, 2011, the Board of Directors approved a stock repurchase program (“2011 program”) authorizing the repurchase of up to 2.5 million additional shares of the Company’s outstanding common stock. The Company can utilize the repurchase program to repurchase shares on the open market or in private transactions from time to time, depending on market conditions. The repurchase program does not have an expiration date. repurchases of common stock are limited under the Company’s debt agreements. There have been no shares repurchased under the 2011 program.
Repurchases Related to Employee Share-based AwardsDuring 2012 and 2011, 298,636 shares and 37,695 shares, respectively, were tendered by employees related to certain share-based awards. These shares were tendered in satisfaction of the exercise price of stock options and/or to satisfy minimum tax withholding amounts for non-qualified stock options, restricted stock and stock performance awards. accordingly, these share repurchases are not considered a part of the Company’s publicly announced stock repurchase programs.
15. SHARE-bASED pLANS
The Company has share-based incentive compensation plans under which certain officers, employees and members of the Board of Directors are participants and may be granted stock options, restricted stock and stock performance awards.

2012 Brown Shoe Company, inC. form 10-k 73
aSC 718, Compensation – Stock Compensation, and aSC 505, Equity, require companies to recognize compensation expense in an amount equal to the fair value of all share-based payments granted to employees over the requisite service period for each award. in certain limited circumstances, the Company’s incentive compensation plan provides for accelerated vesting of the awards, such as in the event of a change in control, qualified retirement, death or disability. The Company has a policy of issuing treasury shares in satisfaction of share-based awards.
Share-based compensation expense of $6.5 million, $5.6 million and $6.1 million was recognized in 2012, 2011 and 2010, respectively, as a component of selling and administrative expenses. The following table details the share-based compensation expense by plan and the total related income tax benefit for 2012, 2011 and 2010: ($ thousands) 2012 2011 2010
expense for share-based compensation plans: Stock options. . . . . . . . . . . . . . . . . . . . . . . . . . . . . . . . . . . . . . . . . . . . . . . $ 215 $ 513 $ 824 Stock performance awards . . . . . . . . . . . . . . . . . . . . . . . . . . . . . . . . . . . . . . . 328 471 1,243 restricted stock grants . . . . . . . . . . . . . . . . . . . . . . . . . . . . . . . . . . . . . . . . . 5,946 4,649 4,077 Total share-based compensation expense . . . . . . . . . . . . . . . . . . . . . . . . . . . . . . . . . 6,489 5,633 6,144 Less: income tax benefit . . . . . . . . . . . . . . . . . . . . . . . . . . . . . . . . . . . . . . . . . . 2,507 2,107 2,082 Total share-based compensation expense, net of income tax benefit. . . . . . . . . . . . . . . . . . $ 3,982 $ 3,526 $ 4,062
The Company issued 925,676, 559,401 and 546,300 shares of common stock in 2012, 2011 and 2010, respectively, for restricted stock grants, stock options exercised and stock performance awards issued to employees and common and restricted stock grants issued to directors. There were no significant modifications to any share-based awards in 2012, 2011 or 2010.
Stock OptionsStock options are granted to employees at exercise prices equal to the quoted market price of the Company’s stock at the date of grant. Stock options generally vest over four years and have a term of 10 years. Compensation cost for all stock options is recognized over the requisite service period for each award. no dividends are paid on unexercised options. expense for stock options is recognized on a straight-line basis separately for each vesting portion of the stock option award.
The Company granted 26,000, 111,500 and 143,000 stock options during 2012, 2011 and 2010, respectively. fair values of options granted in 2012, 2011 and 2010 were estimated using the Black-Scholes option-pricing model based on the following assumptions: 2012 2011 201
Dividend yield. . . . . . . . . . . . . . . . . . . . . . . . . . . . . . . . . . . . . . . . . . . . . . . . . 3.1% 2.2% 2.0%expected volatility . . . . . . . . . . . . . . . . . . . . . . . . . . . . . . . . . . . . . . . . . . . . . . 66.5% 62.9% 59.8%risk-free interest rate . . . . . . . . . . . . . . . . . . . . . . . . . . . . . . . . . . . . . . . . . . . . 1.4% 2.5% 2.9%expected term (in years) . . . . . . . . . . . . . . . . . . . . . . . . . . . . . . . . . . . . . . . . . . 7 7 7
Dividend yields are based on historical dividend yields. expected volatilities are based on historical volatilities of the Company’s common stock. The risk-free interest rate is based on the U.S. Treasury yield curve in effect at the time of grant for periods corresponding with the expected term of the options. The expected term of options represents the weighted-average period of time that options granted are expected to be outstanding, giving consideration to vesting schedules and the Company’s historical exercise patterns.
Summarized information about stock options outstanding and exercisable at february 2, 2013 is as follows: outstanding exercisable weighted- weighted- weighted- average average average number of remaining exercise number of exerciseexercise price range options Life (years) price options price
$3.33 – $8.65 . . . . . . . . . . . . . . . . . . . . . . . . . 127,700 7 $ 4.07 60,625 $ 3.83 $8.66 – $13.97. . . . . . . . . . . . . . . . . . . . . . . . . 163,406 4 10.75 109,281 11.19 $13.98 – $19.29 . . . . . . . . . . . . . . . . . . . . . . . . 774,548 3 15.75 706,548 15.87 $19.30 – $24.61 . . . . . . . . . . . . . . . . . . . . . . . . 140,906 3 21.38 140,906 21.38 $24.62 – $29.93. . . . . . . . . . . . . . . . . . . . . . . . 3,000 4 24.97 3,000 24.97 $29.94 – $35.25. . . . . . . . . . . . . . . . . . . . . . . . 80,247 4 35.25 80,247 35.25 1,289,807 3 $ 15.81 1,100,607 $ 16.88
The weighted-average remaining contractual term of stock options outstanding and currently exercisable at february 2, 2013 was 3.4 years and 2.7 years, respectively. The aggregate intrinsic value of stock options outstanding and currently exercisable at february 2, 2013 was $3.9 million and $2.4 million, respectively. intrinsic value for stock options is calculated based on the exercise price of the underlying awards as compared to the quoted price of the Company’s common stock as of the reporting date.

74 2012 Brown Shoe Company, inC. form 10-k
The following table summarizes stock option activity for 2012 under the current and prior plans: number of weighted-average options exercise price
outstanding at January 28, 2012 . . . . . . . . . . . . . . . . . . . . . . . . . . . . . . . . . . . . . . . . . . . . . 1,662,610 $ 15.79 Granted . . . . . . . . . . . . . . . . . . . . . . . . . . . . . . . . . . . . . . . . . . . . . . . . . . . . . . . . . 26,000 9.18 exercised . . . . . . . . . . . . . . . . . . . . . . . . . . . . . . . . . . . . . . . . . . . . . . . . . . . . . . . . (139,243) 10.10 forfeited . . . . . . . . . . . . . . . . . . . . . . . . . . . . . . . . . . . . . . . . . . . . . . . . . . . . . . . . (253,935) 18.43 Canceled or expired . . . . . . . . . . . . . . . . . . . . . . . . . . . . . . . . . . . . . . . . . . . . . . . . . . (5,625) 8.04 outstanding at february 2, 2013 . . . . . . . . . . . . . . . . . . . . . . . . . . . . . . . . . . . . . . . . . . . . . 1,289,807 $ 15.81 exercisable at february 2, 2013 . . . . . . . . . . . . . . . . . . . . . . . . . . . . . . . . . . . . . . . . . . . . . . 1,100,607 $ 16.88
The intrinsic value of stock options exercised was $0.5 million, $0.4 million and $1.1 million for 2012, 2011 and 2010, respectively. The amount of cash received from the exercise of stock options was $0.9 million in each of 2012, 2011 and 2010. in addition, 33,033, 349 and 7,124 shares were tendered by employees in satisfaction of the exercise price of stock options during 2012, 2011 and 2010, respectively. The tax impact associated with stock options exercised was less than $0.1 million for 2012, less than $0.1 million for 2011, and $0.2 million for 2010.
The following table summarizes nonvested stock option activity for 2012 under the current and prior plans: number of weighted-average nonvested Grant Date options fair Value
nonvested at January 28, 2012 . . . . . . . . . . . . . . . . . . . . . . . . . . . . . . . . . . . . . . . . . . . . . . 278,275 $ 5.26 Granted . . . . . . . . . . . . . . . . . . . . . . . . . . . . . . . . . . . . . . . . . . . . . . . . . . . . . . . . . 26,000 5.46 Vested. . . . . . . . . . . . . . . . . . . . . . . . . . . . . . . . . . . . . . . . . . . . . . . . . . . . . . . . . . (95,350) 5.18 forfeited . . . . . . . . . . . . . . . . . . . . . . . . . . . . . . . . . . . . . . . . . . . . . . . . . . . . . . . . (19,725) 6.50 nonvested at february 2, 2013 . . . . . . . . . . . . . . . . . . . . . . . . . . . . . . . . . . . . . . . . . . . . . . 189,200 $ 5.07
The weighted-average grant date fair value of stock options granted for 2012, 2011 and 2010 was $5.46, $6.83 and $7.48, respectively. The total grant date fair value of stock options vested during 2012, 2011 and 2010 was $0.5 million, $0.9 million and $1.3 million, respectively. as of february 2, 2013, the total remaining unrecognized compensation cost related to nonvested stock options amounted to $0.3 million, which will be amortized over the weighted-average remaining requisite service period of 2.4 years.
Restricted Stock Under the Company’s incentive compensation plans, restricted stock of the Company may be granted at no cost to certain officers, key employees and directors. plan participants are entitled to cash dividends and voting rights for their respective shares. restrictions limit the sale or transfer of these shares during the requisite service period, which generally ranges from one to eight years. expense for restricted stock grants is recognized on a straight-line basis separately for each vesting portion of the stock award based upon fair value of the award on the date of grant. The fair value of the restricted stock grants is the quoted market price for the Company’s common stock on the date of grant.
The following table summarizes restricted stock activity for the year ended february 2, 2013:
number of weighted-average nonvested Grant Date restricted Shares fair Value
nonvested at January 28, 2012 . . . . . . . . . . . . . . . . . . . . . . . . . . . . . . . . . . . . . . . . . . . . 1,850,297 $ 1 1 .09 Granted . . . . . . . . . . . . . . . . . . . . . . . . . . . . . . . . . . . . . . . . . . . . . . . . . . . . . . . 759,400 9.71 Vested. . . . . . . . . . . . . . . . . . . . . . . . . . . . . . . . . . . . . . . . . . . . . . . . . . . . . . . . (330,072) 14.43 forfeited . . . . . . . . . . . . . . . . . . . . . . . . . . . . . . . . . . . . . . . . . . . . . . . . . . . . . . (169,300) 1 1 .39 nonvested at february 2, 2013 . . . . . . . . . . . . . . . . . . . . . . . . . . . . . . . . . . . . . . . . . . . . 2,110,325 $ 10.14
for the years ended february 2, 2013, January 28, 2012 and January 29, 2011, restricted shares granted were 759,400, 656,350 and 565,864, respectively. restricted shares forfeited during 2012, 2011 and 2010 were 169,300, 186,350 and 100,719, respectively. The weighted-average fair value of restricted stock awards granted for the years ended february 2, 2013, January 28, 2012, and January 29, 2011, was $9.71, $13.78 and $13.97, respectively. The total grant date fair value of restricted stock awards vested during the years ended february 2, 2013, January 28, 2012 and January 29, 2011, was $4.8 million, $3.4 million and $4.4 million, respectively. as of february 2, 2013, the total remaining unrecognized compensation cost related to nonvested restricted stock grants amounted to $10.2 million, which will be amortized over the weighted-average remaining requisite service period of 1.7 years.
The Company recognized $0.9 million and $1.0 million in 2012 and 2011, respectively, of excess tax benefits related to restricted stock vesting and dividends, which was reflected as an increase to additional paid-in capital. During 2010, the Company recognized $0.3 million, of excess tax deficiencies related to restricted stock vesting and dividends, which was reflected as a decrease to additional paid-in capital.

2012 Brown Shoe Company, inC. form 10-k 75
Restricted Stock Units for Non-Employee Directors equity-based grants may be made to non-employee directors in the form of cash-equivalent restricted stock units (“rSUs”) at no cost to the non-employee director. The rSUs are subject to a vesting requirement (usually one-year), earn dividend equivalent units and are payable in cash on the date the director terminates service or such earlier date as a director may elect, subject to restrictions, based on the then-current fair value of the Company’s common stock. Dividend equivalents are paid on outstanding rSUs at the same rate as dividends on the Company’s common stock, are automatically re-invested in additional rSUs and vest immediately as of the payment date for the dividend. expense related to the initial grant of rSUs is recognized ratably over the vesting period based upon the fair value of the rSUs, as remeasured at the end of each period. expense for the dividend equivalents is recognized at fair value immediately. Gains and losses resulting from changes in the fair value of the rSUs subsequent to the vesting period and through the settlement date are reported in the Company’s consolidated statements of earnings.
The following table summarizes restricted stock unit activity for the year ended february 2, 2013: outstanding accrued(1) nonvested rSUs weighted-average number of number of Total number Total number Grant Date Vested rSUs nonvested rSUs of rSUs of rSUs fair Value January 28, 2012 . . . . . . . . . . . . . . . . . . . . 165,338 65,975 231,313 209,321 $ 10.41 Granted (2) . . . . . . . . . . . . . . . . . . . . . 4,377 68,215 72,592 50,325 11.94 Vested. . . . . . . . . . . . . . . . . . . . . . . . 67,390 (67,390) – 21,992 10.47 Settled . . . . . . . . . . . . . . . . . . . . . . . (6,432) – (6,432) (6,432) 16.31 february 2, 2013 . . . . . . . . . . . . . . . . . . . . 230,673 66,800 297,473 275,206 $ 11.91
(1) accrued rSUs include all fully vested awards and a pro-rata portion of nonvested awards based on the elapsed portion of the vesting period.(2) Granted rSUs include 5,792 rSUs resulting from dividend equivalents paid on outstanding rSUs, of which 4,377 related to outstanding
vested rSUs and 1,415 related to outstanding nonvested rSUs.
information about rSUs granted, vested and settled during 2012, 2011 and 2010 is as follows: ($ thousands, except per unit amounts) 2012 2011 2010
weighted-average grant date fair value of rSUs granted(1) . . . . . . . . . . . . . . . . . . . . . . $ 12.04 $ 10.31 $ 16.46 fair value of rSUs vested . . . . . . . . . . . . . . . . . . . . . . . . . . . . . . . . . . . . . . . . . 1,156 601 534 rSUs settled . . . . . . . . . . . . . . . . . . . . . . . . . . . . . . . . . . . . . . . . . . . . . . . . 6,432 47,796 – (1) includes dividend equivalents granted on outstanding rSUs, which vest immediately.
The following table details the rSU compensation expense and the total related income tax benefit for 2012, 2011 and 2010: ($ thousands) 2012 2011 2010
Compensation expense . . . . . . . . . . . . . . . . . . . . . . . . . . . . . . . . . . . . . . . . . $ 2,769 $ 159 $ 798 income tax benefit . . . . . . . . . . . . . . . . . . . . . . . . . . . . . . . . . . . . . . . . . . . . (1,077) (62) (310)Compensation expense, net of income tax benefit . . . . . . . . . . . . . . . . . . . . . . . . . . $ 1,692 $ 97 $ 488
The aggregate intrinsic value of rSUs outstanding and currently vested at february 2, 2013 is $5.1 million and $4.0 million, respectively. aggregate intrinsic value for rSUs is calculated based on the average of the high and low prices of the Company’s common stock as of the reporting date. as of february 2, 2013 and January 28, 2012, the liabilities associated with the accrued rSUs totaled $4.7 million and $2.0 million, respectively.
Stock Performance AwardsUnder the Company’s incentive compensation plans, common stock or cash may be awarded at the end of the performance period at no cost to certain officers and key employees if certain financial goals are met. Under the plan, employees are granted stock performance awards at a target number of shares, which cliff-vest generally over a three-year service period. at the end of the three-year period, the employee will be given an amount of shares between 0% and 200% of the targeted award, depending on the achievement of specified financial goals for the three-year period. Beginning in 2012, stock performance awards will only settle in cash.
expense for stock performance awards is recognized based upon the fair value of the awards on the date of grant and the anticipated number of shares or cash to be awarded on a straight-line basis over the three-year service period. The fair value of the stock performance awards is the quoted market price for the Company’s common stock on the date of grant. The Company had nonvested outstanding stock performance awards for 222,325 shares at a 60% target level as of february 2, 2013, which may result in the issuance of up to 382,525 shares at the end of the service periods.

76 2012 Brown Shoe Company, inC. form 10-k
The following table summarizes stock performance activity for the year ended february 2, 2013:
number of number of nonvested Stock nonvested Stock weighted-average performance awards performance awards Grant Date at Target Level at maximum Level fair Value
nonvested at January 28, 2012 . . . . . . . . . . . . . . . . . . . . . . . . 285,750 428,625 $ 14.56 Granted . . . . . . . . . . . . . . . . . . . . . . . . . . . . . . . . . . . 104,325 208,650 9.46 Vested . . . . . . . . . . . . . . . . . . . . . . . . . . . . . . . . . . . (140,000) (210,000) 13.99 expired . . . . . . . . . . . . . . . . . . . . . . . . . . . . . . . . . . . – – – forfeited . . . . . . . . . . . . . . . . . . . . . . . . . . . . . . . . . . (27,750) (44,750) 13.34
nonvested at february 2, 2013 . . . . . . . . . . . . . . . . . . . . . . . . 222,325 382,525 $ 12.67
The weighted-average grant-date fair value of stock performance awards granted for 2012, 2011, and 2010 was $9.46, $15.20, and $13.99, respectively. Stock performance awards of 140,000 and 323,500 vested in 2012 and 2011, respectively, and no awards vested in 2010. as of february 2, 2013, the remaining unrecognized compensation cost related to nonvested stock performance awards was $1.6 million.
16. RELATED pARTy TRANSACTIONS
C. banner International Holdings LimitedThe Company entered into a joint venture agreement with a subsidiary of C. banner international holdings Limited (“CBi”) (formerly known as hongguo international holdings Limited) to market naturalizer footwear in China in 2007. The Company is a 51% owner of B&h footwear, the joint venture, with CBi owning the other 49%. B&h footwear began operations in 2007 and distributes the naturalizer brand in department stores and free-standing stores in several of China’s largest cities. in addition, B&h footwear sells naturalizer footwear to CBi on a wholesale basis. CBi then sells naturalizer products through retail stores in China. During 2012, 2011 and 2010, the Company, through its consolidated subsidiary, B&h footwear, sold $6.9 million, $5.9 million and $3.9 million, respectively, of naturalizer footwear on a wholesale basis to CBi.
17. COMMITMENTS AND CONTINGENCIES
Environmental Remediationprior operations included numerous manufacturing and other facilities for which the Company may have responsibility under various environmental laws for the remediation of conditions that may be identified in the future. The Company is involved in environmental remediation and ongoing compliance activities at several sites and has been notified that it is or may be a potentially responsible party at several other sites.
RedfieldThe Company is remediating, under the oversight of Colorado authorities, the groundwater and indoor air at its owned facility in Colorado (the “redfield site” or, when referring to remediation activities at or under the facility, the “on-site remediation”) and residential neighborhoods adjacent to and near the property (the “off-site remediation”) that have been affected by solvents previously used at the facility. The on-site remediation calls for the operation of a pump and treat system (which prevents migration of contaminated groundwater off the property) as the final remedy for the site, subject to monitoring and periodic review of the on-site conditions and other remedial technologies that may be developed in the future. off-site groundwater concentrations have been reducing over time since installation of the pump and treat system in 2000 and injection of clean water beginning in 2003. however, localized areas of contaminated bedrock just beyond the property line continue to impact off-site groundwater. The modified workplan for addressing this condition includes converting the off-site bioremediation system into a monitoring well network and employing different remediation methods in these recalcitrant areas. in accordance with the workplan, a pilot test was conducted of certain groundwater remediation methods and the results of that test were used to develop more detailed plans for remedial activities in the off-site areas, which were approved by the authorities and are being implemented in a phased manner. The results of groundwater monitoring are being used to evaluate the effectiveness of these activities. The Company submitted a proposed expanded remedy workplan and is awaiting public comment and feedback from the oversight authorities. The liability for the on-site remediation was discounted at 4.8%. on an undiscounted basis, the on-site remediation liability would be $15.9 million as of february 2, 2013. The Company expects to spend approximately $0.2 million in each of the next five years and $14.9 million in the aggregate thereafter related to the on-site remediation.
The cumulative expenditures for both on-site and off-site remediation through february 2, 2013 were $25.8 million. The Company has recovered a portion of these expenditures from insurers and other third parties. The reserve for the anticipated future remediation activities at february 2, 2013 is $7.8 million, of which $7.0 million is recorded within other liabilities and $0.8 million is recorded within other accrued expenses. of the total $7.8 million reserve, $4.8 million is for on-site remediation and $3.0 million is for off-site remediation.

2012 Brown Shoe Company, inC. form 10-k 77
OtherThe Company has completed its remediation efforts at its closed new york tannery and two associated landfills. in 1995, state environmental authorities reclassified the status of these sites as being properly closed and requiring only continued maintenance and monitoring through 2024. The Company has an accrued liability of $1.6 million at february 2, 2013, related to these sites, which has been discounted at 6.4%. on an undiscounted basis, this liability would be $2.0 million. The Company expects to spend approximately $0.2 million in each of the next five years and $1.0 million in the aggregate thereafter related to these sites. in addition, various federal and state authorities have identified the Company as a potentially responsible party for remediation at certain other sites. however, the Company does not currently believe that its liability for such sites, if any, would be material.
Based on information currently available, the Company has an accrued liability of $9.4 million as of february 2, 2013, to complete the cleanup, maintenance and monitoring at all sites. of the $9.4 million liability, $8.4 million is recorded in other liabilities and $1.0 million is recorded in other accrued expenses. The Company continues to evaluate its estimated costs in conjunction with its environmental consultants and records its best estimate of such liabilities. however, future actions and the associated costs are subject to oversight and approval of various governmental authorities. accordingly, the ultimate costs may vary, and it is possible costs may exceed the recorded amounts.
Litigation
Etienne Aigner License Termination During the second quarter of 2012, the Company terminated the etienne aigner license agreement, due to a dispute with the licensor. The term of the former license agreement extended through 2018. The former license agreement would have required guaranteed minimum royalty payments to the licensor of an additional $20.9 million between July 12, 2012 and contract expiration in 2018. The licensor has disputed the basis on which the Company terminated the former license agreement, which has resulted in the parties seeking binding arbitration of their dispute. on october 8, 2012, the Company instituted the arbitration proceedings alleging that the licensor breached the license agreement and is seeking damages. on october 19, 2012, the licensor responded by denying the Company’s allegations, asserting its own claims for breach of the license agreement and is seeking damages. The arbitration is currently scheduled for may 2013. Due to the early stage of the proceedings, the ultimate outcome is uncertain and the Company has not recorded a liability or receivable for this matter.
The Company is involved in legal proceedings and litigation arising in the ordinary course of business. in the opinion of management, the outcome of such ordinary course of business proceedings and litigation currently pending is not expected to have a material adverse effect on the Company’s results of operations or financial position. Legal costs associated with litigation are generally expensed as incurred.
Otherin 2004, the Company was notified of the insolvency of an insurance company that insured the Company for workers’ compensation and casualty losses from 1973 to 1989. That company is now in liquidation. Certain claims from that time period are still outstanding, for which the Company has an accrued liability of $1.4 million as of february 2, 2013. while management believes it has an appropriate reserve for this matter, the ultimate outcome and cost to the Company may vary.
at february 2, 2013, the Company was contingently liable for remaining lease commitments of approximately $0.2 million in the aggregate, which relate to former retail locations that it exited in prior years. These obligations will continue to decline over the next several years as leases expire. in order for the Company to incur any liability related to these lease commitments, the current lessees would have to default.

78 2012 Brown Shoe Company, inC. form 10-k
18. FINANCIAL INFORMATION FOR THE COMpANy AND ITS SUbSIDIARIES
Brown Shoe Company, inc. issued senior notes, which are fully and unconditionally and jointly and severally guaranteed by all of its existing and future subsidiaries that are guarantors under its existing agreement. The following table presents the consolidating financial information for each of Brown Shoe Company, inc. (“parent”), the Guarantors and subsidiaries of the parent that are not Guarantors (the “non-Guarantors”), together with consolidating eliminations, as of and for the periods indicated. The Guarantors are 100% owned by the parent.
The consolidating financial statements have been prepared using the equity method of accounting in accordance with the requirements for presentation of such information. management believes that the information, presented in lieu of complete financial statements for each of the Guarantors, provides meaningful information to allow investors to determine the nature of the assets held by, and operations and cash flows of, each of the consolidated groups.
CONDENSED CONSOLIDATING bALANCE SHEETAS OF FEbRUARy 2, 2013($ thousands) parent Guarantors non-Guarantors eliminations Total AssetsCurrent assets: Cash and cash equivalents . . . . . . . . . . . . . . . . . . . $ – $ 32,060 $ 36,163 $ – $ 68,223 receivables . . . . . . . . . . . . . . . . . . . . . . . . . . . . 70,308 18,088 37,287 – 125,683 inventories . . . . . . . . . . . . . . . . . . . . . . . . . . . . 94,817 421,914 16,544 – 533,275 prepaid expenses and other current assets . . . . . . . . . . 15,099 29,136 1 ,012 – 45,247 Total current assets. . . . . . . . . . . . . . . . . . . . . . . . . . 180,224 501 ,198 91,006 – 772,428 other assets . . . . . . . . . . . . . . . . . . . . . . . . . . . 99,527 19,739 848 – 120, 1 1 4 Goodwill and intangible assets, net . . . . . . . . . . . . . . 37,270 19,901 75,457 – 132,628 property and equipment, net . . . . . . . . . . . . . . . . . . 27,931 109,457 8,701 – 146,089 investment in subsidiaries. . . . . . . . . . . . . . . . . . . . 765,729 91 ,136 1 1 3,033 (969,898) – Total assets . . . . . . . . . . . . . . . . . . . . . . . . . . . . . $ 1 ,1 10,681 $ 741 ,431 $ 289,045 $ (969,898) $ 1,171,259 Liabilities and EquityCurrent liabilities: Borrowings under revolving credit agreement . . . . . . . . $ 105,000 $ – $ – $ – $ 105,000 Trade accounts payable . . . . . . . . . . . . . . . . . . . . . 54,126 126,293 42,323 – 222,742 other accrued expenses . . . . . . . . . . . . . . . . . . . . 54,729 79,492 7,146 – 141,367 Total current liabilities . . . . . . . . . . . . . . . . . . . . . . . . 213,855 205,785 49,469 – 469,109 other liabilities: Long-term debt . . . . . . . . . . . . . . . . . . . . . . . . . 198,823 – – – 198,823 other liabilities . . . . . . . . . . . . . . . . . . . . . . . . . . 15,897 46,658 14,871 – 77,426 intercompany payable (receivable) . . . . . . . . . . . . . . 256,977 (389,774) 132,797 – – Total other liabilities . . . . . . . . . . . . . . . . . . . . . . . . . 471,697 (343,1 16) 147,668 – 276,249 equity: Brown Shoe Company, inc. shareholders’ equity . . . . . . . 425,129 878,762 91 ,136 (969,898) 425,129 noncontrolling interests. . . . . . . . . . . . . . . . . . . . . – – 772 – 772 Total equity . . . . . . . . . . . . . . . . . . . . . . . . . . . . . 425,129 878,762 91,908 (969,898) 425,901 Total liabilities and equity . . . . . . . . . . . . . . . . . . . . . . $ 1,1 10,681 $ 741 ,431 $ 289,045 $ (969,898) $ 1,171,259
CONDENSED CONSOLIDATING STATEMENT OF EARNINGSFOR THE FISCAL yEAR ENDED FEbRUARy 2, 2013($ thousands) parent Guarantors non-Guarantors eliminations Total net sales. . . . . . . . . . . . . . . . . . . . . . . . . . . . . . . . $ 732,350 $ 1,882,809 $ 191,994 $ (209,088) $ 2,598,065 Cost of goods sold . . . . . . . . . . . . . . . . . . . . . . . . . . 566,045 1,076,068 154,681 (209,088) 1,587,706 Gross profit . . . . . . . . . . . . . . . . . . . . . . . . . . . . . . 166,305 806,741 37,313 – 1,010,359 Selling and administrative expenses . . . . . . . . . . . . . . . . 193,763 714,434 10,760 – 918,957 restructuring and other special charges, net . . . . . . . . . . . 12,533 11,485 – – 24,018 impairment of intangible assets. . . . . . . . . . . . . . . . . . . 5,777 – – – 5,777 equity in (earnings) loss of subsidiary . . . . . . . . . . . . . . . (65,160) (23,079) – 88,239 –operating earnings (loss) . . . . . . . . . . . . . . . . . . . . . . 19,392 103,901 26,553 (88,239) 61,607 interest expense . . . . . . . . . . . . . . . . . . . . . . . . . . . (23,378) (4) – – (23,382)interest income . . . . . . . . . . . . . . . . . . . . . . . . . . . . 10 258 54 – 322 intercompany interest income (expense) . . . . . . . . . . . . . 13,073 (13,525) 452 – –earnings (loss) before income taxes from continuing operations . 9,097 90,630 27,059 (88,239) 38,547 income tax benefit (provision) . . . . . . . . . . . . . . . . . . . 18,394 (25,470) (4,267) – (11,343)net earnings (loss) from continuing operations . . . . . . . . . . 27,491 65,160 22,792 (88,239) 27,204 net loss attributable to noncontrolling interests . . . . . . . . . – – (287) – (287)net earnings (loss) attributable to Brown Shoe Company, inc. . . . $ 27,491 $ 65,160 $ 23,079 $ (88,239) $ 27,491

2012 Brown Shoe Company, inC. form 10-k 79
CONDENSED CONSOLIDATING STATEMENT OF COMpREHENSIVE INCOMEFOR THE FISCAL yEAR ENDED FEbRUARy 2, 2013($ thousands) parent Guarantors non-Guarantors eliminations Total net earnings (loss) . . . . . . . . . . . . . . . . . . . . . . . . . . . . $ 27,491 $ 65,160 $ 22,792 $ (88,239) $ 27,204 other comprehensive (loss) income, net of tax: foreign currency translation adjustment . . . . . . . . . . . . . – 475 – – 475 pension and other postretirement benefits adjustments . . . . (8,871) (190) – – (9,061) Unrealized loss on derivative financial instruments, net of tax . . (49) (353) – – (402) net loss from derivatives reclassified into earnings, net of tax . 183 64 – – 247 other comprehensive loss, net of tax. . . . . . . . . . . . . . . . . . (8,737) (4) – – (8,741)Comprehensive income (loss) . . . . . . . . . . . . . . . . . . . . . 18,754 65,156 22,792 (88,239) 18,463 Comprehensive loss attributable to noncontrolling interest . . . . . – – (275) – (275)Comprehensive income (loss) attributable to Brown Shoe Company, inc. . . . . . . . . . . . . . . . . . . . $ 18,754 $ 65,156 $ 23,067 $ (88,239) $ 18,738
CONDENSED CONSOLIDATING STATEMENT OF CASH FLOWSFOR THE FISCAL yEAR ENDED FEbRUARy 2, 2013($ thousands) parent Guarantors non-Guarantors eliminations Total net cash provided by (used for) operating activities . . . . . . . $ 53,628 $ 110,422 $ 33,887 $ – $ 197,937
Investing activitiespurchases of property and equipment . . . . . . . . . . . . . . . (10,132) (43,711) (1,958) – (55,801)Capitalized software . . . . . . . . . . . . . . . . . . . . . . . . . (7,925) – (3) – (7,928)acquisition cost. . . . . . . . . . . . . . . . . . . . . . . . . . . . – (5,000) – – (5,000)net cash used for investing activities. . . . . . . . . . . . . . . . (18,057) (48,711) (1,961) – (68,729)
Financing activitiesBorrowings under revolving credit agreement . . . . . . . . . . 805,000 – – – 805,000 repayments under revolving credit agreement . . . . . . . . . . (901,000) – – – (901,000)intercompany financing . . . . . . . . . . . . . . . . . . . . . . . 77,582 (64,083) (13,499) – –Dividends paid . . . . . . . . . . . . . . . . . . . . . . . . . . . . (12,011) – – – (12,011)issuance of common stock under share-based plans, net . . . . (1,700) – – – (1,700)Tax benefit related to share-based plans. . . . . . . . . . . . . . 944 – – – 944 net cash used for financing activities. . . . . . . . . . . . . . . . (31,185) (64,083) (13,499) – (108,767)effect of exchange rate changes on cash and cash equivalents . – 100 – – 100 increase (decrease) in cash and cash equivalents . . . . . . . . . 4,386 (2,272) 18,427 – 20,541 Cash and cash equivalents at beginning of period . . . . . . . . (4,386) 34,332 17,736 – 47,682 Cash and cash equivalents at end of period . . . . . . . . . . . . $ – $ 32,060 $ 36,163 $ – $ 68,223
CONDENSED CONSOLIDATING bALANCE SHEETAS OF JANUARy 28, 2012($ thousands) parent Guarantors non-Guarantors eliminations Total AssetsCurrent assets: Cash and cash equivalents . . . . . . . . . . . . . . . . . . . $ (4,386) $ 34,332 $ 17,736 $ – $ 47,682 receivables . . . . . . . . . . . . . . . . . . . . . . . . . . . . 78,129 24,082 51,811 – 154,022 inventories . . . . . . . . . . . . . . . . . . . . . . . . . . . . 129,776 418,264 13,757 – 561,797 prepaid expenses and other current assets . . . . . . . . . . 35,625 14,685 1,327 – 51,637 Total current assets. . . . . . . . . . . . . . . . . . . . . . . . . . 239,144 491,363 84,631 – 815,138 other assets . . . . . . . . . . . . . . . . . . . . . . . . . . . 115,515 23,844 918 – 140,277 Goodwill and intangible assets, net . . . . . . . . . . . . . . 47,765 16,160 76,665 – 140,590 property and equipment, net . . . . . . . . . . . . . . . . . . 23,621 97,887 9,963 – 131,471 investment in subsidiaries . . . . . . . . . . . . . . . . . . . 813,602 68,057 – (881,659) – Total assets . . . . . . . . . . . . . . . . . . . . . . . . . . . . . . $ 1,239,647 $ 697,311 $ 172,177 $ (881,659) $ 1,227,476
Liabilities and EquityCurrent liabilities: Borrowings under revolving credit agreement . . . . . . . . $ 201,000 $ – $ – $ – $ 201,000 Trade accounts payable . . . . . . . . . . . . . . . . . . . . . 49,238 92,431 48,942 – 190,611 other accrued expenses . . . . . . . . . . . . . . . . . . . . 60,079 65,676 7,214 – 132,969 Total current liabilities . . . . . . . . . . . . . . . . . . . . . . . . 310,317 158,107 56,156 – 524,580 other liabilities: Long-term debt . . . . . . . . . . . . . . . . . . . . . . . . . 198,633 – – – 198,633 other liabilities . . . . . . . . . . . . . . . . . . . . . . . . . . 29,702 46,717 14,128 – 90,547 intercompany payable (receivable) . . . . . . . . . . . . . . 288,326 (321 ,1 15) 32,789 – – Total other liabilities . . . . . . . . . . . . . . . . . . . . . . . . . 516,661 (274,398) 46,917 – 289,180 equity: Brown Shoe Company, inc. shareholders’ equity . . . . . . . 412,669 813,602 68,057 (881,659) 412,669 noncontrolling interests. . . . . . . . . . . . . . . . . . . . . – – 1,047 – 1,047 Total equity . . . . . . . . . . . . . . . . . . . . . . . . . . . . . . 412,669 813,602 69,104 (881,659) 413,716 Total liabilities and equity . . . . . . . . . . . . . . . . . . . . . . $ 1,239,647 $ 697,311 $ 172,177 $ (881,659) $ 1,227,476

80 2012 Brown Shoe Company, inC. form 10-k
CONDENSED CONSOLIDATING STATEMENT OF EARNINGSFOR THE FISCAL yEAR ENDED JANUARy 28, 2012($ thousands) parent Guarantors non-Guarantors eliminations Total net sales. . . . . . . . . . . . . . . . . . . . . . . . . . . . . . . . $ 691,008 $ 1,857,192 $ 219,939 $ (185,315) $ 2,582,824 Cost of goods sold . . . . . . . . . . . . . . . . . . . . . . . . . . 529,087 1,061,312 181,100 (185,315) 1,586,184 Gross profit . . . . . . . . . . . . . . . . . . . . . . . . . . . . . . 161,921 795,880 38,839 – 996,640 Selling and administrative expenses . . . . . . . . . . . . . . . . 168,414 715,987 53,018 – 937,419 restructuring and other special charges, net . . . . . . . . . . . 20,308 3,363 – – 23,671 equity in (earnings) loss of subsidiaries . . . . . . . . . . . . . . (49,662) 14,613 – 35,049 – operating earnings (loss) . . . . . . . . . . . . . . . . . . . . . . 22,861 61,917 (14,179) (35,049) 35,550 interest expense . . . . . . . . . . . . . . . . . . . . . . . . . . . (26,113) (633) 605 – (26,141)Loss on early extinguishment of debt . . . . . . . . . . . . . . . (1,003) – – – (1,003)interest income . . . . . . . . . . . . . . . . . . . . . . . . . . . . 1 247 396 – 644intercompany interest income (expense) . . . . . . . . . . . . . 15,714 (15,098) (616) – –earnings (loss) before income taxes from continuing operations . 11,460 46,433 (13,794) (35,049) 9,050 income tax benefit (provision) . . . . . . . . . . . . . . . . . . . 13,129 (12,437) (1,018) – (326) net earnings (loss) from continuing operations . . . . . . . . . . 24,589 33,996 (14,812) (35,049) 8,724 Discontinued operations: earnings from operations of subsidiary, net of tax . . . . . . – 1,701 – – 1,701 Gain on sale of subsidiary, net of tax. . . . . . . . . . . . . . – 13,965 – – 13,965 net earnings from discontinued operations . . . . . . . . . . . . – 15,666 – – 15,666 net earnings (loss) . . . . . . . . . . . . . . . . . . . . . . . . . . 24,589 49,662 (14,812) (35,049) 24,390 net loss attributable to noncontrolling interests . . . . . . . . . – – (199) – (199) net earnings (loss) attributable to Brown Shoe Company, inc. . $ 24,589 $ 49,662 $ (14,613) $ (35,049) $ 24,589
CONDENSED CONSOLIDATING STATEMENT OF COMpREHENSIVE INCOMEFOR THE FISCAL yEAR ENDED JANUARy 28, 2012($ thousands) parent Guarantors non-Guarantors eliminations Total net earnings (loss) . . . . . . . . . . . . . . . . . . . . . . . . . . . . $ 24,589 $ 49,662 $ (14,812) $ (35,049) $ 24,390 other comprehensive income (loss), net of tax: foreign currency translation adjustment . . . . . . . . . . . . . – 1,320 (1,113) – 207 pension and other postretirement benefits adjustments . . . . 3,358 (417) – – 2,941 Unrealized (loss) gain on derivative financial instruments, net of tax . . . . . . . . . . . . . . . . . . . . . . . . . . . . . (36) 379 – – 343 net loss from derivatives reclassified into earnings, net of tax . 22 22 – – 44 other comprehensive income (loss), net of tax . . . . . . . . . . . . 3,344 1,304 (1,113) – 3,535 Comprehensive income (loss) . . . . . . . . . . . . . . . . . . . . . . 27,933 50,966 (15,925) (35,049) 27,925 Comprehensive loss attributable to noncontrolling interest . . . . . – – (160) – (160)Comprehensive income (loss) attributable to Brown Shoe Company, inc. . . . . . . . . . . . . . . . . . . . $ 27,933 $ 50,966 $ (15,765) $ (35,049) $ 28,085
CONDENSED CONSOLIDATING STATEMENT OF CASH FLOWSFOR THE FISCAL yEAR ENDED JANUARy 28, 2012($ thousands) parent Guarantors non-Guarantors eliminations Total net cash (used for) provided by operating activities . . . . . . . $ (205,188) $ 234,780 $ 18,439 $ 55 $ 48,086 Investing activitiespurchases of property and equipment . . . . . . . . . . . . . . . (2,739) (21,917) (3,201) – (27,857)Capitalized software . . . . . . . . . . . . . . . . . . . . . . . . . (10,419) (288) – – (10,707)acquisition cost. . . . . . . . . . . . . . . . . . . . . . . . . . . . – – (156,636) – (156,636)Cash recognized on initial consolidation . . . . . . . . . . . . . . – 3,121 – – 3,121 net proceeds from sale of subsidiary. . . . . . . . . . . . . . . . – 61,922 (6,572) – 55,350 net cash (used for) provided by investing activities . . . . . . . (13,158) 42,838 (166,409) – (136,729)Financing activitiesBorrowings under revolving credit agreement . . . . . . . . . . 1,595,500 – – – 1,595,500repayments under revolving credit agreement . . . . . . . . . . (1,592,500) – – – (1,592,500)intercompany financing . . . . . . . . . . . . . . . . . . . . . . . 205,689 (271,509) 65,875 (55) –proceeds from issuance of 2019 Senior notes . . . . . . . . . . . 198,633 – – – 198,633 redemption of 2012 Senior notes . . . . . . . . . . . . . . . . . (150,000) – – – (150,000)Dividends paid . . . . . . . . . . . . . . . . . . . . . . . . . . . . (12,076) – – – (12,076)Debt issuance costs . . . . . . . . . . . . . . . . . . . . . . . . . (6,428) – – – (6,428)acquisition of treasury stock . . . . . . . . . . . . . . . . . . . . (25,484) – – – (25,484)issuance of common stock under share-based plans, net . . . . 918 – – – 918 Tax (deficiency) benefit related to share-based plans . . . . . . (292) 1,292 – – 1,000 Contributions by noncontrolling interests . . . . . . . . . . . . . – – 378 – 378 net cash provided by (used for) financing activities . . . . . . . 213,960 (270,217) 66,253 (55) 9,941 effect of exchange rate changes on cash and cash equivalents . – (164) – – (164) (Decrease) increase in cash and cash equivalents. . . . . . . . . (4,386) 7,237 (81,717) – (78,866) Cash and cash equivalents at beginning of period . . . . . . . . – 27,095 99,453 – 126,548 Cash and cash equivalents at end of period . . . . . . . . . . . . $ (4,386) $ 34,332 $ 17,736 $ – $ 47,682

2012 Brown Shoe Company, inC. form 10-k 81
CONDENSED CONSOLIDATING STATEMENT OF EARNINGSFOR THE FISCAL yEAR ENDED JANUARy 29, 2011($ thousands) parent Guarantors non-Guarantors eliminations Total net sales. . . . . . . . . . . . . . . . . . . . . . . . . . . . . . . . $ 714,388 $ 1,768,767 $ 216,604 $ (195,668) $ 2,504,091 Cost of goods sold . . . . . . . . . . . . . . . . . . . . . . . . . . 545,219 967,712 183,274 (195,668) 1,500,537 Gross profit . . . . . . . . . . . . . . . . . . . . . . . . . . . . . . 169,169 801,055 33,330 – 1,003,554 Selling and administrative expenses . . . . . . . . . . . . . . . . 190,586 717,775 14,615 – 922,976 restructuring and other special charges, net . . . . . . . . . . . 7,209 – 705 – 7,914 equity in (earnings) loss of subsidiaries . . . . . . . . . . . . . . (58,275) (11,860) – 70,135 – operating earnings (loss) . . . . . . . . . . . . . . . . . . . . . . 29,649 95,140 18,010 (70,135) 72,664 interest expense . . . . . . . . . . . . . . . . . . . . . . . . . . . (19,643) (4) – – (19,647)interest income . . . . . . . . . . . . . . . . . . . . . . . . . . . . 1 76 126 – 203 intercompany interest income (expense) . . . . . . . . . . . . . 14,961 (11,212) (3,749) – – earnings (loss) before income taxes . . . . . . . . . . . . . . . . 24,968 84,000 14,387 (70,135) 53,220 income tax benefit (provision) . . . . . . . . . . . . . . . . . . . 12,265 (25,415) (3,010) – (16,160) net earnings (loss) . . . . . . . . . . . . . . . . . . . . . . . . . . 37,233 58,585 11,377 (70,135) 37,060 net earnings (loss) attributable to noncontrolling interests . . . – 310 (483) – (173) net earnings (loss) attributable to Brown Shoe Company, inc. . $ 37,233 $ 58,275 $ 11,860 $ (70,135) $ 37,233
CONDENSED CONSOLIDATING STATEMENT OF COMpREHENSIVE INCOMEFOR THE FISCAL yEAR ENDED JANUARy 29, 2011($ thousands) parent Guarantors non-Guarantors eliminations Total net earnings (loss) . . . . . . . . . . . . . . . . . . . . . . . . . . . . $ 37,233 $ 58,585 $ 1 1 ,377 $ (70,135) $ 37,060 other comprehensive income (loss), net of tax: foreign currency translation adjustment . . . . . . . . . . . . . – 2,150 – – 2,150 pension and other postretirement benefits adjustments . . . . 3,450 (17) – – 3,433 Unrealized (loss) gain on derivative financial instruments, net of tax . . . . . . . . . . . . . . . . . . . . . . . . . . . . . (80) 251 – – 171 net loss from derivatives reclassified into earnings, net of tax . 208 25 – – 233 other comprehensive income, net of tax. . . . . . . . . . . . . . . . 3,578 2,409 – – 5,987 Comprehensive income (loss) . . . . . . . . . . . . . . . . . . . . . . 40,811 60,994 1 1 ,377 (70,135) 43,047 Comprehensive income (loss) attributable to noncontrolling interest . . . . . . . . . . . . . . . . . . . . . . . – 310 (460) – (150)Comprehensive income (loss) attributable to Brown Shoe Company, inc. . . . . . . . . . . . . . . . . . . . $ 40,811 $ 60,684 $ 1 1 ,837 $ (70,135) $ 43,197
CONDENSED CONSOLIDATING STATEMENT OF CASH FLOWSFOR THE FISCAL yEAR ENDED JANUARy 29, 2011($ thousands) parent Guarantors non-Guarantors eliminations Total net cash provided by (used for) operating activities . . . . . . . $ 64,824 $ (129,040) $ 61,904 $ – $ (2,312) Investing activitiespurchases of property and equipment . . . . . . . . . . . . . . . (4,863) (25,126) (792) – (30,781)Capitalized software . . . . . . . . . . . . . . . . . . . . . . . . . (23,793) (253) – – (24,046) net cash used for investing activities. . . . . . . . . . . . . . . . (28,656) (25,379) (792) – (54,827) Financing activitiesBorrowings under revolving credit agreement . . . . . . . . . . 1,051,500 – – – 1,051,500 repayments under revolving credit agreement . . . . . . . . . . (948,000) – – – (948,000)intercompany financing . . . . . . . . . . . . . . . . . . . . . . . (132,926) 206,664 (73,738) – –acquisition of noncontrolling interests (edelman Shoe, inc.) . . 7,309 (40,001) – – (32,692)Dividends paid . . . . . . . . . . . . . . . . . . . . . . . . . . . . (12,254) 5,010 (5,010) – (12,254)Debt issuance costs . . . . . . . . . . . . . . . . . . . . . . . . . (2,636) – – – (2,636)issuance of common stock under share-based plans, net . . . . 926 – – – 926 Contributions by noncontrolling interests . . . . . . . . . . . . . – – 527 – 527 Tax deficiency related to share-based plans . . . . . . . . . . . . (87) – – – (87) net cash (used for) provided by financing activities . . . . . . . (36,168) 171,673 (78,221) – 57,284 effect of exchange rate changes on cash and cash equivalents . – 570 – – 570 increase (decrease) in cash and cash equivalents . . . . . . . . . – 17,824 (17,109) – 715 Cash and cash equivalents at beginning of period . . . . . . . . – 9,271 116,562 – 125,833 Cash and cash equivalents at end of period . . . . . . . . . . . . $ – $ 27,095 $ 99,453 $ – $ 126,548

82 2012 Brown Shoe Company, inC. form 10-k
19. QUARTERLy FINANCIAL DATA (Unaudited)
Quarterly financial results (unaudited) for the years 2012 and 2011 are as follows: Quarters First Quarter Second Quarter Third Quarter Fourth Quarter($ thousands, except per share amounts) (13 weeks) (13 weeks) (13 weeks) (14 weeks)
2012net sales. . . . . . . . . . . . . . . . . . . . . . . . . . . . . . . . . . . . . $626,441 $599,279 $732,169 $640,176 Gross profit . . . . . . . . . . . . . . . . . . . . . . . . . . . . . . . . . . . 239,064 233,814 285,782 251,699 net earnings (loss) . . . . . . . . . . . . . . . . . . . . . . . . . . . . . . . 1,628 (2,714) 24,287 4,003 net earnings (loss) attributable to Brown Shoe Company, inc. . . . . . . 1,695 (2,535) 24,292 4,039 per share of common stock: Basic earnings (loss) per common share attributable to Brown Shoe Company, inc. shareholders (1) . . . . . . . . . . . 0.04 (0.06) 0.57 0.09 Diluted earnings (loss) per common share attributable to Brown Shoe Company, inc. shareholders (1) . . . . . . . . . . . 0.04 (0.06) 0.56 0.09 Dividends paid . . . . . . . . . . . . . . . . . . . . . . . . . . . . . . . 0.07 0.07 0.07 0.07 market value: high. . . . . . . . . . . . . . . . . . . . . . . . . . . . . . . . . . . 11.30 14.24 16.88 19.64 Low . . . . . . . . . . . . . . . . . . . . . . . . . . . . . . . . . . . 8.49 8.28 13.22 14.76
(1) epS for the quarters may not sum to the amounts for the year as each period is computed on a discrete period basis. Quarters first Quarter Second Quarter Third Quarter fourth Quarter($ thousands, except per share amounts) (13 weeks) (13 weeks) (13 weeks) (13 weeks)
2011net sales. . . . . . . . . . . . . . . . . . . . . . . . . . . . . . . . . . . . $ 619,555 (1) $ 620,590 (1) $713,788 $628,891 Gross profit . . . . . . . . . . . . . . . . . . . . . . . . . . . . . . . . . . 247,964 (1) 233,605 (1) 276,498 238,573 net earnings (loss) . . . . . . . . . . . . . . . . . . . . . . . . . . . . . . 3,641 (4,768) 33,693 (8,176)net earnings (loss) attributable to Brown Shoe Company, inc. . . . . . 3,688 (4,609) 33,732 (8,222)per share of common stock: Basic earnings (loss) per common share attributable to Brown Shoe Company, inc. shareholders (2) . . . . . . . . . . 0.08 (0.1 1) 0.80 (0.21) Diluted earnings (loss) per common share attributable to Brown Shoe Company, inc. shareholders (2) . . . . . . . . . . 0.08 (0.1 1) 0.79 (0.21) Dividends paid . . . . . . . . . . . . . . . . . . . . . . . . . . . . . . 0.07 0.07 0.07 0.07 market value: high. . . . . . . . . . . . . . . . . . . . . . . . . . . . . . . . . . 15.77 12.79 10.31 9.72 Low . . . . . . . . . . . . . . . . . . . . . . . . . . . . . . . . . . 10.39 8.85 5.85 7.51
(1) adjusted from amounts previously reported in the Company’s form 10-Q for the financial results related to TBmC. TBmC was acquired in the first quarter of 2011 and sold in the subsequent third quarter of 2011. The historical financial results of TBmC have been reclassified and presented as discontinued operations.
(2) epS for the quarters may not sum to the amounts for the year as each period is computed on a discrete period basis.
The fourth quarter of 2012 included $2.9 million ($1.8 million after-tax, or $0.05 per diluted share) of charges related to the Company’s portfolio realignment initiatives.
The fourth quarter of 2011 included:• $14.7 million ($9.3 million after-tax, or $0.23 per diluted share) of charges related to the Company’s portfolio
realignment initiatives,• $2.9 million ($1.6 million after-tax, or $0.04 per diluted share) of costs related to the integration of ASG, and• $0.9 million ($1.4 million after-tax, or $0.04 per diluted share) as a reduction to the gain on sale of a subsidiary.

2012 Brown Shoe Company, inC. form 10-k 83
SCHEDULE II — VALUATION AND QUALIFyING ACCOUNTS
Col. a Col. B Col. C Col. D Col. e additions Balance at Charged Charged Balance Beginning Costs and other accounts- Deductions- at endDescription of period expenses Describe Describe of period ($ thousands)
yEAR ENDED FEbRUARy 2, 2013Deducted from assets or accounts: Doubtful accounts and allowances . . . . . . . . $ 1,705 $ 360 – $ 1,055(A) $ 1,010 Customer allowances . . . . . . . . . . . . . . . 23,528 52,495 – 54,333(b) 21,690 Customer discounts . . . . . . . . . . . . . . . . 618 4,513 – 4,434(b) 697 inventory valuation allowances . . . . . . . . . . 22,259 63,675 – 66,043(C) 19,891 Deferred tax asset valuation allowance . . . . . 6,946 1,815 – 285(E) 8,476
yEAR ENDED JANUARy 28, 2012Deducted from assets or accounts: Doubtful accounts and allowances . . . . . . . . $ 1,056 $ 1,284 – $ 635(a) $ 1,705 Customer allowances . . . . . . . . . . . . . . . 17,023 56,076 – 49,571(B) 23,528 Customer discounts . . . . . . . . . . . . . . . . 319 3,830 – 3,531(B) 618 inventory valuation allowances . . . . . . . . . . 15,305 54,083 – 47,129(C) 22,259 Deferred tax asset valuation allowance . . . . . 6,751 495 481(D) 781(e) 6,946
yEAR ENDED JANUARy 29, 2011Deducted from assets or accounts: . . . . . . . . . . Doubtful accounts and allowances . . . . . . . . $ 1,021 $ 516 – $ 481(a) $ 1,056 Customer allowances . . . . . . . . . . . . . . . 13,033 43,007 – 39,017(B) 17,023 Customer discounts . . . . . . . . . . . . . . . . 257 6,898 – 6,836(B) 319 inventory valuation allowances . . . . . . . . . . 15,414 53,506 – 53,615(C) 15,305 Deferred tax asset valuation allowance . . . . . 8,859 296 – 2,404(e) 6,751
(a) accounts written off, net of recoveries.(B) Discounts and allowances granted to customers of the wholesale operations segment. (C) adjustment upon disposal of related inventories. (D) established through purchase accounting related to the aSG acquisition. (e) reflects reductions to valuation allowance for the net operating loss carryforwards for certain states based on the Company’s expectations
for utilization of net operating loss carryforwards.
ITEM 9 CHANGES IN AND DISAGREEMENTS WITH ACCOUNTANTS ON ACCOUNTING AND FINANCIAL DISCLOSURE
none.
ITEM 9A CONTROLS AND pROCEDURES
Evaluation of Disclosure Controls and proceduresit is the Chief executive officer’s and Chief financial officer’s ultimate responsibility to ensure we maintain disclosure controls and procedures designed to provide reasonable assurance that information required to be disclosed in the reports that we file or submit under the Securities exchange act of 1934 is recorded, processed, summarized and reported within the time periods specified in the Commission’s rules and forms and is accumulated and communicated to our management, including our principal executive and principal financial officers, or persons performing similar functions, as appropriate to allow timely decisions regarding required disclosure. our disclosure controls and procedures include mandatory communication of material events; automated accounting processing and reporting; management review of monthly, quarterly and annual results; an established system of internal controls; and internal control reviews by our internal auditors.
a control system, no matter how well-conceived or operated, can provide only reasonable, not absolute, assurance that the objectives of the control system are met. furthermore, the design of a control system must reflect the fact there are resource constraints, and the benefits of controls must be considered relative to their costs. Because of the inherent limitations in all control systems, no evaluation of controls can provide absolute assurance that all control issues and instances of fraud, if any, have been detected. These inherent limitations include the realities that judgments in decision-making can be faulty, and breakdowns can occur because of simple error or mistake. additionally, controls can be circumvented by the individual acts of some persons, by collusion of two or more people or by management override of the controls. The design of any system of controls is based in part upon certain assumptions about the likelihood of future events, and there can be no assurance any design will succeed in achieving its stated goals under all potential future conditions; over time, controls may become inadequate because of changes in conditions or the degree of compliance with the policies or procedures may deteriorate. Because of the inherent limitations in a cost-effective control system, misstatements due to errors or fraud may occur and not be detected. our disclosure controls and procedures are designed to provide a reasonable level of assurance that their objectives are achieved. as of february 2, 2013, management of the

84 2012 Brown Shoe Company, inC. form 10-k
Company, including the Chief executive officer and Chief financial officer, conducted an evaluation of the effectiveness of our disclosure controls and procedures (as defined in rule 13a-15(e) under the Securities exchange act of 1934). Based upon and as of the date of that evaluation, the Chief executive officer and Chief financial officer have concluded our disclosure controls and procedures were effective at the reasonable assurance level.
Internal Control Over Financial ReportingBased on the evaluation of internal control over financial reporting, the Chief executive officer and Chief financial officer have concluded that there have been no changes in the Company’s internal controls over financial reporting or in other factors during the quarter ended february 2, 2013, that have materially affected, or are reasonably likely to materially affect, the Company’s internal control over financial reporting.
ITEM 9b OTHER INFORMATION
none.
pART III
ITEM 10 DIRECTORS, EXECUTIVE OFFICERS AND CORpORATE GOVERNANCE
information regarding Directors of the Company is set forth under the caption Proposal 1 – Election of Directors in the proxy Statement for the annual meeting of Shareholders to be held may 30, 2013, which information is incorporated herein by reference.
information regarding executive officers of the registrant is set forth under the caption Executive Officers of the Registrant that can be found in item 1 of this report, which information is incorporated herein by reference.
information regarding Section 16, Beneficial ownership reporting Compliance, is set forth under the caption Section 16(a) Beneficial Ownership Reporting Compliance in the proxy Statement for the annual meeting of Shareholders to be held may 30, 2013, which information is incorporated herein by reference.
information regarding the audit Committee and the audit Committee financial expert is set forth under the captions Board Meetings and Committees and Audit Committee, respectively, in the proxy Statement for the annual meeting of Shareholders to be held may 30, 2013, which information is incorporated herein by reference.
information regarding the Corporate Governance Guidelines, Code of Business Conduct and Code of ethics is set forth under the caption Corporate Governance in the proxy Statement for the annual meeting of Shareholders to be held may 30, 2013, which information is incorporated herein by reference.
ITEM 11 EXECUTIVE COMpENSATION
information regarding executive Compensation is set forth under the captions Compensation Discussion and Analysis, Executive Compensation and Compensation of Non-Employee Directors in the proxy Statement for the annual meeting of Shareholders to be held may 30, 2013, which information is incorporated herein by reference.
information regarding the Compensation Committee report is set forth under the caption Compensation Committee Report in the proxy Statement for the annual meeting of Shareholders to be held may 30, 2013, which information is incorporated herein by reference.
information regarding Compensation Committee interlocks and insider participation is set forth under the caption Compensation Committee Interlocks and Insider Participation in the proxy Statement for the annual meeting of Shareholders to be held may 30, 2013, which information is incorporated herein by reference.

2012 Brown Shoe Company, inC. form 10-k 85
ITEM 12 SECURITy OWNERSHIp OF CERTAIN bENEFICIAL OWNERS AND MANAGEMENT AND RELATED STOCKHOLDER MATTERS
information regarding Company Stock ownership by Directors, officers and principal holders of our Stock is set forth under the caption Stock Ownership by Directors, Executive Officers and 5% Shareholders in the proxy Statement for the annual meeting of Shareholders to be held may 30, 2013, which information is incorporated herein by reference.
Equity Compensation plan InformationThe following table sets forth aggregate information regarding the Company’s equity compensation plans as of february 2, 2013: number of securities remaining available number of securities weighted-average for future issuance under to be issued upon exercise exercise price of equity compensation plans of outstanding options, outstanding options, (excluding securities warrants and rights warrants and rights reflected in column (a))plan Category (a) (b) (c) equity compensation plans approved by security holders . . . . . 1,686,182 (1) 15.81 (1) 2,373,734 (2)
equity compensation plans not approved by security holders . . . – – – Total . . . . . . . . . . . . . . . . . . . . . . . . . . . . . . . . . . . 1,686,182 15.81 2,373,734
(1) Column (a) includes the following: (i) 1,289,807 outstanding stock options (includes vested and nonvested options)(ii) 186,375 rights to receive common shares subject to nonvested performance share awards at the maximum award level. The target
amount of shares to be awarded under these performance share awards is 124,250, depending on the achievement of certain objectives at the end of fiscal 2013 These awards may be payable at anywhere from zero to a maximum of 186,375 shares at the end of 2013. our current expectation is that no shares will be issued upon satisfaction of these awards.
(iii) 210,000 rights to receive common shares subject to performance share awards that have vested at the end of 2012 but had not been approved for issuance by the Compensation Committee as of the end of fiscal 2012. The target amount of shares for these awards was 140,000 and the awards will be paid out at 60% of target in march 2013.
performance share rights described in (ii) and (iii) above were disregarded for purposes of computing the weighted-average exercise price in column (b). This table excludes restricted stock units granted to independent directors and independent directors’ deferred compensation units, which are payable only in cash and are described further in note 15 to the consolidated financial statements.
(2) represents our remaining shares available for award grants based upon the plan provisions, which reflects our practice to reserve shares for outstanding awards. per our current practice, the number of securities available for grant has been reduced for stock option grants and performance share awards payable in stock. performance share awards are reserved based on the maximum payout level.
information regarding share-based plans is set forth in note 15 to the consolidated financial statements and is hereby incorporated by reference.
ITEM 13 CERTAIN RELATIONSHIpS AND RELATED TRANSACTIONS, AND DIRECTOR INDEpENDENCE
information regarding Certain relationships and related Transactions is set forth under the caption Related Party Transactions in the proxy Statement for the annual meeting of Shareholders to be held may 30, 2013, which information is incorporated herein by reference.
information regarding Director independence is set forth under the caption Director Independence in the proxy Statement for the annual meeting of Shareholders to be held may 30, 2013, which information is incorporated herein by reference.
ITEM 14 pRINCIpAL ACCOUNTING FEES AND SERVICES
information regarding our principal accounting fees and Services is set forth under the caption Fees Paid to Independent Registered Public Accountants in the proxy Statement for the annual meeting of Shareholders to be held may 30, 2013, which information is incorporated herein by reference.

86 2012 Brown Shoe Company, inC. form 10-k
pART IV
ITEM 15 EXHIbITS AND FINANCIAL STATEMENT SCHEDULES(a) (1) and (2) The list of financial statements and financial Statement Schedules required by this item is included in the index on page 7 under
financial Statements and Supplementary Data. all other schedules specified under regulation S-X have been omitted because they are not applicable, because they are not required or because the information required is included in the financial statements or notes thereto. (3) exhibits
Certain instruments defining the rights of holders of long-term debt securities of the Company are omitted pursuant to item 601(b)(4)(iii) of regulation S-k, and the Company hereby undertakes to furnish to the SeC, upon request, copies of any such instruments.
Exhibit No. Description 3.1 restated Certificate of incorporation of Brown Shoe Company, inc. (the “Company”) incorporated herein by reference to
exhibit 3.1 to the Company’s Quarterly report on form 10-Q for the quarter ended may 5, 2007, and filed June 5, 2007.
3.2 Bylaws of the Company as amended through october 6, 2011, incorporated herein by reference to exhibit 3.1 to the Company’s form 8-k dated and filed october 11, 2011.
4.2a indenture for the 7.125% Senior notes due 2019, dated may 11, 2011 among Brown Shoe Company, inc., the subsidiary guarantors set forth therein, and wells fargo Bank, national association, as trustee, as incorporated herein by reference to exhibit 4.1 to the Company’s form 8-k dated and filed may 13, 2011.
4.2b form of 7.125% Senior notes due 2019, as incorporated herein by reference to exhibit 4.1 to the Company’s form 8-k dated and filed may 13, 2011.
10.1a Third amended and restated Credit agreement, dated as of January 7, 2011 (the “Credit agreement”), among the Company, as lead borrower for itself and on behalf of certain of its subsidiaries, and Bank of america, n.a., as lead issuing bank, administrative agent and collateral agent, wells fargo Bank, national association, as an issuing bank, wells fargo Capital finance, LLC, as syndication agent, Bank of america, n.a. and Jpmorgan Chase Bank, n.a., as co-documentation agents, and the other financial institutions party thereto, as lenders, as incorporated herein by reference to exhibit 10.1 to the Company’s form 8-k dated and filed January 7, 2011.
10.1b first amendment to Third amended and restated Credit agreement and Confidential Side Letter, dated february 17, 2011, by and among Brown Shoe Company, inc., as lead borrower for itself and on behalf of certain of its subsidiaries, and Bank of america, n.a., as lead issuing bank, administrative agent and collateral agent, wells fargo Bank, national association, as an issuing bank, wells fargo Capital finance, LLC, as syndication agent, Bank of america, n.a. and Jpmorgan Chase Bank, n.a., as co-documentation agents, and the other financial institutions party thereto, as lenders, as incorporated herein by reference to exhibit 10.2 to the Company’s form 8-k dated and filed february 17, 2011.
10.2a* Brown Shoe Company, inc. incentive and Stock Compensation plan of 2002, as amended and restated as of may 22, 2008, incorporated herein by reference to exhibit a to the Company’s definitive proxy statement dated and filed april 11, 2008.
10.2b(1)* form of incentive Stock option award agreement (for grants commencing may 2008) under the Brown Shoe Company, inc. incentive and Stock Compensation plan of 2002, incorporated herein by reference to exhibit 10.5b(1) to the Company’s form 10-k for the year ended January 31, 2009, and filed march 31, 2009.
10.2b(2)* form of incentive Stock option award agreement (for grants prior to may 2008) under the Brown Shoe Company, inc. incentive and Stock Compensation plan of 2002, incorporated herein by reference to exhibit 10.4 to the Company’s form 10-Q for the quarter ended July 31, 2004, and filed September 8, 2004.
10.2c(1)* form of non-Qualified Stock option award agreement (for grants commencing may 2008) under the Brown Shoe Company, inc. incentive and Stock Compensation plan of 2002, incorporated herein by reference to exhibit 10.5c(1) to the Company’s form 10-k for the year ended January 31, 2009, and filed march 31, 2009.
10.2c(2)* form of non-Qualified Stock option award agreement for awards issued prior to may 2008 under the Brown Shoe Company, inc. incentive and Stock Compensation plan of 2002, incorporated herein by reference to exhibit 10.3 to the Company’s form 10-Q for the quarter ended July 31, 2004, and filed September 8, 2004.
10.2d* form of restricted Stock agreement (for employee grants commencing 2008) under the Brown Shoe Company, inc. incentive and Stock Compensation plan of 2002, incorporated herein by reference to exhibit 10.5d(1) to the Company’s form 10-k for the year ended January 31, 2009, and filed march 31, 2009.
10.2e* form of restricted Stock award agreement for non-employee director awards (for grants commencing may 2008) under the Brown Shoe Company, inc. incentive and Stock Compensation plan of 2002, incorporated herein by reference to exhibit 10.5e to the Company’s form 10-k for the year ended January 31, 2009, and filed march 31, 2009.
10.2f* form of performance award agreement (for 2010-2012 performance period) under the Brown Shoe Company, inc. incentive and Stock Compensation plan of 2002, incorporated herein by reference to exhibit 10.3 to the Company’s form 10-Q/a for the quarter ended october 30, 2010, and filed January 21, 2011.
10.3a* Brown Shoe Company, inc. incentive and Stock Compensation plan of 2011, incorporated herein by reference to exhibit a to the Company’s definitive proxy materials filed with the Securities and exchange Commission on Schedule 14a on april 15, 2011.
10.3b(1)* form of performance award agreement (for 2011-2013 performance period) under the Brown Shoe Company, inc. incentive and Stock Compensation plan of 2002, as incorporated herein by reference to exhibit 10.5 to the Company’s form 10-Q for the quarter ended april 30, 2011 and filed June 9, 2011.
10.3(b)(2)* form of performance award agreement (for 2012-2014 performance period) under the Brown Shoe Company, inc. incentive and Stock Compensation plan of 2011, incorporated herein by reference to exhibit 10.1 to the Company’s form 10-Q for the quarter ended July 28, 2012, and filed September 5, 2012.
= 10.3(b)(3)* form of performance award agreement (for 2013-2015 performance period) under the Brown Shoe Company, inc. incentive and Stock Compensation plan of 2011, filed herewith.

2012 Brown Shoe Company, inC. form 10-k 87
Exhibit No. Description 10.4a* form of non-employee Director restricted Stock Unit agreement between the Company and each of its non-employee
Directors (for grants commencing in 2008), incorporated herein by reference to exhibit 10.2 to the Company’s form 10-Q for the quarter ended august 2, 2008, and filed September 10, 2008.
10.4b* form of non-employee Director restricted Stock Unit agreement between the Company and each of its non-employee Directors (for grants prior to 2008), incorporated herein by reference to exhibit 10(u) to the Company’s form 10-k for the year ended January 29, 2005, and filed april 1, 2005.
10.5* Brown Shoe Company, inc. Deferred Compensation plan for non-employee Directors, as amended and restated as of January 1, 2009, incorporated herein by reference to exhibit 10.2a to the Company’s form 10-Q for the quarter ended november 1, 2008, and filed December 9, 2008.
10.6* Brown Shoe Company, inc. Supplemental executive retirement plan (Serp), conformed and restated as of December 2, 2008, incorporated herein by reference to exhibit 10.3 to the Company’s form 10-Q for the quarter ended november 1, 2008, and filed December 9, 2008.
10.7* Brown Shoe Company, inc. Deferred Compensation plan, incorporated herein by reference to exhibit 4.1 to the Company’s registration Statement on form S-8 filed December 11, 2007.
10.8* Brown Shoe Company, inc. non-employee Director Share plan (2009), incorporated herein by reference to exhibit 10.1 to the Company’s form 10-Q for the quarter ended november 1, 2008, and filed December 9, 2008.
10.9* Severance agreement, effective april 1, 2006, between the Company and richard m. ausick, incorporated herein by reference to exhibit 10.4 to the Company’s form 10-Q for the quarter ended July 31, 2010, and filed September 7, 2010.
10.10* Severance agreement, effective april 1, 2006, between the Company and Diane m. Sullivan, incorporated herein by reference to exhibit 10.5 to the Company’s form 8-k dated and filed april 6, 2006.
10.11* Severance agreement, effective october 30, 2006, between the Company and mark e. hood, incorporated herein by reference to exhibit 10.6 to the Company’s form 8-k dated and filed october 30, 2006.
= 10.12* Severance agreement, effective april 1, 2006, between the Company and Douglas w. koch, filed herewith.
10.13* form of amendment letter dated December 18, 2009, to the Severance agreements between the Company and each of: richard m. ausick, mark e. hood, Douglas w. koch and Diane m. Sullivan, as incorporated herein by reference to exhibit 10.6 to the Company’s form 10-Q for the quarter ended July 31, 2010, and filed September 7, 2010.
10.14* Severance agreement, effective June 11, 2012, between the Company and russell C. hammer, incorporated herein by reference to exhibit 10.1 to the Company’s form 8-k dated and filed may 29, 2012.
10.15* Severance agreement, dated December 20, 2012 and effective as of December 1, 2012, between the Company and John w. Schmidt, incorporated herein by reference to exhibit 10.1 to the Company’s form 8-k dated and filed December 21, 2012.
10.16* employment agreement, dated January 7, 2011, between ronald a. fromm and the Company, as incorporated herein by reference to exhibit 10.1 to the Company’s form 8-k dated and filed January 10, 2011.
10.17 Stock purchase agreement, dated february 17, 2011, by and among Brown Shoe Company, inc., Brown Shoe netherlands B.V., american Sporting Goods Corporation, the sellers named therein and Jerome a. Turner, in his capacity as representative, as incorporated herein by reference to exhibit 10.1 to the Company’s form 8-k dated and filed february 17, 2011.
= 21 Subsidiaries of the registrant.
= 23 Consent of registered public accounting firm.
= 24 power of attorney (contained on signature page).
= 31.1 Certification of the Chief executive officer pursuant to Section 302 of the Sarbanes-oxley act of 2002.
= 31.2 Certification of the Chief financial officer pursuant to Section 302 of the Sarbanes-oxley act of 2002.
= 32.1 Certification of the Chief executive and Chief financial officer pursuant to Section 906 of the Sarbanes-oxley act of 2002.
=^ 101.inS XBrL instance Document
=^ 101.SCh XBrL Taxonomy extension Schema Document
=^ 101.CaL XBrL Taxonomy extension Calculation Linkbase Document
=^ 101.LaB XBrL Taxonomy extension Label Linkbase Document
=^ 101.pre XBrL Taxonomy presentation Linkbase Document
=^ 101.Def XBrL Taxonomy Definition Linkbase Document
(b) exhibits:
See item 15(a)(3) above. on request, copies of any exhibit will be furnished to shareholders upon payment of the Company’s reasonable expenses incurred in furnishing such exhibits.
(c) financial Statement Schedules:
See item 8 above.
* Denotes management contract or compensatory plan arrangements.
= Denotes exhibit is filed with this form 10-k.
^ pursuant to rule 406T of regulation S-T, these interactive data files are deemed not filed or part of a registration statement or prospectus for purposes of Sections 11 or 12 of the Securities act of 1933 or Section 18 of the Securities exchange act of 1934.

88 2012 Brown Shoe Company, inC. form 10-k
SIGNATURES
pursuant to the requirements of Section 13 or 15(d) of the Securities exchange act of 1934, the registrant has duly caused this report to be signed on its behalf by the undersigned, thereunto duly authorized.
Brown Shoe Company, inC. By: /s/ russell C. hammerrussell C. hammerSenior Vice president and Chief financial officer
Date: april 2, 2013
know all men by these presents, that each person whose signature appears below constitutes and appoints Diane m. Sullivan, russell C. hammer and michael i. oberlander his or her true and lawful attorney-in-fact and agent, with full power of substitution and resubstitution, for him or her and in his or her name, place and stead, in any and all capacities, to sign any and all amendments to this annual report on form 10-k, and to file the same, with all exhibits thereto, and other documents in connection therewith, with the Securities and exchange Commission, granting unto said attorney-in-fact and agent, full power and authority to do and perform each and every act and thing requisite and necessary to be done, as fully to all intents and purposes as he or she might or could do in person, hereby ratifying and confirming all that said attorney-in-fact and agent or his substitute or substitutes may lawfully do or cause to be done by virtue hereof.
pursuant to the requirements of the Securities exchange act of 1934, this report has been signed below by the following persons on behalf of the registrant, on the dates and in the capacities indicated.
Signatures Date Title /s/ Diane m. Sullivan Diane m. Sullivan april 2, 2013 Director, president and Chief executive officer on behalf of the Company and as principal executive officer /s/ russell C. hammer russell C. hammer april 2, 2013 Senior Vice president and Chief financial officer on behalf of the Company and as principal financial officer and principal accounting officer /s/ ronald a. fromm ronald a. fromm march 25, 2013 Chairman of the Board of Directors /s/ mario L. Baeza mario L. Baeza march 25, 2013 Director /s/ mahendra r. Gupta mahendra r. Gupta march 25, 2013 Director /s/ Carla C. hendra Carla C. hendra march 25, 2013 Director /s/ ward m. klein ward m. klein march 25, 2013 Director /s/ Steven w. korn Steven w. korn march 25, 2013 Director /s/ patricia G. mcGinnis patricia G. mcGinnis march 25, 2013 Director /s/ w. patrick mcGinnis w. patrick mcGinnis march 25, 2013 Director /s/ michael f. neidorff michael f. neidorff march 25, 2013 Director /s/ hal J. Upbin hal J. Upbin march 25, 2013 Director /s/ harold B. wright harold B. wright march 25, 2013 Director
2012 Brown Shoe Company, inC. form 10-k 89
Exhibit 31.1
CERTIFICATIONS
i, Diane m. Sullivan, certify that:
1. i have reviewed this annual report on form 10-k of Brown Shoe Company, inc. (the “registrant”);
2. Based on my knowledge, this report does not contain any untrue statement of a material fact or omit to state a material fact necessary to make the statements made, in light of the circumstances under which such statements were made, not misleading with respect to the period covered by this report;
3. Based on my knowledge, the financial statements, and other financial information included in this report, fairly present in all material respects the financial condition, results of operations and cash flows of the registrant as of, and for, the periods presented in this report;
4. The registrant’s other certifying officer and i are responsible for establishing and maintaining disclosure controls and procedures (as defined in exchange act rules 13a-15(e) and 15d-15(e)) and internal control over financial reporting (as defined in exchange act rules 13a-15(f) and 15d-15(f)) for the registrant and have:
a) Designed such disclosure controls and procedures, or caused such disclosure controls and procedures to be designed under our supervision, to ensure that material information relating to the registrant, including its consolidated subsidiaries, is made known to us by others within those entities, particularly during the period in which this report is being prepared;
b) Designed such internal control over financial reporting, or caused such internal control over financial reporting to be designed under our supervision, to provide reasonable assurance regarding the reliability of financial reporting and the preparation of financial statements for external purposes in accordance with generally accepted accounting principles;
c) evaluated the effectiveness of the registrant’s disclosure controls and procedures and presented in this report our conclusions about the effectiveness of the disclosure controls and procedures, as of the end of the period covered by this report based on such evaluation; and
d) Disclosed in this report any change in the registrant’s internal control over financial reporting that occurred during the registrant’s most recent fiscal quarter (the registrant’s fourth fiscal quarter in the case of an annual report) that has materially affected, or is reasonably likely to materially affect, the registrant’s internal control over financial reporting; and
5. The registrant’s other certifying officer and i have disclosed, based on our most recent evaluation of internal control over financial reporting, to the registrant’s auditors and the audit committee of the registrant’s board of directors (or persons performing the equivalent functions):
a) all significant deficiencies and material weaknesses in the design or operation of internal control over financial reporting which are reasonably likely to adversely affect the registrant’s ability to record, process, summarize and report financial information; and
b) any fraud, whether or not material, that involves management or other employees who have a significant role in the registrant’s internal control over financial reporting.
/s/ Diane m. SullivanDiane m. Sullivanpresident and Chief executive officerBrown Shoe Company, inc.april 2, 2013

90 2012 Brown Shoe Company, inC. form 10-k
Exhibit 31.2
CERTIFICATIONS
i, russell C. hammer, certify that:
1. i have reviewed this annual report on form 10-k of Brown Shoe Company, inc. (the “registrant”);
2. Based on my knowledge, this report does not contain any untrue statement of a material fact or omit to state a material fact necessary to make the statements made, in light of the circumstances under which such statements were made, not misleading with respect to the period covered by this report;
3. Based on my knowledge, the financial statements, and other financial information included in this report, fairly present in all material respects the financial condition, results of operations and cash flows of the registrant as of, and for, the periods presented in this report;
4. The registrant’s other certifying officer and i are responsible for establishing and maintaining disclosure controls and procedures (as defined in exchange act rules 13a-15(e) and 15d-15(e)) and internal control over financial reporting (as defined in exchange act rules 13a-15(f) and 15d-15(f)) for the registrant and have:
a) Designed such disclosure controls and procedures, or caused such disclosure controls and procedures to be designed under our supervision, to ensure that material information relating to the registrant, including its consolidated subsidiaries, is made known to us by others within those entities, particularly during the period in which this report is being prepared;
b) Designed such internal control over financial reporting, or caused such internal control over financial reporting to be designed under our supervision, to provide reasonable assurance regarding the reliability of financial reporting and the preparation of financial statements for external purposes in accordance with generally accepted accounting principles;
c) evaluated the effectiveness of the registrant’s disclosure controls and procedures and presented in this report our conclusions about the effectiveness of the disclosure controls and procedures, as of the end of the period covered by this report based on such evaluation; and
d) Disclosed in this report any change in the registrant’s internal control over financial reporting that occurred during the registrant’s most recent fiscal quarter (the registrant’s fourth fiscal quarter in the case of an annual report) that has materially affected, or is reasonably likely to materially affect, the registrant’s internal control over financial reporting; and
5. The registrant’s other certifying officer and i have disclosed, based on our most recent evaluation of internal control over financial reporting, to the registrant’s auditors and the audit committee of the registrant’s board of directors (or persons performing the equivalent functions):
a) all significant deficiencies and material weaknesses in the design or operation of internal control over financial reporting which are reasonably likely to adversely affect the registrant’s ability to record, process, summarize and report financial information; and
b) any fraud, whether or not material, that involves management or other employees who have a significant role in the registrant’s internal control over financial reporting.
/s/ russell C. hammerrussell C. hammerSenior Vice president and Chief financial officerBrown Shoe Company, inc.april 2, 2013

2012 Brown Shoe Company, inC. form 10-k 91
Exhibit 32.1
Certification pursuant to118 U.S.C. §1350,As Adopted pursuant toSection 906 of the Sarbanes-Oxley Act of 2002 in connection with the annual report of Brown Shoe Company, inc. (the “registrant”) on form 10-k for the year ended february 2, 2013, as filed with the Securities and exchange Commission on the date hereof (the “report”), we, Diane m. Sullivan, president and Chief executive officer of the registrant, and russell C. hammer, Senior Vice president and Chief financial officer of the registrant, certify, to the best of our knowledge, pursuant to 18 U.S.C. §1350, as adopted pursuant to Section 906 of the Sarbanes-oxley act of 2002, that: (1) The report fully complies with the requirements of Section 13(a) or 15(d) of the Securities exchange act of 1934; and (2) The information contained in the report fairly presents, in all material respects, the financial condition and results of
operations of the registrant.
/s/ Diane m. SullivanDiane m. Sullivanpresident and Chief executive officerBrown Shoe Company, inc.april 2, 2013
/s/ russell C. hammerrussell C. hammerSenior Vice president and Chief financial officerBrown Shoe Company, inc.april 2, 2013

* NON-GAAp FINANCIAL MEASURES in this annual report, the company’s financial results are provided both in accordance with generally accepted accounting
principles (Gaap) and using certain non-Gaap financial measures. in particular, the company provides historic operating earnings, net earnings (loss) and earnings (loss) per diluted share adjusted to exclude certain gains, charges and recoveries, which are non-Gaap financial measures. These results are included as a complement to results provided in accordance with Gaap because management believes these non-Gaap financial measures help identify underlying trends in the company’s business and provide useful information to both management and investors by excluding certain items that may not be indicative of the company’s core operating results. These measures should not be considered a substitute for or superior to Gaap results.
SELECTED CONDENSED CONSOLIDATED FINANCIAL INFORMATIONDILUTED EARNINGS PER SHARE 2012 2011 2010 2009 2008
Gaap earnings . . . . . . . . . . . . . . . . . . . . . . . . . . . . $ 0.64 $ 0.56 $ 0.85 $ 0.22 $ (3.21)Charges, other items aSG acquisition and integration-related costs . . . . . . . 0.01 0. 1 1 0.02 - - aSG cost of goods sold adjustment(1) . . . . . . . . . . . . - 0.05 - - - insurance recoveries, net . . . . . . . . . . . . . . . . . . . - - - - (0.15) expense and capital containment initiatives. . . . . . . . . - - - - 0.46 headquarters consolidation . . . . . . . . . . . . . . . . . . - - - (0.03) 0.44 impairment of goodwill and intangible assets . . . . . . . - - - - 2.87 iT initiatives . . . . . . . . . . . . . . . . . . . . . . . . . . . - - 0.10 0. 1 4 0.06 Loss on early extinguishment of debt . . . . . . . . . . . . - 0.02 - - - organizational changes . . . . . . . . . . . . . . . . . . . . 0.03 - - 0.07 - portfolio realignment Gain on sale of subsidiary . . . . . . . . . . . . . . . . . - (0.32) - - - Brand exits and cost reductions . . . . . . . . . . . . . . 0.45 0.28 - - - Total charges, other items . . . . . . . . . . . . . . 0.49 0.14 0.12 0.18 3.68adjusted earnings . . . . . . . . . . . . . . . . . . . . . . . . . . $ 1 .13 $ 0.70 $ 0.97 $ 0.40 $ 0.47
(1) in accordance with Gaap, purchase accounting rules require the company to record inventory at fair value (i.e., expected selling price less costs to sell) on the acquisition date. This results in lower than typical gross margins when the acquired inventory is sold. This adjustment reflects the elimination of the unfavorable impact of lower gross margins for aSG product sold in the first half of 2011.
FORWARD LOOKING STATEMENTS AND RISK FACTORS This document contains certain forward-looking statements and expectations regarding the company’s future performance and the future performance of its brands. Such statements are subject to various risks and uncertainties that could cause actual results to differ materially. These risks include (i) changing consumer demands, which may be influenced by consumers’ disposable income, which in turn can be influenced by general economic conditions; (ii) intense competition within the footwear industry; (iii) rapidly changing fashion trends and purchasing patterns; (iv) customer concentration and increased consolidation in the retail industry; (v) political and economic conditions or other threats to the continued and uninterrupted flow of inventory from China, where aSG has manufacturing facilities and both aSG and Brown Shoe Company rely heavily on third-party manufacturing facilities for a significant amount of their inventory; (vi) the ability to recruit and retain senior management and other key associates; (vii) the ability to attract, retain and maintain good relationships with licensors and protect intellectual property rights; (viii) the ability to secure/exit leases on favorable terms; (ix) the ability to maintain relationships with current suppliers; (x) compliance with applicable laws and standards with respect to lead content in paint and other product safety issues; (xi) the ability to source product at a pace consistent with increased demand for footwear; and (xii) the impact of rising prices in a potentially inflationary global environment. The company’s reports to the Securities and exchange Commission contain detailed information relating to such factors, including, without limitation, the information under the caption risk factors in item 1a of the company’s annual report on form 10-k for the year ended february 2, 2013, which information is incorporated by reference herein and updated by the company’s Quarterly reports on form 10-Q. The company does not undertake any obligation or plan to update these forward-looking statements, even though its situation may change.

Copyright © 2013 Brown Shoe Company. All rights reserved. Design: Joann Bittel, Kansas City, Missouri
EXECUTIVE MANAGEMENTDiane M. SullivanPresident and Chief Executive Officer
Richard M. AusickDivision President - Retail
Daniel R. FriedmanDivision President - Global Supply Chain
Russell C. HammerSenior Vice President and Chief Financial Officer
Douglas W. KochSenior Vice President and Chief Talent and Strategy Officer
John R. MazurkDivision President - Healthy Living Brands
Michael I. OberlanderSenior Vice President, General Counsel and Corporate Secretary
John W. SchmidtDivision President - Contemporary Fashion Brands
Mark A. SchmittSenior Vice President and Chief Information Officer
Ronald A. Fromm (1)
Chairman of the Board of Brown Shoe Company Inc.
Mario L. Baeza (2)
Founder and controlling shareholder of Baeza & Co. and founder and Executive Chairman of V-Me Media Inc.
Mahendra Gupta, Ph.D. (2)
Dean of Olin Business School at Washington University in St. Louis
Carla Hendra (3)
Global Chairman of OgilvyRED, Ogilvy & Mather Worldwide
Ward M. Klein (4, 5)
Chief Executive Officer of Energizer Holdings Inc.
Steven W. Korn (2)
Former President and Chief Executive Officer of Radio Free Europe/Radio Liberty Inc. and Former Vice Chairman and Chief Operating Officer of CNN
Patricia G. McGinnis (6)
Professor of Practice at George Washington University, Trachtenberg School of Public Policy and Public Administration
W. Patrick McGinnis (4, 7)
President and Chief Executive Officer of Nestlé Purina PetCare Company
Michael F. Neidorff (6)
Chairman, President and Chief Executive Officer of Centene Corporation
Diane M. Sullivan (4)
Hal J. Upbin (4, 8)
Chairman Emeritus of the Board of Directors of Kellwood Company
Harold B. Wright (3)
Former Partner of Heidrick and Struggles
CORPORATE INFORMATION
CORPORATE OFFICESBrown Shoe Company8300 Maryland Ave.St. Louis, MO 63105314.854.4000 or brownshoe.com
TRANSFER AGENT Computershare P.O. Box 43006Providence, RI 02940-3006866.865.6319www-us.computershare.com/investor/Contact
INVESTOR RELATIONSPeggy Reilly TharpVice President, Investor Relations 314.854.4134 or [email protected]
INDEPENDENT REGISTEREDPUBLIC ACCOUNTING FIRMErnst & Young LLP
COMMON STOCKBrown Shoe Company is traded on NYSE under the symbol BWS
(1) Chairman of executive committee (2) Member of audit committee (3) Member of governance and nominating committee (4) Member of executive committee
(5) Chairman of governance and nominating committee (6) Member of compensation committee (7) Chairman of compensation committee (8) Chairman of audit committee and financial expert
BOARD OF DIRECTORS

8300 Mary land Ave . St . Louis , MO 63105-3693 3 14 .854 .4000 brownshoe .com