shorebird habitat nesting preferences in arctic …
TRANSCRIPT
1
SHOREBIRD HABITAT NESTING PREFERENCES IN ARCTIC NATIONAL
WILDLIFE REFUGE:
UNDERSTANDING NEST SUCCESS BASED ON ECOSYSTEM FACTORS
Alec Blair
TC660H
Plan II Honors Program
The University of Texas at Austin
April 29, 2020
J. Hayley Gillespie
Jackson School of Geosciences
Supervising Professor
Ashley Matheny
Jackson School of Geosciences
Second Reader

2
ABSTRACT
Author: Alec Blair
Title: Shorebird Habitat Nesting Preferences in Arctic National Wildlife Refuge: Understanding
Nest Success Based on Ecosystem
Supervising Professor: Hayley Gillespie
On the Canning River Delta in the Northeast corner of the 1002 Region of the Arctic
National Wildlife Refuge (ANWR), shorebird biologists conduct surveys to map and study
nesting locations of Semipalmated sandpipers (Calidris pusilla), Pectoral sandpipers (Calidris
melanotos), Red-necked phalaropes (Phalaropus lobatus), and Red phalaropes (Phalaropus
fulicarius). These migratory birds find their way to ANWR during the end of May and
throughout June to begin mating and the strategic process of choosing nest location. U.S. Fish &
Wildlife Service botanists have divided ANWR into eight different habitat types based on
present vegetation and precipitation levels. This information can be useful to determine
environmental preferences that the shorebirds (surveyed in the summer of 2019) may have, and
the level of nest success under those local conditions. My objective was to determine priority
habitat areas to best preserve shorebird species that nest within the 1002 shore area by overlaying
2019 nesting locations with respect to multi-spectral data such as water proximity, avian predator
proximity, and habitat type. I want to understand if there are any significant differences in the
habitat preferences among the four species and what other environmental factors may impact
those differences in selection and in success. Results show that each individual species has
specific preferences relating to each environmental factor: both phalarope species heavily prefer
more saturated terrestrial habitat types with close proximity to a water source where they can
forage. Both sandpipers prefer drier habitat types with neutral distance to water sources (as they
are willing to travel further from their nest to forage). This information can inform the necessity
to preserve near shoreline freshwater sources of varying sizes and calls for further research into
how shoreline erosion, unpredictable future precipitation events, and oil and gas development
can implicate the coastal plain and shorebird nesting habitats. Results indicate that all four
species have heavy preference for one of three habitat classes that are marked by semi-moist
graminoid grasses, with some variation in preference for plant species to nest within. Both nest
initiation and nest termination dates have important roles in the nesting outcomes for all species,
but more so in the phalarope species. Vegetation coverage over nests was significant for
phalaropes but not sandpipers, indicating a need for more research into the changing nesting
phenology of phalaropes, especially in P. fulicarius which is more restricted in its breeding
habitat selection.

3
Table of Contents
Introduction…………………………………………………………………………………...…...5
Focus Species…………………………………………………………………………….12
Methods…………………………………………………………………………………….….....22
Statistical Analysis……………………………………………………………………….28
Results…………………………………………………..…………………………………..……29
Discussion……………………………………………………………………………………..…42
Appendix…………………………………………………………………………………49
Reference List……………………………………………………………………………………58

4
Acknowledgements
This paper would not have been possible without the help of my two advisors, Hayley
Gillespie and Ashley Matheny: their patience and grace during a chaotic time in the world was
helpful beyond the scope of this paper. Thanks to Christopher Latty and Tamara Zeller of
USFWS Alaska Region for providing the opportunity to work in Arctic National Wildlife Refuge
in the summer of 2019: it was an experience I will never forget. Finally, thanks to my friends,
family, coworkers, and anyone else who had to listen to me talk about birds over the last year.

5
Introduction:
Hypotheses
The primary questions that this research seeks to answer are: what significant differences
in habitat nesting preferences exist between each of the two sandpiper species (C. melanotos and
C. pusilla) and the two phalarope species? Within each species, are there significant differences
in the nesting success based on the habitat type that is nested within? How does the initiation
date of the nest impact the likelihood of success? Does temperature at initiation or at termination
have any correlation with nest success? Does concealment have any correlation to nest success?
Background on Arctic National Wildlife Refuge
Roughly the size of South Carolina, Arctic National Wildlife Refuge (ANWR) is the
single largest remaining undeveloped tract of land in the United States. Located on the north
slope of Alaska, approximately 60 miles east of Prudhoe Bay, the refuge includes the lowlands
below the Brooks Mountain Range and extends all the way to the Beaufort Sea of the Arctic
Ocean. On the western border of the refuge lies the Staines River, part of the greater Canning
River Delta. On the eastern border, one refuge ends and another begins: ANWR adjoins its
Canadian equivalent called Ivvavik National Park. The Arctic coastal climate in the Canning
River area consists of low summer temperatures that averaged at 29.85˚F in May, 38.98˚F in
June, 51.35˚F in July, and 42.87˚F in August of 2019 (Figure 1). A general warming trend is
evident between 1999 and 2011 based on weather data taken from NOAA Kaktovik, AK weather
station (Figure 2). Northeasterly winds from the Beaufort Sea can be strong and dense fog can be
common in the summer months. Precipitation is low, with averages less than two inches per

6
month during the summer months between 1999 and 2011 (Figure 3). Ice and snow cover can
persist into June, well into the breeding and nesting period of the shorebirds. Continuous
permafrost exists under the coastal plain extending from the coastline of the Arctic to the
foothills of the Brooks mountain range, however the permafrost has become a major climate
change research focus as its melting may have significant implications. During the summer
months (May to August) annual permafrost thaw creates thaw lakes through thermokarst: the
differential thawing of permafrost creating topographic incongruities on the land surface (Shaftel
2018). Thaw lakes also contribute to the landscape features, drained thaw lake basin (DTLB),
which are classified by low elevation tundra polygon depressions that formerly existed as thaw
lakes (Frohn 2009). These differential polygons create the foundation for the local topographic
changes that classify different local habitat conditions along the coastal plain, and their habitats
continue to shift as permafrost melting increases each year. Permafrost thawing poses an
immediate atmospheric threat with its increase in global methane circulating (Whiteman 2013).
Locally, the permafrost melt has been seen to have significant impact on snowmelt and icing
events annually, which directly impacts herbivorous populations. Further, thaw-induced collapse
of structures used by wildlife for reproduction can have significant impacts on annual
fluctuations in populations of arctic dwelling mammals (specifically shrews and lemmings).
Finally, thermal erosion of ice wedges has a very significant impact on avian species specifically,
as ice wedging can result in the drainage of wetland areas that birds, notably waterfowl species,
rely on (Berteaux 2017). The thaw will also increase soil carbon sinks by directly increasing
microbial respiration and vegetation productivity. This results in an increase of shrub plant
species, which may have significant ecohydrological impact on radiation by reducing surface
reflectance and increasing evapotranspiration (Loranty 2012). Notable shifts in vegetation have

7
already been observed along the North shore of Alaska that are leading researchers to question
how plant productivity shifts may propagate upstream into the food web, through variation in
foraging, hunting and nesting locations that are available to wildlife (Tape 2006). The threat of
ice-wedge melting has the potential to dramatically change the topography of the landscape that
avian species rely on for both foraging and nesting by changing the local water balance in
lowland tundra habitats through increased surface runoff and decreased subsurface inundation to
contribute to renewing winter permafrost boundaries (Liljedahl 2016). Other recent studies
further question the threat that hydrological change may have on local environments in the
tundra. Since 2011, significant reductions in plant productivity have been observed and
correlated to increases in both temperature and precipitation--warning for an even greater
reduction of the tundra’s ability to serve as a carbon sink (Lara 2018). There is also a local threat
to existing biota because of other hydrological changes to the landscape: studies have found that
shifts in climatic conditions will make the Arctic tundra a sink for heavy metals including
cadmium, zinc and lead because of the impending and current increase in local precipitation
(McDonald 2005). All of these disruptions to the local hydrological, vegetative, and topographic
conditions of the Arctic coastal plain raise an alarm to how they may impact wildlife.

8
Figure 1: Average temperature (F) in each of the summer months taken from the NOAA
Kaktovik, AK weather station between 1999 and 2011. General warming trends shown for both
June and July months.
Figure 2: Average daily temperatures (F) including minimum and maximum temperatures in
Prudhoe Bay, Alaska, the nearest weather station (Barter Island LRRS Airport Weather Station)
to the Canning River Delta field site (approximately 60 miles away).
R² = 0.0002
R² = 0.1911
R² = 0.1381
35
37
39
41
43
45
47
49
51
1999 2000 2001 2002 2003 2004 2005 2006 2007 2008 2009 2010 2011
Te
mp
era
ture
(F
)
Year
Kaktovik, AK Average Monthly Temperature 1999-2011
June
July
August
Linear (June)
Linear (July)
Linear (August)

9
Figure 3: Average precipitation during the summer months taken from NOAA weather station in
Kaktovik, AK between 1999 and 2011. Low negative trend for August precipitation with no
trend for June or July.
Policy Background
Originally designated as a wildlife range by President Eisenhower in 1960, Arctic
National Wildlife Refuge earned its “refuge” status when congress passed The Alaskan National
Interest Lands Conservation Act (ANILCA) in 1980 (United States 1980). The act protected the
area oil and gas development, with the exception of a portion of the refuge called the “1002,”
located on the northern portion of the refuge in the Arctic coastal plain. Action to open the 1002
to drilling has been on and off over the last three decades, until in 2017 when the President
Trump signed P.L. 115-97 within H.R. 1 and H.R. 1370 which called for the begin of an oil and
gas program on the coastal plain (Comay et al. 2018). In 2019, the House responded by passing
The Arctic Cultural and Coastal Plain Protection Act (H.R. 1146) which restored protections of
the coastal plain that were removed by the 2017 law. The bill currently sits in the Senate
committee on Energy and Natural Resources for further review before a senate vote is held
(United States 2019).
R² = 0.0025
R² = 5E-05
R² = 0.0685
0
0.2
0.4
0.6
0.8
1
1.2
1.4
1.6
1.8
2
1999 2000 2001 2002 2003 2004 2005 2006 2007 2008 2009 2010
Av
erag
e P
reci
pit
atio
n
Year
Kaktovik, AK Average Summer Precipitation 1999-2011
June
July
August
Linear (June)
Linear (July)
Linear (August)

10
Wildlife on the Arctic Coast
While the climatic conditions above the Arctic Circle are harsh, the area serves as an
essential habitat for many animals: from caribou to Arctic foxes. Some of these species include
migratory birds that use the Arctic as their breeding and nesting location for the summer until
they move as far as Antarctica (Arctic tern) for the winter. Migratory birds have been well
studied to understand the advantages of mobility to promote larger breeding ranges to improve
species fitness (Newton 2003). The adaptation of migration has become an area of concern under
the greater study of climate change, specifically as polar regions rapidly experience the impacts
of global temperature increase. The threat of habitat reduction to migratory species has been
found to be especially significant for coastal birds as their ranges are particularly restricted
(Henningsson 2008). Fourteen of the bird species that use ANWR for nesting are shorebirds of
the Scolopacidae family. The primary local nesting ground of these birds along the Arctic coastal
plain includes the “1002” region of the northwestern portion of ANWR that extends north of the
Sadlerochit Mountains, part of the Brooks Range, to the Beaufort Sea shoreline. This is the only
part of ANWR that was not designated as protected wilderness in The Alaskan National Interest
Lands Conservation Act (ANILCA) of 1980. Currently, annual research is being conducted on
ANWR in the 1002 region to better understand the wildlife that resides there currently and the
potential impacts of development may have on it. One such form of research is conducted by the
“Bird Camp” on the shoulder of the Staines River in the Canning River Delta in the northwest
corner of the 1002, just two miles south of the Beaufort Sea. Multiple projects take place in this
location relating to arctic dwelling species, ranging from Arctic fox den studies to loon surveys.
Over the course of June and July each year, ANWR becomes the home of researchers for a

11
shorebird nesting project to collect data on the habits of the shorebird species that use the area to
forage, nest, and brood before flying south for the winter.
Previous Research
This study will work to expand on the ANWR shorebird abundance and distribution
study done by Brown et al. 2006. Drawing from the same habitat categorization that Brown et al.
applied to their own study (from Jorgensen et al. 2018b), this study will begin by comparing the
abundance and distribution results from Brown’s 2002 and 2004 shorebird surveys to the data
collected in the Summer 2019 field season to confirm the habitat preferences of the four
shorebirds, and then extend the research to include the nesting success of the birds based on the
habitat types in which they nested. The 2019 field season data will be analyzed for the success
rate of each of the bird species based on habitat type and will attempt to block for the presence of
avian predators (Arctic and Red foxes, Parasitic and Pomarine jaegers, and Glaucous gulls).
Brown et al. classified habitat types into five categories as opposed to Jorgenson’s 17, the
simplification of these habitat types is useful on the entire scale of the refuge which includes
upland drier habitat types, but because this study focuses on the coastal plain, it is necessary to
further differentiate the habitats by maintaining Jorgenson’s 17 classes. The initial assessment of
the Arctic coastal plain that now defines the oil and gas interest and the potential to redefine the
conservation status of ANWR is held within the Coastal Plain Resource Assessment (Clough
1987). The second chapter of the assessment discusses wildlife that live on the refuge and the
extent that it would be impacted based on FWS research conducted in the 70’s and 80’s. These
findings will be compared to a modern understanding of the local environment in the Discussion

12
section, to give a better understanding of how both changes in climate and in human
development of the Arctic coastal plain may impact the studied shorebird species.
Focus Species
Four shorebird species are the focus of this study: two phalaropes from the genus
Phalaropus, the Red-necked phalarope (Phalaropus lobatus) and the Red phalarope (Phalaropus
fulicarius) as well as two birds from the Arctic shorebird family Calidris: Semipalmated
sandpiper (Calidris pusilla) and Pectoral sandpiper (Calidris melanotos). All of these migratory
birds find their way to ANWR during the end of May and throughout June. Having established
their local territories in ANWR, the birds begin the process of mating and the strategic process of
deciding nest location.
Red-necked phalarope
Both of the phalarope species are polyandrous: the male is responsible for incubating and
brooding the eggs and caring for chicks while the female lays eggs and moves on, potentially to
find another mate and lay more eggs. Breeding females are distinguished from males by their
brighter plumage and larger body size. Phalaropes determine nesting in a biparental manner,
where both the male and female participate in determining nesting location. The Red-necked
phalarope (Phalaropus lobatus) is one of the world’s smallest seabirds and is the smallest of the
phalarope species (Rubega 2020). The majority of the year (around nine months), the P. lobatus
spends its time on the ocean feeding on planktonic invertebrates, while the other three months
serve as the species’ breeding period where it nests inland in Alaska, northern Canada, northern
13
Scandinavia and northern Russia. On its migration route it stops in the open ocean, or if
migrating inland, on large saline lakes to forage. Very little is known of the species while it is
overwintering, making its nesting period its most accessible for research. Nest site selection
begins with the female 5-7 days before selection and the male joins 1-2 days prior to selection.
Typical vegetation types chosen by P. lobatus include those where sedge is the primary plant,
also significantly moss hummocks with grass, sedge, forbs and low amounts of shrubs (Murphy
1981). Scrape formation occurs between two and five days before eggs are laid by the female
and young leave the nest within 24 hours of the first egg hatching (Rubega 2020). During its
nesting period, P. lobatus is known to forage on small aquatic invertebrates and flying aquatic
insects (most prominently Diptera and Coleoptera orders) in small pools and ponds near nest
locations (Baker 1977). Both phalarope species conduct foraging in a unique way by spinning in
circles in the small water sources that they forage in, using their beak to stir up subsurface
sediment layers that lift their prey to the surface so that they can pick them with their bill
(Rubega 1993). The clutch size of P. lobatus is typically four eggs. To avoid giving nest location
to predators when incubating, the male will walk between 10 and 50 cm from the nest before
taking off to fly to forage. In the presence of a predator the average flushing distance was found
to be five meters, although with some notable variability (between 1 and 30 meters; Sandercock
1997). Eggs begin starring (where small star-shaped perforations become noticeable on the egg
shell from the chick getting closer to its hatch) between two and four days prior to hatch and
pipping begins one to two days before hatch. Larger egg fragments are flown away from the nest
while some minute fragments are left behind.
14
Red phalarope
Red phalaropes (P. fulicarius) spend up to eleven months of each year in their marine
environment and their migratory route is completely marine (unlike P. lobatus that migrates
continentally). The wintering and migratory diet of P. fulicarius consists typically of the
crustaceans that surround whales, while its breeding diet is mostly small invertebrates and
aquatic insects. P. fulicarius are sexually dimorphic, like P. lobatus, having larger females with
brighter plumage than males (Schamel and Tracy 1977). P. fulicarius breeding range is more
restricted to coastal Arctic than that of P. lobatus--closely nesting along the coastline of North
America and Russia. Overwintering takes place in the Pacific along the coastline of southern
North America and South America, in the Atlantic close to the coast of southern USA and the
Caribbean, and in the Atlantic along western Africa (Tracy 2020). Breeding takes place on moist
tundra near small pools (within at least 200 meters) with preference to vegetation that is poorly
drained and level with higher amounts of sedges and hummocks (Kischinski 1975). Notably, P.
fulicarius has less preference for saline pools for foraging than P. lobatus in northern Alaska
(Troy Ecological Associates 1994). Previous research has also identified a notable difference in
preference for moist vs dry habitat (with P. fulicarius showing preference for moist). This causes
even greater restriction for P. fulicarius, combining its preference for moist tundra with near
coastal areas. Foraging behavior differs from P. lobatus, where P. fulicarius edge feeds as
opposed to surfacing feeding and swimming (Elander and Blomqvist 1986). Scrape formation
begins two to four days before egg laying and is typically done in pairs (another notable
difference from P. lobatus --breeding strategy is much more mutualistic for P. fulicarius as both
sexes participate in nest site selection). Much like P. lobatus, it is unknown whether the male or
female ultimately chooses the nesting location. Vegetative preferences for nesting sites include

15
most typically sedge and close to shallow water sources for foraging. Clutch size is typically four
eggs, and the female does not revisit the nest after the final egg is laid. Incubating males will
flush when predator is nearby from between 30 and 50 meters, but may also exhibit distraction
displays like a false broken wing or a “rodent run” where they do not fly away but only run on
the ground away from the nest (Mayfield 1979). Pipping and starring of eggs is on the same
timeline as P. lobatus, as is the disposal of egg shells.
Pectoral Sandpiper
The Pectoral sandpiper (C. melanotos) belongs to the Calidris sandpiper family, it is
larger than the Semipalmated sandpiper (C. pusilla) also in this study. C. melanotos breeds along
the north slope of North America and northern Russia and migrates to its wintering grounds in
southern South America and southern Australia and New Zealand. In its breeding range, C.
melanotos has preference for wet and well vegetated habitats where it prefers raised hummocks
with sedges and grasses—and does not nest in dry tundra areas (Troy Ecological Associates
1994). In the early summer, C. melanotos forages in tundra meadows and edges of polygons, but
midsummer it shifts to wetter areas surrounding ponds and lakes (MacLean 1969). C. melanotos
forages by probing and jabbing into substrate at water edges into substrate and pecking at both
larval and adult arthropods in northern Alaska (Holmes 1968). Males and females both arrive at
the breeding location in late May where males will immediately begin to establish territories to
defend against other males before females arrive. Females will spend several days to determine
appropriate mate and site location and begin egg laying in mid-June (Pitelka 1959). Females
select nesting sites without male participation, choosing drained areas within wet sedge tundra.
Nesting behavior has been previously examined for the relevance of the nesting construction,

16
where it was found that nest scrapes are designed to reduce heat loss for clutches (Reid 2002). C.
melanotos constructs its nest with a nest scrape depression depth that is as small as possible to
ensure minimal heat loss through wind convection. Insulation material selected by sandpipers
maintain beneficial insulated properties when damp which is essential given the environmental
conditions that they nest in. Previous research relating to C. melanotos has found intense sexual
selection exists within males in the species because of their polygynous behavior calling them to
nomadically move through breeding range searching for females to mate with (Kempenaers
2017). This behavior can be significant for its inhibition of allopatric speciation, ensuring
unrestricted interbreeding within geographically different areas within the entire population’s
range. In the situation of the C. melanotos and C. pusilla, nest location is decided by the female,
as the species are polygynous. These habits can inform the nesting preferences of each species,
which are decided in a uniparental manner in the sandpipers, where males create nesting scrapes
in specific locations, but females ultimately determine which male to mate with and which nest
scrape to lay eggs in. Clutch size is typically four eggs, and the interval between laying each egg
is more than 24 hours (Parmelee et al. 1968). Only females incubate eggs and spend a large
portion of their incubation period on the nest. Females will attempt to hide nest location from
predators by leaving on the ground, but will flush if close (observationally from about 10-20
meters) and rodent-run to distract (the practice of scrambling on the ground to imitate a rodent to
attract the attention of the predator). Pipping and starring follows similar timeline as both
phalarope species.

17
Semipalmated sandpiper
Roughly half the size of C. melanotos, the Semipalmated sandpiper (C. pusilla) breeds in
the Arctic and overwinters along the coastline of northern and central South America. It is
seasonally monogamous and territorial--it has proven to be nonsocial in its breeding choices,
behaving in a non-conspecific manner (Hicklin 2010). In very rare circumstances, the C. pusilla
has been found nesting in a colonial manner, making the phenomena something worth
investigating in this study (Jehl 2006). There have been numerous studies on C. pusilla that have
found significant population decline (more notable than any of the other three species included in
this study) at its migration staging areas (Morrison et al. 2001). C. pusilla most commonly breeds
in low, sub-Arctic tundra near river deltas. It forages on benthic invertebrates by pecking and
probing, but has been noticed to also suck biofilm from water surfaces (Ginn 2009). Diet
preferences in Alaska are most commonly Diptera order insect larvae (Holmes and Pitelka 1968).
Arrival to breeding grounds begins in late May and early June, with males arriving prior to
establishing territories. Males are known to establish the same territory that they used in the
previous year (Gratto et al. 1985). Pairing occurs quickly and both male and female C. pusilla
participate in nest-scraping. Males select nest sites that are near water sources and on small
hummocks or in a clump of sedges and do reuse previous sites. Egg laying begins roughly one
week after pair formation (Ashkenazie and Safriel 1979). Average clutch size is four eggs with
the interval of egg laying being as long as 30 hours between each egg, giving a total laying time
of over four days (Gratto-Trevor 1991). Both sexes participate in incubation and in relatively
equal intervals, with males during the day and females at night (Jehl 2007). Pipping and starring
signs are similar to other species, and parents dispose of shells in similar manners to other
shorebird species (Hicklin and Gratto-Trevor 2020).

18
Nest Site Determination
There are many factors that shorebirds consider when determining the location of their
nesting site: food availability, timing of snowmelt and vegetation greening, predator abundance,
and alternative prey abundance. Species may exhibit conservative or opportunistic settlement
strategies in their site determination (Saalfeld 2015). Conservative species, which exhibit high
site fidelity, are more impacted by previous year conditions than current local conditions. Those
who exhibit natal philopatry will nest in the same area that they were born and can be defined as
highly conservative. P. lobatus and C. pusilla have been observed to follow this trend.
The timing of arrival and departure are also essential considerations for nesting success in
shorebirds. Higher latitudes like the Arctic have reduced (compressed) breeding schedules,
making a small window for nesting to brood success for all shorebird species that summer in the
area. Different species react differently to the temporal stress: P. fulicarius have reduced their
incubation periods, while C. pusilla have higher risk of paternal abandonment in the late summer
(Sandercock 1998). The potential for phenological mismatch, especially in regards to trophic
availability, is becoming a research topic of significant value for migratory birds.
Incubation Periods and Initiation Dates
Clutch initiation dates (CIDs) are an essential part of the reproductive biology of avian
species. Understanding the variability within individual species’ phenology to being nesting is an
important assessment of climate change adaptability. Previous research has found that all four
shorebird species have advanced CIDs that range from 0.40 to 0.80 days (within the nine year
study; Liebezeit 2014). Research found that snowmelt was an especially important
environmental factor in determining the nest initiation (which further alludes to the significance

19
that changing climatic conditions will have on the species). Advancement of CIDs has been
shown to help the shorebird species avoid mismatch on a trophic level: allowing them to access
the invertebrates that they forage on during their nesting period. Also significant to the
reproductive biology of the shorebirds is their incubation period. Table 1 represents the
respective incubation periods of each species in the study averaging to a 20.75 day incubation
period among the four (between laying of eggs and hatching of eggs). This does not include the
vulnerable time after egg laying where hatchling brooding takes place (typically less than a 24
hour period) and the scrape formation that occurs prior to the egg laying (typically between four
and seven days for all study species). In this study, incubation period does not begin until the
final egg is laid (which serves to offer even more vulnerable time that the adult is on ground at
the nest site). The data in Table 1 is based off of previous research on the species in the local
range, but still closely match those used in other studies (discrepancies like these are addressed
in Sandercock 1998).
Table 1: Average incubation period of the four focus species based on data provided by the
Canning River Delta “Bird Camp” Research Group (Freeman 2017)
Species Incubation
Period in days
PESA 22
REPH 20
RNPH 21
SESA 20

20
Nest Success
Data collected from Canning River Delta between 2010 and 2016 recorded only two
instances of weather induced nest failure (out of the 1,860 nests recorded) according to the
Canning River Delta “Bird Camp” USFWS site (Freeman 2017). Another important factor for
shorebird nest success is the presence of avian predators that feed on shorebirds and their eggs.
The most common avian predators are the Pomarine jaeger (Stercorarius pomarinus), the
Parasitic jaeger (S. parasiticus), and Glaucous gull (Larus hyperboreus). Each of these predators
overlap in their nesting time and location with the shorebirds and can impact sample data
accuracy when they predate in specific areas decreasing the nesting success of the shorebirds.
Another direct predator of the shorebirds and their eggs are the Arctic fox (Vulpes lagopus) and
Red fox (V. vulpes) which both den and raise their young in the same areas as shorebird nests
and can contribute to significant decline in local annual shorebird abundance when nearby. A
notable contributor to the likeliness of predation is the activity of the parent nesting. Martin
(2000) found that parental activity increases during the nesting stage (as opposed to the
incubation stage pre-birth) when caloric intake of the parent is at its highest to supplement the
diet of the chicks. This at-risk period can contribute to greater depredation and is the source of
convergence between parental activity and nesting sites and should be considered in the
assessment of nesting success. It is important to acknowledge that while not being directly
assessed in this study, parental behavior to avoid depredation is a significant variable in nesting
success (Smith 2007). Local stress conditions created by the presence of avian and mammalian
predators can significantly change the survey results on an annual basis. Simultaneous fox
research was being conducted at the camp to understand the presence of predator species and
their proximity to the survey site.

21
The nesting behavior of shorebirds can differ significantly between species. In the
situation of both sandpiper species, research found that enhanced tundra microrelief increased
nesting site selection (Cunningham 2016). Further, the research found that these two species also
had statistically significant preference for non-conspecific nesting locations: these species
avoided nesting closely to those of their same species. This affirms the conclusion of the
Cunningham study that shorebirds make preference first to habitat type and then to proximity to
other species. The study also found preferences in P. fulicarius for moist environments; a habitat
distinction relating to the wetland habitat type to be used in this study. While this study will not
cover sex ratio, it is beneficial to note that sex-ratio distribution within populations can have a
significant impact on the overall fitness of the population. A study conducted with P. lobatus
determined that their polyandrous behavior still result in greatest fitness within a 1:1 female to
male sex-ratio (English 2014). An aggregation of biotic and abiotic factors directly implicate the
success of shorebird nesting, and while it is difficult to determine the actual cause of nesting
success and failure, it is beneficial to understand the correlations present between the rate of
success and failure of the different species and the environmental conditions that were present
within one summer.

22
Methods:
Habitat Differentiation
One of the most important distinctions of this study is the qualification of the different
habitat types that exist within the study area. The breakdown of habitat types will follow
previous analysis of similar environments in the same area (Brown 2006). The first and easiest
way to break down the habitat types found in the study area is to distinguish between land and
non-land. Non-land includes any water formation: ponds, lakes, and the Staines River that runs
through the study site. Land can be broken into four habitat types: wetland, riparian, moist and
upland. When viewing the Arctic tundra plain from above, it appears to be a mosaic of low and
high centered polygons of vegetation patterning the land alongside different sized water bodies.
The low centered polygons are typically classified as wetlands due to their moistness and are
most abundantly composed of sedges (Carex aquatilis and C. chordorrhiza, and Eriophorum
angustifolium). The moist habitat type is composed of flat centered polygons and are
characterized by improved drainage. Moist areas are most abundantly composed of mosses
(Tomenthypnum nitens and Hylocomium splendens), sedges (Eriophorum angustifolium and
Carex bigelowii), willows (Salix planifolia and Salix reticulata) and Dryas integrifolia. The
upland habitat type includes high centered polygons that are abundant with tussock sedge
(Eriophorum vaginatum) and shrubs (Betula nana and Salix planifolia). This is the least moist
habitat type in the survey. The final habitat type, riparian, includes gravel bars and floodplains
with riparian shrub vegetation (Salix lanata, S. alaxensis, and S. glauca). These habitat types are
distinguished partially by the species of vegetation that they include, but more so based on the

23
available Landsat data that Jorgenson et al. (2018b) used to determine the first baseline study of
vegetation present throughout ANWR.
Study Site
In order to collect data on the nesting location and success of the four bird species, a
sample area in ANWR was established in proximity to the Staines River that covers all of the
habitat types. The study area is the two kilometer radius surrounding Bird Camp itself: the
surrounding area is broken into 37 roughly evenly sized plots, each around 600 square meters
(excluding water formations). During the months of June and July of 2019, each plot was
surveyed by two to three of the crew members to identify any active shorebird nests as well as
any other bird nests that may be occupied on the plot. Shorebird nests were found when parental
behavior was exhibited that alluded to the presence of a nest through different means such as: a
parent flushing from a specific spot, staying unexpectedly close to a certain area, or using
distraction displays to confuse or divert the attention of the observer. When suspect behavior was
exhibited, the origin area of the behavior was closely examined to determine the exact location of
the nest. If the observer was unable to find the nest from the initial flush, they moved away from
the area (roughly 20-40 m away) until the parent returned to the location. In the first round of
surveys, each plot was searched in a group for a human time amount of twelve hours: two people
could search a single plot for six hours, or three people for four hours. All plots were searched a
second time for a total of four human hours (two people searching for two hours) to determine
the presence of any remaining nests on the plots. Nests located during surveys were GPS tagged
and randomly determined to be revisited or to remain undisturbed. They were marked by a line
of three popsicle sticks leading towards the nest from the North in a five meter spacing between

24
each popsicle stick, with the final stick being located within a meter of the nest bowl. Those that
were revisited were done so based on the results of an egg floating test which determined an
approximate incubatory period of the clutch so that revisit timing could be assigned to minimize
nest disturbance and potential nest failure. Egg floating has been proven in previous
experimentation to be an effective form of incubation date estimation (Mabee 2006). To conduct
the float test, each egg from the bowl was carefully removed and then placed into a small
container filled with warm water. The egg was pushed to the bottom of the container in the water
and then released: the height and angle at which the egg would float gives accurate information
as to the likely amount of time until the hatch of the egg. Cracked eggs were not floated, and
previous research has shown that floating uncracked eggs does not impact their hatch likelihood
(Sandercock 1998). Using the method in Mabee 2006, C. pusilla incubation age was estimated to
an accuracy between one and three days. This temporal information allowed for later visitation to
determine the health and eventual outcome of the eggs in the nest. Later visits with later signs of
hatch were not floated, but instead closely examined for signs of piping to determine an
oncoming hatch. Eventually, both nest re-visits and undisturbed nests were visited after the hatch
date of the nest had passed to assess and distinguish between a nest success and failure. Eggshell
evidence has become a common methodology to determine the fate of a nest (Mabee 2006).
Eggshell fragments between 1-5 mm proved to be prominent at successful nests (96% of the time
in the Mabee study) and eggshell tops and bottoms were only present at successful nests. Final
post-fates could result in one of three different outcomes: abandonment, depredation, or hatched.
Signs of abandonment came from revisitation to a nest with eggs feeling cold when examined.
Depredated eggs may have completely disappeared when not at a time expected to have hatched
during visitation, or the nest could have signs of predator activity (fox urine scent or shell
25
fragments found outside of the nest bowl). Hatched nests could be signified by the actual
presence of chicks during the late visitation or presence of eggshell top or bottom or other
appropriately sized fragments. These “post-fate” results were used to determine the relationship
between the success of nests of different species to the habitat type that they nested in as well as
the relationship between nest success and other environmental variables that may have
implicated the nest and the adult incubating it.
Use of Remote Sensing
The use of light detection and ranging (LiDAR) and normalized difference vegetation
index (NDVI) overlay imagery has historically been used in experimentation when dealing with
Arctic tundra polygonal terrain (Gangodagamage 2014). This study employed the work of
Jorgenson et al., specifically through their creation of the “Landcover and Vegetation Map,
Arctic National Wildlife Refuge” composed of data from Landsat Thematic Mapper, multiple
Digital Elevation Maps (DEMs), aerial photography, and ground surveys (Jorgenson 2018b). By
overlaying the feature classes of vegetation over the GPS location of nests, the specific habitat
type of each nest can be determined. Issues with the significance of the findings of habitat
preference arise based on the rapidly changing landscape of the Arctic coastal plain. Each year,
the hydrology that determines the vegetation classification system may differ, but the underlying
value of the classes is still significant to understanding the preferences of the different species.
The classification scheme used contained 17 different habitat types based on the features
examined.

26
Table 2: Vegetation classification system based on the classification system used in Jorgenson
2018b.
# Habitat Class Description of Class
1 Wet Graminoid
Tundra
Poorly drained tundra with sedges or grasses, with few shrubs
or mosses
2 Graminoid Tundra With 10-50% moist inclusions, often on low-centered polygons
or strangmoor
3 Sedge-Willow Tundra 10-50% moist inclusions, often on low-centered polygons or
strangmoor
4 Moist Sedge-Willow
Tundra
Moist tundra with sedges, mosses and willows
5 Moist Sedge-Dryas
Tundra
Moist tundra sedges, mosses, and Dryas. Sedge hummocks and
frost scars give hummocky appearance
6 Moist Sedge-Tussock
Tundra
Moist tundra dominated by cottongrass tussocks with
understory of dwarf shrubs and mosses
7 Moist Shrub-Tussock
Tundra/Water-track
Shrub Tundra
Tussock tundra dominated by erect willow and birch, or
shrubby drainage complexes in foothills
8 Moist Low Shrub
Tundra
Upland slopes with erect willow and birch
9 Moist Shrub Tundra Shrubby polygonized tundra with herbaceous types in polygon
troughs
10 Dryas-Graminoid
Alpine Tundra
Moist to dry alpine tundra with dwarf shrubs, graminoids,
forbs, lichens, and bare ground
11 Riparian Shrub Well-drained river terraces with low or tall willows
12 Dryas River Terrace Well-drained river terraces with Dryas mat, other dwarf
shrubs, forbs, and lichens
13 Partially vegetated 10-15% vegetated
14 Barren <10% vegetated
15 Ice Ice and snow
16 Water
17 Shadow

27
Table 2 includes all tundra ecosystem habitats that were surveyed, but this study only
encompasses the area immediately on the coastal plain, about two miles from the Arctic Ocean:
this means that fewer habitat classifications existed within the study than in Brown 2006. Only
six habitat types were found within the study area that included nests: 1, 2, 3, 5, 14, and 16.
Using ArcGIS Pro, the Jorgenson Map was overlaid on the GPS locations of each of the
individual species to determine what class they lay within. Some discrepancies were significant
enough to determine that the summer 2019 had been significantly altered compared to the
Jorgenson map fifteen years since its initial survey.
Other Environmental Factors
Further analysis included the parameters of the initiation date and its average, minimum,
and maximum air temperatures based on the nearby Kaktovik Weather Station, as well as for the
“last date alive” which was determined to either be the day of hatch or the day of failure or
depredation. Concealment percentage was also included in the study based on the percent of
grass and sedge coverage that was identified while looking down onto the nest from above.
Concealment percentage was identified by surveyors into 5s from 0% coverage to 100%
coverage. After all concealment percentages were gathered, they were then grouped into four
different categories 1-4 by average the total amount and evenly distributed to make four even
concealment categories.

28
Table 3: Using the “ntile” feature in R Studio, the concealment percentages were broken into
four groups to lessen the significance of observer bias as discrepancies in percentages may have
existed between the surveying biologists
Concealment Category Concealment Percentage
1 0-29
2 30-50
3 51-68
4 69-100
Statistical Analysis
Statistical testing compared categorical variables (vegetation, ultimate call, and
concealment) with each other by creating contingency tables between each of them. The Fisher’s
Exact Test was run on each of their contingency tables to determine any statistical significance.
Categorical variables were also compared against each of the quantitative variables (initiation
date, initiation date air temperature (average, minimum, maximum, variance), termination date,
and termination date air temperature (average, minimum, maximum, variance) to gain a better
understanding of how environmental conditions on the day of both initiation and termination
(through both success and failure) may implicate each species. Bar graphs were used to display
the visual results of nesting success based on the habitat. After habitat preference was modeled,
the ultimate call of each available nest (excluding N/A nests) was included to understand how
habitat type location may correlate to the success of that nest. The initial habitat assessment
conducted in Table 5 includes all individuals of the four species group, regardless of the fate of
their nest. This includes nests that were determined “N/A” and were not able to be declared to
have failed or succeeded.

29
Results:
A total of 245 nests of both shorebird and avian predators were observed during the
summer of 2019 making for a total of 237 shorebird nests. Table 4 shows that the most abundant
species was C. melanotos followed by C. pusilla. The least abundant species were the
phalaropes, with only 16 P. lobatus nests being identified in the study. Individuals that were
determined “N/A” were not able to be given a significant probability of having succeeded or
failed. These individuals were included in statistical testing that dealt with species preference but
not in any testing that dealt with nest success. After removing all N/A values, a total of 219 nests
were able to be included in the statistics testing related to nest success. Success rate of species
varied between 44 and 63% with C. pusilla and C. melanotos having similar success rates
around 44% and P. lobatus having the highest success rate at roughly 63% (notably because of
its low total abundance). This does not account for the potential double counting of an individual
that attempted to brood a second time after an initial failure. Figure 2 visualizes the findings of
success and failure within species.

30
Table 4: Species listed by abbreviation code with their respective nesting hatches and failures.
Nesting status was only determined for phalarope and sandpiper species. Total (H/H+F)
represents the total amount of individual nests in the study. % H represents the percentage of
individual nests that succeeded in hatching within a species.
Fail Hatch N/A Total
(H/H+F)
% H
L.
hyperboreus
N/A N/A 7 N/A N/A
S.
parasiticus
N/A N/A 1 N/A N/A
C. melanotos 62 49 4 111 44.14
P. fulicarius 10 17 1 27 62.96
P. lobatus 7 9 1 16 56.25
X. sabini N/A N/A 1 N/A N/A
C. pusilla 37 30 9 67 44.77
Habitat Preference Assessment
Results from the initial habitat assessment show that a significant amount of nests were
found to be water (classification 16) or barren (classification 14) when overlaid on the in
Jorgenson (2018b) map (Table 5). The initial discrepancy is an important note to confirm that
ice-wedge melting has been a significant source of wetland draining in the local habitat. Refined
results show the edited data that was included in the statistical testing (Table 6). Editing this data
was done by confirming nest location with available field data regarding nest location and
confirmed by assessing the location on Arc Pro. The primary sources of error came from the
wetland area in the northern corner of the field site (where nests were assigned values in water as

31
opposed to the feature class closest to water), and from the riparian zone surrounding the
Canning River (nest sites were reassigned to closest habitat class to their location). In total, 50
nests were relocated through this process. Tests were run to gain a better understanding of
potential preferences of shorebirds for habitat types with some level of confidence in
understanding that the classes that they were reassigned to were reasonable based on the gradient
of succession that the tundra habitat experiences. Barren land and open water in the remote
survey is almost always surrounded by habitat classification values 1 and 2: moist, poorly
drained graminoids in low-lying polygons. Figures 4 and 5 visually represent the habitat
preferences of the shorebird species after editing. There is a strong preference in sandpiper
species for habitat types 1 and 2 with occasional usage of habitat types 3 and 5. Phalaropes also
preferred use of habitat types 1 and 2, with no use of habitat 3 and occasional use of habitat 5. A
notable observation is that the sandpipers made use of habitat class 3: Moist sedge-willow
tundra. This could be useful in understanding a distinction is plant species utilization by
sandpipers as opposed to phalaropes.

32
Table 5: Habitat types against individual species, species families, and total individuals for
amount of nests within each.
Wet
graminoid
tundra
Graminoid
tundra
Sedge
willow
tundra
Moist sedge-
dryas tundra
Barren Water Total
C.
melanotos
29 43 8 22 5 8 115
C. pusilla 14 29 2 10 7 14 76
Sandpiper
total
43 72 10 32 12 22 191
P. lobatus 4 3 0 3 1 6 17
P.
fulicarius
8 10 0 1 1 8 28
Phalarope
total
12 13 0 4 2 14 45
Total 55 85 10 36 14 36 236

33
Table 6: Species habitat preference after adjustment based on observational data and closest
proximate habitat type as number of nests within each type.
Wet
graminoid
tundra
Graminoid
tundra
Sedge
willow
tundra
Moist sedge-
dryas tundra Total
C.
melanotos
33 52 8 22 115
C. pusilla 18 46 2 10 76
Sandpiper
total
51 98 10 32 191
P. lobatus 9 4 0 4 17
P. fulicarius 16 11 0 1 28
Phalarope
total
25 15 0 5 45
Total 76 113 10 37 236

34
Figure 4: Sandpiper nesting preference displaying C. melanotos vs C. pusilla nesting abundance
in each of the 4 used habitat types.
Figure 5: Phalarope nesting success displaying P. lobatus vs P. fulicarius nesting abundance in
each of the 6 used habitat types accounting for both hatches and failures.

35
Habitat Nesting Success
Habitat type did not significantly impact the nesting success of any of the bird species.
Running Fisher Exact Tests for the contingency tables for each species did not reveal any
statistical significance (Figures 6-8).
Figure 6: All species nesting success based on ultimate determination after tiny tag and
observational determination.

36
Figure 7: Both phalarope species habitat preference overlaid with the ultimate call to determine
how habitat may have impacted nest success—no significant relations were found.
Figure 8: Both sandpiper species habitat preference overlaid with the ultimate call to determine
how habitat may have impacted nest success--no significant relations were found.

37
Concealment Results
P. lobatus nests showed significance in the relationship between increased coverage and
increased nest success. Contingency tables were created for each of the species based on their
preference for concealing their nests to different degrees of coverage. The initial observations of
concealment were grouped into averaged categories 1-4, one being least covered and four being
most covered to understand if coverage actually played a role in nest survival. Fisher Exact Tests
were run for each of the tables (Figures 9-11).
Figure 9: Nest coverage percentage compared to the ultimate call of nesting success or failure
based on the unfiltered original findings for concealment.

38
Figure 10: Grouped coverage into four classes (1-4) compared to the nest success for the
sandpiper species. 1 represents least covered and 4 represents most covered. No significant
relations were found.
Figure 11: Grouped coverage into four classes (1-4) compared to nest success for the phalarope
species. 1 represents least covered and 4 represents most covered. Significant results for both
species determined that coverage had important correlation to nest success.

39
Initiation and Termination Date Results
The initiation average identified that warmer temperatures significantly impacted the
likelihood of nest initiation of both sandpiper species (Figure 12). C. melanotos was the only
species that was not averse to colder initiation dates. Notably, all C. melanotos nests were
initiated on days that had average temperatures below 45 degrees F. The termination date of each
nest was grouped with that day’s respective average, minimum, and maximum air temperature to
determine if temperature had any correlation to the success of the nest (Figures 14-17). Figure 17
is especially important in identifying that variance is less prevalent in the phalarope species than
in the sandpiper species.
Figure 12: Box plots for both sandpiper species vs. the average temperature on the day of nest
termination (through failure or success).

40
Figure 13: Box plots for both phalarope species vs. the average temperature on the day of nest
termination (through failure or success).
Figure 14: Box plot demonstrating the initiation date average temperature of each nest for all
four species.
Figure 15: Box plot demonstrating the initiation date maximum temperature of each nest for all
four species.

41
Figure 16: Box plot demonstrating the initiation date minimum temperature of each nest for all
four species.
Figure 17: Box plot demonstrating the initiation date variance temperature of each nest for all
four species.

42
Discussion:
Habitat Preference
The four species in this study provide a necessary range of shorebird species to gain a
better understanding of how the greater shorebird community will respond to changing
conditions in the Arctic tundra. More importantly, these birds serve to represent not only
shorebird species, but the entire ecosystem that exists in the Arctic tundra: insect species that
they forage on, and the predatory species that they provide resources to. C. pusilla is already
designated as near threatened (Hicklin and Gratto-Trevor 2020) and both phalarope species have
shown some population decline (Tracy et al. 2020). Disparities between the sandpiper and
phalarope species is a useful basis to understand local preference differences within Arctic
National Wildlife nesting shorebirds. While habitat preference did not reveal any immediate
significant habitat preferences on the classification system used from Jorgensen 2018, the
general importance of habitat classes 1, 2, 3, and 5 reveal necessary conservation preference
when determining essential habitat for shorebird species. Pairing this understanding with
takeaways from the mismatching that occurred in comparison of the nest locations and their
overlay with the map may raise the alarm on how changes to the local habitat composition of the
Arctic coastal plain may negatively impact all shorebird species. It is important to note that the
reassigning of nests operates under multiple assumptions that reduce their significance: the local
differences between habitat classifications 1, 2, 3, and 4 are based on very detailed plant genus
identifications which were remote sensed and compared over ten years ago. The most recent use
of the vegetation remote sensing (done in 2015-2017) showed changes in vegetation cover, most
notably in thermokarst-wetting and in river deposition in the tundra ecosystem (Jorgenson et al.

43
2018a). This counters the oversampling of water and barren land in the habitat assessment
findings and further demonstrates the variability of the local conditions of the coastal plain.
Further research needs to conduct habitat assessment of nest sites upon their identification to
avoid this issue. Previous research on P. lobatus preferences for specific habitat conditions has
confirmed aversion to shrub cover and mud (Walpole 2008). Jorgensen and other important
Arctic research has confirmed that increase in shrub cover has been significant over the past
twenty years and that ice-wedge melting has done significant wetland and open water drainage to
shift habitat conditions on the coastal plain, yet phalarope preference for graminoid nesting
locations in close proximity to open water sources has remained the same. Sandpiper species
showed greater habitat versatility in this study, but still proved to have a significant preference
for one of the three habitat classes that consisted of graminoid vegetation with semi-moistness
(Figure 8). No species were supported on barren rock near the river or on completely dry high
terrace polygons, which research has found may become increasingly dominant in the near future
(Jorgenson et al. 2018b). River deposition is increasing which could in turn increase the amount
of the barren land habitat class that surrounded the Canning River offshoot that ran through the
study area (Ladegaard-Pedersen 2017). These changing conditions emphasize a need for greater
habitat assessment at CRD to better understand both how birds are utilizing habitat, and how the
habitat itself is changing locally. P. fulicarius and their restricted habitat selection during
breeding is especially at risk in the coming years as the Arctic coastal plain will continue to shift
towards more dramatic cover changes that will redesign the entire landscape (Jorgenson et al.
2018b).

44
Air Temperature
Air temperature differences in initiation and in termination revealed the significance of
local weather conditions in the nesting success of the different shorebird species. The phenology
shifts of migratory birds have been well studied, specifically in leaving from wintering grounds
based on changing temperatures in those locations (Cotton 2003). Shifts in both arrival and
departure at the Canning River Delta have been identified by previous CRD research, and have
noted the significance of snow melt as a contributor to the advancement in arrival (Freeman
2017). The lack of temperature variance in the phalarope species initiation and termination may
allude to a cautious future where the Arctic tundra may experience even more fluctuation in
average daily temperatures as climate change advances. Previous studies have confirmed that
egg laying is non-random in relation to climate conditions, and opportunistic breeding is a
significant trait allowing for quicker initiation of nests (Duursma 2019). This may confirm the
need for greater monitoring effort towards phalarope species conservation as they may become
more reproductively stressed in the coming years.
Coverage
Coverage results confirmed that both phalarope species relied heavily on using vegetation
to cover their nests (CITE). This behavior requires a specific habitat types that meet both the
restrictions of their foraging preferences (close proximity to open water source), essential access
to graminoids and sedges, and reduction of shrub coverage or barren ground. While coverage
results were less significant for the shorebird family species, they still made significant use of
such features in their nest construction, implying that the condition is still essential for their
nesting (CITE).

45
Future Research
Overall, the study results provide a basic confirmation of the necessarily complex local
environment that makes up the Arctic coastal plain and how its continued changing will have
even more complicated effects on the species that depend on it. In a basic way, the study
confirmed that there have been dramatic changes to the local landscape that need to be measured
alongside the data that is collected about the birds themselves (Table 5-6). The easiest way to
tailor these changes to the study would be to conduct thorough assessments in nest areas using an
organized collection method across the entire research group collecting data. Soil moisture
would be an important collection note, taken at a specific distance in the radius surrounding the
chosen nest site: potentially at the three markers placed near each nest. This could useful to do
more intensive ecohydrological testing of the changes to the local water cycle, but also to better
classify the habitat type in the specific location in accordance with the Jorgenson classification
system. Even basic botanical observations through rapid ecology surveys of nest sites could be
useful to understand if there are even greater complexities to the choices of the birds in their
nesting locations. Closely monitoring the date of nest establishment and termination will
continue to serve as important markers of the phenological shifts that the species are
experiencing and may even shift the methodology in the coming years to understand if any shifts
in the nest selection process have taken place. At a minimum, data collection dates must advance
as all species continue to arrive earlier each year.
Other Variables
There are other important factors worth addressing outside of the study objectives. This
study does not assess the potential for multiple broodings within a season: the possibility that the

46
parent or parents of a depredated nest may breed a second time in an attempt to hatch. There are
studies that have identified the behavior in C. pusilla, alluding to the possibility that failed nests
could be of the same parents of later nests (Jehl 2007). While colonialism was not exhibited by
the species in this study during this survey year, it is still very possible that the C. pusilla could
participate in the practice--attention should still be given to the proximity of C. pusilla nests to
each other. Finally, little in this research covered the trophic research being done elsewhere to
understand how aquatic insects and other invertebrates that birds rely on in their foraging are
being impacted by the changing conditions. Future research should seek to understand how other
trophic levels are implicated by the changing environment.
Human Impact
Climate change has been referred to frequently in this paper, but with little mention of the
anthropogenic development through oil and gas that may occur in the local coastal tundra that
will exacerbate the effects discussed, and also bring about its own implications. The immediate
impact that climate change and continued human development on the Arctic coast will have on
shorebirds and their nesting locations in the future is being studied with focused energy on the
immediate impacts: discrete changes in conditions that will alter the availability of resources and
shift environmental factors that may detriment the shorebird species. However, there is also the
potential question of how birds themselves will be able to react and adapt to these conditions.
Spring migration phenology is one area of study that questions the ability of migratory birds to
be able to shift their seasonal timeline in movement. Plasticity of migratory behavior is found to
be strongest in social species that do not restrict to very specific habitat conditions, but exhibit
choice in stop over locations (Lameris 2017). Ongoing and further investigation into the

47
plasticity of each shorebird species will be essential for conservation measures to understand
locations that should be emphasized in their preservation, especially if they can be conducted in
non-restrictive locations like the Arctic coastline. Multiple studies have shown relative fitness
differences within species being exacerbated by the ability of an individual to migrate earlier
within a season (Rainio 2006). This is especially important to understand initiation date data on a
larger timeline within a local area.
This 1.5-million-acre coastal plain region has been a source of contention for oil and gas
development over the past four decades, with multiple USGS oil surveys conducted on it to
determine its underground oil content. Many factors contribute to the controversy surrounding
the impending oil and gas development, which has reemerged under the Trump administration as
recently as September 2019 where the 1002 was called to be completely opened to leasing by the
end of year (Eilperin 2017). The House responded quickly with legislation to ban all leasing on
the Pacific and Atlantic coast of the US, which passed but is unlikely to pass in the Senate
(Bennet 2019). Questions about the impact that oil and gas development on the refuge have
implications that extend far beyond their immediate impact on wildlife and transcend into the
human rights of the indigenous people that have occupied the Refuge’s land for thousands of
years--their understanding of the land supersedes any scientific research conducted and the basis
of their opposition to development is the most important argument against development
(Delcomyn 2004). The scope of this paper only considers the impacts on bird species, but it is
important to acknowledge the land of the indigenous Gwich’in Tribe that is being threatened as
an extension of the colonialist oppressive history that has exploited them and their land for
hundreds of years. Oil and gas has been researched for its impact on plant life and has been
found, in the same region of Alaska as the ANWR coastal plain, to have detrimental effects to

48
drier habitat classes, as well as to mosses and lichens (Walker 1978). While these are not the
immediate nesting locations found to be the essential nesting sites for the shorebirds in this
paper, they are still occupied by the sandpiper family birds in some cases, and can serve as
foraging grounds for both species. Drilling sites have been investigated for their use of gravel
and its impact on tundra vegetation and have been found to have persistent effects that last as
long as two decades (Jorgenson et al. 2010). Just the impact of oil site development--not even
drilling itself, could provide noticeable changes to the landscape that will reduce the already
restricted breeding grounds of shorebirds. The understanding of the impact that oil pools have on
aquatic insects also threatens the foraging of these birds to impact their nesting success as well.
Future research should consider the implications that development will have on the trophic
cascade from micro and macroinvertebrates to shorebird species to better understand what
management techniques should be implemented. In the coming years it will be essential to
continue to monitor how shorebird species react to changing conditions locally and globally, and
attempt to discern how specifically local conditions may be the source of declining populations.
Especially in the scenario of the P. fulicarius that is already being pushed to the limits of its
breeding habitat range, it will be important to get annual data on population levels, as its status as
early threatened may become heightened within this decade.

49
Appendix
Map 1: Habitats overlaid onto the study area polygon

50
Map 2: The entire field site with all nest species found on site
51
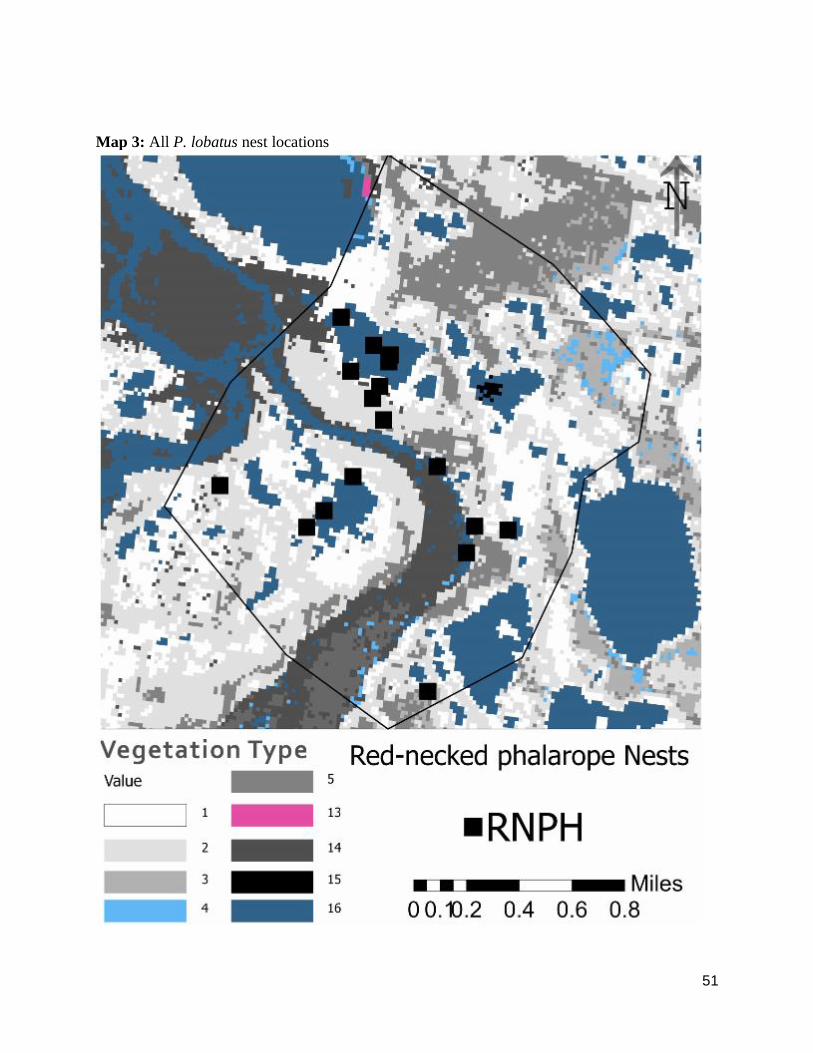
Map 3: All P. lobatus nest locations

52
Map 4: All P. fulicarius nests

53
Map 5: All C. melanotos nests

54
Map 6: All C. pusilla nests

55
Photo 1: Adult C. melanotos foraging on site at the Canning River Delta “Bird Camp”
Photo 2: Two adult C. pusilla foraging in the shallow part of a small thermokarst formed pond
on site

56
Photo 3: A female P. fulicarius brooding her recently hatched chicks (not visible) in a cluster of
sedges on site
Photo 4: A female P. lobatus foraging in a pond on site

57
Photo 5: View of field map with surveying lines for each of the 21 plots visited during the study

58
Literature Cited
Ashkenazie, S. and Safriel, U.N. 1979. Breeding cycle and behavior of the Semipalmated
Sandpiper at Barrow, Alaska. Auk. 96.1: 56–67.
Baker, M. C. 1977. Shorebird food habits in the eastern Canadian Arctic. Condor 79:56–62.
Bennet, M. 2019. Bennet, Markey Introduce Bill to Protect Alaska’s Arctic National Wildlife
Refuge. Press Releases Michael Bennet Colorado U.S. Senate.
Berteaux, D., Gauthier, G., Dominé, F., Ims, R.A., Lamoureux, S.F., Lévesque, E. and Yoccoz,
N.G. 2017. Effects of changing permafrost and snow conditions on tundra wildlife:
critical places and times. Arctic Science, 3, 65-90.
Brown, S., Bart, J., Lanctot, R.B., Johnson, J.A., Kendall, S., Payer, D. 2007. Shorebird
Abundance and Distribution on the Coastal Plain of the Arctic National Wildlife Refuge.
The Condor, 109.1: 1-14
Clough, N. K. Patton, P. C. and Christiansen, A. C. 1987. Arctic National Wildlife Refuge,
Alaska, coastal plain resource assessment-Report and recommendation to the Congress of
the United States and final legislative environmental impact statement: Washington, D.
C., U.S. Fish and Wildlife Service, U.S. Geological Survey, and the Bureau of Land
Management, v. 1 (Report)-xviii + 208 p., 5 pis., 32 figs., 26 tables; v. 2
Comay, L.B., M. Ratner, and R.E. Crafton. 2018. Arctic National Wildlife Refuge (ANWR): An
Overview. Congressional Research Initiative. 7-5700.
Cotton, P.A. 2003. Avian migration phenology and global climate change. Proceedings of the
National Academy of Sciences 100.21: 12219-12222.
Cunningham J.A., Kesler D.C., Lanctot R.B. 2016. Habitat and social factors influence nest-site
selection in Arctic-breeding shorebirds, The Auk 133.3: 364–377.
Delcomyn, M.T. 2004. Arctic National Wildlife Refuge Oil: Canadian and Gwich’ in Indian
Legal Responses to 1002 Area Development. Northern Illinois University Law Review
24.3.
Duursma, D. E., R.V. Gallagher, and S.C. Griffith. 2019. Variation in the Timing of Avian Egg‐
laying in Relation to Climate. Ecography 42.3: 535–548.

59
Elander, M. and S. Blomqvist. 1986. The avifauna of central Northeast Greenland, 73°15'N-
74°05'N, based on a visit to Myggbukta, May-July 1979. Medd. om Grøn. Biosci. 19.
Eilperin, J. 2017. Trump Administration Working Toward Renewed Drilling in Arctic National
Wildlife Refuge. Washington Post.
English, W.B., Schamel, D., Tracy, D.M. et al. 2014. Behav Ecol Sociobiol 68: 1939.
Freeman, S. 2017. Summary of avian fieldwork at the Canning river delta, Arctic National
Wildlife Refuge, Alaska, 1976-2016. USFWS Fairbanks Field Office.
Frohn, R.C., K.M. Hinkel, and W.E. Eisner. Satellite remote sensing classification of thaw lakes
and drained thaw lake basins on the North slope of Alaska. Remote Sensing
Environment, 97.1: 116-126.
Gangodagamage, C., et al. ( 2014), Extrapolating active layer thickness measurements across
Arctic polygonal terrain using LiDAR and NDVI data sets, Water Resour. Res., 50,
6339– 6357.
Ginn, M. G. 2009. Flexibility in foraging behavior and use of alternate food sources by
Semipalmated Sandpipers Calidris pusilla during migratory stopover in the Upper Bay of
Fundy. Unpublished M.Sc. thesis, Mount Allison University, Sackville, New Brunswick,
Canada.
Gratto, C.L., Morrison, R.I.G. and Cooke, F. 1985. Philopatry, site tenacity, and mate fidelity in
the Semipalmated Sandpiper. Auk. 102(1): 16–24.
Gratto-Trevor, C.L. 1991. Parental care in Semipalmated Sandpipers Calidris pusilla: brood
desertion by females. Ibis. 133(4): 394–399.
Henningsson, S.S. and T. Alerstam. 2008. Does migration promote or restrict circumpolar
breeding ranges of arctic birds? Journal of Biogeography 35.5.
Holmes, R. T. and F. A. Pitelka. 1968. Food overlap among coexisting sandpipers on northern
Alaska tundra. Systematic Zoology 17:305-318.
Hicklin, P. and C. L. Gratto-Trevor. 2020. Semipalmated Sandpiper (Calidris pusilla), version
2.0. In The Birds of North America (A. F. Poole, Editor). Cornell Lab of Ornithology,
Ithaca, NY, USA.

60
Jehl, J. 2006. Coloniality, Mate Retention, and Nest-Site Characteristics in the Semipalmated
Sandpiper. The Wilson Journal of Ornithology, 118(4), 478-484.
Jehl, J.R. 2007. Disappearance of breeding Semipalmated Sandpipers from Churchill, Manitoba:
more than a local phenomenon. Condor. 109(2): 351–360.
Jorgenson, J et al. 2010. Long-Term Recovery Patterns of Arctic Tundra after Winter Seismic
Exploration. Ecological Applications 20.1: 205–221.
Jorgenson (a), J. C., M, T. J., Boldenow, M. L., & Orndahl, K. M. 2018. Landscape change
detected over a half century in the arctic national wildlife refuge using high-resolution
aerial imagery. Remote Sensing, 10(8).
Jorgenson (b), J.C., and D.A. Walker. 2018. Land Cover and Vegetation Map, Arctic National
Wildlife Refuge. ORNL DAAC, Oak Ridge, Tennessee, USA.
Kempenaers B., Valcu, M., Breeding site sampling across the Arctic by individual males of a
polygynous shorebird Nature Volume 541, Pages 528–531 (26 January 2017)
Kistchinski, A.A. 1975. Breeding biology and behaviour of the Grey Phalarope Phalaropus
fulicarius in east Siberia. Ibis. 117(3): 285–301.
Ladegaard-Pedersen, Pernille et al. 2017. Suspended Sediment in a High-Arctic River: An
Appraisal of Flux Estimation Methods. Science of the Total Environment 580: 582–592.
Lameris, T.K., et al. 2017. Potential for an Arctic‐breeding Migratory Bird to Adjust Spring
Migration Phenology to Arctic Amplification. Global Change Biology 23.10: 4058–4067.
Lara, M.J., Nitze, I., Grosse, G. et al. 2018. Reduced arctic tundra productivity linked with
landform and climate change interactions. Sci Rep 8, 2345.
Liebezeit, J.R., Gurney, K.E.B., Budde, M. et al. 2014. Phenological advancement in arctic bird
species: relative importance of snow melt and ecological factors. Polar Biol 37, 1309–
1320.
Liljedahl, A., Boike, J., Daanen, R. et al. 2016. Pan-Arctic ice-wedge degradation in warming
permafrost and its influence on tundra hydrology. Nature Geosci 9, 312–318.
Loranty, M.M. and Goetz, S.J. 2012. Shrub expansion and climate feedbacks in Arctic tundra.
Environmental Research Letters 7.1.

61
Mabee, T. J., Wildman, A. M. and Johnson, C. B. (2006), Using egg flotation and eggshell
evidence to determine age and fate of Arctic shorebird nests. Journal of Field
Ornithology, 77: 163-172.
Macdonald, R.W., T. Harner, and J. Fyfe. Recent climate change in the Arctic and its impact on
contaminant pathways and interpretation of temporal trend data. Science of the Total
Environment. 342.1-3: 5-86.
MacLean, Jr., S. F. 1969. Ecological determinants of species diversity in arctic sandpipers near
Barrow, Alaska. Ph.D. thesis, Univ. of California, Berkeley.
Martin, T.E., Scott, J., Menge, C., Nest predation increases with parental activity: separating nest
site and parental activity effects 267 Proc. R. Soc. Lond.
Mayfield, H. F. 1979. Red Phalaropes breeding on Bathurst Island. Living Bird 17:7-39.
Morrison, R. I. G., Y. Aubry, R. W. Butler, G. W. Beyersbergen, G. M. Donaldson, C. L. Gratto-
Trevor, P. W. Hicklin, V. H. Johnston and R. K. Ross. 2001. Declines in North American
shorebird populations. Wader Study Group Bulletin 94:34-38.
Murphy, S. M. 1981. Habitat use by migrating and breeding shorebirds on the eastern Copper
River Delta, Alaska. Master's Thesis, Univ. of Alaska, Fairbanks.
Newton, I. 2003. Crossing barriers. The speciation and biogeography of birds, Chapter 16.
Elsevier Science, Amsterdam.
Parmelee, D. F., D. W. Greiner and W. D. Graul. 1968. Summer schedule and breeding biology
of the White-rumped Sandpiper in the central Canadian arctic. Wilson Bulletin 80:5-29.
Pitelka, F. A. 1959. Numbers, breeding schedule, and territoriality in Pectoral Sandpipers of
northern Alaska. Condor 61:233-264.
Rainio, Kalle et al. 2006. Climatic Responses in Spring Migration of Boreal and Arctic Birds in
Relation to Wintering Area and Taxonomy. Journal of Avian Biology 37.5: 507–515.
Reid, J. M., Cresswell, W., Holt, S., Mellanby, R. J., Whitfield,. D. and Ruxton, G. D. 2002. Nest
scrape design and clutch heat loss in Pectoral Sandpipers (Calidris melanotos). Functional
Ecology, 16: 305-312.

62
Rubega, M. A. and B. S. Obst. 1993. Surface-tension feeding in phalaropes: discovery of a novel
feeding mechanism. Auk 110:169-178.
Rubega, M. A., D. Schamel, and D. M. Tracy. 2020. Red-necked Phalarope (Phalaropus lobatus),
version 1.0. In Birds of the World (S. M. Billerman, Editor). Cornell Lab of Ornithology,
Ithaca, NY, USA.
Sandercock, B. K. 1997. The breeding biology of Red-necked Phalaropes Phalaropus lobatus at
Nome, Alaska. Wader Study Group Bulletin 83:50-54.
Sandercock, B. 1998. Chronology of Nesting Events in Western and Semipalmated Sandpipers
near the Arctic Circle. Journal of Field Ornithology, 69(2), 235-243.
Schamel, D. and Tracy, D 1977. Polyandry, replacement clutches, and site tenacity in the Red
phalarope (Phalaropus Fulicarius) at Barrow, Alaska. Bird-Banding 48.4: 314–324.
Shaftel, R., Bogan, D., Merrigan, D., and Jones L. 2018. Conditions of lakes in the Arctic
Coastal Plain in Alaska: water quality, physical habitat, and biological communities.
Alaska Center for Conservation Science: University of Alaska Anchorage.
Smith, P.A., Gilchrist, H.G., Smith, J.N.M. 2007. Effects of Nest Habitat, Food, and Parental
Behavior on Shorebird Nest Success. The Condor, 109(1), 15-31.
Tape, K., Sturm, M., and Racine, C. 2006. The evidence for shrub expansion in Northern Alaska
and the Pan‐Arctic. Global Change Biology, 12: 686-702.
Tracy, D. M., D. Schamel, and J. Dale. 2020. Red Phalarope (Phalaropus fulicarius), version 1.0.
In Birds of the World (S. M. Billerman, Editor). Cornell Lab of Ornithology, Ithaca, NY,
USA.
Troy Ecological Research. 1994. Bird use of coastal tundra at Prudhoe Bay, Alaska: 1991-1992.
Anchorage, AK: BP Exploration (Alaska), Inc.
United States of America. H.R.1146 - Arctic Cultural and Coastal Plain Protection Act. 116th
Congress (2019-2020).
United States of America. Alaska National Interest Lands Conservation Act (ANILCA) 1980.
Walker, D., Webber, P., Everett, K., & Brown, J. 1978. Effects of Crude and Diesel Oil Spills on
Plant Communities at Prudhoe Bay, Alaska, and the Derivation of Oil Spill Sensitivity
Maps. Arctic, 31(3), 242-259.
63
Walpole, N. E. B., and V. Johnston. 2008. Breeding Habitat Preference and Nest Success of Red-
Necked Phalaropes on Niglintgak Island, Northwest Territories. (Report). Canadian
Journal of Zoology 86.12: 1346–1357.
Whiteman, Gail, et al. 2013. Vast costs of Arctic change: methane released by melting
permafrost will have global impacts that must be better modelled. Nature, 499, no. 7459.

64
Alec Blair graduated from the Plan II Honors Program in the College of Liberal Arts and
the Environmental Science Program in the College of Natural Sciences from the University of
Texas at Austin in 2020. While at UT he was a part of Natural Sciences Council, Texas Blazers,
and the Plan II/KIPP KREWE. He worked as an intern at the Environmental Sciences Institute,
mentored in the Biodiversity FRI Lab, and was a server at the Red River Café. The summer
before his senior year he interned with the US Fish and Wildlife Service in Alaska where he
visited Arctic National Wildlife Refuge and fell in love with ornithology.