shoreline analysis report for shorelines in walla walla ... · shoreline analysis report for...
TRANSCRIPT

FINAL
Shoreline Analysis Report for Shorelines in Walla Walla County and the Cities of Walla Walla, Prescott and Waitsburg
Walla Walla County 315 West Main StreetWalla Walla, WA 99362
Prepared for:
September 2014
Printed on 30% recycled paper.
FINAL WALLA WALLA COUNTY
GRANT NO . G1400495
S H O R E L I N E A N A L Y S I S R E P O R T ( T A S K 5 )
FOR SHORELINES IN WALLA WALLA COUNTY AND THE CITIES OF
WALLA WALLA, PRESCOTT AND WAITSBURG
Prepared for:
Prepared by:
September 2014
The Watershed Company
Reference Number:
121109
STRATEGY | ANALYSIS | COMMUNICATIONS
2025 First Avenue, Suite 800
Seattle WA 98121
Walla Walla County
315 West Main Street
Walla Walla, WA 99362
This report was funded in part
through a grant from the
Washington Department of
Ecology.
Walla Walla Basin Watershed Council
810 South Main
Milton-Freewater, OR 97862

Cite this document as:
The Watershed Company, BERK, and the Walla Walla Basin Watershed Council.
September 2014. Shoreline Analysis Report for Shorelines in Walla Walla County
and the Cities of Walla Walla, Prescott and Waitsburg. Prepared for Walla Walla
County, Walla Walla, WA
The Watershed Company Contact Person:
Dan Nickel
BERK Contact Person:
Lisa Grueter
WWBWC Contact Person:
Brian Wolcott
i
T A B L E O F C O N T E N T S
Page #
Executive Summary ...................................................................... vii
1 Introduction ............................................................................... 1
1.1 Background and Purpose ............................................................................. 1
1.2 Shoreline Jurisdiction .................................................................................. 1
1.3 Study Area ..................................................................................................... 3
2 Summary of Current Regulatory Framework .......................... 4
2.1 Shoreline Management Act .......................................................................... 4
2.2 Local Regulations ......................................................................................... 4
2.2.1 Walla Walla County ......................................................................................... 4 2.2.2 City of Walla Walla ........................................................................................... 6 2.2.3 City of Waitsburg ............................................................................................. 6 2.2.4 City of Prescott ................................................................................................ 7
2.3 State Regulations .......................................................................................... 7
2.4 Federal Regulations ...................................................................................... 9
3 Summary of Ecosystem Conditions ...................................... 13
3.1 Geology ....................................................................................................... 13
3.1.1 Walla Walla WRIA (32) ................................................................................... 14 3.1.2 Lower Snake WRIA (33) ................................................................................ 15
3.2 Geography, Topography, and Drainage Patterns ..................................... 16
3.2.1 Walla Walla WRIA (32) ................................................................................... 16 3.2.2 Lower Snake WRIA (33) ................................................................................ 17 3.2.3 Columbia River .............................................................................................. 17
3.3 Key Species and Habitats ........................................................................... 18
3.3.1 Walla Walla WRIA (32) ................................................................................... 20 3.3.2 Lower Snake WRIA (33) ................................................................................ 25 3.3.3 Columbia River .............................................................................................. 29
3.4 Major Land Use Changes ........................................................................... 30
3.4.1 Walla Walla WRIA (32) ................................................................................... 30
ii
3.4.2 Lower Snake WRIA (33) ................................................................................ 37 3.4.3 Columbia River .............................................................................................. 39
4 Shoreline Inventory ................................................................. 40
4.1 Inventory Sources ....................................................................................... 40
4.2 Data Assumptions and Data Gaps ............................................................. 47
4.2.1 Ecological Characterization ......................................................................... 47 4.2.2 Land Use Characterization ........................................................................... 51
4.3 Summary of Shoreline Inventory Results .................................................. 55
5 Analysis of Ecological Functions .......................................... 56
5.1 Approach, Rationale and Limitations of Functional Analysis .................. 56
5.1.1 Reach Delineation.......................................................................................... 56 5.1.2 Functions and Impairments .......................................................................... 58 5.1.3 Limitations ...................................................................................................... 67
5.2 Results of Functional Analysis .................................................................. 67
5.2.1 Snake River .................................................................................................... 67 5.2.2 Columbia River .............................................................................................. 72 5.2.3 Walla Walla River ........................................................................................... 77 5.2.4 Touchet River ................................................................................................. 82 5.2.5 Mill Creek ........................................................................................................ 91 5.2.6 Bennington Lake.......................................................................................... 100 5.2.7 Yellowhawk Creek ....................................................................................... 102
6 Land Use Analysis ................................................................ 106
6.1 Bennington Lake ....................................................................................... 106
6.1.1 Current Land Use......................................................................................... 106 6.1.2 Future Land Use .......................................................................................... 108 6.1.3 Existing and Potential Public Access ....................................................... 108 6.1.4 Historic and Archeological Sites ............................................................... 109
6.2 Snake River ............................................................................................... 109
6.2.1 Current Land Use......................................................................................... 109 6.2.2 Future Land Use .......................................................................................... 112 6.2.3 Existing and Potential Public Access ....................................................... 114 6.2.4 Historic and Archeological Sites ............................................................... 116
6.3 Columbia River .......................................................................................... 116

iii
6.3.1 Current Land Use......................................................................................... 116 6.3.2 Future Land Use .......................................................................................... 120 6.3.3 Existing and Potential Public Access ....................................................... 122 6.3.4 Historic and Archeological Sites ............................................................... 124
6.4 Walla Walla River ...................................................................................... 125
6.4.1 Current Land Use......................................................................................... 125 6.4.2 Future Land Use .......................................................................................... 127 6.4.3 Existing and Potential Public Access ....................................................... 129 6.4.4 Historic and Archeological Sites ............................................................... 130
6.5 Touchet River ............................................................................................ 131
6.5.1 Current Land Use......................................................................................... 131 6.5.2 Future Land Use .......................................................................................... 133 6.5.3 Existing and Potential Public Access ....................................................... 135 6.5.4 Historic and Archeological Sites ............................................................... 136
6.6 Mill Creek ................................................................................................... 136
6.6.1 Current Land Use......................................................................................... 136 6.6.2 Future Land Use .......................................................................................... 138 6.6.3 Shoreline Permit History ............................................................................. 142 6.6.4 Existing and Potential Public Access ....................................................... 143 6.6.5 Historic and Archeological Sites ............................................................... 145
6.7 Yellowhawk Creek ..................................................................................... 146
6.7.1 Current Land Use......................................................................................... 146 6.7.2 Future Land Use .......................................................................................... 148 6.7.3 Existing and Potential Public Access ....................................................... 149 6.7.4 Historic and Archeological Sites ............................................................... 150
7 Shoreline Management Recommendations ........................ 150
7.1 Environment Designations ....................................................................... 150
7.2 General Policies and Regulations ............................................................ 153
7.2.1 Archaeological and Historic Resources ................................................... 153 7.2.2 Critical Areas ................................................................................................ 153 7.2.3 Flood Hazard Reduction ............................................................................. 154 7.2.4 Public Access .............................................................................................. 154 7.2.5 Shoreline Vegetation Conservation ........................................................... 155 7.2.6 Water Quality, Stormwater, and Nonpoint Pollution ................................ 155
7.3 Shoreline Modification Provisions ........................................................... 156
7.3.1 Shoreline Stabilization ................................................................................ 156

iv
7.3.2 Piers and Docks ........................................................................................... 156 7.3.3 Fill .................................................................................................................. 157 7.3.4 Breakwaters, Jetties, Groins and Weirs .................................................... 157 7.3.5 Dredging and Dredge Material Disposal ................................................... 157 7.3.6 Shoreline Habitat and Natural Systems Enhancement Projects ............ 157
7.4 Shoreline Uses .......................................................................................... 158
7.4.1 Agriculture .................................................................................................... 158 7.4.2 Aquaculture .................................................................................................. 158 7.4.3 Boating Facilities ......................................................................................... 158 7.4.4 Commercial Development .......................................................................... 158 7.4.5 Forest Practices ........................................................................................... 159 7.4.6 Industry ......................................................................................................... 159 7.4.7 In-stream Structural Uses ........................................................................... 159 7.4.8 Mining ........................................................................................................... 159 7.4.9 Recreational Development ......................................................................... 160 7.4.10 Residential Development ............................................................................ 160 7.4.11 Transportation and Parking ........................................................................ 160 7.4.12 Utilities .......................................................................................................... 161
7.5 Restoration Plan........................................................................................ 161
8 References ............................................................................. 163
9 List of Acronyms and Abbreviations ................................... 167
APPENDIX A Walla Walla County Assessment of Shoreline Jurisdiction
APPENDIX B Shoreline Inventory Map Folio
APPENDIX C Summary of Shoreline Inventory by Reach
APPENDIX D Waitsburg Zoning Map

v
L I S T O F E X H I B I T S
Page #
Exhibit 3-1. Map of Water Resource Inventory Areas in Walla Walla County ............ 13
Exhibit 6-1. Current Land Use – Bennington Lake .................................................. 107
Exhibit 6-2. Current Land Use – Snake River .......................................................... 110
Exhibit 6-3. Snake River Zoning by Reach .............................................................. 113
Exhibit 6-4. Current Land Use – Columbia River ..................................................... 118
Exhibit 6-5. Columbia River Zoning by Reach ......................................................... 121
Exhibit 6-6. Current Land Use – Walla Walla River ................................................. 126
Exhibit 6-7. Walla Walla River Zoning by Reach ..................................................... 128
Exhibit 6-8. Current Land Use – Touchet River ....................................................... 132
Exhibit 6-9. Touchet River Zoning by Reach ........................................................... 134
Exhibit 6-10. Current Land Use – Mill Creek ............................................................. 137
Exhibit 6-11. Mill Creek Walla Walla County Zoning by Reach.................................. 140
Exhibit 6-12. Mill Creek City of Walla Walla Zoning by Reach ................................... 141
Exhibit 6-13. Current Land Use – Yellowhawk Creek ................................................ 147
Exhibit 6-14. Yellowhawk Creek Zoning by Reach ...................................................... 149
L I S T O F T A B L E S
Page #
Table 3-1. Priority Habitats and Species in Walla Walla County .............................. 18
Table 3-2. Riparian Assessment by Stream Reach within the Southeast Washington
Recovery Management Unit ................................................................... 21
Table 3-3. Fish Species Present in the Walla Walla River Subbasin ....................... 22
Table 3-4. Listed Wildlife Species within the Walla Walla Subbasin ........................ 24
Table 3-5. Composite Resident Fish Species List and Sources of Data for the Lower
Snake River ........................................................................................... 25
Table 3-6. Status of Priority Habitat Species (PHS) within the Lower Snake River
sub-basin ............................................................................................... 27
Table 3.7. Actions Identified to Improve Water Quality in the Walla Walla Basin ..... 33
Table 4-1. Shoreline Inventory Elements and Information Sources. ........................ 41
Table 4-2. Water-Oriented Uses Definitions and Examples. .................................... 53
Table 5-1. Shoreline Reaches Used in Functional Analysis..................................... 57
Table 5-2. Ecological processes and functions used to evaluate reaches ............... 59
Table 5-3. Description of shoreline functions and common sources of human
disturbance. ........................................................................................... 61
Table 5-4. Functional score ranking for SMA waterbodies1 by indicator metric. ....... 65
Table 5-5. Functional scoring by reach on the Snake River..................................... 71

vi
Table 5-6. Functional scoring by reach on the Columbia River ................................ 75
Table 5-7. Functional scoring by reach on the Walla Walla River ............................ 81
Table 5-8. Functional scoring by unincorporated county reach on the Touchet River
............................................................................................................... 86
Table 5-9. Functional scoring for the reach of the Touchet River within the City of
Prescott .................................................................................................. 87
Table 5-10. Functional scoring by reach on the Touchet River within the City of
Waitsburg, .............................................................................................. 91
Table 5-11. Functional scoring by unincorporated county reach on Mill Creek .......... 95
Table 5-12. Functional scoring by reach on Mill Creek within the City of Walla Walla 99
Table 5-13. Functional scoring for Bennington Lake ............................................... 102
Table 5-14. Functional scoring by reach on Yellowhawk Creek ............................... 106

vii
EXECUTIVE SUMMARY
This Shoreline Analysis Report was prepared for Walla Walla County and the Cities of
Walla Walla, Prescott and Waitsburg under a Washington State Department of Ecology
(Ecology) grant to help create or update each jurisdiction’s Shoreline Master Program
(SMP). Washington’s Shoreline Management Act of 1971 and its implementing State
Guidelines adopted in 2003 require this update. The County has not updated its present
SMP since it was first adopted in 1975. The Cities of Walla Walla and Waitsburg have
separate SMPs which were adopted in 1977 and 1999, respectively. The City of Walla
Walla last updated its SMP in 1986. The City of Prescott does not currently have an SMP.
Under State Guidelines, the County and Cities must base the master program provisions
on an analysis of the most relevant and accurate scientific and technical information
(WAC 173-26-201(3)(c)and(d)). This includes meeting the mandate of “no net loss” of
shoreline ecological functions as well as providing mechanisms for restoration of
impaired shoreline functions. The Inventory and Characterization Report is not a
binding regulatory document but rather provides guidance for potential future updates
to the SMP.
The County’s SMP update is a multi-year process, which begins with an inventory and
characterization of existing environmental and land use conditions, otherwise known as
a “baseline condition.” As part of developing a “baseline” condition, this Inventory and
Characterization Report contains an inventory of a variety of elements, including land
use, landscape processes, and ecological functions. These elements are spatially
catalogued using a Geographic Information System (GIS), where possible, and are
presented as a Countywide Map Folio. Together, these elements define what is
understood to be the existing present day condition and helps inform the review of
current shoreline regulations and highlight areas where changes may be necessary to
meet shoreline management goals to provide for water dependent uses, public access
and the protection of natural resources.
Key information provided in this report include: characterization of existing ecological
functions through an analysis of both physical and biological processes; an analysis of
existing land uses, shoreline modifications, public access, and areas under public
ownership; preliminary identification of restoration opportunities; and
recommendations for the SMP to help meet the Guidelines.

viii
One waterbody not previously identified as a Shoreline of the State, Yellowhawk
Creek, is included in this report. Available documentation indicates that the
lower portion of Yellowhawk Creek from Cottonwood Creek to the confluence
with the Walla Walla River meets the shoreline jurisdictional threshold and
should be included as a Shoreline of the State. Another waterbody not
previously identified as a Shoreline of the State, Whetstone Hollow Creek, was
originally proposed to be included in jurisdiction based on a 2003 USGS study
and was analyzed in earlier drafts of this report. However, additional
investigation and analysis related to flow rates resulted in the decision to remove
Whetstone Hollow Creek from shoreline jurisdiction and it is no longer analyzed
herein.
Dry Creek, which was previously identified as a Shoreline of the State, was
initially in jurisdiction and was analyzed in preliminary drafts of this report.
However, additional investigation and analysis of flow rates resulted in the
decision to remove Dry Creek from shoreline jurisdiction.
Appendix A includes documentation on the jurisdictional determinations for
Whetstone Hollow Creek, Dry Creek and Yellowhawk Creek.

The Watershed Company/BERK/WWBWC September 2014
1
S H O R E L I N E A N A LY S I S R E P O R T
WALLA WALLA COUNTY AND THE C ITIES OF WALLA WALLA ,
PRESCOTT AND WAITSBURG
1 INTRODUCTION
1.1 Background and Purpose
Walla Walla County (County) and the cities of Walla Walla, Prescott and Waitsburg
obtained a grant from the Washington Department of Ecology (Ecology) in 2013 to
complete a comprehensive update of each jurisdiction’s Shoreline Master Program
(SMP). One of the first steps of the update process is to inventory and characterize the
County’s shorelines as defined by the State’s Shoreline Management Act (SMA) (RCW
90.58). This Shoreline Analysis Report was conducted in accordance with the Shoreline
Master Program Guidelines (Guidelines, Chapter 173-26 WAC) and project Scope of
Work promulgated by Ecology. Under these Guidelines, the County and Cities must
identify and assemble the “most current, accurate, and complete scientific and technical
information available that is applicable to the issues of concern” regarding natural and
built environment characteristics in shoreline jurisdiction.
This Shoreline Analysis Report inventories and describes existing conditions and
characterizes ecological functions in the shoreline jurisdiction of all unincorporated
areas within the County, as well as the cities of Walla Walla, Prescott and Waitsburg.
This assessment of current conditions will serve as the baseline against which the
impacts of future development actions in shoreline jurisdiction will be measured. The
Guidelines require that the County and Cities demonstrate that the implementation of
their updated SMP yields “no net loss” in shoreline ecological functions relative to the
baseline (current condition). By describing and inventorying existing conditions, this
Shoreline Analysis Report will be used to help inform the development of appropriate
SMP policies, regulations, and environment designations to help meet the “no net loss”
goal.
1.2 Shoreline Jurisdiction
As defined by the Shoreline Management Act of 1971, shorelines include certain waters
of the state plus their associated “shorelands.” At a minimum, the waterbodies

Walla Walla County Shoreline Analysis Report
2
designated as shorelines of the state are streams whose mean annual flow is 20 cubic feet
per second (cfs) or greater, lakes whose area is greater than 20 acres, and all marine
waters. Shorelands are defined as:
“those lands extending landward for 200 feet in all directions as measured on a
horizontal plane from the ordinary high water mark; floodways and contiguous
floodplain areas landward 200 feet from such floodways; and all wetlands and river
deltas associated with the streams, lakes, and tidal waters which are subject to the
provisions of this chapter…Any county or city may determine that portion of a one-
hundred-year-floodplain to be included in its master program as long as such
portion includes, as a minimum, the floodway and the adjacent land extending
landward two hundred feet therefrom… Any city or county may also include in its
master program land necessary for buffers for critical areas (RCW 90.58.030)”
The ordinary high water mark (OHWM) is:
“that mark that will be found by examining the bed and banks and ascertaining
where the presence and action of waters are so common and usual, and so long
continued in all ordinary years, as to mark upon the soil a character distinct from
that of the abutting upland, in respect to vegetation as that condition exists on June
1, 1971, as it may naturally change thereafter, or as it may change thereafter in
accordance with permits issued by a local government or the department:
PROVIDED, That in any area where the ordinary high water mark cannot be found,
the ordinary high water mark adjoining salt water shall be the line of mean higher
high tide and the ordinary high water mark adjoining fresh water shall be the line of
mean high water” (RCW 90.58.030(2)(b)).
Ecology has identified the upstream limits of shoreline streams and rivers based on
projected mean annual flow of 20 cubic feet per second (cfs) (Higgins 2003), and those
lakes that are 20 acres or greater in size. The Columbia River, Snake River, Touchet
River, Walla Walla River, Mill Creek and Yellowhawk Creek all qualify as Shorelines of
the State based on this definition. Stream and river shoreline jurisdiction also includes
several adjacent waterbodies along the Snake and Columbia Rivers, including Ayer Boat
Basin, Curlew Pond, Casey Pond, Smith Harbor, Quarry Pond, J Line Pond, and
Burbank Slough. A Shoreline Jurisdiction Summary determination is included as
Appendix A.
All streams and rivers that have mean annual flow of 200 cfs or greater or portions of
waterbodies downstream from the first 300 square miles of a drainage area are

The Watershed Company/BERK/WWBWC September 2014
3
considered Shorelines of Statewide Significance in Eastern Washington. This special
status applies to all of the Columbia, Snake, and Walla Walla Rivers within the County
and a portion of the Touchet River upstream until approximately 2 miles west of the
County’s border with Columbia County and all of their associated shoreline
jurisdictional area in the County. For Shorelines of Statewide Significance, the SMA sets
specific preferences for uses and calls for a higher level of effort in implementing its
objectives. A detailed discussion of the entire jurisdiction assessment and determination
process can be reviewed in full in Appendix A.
Bennington Lake qualifies as a Shoreline of the State (larger than 20 acres). The County
does not have any lakes that qualify as Shorelines of Statewide Significance (greater than
1,000 acres).
1.3 Study Area
Walla Walla County encompasses approximately 1,299 square miles and is located in the
southeast part of Washington along the Oregon-Washington border. It is bounded by
the Columbia and Snake Rivers to the west and north and by Columbia County to the
east. The County includes portions of two Water Resource Inventory Areas (WRIAs),
including the majority of the Walla Walla Watershed (WRIA 32) and the south-eastern
portion of the Lower Snake Watershed (WRIA 33).
The County is predominantly rural and agricultural in nature, with unincorporated
areas making up most of the county territory. There are unincorporated communities
such as Burbank and Touchet which include housing, commercial and industrial
activities. Incorporated cities include Walla Walla, Prescott, College Place and
Waitsburg. Each City has a designated Urban Growth Area (UGA) in which the County
retains governance until the area is annexed. The County coordinates planning in the
UGAs with each City.
The study area for this report includes all land currently within proposed shoreline
jurisdiction for unincorporated Walla Walla County and the cities of Walla Walla,
Prescott and Waitsburg. The study area includes relevant discussion of the contributing
watersheds.
In total, this shoreline inventory has mapped approximately 225 miles of river shoreline
that meet shoreline jurisdiction criteria. Jurisdictional shoreland area totals 18.9 square
miles, which includes floodways, and associated floodplains and wetlands. Federal
lands make up approximately 16 percent of that area, or three square miles total.

Walla Walla County Shoreline Analysis Report
4
2 SUMMARY OF CURRENT REGULATORY FRAMEWORK
2.1 Shoreline Management Act
The Shoreline Management Act of 1971 promoted planning along shorelines and
coordination among governments. The legislative findings and policy intent of the SMA
states:
“There is, therefore, a clear and urgent demand for a planned, rational, and
concerted effort, jointly performed by federal, state, and local governments, to
prevent the inherent harm in an uncoordinated and piecemeal development of the
state's shorelines (RCW 90.58.020).”
While protecting shoreline resources by regulating development, the SMA is also
intended to provide balance by encouraging water-dependent or water-oriented uses
while also conserving or enhancing shoreline ecological functions and values. SMPs are
the local land use policies and regulations designed to manage shoreline use. SMPs
must be based on state guidelines, but should be tailored to the specific conditions and
needs of the local community.
Walla Walla County adopted its present Shoreline Management Master Plan in 1975,
and it has not been updated since that time. The Cities of Walla Walla and Waitsburg
have separate SMPs which were adopted in 1977 and 1999, respectively. The City of
Walla Walla last updated its Shoreline Master Program in 1986. The City of Prescott does
not have an SMP. The information provided in this report may be used to create new or
updated SMPs for each local jurisdiction.
2.2 Local Regulations
2.2.1 Walla Walla County
Walla Walla County adopted its first Shoreline Master Program in 1975, and it has not
been updated since. Shoreline uses, developments, and activities are also subject to the
County’s Comprehensive Plan, County Code, and various other provisions of County,
state and federal laws.
The current SMP designations for Walla Walla County are briefly described below.

The Watershed Company/BERK/WWBWC September 2014
5
Urban: The Urban environment is an area of high intensity land-use including
residential, commercial, recreational and industrial development. It is
particularly suitable to those areas presently subjected to extremely intensive use
pressure, as well as areas planned to accommodate urban expansion.
Rural: The Rural environment is intended for those areas characterized by
intensive agriculture and recreational uses and those areas having a high
capability to support active agricultural practices and intensive outdoor
recreational development.
Conservancy: The Conservancy environment is intended for very low intensity
land uses and larger acreages with relatively low land values.
Natural: The Natural environment is characterized by the presence of some
unique natural or cultural features considered valuable in their natural or
original condition which are relatively intolerant of intensive human use.
The County Comprehensive Plan, last updated in 2009, is a statement of policies and
goals that guides growth and development throughout the County. Each of the basic
elements required by the Growth Management Act (GMA) are addressed in the County
Comprehensive Plan, including land use, rural, housing, transportation, utilities, capital
facilities, economics, and parks and recreation.
County regulations applicable to critical areas are detailed in Walla Walla County Code
(WWCC) Chapter 18.08. These regulations were adopted in 1995, and subsequently
revised in 2008. In those regulations the County specifies reach-specific minimum buffer
widths of 35 to 100 feet (WWCC 18.08.650) on waterways in fish and wildlife habitat
conservation areas. The regulations also require wetland buffers between 25 and 250 feet
based on wetland classification (per the Washington State Wetland Rating System for
Eastern Washington, as amended) and intensity of proposed land use (WWCC
18.08.340). The County’s Critical Areas regulations also apply to geologically hazardous
areas, critical aquifer recharge areas, and frequently flooded areas.
Many shoreline and wetland areas within the County contain functioning buffers of the
required widths. Smaller functioning buffers are found where developments existed
prior to the critical areas regulations or where buffers of different widths were
previously established in approved site plans or protected critical area easements.
Shoreline uses, developments, and activities regulated under the critical areas
regulations are also subject to the County’s Comprehensive Plan, Walla Walla County
Code, and various other provisions of County, state and federal laws. Any applicant
must comply with all applicable laws prior to commencing any use, development, or

Walla Walla County Shoreline Analysis Report
6
activity. The County will ensure consistency between the SMP and other County codes,
plans and programs by reviewing each for consistency during periodic updates of the
County’s Comprehensive Plan.
2.2.2 City of Walla Walla
The City of Walla Walla adopted its own SMP in 1977, which was amended in 1981 and
1986. It has not been updated since that time. The SMP has the same four environmental
designations as Walla Walla County’s SMP, described above. It has also adopted critical
areas regulations, contained in WWMC Chapter 21.04, to implement the goals, policies,
guidelines, and requirements of the Growth Management Act and the City of Walla
Walla Urban Area Comprehensive Plan. These regulations have a recommended 35-foot
minimum streamside buffer width for waterways within the City, except for
Yellowhawk Creek from Russell to Mill Creeks, which has a minimum 50-foot buffer
(WWMC 21.04.650). Wetland buffers between 25 and 250 feet are required based on
wetland classification (per the Washington State Wetland Rating System for Eastern
Washington, as amended) and intensity of proposed land use (WWMC 21.04.340).
2.2.3 City of Waitsburg
The City of Waitsburg adopted a SMP in 1999. It has not been updated since that time.
The SMP has the same four environmental designations as Walla Walla County and the
City of Walla Walla’s SMPs described above. The City of Waitsburg Comprehensive
Plan was adopted in 1998 and revised in 2006/2007. The City also adopted critical areas
regulations, first in 1996, and amended in 2008 (contained in Chapter 10.2A of the
Waitsburg Municipal Code), to implement the goals, policies, guidelines, and
requirements of the Growth Management Act and the City of Waitsburg Comprehensive
Plan. These regulations require a 25-foot buffer on the Touchet River and a 15-foot buffer
on Coppei Creek. The regulations also establish a 15-foot buffer from the top and bottom
of steep slopes exceeding 15 percent slope. WMC 10.2A.030 describes the City’s
approach to regulating critical areas as follows,
“This Chapter addresses only those activities within the buffer zones on the Touchet
River and the Coppei Creek, and geologically hazardous areas. The National
Wetlands Inventory Maps show that all wetlands within the City and adopted
Urban Growth Areas are directly associated with the Touchet River and the Coppei
Creek. These buffers along the Touchet and the Coppei also contain all of the wildlife
habitat within the current City limits and adopted Urban Growth Area.”

The Watershed Company/BERK/WWBWC September 2014
7
2.2.4 City of Prescott
The City of Prescott does not currently have a SMP and therefore no shoreline permits
have been issued in the past. Information regarding City of Prescott existing plans and
regulations, including critical areas, were not able to be located.
2.3 State Regulations
Aside from the Shoreline Management Act, State regulations most pertinent to
development in the County and Cities’ shorelines include the State Hydraulic Code,
Growth Management Act, State Environmental Policy Act, Watershed Planning Act,
Water Resources Act, Salmon Recovery Act, and case law. A variety of agencies (e.g.,
Washington Department of Ecology, Washington Department of Fish and Wildlife,
Washington Department of Natural Resources) are involved in implementing these
regulations or otherwise manage public shoreline areas. The Department of Ecology
reviews all shoreline projects that require a shoreline permit, but has specific regulatory
authority over shoreline conditional use permits and shoreline variances. Other agency
reviews of shoreline developments are typically triggered by in- or over-water work,
discharges of fill or pollutants into the water, or substantial land clearing.
Depending on the nature of the proposed development, state regulations can play an
important role in the design and implementation of a shoreline project, ensuring that
impacts to shoreline functions and values are avoided, minimized, and/or mitigated.
During the comprehensive SMP update, the County and Cities will consider other state
regulations to ensure consistency as appropriate and feasible with the goal of
streamlining the shoreline permitting process. A summary of some of the key state
regulations and/or state agency responsibilities follows.
Hydraulic Code: Chapter 77.55 RCW (the Hydraulic Code) gives the Washington
Department of Fish and Wildlife (WDFW) the authority to review, condition, and
approve or deny “any construction activity that will use, divert, obstruct, or change the
bed or flow of State waters.” These activities may include stream alteration, culvert
installation or replacement, pier and bulkhead repair or construction, among others. In
a permit called a Hydraulic Project Approval (HPA), WDFW can condition projects to
avoid, minimize, restore, and compensate adverse impacts.
Section 401 Water Quality Certification: Section 401 of the federal Clean Water Act
allows states to review, condition, and approve or deny certain federal permitted actions
that result in discharges from fills or excavations to State waters, including wetlands and
streams. In Washington, the Department of Ecology is the State agency that has been

Walla Walla County Shoreline Analysis Report
8
delegated responsibility for conducting that review, with their primary review criteria of
ensuring that State water quality standards are met. Actions within streams or wetlands
within the shoreline zone that require a Section 404 permit (see below), Coast Guard
Permit, or a Federal Energy Regulatory Commission (FERC) license require a Section 401
water quality certification.
Washington Department of Natural Resources: Washington Department of Natural
Resources (WDNR) is charged with protecting and managing use of state-owned aquatic
lands. WDNR manages more than 5.6 million acres of state-owned forest, range,
commercial, agricultural, conservation, and aquatic lands. WDNR manages these lands
for revenue, outdoor recreation, and habitat for native fish and wildlife. Water-
dependent uses waterward of the OHWM require review by WDNR to establish
whether the project is on state-owned aquatic lands. WDNR recommends that all
proponents of a project waterward of the OHWM make contact with WDNR to
determine jurisdiction and requirements.
Watershed Planning Act: The Watershed Planning Act of 1998 (Chapter 90.82 RCW)
was passed to encourage local planning of local water resources, recognizing that there
are citizens and entities in each watershed that “have the greatest knowledge of both the
resources and the aspirations of those who live and work in the watershed; and who
have the greatest stake in the proper, long-term management of the resources.” Walla
Walla County is within two watershed basins. The Walla Walla Watershed Plan (WRIA
32) was completed in 2005, and the Watershed Planning Group has completed several
projects under the Watershed Planning Act to date. The Plan recommended changes to
Ecology’s instream flow rule, and in 2007, Ecology amended the rule to achieve the
following:
Establish instream flow water rights,
Modify the seasonal closures of surface waters,
Close withdrawals from shallow gravel aquifers, control and manage future
permit-exempt ground water withdrawals from the gravel aquifer, in populated
areas,
Limit stock watering based on legal lot sizes, and
Limit future withdrawals during high flow periods to projects resulting in net
environmental benefits.
Additionally, to address the unique water challenges found in the Walla Walla
watershed, local interests are working with Ecology to jointly develop the concept of the
The Watershed Company/BERK/WWBWC September 2014
9
Walla Walla Water Management Initiative. The Lower Snake Watershed (WRIA 33) is
not presently subject to the Watershed Planning Act.
Water Pollution Control Act: Chapter 90.48 RCW establishes the State’s policy “to
maintain the highest possible standards to insure the purity of all waters of the State
consistent with public health and public enjoyment thereof, the propagation and
protection of wild life, birds, game, fish and other aquatic life, and the industrial
development of the State, and to that end require the use of all known available and
reasonable methods by industries and others to prevent and control the pollution of the
waters of the State of Washington.” The Department of Ecology is the agency charged
with crafting and implementing rules and regulations in accordance with this
legislation.
2.4 Federal Regulations
Federal regulations most pertinent to development in the County’s and Cities’
shorelines include the Endangered Species Act, the Clean Water Act, and the Rivers and
Harbors Appropriation Act. Other relevant federal laws include the National
Environmental Policy Act, Anadromous Fish Conservation Act, Clean Air Act, and the
Migratory Bird Treaty Act. A variety of agencies (e.g., U.S. Army Corps of Engineers
[Corps], National Marine Fisheries Service, U.S. Fish and Wildlife Service) are involved
in implementing these regulations, but review by these agencies of shoreline
development in most cases would be triggered by in- or over-water work, or discharges
of fill or pollutants into the water. Depending on the nature of the proposed
development, federal regulations can play an important role in the design and
implementation of a shoreline project, ensuring that impacts to shoreline functions and
values are avoided, minimized, and/or mitigated. During the SMP update, the County
and Cities will consider other federal regulations to ensure consistency as appropriate
and feasible with the goal of streamlining the shoreline permitting process. A summary
of some of the key federal regulations and/or federal agency responsibilities follows.
Clean Water Act: Major components of the Clean Water Act include Section 404, Section
401, and the National Pollutant Discharge Elimination System (NPDES).
Section 404 provides the Corps, under the oversight of the U.S. Environmental
Protection Agency, with authority to regulate “discharge of dredged or fill material into
waters of the United States, including wetlands”
(http://www.epa.gov/owow/wetlands/pdf/ reg_authority_pr.pdf). The extent of the
Corps’ authority and the definition of fill have been the subject of considerable legal

Walla Walla County Shoreline Analysis Report
10
activity. As applicable to the County’s shoreline jurisdiction, however, it generally
means that the Corps must review and approve most activities in streams and wetlands.
These activities may include wetland fills, stream and wetland restoration, and culvert
installation or replacement, among others. The Corps requires projects to avoid,
minimize, and compensate for impacts.
A Section 401 Water Quality Certification is required for any applicant for a federal
permit for any activity that may result in any discharge to waters of the United States.
States and tribes may deny, certify, or condition permits or licenses based on the
proposed project’s compliance with water quality standards. In Washington State, the
Department of Ecology has been delegated the responsibility by the U.S. Environmental
Protection Agency for managing implementation of this program.
The NPDES is similar to Section 401, and it applies to ongoing point-source discharge.
The County is engaged in compliance with the NPDES Phase II Municipal Stormwater
General Permit requirements that address stormwater system discharges to surface
waters. Permits include limits on what can be discharged, monitoring and reporting
requirements, and other provisions designed to protect water quality.
Endangered Species Act (ESA): Section 9 of the ESA prohibits “take” of listed species.
Take has been defined in Section 3 as: “harass, harm, pursue, hunt, shoot, wound, kill,
trap, capture, or collect, or to attempt to engage in any such conduct.” The take
prohibitions of the ESA apply to everyone, so any action that results in a take of listed
fish or wildlife would be a violation of the ESA and is strictly prohibited. Per Section 7
of the ESA, activities with potential to affect federally listed or proposed species and that
either require federal approval, receive federal funding, or occur on federal land must be
reviewed by the National Marine Fisheries Service (NOAA Fisheries) and/or U.S. Fish
and Wildlife Service (USFWS) via a process called “consultation.” Activities requiring a
Section 10 or Section 404 permit also require such consultation if these activities occur in
waterbodies with listed species. Section 4(f) of the ESA directs the Services to develop or
appoint teams to develop and implement recovery plans for threatened and endangered
species. Walla Walla County is a member of the Snake River Salmon Recovery Board
and County staff contributed to the development of the 2011 Snake River Salmon
Recovery Plan for Southeast WA.
Magnuson-Stevens Fishery Conservation and Management Act: The Magnuson-
Stevens Fishery Conservation and Management Act of 1996 is administered by the
National Marine Fisheries Service to foster and protect commercial and recreational
fisheries of designated species that “contribute to the food supply, economy, and health

The Watershed Company/BERK/WWBWC September 2014
11
of the Nation and provide recreational opportunities” (18 U.S.C. §1801-a). In the lower
Snake and upper Columbia Rivers designated species include Chinook and coho
salmon. The primary avenue for on-the-ground management of those species is
designation and protection of “essential fish habitat” (EFH), which is “those waters and
substrate necessary to fish for spawning, breeding, feeding, or growth to maturity.” The
National Marine Fisheries Service incorporates consideration of EFH into the same
process under which projects are reviewed per the Endangered Species Act.
Rivers and Harbors Act: Section 10 of the federal Rivers and Harbors Appropriation Act
of 1899 provides the U.S. Army Corps of Engineers (Corps) with authority to regulate
activities that may affect navigation of “navigable” waters. Designated “navigable”
waters in Walla Walla County include the Columbia, Snake, and Walla Walla Rivers.
Proposals to construct new or modify existing over-water structures (including bridges),
to excavate or fill, or to “alter or modify the course, location, condition, or capacity of
navigable waters must be reviewed and approved by the Corps.
McNary Shoreline Management Plan: The majority of the Lake Wallula shoreline,
located above McNary Dam, is owned and managed by the Corps. In 2012, the Corps
updated the 1983 McNary Shoreline Management Plan for management and permitting
of private use on Lake Wallula and Corps-managed lands with frontage on Lake Wallula
(US Army Corps of Engineers 2012). Most of Walla Walla County’s unincorporated
shoreline area governed by the McNary Shoreline Management Plan is designated by
the Corps as “Protected Lakeshore,” or “Prohibited Access.” A couple of locations are
designated as “Public Recreation,” and one area, near Burbank is designated “Limited
Development.” The updated McNary Shoreline Management Plan provides criteria for
design and construction of existing private docks (including “special status” docks, or
“grandfathered” docks), new community and private docks, and vegetation
modification. The plan does not apply to public docks. The plan allows for a total of 100
private docks on Lake Wallula, including existing docks, assigning priority to new
community docks that jointly serve multiple users. As of January 2012, only 27 new,
private docks can be permitted in areas designated under the McNary Shoreline
Management Plan for “Limited Development”. In Walla Walla County one such
Limited Development area is designated along a small portion of the Lake Wallula
shoreline in Burbank.
Pacific Northwest Electric Power Planning and Conservation Act: Congress
established the Northwest Power Act in 1980, which established the Northwest Power
and Conservation Council with the goals of preparing and adopting (1) a regional

Walla Walla County Shoreline Analysis Report
12
conservation and electric power plan and (2) a program to protect, mitigate, and
enhance fish and wildlife. As a member of the Walla Walla Watershed Planning Unit,
Walla Walla County contributed to the preparation of the Walla Walla Subbasin Plan in
2004, prepared for the Northwest Power and Conservation Council. The Subbasin Plan
describes to the Council the most effective ways that the Council and the Bonneville
Power Administration (BPA) can meet their obligations in the Walla Walla Subbasin to
mitigate the impacts on fish and wildlife resources from the construction and operation
of the Federal Columbia River Power System (FCRPS).
The Watershed Company/BERK/WWBWC September 2014
13
3 SUMMARY OF ECOSYSTEM CONDITIONS
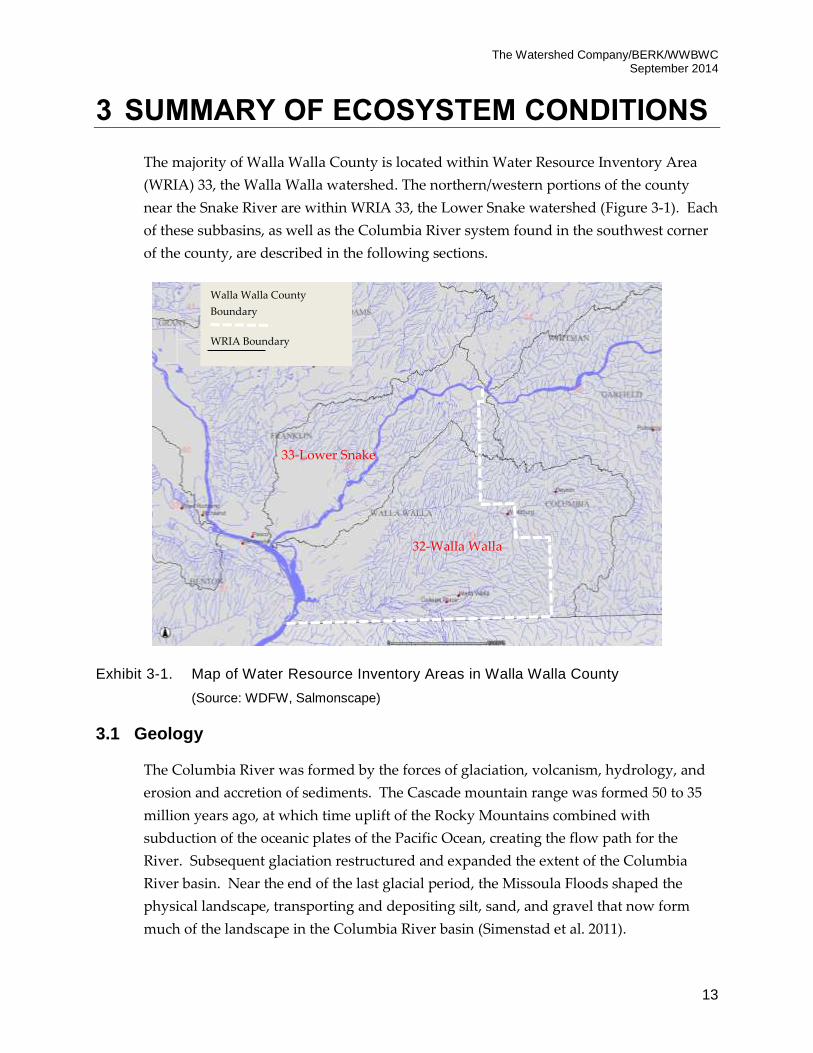
The majority of Walla Walla County is located within Water Resource Inventory Area
(WRIA) 33, the Walla Walla watershed. The northern/western portions of the county
near the Snake River are within WRIA 33, the Lower Snake watershed (Figure 3-1). Each
of these subbasins, as well as the Columbia River system found in the southwest corner
of the county, are described in the following sections.
Exhibit 3-1. Map of Water Resource Inventory Areas in Walla Walla County
(Source: WDFW, Salmonscape)
3.1 Geology
The Columbia River was formed by the forces of glaciation, volcanism, hydrology, and
erosion and accretion of sediments. The Cascade mountain range was formed 50 to 35
million years ago, at which time uplift of the Rocky Mountains combined with
subduction of the oceanic plates of the Pacific Ocean, creating the flow path for the
River. Subsequent glaciation restructured and expanded the extent of the Columbia
River basin. Near the end of the last glacial period, the Missoula Floods shaped the
physical landscape, transporting and depositing silt, sand, and gravel that now form
much of the landscape in the Columbia River basin (Simenstad et al. 2011).
32-Walla Walla
33-Lower Snake
Walla Walla County
Boundary
WRIA Boundary

Walla Walla County Shoreline Analysis Report
14
3.1.1 Walla Walla WRIA (32)
The Walla Walla Basin is a structural basin bounded by basalt cored structural uplifts.
These uplifts include the Blue Mountains on the east, the Horse Heaven Hills on the
south, the Palouse Slope on the north, and the Divide Anticline on the west. The same
Columbia River basalt units found on these highlands (Swanson et al. 1981, Schuster
1994) occur beneath the Basin where they are covered by sedimentary strata, which can
be many of hundreds of feet thick. These sedimentary strata, the suprabasalt sediments,
record a history of basin subsidence and uplift of the surrounding highlands, river and
flood plain deposition, and soil formation and wind deposition (Newcomb 1965, Fecht et
al. 1987, Lindsey 1996, Lindsey and Tolan 2004). The suprabasalt sediments overlie an
irregular basalt surface which is the product of basin subsidence, highland uplift along
faults and folds bounding the Basin, and emplacement of Columbia River basalt flows,
some of which only partially covered the Basin (Lindsey and Tolan 2007).
The Walla Walla Basin contains a thick (up to 800 feet) sequence of clastic sediments
overlying basalt. These strata, referred to herein as the suprabasalt sediments, host an
alluvial aquifer system which supplies water to hundreds of domestic and irrigation
wells. In addition, this alluvial aquifer system displays a high degree of hydrologic
continuity with salmonid-bearing surface waters (Lindsey and Tolan 2007).
The Walla Walla basin has a subsurface distribution of five suprabasalt sediment
stratigraphic units and the underlying Columbia River basalt. Suprabasalt sediments
found within the Walla Walla Basin consist of continental clastic strata deposited during
the Quaternary, before, during, and after Pleistocene Cataclysmic Flooding, and
continental clastic strata deposited in the Mio-Pliocene during the waning stages of, and
following the end of, Columbia River basalt volcanism. The Quaternary deposits are
subdivided into two units, the Quaternary fine unit (silt and fine sand) and the
Quaternary coarse unit (uncemented basalt lithic sand and gravel). Of these two units,
the fine unit is more widespread and generally consists of Touchet Beds, loess, and fine
grained alluvial flood plain deposits. Without good surface geologic mapping, these
materials generally are indistinguishable in the subsurface (Lindsey and Tolan 2007).
The Mio-Pliocene strata (which generally correspond to what R.C. Newcomb originally
referred to as the old clay and gravel, of Pleistocene age) are subdivided into three units:
(1) Mio-Pliocene upper coarse unit, (2) Mio-Pliocene fine unit, and (3) Mio-Pliocene basal
coarse unit. The upper coarse unit consists predominantly of indurated, weathered,
basalt lithic sand and gravel that commonly is red to brown in color. Silt, both as
intercalated beds and as matrix, can be locally abundant. The fine unit consists

The Watershed Company/BERK/WWBWC September 2014
15
predominantly of weakly indurated siltstone and claystone with minor intercalated sand
and gravel. Previously unrecognized felsic-micaceous quartz sand interbedded with
micaceous siltstone and claystone forms the basalt coarse unit. The basal unit directly
overlies basalt at several locations in the Basin (Lindsey and Tolan 2007).
The basalt surface that underlies these sediments forms the bottom of the alluvial
aquifer system. Mapping this surface reveals a number of discontinuities that seem to
project upward into the overlying suprabasalt sediments. Many of these features are
interpreted to be faults and folds. In addition to these folds and faults, the basalt surface
underlying the basin is found to not be defined by the same basalt unit at all locations.
At minimum three different basalt units are present, including one Saddle Mountains
Basalt unit, forming the uppermost basalt unit at different locations in the Basin
(Lindsey and Tolan 2007).
3.1.2 Lower Snake WRIA (33)
The Snake River was formed by the forces of glaciation, volcanism, hydrology and
erosion and accretion of sediments. Erosion-resistant basalt flows has limited the flow
path of the Snake River, resulting in steep-walled canyons along much of its path. Much
of the basalt is from the Columbia River Basalt Group. Collectively the Columbia River
Basalt Group (CRBG) consists of a thick sequence of more than 300 continental tholeiitic
flood basalt flows that cover an area of more than 200,000 km2 in Washington, Oregon,
and western Idaho (Camp et al. 2003). The total estimated CRBG volume is greater than
234,000 km3 (Camp et al. 2003) with the maximum thickness of over 3.2 km occurring in
the Pasco Basin area based on geophysical and deep hydrocarbon exploration well data
(Reidel et al. 1989a, 1989b). The CRBG underlies the entire area and is estimated to range
from 1 to greater than 1.5 km-thick. CRBG flows were erupted during a period from
about 17 to 6 Ma from long (10 to >50 km), north-northwest-trending linear fissure
systems located in eastern Washington, northeastern Oregon, and western Idaho.
Although CRBG eruptive activity spanned an 11 million year period, most (>96 volume
%) of the CRBG flows were emplaced over a 2.5 million year period from 17 to 14.5 Ma
(Swanson and others, 1979; Tolan and others, 1989). When erupted, CRBG basalt flows
generally flowed from east to west across a generally flat to gently rolling topography,
with each successive basalt flow commonly burying much of the preexisting
topography. Prior to 14.5 Ma this topographic surface was generally covered by poorly
integrated stream drainages and interconnected lakes. Following 14.5 Ma stream
drainages were generally well established with discreet river channels and canyons
forming. The CRBG has been divided into a host of regionally mappable units based on
variations in physical, chemical, and paleomagnetic properties - in regard to
Walla Walla County Shoreline Analysis Report
16
stratigraphic position - that exist between flows and packets of flows (Swanson et al.
1981, Beeson et al. 1985, Reidel et al. 1989b). The CRBG underlying the Basin is divided
into three formations. These formations are, from youngest to oldest, the Saddle
Mountains Basalt, Wanapum Basalt, and Grande Ronde Basalt (Swanson et al. 1981).
These formations are further subdivided into members defined, as are the formations,
on the basis of a combination of unique physical, geochemical, and paleomagnetic
characteristics. These members can be, and often are, further subdivided into flow units
(e.g., Beeson et al. 1985, Lindsey and Tolan 2007).
3.2 Geography, Topography, and Drainage Patterns
3.2.1 Walla Walla WRIA (32)
The Walla Walla River originates in the Blue Mountains in Oregon at an elevation of
approximately 6,250 feet. Major tributaries to the Walla Walla River within Walla Walla
County include the Touchet River and Mill Creek, including Yellowhawk Creek, which
is a distributary braid of Mill Creek. The Touchet River drains the northern portion of
the Walla Walla watershed. Mill Creek drains the majority of the southern portion of
the watershed within Walla Walla County.
Precipitation is concentrated in the winter months, and varies depending on location in
the watershed. Most flooding results from rain-on-snow events in the late winter and
early spring. Many of the streams that are not fed by snowmelt dry up in the summer
months.
Groundwater in the Walla Walla Basin occurs in two principal aquifer systems: (1) the
unconfined to confined suprabasalt sediment (alluvial) aquifer system and (2) the
underlying confined basalt aquifer system (Snake River Salmon Recovery Board 2011).
The basalt aquifer system is regional in character, having limited hydraulic connection
to the Walla Walla River except in the canyons of the Blue Mountains. In contrast, the
alluvial aquifer system, with sediments up to 800 feet thick, has a high degree of
hydraulic connection with streams on the valley floor. In recent decades the
management and development of surface water resources has led to installation of flow
control devices at the head of distributary channels. Over time, the management of the
distributary network has become less natural. High flows during the winter and spring
no longer have free access to the distributary network. This, along with the
development of groundwater resources and the channelization of the valley’s rivers and
creeks, has created a declining alluvial aquifer condition. Generally, the ‘spreading out’
of water across the alluvial fans via distributary channels, coupled with the high
hydraulic conductivity of the underlying coarse sediment, function as a primary

The Watershed Company/BERK/WWBWC September 2014
17
groundwater recharge mechanism for the entire alluvial aquifer. This seasonally
recharged aquifer system in-turn feeds the valley’s springs, spring creeks and larger
streams. This cycling of surface water to groundwater recharge, followed by later
discharge in springs and as stream base flow creates a delay in discharge of these waters
from the valley. Depending on local conditions, this delay can range from days to
months, and even years (Jiménez 2012). The declining alluvial aquifer, coupled with
high connectivity between surface water and groundwater, has created stream reaches
where high seepage loss occurs and significant volumes of surface water drain to the
aquifer. In recent years, the listing of steelhead and bull trout as threatened under the
Endangered Species Act and the reintroduction of spring chinook salmon within the
watershed, have led to out-of-court agreements between irrigators and Federal fishery
agencies. As a result of these agreements, local irrigators are leaving a portion of their
legal water rights instream as bypass water year round (Walla Walla Basin Watershed
Council 2013).
3.2.2 Lower Snake WRIA (33)
The Snake River originates in western Wyoming, passing through Idaho, and into
southeastern Washington. The Lower Snake River watershed extends from the
confluence of the Palouse and Snake rivers to the mouth of the Snake River at the
Columbia River. There are no major tributaries in the Lower Snake River Watershed.
The Snake River contributes about 20 percent of the Columbia River flow (Snake River
Salmon Recovery Board 2011). Streamflows are controlled by the hydropower system,
as well as seasonally variable flows in smaller tributaries corresponding with winter
precipitation and spring snowmelt.
The Snake River receives inflow from groundwater aquifers along its reach, including
upper aquifers and deeper basalt aquifers. The minor streams and rivers originating in
the Blue Mountains typically flow year-round, but may lose water to groundwater in
some reaches and gain water from seeps and springs in other reaches (Snake River
Salmon Recovery Board 2011).
3.2.3 Columbia River
The Columbia River is the largest river in the Pacific Northwest, and the fourth largest
river in the United States by volume. The Columbia River watershed originates in
Canada, and the drainage area of over 258,000 square miles includes areas of
Washington, Oregon, Montana, and Idaho, Wyoming, and Nevada.

Walla Walla County Shoreline Analysis Report
18
The hydrology of the Columbia River Basin reflects the interaction of topography
geology, and climate. Most of the drainage of the Columbia River falls as snow in the
Rocky Mountains and in the Cascade Range. Annual peak discharges occur in the
spring (April to June) and generally results from snowmelt in the interior subbasin.
Historically, flood flows peaked at 1.2 million cfs (Simenstad et al. 2011). Today, as a
result of dam regulation, the highest flows occur from April to June, with discharge at
the mouth of the river ranging from 100,000 to 500,000 cfs (Neal 1972, Marriott 2002).
3.3 Key Species and Habitats
Habitat within shoreline jurisdiction ranges from diverse and complex riparian and
wetland habitat along the Columbia River including sloughs, ponds and islands, to
narrow bands of upland shrub-steppe vegetation through primarily agricultural fields in
the upper watersheds.
The County’s shorelands support significant populations of small mammals, which are
highly responsive to changes in vegetation cover and play important roles in ecosystem
functions, including water infiltration, habitat formation, and prey source for predators.
Large and medium-size mammals potentially using areas within shoreline jurisdiction
are black bear, black-tailed deer, Northwest white-tailed deer and mule deer. Rocky
Mountain elk are potentially present in the mountainous upper watershed in the
southeast portion of the county.
The McNary National Wildlife Refuge (see Section 3.4.2) along the east bank of the
Columbia River from the confluence of the Snake River to the mouth of the Walla Walla
River is important habitat for migratory waterfowl, shorebirds and songbirds.
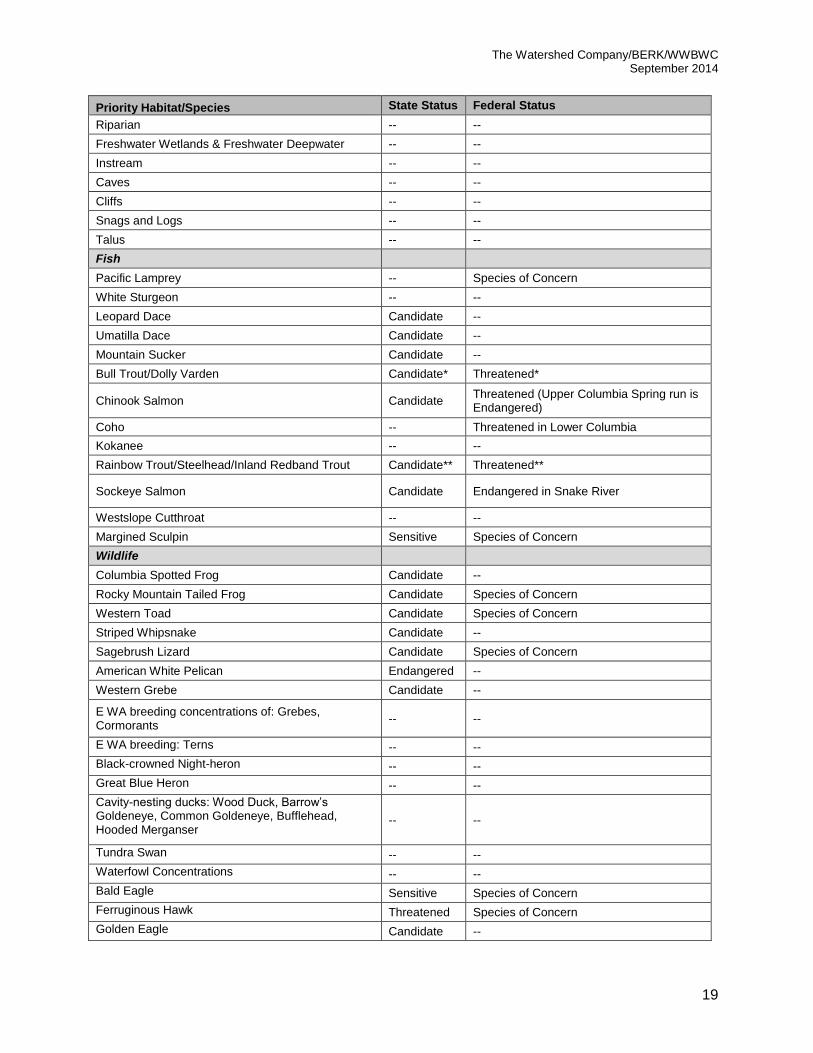
Table 3-1 below, lists the priority habitats and species (PHS) WDFW has identified in
Walla Walla County. A brief discussion specific to each watershed follows. Fish and
Wildlife PHS maps are included as Maps 17-19 in the map folio (Appendix B).
Table 3-1. Priority Habitats and Species in Walla Walla County
(Source: WDFW 2008)
Priority Habitat/Species State Status Federal Status
Habitats
Aspen Stands -- --
Biodiversity Areas & Corridors -- --
Inland Dunes -- --
Juniper Savannah -- --
Eastside Steppe -- --
Shrub-Steppe -- --
The Watershed Company/BERK/WWBWC September 2014
19
Priority Habitat/Species State Status Federal Status
Riparian -- --
Freshwater Wetlands & Freshwater Deepwater -- --
Instream -- --
Caves -- --
Cliffs -- --
Snags and Logs -- --
Talus -- --
Fish
Pacific Lamprey -- Species of Concern
White Sturgeon -- --
Leopard Dace Candidate --
Umatilla Dace Candidate --
Mountain Sucker Candidate --
Bull Trout/Dolly Varden Candidate* Threatened*
Chinook Salmon Candidate Threatened (Upper Columbia Spring run is Endangered)
Coho -- Threatened in Lower Columbia
Kokanee -- --
Rainbow Trout/Steelhead/Inland Redband Trout Candidate** Threatened**
Sockeye Salmon Candidate Endangered in Snake River
Westslope Cutthroat -- --
Margined Sculpin Sensitive Species of Concern
Wildlife
Columbia Spotted Frog Candidate --
Rocky Mountain Tailed Frog Candidate Species of Concern
Western Toad Candidate Species of Concern
Striped Whipsnake Candidate --
Sagebrush Lizard Candidate Species of Concern
American White Pelican Endangered --
Western Grebe Candidate --
E WA breeding concentrations of: Grebes, Cormorants
-- --
E WA breeding: Terns
-- --
Black-crowned Night-heron
-- --
Great Blue Heron
-- --
Cavity-nesting ducks: Wood Duck, Barrow’s Goldeneye, Common Goldeneye, Bufflehead, Hooded Merganser
-- --
Tundra Swan
-- --
Waterfowl Concentrations
-- --
Bald Eagle
Sensitive Species of Concern
Ferruginous Hawk
Threatened Species of Concern
Golden Eagle
Candidate --

Walla Walla County Shoreline Analysis Report
20
Priority Habitat/Species State Status Federal Status
Northern Goshawk
Candidate Species of Concern
Peregrine Falcon
Sensitive Species of Concern
Prairie Falcon
-- --
Dusky Grouse
-- --
Mountain Quail
-- --
Ring-necked Pheasant
-- --
Wild Turkey
-- --
Upland Sandpiper Endangered --
E WA breeding occurrences of: Phalaropes, Stilts and Avocets
-- --
Burrowing Owl
Candidate Species of Concern
Flammulated Owl
Candidate --
Vaux’s Swift
Candidate --
Black-backed Woodpecker
Candidate --
Lewis’ Woodpecker
Candidate --
Pileated Woodpecker
Candidate --
Loggerhead Shrike
Candidate --
Sage Thrasher
Candidate --
Merriam’s Shrew
Candidate --
Preble's Shrew
Candidate Species of Concern
Roosting Concentrations of: Big-brown Bat, Myotis bats, Pallid Bat
-- --
Townsend’s Big-eared Bat
Candidate Species of Concern
Black-tailed Jackrabbit
Candidate --
White-tailed Jackrabbit
Candidate --
Washington Ground Squirrel
Candidate Candidate
Gray Wolf
Endangered Endangered
Marten
-- --
Bighorn Sheep
-- --
Northwest White-tailed Deer
-- --
Elk -- --
Rocky Mountain Mule Deer
-- --
California Floater Candidate Species of Concern
*Bulltrout only
**Steelhead only
-- Not listed
3.3.1 Walla Walla WRIA (32)
The majority of the Walla Walla watershed consists of steppe or shrub-steppe
vegetation. Common trees and shrubs in riparian areas of the Walla Walla watershed
include cottonwood, alder, willow, and red osier dogwood (Snake River Salmon
Recovery Board 2011). Riparian vegetation is usually restricted to narrow strips along
rivers and streams. In the recent past the Conservation Reserve Enchantment Program
(CREP) has led to native tree and shrub plantings, including some coniferous species,

The Watershed Company/BERK/WWBWC September 2014
21
along many stream corridors. Uplands and foothills are dominated by dryland
agriculture, with areas of intensive irrigated croplands adjacent to waterways. The Blue
Mountains plateau and headwaters regions is predominantly dense conifer forests
interspersed with steep grasslands sloping down to headwater streams.
Table 3-2. Riparian Assessment by Stream Reach within the Southeast Washington Recovery Management Unit
(Source: Washington State Conservation Commission, 2001)
Stream Name Riparian Condition
WRIA 32
Lower Touchet Subbasin
Touchet River: L/C Trail State Park to Coppei Creek P1
Touchet River: Coppei Creek to Hwy. 125 P1
Coppei Creek F1, 2
Touchet River: Hwy. 125 to mouth P2
Lower Walla Walla Subbasin
Walla Walla River: Stateline to Mill Creek P2
Walla Walla River: Mill Creek to McDonald Rd. P2
Walla Walla River: McDonald Rd. to mouth F1
Pine and Mud creeks P2
Dry Creek: Headwaters to Hwy. 12 at Smith Rd. F2
Dry Creek: Hwy. 12 at Smith Rd. to mouth P2
Mill Creek: Bennington Lake Dam to mouth P1, 2
Garrison Creek P2
Yellowhawk Creek F2
Cottonwood, Russell, and Reser creeks P2
Upper Mill Creek Subbasin
Mill Creek: Headwaters to Bennington Lake Dam F1-G1
Mill Creek Tributaries (USFS) G1
Key: P = Average habitat condition considered poor (not properly functioning) F = Average habitat condition considered fair (at risk) G = Average habitat condition considered good (properly functioning) 1 = Quantitative studies or published reports documenting habitat condition 2 = Professional knowledge of the WRIA 32, 34, 53 TAG members
It must be noted that the riparian assessment was conducted in 2000; considerable improvements to many of the
rivers/streams has occurred in the last decade and this assessment warrants updating (Snake River Salmon
Recovery Board, 2011)
Fish
The Walla Walla Subbasin Plan created for the Northwest Power and Conservation
Council in 2004 identifies more than 30 species of fish inhabiting the Walla Walla
subbasin, 17 of which are native (Table 3-3) (Walla Walla Watershed Planning Unit
[WWWPU] and Walla Walla Basin Watershed Council [WWBWC] 2004). The following
description of fish species of concern was included in the 2004 report, excerpted from
the Draft Walla Walla Subbasin Summary (NPPC 2001a).

Walla Walla County Shoreline Analysis Report
22
“The only naturally occurring populations of anadromous fish currently present in
the Walla Walla subbasin are summer steelhead (Oncorhynchus mykiss). Pacific
lamprey (Lampetra tridentata), a federally listed species of concern and vulnerable
listed species in Oregon, may also exist. Summer steelhead (Oncorhynchus mykiss)
are federally listed as threatened, a candidate for listing in Washington State, and
listed as vulnerable in Oregon (Columbia Basin Fish and Wildlife Authority 1999).”
“Non-anadromous salmonids and lamprey endemic to the Walla Walla subbasin
include interior redband trout (Oncorhynchus mykiss), bull trout (Salvelinus
confluentus), and mountain whitefish (Prosopium williamsoni), and the western brook
lamprey (Lampetra richardsoni). Redband trout are a candidate for listing in
Washington State as of June 21, 2000 (based on their similar classification as
steelhead). Bull trout are federally listed as threatened under the Endangered
Species Act (ESA), candidates for listing in Washington State.”
Native spring Chinook (Oncorhynchus tshawytscha), which were last documented in the
Walla Walla subbasin in the 1950s, have been reintroduced over the last decade into the
Walla Walla River and Mill Creek by the Confederated Tribes of the Umatilla Indian
Reservation and are successfully reestablishing a local population. Stray Fall Chinook
salmon and coho salmon are occasionally present in the lowest reaches of the Walla
Walla River.
Table 3-3. Fish Species Present in the Walla Walla River Subbasin
(Source: G. Mendel, WDFW, December 2000 as shown in WWWPU and WWBWC 2004, Table 2-3)
Species Origin1 Location2 Status3 Comments
Bull trout (Salvelinus confluentus) N R, T C Headwater areas
Spring Chinook (Oncorhynchus tshawytscha) H R, T R Presumed hatchery strays
Fall Chinook (Oncorhynchus tshawytscha) H R, T R Presumed hatchery strays
Redband trout/ summer steelhead (Oncorhynchus mykiss)
N R, T C/C Dayton return range-184-1006; Walla2 return range – 279-815
Mountain whitefish (Prosopium williamsoni) N R, T R
Brown trout (Salmo trutta) E R, T R
Lamprey (Petromyzontidae) N R, T U brook, river
Longnose dace (Rhinichthys cataractae) N R, T R/I
Speckled dace (Rhinichthys osculus) N R, T A
Umatilla dace (Rhinichthys umatilla) N R, T I
Leopard dace (Rhinichthys falcatus) N R, T I
Chiselmouth (Acrocheilus alutaceus) N R, T C
Peamouth (Mylocheilus caurinus) N R, T I
Redside shiner (Richardsonius balteatus) N R, T C
Northern pikeminnow (Ptychocheilus oregonensis)
N R, T C
Sucker (Catostomidae) N R, T C Bridgelip, largescale
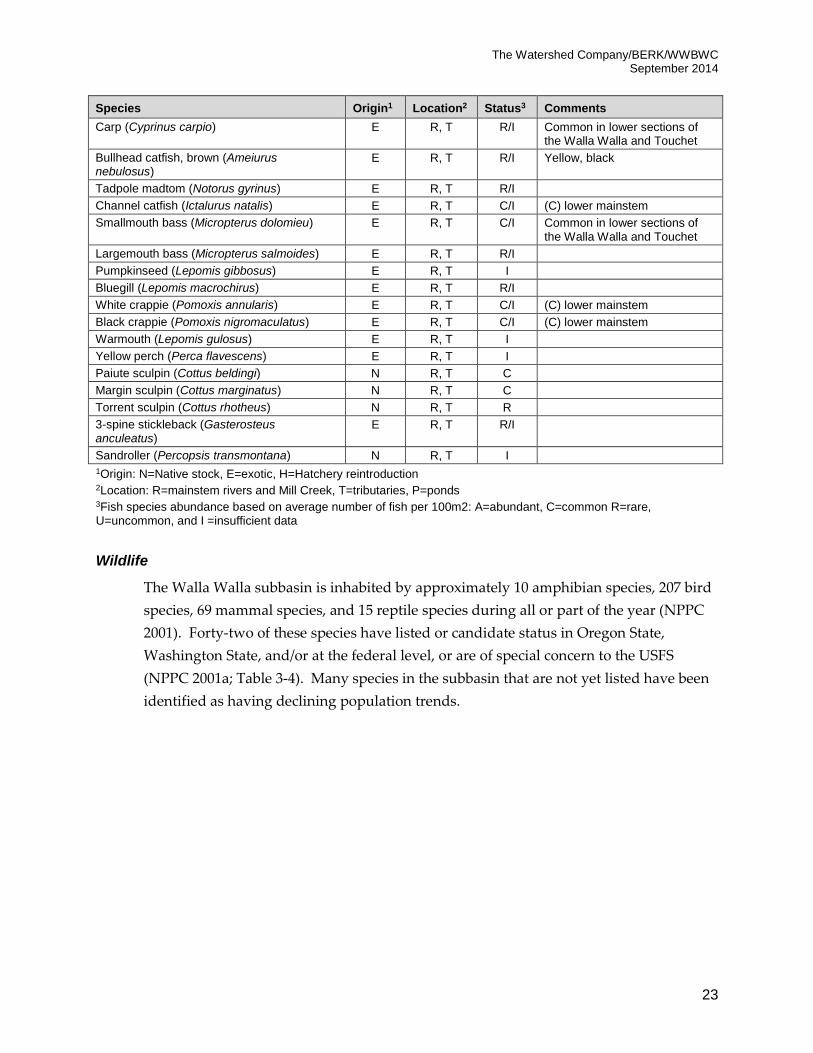
The Watershed Company/BERK/WWBWC September 2014
23
Species Origin1 Location2 Status3 Comments
Carp (Cyprinus carpio) E R, T R/I Common in lower sections of the Walla Walla and Touchet
Bullhead catfish, brown (Ameiurus nebulosus)
E R, T R/I Yellow, black
Tadpole madtom (Notorus gyrinus) E R, T R/I
Channel catfish (Ictalurus natalis) E R, T C/I (C) lower mainstem
Smallmouth bass (Micropterus dolomieu) E R, T C/I Common in lower sections of the Walla Walla and Touchet
Largemouth bass (Micropterus salmoides) E R, T R/I
Pumpkinseed (Lepomis gibbosus) E R, T I
Bluegill (Lepomis macrochirus) E R, T R/I
White crappie (Pomoxis annularis) E R, T C/I (C) lower mainstem
Black crappie (Pomoxis nigromaculatus) E R, T C/I (C) lower mainstem
Warmouth (Lepomis gulosus) E R, T I
Yellow perch (Perca flavescens) E R, T I
Paiute sculpin (Cottus beldingi) N R, T C
Margin sculpin (Cottus marginatus) N R, T C
Torrent sculpin (Cottus rhotheus) N R, T R
3-spine stickleback (Gasterosteus anculeatus)
E R, T R/I
Sandroller (Percopsis transmontana) N R, T I
1Origin: N=Native stock, E=exotic, H=Hatchery reintroduction 2Location: R=mainstem rivers and Mill Creek, T=tributaries, P=ponds 3Fish species abundance based on average number of fish per 100m2: A=abundant, C=common R=rare, U=uncommon, and I =insufficient data
Wildlife
The Walla Walla subbasin is inhabited by approximately 10 amphibian species, 207 bird
species, 69 mammal species, and 15 reptile species during all or part of the year (NPPC
2001). Forty-two of these species have listed or candidate status in Oregon State,
Washington State, and/or at the federal level, or are of special concern to the USFS
(NPPC 2001a; Table 3-4). Many species in the subbasin that are not yet listed have been
identified as having declining population trends.

Walla Walla County Shoreline Analysis Report
24
Table 3-4. Listed Wildlife Species within the Walla Walla Subbasin
(Source: Washington Department of Fish and Wildlife 2000a; Oregon Department of Fish and Wildlife
2000a; U. S. Forest Service 1990, as shown in WWWPU and WWBWC 2004, Table 2-4)
Species Status1
American marten (Martes americana) OR-SV, FS-MIS
Bank swallow (Riparia riparia) OR-SU
Black-backed woodpecker (Picoides arcticus) WA-C
Boreal owl (Aegolius funereus) OR-SU
Burrowing owl (Athene cunicularia) WA-C, OR-SC, US-SpCon
Ferruginous hawk (Buteo regalis) WA-T, OR-SC, FS-S, US-SpCon
Flammulated owl (Otus flammeolus) WA-C, OR-SC, FS-S
Fringed myotis (Myotis thysanodes) OR-SV, US-SpCon
Golden eagle (Aquila chrysaetos) WA-C
Grasshopper sparrow (Ammodramus savannarum) OR-SV
Great gray owl (Strix nebulosa) OR-SV, FS-S
Loggerhead shrike (Lanius ludovicianus) WA-C, OR-SV,US-SpCon
Long-billed curlew (Numenius americanus) OR-SV
Long-eared myotis (Myotis evotis) OR-SU, US-SpCon
Long-legged myotis (Myotis volans) OR-SU,US-SpCon
Lynx (Lynx canadensis) WA-T,US-T
Merriam's shrew (Sorex merriami) WA-C
Northern goshawk (Accipiter gentilis) WA-C, OR-SC, US-SpCon
Northern leopard frog (Rana pipiens) WA-E
Northern pygmy-owl (Glaucidium gnoma) OR-SC
Olive-sided flycatcher (Contopus borealis) OR-SV, US-SpCon
Pallid bat (Antrozous pallidus) OR-SV
Peregrine falcon (Falco peregrinus) WA-E, OR-E, FS-S, US-E
Pileated woodpecker (Dryocopus pileatus) WA-C, OR-SV,FS-S
Preble's shrew (Sorex preblei) FS-S
Pygmy nuthatch (Sitta pygmaea) OR-SC
Rocky mountain elk (Cervus elaphus) FS-MIS
Sage thrasher (Oreoscoptes montanus) WA-C
Sagebrush lizard (Sceloporus graciosus) OR-SV, US-SpCon
Silver-haired bat (Lasionycteris noctivagans) OR-SV
Striped whipsnake (Masticophis taeniatus) WA-C
Swainson's hawk (Buteo swainsoni) OR-SV,FS-S
Tailed frog (Ascaphus truei) OR-SV, US-SpCon
Three-toed woodpecker (Picoides tridactylus) OR-SC, FS-MIS
Vaux's swift (Chaetura vauxi) WA-C
Washington ground squirrel (Spermophilus washingtoni) WA-C, US-C
Western boreal toad (Bufo boreas) WA-C, OR-SV, US-SpCon
Western small-footed myotis (Myotis ciliolabrum) OR-SU, US-SpCon
White-headed woodpecker (Picoides albolarvatus) OR-SC, FS-MIS
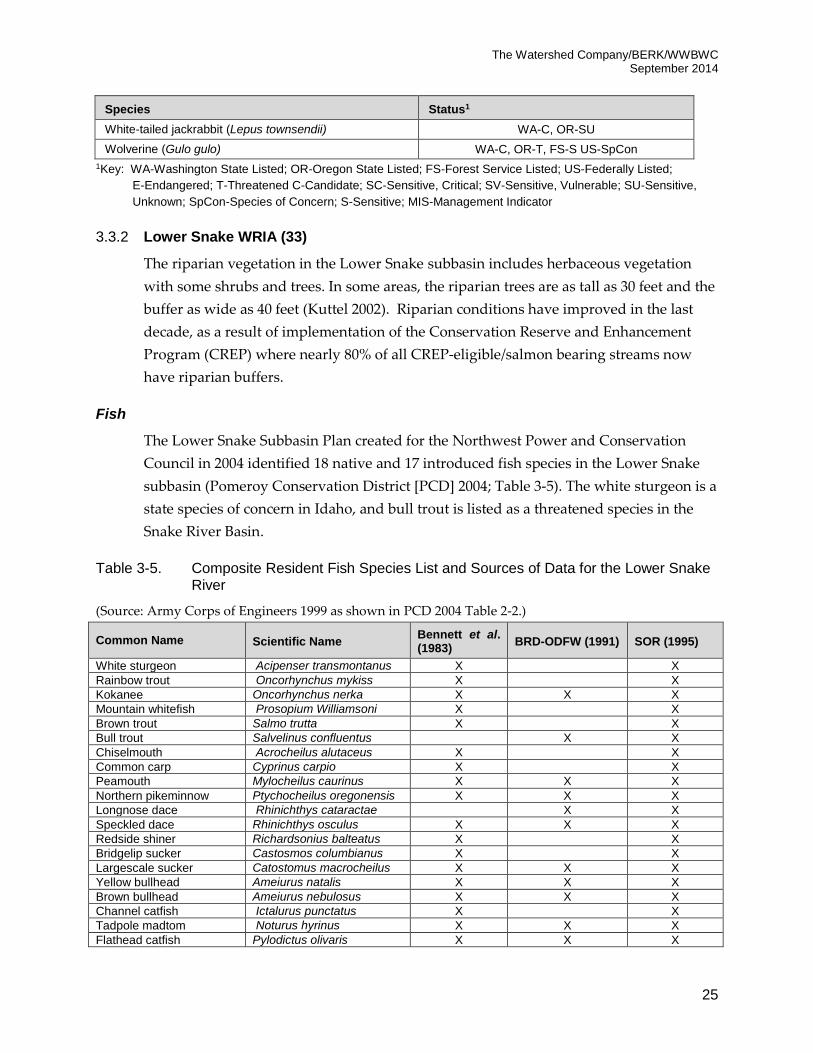
The Watershed Company/BERK/WWBWC September 2014
25
Species Status1
White-tailed jackrabbit (Lepus townsendii) WA-C, OR-SU
Wolverine (Gulo gulo) WA-C, OR-T, FS-S US-SpCon
1Key: WA-Washington State Listed; OR-Oregon State Listed; FS-Forest Service Listed; US-Federally Listed;
E-Endangered; T-Threatened C-Candidate; SC-Sensitive, Critical; SV-Sensitive, Vulnerable; SU-Sensitive,
Unknown; SpCon-Species of Concern; S-Sensitive; MIS-Management Indicator
3.3.2 Lower Snake WRIA (33)
The riparian vegetation in the Lower Snake subbasin includes herbaceous vegetation
with some shrubs and trees. In some areas, the riparian trees are as tall as 30 feet and the
buffer as wide as 40 feet (Kuttel 2002). Riparian conditions have improved in the last
decade, as a result of implementation of the Conservation Reserve and Enhancement
Program (CREP) where nearly 80% of all CREP-eligible/salmon bearing streams now
have riparian buffers.
Fish
The Lower Snake Subbasin Plan created for the Northwest Power and Conservation
Council in 2004 identified 18 native and 17 introduced fish species in the Lower Snake
subbasin (Pomeroy Conservation District [PCD] 2004; Table 3-5). The white sturgeon is a
state species of concern in Idaho, and bull trout is listed as a threatened species in the
Snake River Basin.
Table 3-5. Composite Resident Fish Species List and Sources of Data for the Lower Snake River
(Source: Army Corps of Engineers 1999 as shown in PCD 2004 Table 2-2.)
Common Name Scientific Name Bennett et al. (1983) BRD-ODFW (1991) SOR (1995)
White sturgeon Acipenser transmontanus X X
Rainbow trout Oncorhynchus mykiss X X
Kokanee Oncorhynchus nerka X X X
Mountain whitefish Prosopium Williamsoni X X
Brown trout Salmo trutta X X
Bull trout Salvelinus confluentus X X
Chiselmouth Acrocheilus alutaceus X X
Common carp Cyprinus carpio X X
Peamouth Mylocheilus caurinus X X X
Northern pikeminnow Ptychocheilus oregonensis X X X
Longnose dace Rhinichthys cataractae X X
Speckled dace Rhinichthys osculus X X X
Redside shiner Richardsonius balteatus X X
Bridgelip sucker Castosmos columbianus X X
Largescale sucker Catostomus macrocheilus X X X
Yellow bullhead Ameiurus natalis X X X
Brown bullhead Ameiurus nebulosus X X X
Channel catfish Ictalurus punctatus X X
Tadpole madtom Noturus hyrinus X X X
Flathead catfish Pylodictus olivaris X X X

Walla Walla County Shoreline Analysis Report
26
Common Name Scientific Name Bennett et al. (1983) BRD-ODFW (1991) SOR (1995)
Mosquitofish Gambusia affinis X
Three-spine stickleback Gasterosteus aculeatus
Sandroller Percopsis transmontana X
Pumpkinseed Lepomis gibbosus X X* X
Warmouth Lepomis gulosus X X X
Bluegill Lepomis macrochirus X X X
Smallmouth bass Micropterus dolomieui X X
Largemouth bass Micropterus salmoides X X X
White crappie Pomoxis annularis X X X
Black crappie Pomoxis nigromaculatus X X
Yellow perch Perca flavescens X X X
Walleye Stizostedion vitreum X X
Prickly sculpin Cottus asper X X X
Mottled sculpin Cottus bairdi X X
Paiute sculpin Cottus beldingi X X
Banded killfish ** Fundulus diaphanous N.A. N.A. N.A.
American shad *** Alosa sapidissima N.A. N.A. N.A.
Note: Bennett et al. (1983) reflects sampling by multiple gear types in the four reservoirs.
BRD-Oregon Department of Fish & Wildlife (ODFW) (1991) reflects sampling by electrofisher and includes sampling in the unimpounded Snake River above Asotin, Washington. SOR (1995) is a compilation of data from various sources, including the Snake River below Ice Harbor Dam. *Questionable record. **Added per personal communication between Dave Bennett and Glen Mendel, WDFW, due to recent discovery above Lower Granite Dam *** American shad are also presented in the portion of the Snake River mainstem that flows through the Lower Snake Subbasin (see <http://www.fpc.org/CurrentDaily/7day-ytd_adults.htm> for 2004 adult passage counts at the mainstem Columbia and Snake River dams)
The following discussion of anadromous fish populations in the Lower Snake subbasin
was included in the 2004 subbasin report, as excerpted from the Draft Lower Snake
Subbasin Summary (NPPC 2001b).
“Salmon populations in the Snake River have been listed under provisions of the
U.S. Endangered Species Act (ESA). The pertinent listed species are Snake River
sockeye salmon (Oncorhynchus nerka, listed as endangered in 1991), Snake River
spring/summer and fall chinook salmon (O. tshawytscha, both listed as
threatened in 1992), and Snake River steelhead (O. mykiss, listed as threatened in
1998)...
[Spring chinook salmon] was listed as threatened in 1992. Spring and summer
Chinook migrate through the mainstem Snake River, but no spawning or rearing
is known to occur there or in any of the minor tributaries in this subbasin, except
the Tucannon River where an endemic stock persists.
Fall chinook salmon were listed as threatened under the Endangered Species Act
in 1992. Fall chinook salmon are unique in that they spend the entire freshwater

The Watershed Company/BERK/WWBWC September 2014
27
portion of their life cycle in main-stem habitats. Historically, the majority of
Snake River fall chinook salmon apparently spawned in the mainstem near
Marsing, Idaho (Haas 1965; Irving and Bjornn 1981).
Construction of the Hells Canyon complex (1958-1967) and the Lower Snake
River Dams (1961-1975) eliminated or severely degraded 530 miles of spawning
and rearing habitat for fall chinook in the Snake River (Mendel 1998).
Historically, fall chinook salmon runs averaged 72,000 fish between 1938-1949,
with highs of up to 120,000 (Irving and Bjornn 1981). By the 1950s these runs had
decreased to an average of 29,000. Fall chinook continued to decline, and by the
late 1960s and 1970s the average run was only 5,100 fish at Ice Harbor Dam. The
average annual runs have remained at 4,700-5,500 fish in the 1980s and the
1990s…
Wild coho [salmon] are extinct in the Snake River basin since the early to mid-
1980s. Hatchery coho are being reintroduced in the Clearwater River by the
NPT. Also, there may be stray coho from the Umatilla, and possibly the Yakima
reintroduction efforts in the Snake River. Some of these fish are recovered at
Lyons Ferry Hatchery or in the Tucannon River since about 1997.
Information on Snake River steelhead is limited because it is difficult to develop
stock-specific estimates of abundance and survival. Additionally, it is nearly
impossible to obtain accurate redd counts for Snake River steelhead because of
their spawning locations and timing…”
Wildlife
A diverse variety of wildlife species are found in the Lower Snake Subbasin. Population
status varies by area and species; several species are listed as state threatened, candidate,
or species of concern (NPPC 2001b; Table 3-6). Big game, upland birds, diversity species,
furbearers, and waterfowl are managed by state and federal agencies (NPPC 2001b).
Table 3-6. Status of Priority Habitat Species (PHS) within the Lower Snake River sub-basin
(Source: WDFW data as shown in NPPC 2001b, Table 41)
Species Status Population
Ferruginous hawk T 5 nesting pairs?
Prairie falcon PHS 13 eyries*
Peregrine falcon E & PHS None
Ringneck pheasant G declining
Whitetailed jackrabbit C, SC unknown
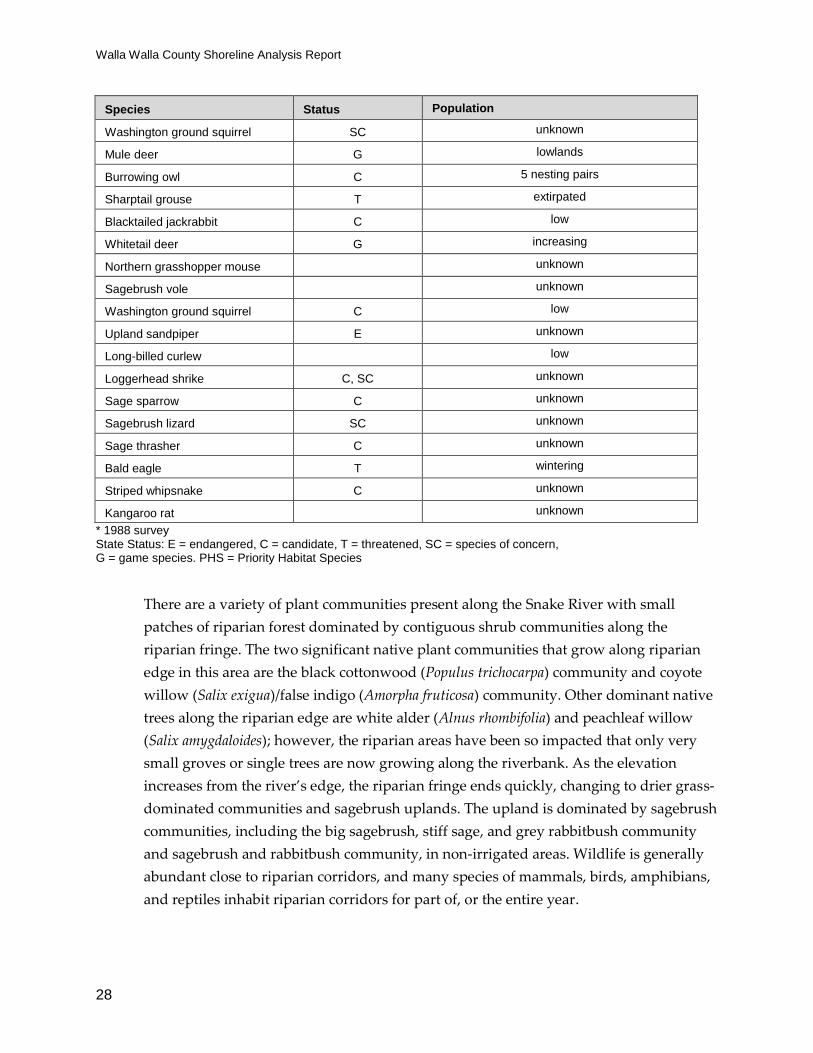
Walla Walla County Shoreline Analysis Report
28
Species Status Population
Washington ground squirrel SC unknown
Mule deer G lowlands
Burrowing owl C 5 nesting pairs
Sharptail grouse T extirpated
Blacktailed jackrabbit C low
Whitetail deer G increasing
Northern grasshopper mouse unknown
Sagebrush vole unknown
Washington ground squirrel C low
Upland sandpiper E unknown
Long-billed curlew low
Loggerhead shrike C, SC unknown
Sage sparrow C unknown
Sagebrush lizard SC unknown
Sage thrasher C unknown
Bald eagle T wintering
Striped whipsnake C unknown
Kangaroo rat unknown
* 1988 survey State Status: E = endangered, C = candidate, T = threatened, SC = species of concern, G = game species. PHS = Priority Habitat Species
There are a variety of plant communities present along the Snake River with small
patches of riparian forest dominated by contiguous shrub communities along the
riparian fringe. The two significant native plant communities that grow along riparian
edge in this area are the black cottonwood (Populus trichocarpa) community and coyote
willow (Salix exigua)/false indigo (Amorpha fruticosa) community. Other dominant native
trees along the riparian edge are white alder (Alnus rhombifolia) and peachleaf willow
(Salix amygdaloides); however, the riparian areas have been so impacted that only very
small groves or single trees are now growing along the riverbank. As the elevation
increases from the river’s edge, the riparian fringe ends quickly, changing to drier grass-
dominated communities and sagebrush uplands. The upland is dominated by sagebrush
communities, including the big sagebrush, stiff sage, and grey rabbitbush community
and sagebrush and rabbitbush community, in non-irrigated areas. Wildlife is generally
abundant close to riparian corridors, and many species of mammals, birds, amphibians,
and reptiles inhabit riparian corridors for part of, or the entire year.

The Watershed Company/BERK/WWBWC September 2014
29
3.3.3 Columbia River
Hundreds of fish and wildlife species reside in or migrate through the Columbia River.
At least 51 species of fish, including thirty native species, have been reported from the
mainstem Columbia River between Wanapum and The Dalles Dams (Ward et al. 2001).
Fall Chinook salmon are the dominant salmonids during spring in nearshore areas.
Other numerically significant species during the spring period are redside shiners, carp,
largescale suckers, northern pikeminnow, and peamouth (Ward et al. 2001).
In 2005, wild populations of salmon in the Columbia River basin represented only 12%
of their historic numbers (Bottom et al. 2005). All 13 ESA-listed evolutionary significant
units (ESUs) of salmon (Oncorhynchus spp.) and steelhead (O. mykiss) in the Columbia
basin use the mainstem Columbia River for migration to and from freshwater natal areas
to the Pacific Ocean (National Marine Fisheries Service (NMFS) 2009). Most of the ESA-
listed species spawn and incubate in tributaries, but some populations of fall Chinook
and chum salmon spawn in the mainstem itself.
At least 258 species of birds, 44 species of mammals, and 21 species of reptiles and
amphibians have been reported from habitats along or near the mainstem Columbia
River between Wanapum and The Dalles Dams (Ward et al. 2001). The middle
Columbia River mainstem supports one of the largest Northwest concentrations of
wintering waterfowl, particularly Canada geese and mallards (Ward et al. 2001). The
reservoirs support colonies of colonial nesting birds, most of which forage primarily on
fish. The river is an important migratory stopover and staging area for many species of
shorebird as well, including long-billed curlew, marbled godwit, long-billed dowitcher,
black-crowned night heron, and several gull and sandpiper species, some of which also
nest on the river.
Riparian vegetation and cliffs in this subbasin provide nesting opportunities for several
species of raptors. The State-threatened ferruginous hawk occurs in the area, as well as
bald and golden eagle, northern goshawk, Swainson’s hawk, osprey, peregrine and
prairie falcons, and several more common buteos and accipiters. Burrowing owl occurs
in adjacent open terrain, which also serves as foraging habitat for many other birds of
prey.
Many species of passerine birds also occur along the Columbia River, typically foraging
on insects associated with riverine and wetland habitats. Species occurring along the
Columbia that are particularly dependent on riparian areas and wetlands include
common yellowthroat, yellow warbler, Wilson’s warbler, yellow-breasted chat,

Walla Walla County Shoreline Analysis Report
30
Nashville warbler, warbling vireo, cedar waxwing, marsh wren, American pipit, red-
winged blackbird, and several of the swallows.
3.4 Major Land Use Changes
3.4.1 Walla Walla WRIA (32)
Historically, the Walla Walla watershed lowlands were characterized by shrubs,
herbaceous plants, and grasses (Snake River Salmon Recovery Board 2011). Trees were
limited to areas of higher groundwater near streams. Much of that vegetation has been
reduced or replaced by rangeland and cropland uses, and by commercial development
near the Cities of Walla Walla and College Place. Vineyards and orchards now account
for more than 3,800 acres of land within the county (Snake River Salmon Recovery Board
2011).
Dams in the Walla Walla watershed include Hofer Dam in the lower Touchet,
Burlingame Dam in the Walla Walla River, and the Mill Creek Project (Bennington Dam)
in Mill Creek upstream of the City of Walla Walla. The upper portion of Mill Creek is
protected by the Mill Creek watershed, and this area has maintained a natural flow
regime (Snake River Salmon Recovery Board 2011). Surface water is over-appropriated
in many of the streams in Walla Walla County, and the entire Touchet River has been
closed to further consumptive appropriations of surface water between June 1 and
October 1, since 1977. In addition to surface water limitations, many reaches have been
altered by diking, diversion, and/or channelization. A settlement between the irrigation
districts and the U.S. Fish and Wildlife Service (USFWS) in 2000 has helped improve
stream flows through the implementation of irrigation efficiencies. Several dike removal
projects have also been done, in conjunction with the Confederated Tribes of the
Umatilla Indian Reservation, Tri-State Steelheaders and WDFW, to reconnect the Walla
Walla River to its floodplain. Removing the dikes allows the river to utilize the
floodplain which has been blocked off in the past, thereby reducing water temperature
and improving flow.
Approximately half of irrigation needs are met through surface water withdrawals, and
the other half is met by groundwater withdrawals (Snake River Salmon Recovery Board
2011). Because groundwater and surface water are typically interconnected, pumping
from either shallow overburden or basalt aquifers usually has the effect of reducing
groundwater discharge to tributaries of the Snake and Columbia rivers, while pumping
from deeper basalt aquifers typically leads to decreased groundwater discharge directly
to the Snake and Columbia rivers (Snake River Salmon Recovery Board 2011). Many of
the streams and rivers in Walla Walla County do not meet water quality standards for

The Watershed Company/BERK/WWBWC September 2014
31
temperature, primarily due to lowered summer flows (Snake River Salmon Recovery
Board 2011).
The Walla Walla Watershed Management Partnership was established in 2009 under a
pilot local water management program (RCW 90.92) to address low flow concerns. The
Partnership has developed a Critical Low Flow Plan and worked with local irrigation
districts to develop local water plans to improve low flow conditions. The Walla Walla
Watershed Management Partnership is also a qualified local entity and program partner
with the Columbia Basin Water Transactions Program.
Water Quality
As early as 1998, Ecology discovered the water quality data for some streams and rivers
in the watershed did not meet the State's water quality standards. As a result, these
streams and rivers were placed on the 303(d) list. In 2004, Ecology included additional
watershed streams on the list. The streams have low dissolved oxygen, high
concentrations of chlorinated pesticides and PCBs, high temperatures, fecal coliform
bacteria, and pH levels.
Portions of the Walla Walla River and its tributaries have been listed by the state of
Washington for non-attainment of the human health criteria for several chlorinated
pesticides, and polychlorinated biphenyls (PCBs).
Ecology began a water quality improvement project (also known as a Total Maximum
Daily Load or TMDL) in the watershed to bring streams and rivers into compliance with
State water quality standards. Due to the size and complexity of the Walla Walla
watershed, Ecology developed four different TMDLs in the watershed:
Chlorinated pesticides and PCBs: Chlorinated pesticides and PCBs are
chemicals that are recognized as known or possible human carcinogens.
Although these chemicals were banned in the U.S. in the 1970s and 1980s,
they are often called “legacy pollutants” because they persist in the
environment for many years.
Fecal coliform bacteria: These bacteria are found in the feces of warm-
blooded animals. When found in bodies of water, fecal coliform can indicate
the presence of other pathogens.
Temperature: When water temperatures are too high, streams can become
uninhabitable for fish and other aquatic animals. Many salmon and trout
species may suffer decreased spawning success and even death when waters
Walla Walla County Shoreline Analysis Report
32
are too warm. In addition, warmer water tends to have lower dissolved
oxygen levels.
Dissolved oxygen and pH: Dissolved oxygen (DO) is necessary for fish to
breathe. pH affects the chemistry and chemical reactions that take place in
the water, such as the solubility of nutrients and metal compounds.
The Environmental Protection Agency (EPA) approved all four TMDLs by August 2007.
In addition to working on these TMDLs, Ecology and the Walla Walla Watershed
Planning Unit's Water Quality Subcommittee continued their partnership to write a
water quality implementation plan. The implementation plan guides the work that is
planned to improve water quality. The plan was completed in December, 2008. Over
fourteen organizations committed to help improve water quality by educating the
public, restoring native trees and shrubs along streams, reducing pollution in
stormwater, and installing off-stream water troughs and fences to control livestock. The
Water Quality Subcommittee prioritized streams in the watershed where work to
improve water quality should begin. Ecology staff are currently providing technical
assistance and working with organizations in these prioritized areas. Actions identified
in the TMDL are identified in Table 3.7. Specific Category 4 and 5 water quality listings
by reach are provided in the Inventory Data Summary Table in Appendix C.

The Watershed Company/BERK/WWBWC September 2014
33
Table 3.7. Actions Identified to Improve Water Quality in the Walla Walla Basin
(Adapted from Table 8 in Walla Walla Watershed PCBs, Chlorinated Pesticides, Fecal Coliform, Temperature, pH & Dissolved Oxygen Total
Maximum Daily Load Water Quality Implementation Plan (Washington Department of Ecology, 2008))
Organization Pollution Source Action Performance Measures Parameter
Where When
Columbia Conservation District, NRCS, and FSA
upland
install riparian buffers CREP eligible reaches landowner driven
temperature, bacteria, dissolved oxygen, nutrients, turbidity
direct seeding site specific landowner and referral driven
sediment, nutrients
livestock
fencing CREP eligible reaches referral and funding driven
bacteria, dissolved oxygen, temperature, nutrients off-site water site specific
referral and funding driven
Koosksooskie Commons
lawns and small acreages
education and restoration by Walla Walla Backyard Stream Team
Yellowhawk Creek on-going
bacteria, dissolved oxygen, temperature, nutrients
Yellowhawk streamkeepers-Urban Backyard Riparian Restoration
Garrison Creek in Fort Walla Walla Park
on-going
education and outreach on stream restoration
60-house development on Yellowhawk Creek
on-going
Priority Projects Group*
land conversion
3 -5 acre wetland restoration North Fork Reser Ck 2010 temperature, dissolved oxygen
3 -5 acres upland steppe restoration
Walla Walla basin 2010 -2011
Tri-State Steelheaders
bank erosion, lack of riparian buffer
woody bank armor, riparian planting and conservation easement
Walla Walla River 2006 -2008 bacteria, dissolved oxygen, temperature, nutrients, turbidity
Large woody debris and riparian planting
Touchet River 2007-2008

Walla Walla County Shoreline Analysis Report
34
Organization Pollution Source Action Performance Measures Parameter
Where When
agriculture and land development
conservation easement North Fork Coppei Creek
2005 -2008
conservation easement Mill Creek 2007 -2008
bank erosion, livestock
riparian planting, pasture fence setback
Russell Creek 2007 -2008
Pasture fence setback, riparian planting
Yellowhawk Creek, Caldwell Creek
2009
riparian planting, livestock setback exclusion
Walla Walla River 2010 -2011
agriculture restore 3-acre wetland with a 14 acre native plant buffer
Reser Creek drainage 2008 -2012
U.S. Army Corps of Engineers -Walla Walla
stormwater riparian planting Nursery St. Bridge in Oregon
possibly 2009 -2010 temperature
channelization feasibility study Walla Walla Basin ongoing flow
City of Walla Walla
Stormwater
place no dumping placards 1000 storm drains discharging to streams
2008-2009 bacteria, dissolved oxygen, temperature, nutrients, turbidity
Sweep streets arterials every week
Residential streets every 2 months
maintain BMPs required by stormwater permit
city wide yearly
urban/rural composting for residents collect household hazardous waste
city wide yearly bacteria, dissolved oxygen, nutrients
city wide yearly toxic chemicals
all/varies Publish 4 articles, bill inserts, or TV spots about water quality
city wide (10,000 customers)
yearly
bacteria, dissolved oxygen, temperature, nutrients, turbidity
W A State Dept. of Ecology
All sources award grants and loans for implementation activities
basin wide annual competitive cycle
turbidity, total suspended solids,

The Watershed Company/BERK/WWBWC September 2014
35
Organization Pollution Source Action Performance Measures Parameter
Where When
provide technical assistance when needed temperature, nutrients, bacteria
provide education and outreach
when needed
monitor water quality as funding allows
inspect DMRs and facilities as required by permit
follow up on complaints, referrals and enforcement
as received
W A State Dept. of Transportation
highway construction
increase infiltration Highway 12 plus an additional 5 acres
2008 -2011 dissolved oxygen, nutrients, pH, turbidity
Walla Walla County Public Works Department
road construction develop stormwater management plan; use BMPs
on-site
during construction
turbidity, total suspended solids
bridge construction projects
develop stormwater management plan, use of BMPs, riparian restoration at bridge, comply with federal and state regulations
during construction
rock crushing
develop stormwater management plan; use BMPs; comply with DNR requirements
during operations
turbidity, total suspended solids
county facilities develop storm water management plan; use BMPs
on-going
new county roads for housing developments
develop stormwater management plan; use BMPs
during construction
new county roads for industrial and commercial development
develop stormwater management plan; use BMPs during construction
during construction

Walla Walla County Shoreline Analysis Report
36
Organization Pollution Source Action Performance Measures Parameter
Where When
direct discharge of stormwater into streams
evaluate on case-by-case basis
when needed
turbidity, total suspended solids, temperature, nutrients, bacteria
herbicide applications near waterways
use aquatic herbicides per regulations
during application toxic chemicals
de-icing applications use non-toxic solutions during application
Walla Walla Community College’s Water and Environment Center
varies Education on rural and upland BMPs
Workshops within the entire watershed
annually
Bacteria, dissolved oxygen, temperature, nutrients, turbidity
Walla Walla Community College
channelization Remove cement-lined pond and install a buffer
Titus Creek 2008-2009
Bacteria, temperature, dissolved oxygen, nutrients, turbidity
Walla Walla County Conservation District, NRCS, and FSA
livestock Install 810 acres riparian buffers
Touchet and Walla Walla rivers; Dry, Doan, and Cottonwood creeks
2008-2012
Bacteria, temperature, dissolved oxygen, nutrients, turbidity
Walla Walla County Conservation District
Urban areas Install 9 to 15 urban buffers Urban streams fall 2007-spring 2010
temperature, dissolved oxygen, nutrients, sediment, turbidity
Irrigation canals
6 miles of piping Touchet River basin-Eastside Irrigation District
2008-2009
piping (undetermined amount)
Old Lowden 2009-2010
Bergevin-Williams 2009-2010
Gardena 2010-2011
Lowden 2010-2011
channelization Creek restoration, including meander reconstruction
Doan Creek east of Last Chance Road
2010
*Priority Projects Group consists of: Walla Walla County Conservation District, Tri-State Steelheaders, Washington State Department of Fish and Wildlife,
Confederated Tribes of the Umatilla Indian Reservation, and Blue Mountain Land Trust
The Watershed Company/BERK/WWBWC September 2014
37
3.4.2 Lower Snake WRIA (33)
Historically, the Lower Snake River watershed was covered by grasslands and shrub-
steppe vegetation. In areas adjacent to streams, vegetation consisted of grasses, shrubs,
and large trees (e.g., willow, cottonwood, birch, and alder) (Snake River Salmon
Recovery Board 2011). As a result of land use changes and development, much of the
historic prairie, shrub-steppe, and riparian habitats have been lost or modified.
However, as noted in the previous section, implementation of the CREP over the last
decade has improved riparian conditions for most CREP eligible/salmon bearing
streams.
The hydrology along the Snake River has been severely altered by the installation of
hydroelectric dams. The Corps operates four dams in the Snake River basin. The two
lower dams, Ice Harbor and Lower Monumental Dams occur in Walla Walla County.
The dams on the Lower Snake and Columbia Rivers impound water, creating shallow
reservoirs that typically fill the width of the steep-sided canyons.
These impoundments aid navigation for shipping barges and provide access to private
industrial and agricultural docks on the Snake River. Barges from these facilities travel
downriver through the locks at Lower Monumental and Ice Harbor to Port of Walla
Walla facilities at the Burbank Industrial Park or beyond to the Tri-Cities or the Port of
Benton.
In addition to alteration of the natural shoreline through water impoundment, the
private and Port-owned dock sites have further altered the shoreline through the
placement of piers and other in-water structures, as well as rip-rap and other shoreline
protection structures.
McNary Wildlife Refuge
The McNary National Wildlife Refuge (NWR) is located in rural Burbank, extending
along the east bank of the Columbia River, from the confluence of the Snake River to the
mouth of the Walla Walla River, and downstream into Oregon.
Established in 1956, the McNary NWR was created to replace wildlife habitat lost to
construction of the McNary Dam downstream. The 15,000 acres of sloughs, ponds,
streams and islands—riparian and wetland habitat—as well as upland shrub-steppe and
cliff-talus habitat are important to migratory waterfowl, shorebirds and songbirds. Few
areas in North America support such dense concentrations of waterfowl; more than half
the mallards in the Pacific Flyway travel over McNary National Wildlife Refuge's rich
diversity of wetland habitat created by the damming of the Columbia River. The dam
Walla Walla County Shoreline Analysis Report
38
highly altered the natural ecosystems and provided management challenges for the U.S.
Fish and Wildlife Service. These challenges include artificial river operations,
widespread nonnative invasive plant and animal species introduction, and extensive
land use conversion and fragmentation. McNary NWR staff use a variety of carefully
chosen habitat management techniques to maintain, recover, or enhance habitat for
wildlife.
Management of seasonal wetlands involves the manipulation of water levels to
encourage native food supplies and promote the diverse wetland plant growth that
provides a variety of food and shelter for wildlife. Some wetlands are burned and
disked to remove undesirable plant growth and create open areas. Shoreline burning
and mowing also create open beach areas that waterfowl use for courting, feeding,
resting and raising young. Seasonally flooded wetlands provide resting and feeding
areas and are especially important to waterfowl during fall migration.
Upland areas, replete with sagebrush, rabbitbrush, and bunchgrasses, provide forage for
deer and nesting sites for pheasants, ducks, California quail, and burrowing owls.
Refuge managers improve uplands through prescribed burning, removal of exotic weed
species, and planting of native grasses.
Riparian areas supply food, plants, water, nesting sites, and shelter for a wide variety of
wildlife. Cottonwoods and willows in riparian areas provide essential nesting habitat for
migratory songbirds like yellow warblers and willow flycatchers. Management practices
in riparian areas include planting native willows and cottonwoods.
Approximately 700 acres of refuge lands are irrigated croplands, which provide food
and cover for wildlife. Farmers grow corn, wheat, alfalfa and other crops under a
cooperative agreement whereby the refuge's share of the crop is left in the field for
wildlife. These crops provide an extremely valuable source of high energy food for
waterfowl, especially in late winter when other food sources may be exhausted or
covered by snow.
Water Quality
The Lower Snake River water quality is impaired by several pesticides, dioxin, PCBs,
temperature, dissolved oxygen, and phosphorus. Data used for these determinations
were collected from water, sediment, or fish tissue. Many of the pesticides and PCBs are
legacy chemicals contained in sediments, but no longer actively used by agriculture,
industry, or municipalities. TMDLs have been developed for dioxin and dissolved
oxygen. See the discussion in Section 3.4.1 above for more detail

The Watershed Company/BERK/WWBWC September 2014
39
3.4.3 Columbia River
Human influences have resulted in substantial changes to the shoreline of the Columbia
River. The most significant changes to the River’s shoreline have resulted from
European settlement following the Lewis and Clark expedition in the early 1800s.
The 21 dams built on the Columbia and Snake Rivers since 1933 have substantially
altered the Columbia River hydrograph. Dam operations have reduced the frequency of
spring freshets, which historically helped maintain floodplain habitat connectivity and
aided the migration of juvenile salmon. As a result, over-bank flows and associated
large woody debris (LWD) recruitment and sediment transport processes have been
substantially reduced.
Today, the Columbia basin supports significant water-dependent commercial and
industrial uses, ports, transportation, and urban population centers. The Port of Walla
Walla, founded in 1952 in anticipation of the completion of the McNary Dam, serves as
the primary economic development agency in the region. The shoreline sites that
currently comprise Wallula, Attalia, and Burbank were purchased from the federal
government by the Port and used to attract industry to the newly-accessible western
portions of Walla Walla County. Today, the Port manages a number of industrial sites
on the Columbia River, including the Wallula Gap Industrial Park-Shipping Terminal,
located just south of the mouth of the Walla Walla River. The site functions as an
intermodal shipping terminal with barge moorage and public rail line access for
shipping goods inland. In addition to Port of Walla Walla facilities, several privately
owned industrial sites also dot the Columbia River shoreline, several with their own
dock facilities.
In these developed areas, riprap and docks have replaced riparian vegetation, and rip
rap revetments now comprise a significant portion of the reservoir shorelines. Historic
and ongoing dredging operations are responsible for maintaining a viable navigation
channel to support five deep-water ports, which transport 30 million tons of goods
annually.
Water Quality
Within Lake Wallula, water quality is strongly influenced by the Snake and Yakima
rivers. Flow from the Snake, Yakima, and Columbia Rivers are not fully mixed until
they reach McNary Dam (Ward et al. 2001). The Snake River-influenced portion on the
southeast side of the river experiences high turbidity and a high nutrient load, and the
Yakima River-influenced portion experiences lower turbidity (Ward et al. 2001). The
Walla Walla County Shoreline Analysis Report
40
Lake Wallula area is on the state 303(d) list for temperature impairments. Additionally,
TMDLs have been prepared for PCB, Hexachlorobenzene and dioxin for other portions
of the Columbia within Walla Walla County shoreline jurisdiction. For all shoreline
jurisdiction waterbodies, water quality listings by reach unit used for analysis in
Chapter 5 can be found in Appendix B.
4 SHORELINE INVENTORY
4.1 Inventory Sources
Development of a shoreline inventory is intended to record the existing or baseline
conditions upon which the development of SMP provisions will be examined to ensure
the adopted regulations provide no net loss of shoreline ecological functions. At a
minimum, local jurisdictions shall gather the inventory elements listed in the WAC
Guidelines, to the extent information is relevant and readily available. Collected
information principally included Watershed Resource Inventory Area (WRIA) and other
basin documents, Walla Walla County studies, scientific literature, aerial photographs,
and Geographic Information Systems (GIS) data from a variety of data providers.
Table 4-1 lists those relevant inventory elements for which data is available for the
County’s shorelines. The table also describes the information collected for each of the
required inventory elements. Map figures are provided in the Map Folio (Appendix B),
and they depict the various inventory pieces listed in the table, as well as additional
analysis. Data gaps and limitations are discussed further in Section 4.2. The WAC
Guidelines do not require generation of new information or mapping to fill identified
data gaps.
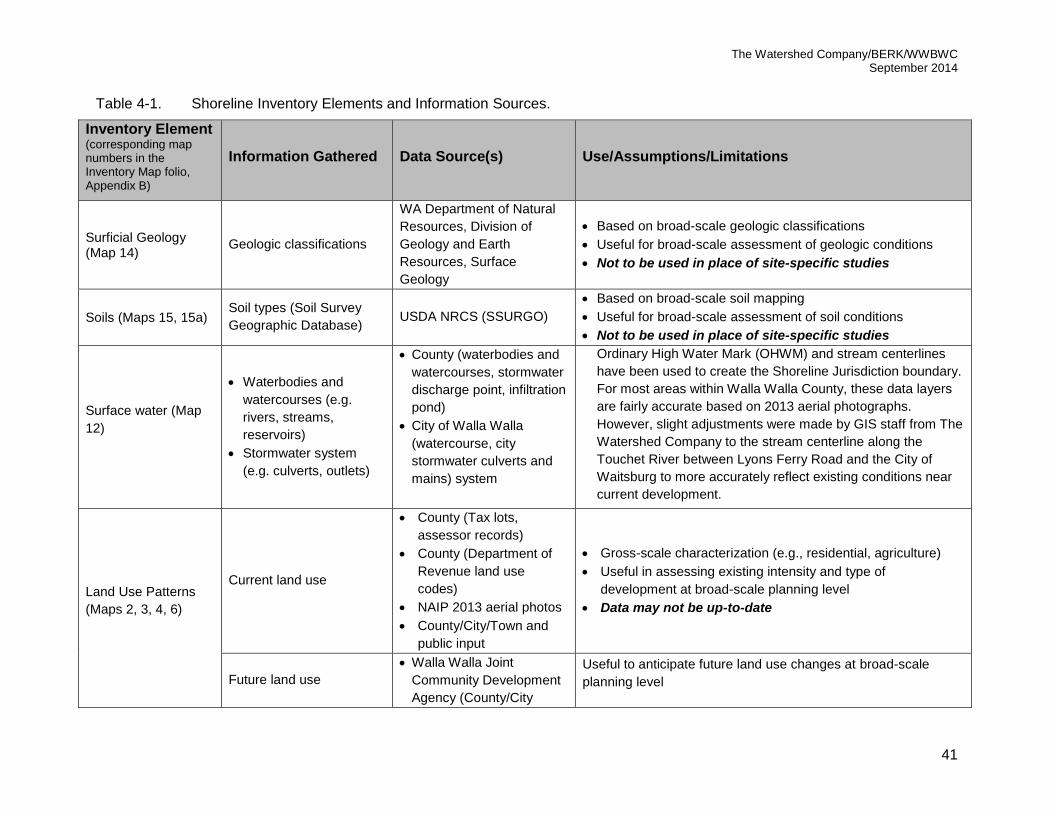
The Watershed Company/BERK/WWBWC September 2014
41
Table 4-1. Shoreline Inventory Elements and Information Sources.
Inventory Element (corresponding map numbers in the Inventory Map folio, Appendix B)
Information Gathered Data Source(s) Use/Assumptions/Limitations
Surficial Geology (Map 14)
Geologic classifications
WA Department of Natural
Resources, Division of
Geology and Earth
Resources, Surface
Geology
Based on broad-scale geologic classifications
Useful for broad-scale assessment of geologic conditions
Not to be used in place of site-specific studies
Soils (Maps 15, 15a) Soil types (Soil Survey
Geographic Database) USDA NRCS (SSURGO)
Based on broad-scale soil mapping
Useful for broad-scale assessment of soil conditions
Not to be used in place of site-specific studies
Surface water (Map
12)
Waterbodies and
watercourses (e.g.
rivers, streams,
reservoirs)
Stormwater system
(e.g. culverts, outlets)
County (waterbodies and
watercourses, stormwater
discharge point, infiltration
pond)
City of Walla Walla
(watercourse, city
stormwater culverts and
mains) system
Ordinary High Water Mark (OHWM) and stream centerlines
have been used to create the Shoreline Jurisdiction boundary.
For most areas within Walla Walla County, these data layers
are fairly accurate based on 2013 aerial photographs.
However, slight adjustments were made by GIS staff from The
Watershed Company to the stream centerline along the
Touchet River between Lyons Ferry Road and the City of
Waitsburg to more accurately reflect existing conditions near
current development.
Land Use Patterns
(Maps 2, 3, 4, 6)
Current land use
County (Tax lots,
assessor records)
County (Department of
Revenue land use
codes)
NAIP 2013 aerial photos
County/City/Town and
public input
Gross-scale characterization (e.g., residential, agriculture)
Useful in assessing existing intensity and type of
development at broad-scale planning level
Data may not be up-to-date
Future land use
Walla Walla Joint
Community Development
Agency (County/City
Useful to anticipate future land use changes at broad-scale
planning level
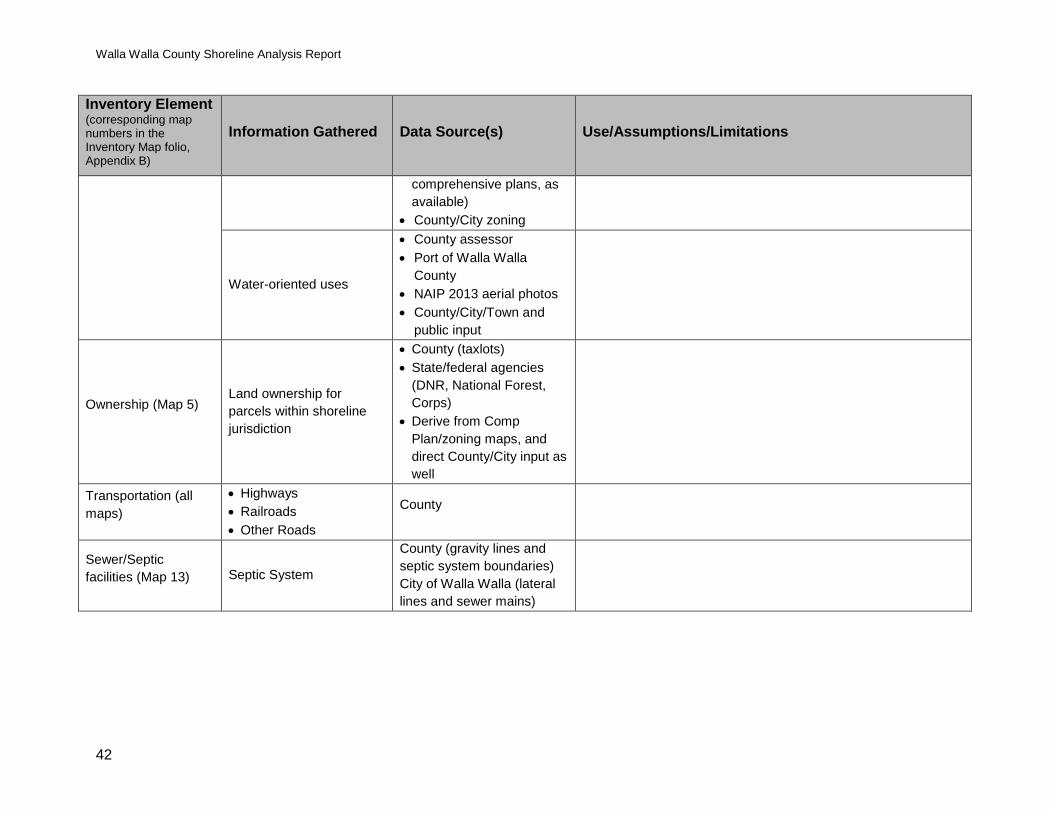
Walla Walla County Shoreline Analysis Report
42
Inventory Element (corresponding map numbers in the Inventory Map folio, Appendix B)
Information Gathered Data Source(s) Use/Assumptions/Limitations
comprehensive plans, as
available)
County/City zoning
Water-oriented uses
County assessor
Port of Walla Walla
County
NAIP 2013 aerial photos
County/City/Town and
public input
Ownership (Map 5) Land ownership for
parcels within shoreline
jurisdiction
County (taxlots)
State/federal agencies
(DNR, National Forest,
Corps)
Derive from Comp
Plan/zoning maps, and
direct County/City input as
well
Transportation (all
maps)
Highways
Railroads
Other Roads
County
Sewer/Septic
facilities (Map 13) Septic System
County (gravity lines and
septic system boundaries)
City of Walla Walla (lateral
lines and sewer mains)

The Watershed Company/BERK/WWBWC September 2014
43
Inventory Element (corresponding map numbers in the Inventory Map folio, Appendix B)
Information Gathered Data Source(s) Use/Assumptions/Limitations
Impervious Surfaces
(Map 8)
Land surface in a range of
0 to 100% percent of
imperviousness as
defined by the National
Land Cover Database
(NLCD
US Department of Interior,
USGS (National Land Cover
Database)
Useful for broad-scale assessment of impervious surfaces only
Vegetation (Map 9) Land cover
Vegetation type
US Department of Interior
(National Land Cover
Database)
Useful for broad-scale assessment of vegetation coverage
only
Not useful for accurate characterization of fine-scale data
(e.g., parcel level, species composition)
Shoreline
Modifications (Map
20)
Levees WA Department of Ecology
This dataset is a synthesis of existing information on levees
in the State of WA. Primary data sources include the U.S.
Army Corps of Engineers and the Federal Emergency
Management Agency. Inputs from local levee managers were
also used to augment the primary sources.
Overwater structures WA Department of Natural
Resources
Overwater structures includes structures such as piers and
bridges. Dams are also depicted in DNR’s overwater
structures dataset.
Data was last updated in 2007 and has a 10-foot
horizontal accuracy range
May not be useful for accurate characterization of fine
scale data (e.g., parcel level)
Dams WA Department of Ecology
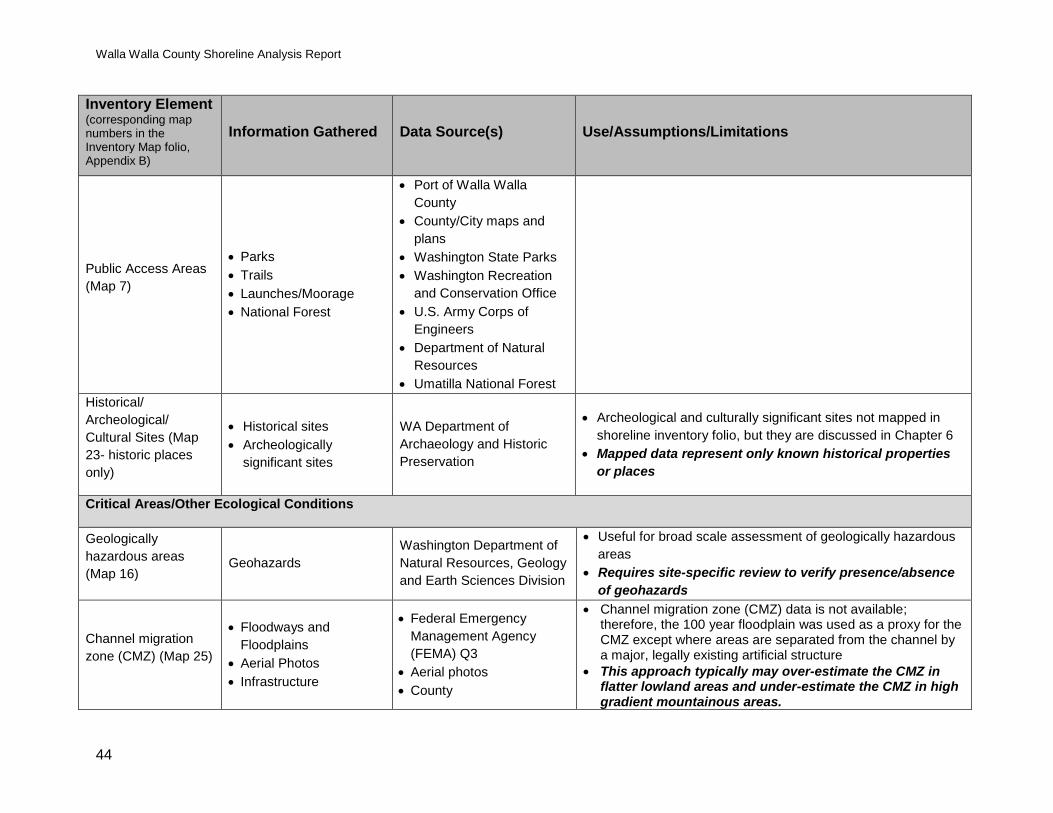
Walla Walla County Shoreline Analysis Report
44
Inventory Element (corresponding map numbers in the Inventory Map folio, Appendix B)
Information Gathered Data Source(s) Use/Assumptions/Limitations
Public Access Areas
(Map 7)
Parks
Trails
Launches/Moorage
National Forest
Port of Walla Walla
County
County/City maps and
plans
Washington State Parks
Washington Recreation
and Conservation Office
U.S. Army Corps of
Engineers
Department of Natural
Resources
Umatilla National Forest
Historical/
Archeological/
Cultural Sites (Map
23- historic places
only)
Historical sites
Archeologically
significant sites
WA Department of
Archaeology and Historic
Preservation
Archeological and culturally significant sites not mapped in
shoreline inventory folio, but they are discussed in Chapter 6
Mapped data represent only known historical properties
or places
Critical Areas/Other Ecological Conditions
Geologically
hazardous areas
(Map 16) Geohazards
Washington Department of
Natural Resources, Geology
and Earth Sciences Division
Useful for broad scale assessment of geologically hazardous
areas
Requires site-specific review to verify presence/absence
of geohazards
Channel migration
zone (CMZ) (Map 25)
Floodways and
Floodplains
Aerial Photos
Infrastructure
Federal Emergency
Management Agency
(FEMA) Q3
Aerial photos
County
Channel migration zone (CMZ) data is not available; therefore, the 100 year floodplain was used as a proxy for the CMZ except where areas are separated from the channel by a major, legally existing artificial structure
This approach typically may over-estimate the CMZ in flatter lowland areas and under-estimate the CMZ in high gradient mountainous areas.
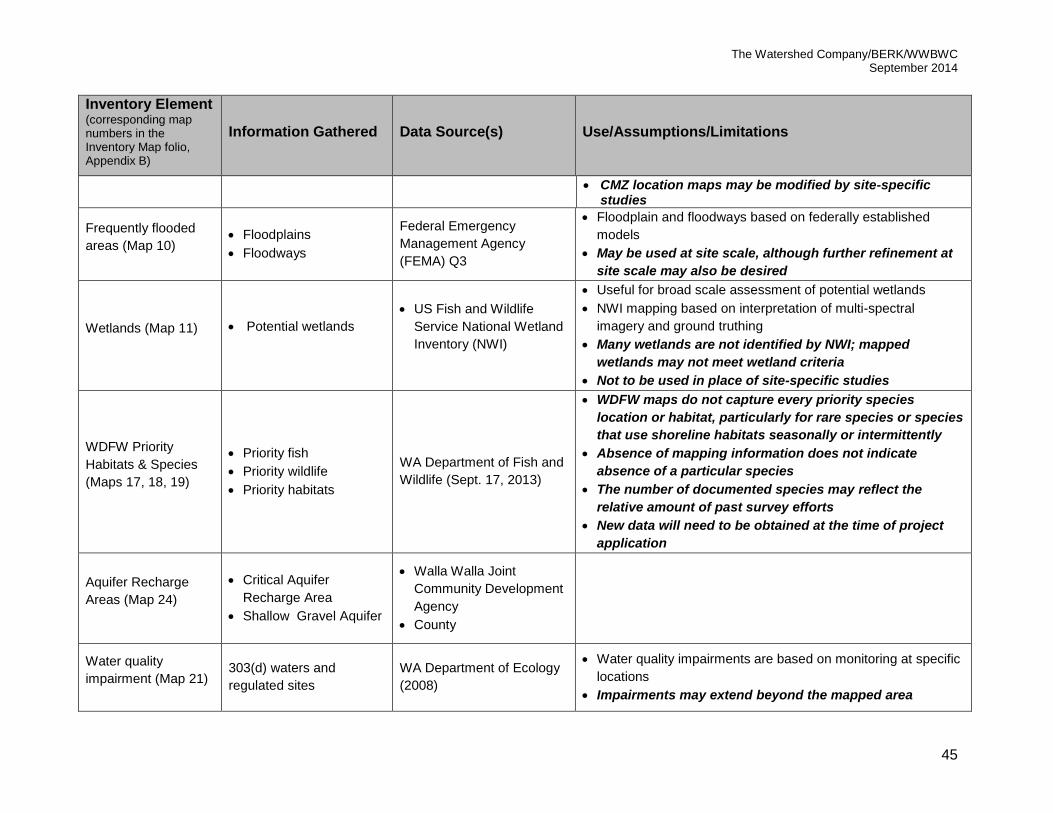
The Watershed Company/BERK/WWBWC September 2014
45
Inventory Element (corresponding map numbers in the Inventory Map folio, Appendix B)
Information Gathered Data Source(s) Use/Assumptions/Limitations
CMZ location maps may be modified by site-specific studies
Frequently flooded
areas (Map 10) Floodplains
Floodways
Federal Emergency
Management Agency
(FEMA) Q3
Floodplain and floodways based on federally established
models
May be used at site scale, although further refinement at
site scale may also be desired
Wetlands (Map 11) Potential wetlands
US Fish and Wildlife
Service National Wetland
Inventory (NWI)
Useful for broad scale assessment of potential wetlands
NWI mapping based on interpretation of multi-spectral
imagery and ground truthing
Many wetlands are not identified by NWI; mapped
wetlands may not meet wetland criteria
Not to be used in place of site-specific studies
WDFW Priority
Habitats & Species
(Maps 17, 18, 19)
Priority fish
Priority wildlife
Priority habitats
WA Department of Fish and
Wildlife (Sept. 17, 2013)
WDFW maps do not capture every priority species
location or habitat, particularly for rare species or species
that use shoreline habitats seasonally or intermittently
Absence of mapping information does not indicate
absence of a particular species
The number of documented species may reflect the
relative amount of past survey efforts
New data will need to be obtained at the time of project
application
Aquifer Recharge
Areas (Map 24)
Critical Aquifer
Recharge Area
Shallow Gravel Aquifer
Walla Walla Joint
Community Development
Agency
County
Water quality
impairment (Map 21) 303(d) waters and
regulated sites
WA Department of Ecology
(2008)
Water quality impairments are based on monitoring at specific
locations
Impairments may extend beyond the mapped area
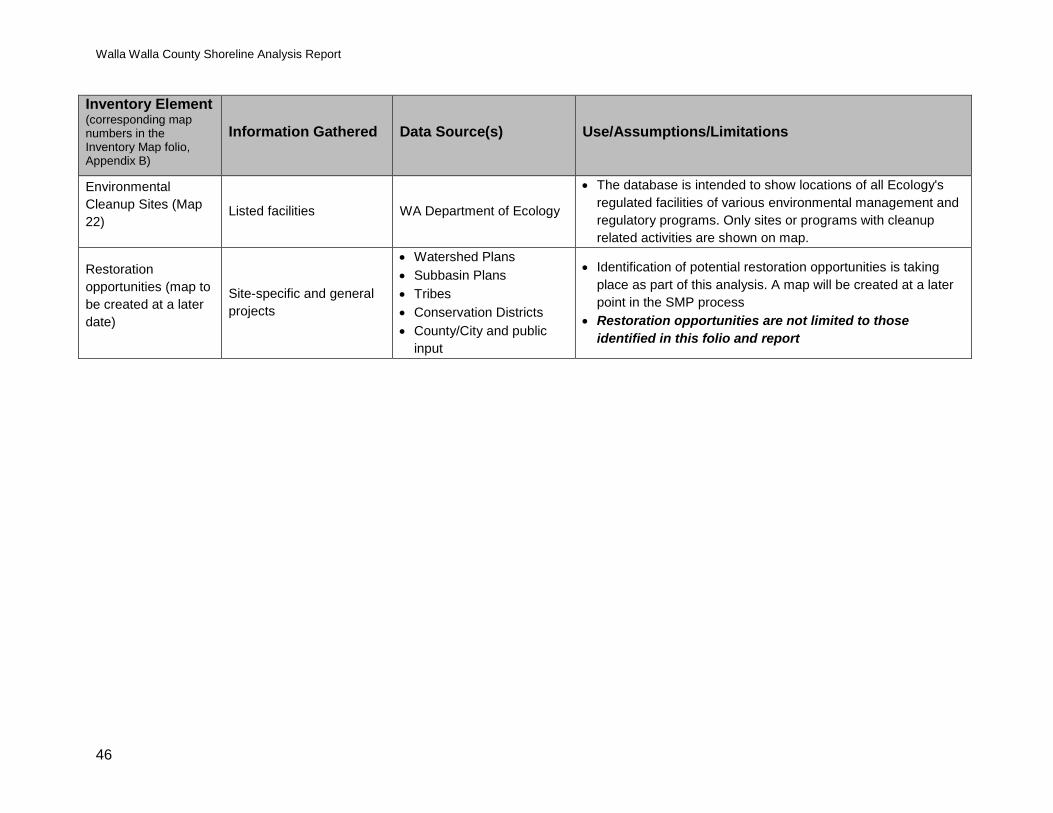
Walla Walla County Shoreline Analysis Report
46
Inventory Element (corresponding map numbers in the Inventory Map folio, Appendix B)
Information Gathered Data Source(s) Use/Assumptions/Limitations
Environmental
Cleanup Sites (Map
22)
Listed facilities WA Department of Ecology
The database is intended to show locations of all Ecology's
regulated facilities of various environmental management and
regulatory programs. Only sites or programs with cleanup
related activities are shown on map.
Restoration
opportunities (map to
be created at a later
date)
Site-specific and general
projects
Watershed Plans
Subbasin Plans
Tribes
Conservation Districts
County/City and public
input
Identification of potential restoration opportunities is taking
place as part of this analysis. A map will be created at a later
point in the SMP process
Restoration opportunities are not limited to those
identified in this folio and report

The Watershed Company/BERK/WWBWC September 2014
47
4.2 Data Assumptions and Data Gaps
4.2.1 Ecological Characterization
The following discussion identifies assumptions and limitations for present inventory
elements, and may provide a brief County-wide or watershed-wide narrative where
qualitative descriptions provide more information than quantitative measures. Despite
data gaps and limitations, a substantial quantity of information is available for the
shorelines of Walla Walla County and the Cities of Prescott, Waitsburg and Walla Walla,
to aid in the development of the inventory and analysis report, as well as the shoreline
master program.
Vegetation Coverage
Vegetative coverage data was generated using multi-spectral satellite imagery with
30x30-meter cell resolution. Spectral data was classified using Multi-Resolution Land
Characteristics (MRLC) Consortium, National Land Cover (NLC) Database. Because
each cell represents 900 square meters, the classification may over or under represent
coverage when the type of coverage within cells is mixed. The spatial resolution of the
NLC data provides a good foundation for broad scale assessment of vegetation
coverage. Its utility is higher in rural areas where vegetative cover is more uniform over
broad areas compared to more developed UGAs.
Because the data is based on interpretation of multi-spectral imagery, classification of
some data may be inaccurate. Most notably, shrub steppe vegetation on steeper slopes
is frequently miscategorized as “cultivated crops” using the NLC model. So long as the
inherent inaccuracies of the data or recognized, the NLC data provides a good broad-
scale assessment of vegetation coverage.
Finally, because the OWHM changes over time, water is occasionally included within
the total shoreline area used for the calculation of vegetation coverage. For this reason,
any area identified as “Water” was excluded from the calculation of percent coverage.
Impervious Surfaces
Similar to the vegetation coverage data, impervious surface data was generated using
MRLC Consortium NLC data (2006) of multispectral satellite imagery with 30x30-meter
cell resolution. National Land Cover categories that apply to areas of higher impervious
surface coverage include Developed- Low, Medium, and High Intensity categories. The
same limitation as the vegetation coverage data apply to impervious surfaces.

Walla Walla County Shoreline Analysis Report
48
Wetlands
Wetland mapping was assembled from the National Wetlands Inventory (NWI). The
NWI dataset is based on many factors, including soil inventories and aerial
interpretations. Although it is very comprehensive and is fairly accurate in
approximating wetland locations, it is acknowledged that many wetlands, especially
small wetlands, are not identified by NWI. Likewise, some areas identified as NWI
wetlands may not meet wetland criteria. The NWI map was reviewed for obvious
inaccuracies, but site-scale investigation is needed to conclusively include or exclude
potential wetland areas. Whether or not they are captured by this mapping effort and
included in the preliminary shoreline jurisdiction maps, actual wetland conditions that
may or may not be found on a site will determine shoreline jurisdiction (as a potential
shoreline-associated wetland) on a site-specific basis.
Soils
Soil data are derived from the Natural Resource Conservation Service (NRCS) national
soil survey. These data represent soils over broad areas; therefore, site-specific soil
characteristics may differ from what is mapped. Information on alluvial soil presence
and distribution was used to assess hyporheic functions.
Surficial Geology
Data on surficial geology are based on information from Washington DNR. The data is
based on broad-scale geologic classifications; therefore, site-specific characteristics may
differ. The map should not be used in place of site-specific studies.
Fish and Wildlife Habitat Conservation Areas
WDFW Priority Habitat and Species maps are presented as three separate units: Habitat
Regions (species or habitat ranges by area), Habitat Species (precise species locations);
and Fish (fish species presence).
These maps do not capture every priority species location or habitat in shoreline
jurisdiction, particularly rare species or species that use the water for foraging and
drinking, but that nest or den farther from the shoreline. Absence of mapping
information does not indicate that a particular species does not or could not utilize the
shoreline or adjacent lands. Furthermore, the number of documented species may
reflect the relative amount of past survey efforts rather than the presence or absence of
suitable habitat.
The Watershed Company/BERK/WWBWC September 2014
49
Frequently Flooded Areas
For all practical purposes, “frequently flooded areas” are those areas within the 100-year
floodplain. Floodplain and floodway maps were developed using FEMA’s Q3 map for
Walla Walla County.
Channel Migration Zone
Channel Migration Zone (CMZ) data was not previously available for shorelines within
Walla Walla County. For the purpose of this analysis report, the 100 year floodplain is
being used as a proxy for the CMZ extent with the following conditions per WAC 173-
26-221(3)(b):
Where available data indicates areas separated from the active river channel by
legally existing, publically owned and maintained, artificial channel constraints
that limit channel movement, those areas are excluded from the channel
migration zone.
All areas separated from the active channel by a legally existing artificial
structure(s) that are likely to restrain channel migration, including major
transportation facilities, built above or constructed to remain intact through the
one hundred-year flood, will not be considered to be in the channel migration
zone.
In general, we expect that this approach may slightly over-estimate the CMZ in flatter
lowland areas.
The CMZ map represents a graphical overlay of the different elements and does not
include field surveys or onsite data collection. Approvals for projects and permits
relying on these boundaries should include detailed assessments with stream surveys,
particularly in active channel areas.
Geologically Hazardous Areas
Maps of geologically hazardous areas were developed by Washington Department of
Natural Resources. The data primarily focus on seismic hazards, and landslide hazard
data seems limited. Data on the distribution and location of steep slopes within the
proposed shoreline jurisdiction were not available, and this represents a data gap. Steep
slopes should be evaluated for landslide hazard potential on a site- and project-specific
basis.

Walla Walla County Shoreline Analysis Report
50
Water Quality
As a requirement of Section 303(d) of the federal Clean Water Act all waterbodies should
be “fishable and swimmable,” Ecology classifies waterbodies into five categories:
Category 1: Meets tested standards,
Category 2: Waters of concern,
Category 3: No data,
Category 4: polluted waters that either have or do not require a TMDL, and
Category 5: polluted waters requiring a TMDL.
Individual waterbodies are assigned to particular “beneficial uses” (public water supply;
protection for fish, shellfish, and wildlife; recreational, agricultural, industrial,
navigational and aesthetic purposes). Waterbodies must meet certain numeric and
narrative water quality criteria established to protect each of those established beneficial
uses. Waterbodies may provide more than one beneficial use, and may have different
levels of compliance with different criteria for those beneficial uses in different segments
of the stream or lake. As a result, many waterbodies may be on the 303(d) list for more
than one parameter in multiple locations.
As presented in the Water Quality map of Appendix B, only Category 4 and 5 waters are
depicted. For more information on specific waterbodies and their water quality
classifications, Ecology provides an interactive on-line viewer at the following website:
http://apps.ecy.wa.gov/wqawa2008/viewer.htm.
Shoreline Modifications
Shoreline modifications are human-caused alterations to the natural water’s edge. The
most common types of shoreline modifications include overwater structures and
shoreline armoring.
The Washington Department of Natural Resources has digitized piers and other in-
water structures such as boatlifts, boathouses, and moorage covers. However, this
dataset does not differentiate between each of these various types of overwater
structures. Thus, reporting of overwater cover is usually an overstatement when
assessing just piers, docks, and floats. Although not technically overwater structures,
boat ramps are also reported in the inventory.

The Watershed Company/BERK/WWBWC September 2014
51
Levees were mapped based on data from the Department of Ecology. County-wide data
were not available for shoreline stabilization, including rip rap armoring and dikes. A
visual assessment of shoreline stabilization using aerial photography was incorporated
into the analysis of ecological functions. This visual assessment is likely to
underestimate the extent of armoring and diked areas.
4.2.2 Land Use Characterization
This shoreline inventory reviews current and planned land use within shoreline
jurisdiction to provide a basis to establish a compatible use pattern over the 20-year
planning period of the SMP and to identify current or planned preferred uses in
shoreline jurisdiction that should be protected or promoted to meet SMA goals for
water-oriented uses, shoreline access, and ecological protection.
The SMA promotes the following use preferences (RCW 90.58.020) for shorelines of
statewide significance (identified in Section 1.2) in the stated order:
1. Recognize and protect the statewide interest over local interest;
2. Preserve the natural character of the shoreline;
3. Result in long term over short term benefit;
4. Protect the resources and ecology of the shoreline;
5. Increase public access to publicly owned areas of the shorelines;
6. Increase recreational opportunities for the public in the shoreline;
7. Provide for any other element as defined in RCW 90.58.100 deemed appropriate or
necessary.
In addition, the following use preferences apply within shoreline jurisdiction in the
following order [from WAC 173-26-201(2)(d)]:
1. Reserve appropriate areas for protecting and restoring ecological functions to control
pollution and prevent damage to the natural environment and public health. In
reserving areas, local governments should consider areas that are ecologically intact
from the uplands through the aquatic zone of the area, aquatic areas that adjoin
permanently protected uplands, and tidelands in public ownership. Local
governments should ensure that these areas are reserved consistent with
constitutional limits.
Walla Walla County Shoreline Analysis Report
52
2. Reserve shoreline areas for water-dependent and associated water-related uses.
Harbor areas, established pursuant to Article XV of the state Constitution, and other
areas that have reasonable commercial navigational accessibility and necessary
support facilities, such as transportation and utilities, should be reserved for water-
dependent and water-related uses that are associated with commercial navigation
unless the local governments can demonstrate that adequate shoreline is reserved for
future water-dependent and water-related uses and unless protection of the existing
natural resource values of such areas preclude such uses. Local governments may
prepare master program provisions to allow mixed-use developments that include
and support water-dependent uses and address specific conditions that affect water-
dependent uses.
3. Reserve shoreline areas for other water-related and water-enjoyment uses that are
compatible with ecological protection and restoration objectives.
4. Locate single-family residential uses where they are appropriate and can be
developed without significant impact to ecological functions or displacement of
water-dependent uses.
5. Limit nonwater-oriented uses to those locations where the above described uses are
inappropriate or where nonwater-oriented uses demonstrably contribute to the
objectives of the Shoreline Management Act.
Current Land Use
Existing land use provides a baseline for types of land use and land cover found within
shoreline jurisdiction. Existing land use data were obtained from the Walla Walla
County Assessor, Department of Revenue and Cities and then overlaid on the Shoreline
Inventory Folio maps for current land use, land ownership patterns, and aerial images.
Mapped assessor use types were sorted into land use categories established in WAC
458-53-030. Land use data from the County Assessor’s office may not be updated as
frequently as other property information; however, it represents the best readily
available information on current land use at a countywide level. The predominant
shoreline land use pattern across all shoreline jurisdiction analyzed is Resource
Production and Extraction.
Water Oriented Use
According to Ecology’s SMP Guidelines (WAC173-26-020), “water-oriented use means a
use that is water-dependent, water-related, or water-enjoyment, or a combination of
such uses.” The Shoreline Management Act promotes uses that are “unique to or

The Watershed Company/BERK/WWBWC September 2014
53
dependent upon use of the state's shoreline,” as well as “ports, shoreline recreational
uses including but not limited to parks, marinas, piers, and other improvements
facilitating public access to shorelines of the state, industrial and commercial
developments which are particularly dependent on their location on or use of the
shorelines of the state and other development that will provide an opportunity for
substantial numbers of the people to enjoy the shorelines of the state.” (RCW 90.58.020)
Definitions and examples of water-oriented uses are included in Table 4-2 below.
Table 4-2. Water-Oriented Uses Definitions and Examples.
Water-Oriented Use Definitions Examples
"Water-dependent use" means a use or portion of a use which cannot exist in a location that is not adjacent to the water and which is dependent on the water by reason of the intrinsic nature of its operations. (WAC 173-26-020(39))
Examples of water-dependent uses may include ship cargo terminal loading areas, ferry and passenger terminals, barge loading facilities, ship building and dry docking, marinas, aquaculture, irrigation diversions, float plane facilities and sewer outfalls.
"Water-related use" means a use or portion of a use which is not intrinsically dependent on a waterfront location but whose economic viability is dependent upon a waterfront location because: (a) The use has a functional requirement for a
waterfront location such as the arrival or shipment of materials by water or the need for large quantities of water; or
(b) The use provides a necessary service supportive of the water-dependent uses and the proximity of the use to its customers makes its services less expensive and/or more convenient. (WAC 173-26-020(43))
Examples of water-related uses may include warehousing of goods transported by water, fish processing plants, hydroelectric generating plants, gravel storage when transported by barge, oil refineries where transport is by tanker, log storage, and potentially agriculture and agriculturally related water transportation systems.
"Water-enjoyment use" means a recreational use or other use that facilitates public access to the shoreline as a primary characteristic of the use; or a use that provides for recreational use or aesthetic enjoyment of the shoreline for a substantial number of people as a general characteristic of the use and which through location, design, and operation ensures the public's ability to enjoy the physical and aesthetic qualities of the shoreline. In order to qualify as a water-enjoyment use, the use must be open to the general public and the shoreline-oriented space within the project must be devoted to the specific aspects of the use that fosters shoreline enjoyment. (WAC 173-26-020(40))
Primary water-enjoyment uses may include, but are not limited to, parks, piers and other improvements facilitating public access to the shorelines of the state; and general water-enjoyment uses may include, but are not limited to, restaurants (where views or other features allowing significant public access are provided), museums, aquariums, scientific/ecological reserves, and resorts/hotels (as part of mixed-use development or with significant public access or restoration components), and commercial/office as part of a mixed-use development.

Walla Walla County Shoreline Analysis Report
54
Based on a review of County Assessor records and the current land use pattern, the
current use categories that were considered most likely to meet the definition of water-
oriented uses were selected as follows:
Transportation, Communication and Utilities (water-dependent when a port or
marina)
Cultural, Entertainment, and Recreational (when a water-enjoyment use)
Manufacturing (water-related when a use is dependent upon shipping)
In the rural portions of the County, much of the potential water-oriented uses are parks;
open space; and cultural, entertainment, and recreational activities. More urban
examples of water-oriented uses, including eating/drinking places and hotel/lodging
uses, are found in the Cities and UGA portions of the County.
More discussion of water-oriented uses is found in Chapter 6, broken down by reaches.
Transportation and Utility Infrastructure
There are several County, City, state and federal highway road sections and railroad
corridors in Walla Walla County that either parallel, cross or are otherwise located in
existing or future shoreline jurisdiction. Road densities are highest in the eastern
portion of the county near population centers. Active railroads include the Union
Pacific Railroad which intersects much of the Snake and Columbia River shoreline
jurisdiction, the BNSF Railway and the Palouse River and Coulee City Railroad. Utility
infrastructure such as water, wastewater, electrical, communication, and other facilities
are found throughout the County with a higher prevalence in populated areas of the
County as well. More information about transportation and utility infrastructure by
waterbody is found in Chapter 6.
Existing and Potential Public Access
Shoreline waterbodies in Walla Walla County are accessed at federal, state, City and
County parks and trails, though there are gaps in the network, which are the subject of
parks and recreation plans. Information about shoreline public access facilities and
potential opportunities was obtained from the Port of Walla Walla County, County and
City maps and plans, Washington State Parks, Washington Recreation and Conservation
Office, U.S. Army Corps of Engineers, Department of Natural Resources and Umatilla
National Forest.

The Watershed Company/BERK/WWBWC September 2014
55
Historical or Archaeological Sites
Historical and Archeological data were obtained from the WA Department of
Archaeology and Historic Preservation. Data represents only known historical
properties or places. Other significant sites may exist. Due to the wealth of cultural
resources potentially present in areas long inhabited by human populations, the State of
Washington Department of Archaeology and Historic Preservation often requires
cultural resources assessments when development or activities are proposed that may
affect archaeological or historic resources.
Archeological and culturally significant sites are not mapped in the shoreline inventory
map folio but they are discussed where relevant in Chapter 6.
Future Land Use
Future land use analysis was based on County and City comprehensive plans, as
available, provided by the Walla Walla Joint Community Development Agency, as well
as County and City zoning. Future land use is discussed in detail, by waterbody in
Chapter 6.
4.3 Summary of Shoreline Inventory Results
In order to assess shoreline conditions and ecological functions at a local scale, each
shoreline waterbody’s jurisdictional area was broken into discrete reaches. Appendix C
expands upon the relevant required inventory elements discussed above, providing
specific detail and data for each reach (see Section 5.1.1 below for description of reach
delineation). Unless otherwise noted, the results reported in Appendix C consider only
information available within the boundaries of shoreline jurisdiction of each reach.

Walla Walla County Shoreline Analysis Report
56
5 ANALYSIS OF ECOLOGICAL FUNCTIONS
5.1 Approach, Rationale and Limitations of Functional Analysis
A GIS-based semi-quantitative method was developed to characterize the relative
performance of relevant ecological processes and functions by shoreline reach, within
the County and each City jurisdiction, as outlined in WAC 173-26-201(3)(d)(i). The
assessment used the available information gathered as part of the shoreline inventory
and applied standardized ranking criteria to provide a consistent methodological
treatment among reaches (Table 5-4). Because watershed processes and the underlying
geomorphic context are distinct between rivers, in some cases separate scoring criteria
were developed for each river. Some criteria were not applicable for analyzing
Bennington Lake functions and were therefore excluded from analysis of the lake
reaches. These semi-quantitative results will ensure consistent and well-documented
treatment of all reaches when assessing existing ecological conditions, yet allow for a
qualitative evaluation of functions for data that are not easily summarized by GIS data
alone. The results are intended to complement the inventory information in Appendix C
and provide a comparison of watershed functions relative to other reaches in the County
or City jurisdictions. Analysis scores and descriptions are accompanied by photographs
taken during site visits or bird’s eye view aerial images from Google Earth (Google
2014).
5.1.1 Reach Delineation
In order to assess shoreline functions at a local scale, each shoreline waterbody’s
jurisdictional area was broken into discrete reaches based on a review of maps and aerial
photography. Land use (e.g., land use patterns, zoning, vegetation coverage, and
shoreline modifications) was weighted heavily in determining reach break locations
because the intensity and type of land use has affected and will continue to affect
shoreline ecological conditions. Furthermore, functional analysis outcomes will be more
relevant for future determination of appropriate shoreline environment designations if
the reach breaks occur at potential transition points in environment designations (note:
every attempt has been made to create reach breaks along parcel boundaries).
Regardless, reaches have been created for informational purposes only and are not
intended to represent regulatory boundaries. While reach scale analysis of ecological
functions is one aspect of evaluating appropriate environment designations, several
other inventory elements also play a significant role.

The Watershed Company/BERK/WWBWC September 2014
57
In addition to land use, physical drivers of shoreline processes were used to establish an
overall framework for determining reach break locations. As noted throughout this
report, ecological function scores at the reach level are intended to be indicators of
function and not an absolute metric.
The following criteria in the following general order were used for determining reach
break locations:
City and urban growth area boundaries;
Changes in land use;
Changes in vegetation (coverage and type);
Shoreline modifications (levees and dams);
FEMA floodway/floodplain areas; and
Significant wetland areas
In all of the above criteria (except the city/UGA boundaries), reach breaks were made
where fairly significant changes were evident. For example, the presence of a couple of
single-family residences along a stretch of undeveloped shoreline would not necessitate
creation of a reach break to separate those two different uses.
The following is a complete list of the 50 reaches initially created for this effort. Each
reach has been given a unique identifier to signify the waterbody name, reach number
along that waterbody, and a general locator name for reference. The map of shoreline
reaches includes color-coded waterbodies and the reach number (Map 25, Appendix B).
Table 5-1. Shoreline Reaches Used in Functional Analysis
Shoreline Reaches
Bennington Lake-1
Columbia River- 1, Highway 730
Columbia River- 2, Walla Walla Confluence
Columbia River- 3, Primary Agriculture
Columbia River- 4, Attalia UGA- Industrial
Columbia River- 5, J Line, Casey and Curlew Ponds
Columbia River- 6, Burbank RAC-Lake Wallula
Columbia River- 7, Burbank Slough
Columbia River- 8, Burbank Slough RAC
Mill Creek- 1, Garrett
Mill Creek- 2, Levee
Mill Creek- 3, Walla Walla UGA West
Mill Creek- 4, Walla Walla Water Treatment Plant (Public Reserve)
Mill Creek- 5, Walla Walla Commercial/Industrial

Walla Walla County Shoreline Analysis Report
58
Shoreline Reaches
Mill Creek- 6, Walla Walla Mixed Use
Mill Creek- 7, Walla Walla Downtown-Underground Section
Mill Creek- 8, Walla Walla Downtown Flume
Mill Creek- 9, Walla Walla Residential
Mill Creek- 10, Walla Walla Public Reserve/Residential
Mill Creek- 11, Walla Walla UGA East
Mill Creek- 12, Diversion Dam
Mill Creek- 13, Rural Residential
Mill Creek- 14, Kooskooskie
Mill Creek- 15, SE County
Snake River- 1, Burbank RAC-Port of Walla Walla
Snake River- 2, Burbank RAC Residential/Public Reserve
Snake River- 3, Public Reserve- Lower Snake Islands
Snake River- 4, Public Reserve
Snake River- 5, Public Ownership
Snake River- 6, Lower Monumental
Snake River- 7, Northern County Primary Agriculture
Touchet River- 1, Touchet Rural Residential
Touchet River- 2, Primary Agriculture
Touchet River- 3, Primary Agriculture Hwy 124
Touchet River- 4, Prescott
Touchet River- 5, Waitsburg Treatment Plant
Touchet River- 6, Waitsburg Agriculture
Touchet River- 7, Waitsburg mixed residential
Touchet River- 8, East Waitsburg Rural
Touchet River- 9, East County
Walla Walla River- 1, Smith's Harbor
Walla Walla River- 2, Primary Agriculture
Walla Walla River- 3, Touchet Confluence-Ag/Residential
Walla Walla River- 4, Lowden
Walla Walla River- 5, Ag Residential
Walla Walla River- 6, Ag/Residential Riparian
Walla Walla River- 7, Rural Residential
Yellowhawk Creek- 1
5.1.2 Functions and Impairments
The analysis of reach functions was based on the four major function categories
identified in the Department of Ecology’s guidelines: hydrologic, hyporheic, shoreline
vegetation, and habitat. The four primary functional categories were further broken
down into relevant functions which were used to evaluate reach performance:

The Watershed Company/BERK/WWBWC September 2014
59
Table 5-2. Ecological processes and functions used to evaluate reaches
Ecological Process and Functions
1. Hydrologic Functions
Moderating erosion processes and the transport of water and sediment
Development and maintenance of instream habitat features (e.g., riffles, pools, and off-
channel habitat)
Attenuating flow energy
2. Vegetative Functions
Provision of large woody debris (LWD) and organic matter
Filtering of upland inputs, including excess nutrients, fine sediment, and toxic substances
Slowing riverbank erosion; bank stabilization
3. Habitat Functions
Wetland and riparian habitat
Physical space (upland and aquatic, including migration corridors) and conditions for life
history
4. Hyporheic Functions
Water and sediment storage, cool water refugia, and maintenance of base flows
Support of vegetation
The available information gathered County-wide in the Shoreline Inventory Map Folio
(Appendix B) was used to determine the performance of these functions (High,
Moderate, or Low). Metrics were developed based on best professional judgment
related to known impacts of different parameters and the data available (Table 5-4).
Rankings were developed for each function based on the distribution of conditions
within the County or City for each river, so that each ranking provides a relative
measure of functions compared to other reaches in the water body and local jurisdiction.
Table 5-3 provides a description of the significance of each function, and how each
function may be affected by human alterations. It should be noted that alterations to
watershed-wide processes (e.g., flow regulation) affect functions throughout all reaches
of each river. Since the purpose of this analysis is to differentiate between levels of
function and anthropogenic alterations, the effects of these watershed-wide impairments
are addressed in Table 5-3, and not incorporated into the scoring of each reach.
Table 5-4 describes the metrics and scoring methodology for each function. Scoring of
some functions is different between rivers, so that the range of scores for each river
represents the range of relative functions of each reach compared to other reaches in the
same river. For example, floodway area is present along portions of the Walla Walla
River, Touchet River and Mill Creek, but is not present on the other waterbodies;

Walla Walla County Shoreline Analysis Report
60
therefore, the scoring criteria for flow attenuation incorporates floodway data for the
Walla Walla, Touchet and Mill Creek and uses floodplain data for the others.
Also, not all of the same functions are applicable to Bennington Lake that are applicable
to the stream reaches. For example, development of in-stream features like riffles and
pools does not occur in a lake environment. Likewise, hyporheic functions are generally
dependent on directional flow, and therefore are less meaningful in lake environments.
Consequently, metrics for evaluating Bennington Lake have been adapted to be more
applicable to a lake shoreline and some criteria in Table 5-4 were not considered.
Scoring of functions was done separately for the reaches within each local jurisdiction
and within each waterbody in order for the range of scores for reaches to represent the
range of relative functions of each reach compared to other reaches in both the same
river and within the same local jurisdiction. For example, the levees within the City of
Walla Walla lower many of the functions of Mill Creek through the city. These reaches
were scored and ranked relative to one another in order to represent a more accurate
range of functions within the City’s shorelines, and differentiate between varying levels
of function despite the overall functional impairment due to the levees. In addition to
the functional scoring, City reaches are also more qualitatively described under each
relevant water body section below.
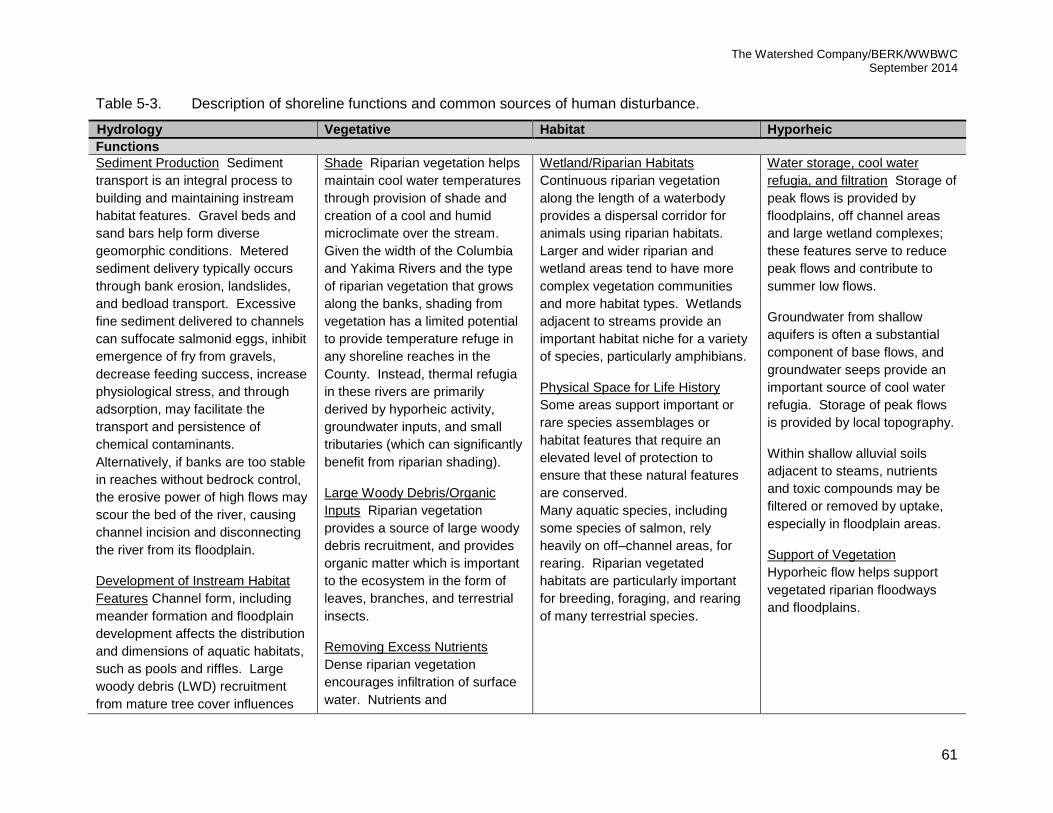
The Watershed Company/BERK/WWBWC September 2014
61
Table 5-3. Description of shoreline functions and common sources of human disturbance.
Hydrology Vegetative Habitat Hyporheic
Functions
Sediment Production Sediment
transport is an integral process to
building and maintaining instream
habitat features. Gravel beds and
sand bars help form diverse
geomorphic conditions. Metered
sediment delivery typically occurs
through bank erosion, landslides,
and bedload transport. Excessive
fine sediment delivered to channels
can suffocate salmonid eggs, inhibit
emergence of fry from gravels,
decrease feeding success, increase
physiological stress, and through
adsorption, may facilitate the
transport and persistence of
chemical contaminants.
Alternatively, if banks are too stable
in reaches without bedrock control,
the erosive power of high flows may
scour the bed of the river, causing
channel incision and disconnecting
the river from its floodplain.
Development of Instream Habitat
Features Channel form, including
meander formation and floodplain
development affects the distribution
and dimensions of aquatic habitats,
such as pools and riffles. Large
woody debris (LWD) recruitment
from mature tree cover influences
Shade Riparian vegetation helps
maintain cool water temperatures
through provision of shade and
creation of a cool and humid
microclimate over the stream.
Given the width of the Columbia
and Yakima Rivers and the type
of riparian vegetation that grows
along the banks, shading from
vegetation has a limited potential
to provide temperature refuge in
any shoreline reaches in the
County. Instead, thermal refugia
in these rivers are primarily
derived by hyporheic activity,
groundwater inputs, and small
tributaries (which can significantly
benefit from riparian shading).
Large Woody Debris/Organic
Inputs Riparian vegetation
provides a source of large woody
debris recruitment, and provides
organic matter which is important
to the ecosystem in the form of
leaves, branches, and terrestrial
insects.
Removing Excess Nutrients
Dense riparian vegetation
encourages infiltration of surface
water. Nutrients and
Wetland/Riparian Habitats
Continuous riparian vegetation
along the length of a waterbody
provides a dispersal corridor for
animals using riparian habitats.
Larger and wider riparian and
wetland areas tend to have more
complex vegetation communities
and more habitat types. Wetlands
adjacent to streams provide an
important habitat niche for a variety
of species, particularly amphibians.
Physical Space for Life History
Some areas support important or
rare species assemblages or
habitat features that require an
elevated level of protection to
ensure that these natural features
are conserved.
Many aquatic species, including
some species of salmon, rely
heavily on off–channel areas, for
rearing. Riparian vegetated
habitats are particularly important
for breeding, foraging, and rearing
of many terrestrial species.
Water storage, cool water
refugia, and filtration Storage of
peak flows is provided by
floodplains, off channel areas
and large wetland complexes;
these features serve to reduce
peak flows and contribute to
summer low flows.
Groundwater from shallow
aquifers is often a substantial
component of base flows, and
groundwater seeps provide an
important source of cool water
refugia. Storage of peak flows
is provided by local topography.
Within shallow alluvial soils
adjacent to steams, nutrients
and toxic compounds may be
filtered or removed by uptake,
especially in floodplain areas.
Support of Vegetation
Hyporheic flow helps support
vegetated riparian floodways
and floodplains.

Walla Walla County Shoreline Analysis Report
62
Hydrology Vegetative Habitat Hyporheic
stream channel morphology and
habitat complexity. Accumulations
of LWD affect bank stability, scour,
bar formation, and may also induce
rapid channel adjustments and
assists in pool formation. Mid-
channel islands and off-channel
habitats provide important high-flow
refugia for fish and wildlife.
Wave and Flow Attenuation
Floodway areas and riverine
wetlands provide a transition
between upland and riverine
habitats. Vegetated floodways help
slow and disperse flood flows. The
extent to which local conditions
affect flow is related to the position
of a reach within a watershed and
the size of the floodplain or wetland
area relative to watershed size.
contaminants in subsurface water
are filtered out of the soil and
taken up by the roots of plants.
Shoreline Stabilization The root
structure of woody vegetation
stabilizes shoreline soils and
prevents excessive erosion.
Watershed-wide Alterations
Dam regulation on the Columbia,
Snake and Mill Creek affects the
timing, duration, and frequency of
flood events, as well as sediment
transport. The dams on the Lower
Snake and Columbia Rivers
impound water, creating shallow
reservoirs that typically fill the width
of the steep-sided canyons.
Dredging of the Columbia River has
On the Columbia, Snake and Mill
Creek, dam regulation,
channelization, and armoring limit
floodplain connectivity, which
helps support the establishment
of riparian vegetation. Over time,
as flood events are reduced in
magnitude and frequency, the
area of riparian vegetation is
reduced.
Hydrologic alteration from dams
interrupts natural habitat forming
processes, which create diversity in
channel form and suitable instream
habitat function.
Periodic dredging of depositional
areas in the Columbia River limits
the development of instream habitat
features.
Dam regulation limits the
frequency and intensity of
flooding events, which limits the
recharge capacity of the aquifer.
Irrigation-induced groundwater
flows and agricultural return
flows now discharge to the river
to provide cool water refugia.

The Watershed Company/BERK/WWBWC September 2014
63
Hydrology Vegetative Habitat Hyporheic
also greatly simplified the channel
form and limited geomorphic
diversity.
Irrigated agriculture occurs
throughout the County and can
effect natural hydrologic processes.
Irrigation water is drawn from
groundwater and late spring and
summer surface flow. Irrigation
returns have substantially replaced
natural groundwater recharge.
LWD recruitment from within
Walla Walla County was likely
always limited given the climate
and type of riparian and upland
vegetation naturally occurring in
the County. Instead, LWD was
transported from upstream
reaches.
Noxious weeds along the Touchet
and Walla Walla Rivers threaten
the native plant communities
which can affect bank stability, as
well as floodplain connectivity.
Localized Alterations
Armored shorelines prevent natural
erosion and sediment delivery
processes. Shoreline armoring can
limit floodway interactions,
accelerate streamflow along the
bank, and contributing to erosion of
adjacent properties.
Loss of mature, native vegetation
and wetlands affects the timing,
rate, magnitude, and duration of
stream flows. An increase in
impervious surfaces results in
increased frequency and intensity of
flooding. Changes in flow volume
or frequency can alter channel
morphology and the sediment
balance of the stream.
Clearing and grading for
development often results in the
removal of significant vegetation.
Impervious surfaces related to
roadways, driveways and parking
areas tend to produce
hydrocarbon pollutants and heavy
metals. Depending on
management activities, even
pervious surfaces such as lawns
and pastures can substantially
increase nutrients from fertilizers
and pollutants and toxins through
herbicides and pesticides.
Armored shorelines can isolate the river from potential sources of organic matter and eliminate filtration potential.
Historic draining, ditching, and fill of
wetlands for agriculture and
development have reduced the
availability of suitable habitat for
aquatic and terrestrial species.
In water structures interrupt the longitudinal flow of sediment and alter habitat associations.
Impervious surfaces reduce
infiltration, increasing surface
flows. The net result is a
reduction in shallow
groundwater and hyporheic
flows capable of maintaining
summer low flows in streams
and rivers.
Levees that limit channel migration and floodplain area also restrict hyporheic activity.

Walla Walla County Shoreline Analysis Report
64
Hydrology Vegetative Habitat Hyporheic
In addition to watershed scale
effects, irrigation withdrawals can
have localized effects on stream
flow. The effect of withdrawals on
stream flow may depend on the
withdrawal rate, as well as the local
groundwater interchange (i.e. if the
reach is a gaining or losing reach).

The Watershed Company/BERK/WWBWC September 2014
65
Table 5-4. Functional score ranking for SMA waterbodies1 by indicator metric.
Process/Function High Moderate Low
Hyd
rolo
gic
Moderation of sediment transport
No armoring or dams present within the reach
Steep slopes present, but not developed
AND
Limited armoring present
Steep slopes present with development
OR
Majority of the reach is armored
Development/ maintenance of in-stream
habitat features
Backwater areas, islands, and wetlands occupy >30% of the reach
Backwater areas, islands, and wetlands occasionally present
OR
Off-channel habitats are isolated from the mainstem channel by armoring or causeways
No backwater areas, islands, or wetlands
OR
Off-channel habitats are significantly altered (i.e. dredged or armored)
Attenuation of flow energy
Majority of the reach is not armored or protected by levees
AND
Large wetlands or backwaters are present
AND
Floodway2 >50% of area
Wetlands or backwater areas are occasionally present
AND
Majority of the reach is not armored or protected by levees
AND
Floodplain2 >20% OR
Floodway 20-50%
Levees present or majority of the reach is armored
OR
No wetlands or backwater areas present
OR
Floodplain area <20% of total area or lacks vegetation
OR
Floodway <20% of total area or lacks vegetation
Veg
eta
tive
LWD and organic matter
recruitment
Forest, shrub, or wetland vegetation >75% of area within immediate proximity of shoreline
AND
No armoring or structures separate vegetation from the water’s edge.
Forest, shrub, or wetland vegetation 50-75% of area within immediate proximity of shoreline
OR
A portion of the vegetation isolated from the water’s edge by armoring or other structures
Forest, shrub, or wetland vegetation <50% of area within immediate proximity of shoreline
OR
Vegetation is separated from the shoreline by armoring and other structures
Filtration of upland inputs
A broad band of dense vegetation separates uplands from the river
A narrow band of dense vegetation or a broad band of sparse vegetation separates uplands from the river
No vegetation along the shoreline OR
A narrow band of sparse vegetation separates uplands from the river
Bank stabilization
Riparian trees and shrubs stabilize the banks in the majority of the reach
Riparian trees and shrubs are sparsely present along the shoreline
OR
A portion of the shoreline is armored
The majority of the reach is armored
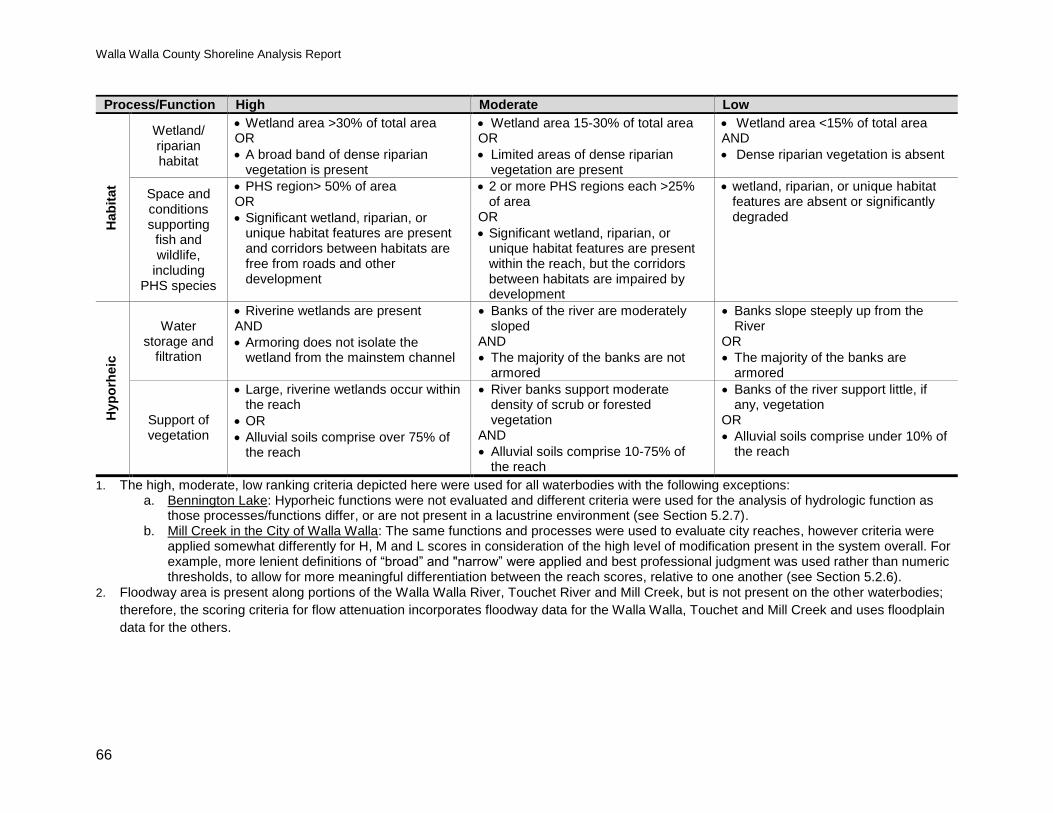
Walla Walla County Shoreline Analysis Report
66
Process/Function High Moderate Low H
ab
itat
Wetland/ riparian habitat
Wetland area >30% of total area OR
A broad band of dense riparian vegetation is present
Wetland area 15-30% of total area OR
Limited areas of dense riparian vegetation are present
Wetland area <15% of total area AND
Dense riparian vegetation is absent
Space and conditions supporting
fish and wildlife,
including PHS species
PHS region> 50% of area OR
Significant wetland, riparian, or unique habitat features are present and corridors between habitats are free from roads and other development
2 or more PHS regions each >25% of area
OR
Significant wetland, riparian, or unique habitat features are present within the reach, but the corridors between habitats are impaired by development
wetland, riparian, or unique habitat features are absent or significantly degraded
Hyp
orh
eic
Water storage and
filtration
Riverine wetlands are present AND
Armoring does not isolate the wetland from the mainstem channel
Banks of the river are moderately sloped
AND
The majority of the banks are not armored
Banks slope steeply up from the River
OR
The majority of the banks are armored
Support of vegetation
Large, riverine wetlands occur within the reach
OR
Alluvial soils comprise over 75% of the reach
River banks support moderate density of scrub or forested vegetation
AND
Alluvial soils comprise 10-75% of the reach
Banks of the river support little, if any, vegetation
OR
Alluvial soils comprise under 10% of the reach
1. The high, moderate, low ranking criteria depicted here were used for all waterbodies with the following exceptions: a. Bennington Lake: Hyporheic functions were not evaluated and different criteria were used for the analysis of hydrologic function as
those processes/functions differ, or are not present in a lacustrine environment (see Section 5.2.7). b. Mill Creek in the City of Walla Walla: The same functions and processes were used to evaluate city reaches, however criteria were
applied somewhat differently for H, M and L scores in consideration of the high level of modification present in the system overall. For example, more lenient definitions of “broad” and "narrow” were applied and best professional judgment was used rather than numeric thresholds, to allow for more meaningful differentiation between the reach scores, relative to one another (see Section 5.2.6).
2. Floodway area is present along portions of the Walla Walla River, Touchet River and Mill Creek, but is not present on the other waterbodies;
therefore, the scoring criteria for flow attenuation incorporates floodway data for the Walla Walla, Touchet and Mill Creek and uses floodplain
data for the others.
The Watershed Company/BERK/WWBWC September 2014
67
5.1.3 Limitations
This evaluation was limited by the quality and availability of inventory data. Therefore,
limitations presented in Sections 4.2.1 also apply to this evaluation.
In evaluating shoreline functions, the area of shoreline impacts and conditions assessed
was generally limited to the area of shoreline jurisdiction. In many cases, shoreline
impacts may occur at a site due to ecological and geomorphological processes that are
disturbed at a remote site upstream, further inland, or up-current. This evaluation
approach may not identify all of the functional responses occurring as a result of
impacts to nearby or remote areas.
The approach was limited to an evaluation of shoreline ecological potential, and it did
not integrate this potential with the opportunity to perform a given function based on
site-specific conditions. For example, the analysis assessed the ability of a shoreline to
store water, but it did not consider the frequency of flooding downstream and the
corresponding significance of such a function.
5.2 Results of Functional Analysis
The following sections summarize the results of the ecological functional analysis for
each shoreline waterbody. A brief overview of each waterbody is given, followed by a
one page summary of the overall main functions and impacts and a detailed breakdown
of the functional scores by reach.
5.2.1 Snake River
Overview
The Snake River flows along the majority of the northwestern border of Walla Walla
County. It is an important transportation corridor and has significant barge traffic on
the river and train traffic along the shoreline. The majority of the cargo is wood and
coal. A 14-foot navigational channel is authorized to be maintained through dredging
throughout the river.
For the purposes of this report, the shoreline jurisdiction area has been divided into
seven reaches, numbered sequentially upstream. Conditions along the upper reaches (4-
7) are impacted from the Union Pacific Railroad which parallels the shoreline. Two
dams, Ice Harbor and Lower Monumental, are found in Reaches 3 and 6, respectively.
The channel in most areas has steeply sloped banks or is within steep-sided canyons
with limited vegetation. Compared to the upper reaches, reaches along the lower Snake
(1-3) have areas with less armoring, more wetlands, islands and shoreline vegetation;

Walla Walla County Shoreline Analysis Report
68
however, more residential development also occurs near the shoreline in the lower
Snake reaches, particularly in the shoreline areas around Burbank (Reach 2). Some
industrial development is also present at the Port of Walla Walla in Reach 1.
The following page provides a summary of the main functions and impacts in the Snake
River shoreline jurisdiction for each of the four ecological processes categories identified
in Table 5-2.
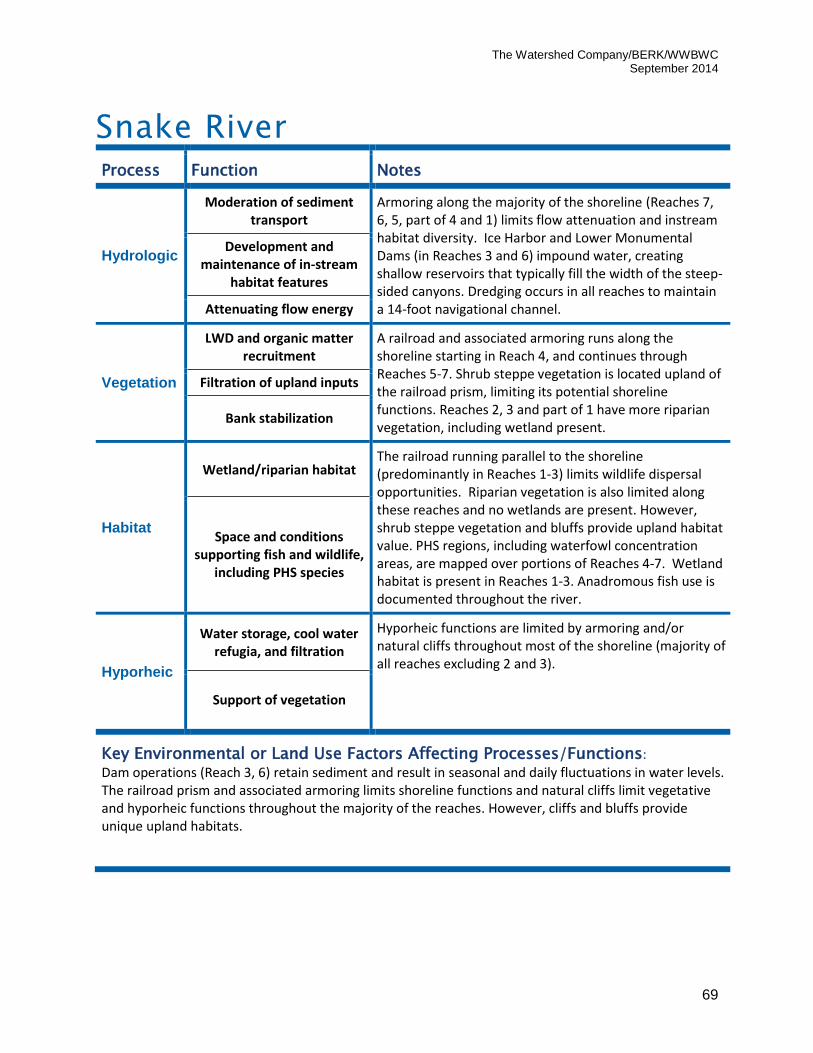
The Watershed Company/BERK/WWBWC September 2014
69
Snake River Process Function Notes
Hydrologic
Moderation of sediment transport
Armoring along the majority of the shoreline (Reaches 7, 6, 5, part of 4 and 1) limits flow attenuation and instream habitat diversity. Ice Harbor and Lower Monumental Dams (in Reaches 3 and 6) impound water, creating shallow reservoirs that typically fill the width of the steep-sided canyons. Dredging occurs in all reaches to maintain a 14-foot navigational channel.
Development and maintenance of in-stream
habitat features
Attenuating flow energy
Vegetation
LWD and organic matter recruitment
A railroad and associated armoring runs along the shoreline starting in Reach 4, and continues through Reaches 5-7. Shrub steppe vegetation is located upland of the railroad prism, limiting its potential shoreline functions. Reaches 2, 3 and part of 1 have more riparian vegetation, including wetland present.
Filtration of upland inputs
Bank stabilization
Habitat
Wetland/riparian habitat The railroad running parallel to the shoreline (predominantly in Reaches 1-3) limits wildlife dispersal opportunities. Riparian vegetation is also limited along these reaches and no wetlands are present. However, shrub steppe vegetation and bluffs provide upland habitat value. PHS regions, including waterfowl concentration areas, are mapped over portions of Reaches 4-7. Wetland habitat is present in Reaches 1-3. Anadromous fish use is documented throughout the river.
Space and conditions supporting fish and wildlife,
including PHS species
Hyporheic
Water storage, cool water refugia, and filtration
Hyporheic functions are limited by armoring and/or natural cliffs throughout most of the shoreline (majority of all reaches excluding 2 and 3).
Support of vegetation
Key Environmental or Land Use Factors Affecting Processes/Functions: Dam operations (Reach 3, 6) retain sediment and result in seasonal and daily fluctuations in water levels. The railroad prism and associated armoring limits shoreline functions and natural cliffs limit vegetative and hyporheic functions throughout the majority of the reaches. However, cliffs and bluffs provide unique upland habitats.

Walla Walla County Shoreline Analysis Report
70
Select Reach Photos Aerial images source: Google Earth 2014
Lower Monumental
Dam (Reach 6)
Burbank RAC (Reach 2)
Port of Walla Walla
(Reach 1)
Riparian vegetation
more common in lower
reaches (Reach 3)
Armoring and cliffs
typical of the upper
reaches (Reach 7 shown)
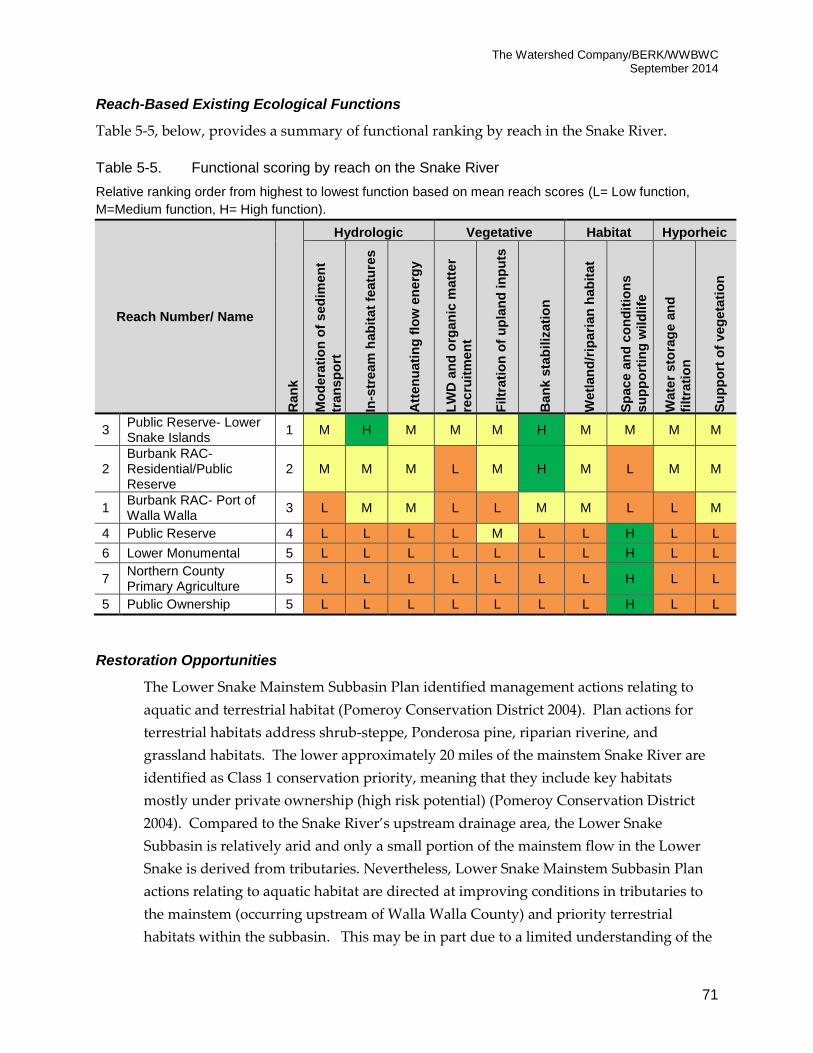
The Watershed Company/BERK/WWBWC September 2014
71
Reach-Based Existing Ecological Functions
Table 5-5, below, provides a summary of functional ranking by reach in the Snake River.
Table 5-5. Functional scoring by reach on the Snake River
Relative ranking order from highest to lowest function based on mean reach scores (L= Low function,
M=Medium function, H= High function).
Reach Number/ Name
Ran
k
Hydrologic Vegetative Habitat Hyporheic
Mo
dera
tio
n o
f s
ed
imen
t
tran
sp
ort
In-s
tream
hab
itat
featu
res
Att
en
uati
ng
flo
w e
nerg
y
LW
D a
nd
org
an
ic m
att
er
rec
ruit
men
t
Filtr
ati
on
of
up
lan
d in
pu
ts
Ban
k s
tab
iliz
ati
on
Wetl
an
d/r
ipa
rian
hab
itat
Sp
ac
e a
nd
co
nd
itio
ns
su
pp
ort
ing
wild
life
Wate
r sto
rag
e a
nd
filt
rati
on
Su
pp
ort
of
veg
eta
tio
n
3 Public Reserve- Lower Snake Islands
1 M H M M M H M M M M
2 Burbank RAC-Residential/Public Reserve
2 M M M L M H M L M M
1 Burbank RAC- Port of Walla Walla
3 L M M L L M M L L M
4 Public Reserve 4 L L L L M L L H L L
6 Lower Monumental 5 L L L L L L L H L L
7 Northern County Primary Agriculture
5 L L L L L L L H L L
5 Public Ownership 5 L L L L L L L H L L
Restoration Opportunities
The Lower Snake Mainstem Subbasin Plan identified management actions relating to
aquatic and terrestrial habitat (Pomeroy Conservation District 2004). Plan actions for
terrestrial habitats address shrub-steppe, Ponderosa pine, riparian riverine, and
grassland habitats. The lower approximately 20 miles of the mainstem Snake River are
identified as Class 1 conservation priority, meaning that they include key habitats
mostly under private ownership (high risk potential) (Pomeroy Conservation District
2004). Compared to the Snake River’s upstream drainage area, the Lower Snake
Subbasin is relatively arid and only a small portion of the mainstem flow in the Lower
Snake is derived from tributaries. Nevertheless, Lower Snake Mainstem Subbasin Plan
actions relating to aquatic habitat are directed at improving conditions in tributaries to
the mainstem (occurring upstream of Walla Walla County) and priority terrestrial
habitats within the subbasin. This may be in part due to a limited understanding of the

Walla Walla County Shoreline Analysis Report
72
significance of habitat conditions in the mainstem. The Snake River Salmon Recovery
Board (2011) identified a need to assess nearshore habitat and cold water refugia in the
mainstem and to explore opportunities for, and potential benefits from, restoration and
protection of these areas.
5.2.2 Columbia River
Overview
The Columbia River completes Walla Walla County’s western border from the
confluence with the Snake River to the Oregon border. For the purposes of this report,
the shoreline jurisdiction area has been divided into eight reaches, numbered
sequentially upstream. The conditions along the Columbia River within shoreline
jurisdiction vary from armored roadbed and railroad (Reaches 1, 3 and 4) to extensive
wetland habitat (Reaches 2 and 5-8) and public reserve (Reaches 5-8). Shoreline
jurisdiction reaches are mostly undeveloped other than transportation infrastructure
and include Burbank Slough and extensive off-channel ponds and wetlands, as well as a
portion of the McNary National Wildlife Refuge (see Section 3.4.2) extending from the
confluence of the Snake River to the mouth of the Walla Walla River, and downstream
into Oregon. Some commercial/industrial development is located in Attalia (Reach 4),
and the Wallula Gap Industrial Park-Shipping Terminal in Reach 1.
Reach 6, just south of the confluence of the Columbia and Snake Rivers, near Burbank,
includes extensive area mapped as wetland by NWI. The northern portion of this reach
includes land owned by the Port of Walla Walla, which is planned for development as
part of the Burbank Industrial Park. As part of the planning process for the industrial
park, the Port had a wetland delineation of this area conducted in 2010 (Anderson Perry
& Associates 2010). The results of this study, which are included in the wetland maps in
Appendix B, depict a slightly smaller wetland area than is shown in the NWI. Site-scale
investigation is always needed to conclusively include or exclude potential wetland
areas and it should be noted that actual wetland conditions that may or may not be
found on a site will determine shoreline jurisdiction (as a potential shoreline-associated
wetland) on a site-specific basis.
The following page provides a summary of the main functions and impacts in the
Columbia River shoreline jurisdiction for each of the four ecological processes categories
identified in Table 5-2.

The Watershed Company/BERK/WWBWC September 2014
73
Columbia River Process Function Notes
Hydrologic
Moderation of sediment transport
At least some armoring is present in all of the reaches (particularly in Reaches 1, 3 and 4) that limits flow attenuation and instream habitat diversity. Dam regulation and dredging throughout the Columbia impact natural hydrologic processes. However, extensive backwater areas and islands (Reaches 5, 6, 7, and 8) allow for sediment deposition and off-channel habitat.
Development and maintenance of in-stream
habitat features
Attenuating flow energy
Vegetation
LWD and organic matter recruitment
In Reaches 1, 3 and 4, vegetation is mostly located upland of the railroad prism, limiting its potential shoreline functions. Extensive wetland and riparian vegetation is present in Reaches 5-8. However, Highway 12 and a railroad slightly lower vegetative scores in Reach 5.
Filtration of upland inputs
Bank stabilization
Habitat
Wetland/riparian habitat The railroad limits wildlife dispersal opportunities and riparian vegetation is limited along several of the reaches (1, 3, and 4). However, shrub steppe vegetation and bluffs provide upland habitat value and high habitat functions in wetlands and off-channel habitats are present in Reaches 2 and 6 and especially around Burbank Slough (Reaches 7, 8) and the ponds in Reach 5. Anadromous fish use is documented throughout the river.
Space and conditions supporting fish and
wildlife, including PHS species
Hyporheic
Water storage, cool water refugia, and filtration
Hyporheic functions are limited by armoring in Reaches 1, 3 and 4, however, large riverine wetlands and high percentages of alluvial soils are present in Reaches 3-7 which maintain water and support shoreline vegetation.
Support of vegetation
Key Environmental or Land Use Factors Affecting Processes/Functions: Function varies greatly between reaches. Generally functions are limited by armoring along most of the river. Numerous overwater structures are also present. However, extensive backwater habitat and wetland areas greatly increase functions around the Burbank Slough area. Bluffs also provide unique upland habitat.

Walla Walla County Shoreline Analysis Report
74
Select Reach Photos Aerial images source: Google Earth 2014
Extensive wetland, islands
and backwater areas in
Reaches 5 and 6
Industrial uses near Attalia (Reach 4)
Armoring and cliffs
typical of Reach 1 along
Highway 730
Typical condition of Reach 3, along
railroad with adjacent agricultural uses
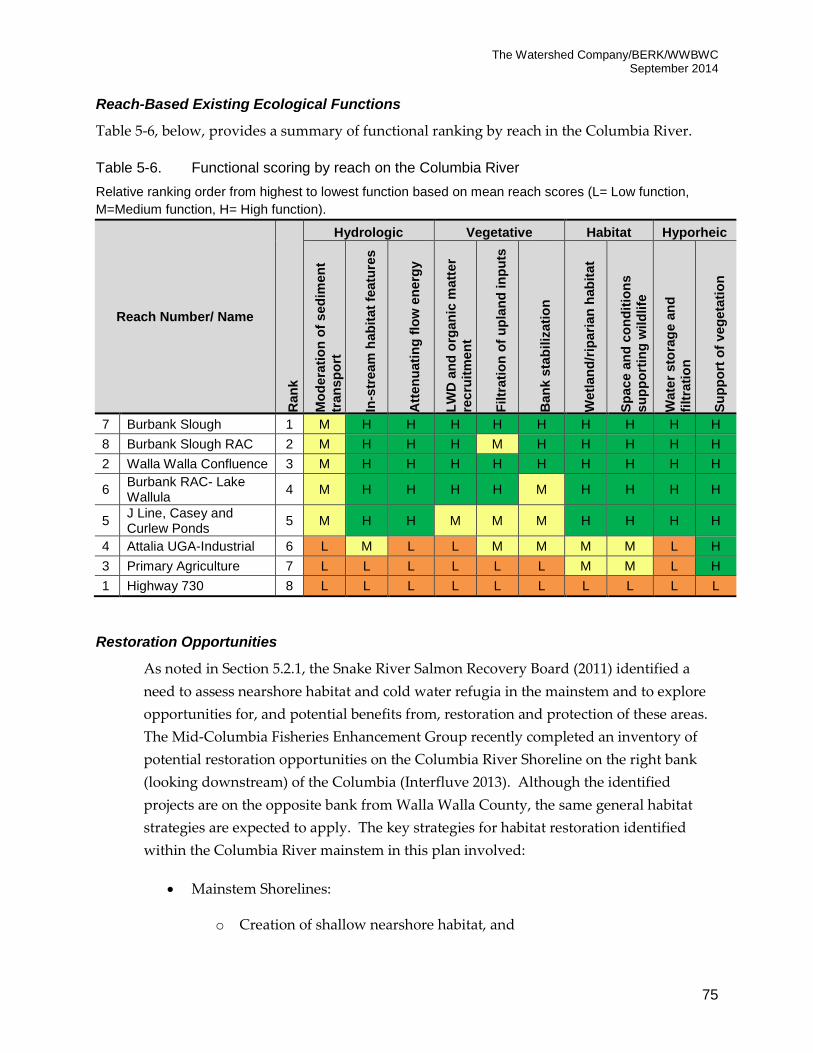
The Watershed Company/BERK/WWBWC September 2014
75
Reach-Based Existing Ecological Functions
Table 5-6, below, provides a summary of functional ranking by reach in the Columbia River.
Table 5-6. Functional scoring by reach on the Columbia River
Relative ranking order from highest to lowest function based on mean reach scores (L= Low function,
M=Medium function, H= High function).
Reach Number/ Name
Ran
k
Hydrologic Vegetative Habitat Hyporheic
Mo
dera
tio
n o
f s
ed
imen
t
tran
sp
ort
In-s
tream
hab
itat
featu
res
Att
en
uati
ng
flo
w e
nerg
y
LW
D a
nd
org
an
ic m
att
er
rec
ruit
men
t
Filtr
ati
on
of
up
lan
d in
pu
ts
Ban
k s
tab
iliz
ati
on
Wetl
an
d/r
ipa
rian
hab
itat
Sp
ac
e a
nd
co
nd
itio
ns
su
pp
ort
ing
wild
life
Wate
r sto
rag
e a
nd
filt
rati
on
Su
pp
ort
of
veg
eta
tio
n
7 Burbank Slough 1 M H H H H H H H H H
8 Burbank Slough RAC 2 M H H H M H H H H H
2 Walla Walla Confluence 3 M H H H H H H H H H
6 Burbank RAC- Lake Wallula
4 M H H H H M H H H H
5 J Line, Casey and Curlew Ponds
5 M H H M M M H H H H
4 Attalia UGA-Industrial 6 L M L L M M M M L H
3 Primary Agriculture 7 L L L L L L M M L H
1 Highway 730 8 L L L L L L L L L L
Restoration Opportunities
As noted in Section 5.2.1, the Snake River Salmon Recovery Board (2011) identified a
need to assess nearshore habitat and cold water refugia in the mainstem and to explore
opportunities for, and potential benefits from, restoration and protection of these areas.
The Mid-Columbia Fisheries Enhancement Group recently completed an inventory of
potential restoration opportunities on the Columbia River Shoreline on the right bank
(looking downstream) of the Columbia (Interfluve 2013). Although the identified
projects are on the opposite bank from Walla Walla County, the same general habitat
strategies are expected to apply. The key strategies for habitat restoration identified
within the Columbia River mainstem in this plan involved:
Mainstem Shorelines:
o Creation of shallow nearshore habitat, and

Walla Walla County Shoreline Analysis Report
76
o Enhancement of shoreline complexity and vegetation.
Backwaters
o Improved fish passage and hydrologic connectivity
o Enhancement of backwater form and function
Tributary Confluences
o Improved tributary fish passage and hydrologic connectivity
o Restoration of tributary delta form and function
Within the Columbia River mainstem, dam operations and management of the McNary
National Wildlife Refuge are two of the key features affecting shoreline functions. These
issues are discussed further below.
Dam operations
Current hydropower programs and operations are engaged in activities to minimize
impacts of flow regulation on the ecological processes of the Columbia River. These
actions are generally the result of obligations under the Endangered Species Act (Section
7 consultations, Section 10 Habitat Conservation Plans (HCPs)) or FERC relicensing.
The following actions are identified by NMFS (2009) as significant actions to
minimize impacts of mainstem dams on the hydrology, habitat, and water
quality of the Columbia River: Modify Columbia and Snake River dams to
maximize juvenile and adult fish survival.
Implement spill and juvenile transportation improvements at Columbia and
Snake River dams.
Operate and maintain facilities at Corps mainstem projects to maintain biological
performance.
Implement piscivorous predation control measures to increase survival of
juvenile salmonids in the lower Snake and Columbia rivers.
Implement avian predation control measures to increase survival of juvenile
salmonids in the lower Snake and Columbia Rivers.
Implement marine mammal control measures to increase survival of adult
salmonids at Bonneville Dam.
Provide information needed to support planning and adaptive management and
demonstrate accountability related to the implementation of FCRPS [Federal
Columbia River Power System] ESA hydropower actions for all ESUs (i.e.,
The Watershed Company/BERK/WWBWC September 2014
77
implement research, monitoring, and evaluation programs for hydropower
actions and predator control actions).
McNary National Wildlife Refuge
Established in 1956, the McNary NWR was created to replace wildlife habitat lost to
construction of the McNary Dam downstream. The area consists of 15,000 acres of
sloughs, ponds, streams and islands.
Seasonal wetlands are managed to promote diverse wetland plant growth. Upland
areas are managed with prescribed burning, removal of exotic weed species, and
planting of native grasses. Native willows and cottonwoods are planted in riparian
areas. Approximately 700 acres of refuge lands are managed in agriculture specifically
to provide waterfowl with winter forage opportunities.
5.2.3 Walla Walla River
Overview
The Walla Walla River flows into Walla Walla County from Oregon just south of College
Place, then flows east until it joins the Columbia north of the Wallula Gap. For the
purposes of this report, the shoreline jurisdiction area has been divided into seven
reaches, numbered sequentially upstream. Shoreline conditions are moderate to high
throughout all the reaches due to largely unaltered banks, floodway and floodplain
connectivity, riparian vegetation and channel complexity. Summer steelhead and Spring
Chinook are documented throughout all reaches, as well as bull trout in Reaches 5 and 6
(WDFW Salmonscape 2014). Stray Fall Chinook salmon and coho salmon may
occasionally be present in the lowest reaches. It should be noted that there are other
ongoing studies of the conditions on the Walla Walla River independent of this analysis
report. Much of the research focuses specifically on fish habitat. The results of such
studies may not align exactly with the functional analysis results presented here as the
criteria and scoring thresholds are likely different, given the different purposes of the
studies.
Highest functions are found in the Smith’s Harbor reach (Reach 1) where extensive
wetland and backwater areas are present. Reaches further upstream have some impact
from residential development and agricultural use. Stream banks and the immediate
shoreline are generally well vegetated. Little armoring is present and the channel has
many meanders with large areas of wetland in all reaches. Large areas of floodplain are
located in Reaches 1 and 2 and floodway is mapped in Reaches 3-7. Burlingame Dam is
located in Reach 6.

Walla Walla County Shoreline Analysis Report
78
The following page provides a summary of the main functions and impacts in the Walla
Walla River shoreline jurisdiction for each of the four ecological processes categories
identified in Table 5-2. Below the summary page, a detailed table of the functional scores
for each reach is provided.

The Watershed Company/BERK/WWBWC September 2014
79
Walla Walla River Process Function Notes
Hydrologic
Moderation of sediment transport
Moderate to high hydrologic function overall- Little armoring is present and the majority of the shoreline area is within the active floodplain and/or floodway. Floodway
is greater than 60% of Reaches 3, 6 and 7. Vegetated riparian areas, including wetlands and backwater areas help
slow and disperse flood flows. The dam lowers the sediment transport score for Reach 6.
Development and maintenance of in-stream
habitat features
Attenuating flow energy
Vegetation
LWD and organic matter recruitment
Moderate vegetation function overall- The shoreline includes several areas of forested and scrub-shrub wetlands. Riparian forested and scrub-shrub vegetation provides filtration and stabilization functions. These are highest in the Smith’s Harbor area (Reach 1) and lower through the rest of the reaches where the band of vegetation is more narrow, or broad but sparse.
Filtration of upland inputs
Bank stabilization
Habitat
Wetland/riparian habitat Moderate to high wildlife function overall- PHS regions are mapped throughout extensive portions of all reaches. Riparian vegetation separates the agriculture fields and associated development from the river in most places. Anadromous fish species (Summer steelhead, Spring Chinook) are documented using the channel.
Space and conditions supporting fish and wildlife,
including PHS species
Hyporheic
Water storage, cool water refugia, and filtration
High hyporheic function due to extensive presence of alluvial soils that store water and support vegetation within the shoreline area. A high percentage of wetland area is also present, particularly in Reaches 1 and 4.
Support of vegetation
Key Environmental or Land Use Factors Affecting Processes/Functions:
Agricultural uses are the primary modification along the Walla Walla River. However, areas of wetland, backwater habitat and a riparian buffer are still present along some portion of most of the reaches.

Walla Walla County Shoreline Analysis Report
80
Select Reach Photos Aerial images source: Google Earth 2014
Area with relatively
high functioning
riparian buffer
(Reach 6)
Channel
condition near
Touchet
Smith’s Harbor area (Reach 1)
Agricultural impacts (Reach 2)
Typical rural
residential condition
(Reach 7)

The Watershed Company/BERK/WWBWC September 2014
81
Reach-Based Existing Ecological Functions
Table 5-7, below, provides a summary of functional ranking by reach in the Walla Walla River.
Table 5-7. Functional scoring by reach on the Walla Walla River
Relative ranking order from highest to lowest function based on mean reach scores (L= Low function,
M=Medium function, H= High function).
Reach Number/ Name
Ran
k
Hydrologic Vegetative Habitat Hyporheic
Mo
dera
tio
n o
f s
ed
imen
t
tran
sp
ort
In-s
tream
hab
itat
featu
res
Att
en
uati
ng
flo
w e
nerg
y
LW
D a
nd
org
an
ic m
att
er
rec
ruit
men
t
Filtr
ati
on
of
up
lan
d in
pu
ts
Ban
k s
tab
iliz
ati
on
Wetl
an
d/r
ipa
rian
hab
itat
Sp
ac
e a
nd
co
nd
itio
ns
su
pp
ort
ing
wild
life
Wate
r sto
rag
e a
nd
filt
rati
on
Su
pp
ort
of
veg
eta
tio
n
1 Smith’s Harbor 1 H H M H H H H H H H
6 Agriculture/Residential Riparian
2 M H H M M H H H H H
3 Touchet Confluence-Agriculture/Residential
3 H M H M M M M H H H
4 Lowden 3 H H M M M M H H H H
2 Primary Agriculture 4 H H M M M M M H H H
5 Agriculture/Residential 4 H H M M M M M H H H
7 Rural Residential 4 H M H M M M M H H H
Restoration Opportunities
A priority restoration reach identified in the Snake River Salmon Recovery Plan (Snake
River Salmon Recovery Board 2011) begins at the mouth of Dry Creek and continues up
to the Washington state line (Reaches 5, 6, 7 and a portion of 4). Key limiting factors and
objectives noted for the priority restoration reach are identified in order of importance
below:
1. Increase Stream Flow
2. Temperature: not more than 4 days above 72ºF
3. Large Woody Debris: > 1 piece per channel width
4. Embeddedness: less than 10% embeddedness
5. Riparian Function: 40 to 90% of maximum

Walla Walla County Shoreline Analysis Report
82
6. Channel Confinement: reduce to 40% to 60% of stream length
Project- and program- specific opportunities are identified in the Snake River Salmon
Recovery Board’s 3-Year Work Plan (Snake River Salmon Recovery Board 2012) and
include projects sponsored by a number or organizations including Walla Walla
Watershed Management Partnership, Columbia Conservation District and Walla Walla
County Conservation District, Gardena Farms Irrigation District #13, Walla Walla Basin
Watershed Council, Department of Ecology, Confederated Tribes of the Umatilla Indian
Reservation, Tri-State Steelheaders, and WDFW.
5.2.4 Touchet River
Overview
The Touchet River flows through the middle of Walla Walla County. It enters from Columbia
County and flows east through the Cities of Waitsburg and Prescott before turning south and
eventually joining the Walla Walla River in the southwest portion of the County, just southwest
of unincorporated Touchet. For analysis purposes four reaches were delineated on the Touchet
River within the unincorporated County (Reaches 1, 2, 3 and 9), four within the City of
Waitsburg (Reaches 5, 6, 7 and 8) and one within the City of Prescott (Reach 4).
Functions are generally moderate to high throughout all reaches. Presence of anadromous fish
species is documented throughout the river including Spring Chinook and Summer Steelhead,
as well as presumed presence of bull trout in Reaches 3-9 (WDFW Salmonscape, 2014). The
greatest functional impairments are found in the agricultural areas of Reaches 2, 3 and 6 where
shoreline vegetation is lacking. Water quality in portions of the Touchet River is impaired, most
commonly by pH (Reaches 1, 2, 3 and 7). Category 4a listings for temperature, dissolved oxygen
and bacteria are also present for several reaches and Reach 1 has a Category 5 listing for
turbidity. The city of Prescott is entirely on a septic system. The water downstream of Prescott
has a 4a listing for bacteria.
A levee is present along a portion of Reaches 3 and 9 and through the majority of Waitsburg
(Reaches 5-7). In 1996 a significant flood event occurred along the Touchet River in this area.
Reports from the flooding indicate that in extreme flood events the old Mill Race north of
Waitsburg can act like floodway. Because of this, portions of Reach 3 are considered a high
priority for protection and restoration to increase flood control function. The City of Waitsburg
has indicated that vegetation along the levee within City limits has been removed due to the
Corps’ maintenance requirements.
A discussion of shoreline conditions follows for the reaches in each of the local jurisdictions.
The following page provides a summary of the main functions and impacts in Reaches 1, 2, 3,

The Watershed Company/BERK/WWBWC September 2014
83
and 9, which excludes the reaches within the City of Waitsburg. A separate summary is
provided for the City of Waitsburg Reaches 5-8. Reach 4 within the City of Prescott is also
described separately.
Below the summary pages, a detailed table of the functional scores for each reach is provided.
Separate tables are provided for the reaches in each local jurisdiction so that they may be ranked
relative to the other reaches within the same jurisdiction.

Walla Walla County Shoreline Analysis Report
84
Touchet River-excluding City of Waitsburg reaches
Process Function Notes
Hydrologic
Moderation of sediment transport
Moderate to high hydrologic function is present overall. A small area of levee is present in Reaches 3 and 9, and Hofer Dam is located in Reach 2. Floodway is present along Reaches 1, 3 and 9. Several overwater structures are also present. Wetlands, meanders and backwater areas are present in Reach 3, with some other wetlands in Reaches 1 and 9.
Development and maintenance of in-stream
habitat features
Attenuating flow energy
Vegetation
LWD and organic matter recruitment
Moderate vegetation function is present. Riparian vegetation is generally present separating the channel from uplands and stabilizing banks, though vegetation is very narrow in many areas, particularly in Reach 2. The most riparian vegetation is located along the slope on the south side of Reach 7.
Filtration of upland inputs
Bank stabilization
Habitat
Wetland/riparian habitat Overall, moderate to high habitat functions are present. PHS regions are mapped throughout a high percentage of all the reaches, as well as anadromous fish use. Some off-channel habitat areas are present in Reaches 2, 3 and 4.
Space and conditions supporting fish and wildlife,
including PHS species
Hyporheic
Water storage, cool water refugia, and filtration
High hyporheic functions are present due to a high percentage of alluvial soils along the entire Touchet River which help store water and support vegetation within the shoreline area. Support of vegetation
Key Environmental or Land Use Factors Affecting Processes/Functions:
Agricultural uses and loss of riparian vegetation are the primary modifications along the Touchet River.

The Watershed Company/BERK/WWBWC September 2014
85
Select Reach Photos Aerial images source: Google Earth 2014
Typical aerial view
(Reach 2)
Channel detail near Touchet
Reach 9 near eastern county
border
Typical conditions through the
majority of the shoreline
(Reach 2)
Rural Residential
shorelines in Reach 1
Denser woody riparian vegetation
in Reach 3 near Hwy 124

Walla Walla County Shoreline Analysis Report
86
Unincorporated County
Reach-Based Existing Ecological Functions
Table 5-8, below, provides a summary of functional ranking by unincorporated county reach in
the Touchet River.
Table 5-8. Functional scoring by unincorporated county reach on the Touchet River
Relative ranking order from highest to lowest function based on mean reach scores (L= Low function,
M=Medium function, H= High function).
Reach Number/ Name
Ran
k
Hydrologic Vegetative Habitat Hyporheic M
od
era
tio
n o
f s
ed
imen
t
tran
sp
ort
In-s
tream
hab
itat
featu
res
Att
en
uati
ng
flo
w e
nerg
y
LW
D a
nd
org
an
ic m
att
er
rec
ruit
men
t
Filtr
ati
on
of
up
lan
d in
pu
ts
Ban
k s
tab
iliz
ati
on
Wetl
an
d/r
ipa
rian
hab
itat
Sp
ac
e a
nd
co
nd
itio
ns
su
pp
ort
ing
wild
life
Wate
r sto
rag
e a
nd
filt
rati
on
Su
pp
ort
of
veg
eta
tio
n
1 Touchet Rural Residential
1 H M H M M M M H H H
3 Primary Agriculture, Hwy 124
1 M H M M M M H H H H
9 East County 2 M M M M M H M H H H
2 Primary Agriculture 3 M M M M L M M H H H
Restoration Opportunities
The Touchet River major spawning area and priority protection reach extends upstream from
the Highway 125 Bridge to the confluence of Coppei Creek (within Reach 3). Key limiting
factors and objectives noted in the Snake River Salmon Recovery Plan (Snake River Salmon
Recovery Board 2011) for the priority restoration reach are identified in order of importance
below:
1. Embeddedness: less than 10% embeddedness
2. Temperature: not more than 4 days above 72ºF
3. Large Woody Debris: > 1 piece per channel width
4. Channel Confinement: reduce to 40% to 60% of stream length

The Watershed Company/BERK/WWBWC September 2014
87
Project- and program- specific opportunities identified in the Snake River Salmon Recovery
Board’s 3-Year Work Plan (Snake River Salmon Recovery Board 2012) include projects to control
sediment, enhance and protect riparian vegetation, restore floodplain, improve fish passage,
and increase low flows. Project sponsors include the Tri-State Steelheaders, Walla Walla
Conservation District, Walla Walla Watershed Management Partnership and WDFW.
City of Prescott
Portions of five parcels (3.5 acres total) within the City of Prescott lie within Touchet
River shoreline jurisdiction (Reach 4), one in the southwest tip of the city and the others
along the southeast border. For analysis purposes these areas were included as one
reach. The shoreline at the very southwest tip of Prescott’s city limits is fairly unaltered
with forested and scrub/shrub vegetation, backwater and extensive wetland areas. While
shoreline functions along the parcels at the very southeast of the city limits are more
modified from agricultural activities and vegetation clearing; however, some unique
backwater habitat is still present. The entire reach is mapped as floodplain and a priority
habitat region for two species - Northwest White-tailed Deer and Ring-necked Pheasant.
Over half is potentially associated wetland. Presence of Spring Chinook and Summer
Steelhead is documented, as well as presumed presence of bull trout.
Reach-Based Existing Ecological Functions
Table 5-9, below, provides a summary of functional ratings for Reach 4 of the Touchet
River within the City of Prescott.
Table 5-9. Functional scoring for the reach of the Touchet River within the City of Prescott
Reach Number/ Name
Ran
k
Hydrologic Vegetative Habitat Hyporheic
Mo
dera
tio
n o
f s
ed
imen
t
tran
sp
ort
In-s
tream
hab
itat
featu
res
Att
en
uati
ng
flo
w e
nerg
y
LW
D a
nd
org
an
ic m
att
er
rec
ruit
men
t
Filtr
ati
on
of
up
lan
d in
pu
ts
Ban
k s
tab
iliz
ati
on
Wetl
an
d/r
ipa
rian
hab
itat
Sp
ac
e a
nd
co
nd
itio
ns
su
pp
ort
ing
wild
life
Wate
r sto
rag
e a
nd
filt
rati
on
Su
pp
ort
of
veg
eta
tio
n
4 Prescott NA H H H H M H H H H H
L= Low function, M=Medium function, H= High function

Walla Walla County Shoreline Analysis Report
88
Restoration Opportunities
See the main discussion of restoration opportunities in the Unincorporated County
Section above for restoration opportunities on the Touchet River that may apply to the
City of Prescott.
City of Waitsburg
Four of the Touchet River reaches (Reaches 5-8), totaling approximately 157 acres, lie
within City of Waitsburg boundaries. The majority of this land is owned by the City.
Reach 8 through eastern Waitsburg is the least altered reach. The majority of the
shoreline is unarmored with some backwater areas and wetlands and dense riparian
vegetation separating uplands from the river along most of the reach. Reaches 6 and 7
are slightly lower functioning due to more alterations from residential development,
agriculture practices and areas with little riparian vegetation. Irrigation withdrawals for
alfalfa production occur in Reach 6.
Extensive floodplain and floodway areas are mapped within each of the four reaches
and the city experienced significant flooding events in 1964 and 1996. Levees are present
along the majority of Reaches 5-7, which are used as a public trail. Currently Reach 8
also has a temporary levee along the north side. The levees alter natural hydrologic
process and floodway connectivity. Additionally, the Corps has recently required
vegetation removal along the levee, lowering vegetative shoreline function.
Priority habitat regions for Northwest White-tailed Deer and Ring-necked Pheasant are
mapped within each of the reaches. Presence of Spring Chinook and Summer Steelhead
is documented, as well as presumed presence of bull trout.

The Watershed Company/BERK/WWBWC September 2014
89
Touchet River- City of Waitsburg
Process Function Notes
Hydrologic
Moderation of sediment transport
Low to moderate hydrologic function is present overall. Extensive floodway and floodplain is mapped throughout Waitsburg, however, levees are present along portions of Reaches 5-7 which lowers connectivity to the floodplain and overall hydrologic function. Very little wetland is present.
Development and maintenance of in-stream
habitat features
Attenuating flow energy
Vegetation
LWD and organic matter recruitment
Moderate vegetation functions are present overall. Riparian vegetation is generally present separating the channel from uplands and stabilizing banks. Functions are highest in Reach 8 where a wider vegetated riparian area is present then in the more developed areas of the city.
Filtration of upland inputs
Bank stabilization
Habitat
Wetland/riparian habitat Moderate to high habitat functions are present. PHS regions are mapped over a high percentage of all of the reaches. Presence of Spring Chinook and Summer Steelhead is documented, as well as presumed presence of bull trout.
Space and conditions supporting fish and wildlife,
including PHS species
Hyporheic
Water storage, cool water refugia, and filtration
High hyporheic functions are present due to a high percentage of alluvial soils along the entire Touchet River which help store water and support vegetation within the shoreline area. Support of vegetation
Key Environmental or Land Use Factors Affecting Processes/Functions:
Levees along the majority of Reaches 5-7 are the primary modification to the Waitsburg shorelines. The levees alter natural hydrologic process and floodway connectivity. Agricultural uses and loss of riparian vegetation are also signification modifications.

Walla Walla County Shoreline Analysis Report
90
Select Reach Photos Aerial images source: Google Earth 2014
Reach 7
Detail of conditions
Reach 6
Reach 5
Reach 8

The Watershed Company/BERK/WWBWC September 2014
91
Reach-Based Existing Ecological Functions
Table 5-10, below, provides a summary of functional ranking by reach of the Touchet
River within the City of Waitsburg.
Table 5-10. Functional scoring by reach on the Touchet River within the City of Waitsburg,
Relative ranking order from highest to lowest function based on mean reach scores (L= Low function,
M=Medium function, H= High function).
Reach Number/ Name
Ran
k
Hydrologic Vegetative Habitat Hyporheic
Mo
dera
tio
n o
f s
ed
imen
t
tran
sp
ort
In-s
tream
hab
itat
featu
res
Att
en
uati
ng
flo
w e
nerg
y
LW
D a
nd
org
an
ic m
att
er
rec
ruit
men
t
Filtr
ati
on
of
up
lan
d in
pu
ts
Ban
k s
tab
iliz
ati
on
Wetl
an
d/r
ipa
rian
hab
itat
Sp
ac
e a
nd
co
nd
itio
ns
su
pp
ort
ing
wild
life
Wate
r sto
rag
e a
nd
filt
rati
on
Su
pp
ort
of
veg
eta
tio
n
8 East Waitsburg Rural 1 H M H H H H H H H H
5 Waitsburg Treatment Plant
2 M M L L M M M H M H
6 Waitsburg Agriculture 2 M L L M M M M H M H
7 Waitsburg Mixed Residential
3 M L L M L M M H M H
Restoration Opportunities
See the main discussion of restoration opportunities in the Unincorporated County
Section above for restoration opportunities on the Touchet River that may apply to the
City of Waitsburg.
5.2.5 Mill Creek
Overview
Mill Creek is a tributary to the Walla Walla River originating in the Blue Mountains. For the
purpose of this analysis it has been divided into 15 reaches. Reaches 3 through 11 are in the City
of Walla Walla or its UGA, the rest are in unincorporated county.
The conditions in the upper Mill Creek watershed (reaches 13-15) are vastly different from the
conditions of the lower watershed (reaches 1-12) through the City of Walla Walla and
approaching the confluence with the Walla Walla River. Reach 2 in the county, and the reaches
of Mill Creek that flow through the city (3-11) are highly modified from a U.S. Army Corps of
Engineers project to control flooding. In contrast, the headwaters portion of the Mill Creek
watershed is nearly pristine and has very limited access. Reach 15 is managed as a municipal

Walla Walla County Shoreline Analysis Report
92
watershed to protect the city of Walla Walla’s municipal water supply and has been closed to
public entry since 1954 (Washington State Department of Ecology 2007).
Documented presence of Kokanee and spawning bull trout occur in Reach 15, the most
unaltered reach in the very southeast, mountainous portion of the county. Bull trout, rearing
and spawning Spring Chinook and Summer Steelhead are documented throughout the other
reaches, however significant fish passage barriers exist in the system, especially through the
City of Walla Walla (see below) (WDFW Salmonscape 2014). While highly modified, reaches
within the flood control project are recognized as important for migration and rearing of
salmonids. Several springs bring in cold water to the concrete channel and allow rearing for
salmonid fish. Fish passage corrective actions are currently taking place and will continue
(Burns et al. 2009).
Within the City of Walla Walla, the channel has been widened and substantially reinforced with
weirs and concrete flumes. These reaches have very low flows during the summer months
because the majority of water is diverted down Yellowhawk and Garrison Creeks to provide
irrigation water and in-stream flow levels for migrating fish. A hydroelectric plant is present
north of Rooks Park near Reach 12 and some return flow enters Mill Creek near Looking Glass
Road.
A Memorandum of Understanding exists between the Corps and Ecology regarding the Corps
ability to assist Ecology with requests for dividing water between Mill Creek, Yellowhawk and
Garrison Creeks. The diversion dam in Reach 12 limits flood waters from entering Yellowhawk
and Garrison Creeks but the Corps and Ecology have also developed a general schedule for
regulating flows during non-flood periods to maintain adequate flows to sustain fish and fish
habitat (MOU between Corps and Ecology 2012).
As conditions within the city limits are generally quite different from those in the
unincorporated county, and in recognition that the results of this analysis will potentially be
used to create unique SMP provisions for the City of Walla Walla, the city reaches have been
rated relative to one another rather than to the less modified county reaches.
The following table provides separate functional summary pages for the unincorporated county
reaches and the City of Walla Walla reaches, as well as detailed functional scores and rankings,
relative to other reaches within the same local jurisdiction.

The Watershed Company/BERK/WWBWC September 2014
93
Mill Creek- Unincorporated County Reaches Process Function Notes
Hydrologic
Moderation of sediment transport
Moderate to high hydrologic function is present. Significant floodway is present in Reaches 1, 12, 13 and 14, but very little wetland is present throughout the creek. The Mill Creek Diversion Dam located in Reach 12 alters flows and some natural hydrologic processes.
Development and maintenance of in-stream
habitat features
Attenuating flow energy
Vegetation
LWD and organic matter recruitment
Intact shrub scrub and forested riparian habitat is present in some upper County reaches (Reaches 13, 15). Reaches 1, 12 and 14 have moderate riparian vegetation along with some residential and agricultural modifications.
Filtration of upland inputs
Bank stabilization
Habitat
Wetland/riparian habitat Generally high habitat function is present- PHS habitat is mapped over large portions of Reaches 1, 11-13, and 15, which includes Rocky Mountain Elk habitat in Reach 15. Wetland habitat is present in Reach 12 and some areas of dense riparian upland habitat in Reaches 13 and 15. Anadromous fish presence is documented.
Space and conditions supporting fish and wildlife,
including PHS species
Hyporheic
Water storage, cool water refugia, and filtration
Moderate to high hyporheic functions are present due to a high percentage of alluvial soils (except in Reach 15) which help store water and support vegetation within the shoreline area. Support of vegetation
Key Environmental or Land Use Factors Affecting Processes/Functions:
The main modification to the Mill Creek shoreline in the county is agricultural and residential uses which have impacted shoreline vegetation and the Corps flood control project which alters flows downstream of Reach 12 and has modified the channel structure in Reach 2.
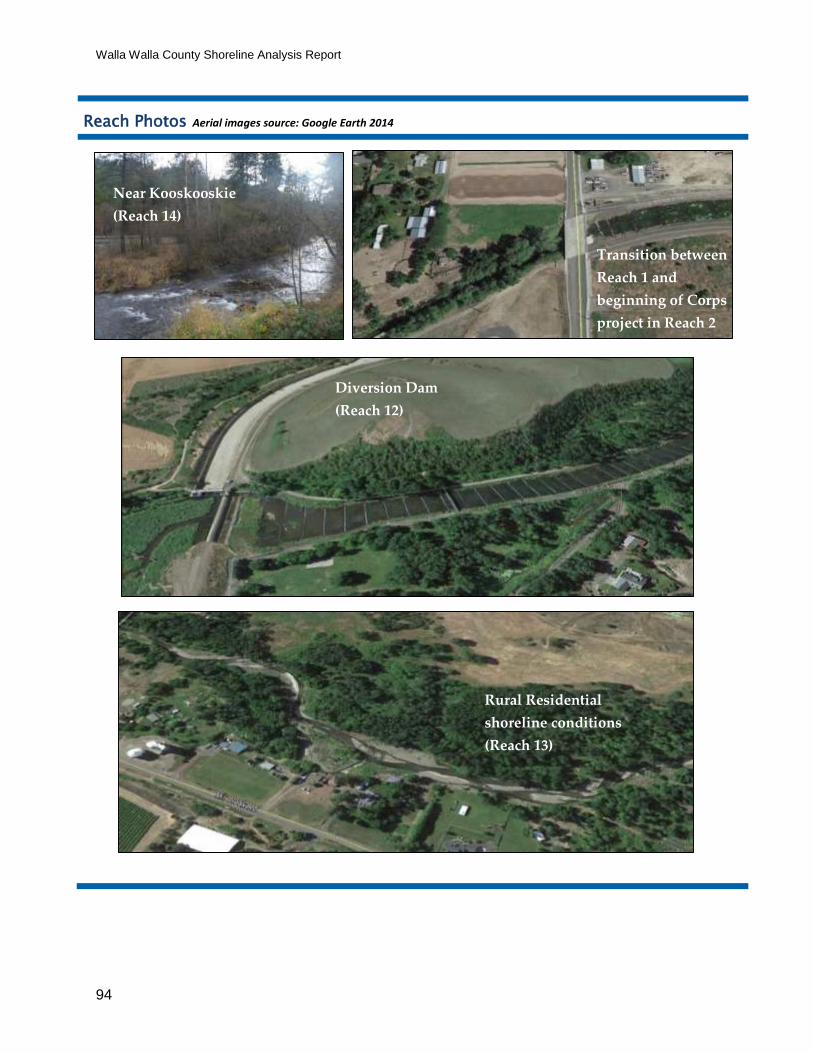
Walla Walla County Shoreline Analysis Report
94
Reach Photos Aerial images source: Google Earth 2014
Near Kooskooskie
(Reach 14)
Transition between
Reach 1 and
beginning of Corps
project in Reach 2
Diversion Dam
(Reach 12)
Rural Residential
shoreline conditions
(Reach 13)

The Watershed Company/BERK/WWBWC September 2014
95
Unincorporated County
Reach-Based Existing Ecological Functions
Table 5-11, below, provides a summary of functional ranking by unincorporated county
reach in Mill Creek.
Table 5-11. Functional scoring by unincorporated county reach on Mill Creek
Relative ranking order from highest to lowest function based on mean reach scores (L= Low function,
M=Medium function, H= High function).
Reach Number/ Name
Ran
k
Hydrologic Vegetative Habitat Hyporheic
Mo
dera
tio
n o
f s
ed
imen
t
tran
sp
ort
In-s
tream
hab
itat
featu
res
Att
en
uati
ng
flo
w e
nerg
y
LW
D a
nd
org
an
ic m
att
er
rec
ruit
men
t
Filtr
ati
on
of
up
lan
d in
pu
ts
Ban
k s
tab
iliz
ati
on
Wetl
an
d/r
ipa
rian
hab
itat
Sp
ac
e a
nd
co
nd
itio
ns
su
pp
ort
ing
wild
life
Wate
r sto
rag
e a
nd
filt
rati
on
Su
pp
ort
of
veg
eta
tio
n
13 Rural Residential 1 H M M H H H H H H H
15 SE County 2 H M L H H H H H M M
1 Garrett 3 H H M M M H M H H H
12 Diversion Dam 4 L M M M M L H H L H
14 Kooskooskie 5 M M M M M M M M M M
2 Levee 6 L L L L L L L L L M
Restoration Opportunities
Mill Creek is designated as a priority protection stream. Additionally, the Snake River regional
technical team has classified Mill Creek upstream of Bennington Dam (Reaches 13-15) as a
priority restoration reach with the vision of restoring adequate fish passage where it is lacking.
Key limiting factors and objectives noted in the Snake River Salmon Recovery Plan (Snake River
Salmon Recovery Board 2011) for the priority protection reach are identified in order of
importance below:
1. Embeddedness: less than 10% embeddedness
2. Temperature: not more than 4 days above 72ºF
3. Large Woody Debris: > 1 piece per channel width
4. Riparian: 40% to 90% of maximum
Project- and program-specific opportunities identified in the Snake River Salmon Recovery
Board’s 3-Year Work Plan (Snake River Salmon Recovery Board 2012) include invasive species

Walla Walla County Shoreline Analysis Report
96
removal, riparian planting, irrigation efficiency studies to increase low flows, fish passage
improvements and in-stream habitat work. Project sponsors include the Walla Walla Watershed
Management Partnership, Walla County Conservation District, Tri-State Steelheaders, WDFW
and the Confederated Tribes of the Umatilla Reservation.
City of Walla Walla
As mentioned above, the Mill Creek channel and shorelines within the city limits and UGA of
the City of Walla Walla have been highly modified and conditions and functions vary greatly
from the reaches in the unincorporated county. The flow diversion upstream causes very low
flows during the summer months. Fish and wildlife habitat is greatly limited due to both flow
and channel modifications and barriers, as well as surrounding land use impacts.
Levees are present along 100% of the city shorelines. The upstream portion of Reach 5 and all of
Reaches 6, 8 and 9 flow through a narrow concrete flume. Mill Creek flows through an
underground pipe (Reach 7) between N. 3rd Avenue and S. Colville Street. The upstream
portion of the creek within the City is wider (Reaches 10 and 11).
Functions are highest in Reaches 10 and 11 where the channel is not in a narrow concrete flume
and the shoreline is less developed, or where there is still some vegetation present. Shallow
alluvial soils are mapped for almost 100% of the city reaches which could help provide
hyporheic function in the shorelines that are not covered with impervious surfaces. PHS habitat
is mapped over some portion of all reaches except 6-9, including 100% of Reach 11. Reach 9 is
predominantly residential development and includes a park and several areas of trees and
pervious surface among the houses which slightly raises its vegetative and habitat scores as
compared to the other city specific reaches.
Functions are lowest in Reaches 5, 6 and 8, which cover the downtown core and industrial
areas, where much of the channel is in the flume and little shoreline vegetation is present.
However, Reach 5 does have some undeveloped areas, including one stretch of fairly wide
forested and scrub shrub vegetation. Functions are essentially nonexistent in the underground
section, other than the actual transmittal of flow.
Reaches 3 and 4 fall in the middle of the functional rankings. Reach 4 is the parcel
encompassing the Walla Walla water treatment plant and Reach 3 covers the shoreline
jurisdiction within the western UGA. While the shorelines in these reaches are not entirely built
out, they are heavily impacted from industrial activity and very little vegetation is present.

The Watershed Company/BERK/WWBWC September 2014
97
Mill Creek- City of Walla Walla Reaches Process Function Notes
Hydrologic
Moderation of sediment transport
Low natural hydrologic function exists, though flood control is provided by the highly modified system. Levees are present along 100% of the city shorelines. The upstream portion of Reach 5 and all of Reaches 6, 8 and 9 flow through a narrow concrete flume. Reach 7 is underground. The upstream city reaches (10 and 11) are wider than those in the flume.
Development and maintenance of in-stream
habitat features
Attenuating flow energy
Vegetation
LWD and organic matter recruitment
High intensity development in most of the city reaches greatly limits vegetative function. Vegetative functions are highest in Reaches 10 and 11 where the shoreline is less developed and some public reserve is present. Reach 9 is includes a park and several areas of trees and pervious surface among the houses which slightly raises its vegetative scores.
Filtration of upland inputs
Bank stabilization
Habitat
Wetland/riparian habitat PHS habitat is mapped in Reach 11. Elsewhere habitat is greatly limited due to shoreline development and the flume system.
Space and conditions supporting fish and wildlife,
including PHS species
Hyporheic
Water storage, cool water refugia, and filtration
A very high percentage of alluvial soils is present along the entire creek, however this function is impaired due to high levels of impervious surface.
Support of vegetation
Key Environmental or Land Use Factors Affecting Processes/Functions:
The Corps flood control project has highly modified the Mill Creek system through the City of Walla Walla.
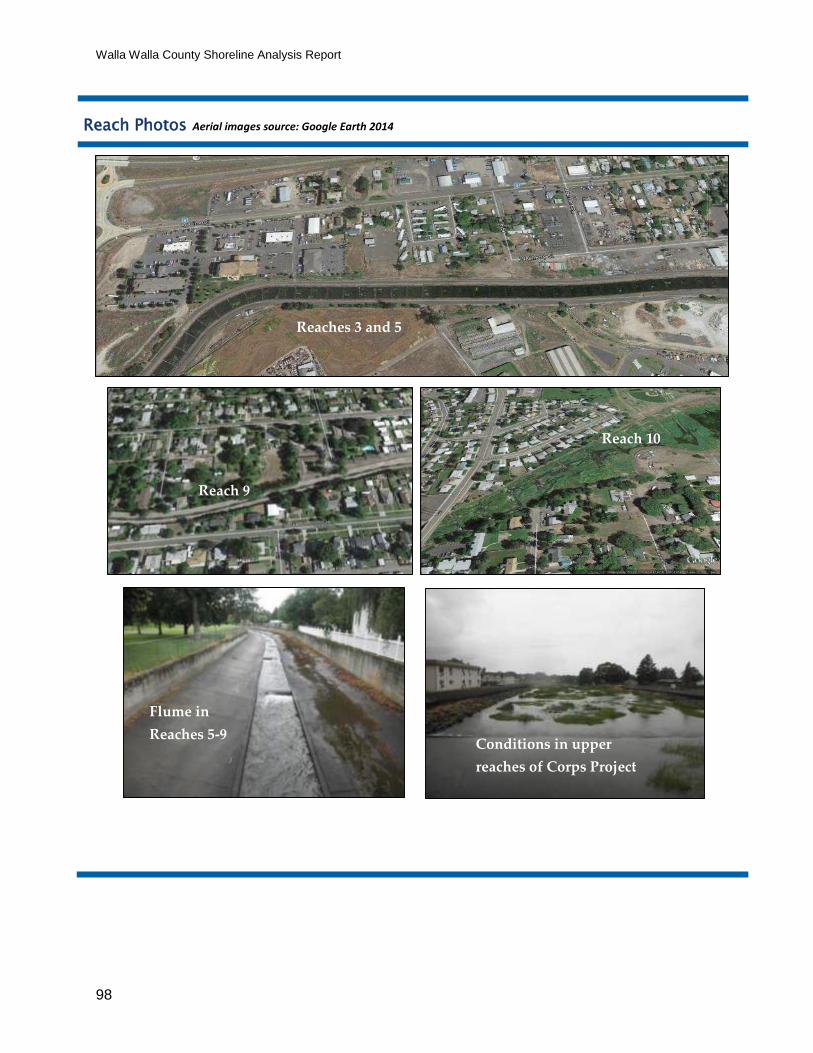
Walla Walla County Shoreline Analysis Report
98
Reach Photos Aerial images source: Google Earth 2014
Reaches 3 and 5
Reach 9
Reach 10
Reach 9
Reach 10
Flume in
Reaches 5-9 Conditions in upper
reaches of Corps Project

The Watershed Company/BERK/WWBWC September 2014
99
Reach-Based Existing Ecological Functions
Generally the same functions and processes outlined in Table 5-4 were used to evaluate City of
Walla Walla reaches and the overall result reflects low functions throughout the City. However,
in order to distinguish between levels of impairment, criteria were applied somewhat
differently for H, M and L scores in consideration of the high level of modification present in
the system overall. Best professional judgment was used to evaluate the overall processes and
functions present (or absent) and to assign relative ratings in an attempt to better differentiate
between levels of modification. For example, more lenient definitions of “broad” and "narrow”
were applied and best professional judgment was used rather than numeric thresholds, to
allow for more meaningful differentiation between the reach scores, relative to one another. The
main characteristics of the reaches which contributed to the ratings are described above.
Table 5-12, below, provides a summary of qualitative functional ranking by reach in Mill Creek
through the City of Walla Walla.
Table 5-12. Functional scoring by reach on Mill Creek within the City of Walla Walla
With relative ranking order from highest to lowest function based on mean reach scores (L= Low function,
M=Medium function, H= High function)*
Reach Number/ Name
Ran
k
Hydrologic Vegetative Habitat Hyporheic
Mo
dera
tio
n o
f
sed
imen
t tr
an
sp
ort
In-s
tream
hab
itat
featu
res
Att
en
uati
ng
flo
w
en
erg
y
LW
D a
nd
org
an
ic
matt
er
recru
itm
en
t
Filtr
ati
on
of
up
lan
d
inp
uts
Ban
k s
tab
iliz
ati
on
Wetl
an
d/r
ipa
rian
hab
itat
Sp
ac
e a
nd
co
nd
itio
ns
su
pp
ort
ing
wild
life
Wate
r sto
rag
e a
nd
filt
rati
on
Su
pp
ort
of
veg
eta
tio
n
11 Walla Walla UGA East 1 M L M L M L M H L M
10 Walla Walla Public Reserve/Residential
2 M M M L M L M M L M
9 Walla Walla Residential 3 L L L M L L M L L M
3 Walla Walla UGA West 4 L L L L L L L M L M
4 Walla Walla Water Treatment Plant (Public Reserve)
4 L L L L L L L M L M
5 Walla Walla Commercial/Industrial
5 L L L L L L L M L L
6 Walla Walla Mixed Use 6 L L L L L L L L L L
8 Walla Walla Downtown- Flume
6 L L L L L L L L L L
7 Walla Walla Downtown-Underground
7 N/A NA NA NA NA NA NA NA NA NA
*Functional rankings were assigned qualitatively for the City of Walla Walla in order to compare them independently
from the County reaches, and to differentiate between varying levels of impairment (See Section 5.1.2)

Walla Walla County Shoreline Analysis Report
100
Restoration Opportunities
Within the City of Walla Walla, restoration opportunities include improving aquifer
recharge to increase stream flows, improving fish passage, and enhancing riparian
habitat as opportunities arise. Project- and program- specific opportunities are
identified in the Snake River Salmon Recovery Board’s 3-Year Work Plan (Snake River
Salmon Recovery Board 2012) and are briefly summarized above.
5.2.6 Bennington Lake
Overview
Bennington Lake is a 68-acre off-stream reservoir of the Army Corps Mill Creek diversion
project. It is the only public lake within 45 miles of the City of Walla Walla and is a popular
location for recreation.
The following page provides a summary of the main functions and impacts in the Bennington
Lake shoreline jurisdiction. Below the summary page, a detailed table of the functional scores is
provided.

The Watershed Company/BERK/WWBWC September 2014
101
Bennington Lake Process Function Notes
Hydrologic
Moderation of sediment transport
Bennington Lake performs a high level of hydrologic function by providing flood control. The predominant purpose of the lake is storage of flood flows from Mill Creek.
Development and maintenance of in-stream
habitat features
Attenuating flow energy
Vegetation
LWD and organic matter recruitment
The majority of the lake shoreline is vegetated with forested or scrub/shrub vegetation. Though the riparian area is generally narrow, it does separate the lake from surrounding uplands.
Filtration of upland inputs
Bank stabilization
Habitat
Wetland/riparian habitat PHS regions are mapped over almost all of the Bennington Lake reach. The adjacent open water and vegetated shoreline provides additional habitat features, however some impact to habitat occurs from trails and associated recreational uses.
Space and conditions supporting fish and
wildlife, including PHS species
Hyporheic
Water storage, cool water refugia, and filtration
N/A
Support of vegetation
Key Environmental or Land Use Factors Affecting Processes/Functions:
The lake is highly functioning for its designed purpose of flood control. It also provides some habitat and vegetative functions with slight functional impacts from recreational use.
Photo of Mill Creek Dam
and Bennington Lake
Image source: US Army Corps of Engineers

Walla Walla County Shoreline Analysis Report
102
Reach-Based Existing Ecological Functions
Table 5-13, below, provides a summary of functional ranking for Bennington Lake.
Table 5-13. Functional scoring for Bennington Lake
L= Low function, M=Medium function, H= High function
Reach Number/ Name
Ran
k
Hydrologic Vegetative Habitat Hyporheic
Mo
dera
tio
n o
f s
ed
imen
t
tran
sp
ort
In-s
tream
hab
itat
featu
res
Att
en
uati
ng
flo
w e
nerg
y
LW
D a
nd
org
an
ic m
att
er
rec
ruit
men
t
Filtr
ati
on
of
up
lan
d in
pu
ts
Ban
k s
tab
iliz
ati
on
Wetl
an
d/r
ipa
rian
hab
itat
Sp
ac
e a
nd
co
nd
itio
ns
su
pp
ort
ing
wild
life
Wate
r sto
rag
e a
nd
filt
rati
on
Su
pp
ort
of
veg
eta
tio
n
1 Bennington Lake NA NA* NA* NA* M M H M H NA** NA**
*The selected hydrologic criteria used for the functional analysis of the stream reaches are not generally present in a lacustrine environment. However, the main purpose of the lake is water storage for flood control, which it is providing. Therefore the hydrologic function is rated “high” overall. **Hyporheic functions are not generally significant in a lacustrine environment and were not evaluated
Restoration Opportunities
An ongoing effort is underway to improve fish passage and screening at the Bennington Lake
Diversion Dam. The 2011 National Marine Fisheries Service Biological Opinion regarding
operation of the Mill Creek Project included a jeopardy determination for the Middle Columbia
River steelhead Distinct Population Segment, indicating that operation of the Mill Creek Project
is likely to hinder the survival and recovery of the Middle Columbia River steelhead Distinct
Population Segment run. In 2012, an alternatives assessment led to the identification of a
preferred alternative and initiation of designs. The Corps will pursue funding to complete the
improvements in the near future.
5.2.7 Yellowhawk Creek
Overview
Yellowhawk Creek is a tributary to the Walla Walla River, entering the Walla Walla River just
west of Old Milton Highway. It originates as a distributary of Mill Creek at the Corps operated
diversion structure located just south of Walla Walla Community College. Downstream from
the diversion structure three tributaries enter Yellowhawk Creek (Caldwell, Russell, and
Cottonwood Creeks, respectively). Based on stream flow data collected on Yellowhawk Creek
by the Walla Walla Basin Watershed Council from May 2009 to September 2013 at a gage station
located approximately 1,000 feet upstream from its confluence with the Walla Walla River,

The Watershed Company/BERK/WWBWC September 2014
103
mean annual flow for Yellowhawk Creek near its mouth varied between a low of 30.8 cfs (2012-
2013 WY) to a high of 53.5 cfs (2010-2011 WY), with an overall mean annual flow of 39.1 cfs. Per
the evaluation of this stream flow record and recent site visits it was determined that
Yellowhawk Creek meets the 20 cfs mean annual flow threshold to be considered a Shoreline of
the State from Cottonwood Creek downstream to the confluence with the Walla Walla River.
Land use within the Yellowhawk reach is predominantly agricultural with some rural
residential uses throughout. The Mill Creek diversion dam operated by the Corps (see Section
5.2.6) limits flood flows from entering Yellowhawk Creek but may also be adjusted to regulate
flows during non-flood periods to maintain adequate flows to sustain fish and fish habitat. The
Corps and Ecology have developed a general schedule for non-flood flow regulation (MOU
between Corps and Ecology 2012). The presence of Spring Chinook is documented throughout
all of Yellowhawk Creek, as well as documented spawning habitat for Summer Steelhead
(WDFW Salmonscape 2014).
The following page provides a summary of the main functions and impacts in the Yellowhawk
Creek shoreline jurisdiction for each of the four ecological processes categories identified in
Table 5-2. Below the summary page, a detailed table of the functional scores is provided.

Walla Walla County Shoreline Analysis Report
104
Yellowhawk Creek Process Function Notes
Hydrologic
Moderation of sediment transport
Hydrologic function varies- No armoring or dams are present and moderation of sediment transport function is high. However, flows are regulated by the Mill Creek diversion dam. No wetland and little backwater areas or off-channel habitat is present in this portion of the creek. Extensive floodplain is present but flow control limits flood waters from entering the channel.
Development and maintenance of in-stream
habitat features
Attenuating flow energy
Vegetation
LWD and organic matter recruitment
Vegetation function also varies- Dense, though narrow bands of forested and shrub vegetation exists along the banks of the channel, providing some screening between the channel and agricultural lands and residential development.
Filtration of upland inputs
Bank stabilization
Habitat
Wetland/riparian habitat Moderate to high habitat function is present. Several road crossings limit habitat connectivity and riparian habitat is narrow, though dense, in many places. No wetland is mapped. However, PHS regions are mapped throughout the reach and there is documented anadromous fish use.
Space and conditions supporting fish and wildlife,
including PHS species
Hyporheic
Water storage, cool water refugia, and filtration
High hyporheic functions are present due to a high percentage of alluvial soils along the entire Touchet River which help store water and support vegetation within the shoreline area.
Support of vegetation
Key Environmental or Land Use Factors Affecting Processes/Functions: The main modifications along this creek are alteration of vegetation by agricultural and
residential development, and flow regulation from the Mill Creek diversion dam.

The Watershed Company/BERK/WWBWC September 2014
105
Reach Photos Aerial images source: Google Earth 2014
Detail of Yellowhawk at
Peppers Bridge Road
Blue shows the extent
of Yellowhawk Creek
Jurisdiction Walla Walla
River
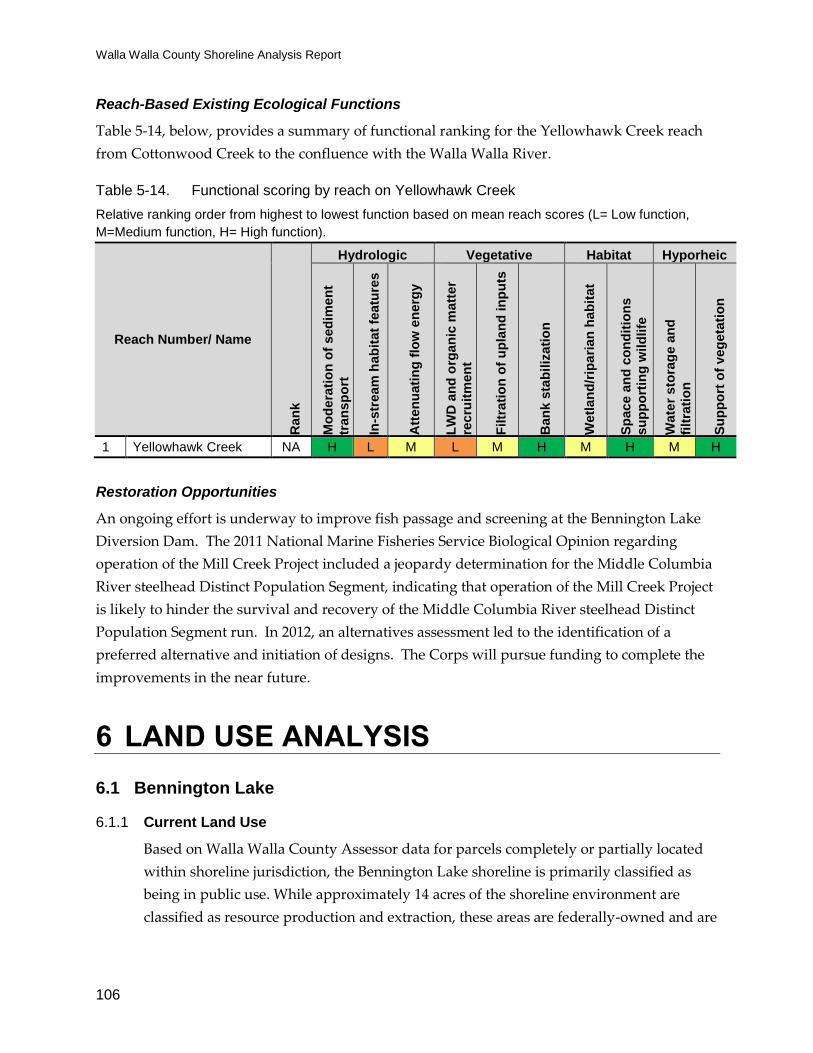
Walla Walla County Shoreline Analysis Report
106
Reach-Based Existing Ecological Functions
Table 5-14, below, provides a summary of functional ranking for the Yellowhawk Creek reach
from Cottonwood Creek to the confluence with the Walla Walla River.
Table 5-14. Functional scoring by reach on Yellowhawk Creek
Relative ranking order from highest to lowest function based on mean reach scores (L= Low function,
M=Medium function, H= High function).
Reach Number/ Name
Ran
k
Hydrologic Vegetative Habitat Hyporheic
Mo
dera
tio
n o
f s
ed
imen
t
tran
sp
ort
In-s
tream
hab
itat
featu
res
Att
en
uati
ng
flo
w e
nerg
y
LW
D a
nd
org
an
ic m
att
er
rec
ruit
men
t
Filtr
ati
on
of
up
lan
d in
pu
ts
Ban
k s
tab
iliz
ati
on
Wetl
an
d/r
ipa
rian
hab
itat
Sp
ac
e a
nd
co
nd
itio
ns
su
pp
ort
ing
wild
life
Wate
r sto
rag
e a
nd
filt
rati
on
Su
pp
ort
of
veg
eta
tio
n
1 Yellowhawk Creek NA H L M L M H M H M H
Restoration Opportunities
An ongoing effort is underway to improve fish passage and screening at the Bennington Lake
Diversion Dam. The 2011 National Marine Fisheries Service Biological Opinion regarding
operation of the Mill Creek Project included a jeopardy determination for the Middle Columbia
River steelhead Distinct Population Segment, indicating that operation of the Mill Creek Project
is likely to hinder the survival and recovery of the Middle Columbia River steelhead Distinct
Population Segment run. In 2012, an alternatives assessment led to the identification of a
preferred alternative and initiation of designs. The Corps will pursue funding to complete the
improvements in the near future.
6 LAND USE ANALYSIS
6.1 Bennington Lake
6.1.1 Current Land Use
Based on Walla Walla County Assessor data for parcels completely or partially located
within shoreline jurisdiction, the Bennington Lake shoreline is primarily classified as
being in public use. While approximately 14 acres of the shoreline environment are
classified as resource production and extraction, these areas are federally-owned and are

The Watershed Company/BERK/WWBWC September 2014
107
not actively farmed. In practice, the entire shoreline area is devoted to recreational uses
and flood management by the U.S. Army Corps of Engineers.
Exhibit 6-1. Current Land Use – Bennington Lake
Source: Walla Walla County Assessor, 2014.
Water-Oriented Uses
Water-dependent and water-related uses include Bennington Lake itself, which is a
Corps-operated flood management project fed by a diversion dam on Mill Creek to the
north. Water level monitoring equipment and the diversion flume itself are also present
within the Bennington Lake reach.
Resource Production &
Extraction13.81 ac
21%
Government51.45 ac
79%
Current Land Use Acres - Bennington Lake Shoreline Jurisdiction

Walla Walla County Shoreline Analysis Report
108
Water-enjoyment uses consist of recreational activities provided by the surrounding
federally-operated park and trail system, which are described in detail in Section 6.1.3.
Transportation and Utilities
Transportation infrastructure in the vicinity of Bennington Lake consists of a single
public roadway, Reservoir Road, which provides access to the lake and surrounding
recreation area from North Tausick Way, northwest of the lake. As described in Section
6.1.3, on-site multipurpose trails provide non-motorized transportation access within the
recreation area and to points north along Mill Creek.
Bennington Lake is a flood control reservoir maintained by the U.S. Army Corps of
Engineers, and is itself, in essence, a utility facility. Other utilities in the area include
electric power for on-site equipment.
6.1.2 Future Land Use
Bennington Lake is entirely zoned Exclusive Agriculture (120 acres). Due to the presence
of the federal flood control facility and the large minimum lot size required under
zoning regulations, future development in this area is anticipated to be minimal and
would, in all likelihood, be directly related to flood control or recreation.
6.1.3 Existing and Potential Public Access
Parks and Open Space
Bennington Lake is a flood control reservoir maintained by the Corps. The lake is
surrounded by approximately 68 acres of federally-owned land and offers a variety of
amenities, including picnic areas, trails, and a boat ramp.
Recreation: Boat Launches and Trails
Bennington Lake features a single boat launch and associated parking area. Internal
combustion boat engines are prohibited on the lake.
The Bennington Lake recreation area offers access to a number of local, Corps-
maintained trails that cover the area surrounding the lake itself, as well as extending
north to Rooks Park at the Mill Creek diversion dam. These trails include the following:
Bennington Lake National Recreation Trail System (20+ miles)
Kingfisher Trail (1.7 miles)
Meadowlark Trail (2.6 miles)
Whitetail Trail (4.8 miles)

The Watershed Company/BERK/WWBWC September 2014
109
Future Public Access
The entirety of the Bennington Lake reach consists of public land devoted to recreation
and water access. The Corps will, in all likelihood, continue to maintain the existing
public access facilities at this location and make improvements as necessary, but no
major facility additions are anticipated in the foreseeable future.
Potential Population and Future Tourism Demand
While no residential development is anticipated within the immediate vicinity of
Bennington Lake due to federal ownership of the land, the recreation area is only a short
distance from the City of Walla Walla, the largest population center in the county. As
population growth continues in nearby urban areas, Bennington Lake is likely to be an
attractive recreational option for area residents, increasing the number of annual visitors
and placing greater demand on the existing facilities.
Walla Walla is also a center of regional tourism, and visitors come from across
Washington to tour local wineries and visit historic sites, among other activities. As
more visitors come to the area, it is likely that demand at the Bennington Lake facilities
will increase, as well.
6.1.4 Historic and Archeological Sites
No historic or archaeological sites have been documented at Bennington Lake. Because
the site is a Corps-managed flood control project, the lake level is regulated by the Mill
Creek Diversion Dam, and the current shoreline does not represent historic conditions.
As a result, the potential for discovery of undocumented cultural resources is likely to be
relatively low.
6.2 Snake River
6.2.1 Current Land Use
Based on Walla Walla County Assessor data for parcels completely or partially located
within shoreline jurisdiction, the most prevalent land use along the Snake River
shoreline is resource production and extraction, primarily in the form of agriculture.
Undeveloped land and transportation/communication/utility facilities also occupy a
large portion of the shoreline.
Current land uses on the Snake River shoreline are summarized below in
Exhibit 6-2.
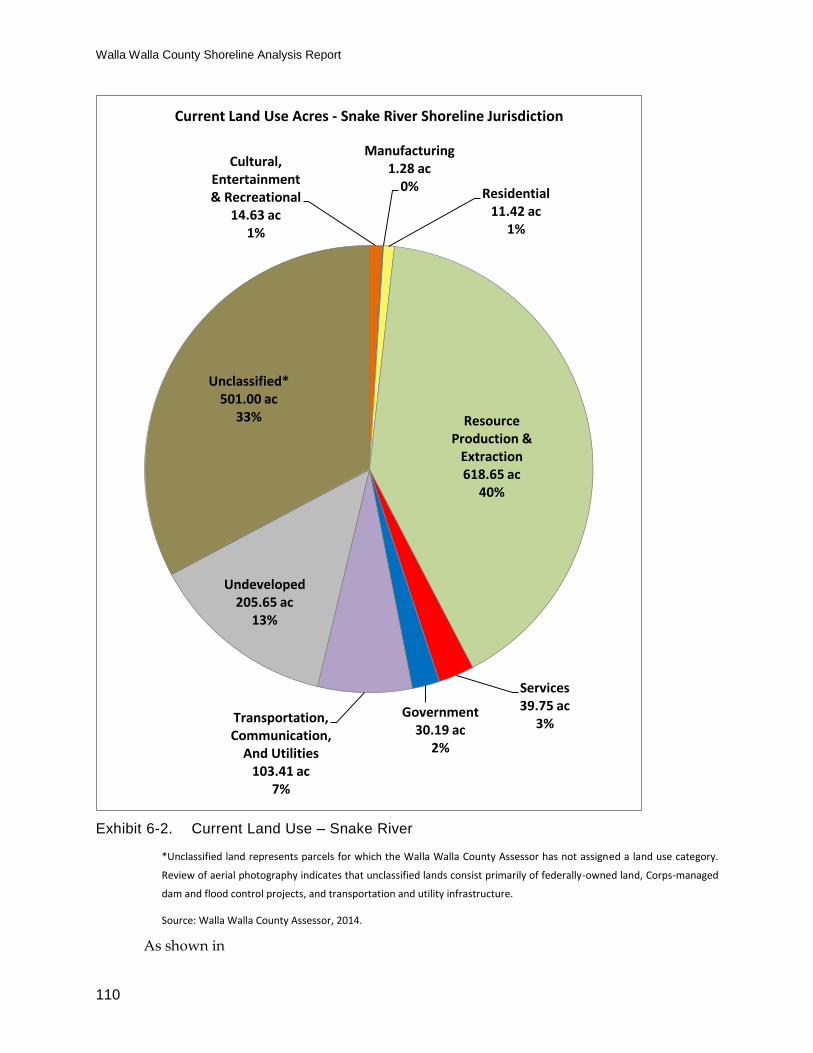
Walla Walla County Shoreline Analysis Report
110
Exhibit 6-2. Current Land Use – Snake River
*Unclassified land represents parcels for which the Walla Walla County Assessor has not assigned a land use category.
Review of aerial photography indicates that unclassified lands consist primarily of federally-owned land, Corps-managed
dam and flood control projects, and transportation and utility infrastructure.
Source: Walla Walla County Assessor, 2014.
As shown in
Cultural, Entertainment & Recreational
14.63 ac1%
Manufacturing1.28 ac
0% Residential11.42 ac
1%
Resource Production &
Extraction618.65 ac
40%
Services39.75 ac
3%Government
30.19 ac2%
Transportation, Communication,
And Utilities103.41 ac
7%
Undeveloped 205.65 ac
13%
Unclassified*501.00 ac
33%
Current Land Use Acres - Snake River Shoreline Jurisdiction

The Watershed Company/BERK/WWBWC September 2014
111
Exhibit 6-2, nearly one-third of the Snake River shoreline is occupied by “Unclassified”
land uses. These areas represent parcels for which the Walla Walla County Assessor has
not assigned land use category in their records. Review of these properties via aerial
photography indicates that this land consists of federally-owned properties associated
with U.S. Army Corps of Engineers-managed dams and parks or transportation and
utility infrastructure associated with railroad operations or hydroelectric power
generation. A more detailed discussion of transportation and utility infrastructure in the
shoreline environment is contained in the following sections.
Water-Oriented Uses
Along the Snake River, water-dependent uses include the Ice Harbor and Lower
Monumental Dams, docks supporting barge traffic on the river, and recreational boat
launches, which are discussed in detail in Section 6.2.4. Industrial docks and barge slips
are concentrated in the Burbank area, where the Port of Walla Walla operates the
Burbank Industrial Park and Burbank Business Park. The Port also operates a grain
shipping facility at the Sheffler site, located roughly halfway between the Ice Harbor and
Lower Monumental dams, under lease from the Army Corps of Engineers. The Sheffler
facility was recently expanded and serves as the primary grain shipping site for farmers
in this portion of Walla Walla County.
Water-related uses include hydroelectric power production and irrigation facilities, such
as withdrawal pumping stations and canals. Water-enjoyment uses consist primarily of
recreational uses, including parks, boat launches, trails, campsites, and open space.
Public access is discussed in Section 6.2.3 below.
Transportation and Utilities
Transportation facilities along the Snake River include state and U.S. highways, county
roads, private access roads, and railroads. Goods and materials, primarily grain and
wood products, are also transported by barge on the Snake River itself, and the U.S.
Army Corps of Engineers maintains a dredged navigation channel for barge traffic. In
Walla Walla County, the Snake River is dammed at two locations, Ice Harbor Dam and
Lower Monumental Dam, to facilitate navigation and generate hydroelectric power.
SR 124 and U.S. 12 cross the Snake River immediately upstream of its confluence with
the Columbia River near Burbank; this is the only vehicular bridge crossing of the Snake
in Walla Walla County. All other roadways along the Snake consist of County roads and
private roadways that provide access to agricultural, residential, and industrial areas
along the river, including access roads for the federally-maintained dams.

Walla Walla County Shoreline Analysis Report
112
The Union Pacific Railroad follows the south bank of the Snake River from the Ice
Harbor Dam all the way to the northeastern corner of the county, finally crossing the
river north into Franklin County, a distance of over 50 miles. The railroad ultimately
connects to the cities of Cheney, Spokane, and Coeur d’Alene. Materials transported by
rail along the Snake River include grain, coal, and closed shipping containers for
miscellaneous goods.
Utility systems along the Snake River consist mostly of the hydroelectric generation
facilities located at the Ice Harbor and Lower Monumental dams, but also include the
following:
Water and sewer utilities serving residential development in the Burbank area.
Electric transmission and distribution lines serving shoreline development in the
Burbank area.
Electric power transmission infrastructure serving hydroelectric generation
projects on the river, including a Bonneville Power Administration (BPA)
substation located adjacent to the Lower Monumental Dam.
Future utilities along the Snake River would include expansion of the existing BPA
substation at the Lower Monumental Dam as part of the upcoming Central Ferry-Lower
Monumental Transmission Line Project, which would construct a new 500 kilo-volt (kV)
transmission line across northern Walla Walla County to connect the Lower
Monumental Dam substation with the Central Ferry substation in Garfield County.
Project construction is scheduled to begin in 2014, with final line energization in late
2015.
6.2.2 Future Land Use
The majority of the Snake River shoreline is zoned Primary Agriculture (minimum lot
size of 40 acres), followed by Public Reserve. In the Burbank area, approximately 18
acres are zoned Heavy Industrial, and approximately 30 acres are zoned Rural
Residential (minimum lot size of 2 acres). Exhibit 6-3 shows zoned acres by shoreline
reach, as well as the percentage of each reaches covered by different zoning districts. As
illustrated by the exhibit, the upper reaches of the river are intended for primarily
agricultural development, while the downstream reaches are more varied, incorporating
residential uses, industry, and public uses associated with Corps-managed facilities.

The Watershed Company/BERK/WWBWC September 2014
113
Exhibit 6-3. Snake River Zoning by Reach
Source: Walla Walla Joint Community Development Agency, 2014.
Very little land on the Snake River is vacant and available for development. Much of the
land classified as “Undeveloped” is in government ownership and not available for
private residential, commercial, or industrial development. Only approximately 4 acres
of vacant parcels lie along the Snake River, of which only 1.8 acres are within shoreline
18.07 ac
8.92 ac
124.81 ac
561.52 ac
468.64 ac
18.69 ac
48.63 ac
133.03 ac
116.29 ac
29.95 ac
0% 20% 40% 60% 80% 100%
S1, Burbank RAC-Port of Walla Walla
S2, Burbank RAC-Residential. Public Reserve
S3, Public Reserve- Lower Snake Islands
S4, Public Reserve
S5, Public Ownership
S6, Lower Monumental
S7, Northern County Primary Agriculture
Snake River Shoreline Jurisdiction - Current Zoning by Reach
Heavy Industrial Primary Agriculture 40 Public Reserve Rural Residential 2

Walla Walla County Shoreline Analysis Report
114
jurisdiction. All of these properties are zoned Rural Residential (2 acres), and while none
of them currently meet the minimum size requirements for new parcels, they were legal
lots at the time of creation and are available for development. Development of these lots
would add up to 6 new residences to the Snake River shoreline, all located in the
Burbank area.
In addition to vacant residential properties, capacity for additional development is
available at the Burbank Industrial Park owned by the Port of Walla Walla. The Port has
planned substantial improvements and renovations to the industrial park over the next
10 years, as documented in the Port’s comprehensive plan, adopted in 2012. Planned
improvements include new commodity storage buildings, barge slip improvements,
improvements to existing grain facilities, expansion of water and sewer systems, and
construction of a new rail line connection to the industrial park.
6.2.3 Existing and Potential Public Access
Parks and Open Space
Existing parks and public access opportunities along the Snake River include Hood
Park, Ice Harbor Dam, Charbonneau Park, Fish Hook Park, and the Ayer Boat Basin.
County, state, and federally-owned land along the Snake River is summarized in the
table below.
Table 6-1. Parks and Open Space Acres by Reach – Snake River
Reach Ownership Acres in
Jurisdiction
S1 – Burbank RAC/Port of Walla Walla County 15.6
S2 – Burbank RAC/Residential/Public Reserve County 16.3
S3 – Public Reserve/Lower Snake Islands County 16.0
S4 – Public Reserve County 45.9
Federal 37.7
S5 – Public Ownership Federal 31.0
S6 – Lower Monumental Federal 43.9
S7 – Northern County Primary Ag County 50.7
Source: Walla Walla County Assessor, 2013.
Recreation: Boat Launches and Trails
Boat launches are available on the Snake River at the following locations:
Hood Park – Located in Burbank, just upstream of the Snake/Columbia
confluence, the Corps-managed park provides camping, day use areas, and a 3-
lane boat launch.
The Watershed Company/BERK/WWBWC September 2014
115
Charbonneau Park – Located approximately 2 miles upstream of Ice Harbor
Dam, Charbonneau Park is managed by the U.S. Army Corps of Engineers and
provides camping, picnicking, fishing, hiking, and hunting, in addition to a
boat ramp.
Fish Hook Park – Located approximately 7 miles upstream of Ice Harbor Dam,
this Corps-managed park provides campsites, day-use areas, and a 2-lane
paved boat launch.
Lower Monumental Boat Launch – Located approximately one mile
downstream of the Lower Monumental Dam, this boat launch is located on
federal land and provides a one-lane launch with limited parking.
Ayer Boat Basin – Located just downstream from the community of Ayer, the
boat basin provides primitive camp sites, vault toilets, and a boat launch
facility.
The Snake River is also a designated route for the Northwest Discovery Water Trail
along its entire length in Walla Walla County. The Water Trail stretches 367 miles from
the Clearwater River in Idaho to the Bonneville Dam on the Columbia River and
provides tourists with boating and camping opportunities along the river.
Future Public Access
Walla Walla County has not historically served as a provider of parks and open space,
and the County has not identified future improvements at any shoreline parks. The
Corps conducts ongoing maintenance and improvements of its dam and park facilities.
The Port of Walla Walla completed a master plan for its Cargill Pond site on the Snake
River in 2011. The master plan features a park design with public water access,
including a boat ramp, a swimming area, waterfront pedestrian trails, lawn areas,
habitat plantings, rest areas, and sports facilities. Phase I of the Cargill Pond
redevelopment is planned to be complete by 2017. Phases II-IV are planned to be
complete by 2022.
It is anticipated that additional opportunities for improved public access to the shoreline
will be identified as part of the SMP planning process.
Potential Population and Future Tourism Demand
Outside of the Burbank area, zoning along the Snake River shoreline is almost entirely
agricultural, and future population growth is anticipated to be very low. Upstream
recreational areas are frequented by boaters and campers, but their remoteness is likely
to limit increases in use from tourism to moderate levels.

Walla Walla County Shoreline Analysis Report
116
Due to the presence of residential development in Burbank Heights and the proximity of
the Tri-Cities, public access points near the confluence of the Snake and Columbia Rivers
may experience increased usage from both population growth and tourism.
6.2.4 Historic and Archeological Sites
The Snake River has been a major regional waterway for centuries, providing fishing,
hunting, and transportation for native peoples, particularly as it provides downstream
access to the Columbia River, which ultimately flows to the Pacific Ocean. After
European settlement of the region and the rise of agriculture and mineral extraction
operations, the Snake provided a means to transport goods downstream to the
Columbia River. Similar to the Columbia River, numerous sections of the Snake were
dammed in the early and mid-20th Century to ease navigation, provide irrigation water,
and generate hydroelectric power. The portion of the Snake that borders Walla Walla
County contains two dams: the Ice Harbor Dam was completed in 1961, and the Lower
Monumental Dam was completed in 1969. While these two structures are not included
in local or national registers of historic sites, both are more than 50 years old.
The Snake River is also designated as part of the Lewis and Clark National Historic
Trail, and approximate locations have been identified for several of the riverside
campsites recorded in the expedition’s journals. No historic or archaeological sites are
documented on the Snake River in Walla Walla County, but its long use for fishing,
hunting, and transportation by both native peoples and post-settlement occupants
makes it likely that undocumented cultural resources exist along the shoreline.
6.3 Columbia River
6.3.1 Current Land Use
The Columbia River shoreline in Walla Walla County is characterized by a mix of
industrial, resource production and extraction, and government-owned public uses.
Walla Walla County Assessor data for parcels completely or partially located within
shoreline jurisdiction is summarized in Exhibit 6-4. The largest land use category is
Unclassified, which consists of properties to which the Assessor has not assigned a land
use value. Review of aerial photography indicates that most of this land is occupied by
federally-owned property associated with Corps-managed parks or the McNary
National Wildlife Refuge.
The Port of Walla Walla manages several industrial properties along the Columbia River
shoreline, including the following:
The Watershed Company/BERK/WWBWC September 2014
117
Ady Industrial Site – Located just south of the Burbank Rural Activity Center,
the Port owns approximately 110 acres of industrially-zoned shoreline
property. The majority of the land is underwater, and the limited upland
areas are currently vacant.
Dodd Road Industrial Park – Located in the Attalia Industrial UGA north of
Wallula, the Dodd Road Industrial Park encompasses approximately 289
acres zoned for heavy industry. Most of the industrial park is currently
vacant, but Railex, LLC owns approximately 53 acres and operates a produce
and wine distribution facility. The remainder of the park is currently Port
owned.
Attalia Industrial Site – Located within the Attalia Industrial UGA and south
of the Dodd Road Industrial Park, the Port of Walla Walla owns
approximately 90 acres of vacant shoreline property zoned for heavy
industry and agricultural industrial uses. The majority of this land is
underwater, and limited upland area is available for development.
Wallula Industrial Park-Shipping Terminal – Located at the mouth of the
Walla Walla River, the Port owns approximately 41 acres zoned for rural
commercial and industrial development, as well as agriculture. The property
is currently vacant, but it is located adjacent to an existing Northwest Grain
Growers grain elevator facility, which includes a public barge slip.

Walla Walla County Shoreline Analysis Report
118
Exhibit 6-4. Current Land Use – Columbia River
*Unclassified land represents parcels for which the Walla Walla County Assessor has not assigned a land use category. Review
of aerial photography indicates that unclassified lands consist primarily of federally-owned land, Corps-managed dam and
flood control projects, and transportation and utility infrastructure.
Source: Walla Walla County Assessor, 2014.
Manufacturing42.75 ac
2%
Residential0.01 ac
0%
Resource Production &
Extraction626.87 ac
32%
Services60.14 ac
3%
Government305.39 ac
16%
Transportation, Communication,
And Utilities8.84 ac
0%
Undeveloped 167.94 ac
9%
Unclassified*751.31 ac
38%
Current Land Use Acres - Columbia River Shoreline Jurisdiction
The Watershed Company/BERK/WWBWC September 2014
119
Water-Oriented Uses
Water-dependent uses on the Columbia River include docks and wastewater outfalls for
industrial development, as well as private docks for recreational boating. As described
under current land use, the Port of Walla Walla owns and manages several industrial
parks and shipping facilities along the Columbia River that include barge slips and
docks. Water-related uses include irrigation pumping stations and maintenance/access
roads for railroad facilities. Water enjoyment uses occupy a large amount of the
shoreline, consisting of the McNary National Wildlife Refuge, several USFWS wildlife
habitat management units, and riverside parks and trails. Public access to the shoreline
is described in detail in Section 6.3.3.
Transportation and Utilities
Transportation facilities along the Columbia River include U.S. highways, county roads,
private access roads, and railroads. Goods and materials are also transported by barge
on the Columbia River itself. All of the Columbia River shoreline in Walla Walla County
consists of the man-made Lake Wallula, and no dams are present on this stretch of the
river.
Highways on the Columbia River include U.S.12, which follows the river south from
Burbank to Smiths Harbor before turning east along the Walla Walla River. U.S. 730
continues from this junction and follows the east bank of the river south into Oregon. No
vehicular bridges cross the Columbia River in Walla Walla County. Other vehicular
transportation infrastructure includes county and private roads providing access to
residential, commercial, industrial, and public access uses along the Lake Wallula
shoreline.
Railroads parallel the Columbia River shoreline along its entire length in Walla Walla
County. The BNSF railroad crosses the Snake River confluence, terminating at Burbank.
The Union Pacific connects at this point and follows the Columbia south. A second
Union Pacific lines crosses the Columbia from Benton County north of Foundation
Island and joins the rail corridor. These rail lines primarily serve the Attalia Industrial
UGA.
Utility systems along the Columbia River include:
Water utilities serving residential development in the Burbank and Wallula
areas.

Walla Walla County Shoreline Analysis Report
120
On-site septic systems serving residential development in the Burbank area.
Electric transmission and distribution lines serving shoreline development in the
Burbank area and the Attalia Industrial UGA.
6.3.2 Future Land Use
The vast majority of the Columbia River shoreline is zoned Public Reserve, which is
intended for open space uses, such as parks, cultural facilities, and wildlife habitat. The
Primary Agriculture (minimum 40 acres), Industrial Agriculture Heavy, and Heavy
Industrial zones comprise the next largest portion of the shoreline. A relatively small
amount of the shoreline is zoned for Industrial/Business Park, Rural Activity Center, and
Rural Development – Commercial/Industrial. Exhibit 6-5 shows zoned acres by shoreline
reach, as well as the percentage of each reach covered by each zoning district.

The Watershed Company/BERK/WWBWC September 2014
121
Exhibit 6-5. Columbia River Zoning by Reach
Source: Walla Walla Joint Community Development Agency, 2014.
48.15 ac
78.78 ac
10.82 ac
137.02 ac
38.87 ac
53.41 ac
1165.97 ac
30.71 ac
402.79 ac
146.36 ac
1.65 ac
12.76 ac
22.22 ac
0% 20% 40% 60% 80% 100%
C1, Commercial/Industrial
C2, Walla Walla Confluence
C3, Primary Agriculture
C4, Attalia UGA- Industrial
C5, J Line, Casey and Curlew Ponds
C6, Burbank RAC-Lake Wallula
C7, Burbank Slough
C8, Burbank RAC
Columbia River Shoreline Jurisdiction - Current Zoning by Reach
Heavy Industrial Industrial Agriculture Heavy
Industrial/Business Park Primary Agriculture 40
Public Reserve Rural Activity Center
Rural Development - Commercial/Industrial

Walla Walla County Shoreline Analysis Report
122
Relatively little land on the Columbia River shoreline is vacant and available for development.
Similar to the Snake River, government ownership is widespread in the area, and much of the
land classified as “Undeveloped” is not available for private development. Approximately 22
acres near the Walla Walla confluence are vacant and available for development for industrial
uses, of which approximately 4 acres are within shoreline jurisdiction.
Review of the existing development in the Attalia Industrial UGA indicates that most industrial
facilities in the area have a Floor Area Ratio (FAR) of 0.15. FAR represents the ratio of building
floor area to the overall size of the building site. For example, a one-story building that covers
half of the lot on which it is located would have an FAR of 0.5. Based on the prevailing existing
FAR of 0.15 in the Attalia Industrial UGA, vacant properties could potentially generate an
additional 26,600 square feet of industrial space in the shoreline environment.
In addition to vacant properties, additional development may occur through expansion of
existing facilities, most notably at shoreline industrial parks. As described under Current Land
Use, the Dodd Road Industrial Park has capacity for additional industrial development, and the
Port plans to invest in additional improvements, such as enhanced rail access and expanded
utility systems, to foster future growth in this location. The Wallula Industrial Park-Shipping
Terminal site also has capacity for additional development. This site lies partially within a Local
Area of More Intensive Rural Development (LAMIRD), as designated by Walla Walla County.
LAMIRD’s support localized clusters of intensive development, such as industry or agricultural
goods processing, in rural areas, and additional industrial development is anticipated to occur
at this location over time.
6.3.3 Existing and Potential Public Access
Parks and Open Space
Existing public access along the Columbia River consists primarily of federal land
ownership, most of which is encompassed by the McNary National Wildlife Refuge. The
refuge, centered on Burbank Slough, encompasses roughly 15,000 acres, approximately
1,400 acres of which are in shoreline jurisdiction. A breakdown of public access acreage
by reach is presented in Table 6-2.
Table 6-2. Parks and Open Space Acres by Reach – Columbia River
Reach Ownership Acres in
Jurisdiction
C1 – Commercial/Industrial County 8.9
C2 – Walla Walla Confluence Federal 1.7
C4 – Attalia UGA/Industrial Federal 28.7
C5 – J Line, Casey, and Curlew Ponds Federal 1,106.6
C6 – Burbank RAC/Lake Wallula Federal 33.4
C7 – Burbank Slough Federal 375.1

The Watershed Company/BERK/WWBWC September 2014
123
C8 – Burbank RAC Federal 144.8
Source: Walla Walla County Assessor, 2013.
As described above, parks and open space along the Columbia consist mostly of national
wildlife refuge and habitat management areas. In addition to the McNary Wildlife
Refuge, the Columbia River shoreline jurisdiction contains portion of the Peninsula
Habitat Management Unit south of Burbank and the Two Rivers Habitat Management
Unit at the southern end of the McNary refuge. Other parks include:
Madame Dorian Memorial Park at the mouth of the Walla Walla River,
operated by the U.S. Fish and Wildlife Service (USFWS).
Wallula Gap National Natural Landmark Area (Twin Sisters), located
approximately 1 mile south of the mouth of the Walla Walla River.
Port Kelley, located approximately 2 miles south of the mouth of the Walla
Walla River. The private property is the home of the Walla Walla Yacht Club,
and the site includes boat moorage, boat launches, trailer parking, and a
small park area.
In addition to the formal parks and recreation areas described above, anecdotal
information from local residents indicates that informal fishing access exists on the
southern reaches of the Columbia River, and recreational anglers often park their cars
along the railroad right-of-way and walk across the tracks to fish.
Recreation: Boat Launches and Trails
Public boat launches are available at only one location on the Columbia River, the
McNary Wildlife Refuge, located at the mouth of Burbank Slough (Reach C7). The Walla
Walla Yacht Club facility in Reach C1 offers moorage and boat launches for club
members. While technically located on the Walla Walla River, a boat launch is also
available at Madame Dorian Memorial Park, located where the Walla Walla River flows
into the Columbia.
Trails on the Columbia River shoreline include the following:
McNary Interpretive Trail – A 1.9-mile interpretive pedestrian trail located at
the McNary Wildlife Refuge along Burbank Slough. The trail starts at the
McNary Environmental Education Center and follows the slough edge before
looping through the shrub-steppe uplands.
Walla Walla County Shoreline Analysis Report
124
McNary Refuge Horse Trail – A 4-mile riverside equestrian trail in the
Peninsula Unit of the McNary Wildlife Refuge.
Northwest Discovery Water Trail – The NDWT stretches 367 miles from the
Clearwater River in Idaho to the Bonneville Dam on the Columbia River. The
Columbia River is part of the trail route from the confluence with the Snake
River south to the Bonneville Dam in Oregon. The water trail provides
tourists with boating and camping opportunities along the river.
Future Public Access
Walla Walla County has not historically served as a provider of parks and open space,
and the County has not identified future improvements at any shoreline parks. The
USFWS conducts ongoing maintenance and improvements of its facilities at the McNary
Wildlife Refuge and other habitat management areas. It is anticipated that additional
opportunities for improved public access to the shoreline will be identified as part of the
SMP planning process. Members of the public have expressed interest in the potential
addition of a fishing pier at Port Kelley to provide additional public access.
Potential Population and Future Tourism Demand
Most of the Columbia River shoreline in Walla Walla County is in federal ownership,
and adopted zoning in the shoreline area is mostly focused on agricultural and
industrial uses, limiting the potential for significant future population growth along the
Columbia. However, the McNary Wildlife Refuge is located only a short distance away
from the Tri-Cities, a major population center for Benton and Franklin Counties. As
population growth occurs in these cities and Walla Walla County continues as a center
of regional tourism, it is possible that visitors from outside Walla Walla County may
increase usage of the wildlife refuge and its facilities.
6.3.4 Historic and Archeological Sites
The Columbia River has been a major inland waterway for centuries, providing fishing,
hunting, and transportation for native peoples. After European settlement of the region,
resource-based agriculture and mining operations became more common, leading to
increased use of the river as a transportation route for both imported and exported
goods. Numerous sections of the Columbia River were dammed in the early and mid-
20th Century to ease navigation, provide irrigation water, and generate hydroelectric
power. A byproduct of this process was alteration of the historic shoreline in many
areas. Due to the long history of water and shoreline use by both native peoples and
European settlers, the Columbia River valley contains numerous documented historic
and archaeological sites and is likely to contain many undocumented archaeological
The Watershed Company/BERK/WWBWC September 2014
125
resources, as well. However, due to continual dam construction over the previous
century, most notably the construction of the McNary Dam and the creation of Lake
Wallula, many of these archaeological resources may now be lost.
In Walla Walla County, cultural resources sited on the Columbia River are concentrated
at the McNary Wildlife Refuge, specifically at the northwest end of Burbank Slough. The
wildlife refuge contains 9 documented historic structures, including quarters, storage
and service buildings, a shop, and a set of granaries.
6.4 Walla Walla River
6.4.1 Current Land Use
Based on Walla Walla County Assessor data for parcels completely or partially located
within shoreline jurisdiction, the most prevalent land use along the Walla Walla River
shoreline is resource production and extraction, primarily in the form of agriculture.
Most of the remaining land consists of government-owned land and residential
development. Current land uses on the Walla Walla River shoreline are summarized
below in Exhibit 6-6.
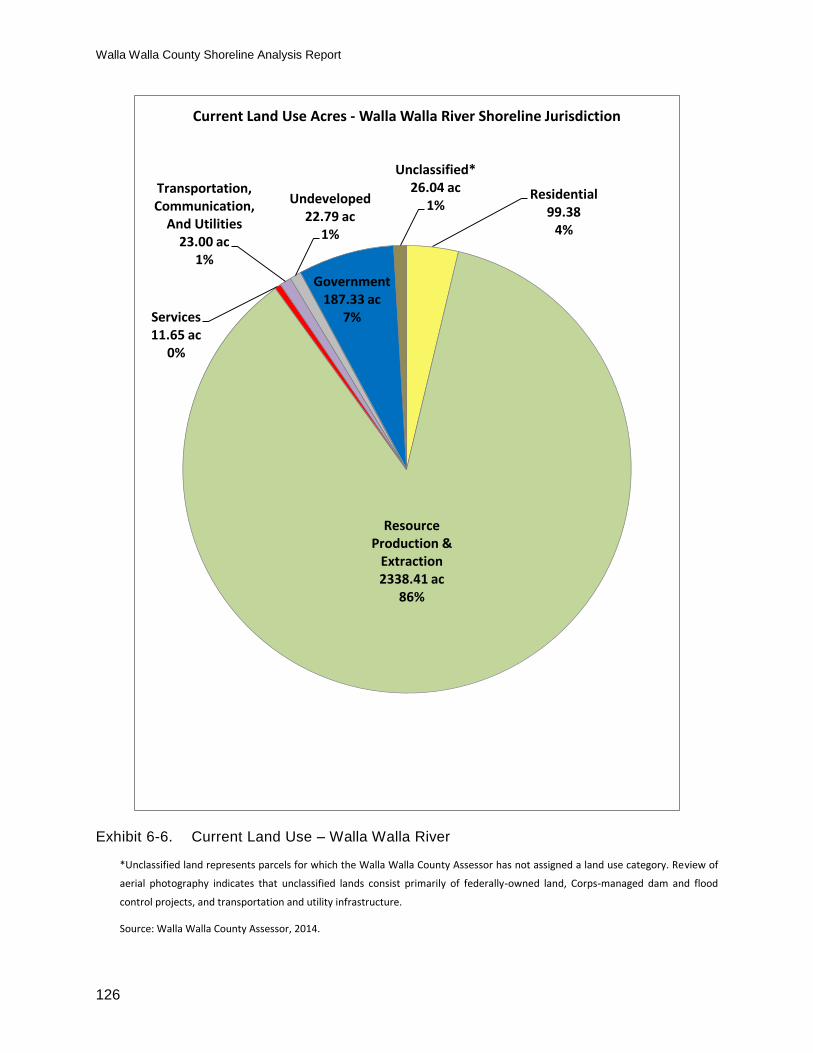
Walla Walla County Shoreline Analysis Report
126
Exhibit 6-6. Current Land Use – Walla Walla River
*Unclassified land represents parcels for which the Walla Walla County Assessor has not assigned a land use category. Review of
aerial photography indicates that unclassified lands consist primarily of federally-owned land, Corps-managed dam and flood
control projects, and transportation and utility infrastructure.
Source: Walla Walla County Assessor, 2014.
Residential99.38
4%
Resource Production &
Extraction2338.41 ac
86%
Services11.65 ac
0%
Transportation, Communication,
And Utilities23.00 ac
1%
Undeveloped 22.79 ac
1%
Government187.33 ac
7%
Unclassified*26.04 ac
1%
Current Land Use Acres - Walla Walla River Shoreline Jurisdiction
The Watershed Company/BERK/WWBWC September 2014
127
Water-Oriented Uses
Water-dependent uses on the Walla Walla River consist of a boat launch facility at Smith
Harbor. Water-related uses include irrigation pumping and diversion structures, and
water-enjoyment uses include parks, a boat launch, and trails. Public access to the
shoreline is described in Section 6.4.3 below.
Transportation and Utilities
Transportation infrastructure in the Walla Walla River shoreline area includes U.S
Highway 12, SR 125, and a variety of county roads and private access roads. U.S. 12
crosses the Walla Walla River at its mouth on the Columbia River, then turns east and
crosses the river again approximately 6 miles northwest of Touchet. SR 125 crosses the
river south of College Place, approximately 4 miles north of the Oregon state line.
County and private roads along the river serve primarily agricultural and low-density
residential development.
Railroad infrastructure along the Walla Walla River includes on railroad crossing at the
mouth of the River on the Columbia, as well as an east-west Union Pacific line that
roughly parallels the river and U.S. 12 through the town of Touchet before eventually
arriving in Walla Walla. The east-west rail line remains on the north side of the river and
periodically passes in and out of shoreline jurisdiction.
Utilities in the shoreline environment include irrigation structures and piping, as well as
water, power, and possibly septic infrastructure serving residences on the shoreline.
6.4.2 Future Land Use
The majority of the Walla Walla River shoreline is zoned Primary Agriculture (40 acres),
though Agriculture Residential (10 acres) accounts for roughly one-third of the shoreline
environment. Agriculture Residential zoning is concentrated in the upper reaches of the
river near Touchet and the City of Walla Walla, while Primary Agriculture is dominant
in the lower reaches near the Columbia River. Rural Residential (5 acres) zoning
accounts for a small portion of the overall shoreline environment, but it represents a
large portion of Reach WW7, located south of College Place and Walla Walla. Exhibit 6-7
shows zoned acres by shoreline reach, as well as the percentage of each reach covered by
the various zoning districts.

Walla Walla County Shoreline Analysis Report
128
Exhibit 6-7. Walla Walla River Zoning by Reach
Source: Walla Walla Joint Community Development Agency, 2014.
Vacant parcels along the Walla Walla River total approximately 17 acres, with shoreline
jurisdiction covering approximately 8.3 acres. These properties are concentrated in the
upper portions of the river (Reaches 5, 6, and 7) and could generate up to 5 new
362.17 ac
301.12 ac
356.47 ac
93.41 ac
853.43 ac
642.72 ac
233.25 ac
291.29 ac
20.13 ac
103.96 ac
0% 20% 40% 60% 80% 100%
WW1, Smith's Harbor
WW2, Primary Agriculture
WW3, Touchet Confluence-Ag/Residential
WW4, Lowden
WW5, Ag Residential
WW6, Ag/Residential Riparian
WW7, Rural Residential
Walla Walla River Shoreline Jurisdiction - Current Zoning by Reach
Agriculture Residential 10 Primary Agriculture 40 Rural Residential 5
The Watershed Company/BERK/WWBWC September 2014
129
shoreline residences, though the size of the parcel pattern in this area would provide
opportunities for homeowners to construct their residences outside the shoreline
jurisdiction, thus reducing this number.
In addition to vacant properties, one residential property in Reach WW5 is capable of
being subdivided for further development, providing the potential for one additional
residence.
6.4.3 Existing and Potential Public Access
Parks and Open Space
Public access on the Walla Walla River is currently limited due to almost completely
private ownership of the adjacent uplands. A large area of federally-owned land is
located at the mouth of the river in Smith’s Harbor, and Reach WW6 contains a portion
of the Whitman Mission National Historic Site, though the site does not offer any formal
water access features or facilities. Park and open space acreage by reach are presented
below in Table 6-3.
Table 6-3. Parks and Open Space Acres by Reach – Walla Walla River
Reach Ownership Acres in
Jurisdiction
WW1 – Smith’s Harbor Federal 276.1
WW4 – Lowden State 13.4
WW6 – Ag/Residential Riparian Federal 8.3
Source: Walla Walla County Assessor, 2013.
Parks and open space along the Walla Walla River include the following:
Madame Dorian Memorial Park, operated by the U.S. Fish and Wildlife Service
(USFWS). The site includes a boat launch and lawn areas.
Wallula Habitat Management Unit, operated by the USFWS. Part of the McNary
Wildlife Refuge complex, the Wallula Unit offers opportunities for fishing,
upland and waterfowl hunting, and equestrian activities.
Whitman Mission National Historical Site, operated by the National Park
Service. The site consists of a visitor center, memorial site markers for the
original mission site, and a grave site, though none of these features are located
in shoreline jurisdiction. As described above, the site is adjacent to the Walla
Walla River, but no formal public access features or facilities are provided.

Walla Walla County Shoreline Analysis Report
130
An unnamed WDFW-owned open space property, located where McDonald
Road crosses the river approximately 6 miles east of Touchet. The property
includes a small parking area and a gravel boat launch.
In addition to these parks and publicly-owned properties, WDFW maintains a fishing
access point on the river at the confluence with Mill Creek.
Recreation: Boat Launches and Trails
As described above, the Walla Walla River contains two public boat launches, one
located at Madame Dorian Memorial Park near the mouth of the river, and another
located on the WDFW-owned property in Reach 4. The federally-operated Wallula
Habitat Management Unit includes a 4-mile equestrian trail along the north bank of the
river.
Future Public Access
Walla Walla County has not historically served as a provider of parks and open space,
and the County has not identified future improvements at any shoreline parks. The
USFWS conducts ongoing maintenance and improvements of its facilities at the McNary
Wildlife Refuge and other habitat management areas. It is anticipated that additional
opportunities for improved public access to the shoreline will be identified as part of the
SMP planning process.
Potential Population and Future Tourism Demand
Future population growth along the Walla Walla River is likely to be limited due to the
prevalence of agricultural zoning and residential zoning district which require large
minimum lot sizes. Additional public access demand associated with tourism may occur
on the lower reaches of the river, which are closer to regional population centers and
where the river is large enough to support fishing and boating activities. These areas are
already served by federal facilities, and future improvements would be planned and
implemented by the USFWS.
6.4.4 Historic and Archeological Sites
While the land use pattern along the Walla Walla River contains a larger amount of
residential uses than some of the smaller streams discussed in this report, it does not
pass through any heavily urbanized areas, and it has relatively few documented historic
sites. Six sites are currently documented along the Walla Walla River, of which four are
bridges, one is a 1930’s single-family residence, and one is the Whitman Mission
National Historic Site, described in Section 6.4.3 above. The Walla Walla River is
regionally significant for agricultural uses, but it does not have a history as a

The Watershed Company/BERK/WWBWC September 2014
131
transportation route that would attract large concentrations of modern human
settlement. However, the river historically hosted a spring salmon that could have
attracted native peoples, and there is potential for undiscovered archaeological
resources in the shoreline environment.
6.5 Touchet River
6.5.1 Current Land Use
Based on Walla Walla County Assessor data for parcels completely or partially located
within shoreline jurisdiction, current land use along the Touchet River is
overwhelmingly agricultural in nature, represented on Exhibit 6-8 as resource
production and extraction. The next largest land use category is residential, which is
concentrated in the vicinity of the town of Touchet. Exhibit 6-8 shows a summary of land
use categories along the Touchet River.

Walla Walla County Shoreline Analysis Report
132
Exhibit 6-8. Current Land Use – Touchet River
*Unclassified land represents parcels for which the Walla Walla County Assessor has not assigned a land use category. Review of
aerial photography indicates that unclassified lands consist primarily of federally-owned land, Corps-managed dam and flood
control projects, and transportation and utility infrastructure.
Source: Walla Walla County Assessor, 2014.
Cultural, Entertainment & Recreational
3.170%
Manufacturing0.910%
Residential124.67
4%
Resource Production &
Extraction2896.75
92%
Undeveloped Land And Water
Areas74.06
2%
Services2.700%
Transportation, Communication,
And Utilities19.78
1%
Trade3.890%
Unclassified*15.23
0%
Government15.48
1%
Current Land Use Acres - Touchet River Shoreline Jurisdiction

The Watershed Company/BERK/WWBWC September 2014
133
Water-Oriented Uses
Water-dependent and water enjoyment uses along the Touchet River are limited due to
the almost exclusively agricultural nature of the area. Water-related uses include
pumping stations and water diversion structures for irrigation.
Transportation and Utilities
Transportation infrastructure in the Touchet River shoreline includes U.S. and State
highways, as well as county roads, local city streets, and private access roads. U.S. 12
crosses the river just west of the town of Touchet and crosses it again in Waitsburg. SR
124 parallels the river for approximately 15 miles before crossing it approximately 3
miles west of Waitsburg. SR 125 crosses the river at its junction with SR 124, just west of
Prescott. County roads and private roads provide access to agricultural and rural
residential development, and local city streets enter the shoreline environment where
the river passes through Waitsburg.
A Port of Columbia rail line crosses the river on a small bridge just south of Prescott and
roughly parallels the river eastward, periodically entering and leaving the shoreline
environment between Prescott and Waitsburg.
Utilities in the shoreline environment consist primarily of agricultural irrigation
infrastructure, overhead power transmission and distribution lines, and water lines
serving residential development. Some sewer or septic lines may cross the shoreline
environment in populated areas, such as Touchet and Waitsburg. The City of Waitsburg
Wastewater Treatment Plant, while not located in shoreline jurisdiction itself, discharges
its treated effluent to an infiltration wetland that lies partially within shoreline
jurisdiction in Reach 5.
6.5.2 Future Land Use
County zoning along the Touchet River is almost entirely Primary Agriculture (40 acres),
though the area near the town of Touchet has a concentration of Rural Residential (5
acres) zoning. Exhibit 6-9 shows County zoning acres by reach, as well as the percentage
of each reach occupied by each County zoning district.

Walla Walla County Shoreline Analysis Report
134
Exhibit 6-9. Touchet River Zoning by Reach
Source: Walla Walla Joint Community Development Agency, 2014.
Reach T3 includes a small area (less than 1 acre) within the Town of Prescott’s Urban
Growth Area that is zoned Public Reserve, but is otherwise zoned entirely Primary
Agriculture (40 acres). Reach T4 consists of areas within the Town of Prescott, where no
Town zoning information is currently available. However, County zoning maps show a
small area (approximately 1.18 acres) in the eastern portion of the Town limits where a
County zoning designation of Suburban Residential is applied. Based on the current
land use pattern, this reach is anticipated to remain agricultural in character.
Reaches T5, T6, T7 and T8 are within the City of Waitsburg and have City zoning
applied. Shoreline zoning in Waitsburg is primarily Residential, followed by Public
Lands and Commercial. The Residential and Commercial zones are designed to
accommodate development of those types, and the Public Lands zone is applied to all
286.57 ac
1381.13 ac
1189.86 ac
32.45 ac
74.53 ac
1.18 ac
119.78 ac
0% 20% 40% 60% 80% 100%
T1, Touchet Rural Residential
T2, Primary Agriculture
T3, Primary Agriculture, Hwy 124
T4, Prescott
T5, Waitsburg Treatment Plant
T9, East County
Touchet River Shoreline Jurisdiction - Current Zoning by Reach
Primary Agriculture 40 R-96 Suburban Residential Rural Residential 5
The Watershed Company/BERK/WWBWC September 2014
135
areas that are “public” in nature, regardless of whether they are owned by the City or a
private owner. The zone is intended to provide for civic facilities, establish the aesthetic
image of the city, and protect parks and open space. GIS data for City of Waitsburg
zoning was not available as of this writing, but an image of the City’s latest zoning map
is included for reference in Appendix D. Reach T9 consists of that unincorporated
portion of the Touchet River upstream of Waitsburg and is zoned exclusively Primary
Agriculture (40 acres).
Vacant properties in the unincorporated county along the Touchet River total
approximately 30 acres, of which 16 acres are covered by shoreline jurisdiction. These
vacant lots are concentrated near Prescott, Waitsburg, and the town of Touchet. Based
on allowed residential densities, these properties could generate up to 20 new shoreline
residences, though the number could be lower depending on individual project siting
and the amount of each parcel located in shoreline jurisdiction. In addition to vacant
properties, two properties in Reach T3 near Prescott zoned for suburban residential
development could potentially be subdivided to allow further development. Combined,
these two properties could generate up to 62 additional single-family lots, though a
relatively small portion of each lot is located in shoreline jurisdiction, so the majority of
these new residences would be located upland of the shoreline.
The City of Waitsburg contains 31 vacant shoreline properties along the Touchet River,
which could potentially be developed for residential, commercial, or industrial uses.
However, the Touchet River has an extensive floodplain in Waitsburg, and flood risks to
residents and businesses are high. As a result, FEMA is in the process of a voluntary
buy-out of many affected property owners, which is anticipated to limit future
development potential in this area.
6.5.3 Existing and Potential Public Access
Most of the land along the Touchet River is in private ownership, and public access is
currently limited. The only documented public access point is the city-owned Preston
Park in Waitsburg, consisting of approximately 9.6 acres on the south bank of the river.
Most of the shoreline is screened by vegetation at this location, but visual and physical
access is available. No trails or boat launch facilities are provided.
Future Public Access
Walla Walla County has not historically served as a provider of parks and open space,
and the County has not identified any locations on the Touchet River for future
acquisition and improvement. The Capital Facilities Element of the City of Waitsburg’s

Walla Walla County Shoreline Analysis Report
136
Comprehensive Plan, last updated in 2007, includes a planned trail along the Touchet
River levee at a cost of $11,000. No date for construction is provided.
The City of Waitsburg has also planned construction of a new park at the previous site
of a Northwest Grain Growers mill on the north side of the Touchet River, known as
Rankin Park. Construction is planned for 2014-15.
Potential Population and Future Tourism Demand
Based on the prevailing agricultural land use pattern and zoning, population growth
along the Touchet River is anticipated to be modest and concentrated in the
communities of Touchet, Prescott, and Waitsburg. Tourism opportunities along the river
are likewise limited, and the Touchet is unlikely to experience the same level of tourism-
oriented demand for public access as larger rivers, such as the Snake or Columbia.
6.5.4 Historic and Archeological Sites
The City of Waitsburg contains a historic district listed on the National Register of
Historic Places, a portion of which lies within shoreline jurisdiction. Historic properties
within shoreline jurisdiction include a historic gas station, an American Legion Hall, and
International Order of Odd Fellows Hall, a historic auto garage, and the Waitsburg
Bridge that crosses the Touchet River. None of these properties are currently listed on
the National Register of Historic Places.
The Touchet River is also designated as part of the Lewis and Clark National Historic
Trail. While no physical trail facilities are provided for modern hikers, both SR 124 and
U.S. 12 are part of the Lewis and Clark Auto Tour Route.
6.6 Mill Creek
6.6.1 Current Land Use
Mill Creek has the most varied land uses of all the SMA-regulated streams in Walla
Walla County. It is the most urbanized of the streams, even conveyed underground
through downtown Walla Walla, but it also includes very rural areas east and south of
the city as it crosses into Oregon. Resource production and extraction is the majority use,
but residential uses account for approximately 21% of the shoreline acreage. These uses
dominate in the area west of the City of Walla Walla, transitioning to more intense uses
within the city (manufacturing, commercial, higher-density residential). East of Walla
Walla, uses again become more rural. These areas are characterized by agriculture and
undeveloped land, though pockets of rural residential uses exist, such as Kooskooskie
Commons.

The Watershed Company/BERK/WWBWC September 2014
137
Existing land uses along Mill Creek are summarized in Exhibit 6-10 below.
Exhibit 6-10. Current Land Use – Mill Creek
*Unclassified land represents parcels for which the Walla Walla County Assessor has not assigned a land use category. Review of
aerial photography indicates that unclassified lands consist primarily of federally-owned land, Corps-managed dam and flood
control projects, and transportation and utility infrastructure.
Source: Walla Walla County Assessor, 2014.
Cultural, Entertainment & Recreational
29.692% Government
94.476%
Manufacturing4.800%
Residential314.77
22%
Resource Production &
Extraction851.80
58%
Services27.42
2%
Trade12.94
1%
Transportation, Communication,
& Utilities9.521%
Unclassified11.71
1%
Undevelopable Land6.630%
Undeveloped 95.96 ac
7%
Current Land Use Acres - Mill Creek Shoreline Jurisdiction
Walla Walla County Shoreline Analysis Report
138
Water-Oriented Uses
Water-dependent uses on Mill Creek include stormwater outfalls in urbanized areas
(Walla Walla and College Place UGA). The U.S. Army Corps of Engineers also maintains
a flood control diversion dam in Reach MC12. This dam regulates water levels in
Bennington Lake to the south and prevents flooding of downtown Walla Walla.
Water-enjoyment uses include several parks and open space areas, which are described
in detail in Section 6.6.4.
Due to the urbanized nature of Mill Creek’s shorelines in the Walla Walla area, a
number of non-water oriented uses, such as commercial and manufacturing uses, are
also present.
Transportation and Utilities
Transportation infrastructure in the Mill Creek shoreline environment includes U.S. and
state highways, county roads, local city streets, and private access roads. The largest
concentration of transportation infrastructure is in the City of Walla Walla and the
immediately surrounding areas. A major interchange of U.S. 12 and SR 125 is located in
northwestern Walla Walla, and SR 125 crosses the creek near the western city limits.
Stream crossings in Walla Walla are generally limited to highways, railroad bridges, and
major arterial streets. Crossings by local circulation streets, while providing access to
development in the shoreline environment, are limited, except in the downtown area,
where the stream has been routed underground. Outside Walla Walla, transportation
infrastructure on Mill Creek is limited to county roads and private access roads.
Mill Creek has two railroad crossings: one near its mouth on the Walla Walla River and
another in northwestern Walla Walla, where two rail lines merge and cross the creek
south of the U.S. 12/SR 125 junction. These lines travel north, providing rail access to
Prescott, Waitsburg, and communities in Columbia County.
Utilities in the Mill Creek shoreline environment include major urban utilities, such as
electric power, water, and sewer lines. In rural portions of the shoreline environment,
utilities consist of overhead power lines, irrigation intake structures, and possibly water
lines serving rural residential development.
6.6.2 Future Land Use
As shown in Exhibit 6-1 and 6-12, zoning along Mill Creek is diverse, including both
County and City zoning districts to accommodate both rural and urban development

The Watershed Company/BERK/WWBWC September 2014
139
patterns. The largest zoning category is Rural Residential – Mill Creek (5 acres),
concentrated in the stretch of the creek immediately west of Walla Walla. Rural Remote
(40 acres) zoning accounts for approximately 21% of the shoreline acres; this district is
concentrated in the southeastern portion of the county and is intended for remote areas
where county services are limited or unavailable. Agriculture Residential (10 acres)
zoning, intended to accommodate agricultural, residential, and limited tourism uses,
accounts for 17% of the shoreline acreage and is concentrated on the portion of the creek
west of Walla Walla and College Place near the confluence with the Walla Walla River.
Walla Walla County zoning districts are summarized in Exhibit 6-1, and City of Walla
Walla zoning districts are summarized in Exhibit 6-2.

Walla Walla County Shoreline Analysis Report
140
Exhibit 6-11. Mill Creek Walla Walla County Zoning by Reach
Source: Walla Walla Joint Community Development Agency, 2014.
254.53 ac
13.22 ac
2.40 ac
15.31 ac
3.08 ac
34.70 ac
105.78 ac 132.59 ac
62.99 ac
116.53 ac
97.02 ac
25.05 ac
8.09 ac 43.02 ac
372.56 ac
0% 20% 40% 60% 80% 100%
MC1, Garrett
MC2, Levee
MC3, Walla Walla UGA
MC11, Walla Walla UGA
MC12, Diversion Dam
MC13, Rural Residential
MC14, Kooskooskie
MC15, SE County
Mill Creek Shoreline Jurisdiction - Current County Zoning by Reach
Agriculture Residential 10 Exclusive Agriculture 120
Primary Agriculture 40 R-96 Suburban Residential
Rural Remote 20 Rural Remote 40
Rural Residential 5 Rural Residential Mill Creek 5
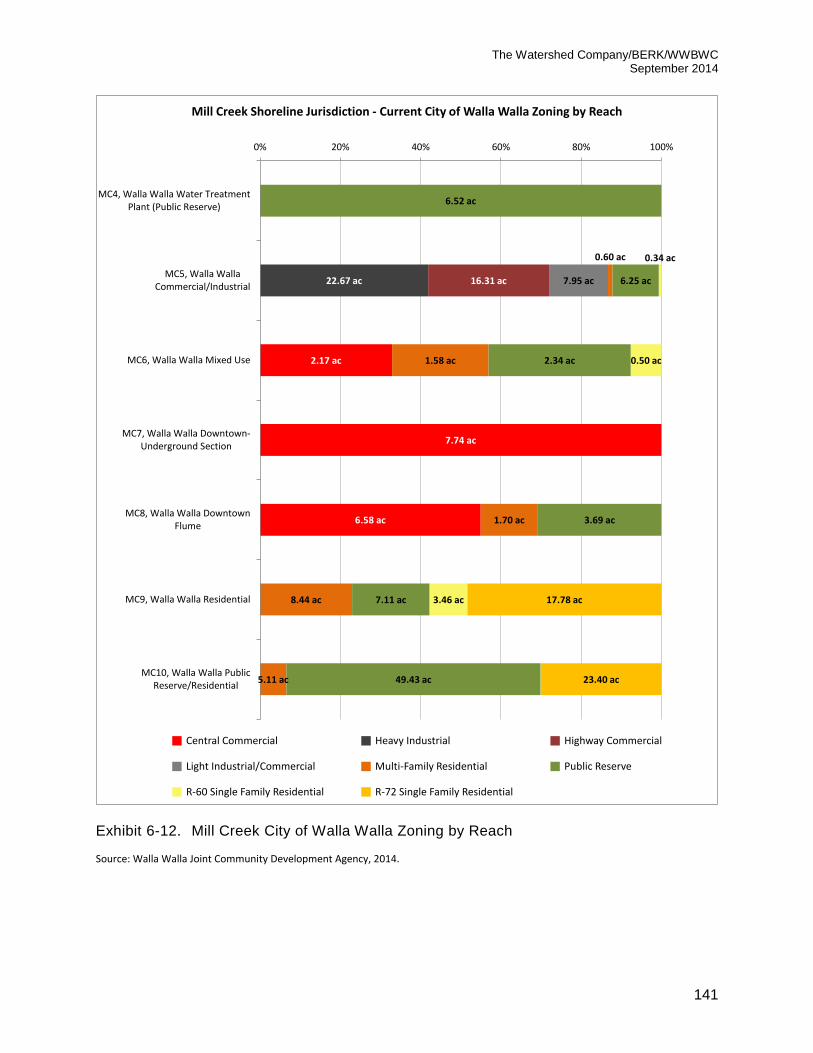
The Watershed Company/BERK/WWBWC September 2014
141
Exhibit 6-12. Mill Creek City of Walla Walla Zoning by Reach
Source: Walla Walla Joint Community Development Agency, 2014.
2.17 ac
7.74 ac
6.58 ac
22.67 ac 16.31 ac 7.95 ac
0.60 ac
1.58 ac
1.70 ac
8.44 ac
5.11 ac
6.52 ac
6.25 ac
2.34 ac
3.69 ac
7.11 ac
49.43 ac
0.34 ac
0.50 ac
3.46 ac 17.78 ac
23.40 ac
0% 20% 40% 60% 80% 100%
MC4, Walla Walla Water TreatmentPlant (Public Reserve)
MC5, Walla WallaCommercial/Industrial
MC6, Walla Walla Mixed Use
MC7, Walla Walla Downtown-Underground Section
MC8, Walla Walla DowntownFlume
MC9, Walla Walla Residential
MC10, Walla Walla PublicReserve/Residential
Mill Creek Shoreline Jurisdiction - Current City of Walla Walla Zoning by Reach
Central Commercial Heavy Industrial Highway Commercial
Light Industrial/Commercial Multi-Family Residential Public Reserve
R-60 Single Family Residential R-72 Single Family Residential

Walla Walla County Shoreline Analysis Report
142
Due the urbanized nature of much of its shoreline, Mill Creek has the highest potential
for additional development in the shoreline environment. Vacant parcels along Mill
Creek comprise approximately 211 acres, with 85 acres covered by shoreline jurisdiction.
As discussed above, zoning varies from reach to reach, and vacant properties could be
developed with a mix of single-family residential, multifamily residential, commercial,
and industrial uses.
Based on allowed residential densities, it is estimated that future development on
shoreline parcels could result in up to 80 new residences, concentrated mostly in the
City of Walla Walla. In areas outside the city, the number of residences located in
shoreline jurisdiction is likely to be greatly reduced due to larger parcel sizes that allow
for more flexibility in building siting. In Walla Walla, the smaller lot size pattern would
result in a larger proportion of these residences being located in shoreline jurisdiction.
In addition to vacant properties, 44 residential parcels on Mill Creek are large enough to
be subdivided, based on applied zoning requirements, thus potentially generating
additional residences. As with vacant properties, most of these lots are concentrated in
Walla Walla. Based on minimum parcel sizes for adopted residential zoning, subdivision
of these properties could result in the creation of up to 169 new lots, of which
approximately 59 would be covered by shoreline jurisdiction. The precise number of
new shoreline residences from subdivision would depend on lot and access road
configuration, as well as market factors, potentially reducing this number.
Vacant properties along Mill Creek zoned for commercial and industrial uses could also
experience future development, increasing the intensity of shoreline land use conditions.
Potential commercial and industrial development was estimated based on observed
FAR values for comparably zoned developed properties; as a general rule, FAR values
for particular development types in urban areas were higher than their rural
counterparts. Based on this information, it is estimated that future development of
vacant properties on Mill Creek could generate up to 137,600 square feet of commercial
and industrial space in shoreline jurisdiction. Most of this development potential is
concentrated in western Walla Walla, in Reach MC5.
6.6.3 Shoreline Permit History
Due to the rural nature of most of Walla Walla County, relatively few shoreline permits
have been issued in recent years. Records provided regarding shoreline permit history
cover a limited timeframe and provide limited information regarding the location or
precise nature of the permitted shoreline activity. For example, during the period 2008-
2010, Walla Walla County issued 18 shoreline permits. However, no information is
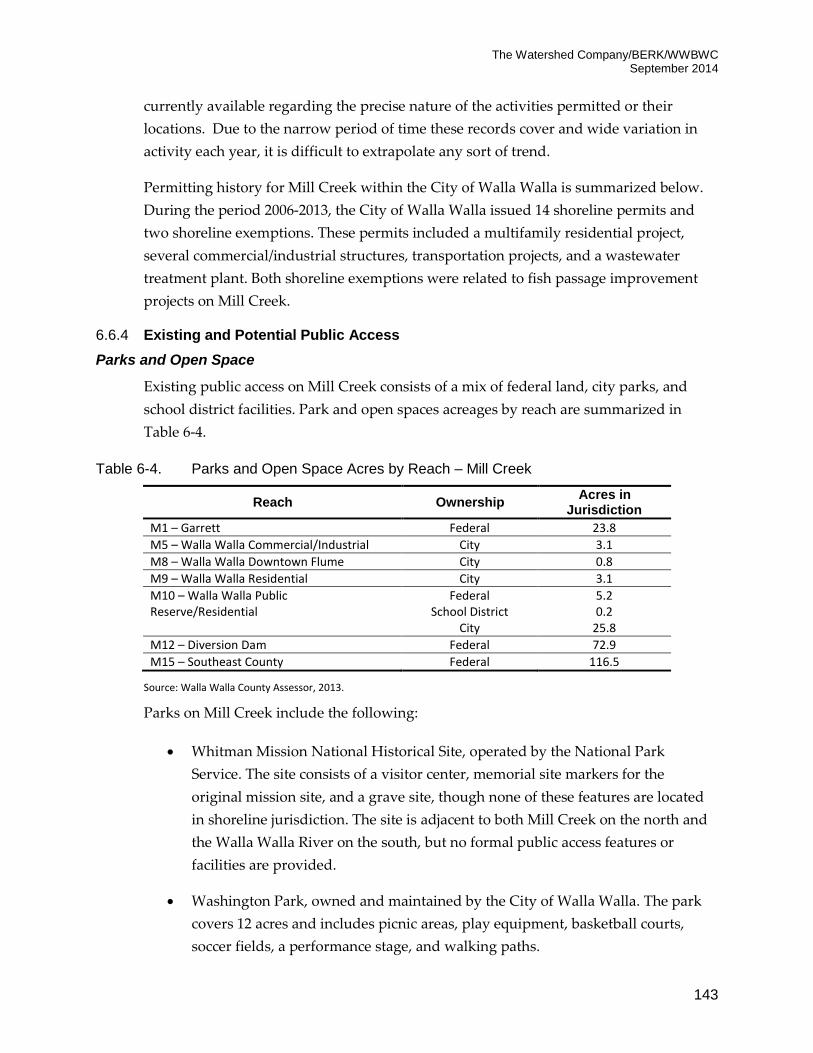
The Watershed Company/BERK/WWBWC September 2014
143
currently available regarding the precise nature of the activities permitted or their
locations. Due to the narrow period of time these records cover and wide variation in
activity each year, it is difficult to extrapolate any sort of trend.
Permitting history for Mill Creek within the City of Walla Walla is summarized below.
During the period 2006-2013, the City of Walla Walla issued 14 shoreline permits and
two shoreline exemptions. These permits included a multifamily residential project,
several commercial/industrial structures, transportation projects, and a wastewater
treatment plant. Both shoreline exemptions were related to fish passage improvement
projects on Mill Creek.
6.6.4 Existing and Potential Public Access
Parks and Open Space
Existing public access on Mill Creek consists of a mix of federal land, city parks, and
school district facilities. Park and open spaces acreages by reach are summarized in
Table 6-4.
Table 6-4. Parks and Open Space Acres by Reach – Mill Creek
Reach Ownership Acres in
Jurisdiction
M1 – Garrett Federal 23.8
M5 – Walla Walla Commercial/Industrial City 3.1
M8 – Walla Walla Downtown Flume City 0.8
M9 – Walla Walla Residential City 3.1
M10 – Walla Walla Public Reserve/Residential
Federal 5.2 School District 0.2
City 25.8
M12 – Diversion Dam Federal 72.9
M15 – Southeast County Federal 116.5
Source: Walla Walla County Assessor, 2013.
Parks on Mill Creek include the following:
Whitman Mission National Historical Site, operated by the National Park
Service. The site consists of a visitor center, memorial site markers for the
original mission site, and a grave site, though none of these features are located
in shoreline jurisdiction. The site is adjacent to both Mill Creek on the north and
the Walla Walla River on the south, but no formal public access features or
facilities are provided.
Washington Park, owned and maintained by the City of Walla Walla. The park
covers 12 acres and includes picnic areas, play equipment, basketball courts,
soccer fields, a performance stage, and walking paths.
Walla Walla County Shoreline Analysis Report
144
Wildwood Park, owned and maintained by the City of Walla Walla. The park
covers 6 acres and includes play equipment and a picnic shelter building.
Eastgate Lions Park, owned and maintained by the City of Walla Walla. The park
covers 12 acres and includes play equipment, a picnic shelter, and a basketball
court. The park is also the western terminus for the Mill Creek recreation trail.
Mill Creek Sports Complex, owned and operated by the City of Walla Walla. The
sports complex covers 50 acres and provides two soccer fields and three lighted
softball fields. The park is heavily used due to adult and youth league play.
Heritage Square is owned and operated by the City of Walla Walla. The park is
located on Main Street in downtown Walla Walla, between Spokane and Colville
Streets. A picnic shelter, playground equipment, and restrooms are available.
Mill Creek/Bennington Lake Recreation Area, managed by the U.S. Army Corps
of Engineers. This recreation area includes both Rooks Park on Mill Creek and
Bennington Lake to the south, described in Section 6.8. Rooks Park includes
group picnic areas with shelters, a playground, shower facilities, and access to
shoreline trails that connect to Bennington Lake.
Recreation: Boat Launches and Trails
No boat launch facilities are available on Mill Creek.
Trails on Mill Creek include the following:
Mill Creek Recreation Trail – A paved trail for pedestrians and bicyclists that
follows the Mill Creek from the City of Walla Walla’s Eastgate Lions Park to the
Corps-maintained Rooks Park at the Mill Creek diversion dam.
Bennington Lake Recreation Area Trail System – The Bennington Lake
Recreation Area is located primarily around Bennington Lake, but includes areas
along Mill Creek and provides access to a network of pedestrian, bicycle, and
equestrian trails, including the following:
Kingfisher Trail (1.7 miles)
Meadowlark Trail (2.6 miles)
Whitetail Trail (4.8 miles)

The Watershed Company/BERK/WWBWC September 2014
145
Future Public Access
Walla Walla County has not historically served as a provider of parks and open space,
and the County has not identified future improvements at any shoreline parks. The
Corps conducts ongoing maintenance and improvements of its facilities at the
Bennington Lake Recreation Area. The City of Walla Walla conducts ongoing
maintenance at its parks, but no shoreline park improvements have been identified for
the foreseeable future.
Several private developments are underway along the Mill Creek shoreline in
downtown Walla Walla that will provide public access. The recently completed Vue 22
condominium development includes a walking path along the creek, and a new
Courtyard Marriott hotel is under construction that will also provide public creek
access.
It is anticipated that additional opportunities for improved public access to the shoreline
will be identified as part of the SMP planning process.
Potential Population and Future Tourism Demand
Mill Creek is the most urbanized stream in Walla Walla County and passes through the
county’s largest population center. Future population growth in the Walla Walla area is
likely to drive additional demand for public access, as is Walla Walla’s role as a center of
regional wine and arts tourism, which is likely to continue for the foreseeable future.
Aside from the public parks and open space already identified on Mill Creek, the
majority of remaining shoreline land is privately owned, making the development of
new public access locations challenging. Future demand for public access to the
shoreline is therefore likely to take the form of increased use of existing shoreline parks
and open space areas.
6.6.5 Historic and Archeological Sites
The shoreline jurisdiction of Mill Creek has approximately 100 documented historic
sites, the greatest amount of all the SMA water bodies in Walla Walla County. Nearly all
of these historic properties are located in the City of Walla Walla, where Mill Creek
passes through the city’s downtown. The City of Walla Walla is the largest population
center in the county and has been a crossroads of the region for centuries, serving as a
traditional gathering place for native peoples and later as a military outpost after Euro-
American settlement of the area. Walla Walla boomed in the late 1800’s and early 1900’s
as wheat farming expanded in the surrounding countryside, and the city’s downtown
area retains many buildings from that time period. A number of these historic properties
are listed on the National Register of Historic Places, including the Walla Walla Post

Walla Walla County Shoreline Analysis Report
146
Office, the Electric Light Works Building, the Marcus Whitman Hotel, and the Liberty
Theater.
Outside the City of Walla Walla, historic sites on Mill Creek include, but are not limited
to, the following:
Swengle Road Bridge, located approximately one-half mile northeast of Mill
Creek’s discharge to the Walla Walla River.
The Whitman Mission National Historic Site, located approximately 6 miles west
of Walla Walla on U.S. 410.
Mill Creek Diversion Works Dike, located northeast of Walla Walla at the
diversion channel from Mill Creek to Bennington Lake.
Upper Mill Creek Dam, located in the far southeast portion of Mill Creek Reach
14, just north of the Oregon State Line.
6.7 Yellowhawk Creek
6.7.1 Current Land Use
Based on Walla Walla County Assessor data for parcels completely or partially located
within shoreline jurisdiction, the Yellowhawk Creek shoreline is characterized primarily
by resource production and extraction uses, mostly in the form of agriculture. The other
major land use category is residential development, representing approximately one-
quarter of the jurisdiction acreage. Current land use on Yellowhawk Creek is
summarized in Exhibit 6-3.

The Watershed Company/BERK/WWBWC September 2014
147
Exhibit 6-13. Current Land Use – Yellowhawk Creek
Source: Walla Walla County Assessor, 2014.
Residential26.26 ac
25%
Resource Production &
Extraction73.54 ac
70%
Transportation, Communication,
And Utilities1.72 ac
2%
Undeveloped 3.82 ac
3%
Current Land Use Acres - Yellowhawk Creek Shoreline Jurisdiction

Walla Walla County Shoreline Analysis Report
148
Water-Oriented Uses
Water-oriented uses on Yellowhawk Creek consist primarily of water diversion
structures for irrigation and drainage channels from agricultural fields. No dams, docks,
boat-launches, or parks are present on this portion of the creek.
Transportation and Utilities
Transportation infrastructure in the vicinity of Yellowhawk Creek includes one state
highway, several county roads, and a number of private access roads. SR 125 and Old
Milton Highway are the two major thoroughfares in the area, and both cross
Yellowhawk Creek via vehicular bridges.
Utilities along Yellowhawk Creek include the following:
Electrical power transmission lines along roads, specifically SR 125 and Old
Milton Highway, where they cross the creek.
Electrical power distribution lines to residential development along the creek.
6.7.2 Future Land Use
County zoning along Yellowhawk Creek consists of Rural Residential and Agricultural
Residential districts, as described below:
Rural Residential (5 acres) – Intended to accommodate large-lot rural residential
development, this zoning district covers 96.45 acres (89%) of the reach.
Agriculture Residential (10 acres) – Intended to accommodate agricultural,
residential, and limited tourism uses, this zoning district covers 12.45 acres (11%)
of the reach.
Exhibit 6-104 summarizes the zoning districts present on Yellowhawk Creek, including
the percentage of the reach covered by each zoning district.

The Watershed Company/BERK/WWBWC September 2014
149
Exhibit 6-104. Yellowhawk Creek Zoning by Reach
Vacant properties along Yellowhawk Creek comprise approximately 18 acres, of which
approximately 4 acres are covered by shoreline jurisdiction. These properties could
generate up to 9 new residences, though most of these properties have less than an acre
of area within shoreline jurisdiction. As a result, most of these new residences are not
likely to be located in shoreline jurisdiction.
6.7.3 Existing and Potential Public Access
Land ownership along the regulated portion of Yellowhawk Creek is entirely private,
with the exception of approximately 1.1 acres at the southwestern corner of the
intersection of Old Milton Highway and SR 125, which are owned by the State and are
currently undeveloped. While this land could potentially be used to provide access to
Yellowhawk Creek, immediately south of the property, the site is constrained by its
narrow configuration located adjacent to a five-lane highway.
No parks, dedicated open space, boat launches, or trails are currently present on
Yellowhawk Creek. The creek bank is heavily vegetated along most of its length, and the
creek offers few recreational opportunities. No significant increase in demand for public
12.45 ac 96.45 ac
0% 20% 40% 60% 80% 100%
YC1, Cottonwood Creek
Yellowhawk Creek Shoreline Jurisdiction - Current Zoning by Reach
Agriculture Residential 10 Rural Residential 5

Walla Walla County Shoreline Analysis Report
150
access along Yellowhawk Creek is anticipated in the foreseeable future, and the County
has planned no public access improvements for this stream.
6.7.4 Historic and Archeological Sites
Yellowhawk Creek is a relatively small stream, and, as a non-navigable waterway, the
presence of cultural resources is less likely than along larger water bodies, such as the
Columbia or Snake Rivers. No historic or archaeological sites have been documented in
the vicinity of Yellowhawk Creek.
7 SHORELINE MANAGEMENT RECOMMENDATIONS
The following are recommended actions for translating inventory and characterization
findings into the draft SMP policies, regulations, environment designations, and
restoration strategies for areas within shoreline jurisdiction. In addition to the following
analysis-specific recommendations, the updated SMP(s) will incorporate all other
requirements of the Shoreline Management Act (RCW 90.58) and the Shoreline Master
Program Guidelines (WAC 173-26).
7.1 Environment Designations
As outlined in WAC 173-26-191(1)(d), “Shoreline management must address a wide
range of physical conditions and development settings along shoreline areas. Effective
shoreline management requires that the shoreline master program prescribe different
sets of environmental protection measures, allowable use provisions, and development
standards for each of these shoreline segments.” In WAC 173-26-211(2)(a), the
Guidelines further direct development and assignment of environment designations
based on “existing use pattern, the biological and physical character of the shoreline,
and the goals and aspirations of the community as expressed through comprehensive
plans…”
It is difficult to describe a methodology for environment designation recommendations
as there are very few firm rules. In general, the environment designation purpose and
criteria will be utilized and further informed by the findings of this Shoreline Analysis
Report, including the following GIS data:
Current land use
Planned land use
The Watershed Company/BERK/WWBWC September 2014
151
Ownership
Wetlands
Floodplains
Vegetation
Impervious surface
Ecological functions (as described in this report)
While current and future land use designations provide the basic context for a given
segment of land, recommended environment designations will not always correlate
strongly with those parameters, particularly on currently undeveloped shoreline areas
and shoreline areas with extensive critical areas (e.g., wetlands, floodways, channel
migration zones, other geologically hazardous areas). This may also be the case where
parcels are large, and extend well beyond shoreline jurisdiction. For example, while the
current land use code may indicate a single-family residential land use designation, the
actual existing use may not be in shoreline jurisdiction and a more conservative
designation could be appropriate to correspond with existing conditions in shoreline
jurisdiction.
In the above situations, vegetation (including identification of wetlands) and impervious
surface data, as well as the ecological function results, may provide better indicators of
the existing alteration level in shoreline jurisdiction. For this reason, all or portions of
parcels that have a current or planned land use designation of residential (or other
designation allowing alteration) may ultimately have a more protective shoreline
environment designation if the ecological functions are considered high and
examination of aerial photos and specific data layers provides additional support. In
these cases, the parcels can still accommodate the existing or planned uses, perhaps even
in shoreline jurisdiction, and satisfy the WAC requirements for consistency between the
environment designations and the Comprehensive Plans (see WAC 173-26-211(3) for
additional detail about consistency requirements).
In more developed areas, current land use designation will be more strongly correlated
with level of alteration and the resulting environment designation. In these areas, often
the entire parcel or a large portion of the parcel is in shoreline jurisdiction, and the
allowed level of development may already have occurred
The County’s current Shoreline Management Master Plan utilizes a system of four
environment designations: Urban, Rural, Conservancy, and Natural. Similarly, the cities
of Walla Walla and Waitsburg also use the same designation system.

Walla Walla County Shoreline Analysis Report
152
Urban: The Urban environment is an area of high intensity land-use including
residential, commercial, recreational and industrial development. It is
particularly suitable to those areas presently subjected to extremely intensive use
pressure, as well as areas planned to accommodate urban expansion, primarily
utilized in the cities of Walla Walla and Waitsburg.
Rural: The Rural environment is intended for those areas characterized by
intensive agriculture and recreational uses and those areas having a high
capability to support active agricultural practices and intensive outdoor
recreational development. This applies to most of the unincorporated areas of
the County with ongoing uses.
Conservancy: The Conservancy environment is intended for very low intensity
land uses and larger acreages with relatively low land values.
Natural: The Natural environment is characterized by the presence of some
unique natural or cultural features considered valuable in their natural or
original condition which are relatively intolerant of intensive human use.
The County’s shoreline environment designation map has not been modified since it
was originally developed in the mid-1970s, and thus the environment designation
assignments no longer provide the best fit with the existing biological and land use
character and are not compatible with current digital formats.
The Guidelines recommend use of six unique environments: Aquatic, Natural, Urban
Conservancy, Rural Conservancy, Shoreline Residential, and High Intensity. Urban
Conservancy, Shoreline Residential, and High Intensity are each intended by the
Guidelines to be applied only in Cities and Towns, UGAs, and intensely developed rural
areas. However, each jurisdiction may use “alternative” environment designations, as
appropriate, as long as they provide equal or better protection than the standard.
The findings of this Analysis Report would support development of several alternative
designations to supplement the Guidelines system as follows:
Consider development of a specific “Rural Industrial” designation to allow for
special consideration of the unique water-oriented industrial, commercial,
transportation, and power production developments on both the Snake and
Columbia Rivers.
The Watershed Company/BERK/WWBWC September 2014
153
Consider development of an “Agriculture” designation to accommodate unique
agricultural industrial activities (e.g. diversions), as well as recognize the
community’s economic and cultural connection to this important land use.
Consider development of a “Flood Control” designation for Mill Creek in the
City of Walla Walla to simplify development of unique standards and allowed
uses that may be appropriate in this distinct and highly altered environment.
The County and cities are required to include an Aquatic environment
designation for areas below the OHWM. Per the Guidelines, the purpose is to
“protect, restore, and manage the unique characteristics and resources of the
areas waterward of the ordinary high-water mark.”
The County and Cities should consider how to designate any potentially associated
wetlands, especially any associated wetlands which extend beyond the minimum 200-
foot shoreline jurisdiction. Some options include applying a universal shoreline
environment designation (e.g. Conservancy or Natural) to all associated wetlands or
applying the shoreline environment designation which is immediately adjoining the
wetland
7.2 General Policies and Regulations
7.2.1 Archaeological and Historic Resources
The findings of this Shoreline Analysis Report do not suggest a need for
additional regulations beyond those mandated by the SMP Guidelines.
7.2.2 Critical Areas
The County and Cities should consider whether their critical areas regulations
should be incorporated into the SMP by reference or through direct inclusion.
Either method of incorporation will require modification of the County’s and
Cities’ critical areas regulations to different degrees as they apply in shoreline
jurisdiction to meet SMA criteria. For example, any exceptions, such as
reasonable use, will need to be removed as the appropriate SMA process for such
action is through the Shoreline Variance.
The County and Cities will need to evaluate whether the existing critical area
buffer protections are sufficient to protect their functions and values and achieve
no net loss.
o In the County, critical areas regulations establish recommended buffers
for most shoreline streams of 100 feet. Yellowhawk Creek between the
Walla Walla River and Cottonwood Creek has a 50-foot buffer.

Walla Walla County Shoreline Analysis Report
154
o The City of Walla Walla’s regulations require a 35-foot buffer on Mill
Creek between Gose St. and the Bennington Lake diversion dam.
o The City of Waitsburg’s regulations require a 25-foot buffer on the
Touchet River.
o The City of Prescott critical area regulations were not available for review
at this time.
Overall, these regulations will need to be revisited to assess if changes are
needed to recognize existing shoreline conditions and to accommodate water-
oriented and other preferred uses consistent with no net loss of ecological
functions (as required by WAC 173-26-221(2)(a)(ii)). In particular, the existing
stream buffers are not environment designation- or waterbody-based, which
indicates that they may need to be further customized to accomplish these
objectives.
Wetlands regulations will need to be reviewed carefully to ensure consistency
with the latest Ecology guidance.
7.2.3 Flood Hazard Reduction
Several areas have experienced severe floods in the past. Consistent with the
WAC provisions in the Guidelines, the SMP(s) should provide flexibility for
developing and maintaining flood hazard reduction measures as needed to
continue protection of existing uses. Emphasis should be given to maintaining
existing ecological functions, at a minimum, through Ecology’s no net loss
criteria.
7.2.4 Public Access
The majority of public shoreline access across Walla Walla County is provided
and managed by a variety of entities, including the U.S. Army Corps of
Engineers, USFWS, Port of Walla Walla and the Washington Department of Fish
and Wildlife.
Walla Walla County has not historically served as a provider of parks and open
space, and the County has not identified future improvements at any shoreline
parks. It is anticipated that any additional opportunities for improved public
access to the shoreline will be identified as part of the SMP planning process.
The County and Cities should consider providing policies and regulations that:
o recognize and facilitate implementation of existing parks, recreation, and
open space plans (e.g. the City of Waitsburg’s plan to construct Rankin
Park along the north side of the Touchet River);

The Watershed Company/BERK/WWBWC September 2014
155
o provide public access, as feasible and where public safety would allow, in
new commercial, industrial and multi-family development as well as any
future publicly sponsored or financed utility and flood control facilities;
o recognize informal shoreline access points (e.g. fishing access at southern
portion of Columbia River) and attempt to create formal public access
opportunities that address these needs and prevent improper use of the
shoreline that may interfere with adjacent uses; and
o promote visual access where physical access is not feasible.
7.2.5 Shoreline Vegetation Conservation
As noted above under Critical Areas, the County and Cities should review the
existing protections provided in the critical areas regulations, paying special
attention to measures that will promote retention of shoreline vegetation,
replacement of invasive vegetation with native vegetation, and development of a
well-functioning shoreline which provides both physical and habitat processes.
Consider development of specific buffer and/or setback strategies that meet
requirements for environmental protection and recognition of local conditions.
These may include variations between County/City-specific areas, environment
designations, and/or waterbodies.
Ensure that vegetation provisions allow for appropriate modifications to
accommodate preferred uses, particularly important agriculture modifications,
water-dependent or –related port developments, other water-oriented uses, and
public access and recreation.
7.2.6 Water Quality, Stormwater, and Nonpoint Pollution
As noted in several waterbodies throughout the County (e.g. Snake River,
Touchet River, Mill Creek), water quality parameters such as bacteria levels, pH,
temperature, and dissolved oxygen, are exceeding State standards. The County
and Cities should consider incorporating regulations to facilitate maximum
implementation of TMDL plans, and controlling introduction of 303(d)-listed
pollutants for which TMDLs have not yet been prepared.
Consider adding clarifying statements noting that the policies of the SMPs are
also policies of the comprehensive plans and that the policies also apply to
activities outside shoreline jurisdiction that affect water quality within shoreline
jurisdiction. However, the regulations apply only within shoreline jurisdiction.

Walla Walla County Shoreline Analysis Report
156
7.3 Shoreline Modification Provisions
7.3.1 Shoreline Stabilization
The presence of existing stabilization related to transportation infrastructure (e.g.
railroads and highways) or existing water-dependent uses will continue to be
maintained in the years ahead. For the updated SMPs, ensure that proper
reference is given to appropriate exemptions found in the WAC related to
“normal maintenance and repair.” These are not exemptions from the
regulations, however; they are exemptions from a Shoreline Substantial
Development Permit.
Ensure “replacement” and “repair” definitions and standards are consistent with
WAC 173-26-231(3)(a). Repair activities should be defined to include a
replacement threshold so that applicants and staff will know when
“replacement” requirements need to be met.
The County and Cities should include policies and regulations which promote
"soft" over "hard" shoreline stabilization measures. Incentives should be
included in the SMP that would encourage modification of existing armoring,
where feasible, to improve habitat while still maintaining any necessary site use
and protection.
Consider requiring a Conditional Use Permit for any new hard shoreline
stabilization, at least in certain environment designations.
7.3.2 Piers and Docks
There do not appear to be any private residential pier or dock structures in Walla
Walla County which are associated with boat moorage. If that is the case,
standards for such residential moorage structures may not be needed.
Overwater structures associated with residential uses, which are used for
viewing or other recreational access, such as swimming and fishing, are present
along various waterbodies, including upper Mill Creek (e.g. Kooskooskie
Commons). The County (and Cities, if appropriate), should consider providing
dimensional requirements, if allowed.
For other types of uses, such as commercial, industrial, and public recreational, it
may not be appropriate to have defined dimensional requirements but rather
standards which emphasize that these uses should rely on mitigation sequencing
to develop an appropriate design.
Similar to the recommendation under Shoreline Stabilization, the County (and
Cities, if appropriate) should ensure repair activities are defined to include a

The Watershed Company/BERK/WWBWC September 2014
157
replacement threshold so that applicants and staff will know when
“replacement” requirements need to be met.
7.3.3 Fill
Restoration fills can benefit shoreline functions and should be encouraged,
including improvements to shoreline habitats, material to anchor LWD
placements, and as needed to implement shoreline restoration. For example, the
filling of rip-rapped shoreline areas along the Snake River with previously
dredged material to fill interstitial spaces often used by non-native fish species
which prey on juvenile salmon.
Fills waterward of the OHWM to create developable land should be prohibited.
7.3.4 Breakwaters, Jetties, Groins and Weirs
Breakwaters, jetties and groins are not prevalent in Walla Walla County. The
County and Cities could consider prohibiting new breakwaters, jetties, and
groins, except where they are essential to restoration or maintenance of existing
water-dependent uses.
Weirs have been commonly used in many streams and small rivers in the County
to control stream flow and improve fish passage, including use by the Walla
Walla County Conservation District. As such, the County and Cities should
consider continuing to allow the use of weirs for such purposes.
7.3.5 Dredging and Dredge Material Disposal
In the County, dredging to maintain active navigation channels, moorage
facilities, and docking areas, is expected to continue. The County should
consider providing standards as necessary so these activities can continue.
As noted above under “Fill,” the re-use of dredge material along the Snake River
for the purposes of filling interstitial spaces in rip-rapped shorelines should be
allowed.
Except for purposes of shoreline restoration, flood hazard reduction, and
maintenance of existing legal moorage and navigation, the Cities should consider
prohibiting these modifications.
7.3.6 Shoreline Habitat and Natural Systems Enhancement Projects
Consider incentives to encourage restoration projects, particularly in areas
identified as having lower function. For example, allow modification of
impervious surface coverage, density, height, or setback requirements when
paired with significant restoration. Emphasize that certain fills, such as

Walla Walla County Shoreline Analysis Report
158
streambed gravels or material to anchor logs, can be an important component of
some restoration projects.
7.4 Shoreline Uses
7.4.1 Agriculture
Maintenance of existing agriculture is commercially and culturally important to
Walla Walla County. This should be recognized in shoreline policies.
The findings of this Shoreline Analysis Report do not suggest a need for
additional regulations beyond those mandated by the SMP Guidelines.
Given the prevalence of agricultural uses, the County and Cities should consider
allowing low-intensity agricultural uses in the Natural environment per WAC
173-26-211(5)(a)(ii)(E).
7.4.2 Aquaculture
There are no known aquaculture uses within Walla Walla County, including
hatcheries. However, future aquaculture activities may occur. The County and
Cities should ensure that any salmon recovery-related aquaculture activities are
facilitated in the aquatic and appropriate upland environments.
7.4.3 Boating Facilities
Walla Walla County includes a variety of boating facilities, including port uses
and park boat moorage and launching facilities. Regulations for the over- and
in-water components should be developed to provide applicants with as much
predictability as possible, while still allowing for an appropriate amount of
flexibility based on site-specific conditions and use-specific needs.
Public access should be included as components of new marinas or expansions,
where feasible.
7.4.4 Commercial Development
There is minimal commercial use in unincorporated Walla Walla County along
the shorelines. However, the County should allow existing commercial uses to
continue and identify criteria for where future commercial uses may be
appropriate by providing clear priority for water-oriented uses.
Consider incentives to attract water-oriented uses in appropriate locations along
the shoreline.
Public access should be included as a component of new non-water oriented
commercial uses, where feasible.
The Watershed Company/BERK/WWBWC September 2014
159
Ensure water-dependent uses are not restricted by other regulatory
setbacks/buffers.
Support the efforts by the Cities of Waitsburg and Walla Walla to provide for
commercial development along the Touchet River and Mill Creek, respectively.
7.4.5 Forest Practices
In the County, provide general policies and regulations for forest practices
according to the SMP Guidelines. As provided for in WAC 173-26-241(3)(e), the
master program should rely on the Forest Practices Act for regulation of
commercial forestry. There are, however, specific limits on clear cutting
provided in RCW 90.58.150 which must be included. Exceptions to this standard
should be by conditional use review.
The SMP standards should apply to Class IV General Forest Practices within the
County where shorelines are being converted to non-forestry uses.
Consider prohibiting this use for the Cities.
7.4.6 Industry
The County should support the Port’s efforts to retain existing and attract new
water-oriented industrial uses in appropriate locations.
The County (and Cities where appropriate) should recognize current industrial
uses and consider incentives to attract water-oriented uses in appropriate
locations along the shoreline.
Recognize and allow existing and new industrial uses (e.g. grain silos), that serve
the County’s agriculture industry, provided they are developed and operated
consistent with the Guidelines and other County and State requirements.
7.4.7 In-stream Structural Uses
Large-scale in-stream structures intended to produce energy and/or moderate
flooding are found in Walla Walla County. There are also a number of irrigation
diversion and discharge structures in many waterbodies. Regulations need to
accommodate anticipated new diversion structures, and repair/maintenance and
possible expansion of existing projects.
7.4.8 Mining
Very little mining actively occurs within Walla Walla County. The County and
the City of Walla Walla should consider policies which emphasize locating new
mining away from shorelines, floodplains, and streams.
The Cities of Prescott and Waitsburg could consider prohibiting mining.

Walla Walla County Shoreline Analysis Report
160
7.4.9 Recreational Development
Recognizing that Walla Walla County has not historically served as a provider of
parks and open space, include appropriate provisions for existing and potential
recreational uses, including boating, swimming, and fishing for both the County
and Cities.
Work with local, state and federal parks departments; Army Corps of Engineers;
and Port officials to ensure consistency between shoreline policies and
regulations and long-term parks management plans.
Policies and regulations related to parks management should provide clear
preferences for shoreline restoration consistent with public access needs and
uses.
New shoreline access should be located and designed to maintain ecological
functions.
7.4.10 Residential Development
Residential uses in the unincorporated County are generally not concentrated in
shoreline areas. Where proposed, residential development should proceed in a
manner consistent with the control of pollution and prevention of damage to the
shoreline environment.
In the Cities and areas of more intense development, recognize current and
planned shoreline residential uses with adequate provision of services and
utilities as appropriate to allow for shoreline ecological protection.
For the County and Cities, incorporate clear dimensional criteria for residential
development, including setbacks/buffers, lot coverage, height limits, etc.
Include provisions which ensure that new development, including the creation
of new lots, would not require new shoreline stabilization. New primary and
accessory residential structures should be located far enough from the shoreline
to prevent such a need.
For residential subdivisions that create five or more lots, consider how to create
public or community access opportunities to the shoreline, as stipulated by the
WAC Guidelines.
7.4.11 Transportation and Parking
Given the prevalence of transportation infrastructure within or near shorelines,
the County and Cities should allow for maintenance and improvements to
existing roads, railroads and parking areas, and for necessary new roads and
parking areas where other locations outside of shoreline jurisdiction are not
feasible.

The Watershed Company/BERK/WWBWC September 2014
161
Within the City of Walla Walla, promote additional trail connections consistent
with local and regional plans.
7.4.12 Utilities
The County and Cities should:
o allow for maintenance and improvements to existing utility facilities; and
o ensure that location of new utilities considers alternatives to location
within shoreline jurisdiction and provide performance standards for
necessary new utilities where other locations outside of shoreline
jurisdiction are not feasible.
7.5 Restoration Plan
A Restoration Plan document will be prepared at a later phase of the Shoreline Master
Program update process, consistent with WAC 173-26-201(2)(f). The Shoreline
Restoration Plan will address the following six subjects (WAC 173-26-201(2)(f)(i-vi)) and
incorporate findings from this Shoreline Analysis Report:
(i) Identify degraded areas, impaired ecological functions, and sites with potential for
ecological restoration;
(ii) Establish overall goals and priorities for restoration of degraded areas and impaired
ecological functions;
(iii) Identify existing and ongoing projects and programs that are currently being implemented,
or are reasonably assured of being implemented (based on an evaluation of funding likely in
the foreseeable future), which are designed to contribute to local restoration goals;
(iv) Identify additional projects and programs needed to achieve local restoration goals, and
implementation strategies including identifying prospective funding sources for those
projects and programs;
(v) Identify timelines and benchmarks for implementing restoration projects and programs and
achieving local restoration goals; and
(vi) Provide for mechanisms or strategies to ensure that restoration projects and programs will
be implemented according to plans and to appropriately review the effectiveness of the
projects and programs in meeting the overall restoration goals.
The Restoration Plan will “include goals, policies and actions for restoration of impaired
shoreline ecological functions. These master program provisions should be designed to

Walla Walla County Shoreline Analysis Report
162
achieve overall improvements in shoreline ecological functions over time, when
compared to the status upon adoption of the master program.” The Restoration Plan
will mesh opportunities identified in this report with additional projects, regional or
local efforts, and programs of each jurisdiction, watershed groups, and environmental
organizations that contribute or could potentially contribute to improved ecological
functions of the shoreline.

The Watershed Company/BERK/WWBWC September 2014
163
8 REFERENCES
Anderson Perry & Associates, Inc. 2010. Wetland Delineation Report for Burbank Business Park
Wastewater Project Walla Walla County, Washington.
Barker, R.A. and Mac Nish, R.D. 1976. Digital Model of The Gravel Aquifer, Walla Walla River
Basin, Washington and Oregon: Washington Department of Ecology, Water-Supply
Bulletin 45, 56 p, 1 plate.
Beeson, M.H., Fecht, K.R., Reidel, S.P., and Tolan, T.L. 1985. Regional correlations within the
Frenchman Springs Member of the Columbia River Basalt Group - new insights into
middle Miocene tectonics of northwestern Oregon: Oregon Geology, v. 47, no. 8, p. 87-96.
Bottom, D. L., D. A. Jay, C. A. Simenstad, J. Burke, A. M. Baptista, D. A. Jay, K. K. Jone, and and
M. H. S. Edmundo Casillas. 2005. Salmon at river’s end : the role of the estuary in the
decline and recovery of Columbia River salmon. U.S. Department of Commerce, NOAA
Technical Memo NMFS-NWFSC 68:246.
Burns, B., Powers, P. Waterfall Enginerring, LLC, Bates, K.K., and Kidder, J. Chinook
Enginnering. 2009. Mill Creek Fish Passage Assessment. Final Report, produced for Tri
State Steelheaders. Walla Walla, WA.
Camp, V.E., Ross, M.E., and Hansen, W.L. 2003. Genesis of flood basalt flows and basin and
range volcanic rocks from the Steens Mountains to Malheur River Gorge, Oregon:
Geological Society of America Bulletin, v. 115, p. 105-128.
Fecht, K.R., Reidel, S.P., and Tallman, A.M., 1987, Paleodrainage of the Columbia River system
on the Columbia Plateau of Washington State - a summary, in, Shuster, J.E., ed., Selected
papers on the geology of Washington State: Washington Department of Natural Resources,
Division of Geology and Earth Resources Bulletin 77, p. 219-248.
Google Inc. 2014. Google Earth. (2013). [Software].
Higgins, J. L. 2003. Determination of upstream boundary points on southeastern Washington
streams and rivers under the requirement of the Shoreline Management Act of 1971. U.S.
Geological Survey Water-Resources Investigations Report 03-4042:18.
Interfluve. 2013. Columbia River Shoreline Project Identification. Mainstem Columbia River:
Klickitat Lead Entity Area. Pp. 31. Prepared for Mid–Columbia FEG.

Walla Walla County Shoreline Analysis Report
164
Jiménez, A. C.P. 2012. Managed Artificial Aquifer Recharge and Hydrological Studies in the
Walla Walla Basin to Improve River and Aquifer Conditions. Oregon State University:
Water Resources Engineering, Ph.D. Dissertation.
Kuttel, M. 2002. Salmonid Habitat Limiting Factors Water Resource Inventory Areas 33 (Lower)
and 35 (Middle) Snake Watersheds, and Lower Six Miles of the Palouse. Washington State
Conservation Commission.
Lindsey, K.A. 1996. The Miocene to Pliocene Ringold Formation and associated deposits of the
ancestral Columbia River system, south-central Washington and north-central Oregon.
Washington Department of Natural Resources, Division of Geology and Earth Resources
Open- File Report 96-8.
Lindsey, K.A., and Tolan, T.L. 2004. Alluvial stratigraphy, distal sources, and induration in
suprabasalt sediments in the Walla Walla Basin, Washington and Oregon – revisiting and
revising a layer-cake stratigraphic model: Geological Society of America Abstracts with
Programs, v. 36, no. 4, p. 78.
Lindsey, K.A., and Tolan, T.L. 2007. Geologic Setting of the Miocene (?) to Recent Suprabasalt
Sediments of the Walla Walla Basin, Southeastern Washington and Northeastern Oregon:
Prepared for the Walla Walla Basin Watershed Council and Washington Department of
Ecology. p.143.
Mac Nish, R.D., Myers D.A, and Barker, R.A. 1973. Appraisal of Ground-water Availability and
Management Projections Walla Walla River Basin, Washington and Oregon: Washington
Department of Ecology, Water-Supply Bulletin 37, 36 p.
Marriott, D. 2002. Lower Columbia River and Columbia River Estuary Subbasin Summary. Pp.
Northwest Power Planning Council.
National Marine Fisheries Service (NMFS). 2009. Middle Columbia River Steelhead Distinct
Population Segment ESA Recovery Plan.
Neal, V. 1972. Physical aspects of the Columbia River and its Estuary. Pp. pp. 19–70 in A. T.
Pruter and D. L. Alverson, editors. The Columbia River Estuary and Adjacent Ocean
Waters: Bioenvironmental Studies. University of Washington Press, Seattle.
Newcomb, R.C. 1965. Geology and ground-water resources of the Walla Walla River Basin,
Washington and Oregon: Washington Department of Conservation, Division of Water
Resources Water-Supply Bulletin 21, 151 p, 3 plates.
The Watershed Company/BERK/WWBWC September 2014
165
Northwest Power Planning Council (NPPC). 2001a. Draft Walla Walla Subbasin Summary.
Prepared August 3, 2001. 125 pp.
Northwest Power Planning Council (NPPC). 2001b. Draft Lower Snake Subbasin Summary.
Prepared August 3, 2001. 158 pp.
Pomeroy Conservation District. 2004. Lower Snake Mainstem Subbasin. Pp. 195.
Reidel, S.P., Fecht, K.R., Hagood, M.C., and Tolan, T.L.. 1989a. The geologic evolution of the
central Columbia Plateau, in, Reidel, S.P., and Hooper, P.R., eds., Volcanism and tectonism
in the Columbia River flood-basalt province: Geological Society of America Special Paper
239, p.247-264.
Reidel, S.P., Tolan, T.L., Hooper, P.R., Beeson, M.H., Fecht, K.R., Bentley, R.D., and Anderson,
J.L.. 1989b. The Grande Ronde Basalt, Columbia River Basalt Group - stratigraphic
descriptions and correlations in Washington, Oregon, and Idaho, in, Reidel, S.P., and
Hooper, P.R., eds., Volcanism and tectonism in the Columbia River flood-basalt province:
Geological Society of America Special Paper 239, p. 21-53.
Schuster, J.E. 1994. Geologic map of the Walla Walla 1:100,000 quadrangle, Washington:
Washington Department of Natural Resources, Division of Geology and Earth Resources
Open- File Report 94-3, 18 p., 1 plate.
Simenstad, C. A., J. L. Burke, J. E. O’Connor, C. Cannon, D. W. Heatwole, M. F. Ramirez, I. R.
Waite, T. D. Counihan, K. L. Jones, and and K. L. J. Charles A. Simenstad, Jennifer L.
Burke, Jim E. O’Connor, Charles Cannon, Danelle W. Heatwole, Mary F. Ramirez, Ian R.
Waite, Timothy D. Counihan. 2011. Columbia River Estuary Ecosystem Classification —
Concept and Application. Pp. 54 U.S. Geological Survery Open-File Report.
Snake River Salmon Recovery Board. 2011. Snake River Salmon Recovery Plan for Southeast
Washington.
Snake River Salmon Recovery Board. 2012. Snake River Salmon Recovery Regional Provisional
3 Year Work Plan.
Swanson, D.A., Anderson, J.L., Bentley, R.D., Camp, V.E., Gardner, J.N., and Wright, T.L.. 1979.
Reconnaissance geologic map of the Columbia River Basalt Group in Washington and
adjacent Idaho: U.S., Geological Survey Open-File Report 79-1363, scale 1:250,000.
Swanson, D.A., Anderson, J. L., Camp, V.E., Hooper, P.R., Taubeneck, W.H., and Wright, T.L.
1981. Reconnaissance geologic map of the Columbia River Basalt Group, northern Oregon
and western Idaho: U.S. Geological Survey Open-File Report 81-797, scale 1:250,000.

Walla Walla County Shoreline Analysis Report
166
Tolan, T.L., Reidel, S.P., Beeson, M.H., Anderson, J.L., Fecht, K.R., and Swanson, D.A.1989.
Revisions to the estimates of the areal extent and volume of the Columbia River Basalt
Group, in, Reidel, S.P. and Hooper, P.R., eds., Volcanism and Tectonism in the Columbia
River Flood-Basalt Province: Geological Society of America Special Paper 239, p. 1-20.
US Army Corps of Engineers. 2012. McNary Shoreline Managment Plan.
http://www.nww.usace.army.mil/Portals/28/docs/programsandprojects/msmp/MSMP-
Final_121211.pdf. Accessed March 20, 2014.
US Army Corps of Engineers and WA Department of Ecology. 2012. Memorandum of
Understanding Signed 7.24.12 Regarding Mill Creek Flow Diversion.
Walla Walla Basin Watershed Council. 2013. Walla Walla Basin Aquifer Recharge Strategic Plan.
Walla Walla Watershed Planning Unit (WWWPU) and Walla Walla Basin Watershed Council
(WWBWC). 2004. Walla Walla Subbasin Plan.
Ward, D., S. Barnes, G. Rimbach, K. Bevis, J. Feen, P. Hoffarth, J. Jacobson, D. Larsen, J. Tabor,
M. Vander Hagen, R. Woodin, M. Gildersleeve, H. Brunkal, G. Hughes, K. Tiffan, D. Geist,
B. Tiller, J. Lukas, M. Powelson, and C. Macdonald. 2001. Draft Mainstem Columbia River
Subbasin Plan. Prepared for Northwest Power and Conservation Council:169.
Washington Department of Fish and Wildlife. Electronic Reference. Salmonscape.
http://wdfw.wa.gov/mapping/salmonscape/index.html. Accessed March 28, 2014.
Washington Department of Fish and Wildlife. 2008. State of Washington Priority Habitats and
Species List.
Washington State Conservation Commission. 2001. The Salmonid Habitat Limiting Factors
report WRIA 32 Walla Walla Watershed. 171 PP.
Washington State Department of Ecology. 2007. Walla Walla River Tributaries Temperature
Total Maximum Daily Load Study.
Washington Department of Ecology. 2008. Walla Walla Watershed PCBs, Chlorinated
Pesticides, Fecal Coliform, Temperature, pH & Dissolved Oxygen Total Maximum Daily
Load Water Quality Implementation Plan. 93 pp.
The Watershed Company/BERK/WWBWC September 2014
167
9 LIST OF ACRONYMS AND ABBREVIATIONS
cfs .................................. Cubic Feet per Second
Corps ............................ U.S. Army Corps of Engineers
CREP ............................ Conservation Reserve and Enhancement Program
Ecology ........................ Washington Department of Ecology
EIS ................................. Environmental Impact Statement
ESA ............................... Endangered Species Act
FEMA ........................... Federal Emergency Management Agency
GIS ................................ Geographic information systems
GMA............................. Growth Management Act
HPA .............................. Hydraulic Project Approval
LWD ............................. Large Woody Debris
MOU ............................ Memorandum of Understanding
NLC .............................. National Land Cover
NOAA .......................... National Oceanographic and Atmospheric Administration
NPDES ......................... National Pollutant Discharge Elimination System
NRCS............................ Natural Resources Conservation Service
NWI .............................. National Wetlands Inventory
OHWM ........................ Ordinary High Water Mark
PCB ............................... Polychlorinated biphenyl
PHS ............................... Priority Habitats and Species
RCW ............................. Revised Code of Washington
RAC .............................. Rural Activity Center
SMA ............................. Shoreline Management Act
SMP .............................. Shoreline Master Program
SSURGO ...................... Soil Survey Geographic Database
TMDL ........................... Total Maximum Daily Load
UGA ............................. Urban Growth Area
USDA ........................... U.S. Department of Agriculture
USFWS ......................... U.S. Fish and Wildlife Service
USGS ............................ U.S. Geological Service
WAC............................. Washington Administrative Code
WDFW ......................... Washington Department of Fish and Wildlife
WDNR ......................... Washington Department of Natural Resources
WRIA ........................... Water Resource Inventory Area