shoreline change analyses along the eastern coast of ghana
TRANSCRIPT
Shoreline Change Analyses along the Eastern Coast of Ghana using
Landsat and ASTER Images
Philip-Neri Jayson-Quashigah (Mphil. Environmental Science Programme, UG)Dr. K. Appeaning Addo (Department of Marine and Fisheries Science, UG)
Outline
• Introduction
▫ Objectives of study
• Study Area
▫ Erosion & Interventions
• Approach
• Results and Discussion
• Conclusion and Recommendations
Introduction• Coastal zones are facing intensified disturbances▫ SLR▫ Coastal erosion (70% of the worlds beaches )▫ Increase in population (Appeaning Addo et al., 2008;
Zhang, 2010)• Hence accelerated efforts to assess, monitor and
mitigate stressors (Boak and Turner, 2005)• Shoreline change portray a cumulative outcome of the
processes that altered the shoreline for the periods analysed▫ Facilitates formulating effective coastal management
strategies and planning by revealing trends (AppeaningAddo, 2009).
• Coastal management/engineering require such information (Alves, 2007)

Ghana’s Coast• Ghana’s coastal zone represents about 6.5% of the
land area▫ 25% of the nation’s population▫ 80% of the industrial establishments (Armah and
Amlalo, 1998)• 540km of shoreline to be managed sustainably▫ Some of this is not easily accessible
• Erosion is a serious problem along the entire coast▫ Studies by Nai et al., 1993 and Armah, 1991 also Ly,
1980; Appeaning Addo et al. 2008
Motivation
• Part of efforts for continuous monitoring of Ghana’s shoreline
• The impacts of interventions such as the KSDP
• Expensive high resolution data and field work
Armah and Amlalo, 1998; Appeaning Addo, 2009
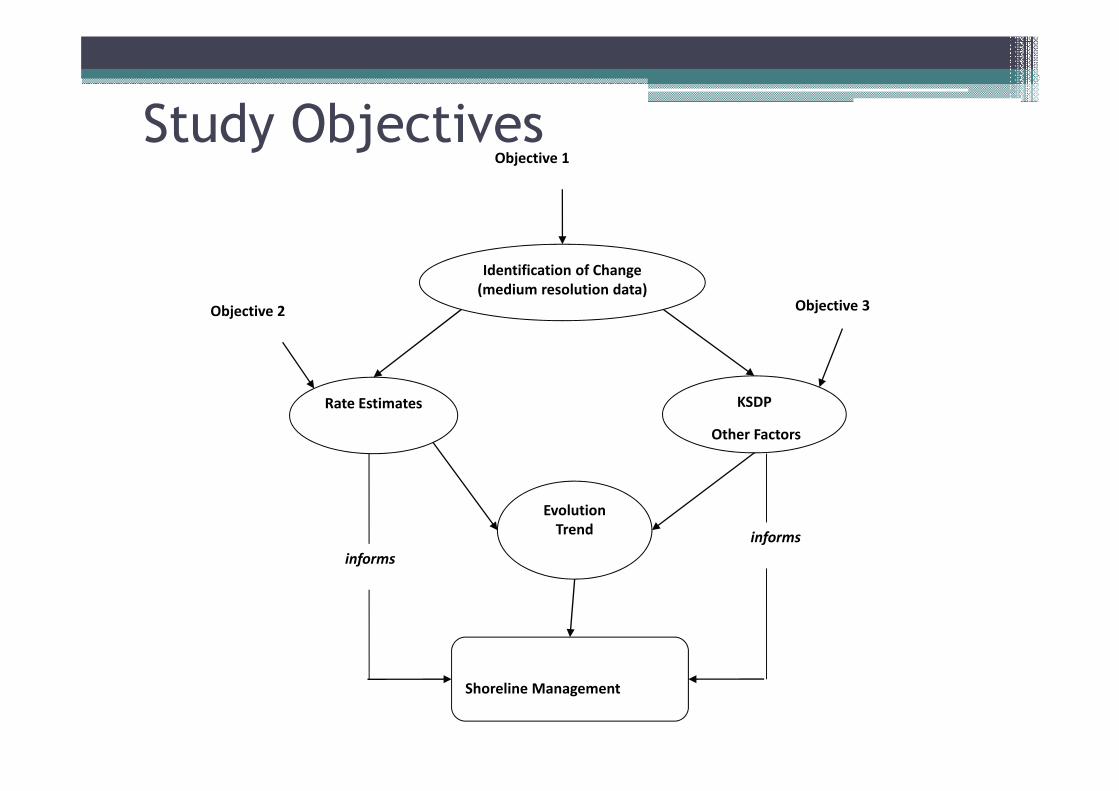
Study Objectives
Identification of Change (medium resolution data)
Rate Estimates
Shoreline Management
Evolution Trend
Objective 1
Objective 2 Objective 3
KSDP
Other Factors
informsinforms

Study Area• Between 5º25' and 6 º 20' N and 0 º 40' and 1 º 10' E
• East of the Volta Estuary
• Keta Lagoon Complex
• Soft geology; unconsolidated beach sands and lagoon clays •Waves reach as high as 3m
o South west
• Tidal range of 1m
• Presence of canyons offshore
• Narrow spit with high population density: 164-500 p/km2
Allersma and Tilsman, 1991; Sorenson et al., 2003; GSS, 2005; Boateng, 2009
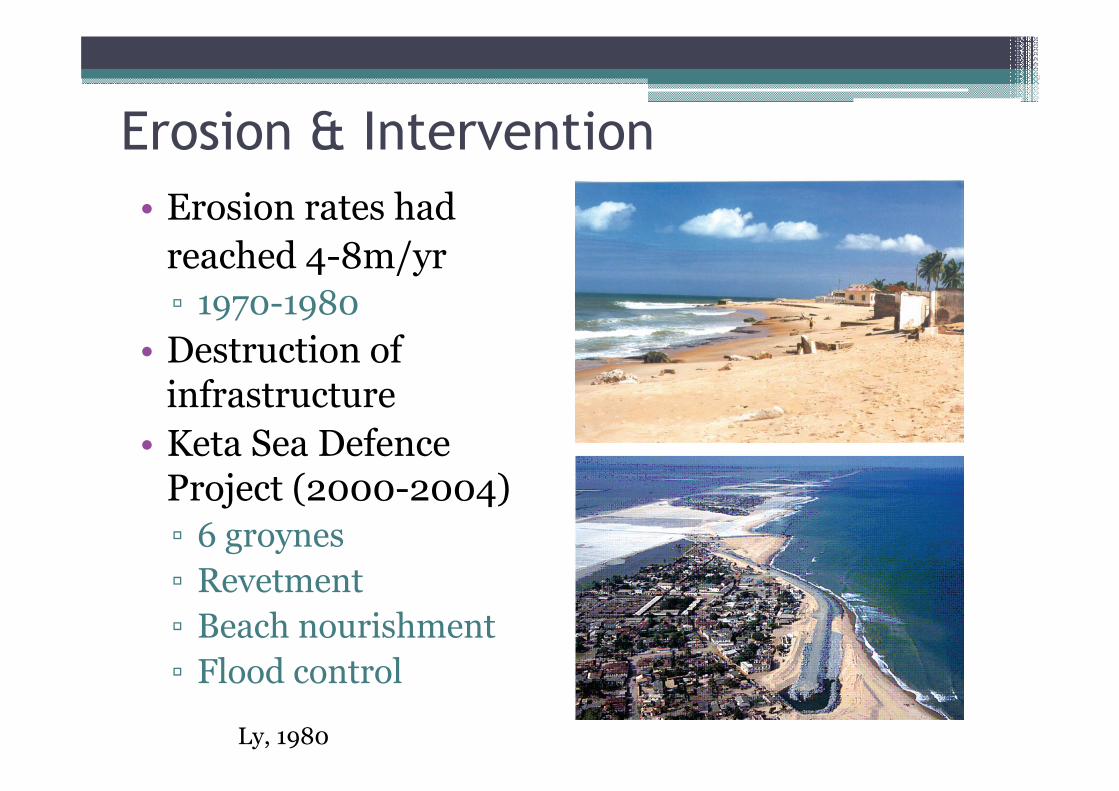
Erosion & Intervention• Erosion rates had
reached 4-8m/yr▫ 1970-1980
• Destruction of infrastructure
• Keta Sea Defence Project (2000-2004)▫ 6 groynes▫ Revetment▫ Beach nourishment▫ Flood control
Ly, 1980
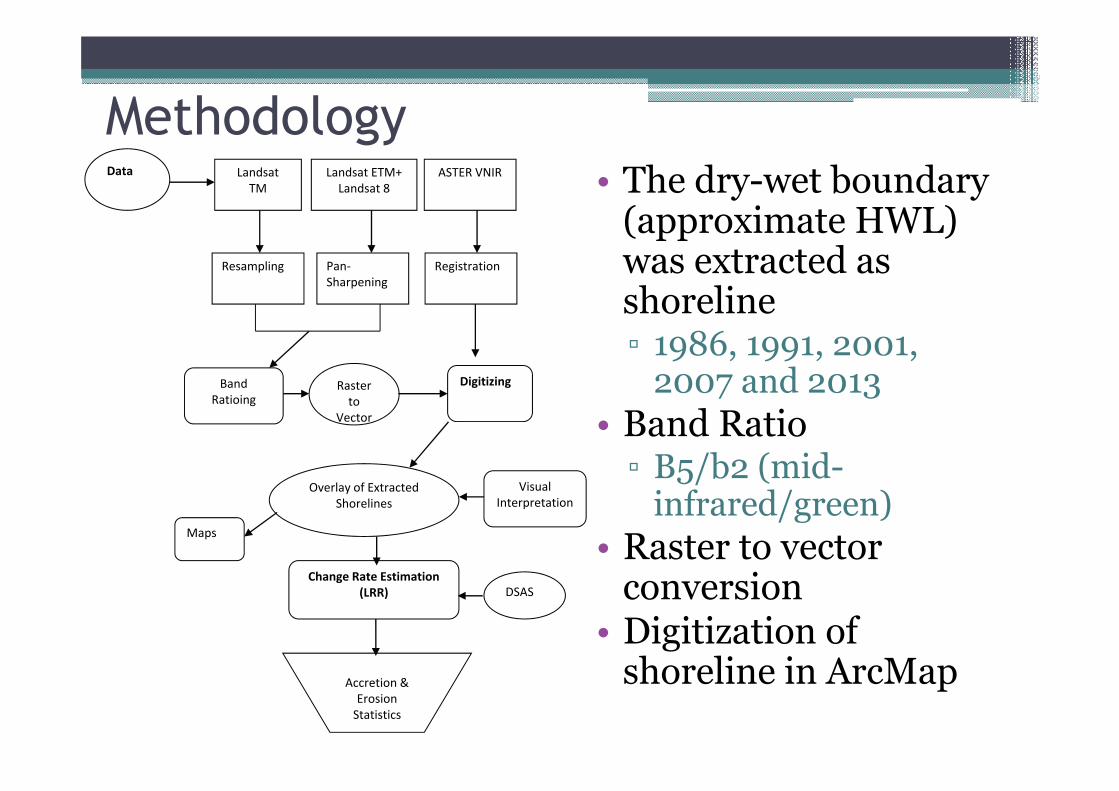
MethodologyData Landsat
TMASTER VNIRLandsat ETM+
Landsat 8
Resampling Pan‐Sharpening
Overlay of Extracted Shorelines
Registration
BandRatioing
Digitizing
Maps
Visual Interpretation
Change Rate Estimation (LRR) DSAS
Accretion & Erosion Statistics
Raster to
Vector
• The dry-wet boundary (approximate HWL) was extracted as shoreline▫ 1986, 1991, 2001,
2007 and 2013 • Band Ratio▫ B5/b2 (mid-
infrared/green)• Raster to vector
conversion• Digitization of
shoreline in ArcMap

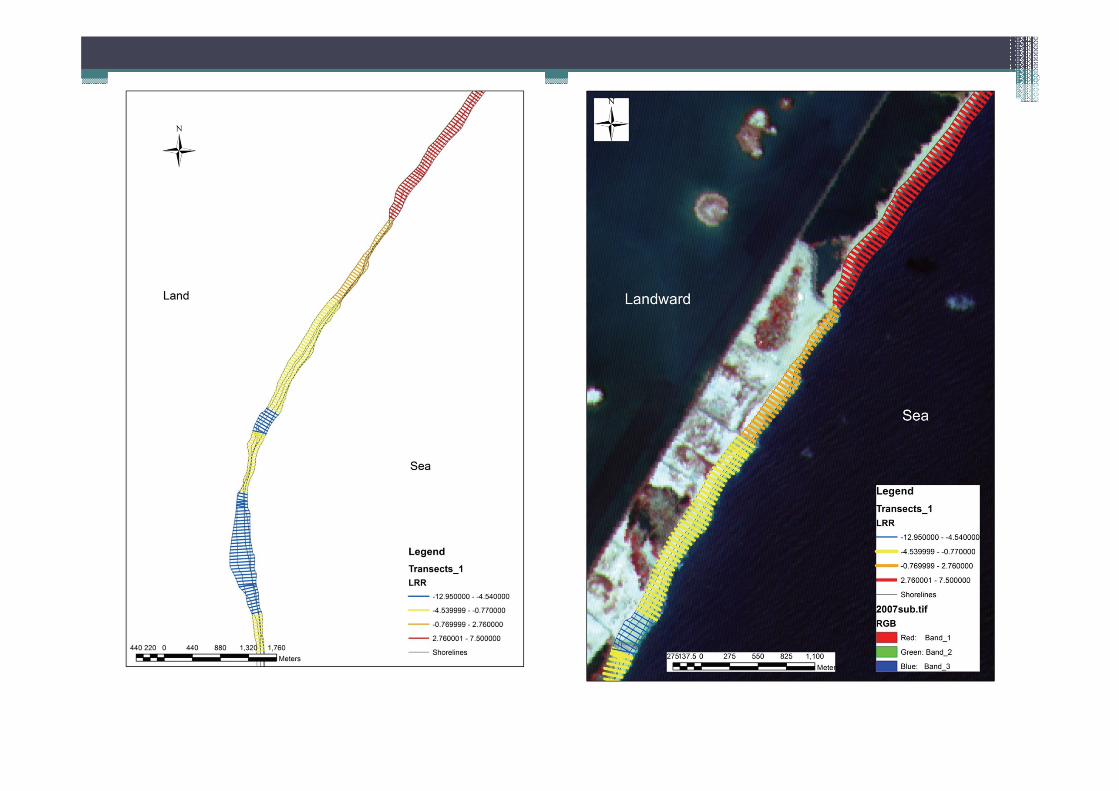
Analysis• Development of Database▫ Shoreline attributes
• DSAS (Extension for ArcGIS)▫ Computes rates at specified
intervals▫ Various statistical methods
• Baseline construction▫ About 500m onshore
• Casting of Transects▫ 50m spacing
• Linear Regression Rate of change (LRR) was used
• Error estimation▫ 30m▫ Annualized: ▫ Ea = √( E1
2 + E22 + E3
2 + E42 + E5
2)/ T
DSAS 4.3; USGS

Results/Discussion
• A total of 5 shorelines 1986, 1991,
2001, 2007, 2013
• 1986 to 2001 pre KSDP
• 2001 to 2013 post KSDP

Visual AssessmentUncertainty
± 0.45
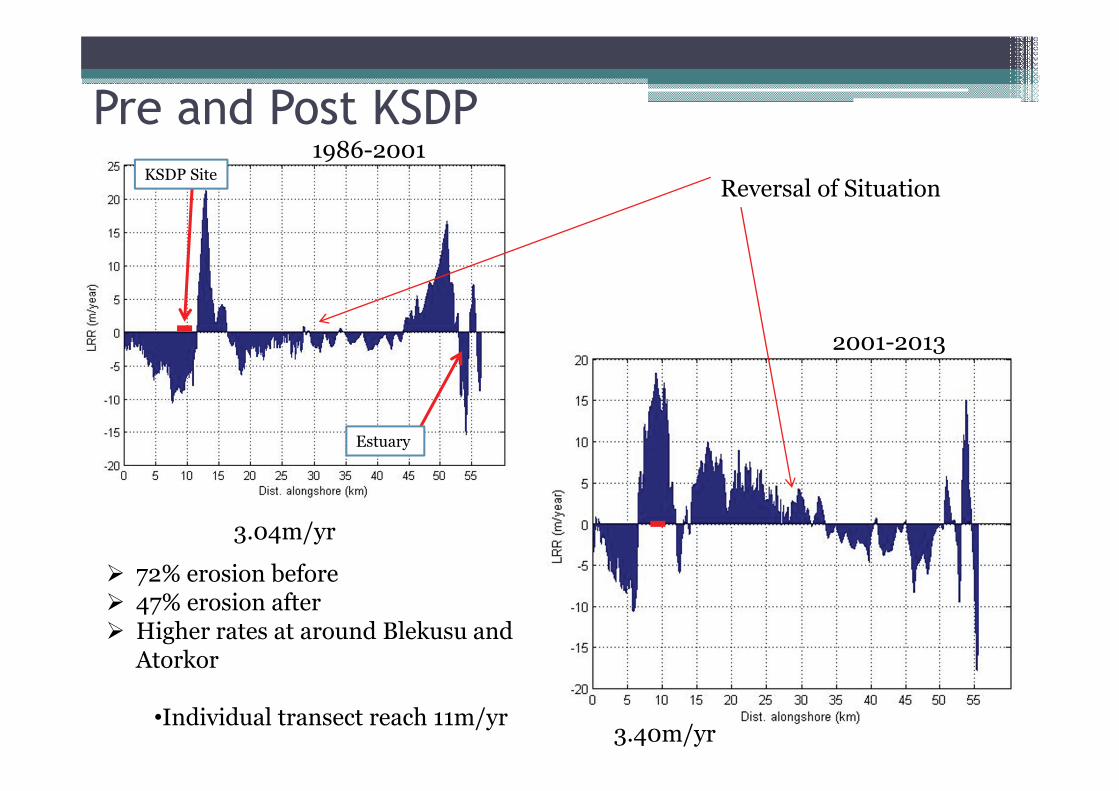
Pre and Post KSDP1986-2001
2001-2013
KSDP SiteReversal of Situation
3.04m/yr
3.40m/yr
Estuary
72% erosion before 47% erosion after Higher rates at around Blekusu and
Atorkor
•Individual transect reach 11m/yr
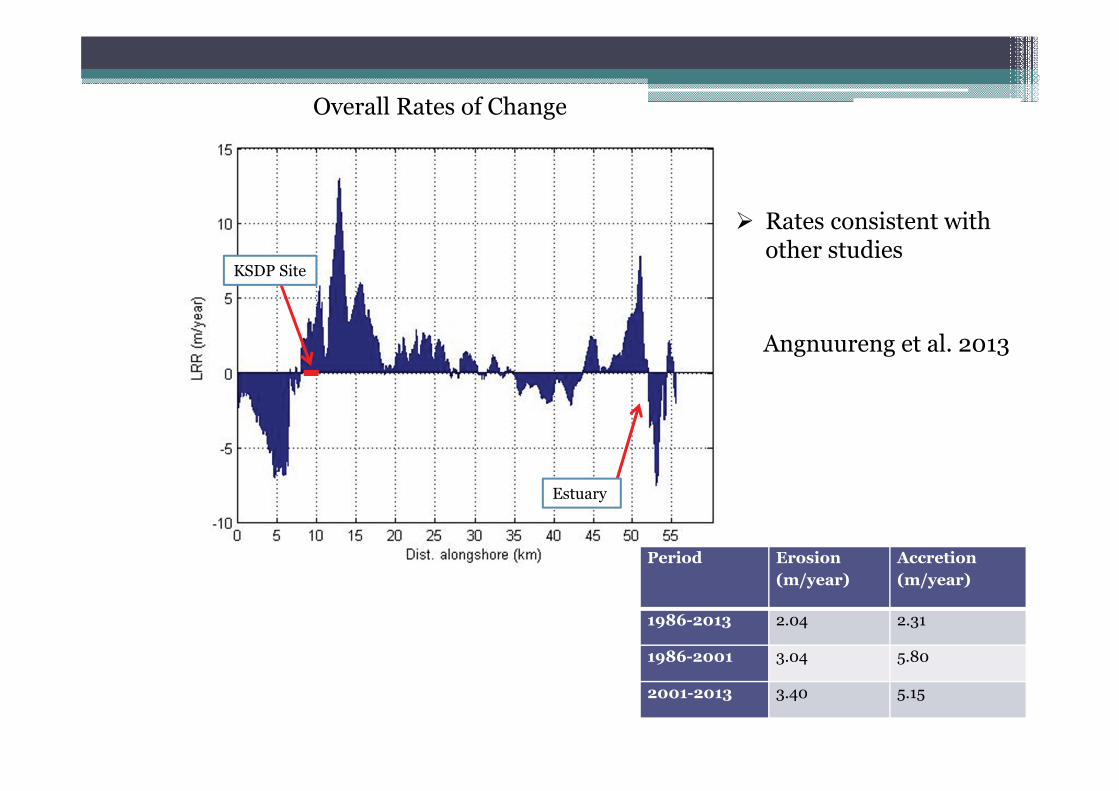
Overall Rates of Change
KSDP Site
Estuary
Period Erosion(m/year)
Accretion(m/year)
1986-2013 2.04 2.31
1986-2001 3.04 5.80
2001-2013 3.40 5.15
Rates consistent with other studies
Angnuureng et al. 2013
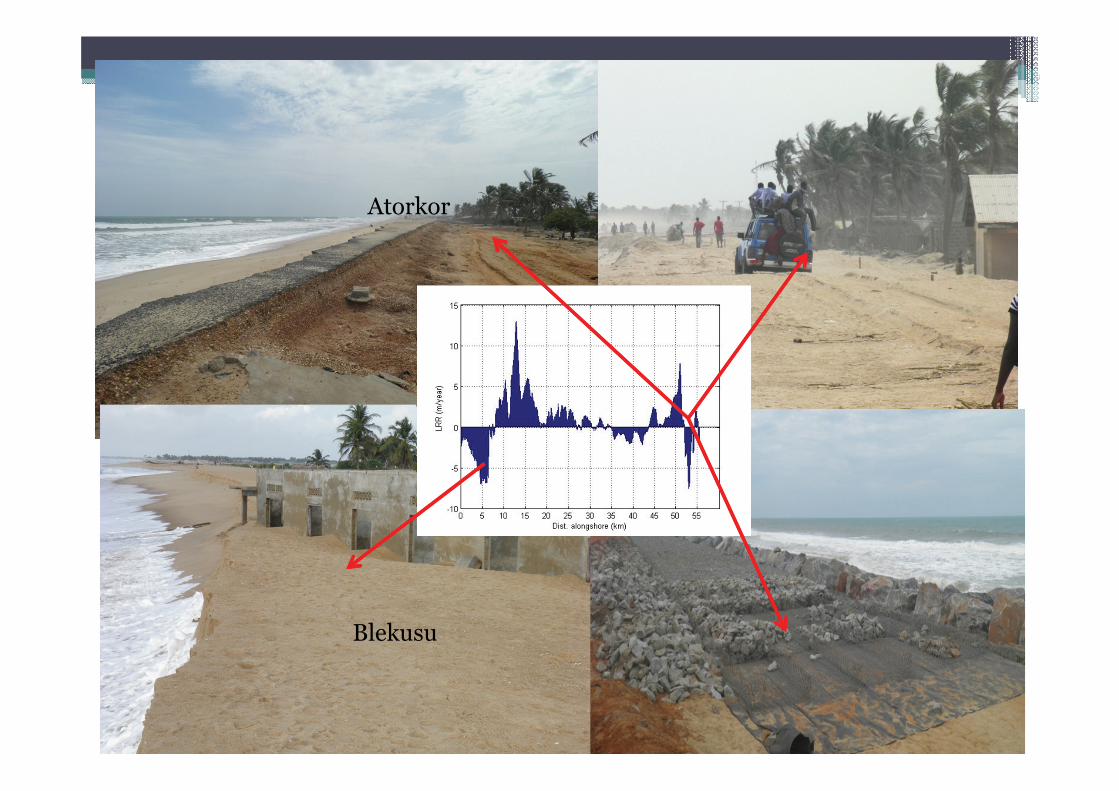
Blekusu
Atorkor

Possible Factors • Wave action▫ Prevailing southwesterly winds▫ High energy waves (1.3m 10.9s;
Max:2.82m, 19.68s)▫ Presence of Canyons on sea bed
• Shoreline Orientation• Bathymetry (relatively deep)• Human Activities▫ KSDP▫ Sand Mining, mangrove
destruction• Land squeeze▫ coastal development ▫ prevents coasts from adapting
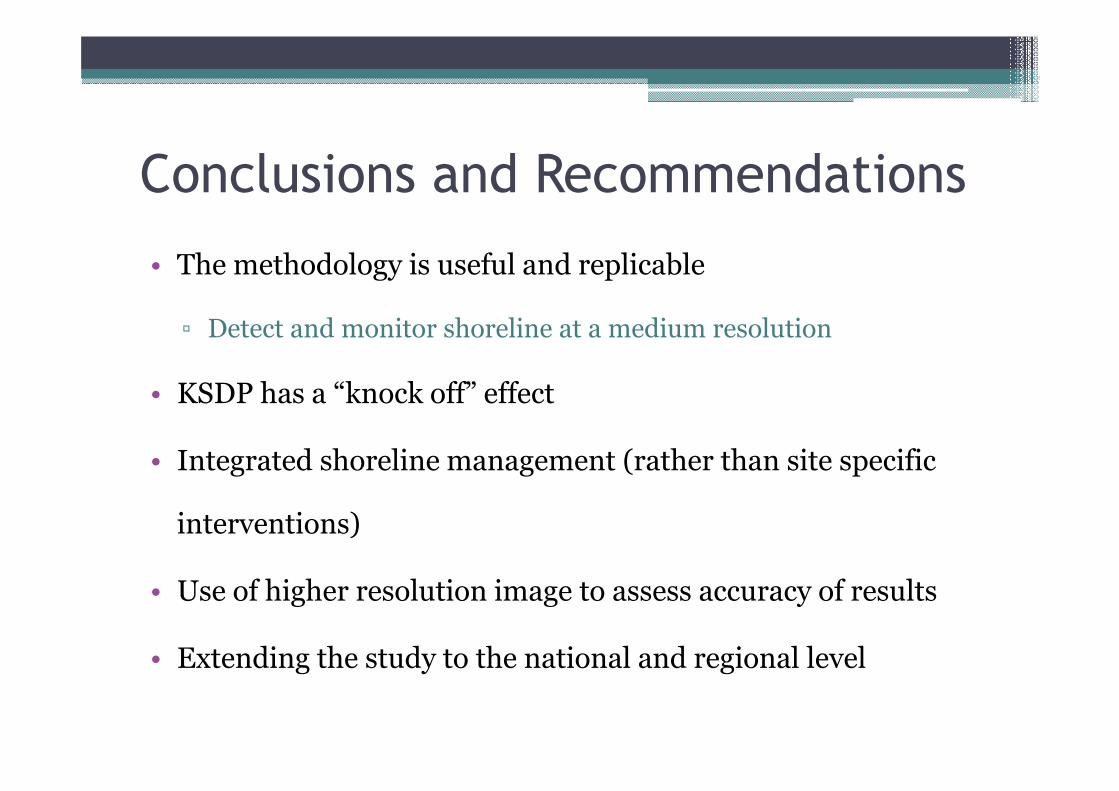
Conclusions and Recommendations
• The methodology is useful and replicable
▫ Detect and monitor shoreline at a medium resolution
• KSDP has a “knock off” effect
• Integrated shoreline management (rather than site specific
interventions)
• Use of higher resolution image to assess accuracy of results
• Extending the study to the national and regional level

Acknowledgements
Thank Youmerci