short-circuit, coordination, and arc-flash studies for ... · pdf fileshort-circuit,...
TRANSCRIPT

Short-Circuit, Coordination, and Arc-Flash Studies for Data Centers: Best Practices and Pitfalls
Karl A. Homburg, PE, Staff Power Systems Engineer, Square D Engineering Services
Revision 0 11/09 Page 1 of 20 www.criticalpowernow.com
1. Abstract Data Center power systems present unique challenges for the application of electrical equipment. These challenges, such as multiple operating modes, must be carefully implemented if the desired system performance under normal and abnormal conditions is to be achieved. This paper describes the challenges that a typical data center presents to the system study engineer, common pitfalls that must be avoided, and describes how a well-performed system study is crucial to the successful performance of a data center power system.
2. Power System Analysis Software While it is possible to perform power system studies utilizing hand calculations, the complexities of data center power systems would tend to make these calculations tedious at best. Due to the high reliability requirement of data centers they are usually designed with several possible operating scenarios for many different contingencies. Every operating scenario is essentially a completely separate power system that may have completely different fault currents, arc-flash incident energy levels and power flows. It is also possible that some contingency scenarios, like operation on generator power, may require protective relays to be programmed with multiple sets of trip characteristics based on the scenario they are operating under. The best way to find and mitigate problems with the design of a data center is on the computer where changes are less expensive than changes to equipment and there is reduced risk of downtime before equipment is in service. With the proper software, multiple contingency and operating scenarios can be completely evaluated ahead of time.
3. Short-Circuit, Coordination and Arc-Flash Studies A power system study is an extremely important document for any power system. Today even the smallest power systems are having power system studies performed to comply with more stringent codes and regulations. Due to the high reliability requirement imposed upon the operation of data centers it is an absolute necessity.
A power system study typically consists of short circuit, coordination, and arc-flash hazard studies. While sometimes these individual areas may be considered separately they are all very much interrelated and it is recommended that these be performed at the same time, by the same entity, to ensure the most accurate results.
Data centers also present additional challenges to the engineer tasked with performing a power system study. Many data centers are served by multiple utility sources and generators that can be operated in several different configurations. All configurations must be considered in order for the engineering study to completely predict the operation and identify any shortcomings in the power system.
3.1. Short Circuit Study
3.1.1. Background The purpose of a short circuit study is to identify the maximum available fault current at all locations, called busses, in the power system. It is then compared with the ratings of the
Copyright © 2009 Schneider Electric. All Rights Reserved.
Short-Circuit, Coordination, and Arc-Flash Studies for Data Centers
individual power system components to determine if the equipment is adequately rated to safely withstand or interrupt the calculated fault current.
The results of the short circuit study are also used in both the coordination study and the arc-flash study. How this information is used will be discussed later.
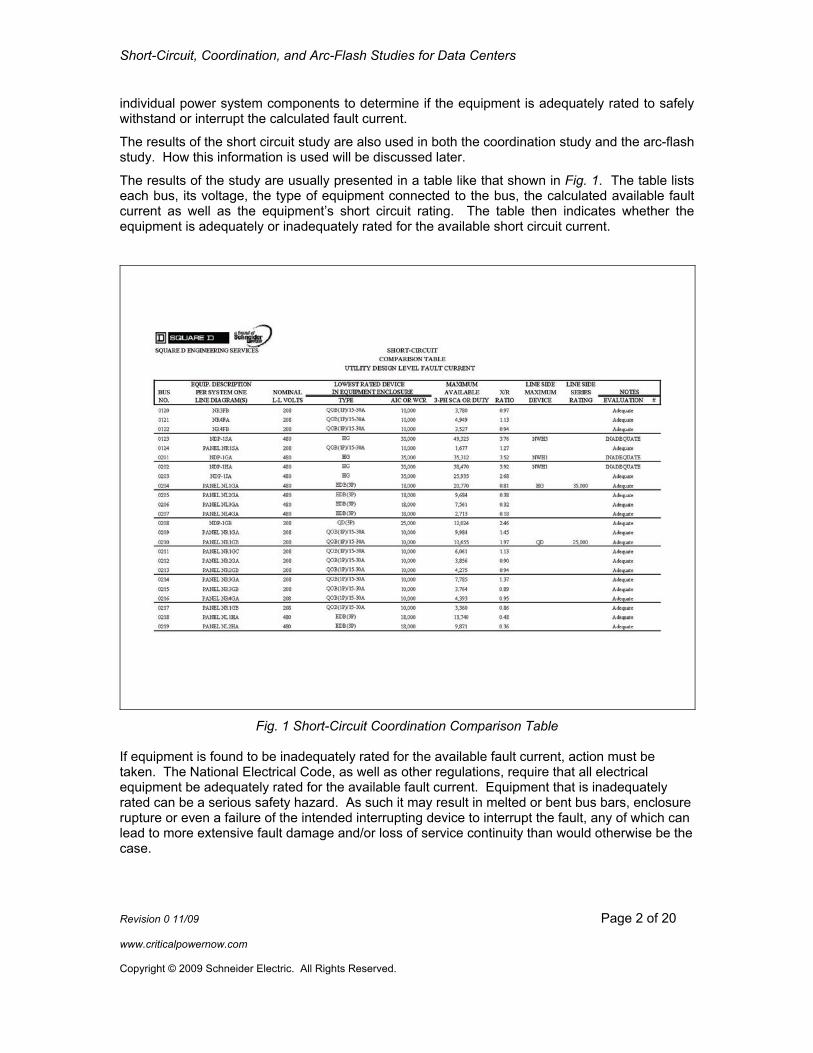
The results of the study are usually presented in a table like that shown in Fig. 1. The table lists each bus, its voltage, the type of equipment connected to the bus, the calculated available fault current as well as the equipment’s short circuit rating. The table then indicates whether the equipment is adequately or inadequately rated for the available short circuit current.
Fig. 1 Short-Circuit Coordination Comparison Table
If equipment is found to be inadequately rated for the available fault current, action must be taken. The National Electrical Code, as well as other regulations, require that all electrical equipment be adequately rated for the available fault current. Equipment that is inadequately rated can be a serious safety hazard. As such it may result in melted or bent bus bars, enclosure rupture or even a failure of the intended interrupting device to interrupt the fault, any of which can lead to more extensive fault damage and/or loss of service continuity than would otherwise be the case.
Revision 0 11/09 Page 2 of 20 www.criticalpowernow.com Copyright © 2009 Schneider Electric. All Rights Reserved.

Short-Circuit, Coordination, and Arc-Flash Studies for Data Centers
3.1.2. Short Circuit Study – Pitfalls Data centers present some pitfalls when performing a short circuit study. Since the short circuit study is concerned with the maximum available fault current, we need to look at the operating scenario that will supply the most fault current and consider all sources of fault current. In most cases the operating scenarios and motor information are not readily apparent upon examining the one-line diagram of the power system. The system study engineer must obtain this information from the system designer.
Fig. 2 Fault Currents with Open Tie
Fig. 3 Fault Currents with Closed Tie
Revision 0 11/09 Page 3 of 20 www.criticalpowernow.com Copyright © 2009 Schneider Electric. All Rights Reserved.
Short-Circuit, Coordination, and Arc-Flash Studies for Data Centers
3.1.2.1. Motor Contribution One often overlooked source of fault current are motors operating on the system. Large data centers may have very large chillers and air handlers to deal with the heat generated by the equipment within. It is not uncommon mistake for some system designers to choose short circuit rating of equipment based on an infinite bus calculation of the transformers feeding them while neglecting the contribution of motors in the system. A typical motor will contribute 6 times its full load current as fault current. If little margin is included when short circuit ratings are chosen the motor contribution could easily push the distribution equipment over the edge.
3.1.2.2. Parallel Operation Often data centers are not designed to parallel sources during steady state operations. Some designs however may operate one or more transformers in parallel with one or more generators. If this is the case all of the operating scenarios must be considered to determine the scenario that produces the maximum available fault current. Fig. 2 and Fig. 3 show the difference in fault current on a main tie main system with the tie breaker both open and closed. If the utility has been assumed to be an infinite bus the available fault current would be double. Since real utility sources are not infinite busses the available fault current from the utility will have a significant effect on the secondary fault current. In most cases it will be much less than double but still significantly more than the current available from a single transformer. This effect can be even more significant when multiple generators are paralleled.
Even in data centers that do not intentionally operate with parallel sources many of them do experience some time in which sources are paralleled. This is the case if switching is performed as a closed transition. Under this scenario sources are briefly paralleled to allow the switching of sources without interruption to the load. If this is done automatically the time the sources are paralleled is very brief, up to only a few seconds. If the switching is done manually the time can be significantly longer based on the time needed for the worker operating the equipment. During the time that the sources are paralleled the power system equipment is exposed to the much larger fault current of the paralleled sources.
There are differing opinions as to whether switchgear should be operated in a closed transition scenario while only rated for the open transition fault current. One common view holds that if the closed transition is automatically controlled by a control system such that the tie breaker and both mains are closed for only a very short period of time it is acceptable to choose the equipment based on the open tie fault current. This is because the probability of a fault during this very brief period of time is extremely low and workers are not typically standing in front of the equipment during operation.
Conversely if the closed transition is done by a worker manually operating circuit breakers the time period the breakers are closed is significantly longer and the worker is in close proximity to the switchgear. In these cases equipment that is fully rated for the closed tie fault current is typically recommended. It should be noted that there is, by no means, universal agreement on what ratings to use for a closed transition. It is ultimately the responsibility of the engineer of record to make the decision.
3.1.2.3. Single Line to Ground Faults Single line to ground fault can be a concern when a delta-wye connected 3 phase 4 wire system or wye-grounded generators are employed especially when the substation transformers or generators are very close or are close coupled to the distribution switchgear. When the distance is small the zero sequence impedance is significantly smaller than the positive and negative sequence impedance. This difference can cause the single line to ground fault magnitude to be up to theoretical maximum of 150% of the magnitude of a three phase fault. Revision 0 11/09 Page 4 of 20 www.criticalpowernow.com Copyright © 2009 Schneider Electric. All Rights Reserved.

Short-Circuit, Coordination, and Arc-Flash Studies for Data Centers
Fig. 2 shows a one-line diagram of a main-tie-main service entrance with the tie breaker open. The transformers are assumed to be close coupled to the switchgear. As can be seen in the figure the available single line to ground fault is about 105% of the available three phase fault.
Fig. 3 shows what happens when the tie breakers are closed. Not only does the three phase fault current increase dramatically but so does the difference between the three phase fault and the single line to ground fault. When the transformers are paralleled the single line to ground fault is about 109% of the three phase fault. Fortunately after even as little as a few tens of feet for smaller transformers the zero sequence impedance increases to the point where the single line to ground fault will be less than the three phase fault. For the example we have been using it would take about 90 feet of cable to reduce the SLG fault current to the level of the 3P fault current. If dealing with a closed tie situation the required cable length approximately doubles to about 180 feet.
3.1.2.4. X/R Ratio The X/R ratio is a measure of the ratio of the inductive reactance (X), consisting of the inductive components of cable, transformer, generator, etc., impedances, to the resistive components (R) of those impedances; the applicable ANSI [1] [2] and IEEE [3] standards are very specific on the method for calculating it. Every practical electrical power system has some inductive impedance, making the X/R ratio always larger than zero. An inductor stores energy in a magnetic field, which requires current flow. Because this energy cannot be dissipated instantaneously an inductor opposes changes to current flow. For fault conditions, this means that after a fault is initiated there will be a DC offset to the fault current; the higher the X/R ratio, the higher the DC offset. This DC offset must be taken into account when calculating the interrupting duty of fault interrupting devices such as circuit breakers. The result, for low-voltage interrupting devices, is that the fault duty that is used in comparison to the interrupting rating of the device will be higher (theoretical maximum is 31% higher for a molded-case circuit breaker with interrupting rating greater than 20kA) than the actual calculated fault current if the X/R ratio calculated at the point of the fault is greater than the X/R ratio for which the device has been tested. This can become an issue if the device has an interrupting rating only marginally higher than the available fault current. Such a scenario unfortunately, occurs often in data center applications, especially where relatively large low-voltage generators are operated in parallel.
3.2. Coordination Study
3.2.1. Background The purpose of a coordination study is to determine the proper settings for overcurrent protective devices in the power system. Ideally the selection of the proper settings will both protect the power system equipment as well as remove only the smallest portion of the electrical system as necessary from service in order to isolate a fault. In most cases however compromises must be made in order to provide the best overall system reliability.
In order to determine the proper setting for the Overcurrent protective devices they are plotted on time-current curve graphs (TCCs). The time-current characteristics of properly coordinated devices will not overlap on a TCC graph. An example of a TCC graph is shown in Fig. 5. The devices in this TCC graph correspond to the devices shown in the one-line diagram in Fig. 4.
Revision 0 11/09 Page 5 of 20 www.criticalpowernow.com Copyright © 2009 Schneider Electric. All Rights Reserved.
Short-Circuit, Coordination, and Arc-Flash Studies for Data Centers
3.2.2. Interpreting a TCC Graph The TCC graph relies on the information determined in the short circuit analysis to determine where the device time-current curve is cut off. Each device will have its characteristic cut off at the maximum fault current available for the bus it is connected to. As stated earlier, most of the time when there is no overlap on the TTC graph the devices can be said to coordinate.
Many data centers utilize ANSI draw-out style switchgear, or similar, “hybrid,” switchboard construction, at the service entrance. This type of switchgear has the benefit of being able to conduct rated fault currents for time periods up to 30 cycles. This withstand capability allows the instantaneous function of the main circuit breaker to be turned off in many cases avoiding overlap and providing for better coordination
There are couple of exceptions to the no overlap concept. If two devices are operating in a current-limiting mode at the available fault current, the curves will fall below 0.01s on the TCC graph. Even though they do not show overlap on the graph additional techniques are required to judge selectivity. Generally this occurs with fuses and requires the use of fuse ratio tables to determine selectivity.
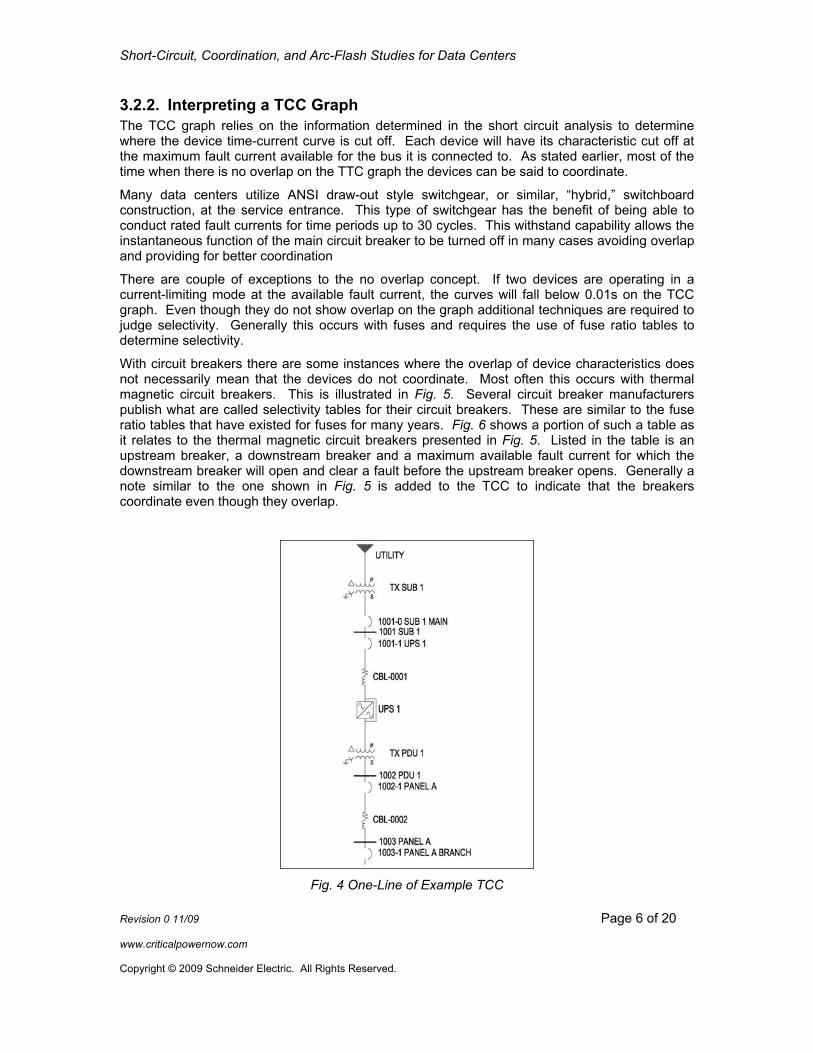
With circuit breakers there are some instances where the overlap of device characteristics does not necessarily mean that the devices do not coordinate. Most often this occurs with thermal magnetic circuit breakers. This is illustrated in Fig. 5. Several circuit breaker manufacturers publish what are called selectivity tables for their circuit breakers. These are similar to the fuse ratio tables that have existed for fuses for many years. Fig. 6 shows a portion of such a table as it relates to the thermal magnetic circuit breakers presented in Fig. 5. Listed in the table is an upstream breaker, a downstream breaker and a maximum available fault current for which the downstream breaker will open and clear a fault before the upstream breaker opens. Generally a note similar to the one shown in Fig. 5 is added to the TCC to indicate that the breakers coordinate even though they overlap.
Fig. 4 One-Line of Example TCC
Revision 0 11/09 Page 6 of 20 www.criticalpowernow.com Copyright © 2009 Schneider Electric. All Rights Reserved.

Short-Circuit, Coordination, and Arc-Flash Studies for Data Centers
Fig. 5 Typical TCC Graph
Revision 0 11/09 Page 7 of 20 www.criticalpowernow.com Copyright © 2009 Schneider Electric. All Rights Reserved.

Short-Circuit, Coordination, and Arc-Flash Studies for Data Centers
Fig. 6 Circuit Breaker Selectivity Table
3.2.3. Coordinating Parallel Generators The coordination of parallel generators can pose a challenge. It is not uncommon for the feeder breakers in generator paralleling switchgear to have a similar long time trip rating as the generator breakers. In such an instance it may be impossible to adjust the devices to have good selective coordination while providing protection that matches the generator’s decrement curve.
If two identically sized generators with identical impedance characteristics are operating in parallel, the fault current will be split approximately equally between the two generators. This means that the generator breakers will only see half of the fault current that a feeder breaker would see. Using this relationship, the generator breaker curves can be shifted to the right by a factor of two. This shifting of the curves allows a visual representation of the actual conditions that exist during the parallel operation. The same methodology applies to numbers of generator breakers greater than two – the curves would be shifted by a factor of 3 for 3 breakers, 4 for 4 breakers, etc. Strictly speaking, such shifting of curves applies only to faulted conditions where the fault is downstream of both breakers with shifted curves, and not to overloads. If only one of the sources is in operation, however, fault overcurrent coordination would still be based on the non-shifted curves.
This technique could also be applied to a generator paralleled with a transformer or two generators of different sizes. The scaling factors would simply need to be adjusted based on the ratio of the impedances of the sources.
Fig. 7 is a sample one-line of two parallel generators. The generator paralleling switchgear feeds a distribution switchboard that then feeds several UPSs, one of which is shown. Fig. 8 shows a Revision 0 11/09 Page 8 of 20 www.criticalpowernow.com Copyright © 2009 Schneider Electric. All Rights Reserved.

Short-Circuit, Coordination, and Arc-Flash Studies for Data Centers
TCC drawing based on the one-line. As can be seen perfect selective coordination is obtained all the way up to the switchboard feeder breaker. There is a lack of selective coordination with the generator breaker however. This is because the generator breaker had to be adjusted so that the generator is adequately protected for short-circuit conditions.
Since there are two parallel generators Fig. 9 shows the generator breaker and decrement curve shifted to the right. Since there are two generators the curves were shifted by a factor of two. As can be seen, when two generators are operating in parallel perfect selective coordination exists.
Fig. 7 Parallel Generator Example TCCs One-Line Diagram
Revision 0 11/09 Page 9 of 20 www.criticalpowernow.com Copyright © 2009 Schneider Electric. All Rights Reserved.

Short-Circuit, Coordination, and Arc-Flash Studies for Data Centers
Fig. 8 Parallel Generator Example TCC – Un-shifted
Revision 0 11/09 Page 10 of 20 www.criticalpowernow.com Copyright © 2009 Schneider Electric. All Rights Reserved.

Short-Circuit, Coordination, and Arc-Flash Studies for Data Centers
Fig. 9 Parallel Generator Example TCC - Shifted
Revision 0 11/09 Page 11 of 20 www.criticalpowernow.com Copyright © 2009 Schneider Electric. All Rights Reserved.

Short-Circuit, Coordination, and Arc-Flash Studies for Data Centers
3.3. Arc-Flash Study
3.3.1. Background An arc-flash hazard analysis has become a standard part of many system studies. The purpose of the analysis is to determine the available arc-flash incident energy at all of the busses in the power system so that electrical workers are aware of the potential hazard and can make informed choices about personal protective equipment.
The foundations of arc-flash analysis are the IEEE-1584-2002 [4] and NFPA 70E-2009 [5] standards. The calculation methodologies require the results of the short circuit and coordination studies. The results of these studies must be applied carefully to the arc-flash analysis so that realistic estimates of the available incident energy are made.
3.3.2. Multiple Operating Scenarios Once again, multiple operating scenarios will need to be considered by the system study engineer in order to properly calculate the incident energy levels in the system. Unlike short circuit studies where we are concerned with the maximum available fault current with arc-flash studies we are really concerned with all possible available fault currents. In many cases the highest incident energy levels are produced by the scenario that produces the lowest available fault current. This is because fault currents that fall just below the instantaneous or short time pickup of circuit breakers will last for a much longer time period and therefore expose an electrical worker to more energy.
3.3.3. PDUs and Transformers According to IEEE 1584, busses operating at 240V or less fed by transformers less than 125kVA in size do not need to be considered in an arc-flash hazard analysis and can be assumed to be Category 0 (1.2 cal/cm^2) Many data centers, however, use transformers larger than 125kVA in their PDUs. This can pose a problem if trying to keep the incident energy levels in the power system low.
There are two problems with 480 to 208V transformers related to arc-flash within data centers. The first has to do with the physical construction of the PDUs and the second is related to the low level of arcing faults on the 208V terminals of the transformer.
3.3.3.1. Low Level Arcing Faults The arcing fault current on the secondary of a 480 to 208V transformer is usually relatively low when compared to the instantaneous pickup of the 480V breaker feeding the PDU. Due to this the primary breaker usually takes several seconds to clear a fault on the 208V side. When the arc-flash calculations are stopped at two seconds, per IEEE 1584, a Category 3 arc-flash hazard/risk rating is very common. It should be noted, that for locations where clear egress is not possible, it may be prudent to extend the calculations past 2 seconds. Unfortunately, there are very few cost effective solutions to decrease the hazard at this location in a power system. One work-around is to consider the equipment construction and layout.
3.3.3.2. PDU Construction Typically, PDUs are constructed with the 208V secondary breakers and a branch circuit panelboard within the same enclosure. This poses two risks. First the primary of the transformer represents a 480V hazard while a worker is performing work on the 208V components. The second risk is exposure to the line side of the 208V secondary breakers. As discussed earlier Revision 0 11/09 Page 12 of 20 www.criticalpowernow.com Copyright © 2009 Schneider Electric. All Rights Reserved.
Short-Circuit, Coordination, and Arc-Flash Studies for Data Centers
this location is quite often Category 3. Since all of the components are in the same enclosure this rating must be applied to the entire PDU.
There is a possible solutions to this problem.
3.3.3.2.1. Provide Separate Enclosure for Panelboards A solution is to move the branch circuit panelboards to a separate enclosure. Most of the time the 208V breaker feeding the branch circuit panelboard is capable of interrupting the arcing fault fast enough to allow for a Category 0 rating at the panel. By moving it to a separate enclosure the worker is no longer exposed to the unprotected transformer secondary when working on the branch circuit panelboard. The hazard still exists in the PDU but workers need access to the PDU much less often then the panelboards.
3.3.4. UPS Systems and Arcing Fault Currents It has been common practice when performing arc-flash studies to assume that a UPS system will switch into bypass during an arcing fault. If the arcing fault current is too low, however, this may not be the case.
Information about the behavior of a UPS system for low level arcing faults is difficult to obtain from most of the major UPS manufacturers. The information that is available shows that different UPS models have different behaviors even from the same manufacturer.
In general, if the arcing fault current is less than the overload rating of the UPS the unit will not switch into bypass and the only current flow will be from the output of the UPS itself.
For slightly higher faults the unit may operate in what one manufacturer called pulsed parallel mode in which both the UPS output and the bypass are paralleled for approximately 40 milliseconds at which time the UPS output breaker will open leaving only the bypass to supply the fault.
The third scenario is one in which the fault current significantly exceeds the UPS overload rating. In this case the UPS will immediately switch to bypass mode.
The scenario that produces the worst case incident energy level could vary significantly depending on the UPS size, available fault current and overcurrent protection types. Each system should be carefully considered in consultation with the UPS manufacturer’s published data to make a determination.
3.3.4.1. UPS Example For example, one particular UPS system, with a Static Transfer Switch (STS), will conduct for overloads that exceed 155% of the on-line modules. This essentially places the UPS output and the bypass source in parallel to feed the fault for 40 milliseconds. The downstream faulted bus will therefore experience an available fault current consisting of both the UPS inverter capability and the bypass source for that duration. If the fault has not cleared in that time, the STS will continue to conduct while the UPS output breaker opens and the bypass breaker closes
To apply this to an arc flash analysis for loads supplied by such a UPS system, the idea is to compare the calculated arcing current at the downstream busses, supplied from the UPS to the overload capability of the UPS (155% of the online modules). If the calculated arcing current at the downstream bus exceeds the overload capability of the UPS, then the downstream panel can be evaluated in Bypass mode only. If the arcing current is insufficient to cause the STS to conduct in "pulsed parallel" operation, then that downstream bus should be evaluated separately
Revision 0 11/09 Page 13 of 20 www.criticalpowernow.com Copyright © 2009 Schneider Electric. All Rights Reserved.
Short-Circuit, Coordination, and Arc-Flash Studies for Data Centers
for arc flash based on the UPS supply only and in bypass, with the worse case determined and reported.
4. Power System Data Accurate data about the power system is essential for any system study to accurately predict its behavior. Sometimes even seemingly insignificant errors in the system data can produce significant errors in the study results. This is especially the case with an arc-flash hazard analysis.
4.1. Effects of Inaccurate Data on System Studies It is possible for small errors in the power system data to have a very significant effect on arc-flash calculations. It is therefore necessary that the power system data be as accurate as possible. Underestimating cable lengths can cause arc-flash incident energy levels to be underreported. Overestimating lengths could also have an effect when comparing the withstand ratings of equipment when performing a short circuit analysis if the fault current fall close to the actual equipment rating.
Another area that could cause significant errors is neglecting to consider the type of conduit used for feeders. Assuming magnetic conduit when PVC is actually used or vice-versa can have a significant effect on the fault current calculations.
Finally, a third common area that can introduce errors is the available utility fault current.
4.1.1. Incorrect Cable Lengths As stated earlier, incorrectly estimating the lengths of the power cables in the system can have a negative impact on the study results. There are two concerns that are in opposition with each other. The first concern would be to overestimate the length. Overestimating the length would cause the study results to underestimate the available fault current at a bus and determining that devices are adequately rated when they are not. Generally, this would only be a problem for a gross overestimation of the lengths since most of the time equipment rating are not chosen to be too close to the available fault current. It is also relatively easy to guard against this situation. Simply scanning through the short circuit comparison table will quickly show devices that are close to their interrupting rating. If there is little confidence in the accuracy of the cable lengths some time could be spent on only these cable to obtain more accurate information.
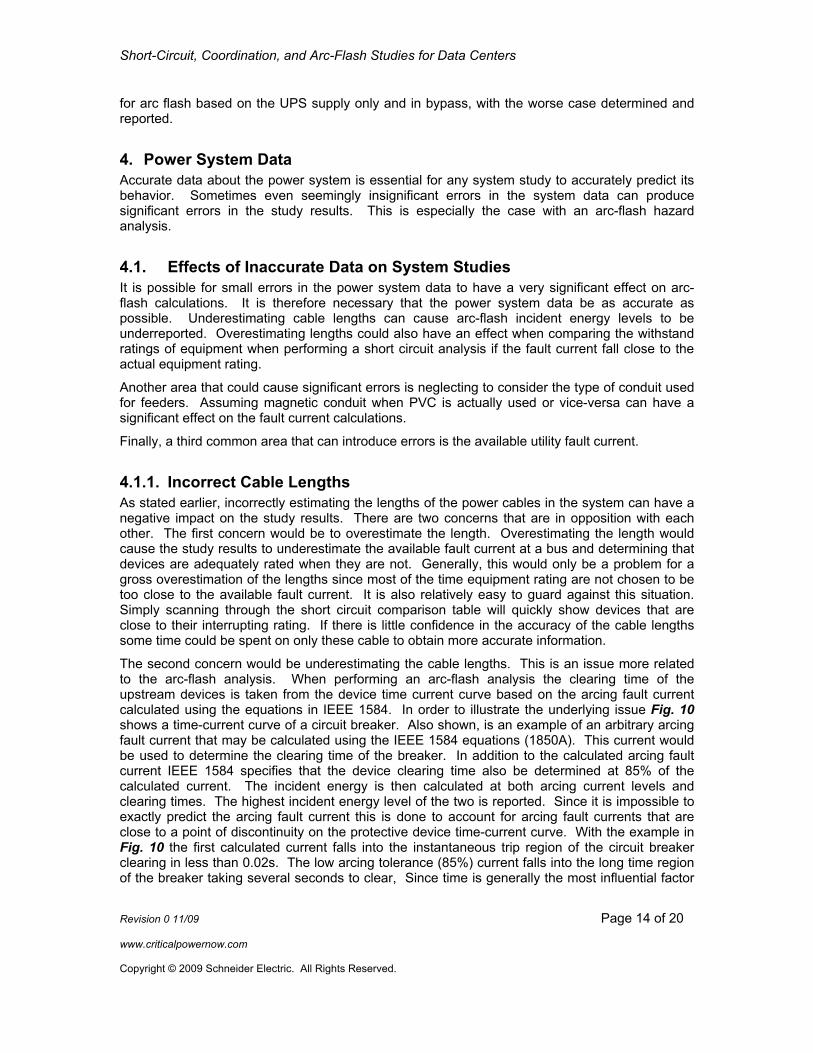
The second concern would be underestimating the cable lengths. This is an issue more related to the arc-flash analysis. When performing an arc-flash analysis the clearing time of the upstream devices is taken from the device time current curve based on the arcing fault current calculated using the equations in IEEE 1584. In order to illustrate the underlying issue Fig. 10 shows a time-current curve of a circuit breaker. Also shown, is an example of an arbitrary arcing fault current that may be calculated using the IEEE 1584 equations (1850A). This current would be used to determine the clearing time of the breaker. In addition to the calculated arcing fault current IEEE 1584 specifies that the device clearing time also be determined at 85% of the calculated current. The incident energy is then calculated at both arcing current levels and clearing times. The highest incident energy level of the two is reported. Since it is impossible to exactly predict the arcing fault current this is done to account for arcing fault currents that are close to a point of discontinuity on the protective device time-current curve. With the example in Fig. 10 the first calculated current falls into the instantaneous trip region of the circuit breaker clearing in less than 0.02s. The low arcing tolerance (85%) current falls into the long time region of the breaker taking several seconds to clear, Since time is generally the most influential factor
Revision 0 11/09 Page 14 of 20 www.criticalpowernow.com Copyright © 2009 Schneider Electric. All Rights Reserved.

Short-Circuit, Coordination, and Arc-Flash Studies for Data Centers
in determining the incident energy level during an arcing fault there will be a very significant difference in incident energy.
Revision 0 11/09 Page 15 of 20 www.criticalpowernow.com
the model.
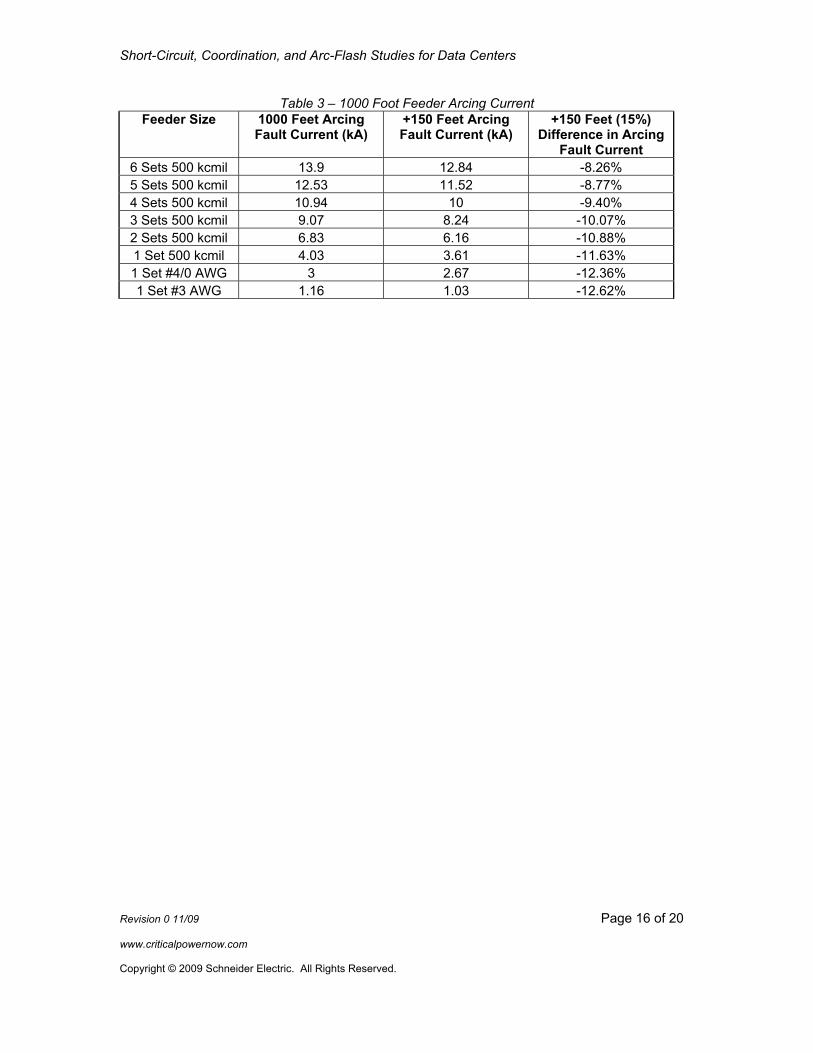
Unlike the short circuit analysis it is difficult to determine from the output of an arc-flash analysis if a bus is close to making the jump in incident energy by being close to the point of discontinuity of a protective device. If that were the case the study engineer could simply scrutinize the few, if any, cable lengths where the fault current was close. Fortunately, The IEEE 1584 low arcing tolerance can provide some cover. Tables Table 1, Table 2 and Table 3 below shows the results of a comparison of the difference in arcing fault currents for cables of 50, 100 and 1000 feet in length based on an underestimation of the cable length by 15%. As expected, underestimating the length of smaller gauge conductors has a much larger effect than on larger gauge conductors. Also, note that the longer the cable length, the larger the effect. Generally, the tables show that the IEEE 1584 low arcing current tolerance has the capability of easily accounting for a 15% error in cable lengths with some room to spare for other inaccuracies in
This is by no means an exhaustive analysis and should not be considered a hard and fast rule. Cable lengths should always be measured as precisely as possible. There is no ANSI/IEEE standard that specifies a recommended accuracy of cable lengths. The study engineer must make his own determination based on his confidence in the accuracy of the cable data.
Table 1 – 50 Foot Feeder Arcing Current Feeder Size 50 Feet Arcing Fault
Current (kA) +57.5 (15%) Feet
Arcing Fault Current (kA)
+57.5 Feet (15%)Difference in
Arcing Fault Current 6 Sets 500 kcmil 30.38 30.09 -0.96% 5 Sets 500 kcmil 30 29.66 -1.15% 4 Sets 500 kcmil 29.44 29.03 -1.41% 3 Sets 500 kcmil 28.55 28.05 -1.78% 2 Sets 500 kcmil 26.93 26.26 -2.55% 1 Set 500 kcmil 23.02 22.07 -4.30% 1 Set #4/0 AWG 21.31 20.21 -5.44% 1 Set #3 AWG 12.92 11.73 -10.14%
Table 2 – 100 Foot Feeder Arcing Current
Feeder Size (Steel Conduit)
100 Feet Arcing Fault Current (kA)
+15 (15%) Feet Arcing Fault Current
(kA)
+15 Feet (15%) Difference in Arcing
Fault Current 6 Sets 500 kcmil 28.55 28.05 -1.78% 5 Sets 500 kcmil 27.88 27.31 -2.09% 4 Sets 500 kcmil 26.93 26.26 -2.55% 3 Sets 500 kcmil 25.49 24.69 -3.24% 2 Sets 500 kcmil 23.02 22.07 -4.30% 1 Set 500 kcmil 17.9 16.8 -6.55% 1 Set #4/0 AWG 15.59 14.44 -7.96% 1 Set #3 AWG 7.78 6.97 -11.62%
Copyright © 2009 Schneider Electric. All Rights Reserved.
Short-Circuit, Coordination, and Arc-Flash Studies for Data Centers
Table 3 – 1000 Foot Feeder Arcing Current Feeder Size 1000 Feet Arcing
Fault Current (kA) +150 Feet Arcing Fault Current (kA)
+150 Feet (15%) Difference in Arcing
Fault Current 6 Sets 500 kcmil 13.9 12.84 -8.26% 5 Sets 500 kcmil 12.53 11.52 -8.77% 4 Sets 500 kcmil 10.94 10 -9.40% 3 Sets 500 kcmil 9.07 8.24 -10.07% 2 Sets 500 kcmil 6.83 6.16 -10.88% 1 Set 500 kcmil 4.03 3.61 -11.63% 1 Set #4/0 AWG 3 2.67 -12.36% 1 Set #3 AWG 1.16 1.03 -12.62%
Revision 0 11/09 Page 16 of 20 www.criticalpowernow.com Copyright © 2009 Schneider Electric. All Rights Reserved.

Short-Circuit, Coordination, and Arc-Flash Studies for Data Centers
Fig. 10 Arcing Fault Current Tolerance
Revision 0 11/09 Page 17 of 20 www.criticalpowernow.com Copyright © 2009 Schneider Electric. All Rights Reserved.
Short-Circuit, Coordination, and Arc-Flash Studies for Data Centers
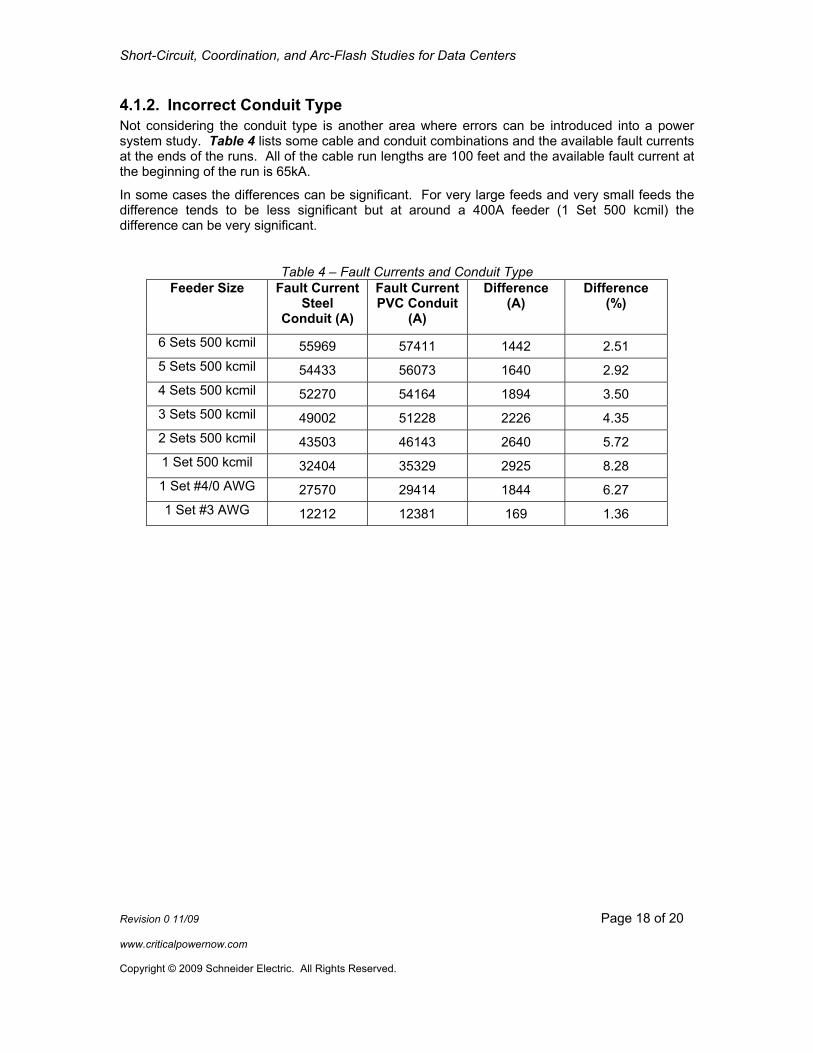
4.1.2. Incorrect Conduit Type Not considering the conduit type is another area where errors can be introduced into a power system study. Table 4 lists some cable and conduit combinations and the available fault currents at the ends of the runs. All of the cable run lengths are 100 feet and the available fault current at the beginning of the run is 65kA.
In some cases the differences can be significant. For very large feeds and very small feeds the difference tends to be less significant but at around a 400A feeder (1 Set 500 kcmil) the difference can be very significant.
Table 4 – Fault Currents and Conduit Type Feeder Size Fault Current
Steel Conduit (A)
Fault Current PVC Conduit
(A)
Difference (A)
Difference (%)
6 Sets 500 kcmil 55969 57411 1442 2.51 5 Sets 500 kcmil 54433 56073 1640 2.92 4 Sets 500 kcmil 52270 54164 1894 3.50 3 Sets 500 kcmil 49002 51228 2226 4.35 2 Sets 500 kcmil 43503 46143 2640 5.72 1 Set 500 kcmil 32404 35329 2925 8.28 1 Set #4/0 AWG 27570 29414 1844 6.27 1 Set #3 AWG 12212 12381 169 1.36
Revision 0 11/09 Page 18 of 20 www.criticalpowernow.com Copyright © 2009 Schneider Electric. All Rights Reserved.
Short-Circuit, Coordination, and Arc-Flash Studies for Data Centers
4.1.3. Utility Fault Current Data A final, common area of concern, when considering data accuracy is the available fault current as given by the electric utility. Although it has improved in recent years there are still many utilities that only give the maximum available fault current at a customer’s service entrance. This is most often the case with 480V service entrances. For medium voltage service entrances it is common to get the maximum value along with an actual present value.
The maximum value is needed to run the short circuit analysis however lower values should always be considered when performing an arc-flash hazard analysis since lower fault currents quite often produce higher incident energy levels.
Determining what to use for the minimum levels for a 480V or 208V service entrance may seem to require pure guesswork but some basic analysis and reasonable assumptions can be used to determine realistic values. There are no methods given in the present standards to assist in determining realistic values. The method below is presented simply as an example. The study engineer should always use a method and assumptions that fit best with his experience with power systems and utilities in the area of the project.
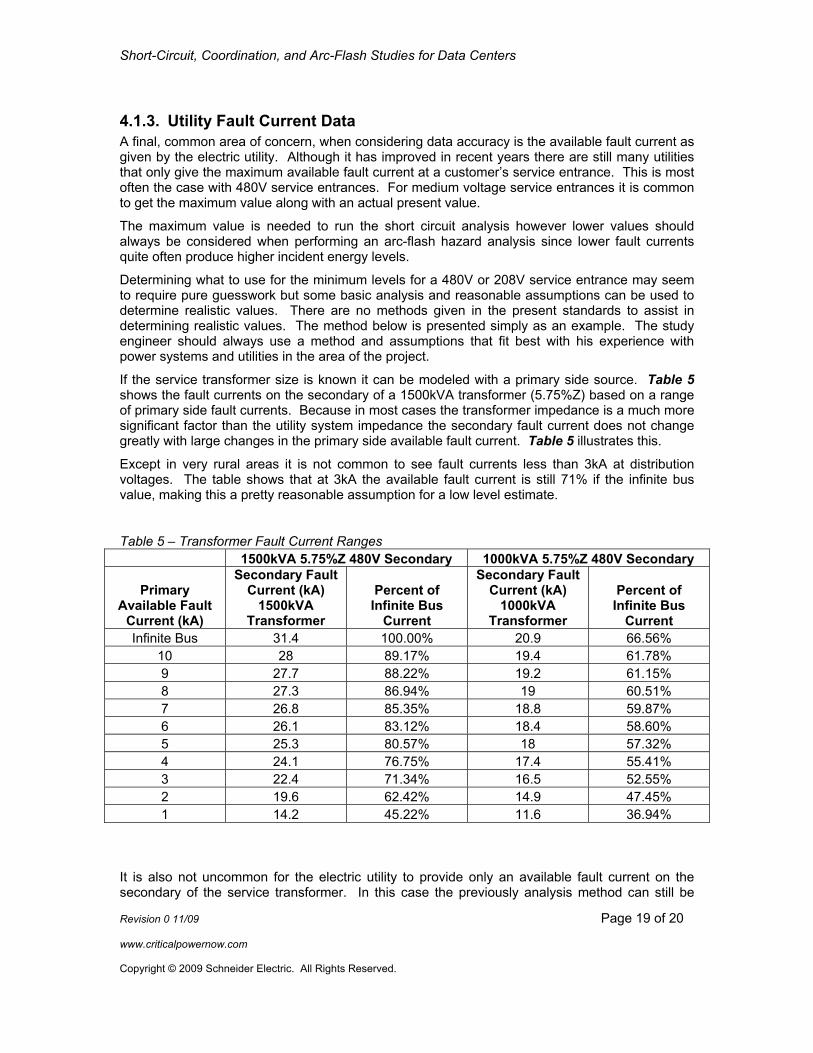
If the service transformer size is known it can be modeled with a primary side source. Table 5 shows the fault currents on the secondary of a 1500kVA transformer (5.75%Z) based on a range of primary side fault currents. Because in most cases the transformer impedance is a much more significant factor than the utility system impedance the secondary fault current does not change greatly with large changes in the primary side available fault current. Table 5 illustrates this.
Except in very rural areas it is not common to see fault currents less than 3kA at distribution voltages. The table shows that at 3kA the available fault current is still 71% if the infinite bus value, making this a pretty reasonable assumption for a low level estimate.
Table 5 – Transformer Fault Current Ranges 1500kVA 5.75%Z 480V Secondary 1000kVA 5.75%Z 480V Secondary
Primary Available Fault
Current (kA)
Secondary Fault Current (kA)
1500kVA Transformer
Percent of Infinite Bus
Current
Secondary Fault Current (kA)
1000kVA Transformer
Percent of Infinite Bus
Current Infinite Bus 31.4 100.00% 20.9 66.56%
10 28 89.17% 19.4 61.78% 9 27.7 88.22% 19.2 61.15% 8 27.3 86.94% 19 60.51% 7 26.8 85.35% 18.8 59.87% 6 26.1 83.12% 18.4 58.60% 5 25.3 80.57% 18 57.32% 4 24.1 76.75% 17.4 55.41% 3 22.4 71.34% 16.5 52.55% 2 19.6 62.42% 14.9 47.45% 1 14.2 45.22% 11.6 36.94%
It is also not uncommon for the electric utility to provide only an available fault current on the secondary of the service transformer. In this case the previously analysis method can still be
Revision 0 11/09 Page 19 of 20 www.criticalpowernow.com Copyright © 2009 Schneider Electric. All Rights Reserved.
Short-Circuit, Coordination, and Arc-Flash Studies for Data Centers
Revision 0 11/09 Page 20 of 20 www.criticalpowernow.com Copyright © 2009 Schneider Electric. All Rights Reserved.
used however, an assumption needs to be made in regards to the transformer kVA rating. If one were to choose a kVA rating that matched the service entrance ampacity it would likely be larger than the transformer installed by the utility. It is not uncommon for the utility to install a transformer one size smaller than the rated ampacity of the service entrance while quoting a fault current for the “properly” sized transformer. For the example in Table 5 this would be a 1000kVA transformer with the same impedance (5.75%Z). At 3kA primary side fault current this give a fault current on the secondary that is close to 50% of the larger transformer infinite bus value. Again, this is probably not a bad estimate if only given the secondary side fault current.
Most of the time, when the lower fault currents are used for the arc-flash analysis, only a few locations will see their incident energy levels increase. The reason for the increase is usually because the high estimate of the available fault current placed the arcing fault current close to a point of discontinuity of a protective device. The main purpose for using the lower available fault current value is to root out those cases and extreme accuracy in the low level estimate is not normally necessary.
5. Conclusions Data center power systems offer special challenges to the study engineer and the design engineer. The selection and arrangement of the components in the power system significantly affect the arc flash study outcome. Design practices that used to be common (infinite bus short circuit calculation, large PDU transformers, etc) are not conducive to controlling arc flash energies. Arc flash mitigation must be designed into the data center power system at the concept stage. Additionally, due to the various operating scenarios, data center power system studies require an extra level of diligence of the study engineer. Select a study team that has sufficient resources to evaluate the system parameters completely and accurately, and invests the necessary effort to acquire a reasonable compromise between selectivity (reliability) and arc flash energies.
6. References [1] ANSI C37.010, Application Guide for AC High-Voltage Circuit Breakers Rated on a
Symmetrical Current Basis
[2] ANSI/IEEE C37.5, IEEE Standard for Low-Voltage AC Power Circuit Breakers Used in Enclosures
[3] IEEE 141-1993, IEEE Recommended Practice for Electric Power Distribution for Industrial Plants (IEEE Red Book)
[4] IEEE 1584-2002, Guide for Performing Arc-Flash Hazard Calculations
[5] NFPA 70E-2009, Standard for Electrical Safety in the Workplace