short note using the ntsc color space to double the ...sep · using the ntsc color space to double...
TRANSCRIPT
Stanford Exploration Project, Report 110, September 18, 2001, pages 1–181
Short Note
Using the NTSC color space to double the quantity of informationin an image
Ioan Vlad1
INTRODUCTION
Geophysical images are, by their nature, intensity images: matrices of real numbers. Thus,representing an image in a color scale will only enlarge the visible dynamic color range withoutadding any information. But color can be used to encode information taken from a secondgeophysical image. The combination of the two images produces a meaningful image thatcan be understood better if two criteria are fulfilled: 1) The information used to create color(referred to from now on as the chrominance image) is entirely separated from the shading(black and white) information (referred to from now on as the luminance image). 2) Thefrequency content of the chrominance image must be different from that of the luminanceimage, preferably richer in lower frequencies, since the human eye is less sensitive to highspatial frequency color information. This short note will show how to combine two intensityimages (i.e. a seismic section and a velocity model) into a single color image, using the NTSC(National Television Standards Committee) color space.
NTSC AND ITS PROPERTIES
The human eye has receptors for three primary colors - red, green and blue (Ruston, 1975).Thus, all color spaces have three dimensions. There are several color spaces available, the mostwidely known being RGB (Red-Green-Blue), HSV (Hue-Saturation-Value) and NTSC. NTSCis the color space used for television broadcast in the United States, and the only space amongthe above-mentioned ones that realizes a complete separation between the luminance and thechrominance information. NTSC has this property because when it was introduced, it had toseparate the information used by the monochrome TV receivers from the supplementary oneused by color receivers. (Blinn, 1993). The components of the NTSC color space are Y (theluminance component), I (the cyan-orange component), and Q (the green-purple component).There is a link between I and Q and the more intuitive hue and saturation: components I andQ have the property that, when modulated in quadrature in respect to each other by the 3.58
1email: [email protected]
1
2 Vlad SEP–110
MHz TV carrier wave and then summed, they form a signal (chrominance) whose magnituderepresents the color saturation and whose phase represents the hue (Kuhn, 1996).
Saturation and hue are directly present as components of the HSV color space, and theirmeaning is more intuitive than that of the NTSC I and Q axes, so why not use HSV insteadthen? We must not not confuse between meaningfulness of the axes and meaningfulness ofthe object represented using these axes: because the separation between the luminance andchrominance information is not complete in HSV, those parts of the luminance image that aredark are not colored effectively and are rendered deep tones of gray, and ultimately a blackpixel in the V component of HSV results in a black spot in a final image, thus not in the desiredcolor. HSV images with the V component given by the luminance, and the H and S by thechrominance, will thus lack the ability to render fine detail, and the continuity of the color fieldwill be broken by the dark pixels. The meaning of the dimensions of the HSV color space iseasy to understand, but the final target, an image produced by taking the V component fromone intensity image and the H and S components from the second intensity image, is harderto interpret than an image created in a similar manner using the NTSC color space. The exactway of constructing such an image using the NTSC color space is detailed in the next section.
CREATING THE COLOR IMAGE
The input data in this process consists of the luminance and the chrominance images. Bothare stored in real-valued, normalized matrices (respectively L and C). The output will be aRGB image with three components: R,G and B, obtained by transforming a NTSC imagecomposed of the matrices Y, I and Q. The first step is thus transforming L and C into theNTSC components Y, I and Q through a colormap operator (actually, a set of three relatedoperators)
Y = M1L (1)
I = M2C (2)
Q = M3C (3)
The next section will elaborate on the construction of the three operators. Once the Y, I andQ matrices are obtained, we basically have the color image, but since computer devices workwith RGB, we usually need to transform to RGB with the equation R
GB
=
1.0001.0001.000
0.956−0.272−1.106
0.621−0.6471.703
YIQ
(4)
before writing the file to disk (Kuhn, 1996).
BUILDING THE THREE COLORMAP OPERATORS
In simple casesM1, from eq. (1), is a histogram equalization operator (for contrast adjustment)or only the identity matrix, andM2 and M3 represent raising each point in the matrix to a
SEP–110 Image display with NTSC 3
0 0.1 0.2 0.3 0.4 0.5 0.6 0.7 0.8 0.9 10
0.2
0.4
0.6
0.8
1
Matlab’s jet colormap in the RGB, respectively NTSC color spaces
RGB
colo
rmap
val
ues
RGB
0 0.1 0.2 0.3 0.4 0.5 0.6 0.7 0.8 0.9 1−1
−0.5
0
0.5
1
Value of L or C to be pointwise multiplied with the plotted coefficients (M1,M2,M3)
NTSC
col
orm
ap v
alue
s
M1M2M3
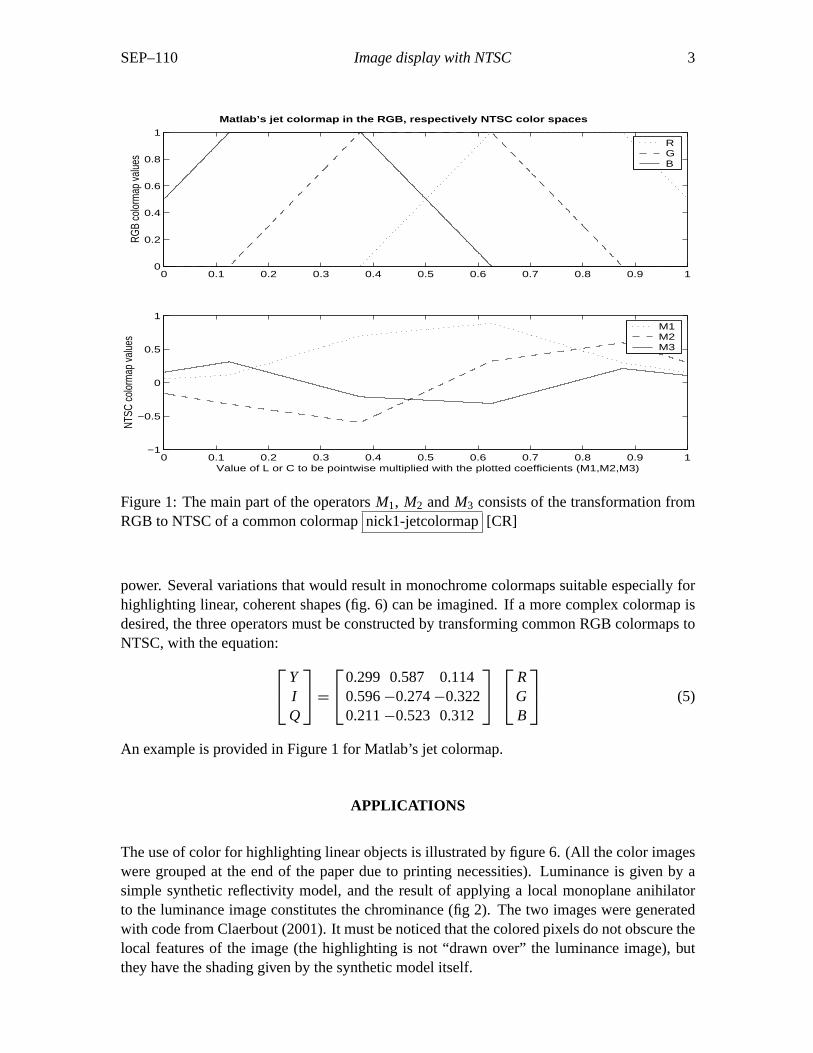
Figure 1: The main part of the operatorsM1, M2 andM3 consists of the transformation fromRGB to NTSC of a common colormapnick1-jetcolormap[CR]
power. Several variations that would result in monochrome colormaps suitable especially forhighlighting linear, coherent shapes (fig. 6) can be imagined. If a more complex colormap isdesired, the three operators must be constructed by transforming common RGB colormaps toNTSC, with the equation: Y
IQ
=
0.2990.5960.211
0.587−0.274−0.523
0.114−0.3220.312
RGB
(5)
An example is provided in Figure 1 for Matlab’s jet colormap.
APPLICATIONS
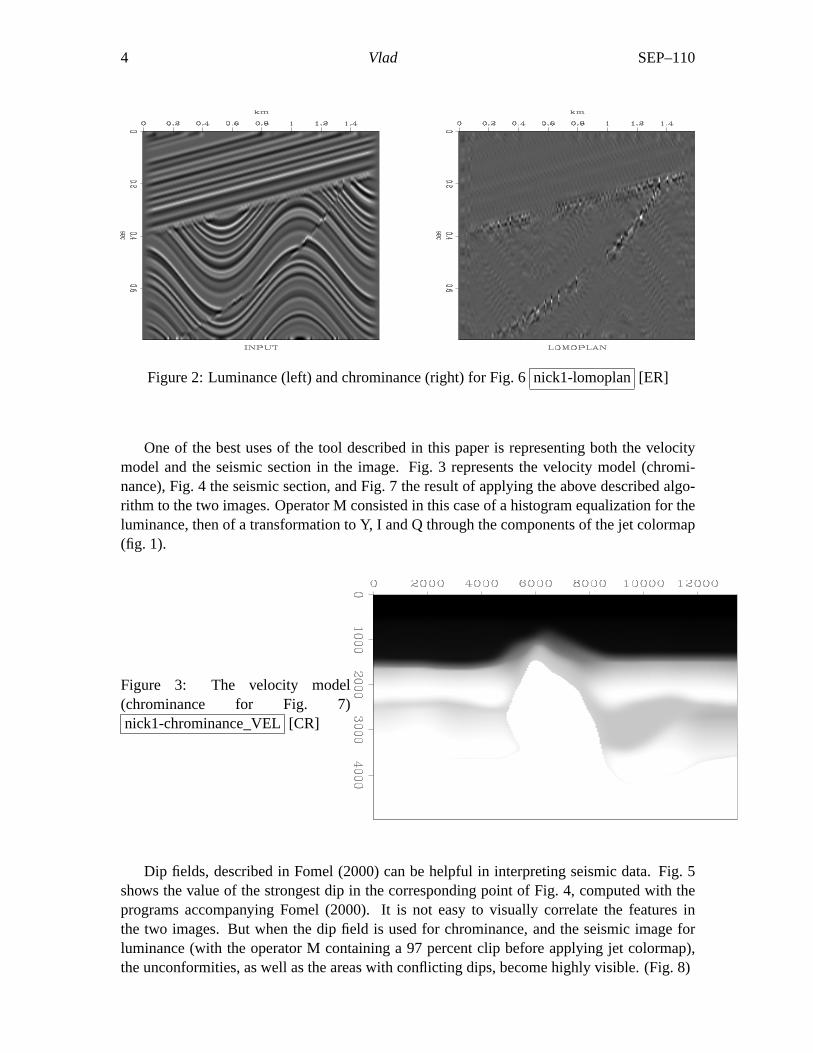
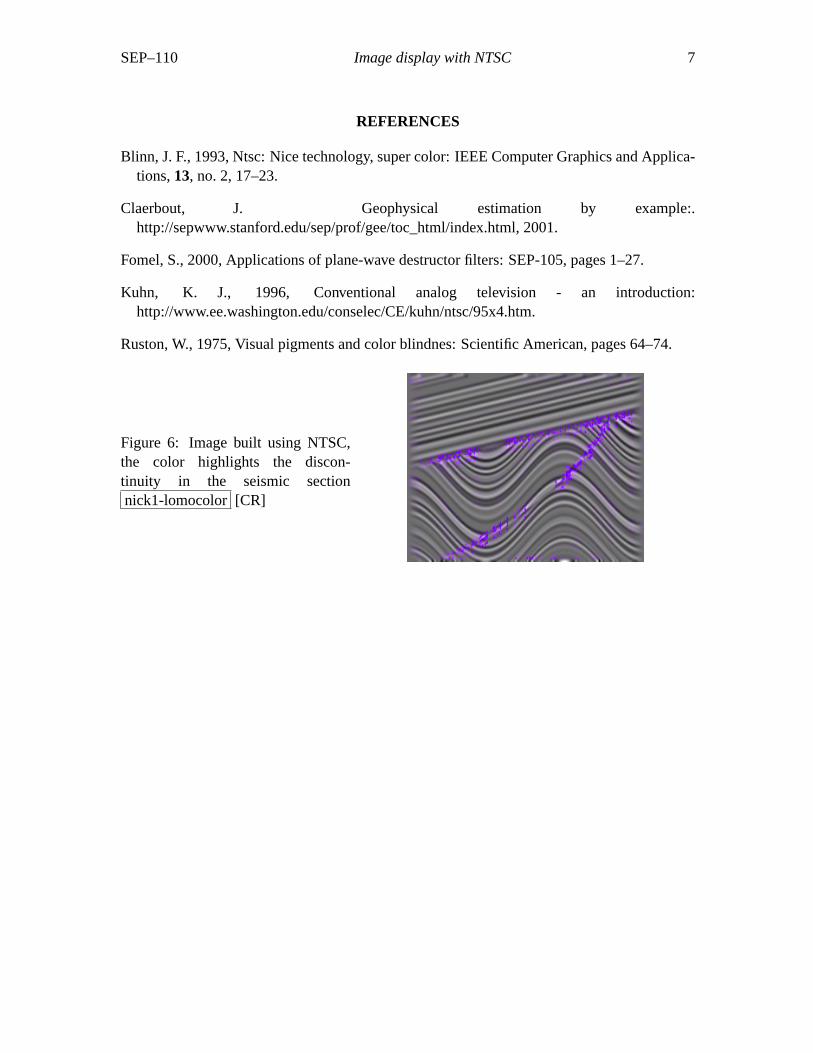
The use of color for highlighting linear objects is illustrated by figure 6. (All the color imageswere grouped at the end of the paper due to printing necessities). Luminance is given by asimple synthetic reflectivity model, and the result of applying a local monoplane anihilatorto the luminance image constitutes the chrominance (fig 2). The two images were generatedwith code from Claerbout (2001). It must be noticed that the colored pixels do not obscure thelocal features of the image (the highlighting is not “drawn over” the luminance image), butthey have the shading given by the synthetic model itself.
4 Vlad SEP–110
Figure 2: Luminance (left) and chrominance (right) for Fig. 6nick1-lomoplan[ER]
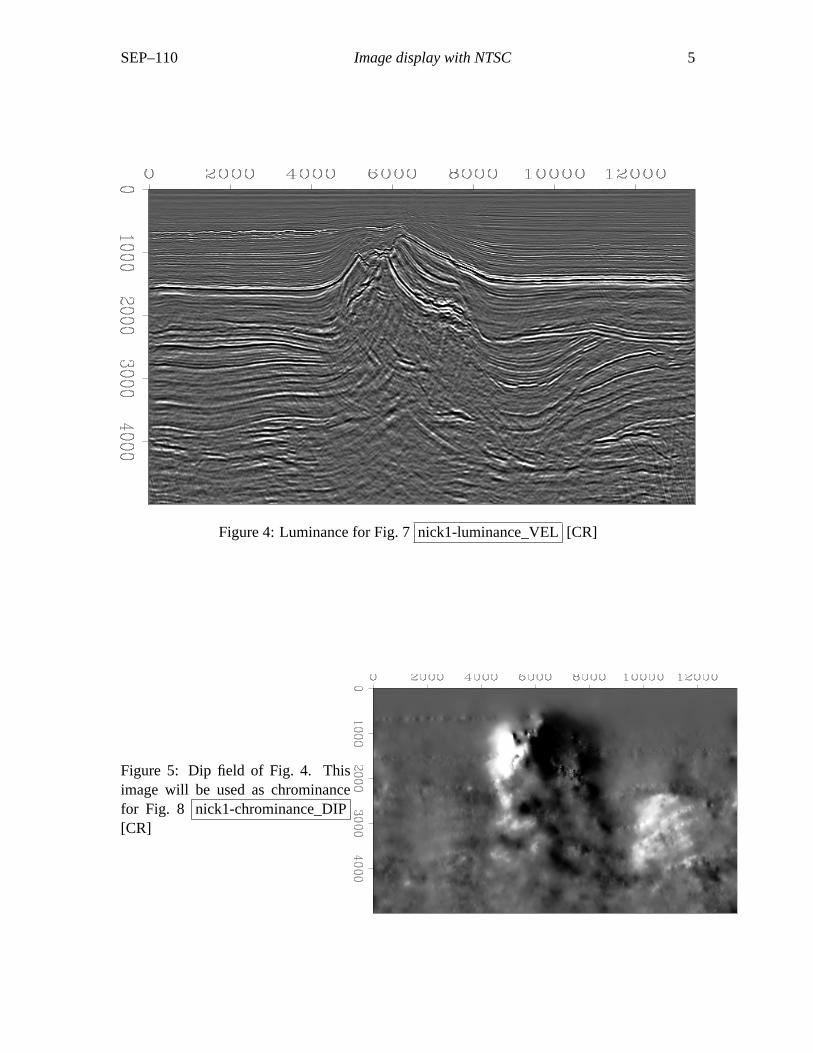
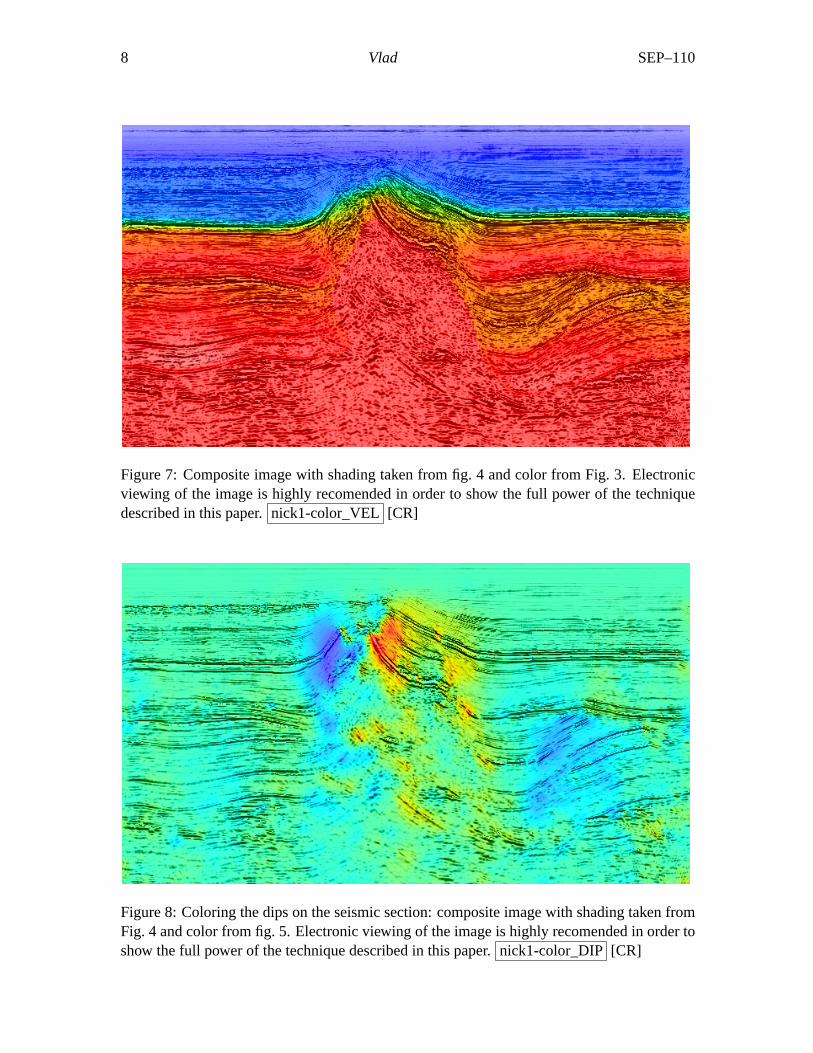
One of the best uses of the tool described in this paper is representing both the velocitymodel and the seismic section in the image. Fig. 3 represents the velocity model (chromi-nance), Fig. 4 the seismic section, and Fig. 7 the result of applying the above described algo-rithm to the two images. Operator M consisted in this case of a histogram equalization for theluminance, then of a transformation to Y, I and Q through the components of the jet colormap(fig. 1).
Figure 3: The velocity model(chrominance for Fig. 7)nick1-chrominance_VEL[CR]
Dip fields, described in Fomel (2000) can be helpful in interpreting seismic data. Fig. 5shows the value of the strongest dip in the corresponding point of Fig. 4, computed with theprograms accompanying Fomel (2000). It is not easy to visually correlate the features inthe two images. But when the dip field is used for chrominance, and the seismic image forluminance (with the operator M containing a 97 percent clip before applying jet colormap),the unconformities, as well as the areas with conflicting dips, become highly visible. (Fig. 8)
SEP–110 Image display with NTSC 5
Figure 4: Luminance for Fig. 7nick1-luminance_VEL[CR]
Figure 5: Dip field of Fig. 4. Thisimage will be used as chrominancefor Fig. 8 nick1-chrominance_DIP[CR]

6 Vlad SEP–110
CONCLUSIONS
NTSC is the color space with the best separation between the luminance and the chrominanceinformation. It is useful for enhancing the interpretability of geophysical images in a simple,intuitive way, easy to implement into software and computationally inexpensive. Several otherexamples can be found at http://sepwww.stanford.edu/sep/nick/research/NTSC/ . Future workinclude implementation of this feature into SEPlib.
SEP–110 Image display with NTSC 7
REFERENCES
Blinn, J. F., 1993, Ntsc: Nice technology, super color: IEEE Computer Graphics and Applica-tions,13, no. 2, 17–23.
Claerbout, J. Geophysical estimation by example:.http://sepwww.stanford.edu/sep/prof/gee/toc_html/index.html, 2001.
Fomel, S., 2000, Applications of plane-wave destructor filters: SEP-105, pages 1–27.
Kuhn, K. J., 1996, Conventional analog television - an introduction:http://www.ee.washington.edu/conselec/CE/kuhn/ntsc/95x4.htm.
Ruston, W., 1975, Visual pigments and color blindnes: Scientific American, pages 64–74.
Figure 6: Image built using NTSC,the color highlights the discon-tinuity in the seismic sectionnick1-lomocolor [CR]
8 Vlad SEP–110
Figure 7: Composite image with shading taken from fig. 4 and color from Fig. 3. Electronicviewing of the image is highly recomended in order to show the full power of the techniquedescribed in this paper.nick1-color_VEL [CR]
Figure 8: Coloring the dips on the seismic section: composite image with shading taken fromFig. 4 and color from fig. 5. Electronic viewing of the image is highly recomended in order toshow the full power of the technique described in this paper.nick1-color_DIP [CR]

182 SEP–110