short-term energy outlook model documentation: electricity ...u.s. energy information administration...
TRANSCRIPT
Short-Term Energy Outlook
Model Documentation:
Electricity Generation and Fuel
Consumption Models
January 2014
Independent Statistics & Analysis
www.eia.gov
U.S. Department of Energy
Washington, DC 20585

U.S. Energy Information Administration | STEO Model Documentation: Electricity Generation and Fuel Consumption Models i
This report was prepared by the U.S. Energy Information Administration (EIA), the statistical and
analytical agency within the U.S. Department of Energy. By law, EIA’s data, analyses, and forecasts are
independent of approval by any other officer or employee of the United States Government. The views
in this report therefore should not be construed as representing those of the U.S. Department of Energy
or other Federal agencies.
January 2014
U.S. Energy Information Administration | STEO Model Documentation: Electricity Generation and Fuel Consumption Models ii
Contents
1. Overview .................................................................................................................................................. 1
2. Data Sources ............................................................................................................................................ 2
3. Variable Naming Convention ................................................................................................................... 3
4. U.S. Electricity Generation Model ............................................................................................................ 5
A. Electric Power Sector Generation ...................................................................................................... 8
i. Fossil Fuel Generation ................................................................................................................... 9
ii. Nuclear Generation .................................................................................................................... 11
iii. Hydroelectric Generation .......................................................................................................... 11
iv. Renewable and Other Generation ............................................................................................. 12
B. Commercial and Industrial Sector Generation ................................................................................. 14
5. U.S. Fuel Consumption Model ............................................................................................................... 15
6. Forecast Evaluations .............................................................................................................................. 18
A. Electricity Generation ....................................................................................................................... 18
B. Fuel Consumption ............................................................................................................................. 22
Appendix A. Variable Definitions ............................................................................................................... 24
Appendix B. Eviews Model Object File (electricity generation) ................................................................. 44
Appendix C. Generation Model Regression Results................................................................................... 62
Appendix D. Eviews Model Object File (fossil fuel consumption)............................................................ 137
Appendix E. Fuel Consumption Model Regression Results ...................................................................... 150

January 2014
U.S. Energy Information Administration | STEO Model Documentation: Electricity Generation and Fuel Consumption Models 1
1. Overview
The U.S. Energy Information Administration's Short-Term Energy Outlook (STEO) produces monthly
projections of energy supply, demand, trade, and prices over a 13-24 month period. Every January, the
forecast horizon is extended through December of the following year. The STEO model is an integrated
system of econometric regression equations and identities that link the various components of the U.S.
energy industry together in order to develop consistent forecasts. The regression equations are
estimated and the STEO model is solved using the Eviews 8 econometric software package from IHS
Global Inc. The model consists of various sub-modules specific to each form of energy resource. All
modules provide projections for the United States, and some modules provide more detailed forecasts
for different regions of the country.
The electricity supply and fuel consumption modules of the STEO model provide, respectively, forecasts
of electricity generation from various types of energy sources and forecasts of the quantities of fossil
fuels consumed for power generation. The supply module is closely linked with the electricity demand
module, from which the total level of required generation is derived. The fuel consumption module is
closely associated with the electricity supply module, and it provides inputs into other components of
the STEO model. The structure of the electricity industry and the behavior of power generators varies
between different areas of the United States. In order to capture these differences, the STEO electricity
supply and fuel consumption models are designed to provide forecasts for the four primary Census
regions shown in Figure 1.
Figure 1. U.S. Census regions and divisions
West
Region
South
Region
Midwest
Region Northeast
Region

January 2014
U.S. Energy Information Administration | STEO Model Documentation: Electricity Generation and Fuel Consumption Models 2
2. Data Sources
All of the data input for the STEO electricity generation and fuel consumption models are in a monthly
frequency. In most cases, generation and fuel consumption data are expressed in average per-day units
for each month, so that the data can be integrated into other STEO model components. The primary
data sources for the electricity generation and fuel consumption models of the STEO are:
EIA Electric Power Monthly
EIA Electric Monthly Update
EIA Electric Power Annual
Electricity generation and fossil fuel consumption data in each of these three publications are derived
from information collected via Form EIA-923 from all electric power and combined heat and power
(CHP) plants with total generator nameplate capacity of 1 megawatt (MW) or greater. All respondents
are required to file Form EIA-923 once a year. A sample of respondents files their forms monthly.1 EIA
estimates monthly generation and fuel consumption data for non-sampled respondents for the most
recent year.
The STEO model supplements data published in the three EIA sources listed above with data from
outside sources. Information from the U.S. Nuclear Regulatory Commission provides the foundation for
the model’s projections of nuclear generation, and water flow data from the Bonneville Power
Administration is a primary determinant of the forecasts for hydroelectric generation.
The latest historical data provided in the EIA source publications are generally two to three months
behind the STEO publication date. The model incorporates information from Edison Electric Institute’s
Weekly Electric Output report to estimate total electricity consumption (and electricity generation)
during the most recent months for which EIA data are not yet available. Similarly, Bentek Energy’s
Power Burn Report supplies information to the model for estimating the amount of natural gas
consumed in recent months by the electric power sector.
1 This sample represents about one-third of total respondents but accounts for more than 90% of total generation.
January 2014
U.S. Energy Information Administration | STEO Model Documentation: Electricity Generation and Fuel Consumption Models 3
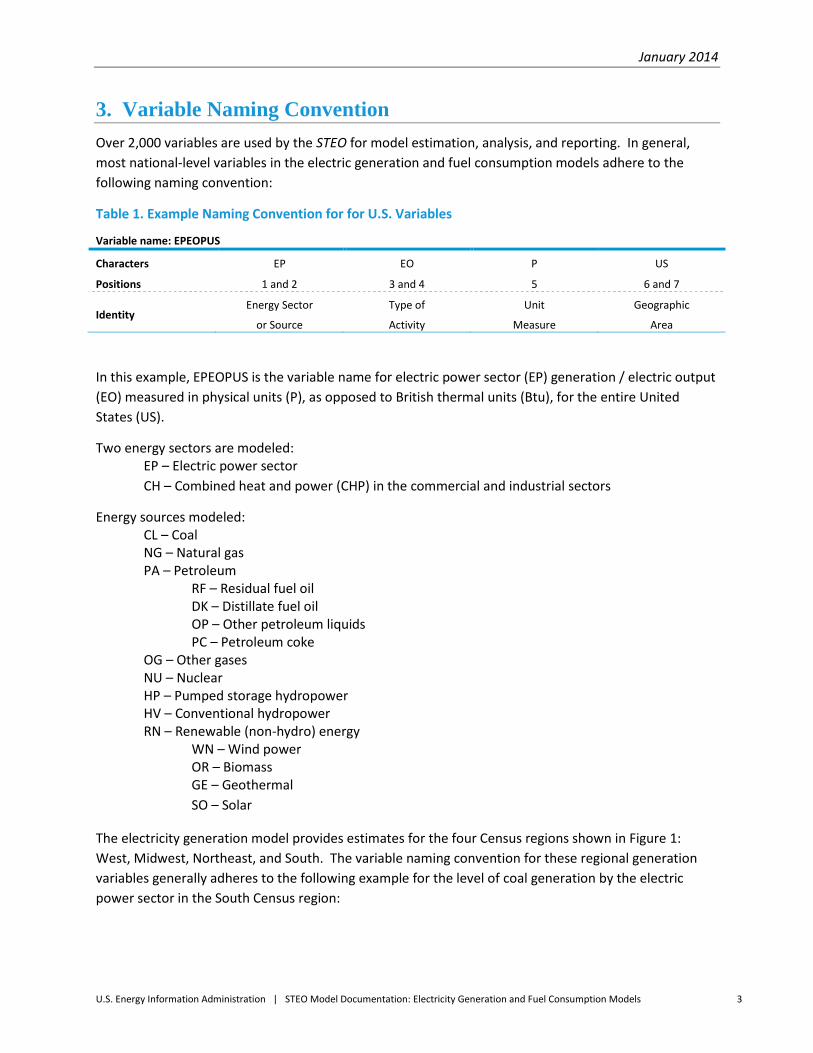
3. Variable Naming Convention
Over 2,000 variables are used by the STEO for model estimation, analysis, and reporting. In general,
most national-level variables in the electric generation and fuel consumption models adhere to the
following naming convention:
Table 1. Example Naming Convention for for U.S. Variables
Variable name: EPEOPUS
Characters EP EO P US
Positions 1 and 2 3 and 4 5 6 and 7
Identity Energy Sector
or Source
Type of
Activity
Unit
Measure
Geographic
Area
In this example, EPEOPUS is the variable name for electric power sector (EP) generation / electric output
(EO) measured in physical units (P), as opposed to British thermal units (Btu), for the entire United
States (US).
Two energy sectors are modeled: EP – Electric power sector
CH – Combined heat and power (CHP) in the commercial and industrial sectors
Energy sources modeled: CL – Coal NG – Natural gas PA – Petroleum RF – Residual fuel oil DK – Distillate fuel oil OP – Other petroleum liquids PC – Petroleum coke OG – Other gases NU – Nuclear HP – Pumped storage hydropower HV – Conventional hydropower RN – Renewable (non-hydro) energy WN – Wind power OR – Biomass GE – Geothermal
SO – Solar
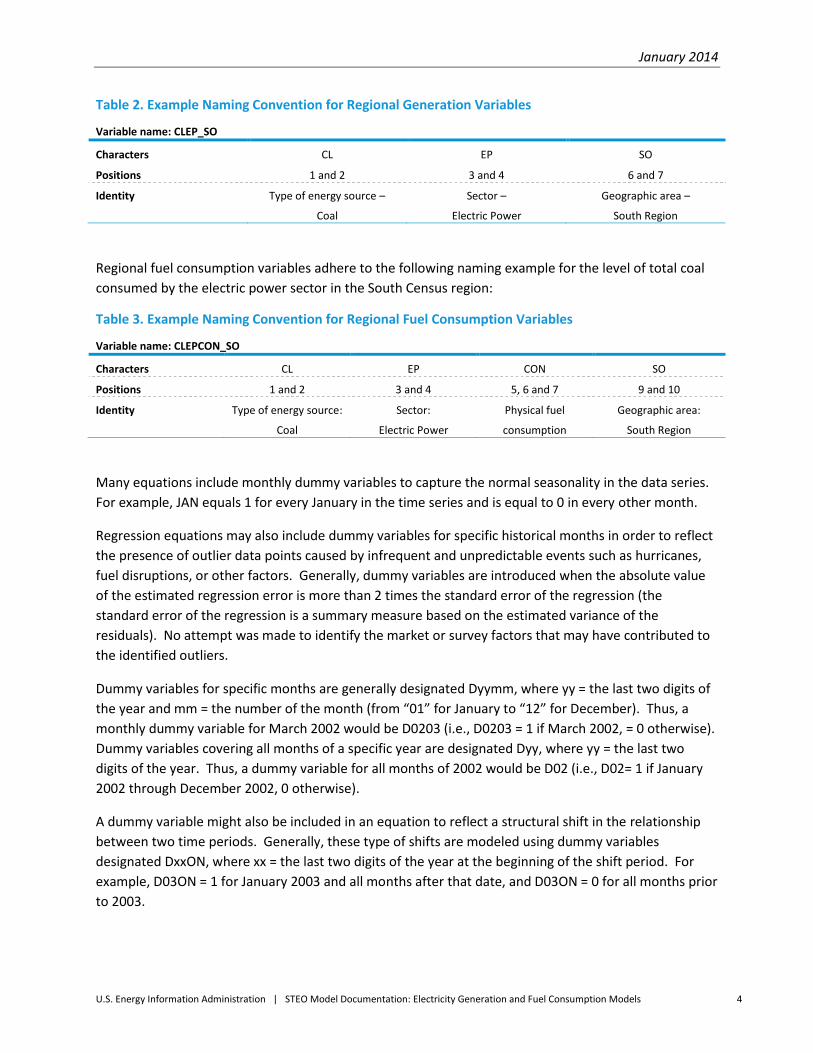
The electricity generation model provides estimates for the four Census regions shown in Figure 1:
West, Midwest, Northeast, and South. The variable naming convention for these regional generation
variables generally adheres to the following example for the level of coal generation by the electric
power sector in the South Census region:
January 2014
U.S. Energy Information Administration | STEO Model Documentation: Electricity Generation and Fuel Consumption Models 4
Table 2. Example Naming Convention for Regional Generation Variables
Variable name: CLEP_SO
Characters CL EP SO
Positions 1 and 2 3 and 4 6 and 7
Identity Type of energy source –
Coal
Sector –
Electric Power
Geographic area –
South Region
Regional fuel consumption variables adhere to the following naming example for the level of total coal
consumed by the electric power sector in the South Census region:
Table 3. Example Naming Convention for Regional Fuel Consumption Variables
Variable name: CLEPCON_SO
Characters CL EP CON SO
Positions 1 and 2 3 and 4 5, 6 and 7 9 and 10
Identity Type of energy source:
Coal
Sector:
Electric Power
Physical fuel
consumption
Geographic area:
South Region
Many equations include monthly dummy variables to capture the normal seasonality in the data series.
For example, JAN equals 1 for every January in the time series and is equal to 0 in every other month.
Regression equations may also include dummy variables for specific historical months in order to reflect
the presence of outlier data points caused by infrequent and unpredictable events such as hurricanes,
fuel disruptions, or other factors. Generally, dummy variables are introduced when the absolute value
of the estimated regression error is more than 2 times the standard error of the regression (the
standard error of the regression is a summary measure based on the estimated variance of the
residuals). No attempt was made to identify the market or survey factors that may have contributed to
the identified outliers.
Dummy variables for specific months are generally designated Dyymm, where yy = the last two digits of
the year and mm = the number of the month (from “01” for January to “12” for December). Thus, a
monthly dummy variable for March 2002 would be D0203 (i.e., D0203 = 1 if March 2002, = 0 otherwise).
Dummy variables covering all months of a specific year are designated Dyy, where yy = the last two
digits of the year. Thus, a dummy variable for all months of 2002 would be D02 (i.e., D02= 1 if January
2002 through December 2002, 0 otherwise).
A dummy variable might also be included in an equation to reflect a structural shift in the relationship
between two time periods. Generally, these type of shifts are modeled using dummy variables
designated DxxON, where xx = the last two digits of the year at the beginning of the shift period. For
example, D03ON = 1 for January 2003 and all months after that date, and D03ON = 0 for all months prior
to 2003.
January 2014
U.S. Energy Information Administration | STEO Model Documentation: Electricity Generation and Fuel Consumption Models 5
4. U.S. Electricity Generation Model
Electricity is produced in order to supply the needs for power used by residential, business, and
governmental consumers. Some electricity is lost along the way as it’s delivered to end-use customers.
Different energy sources are used for electricity generation, based on the economics and availability of
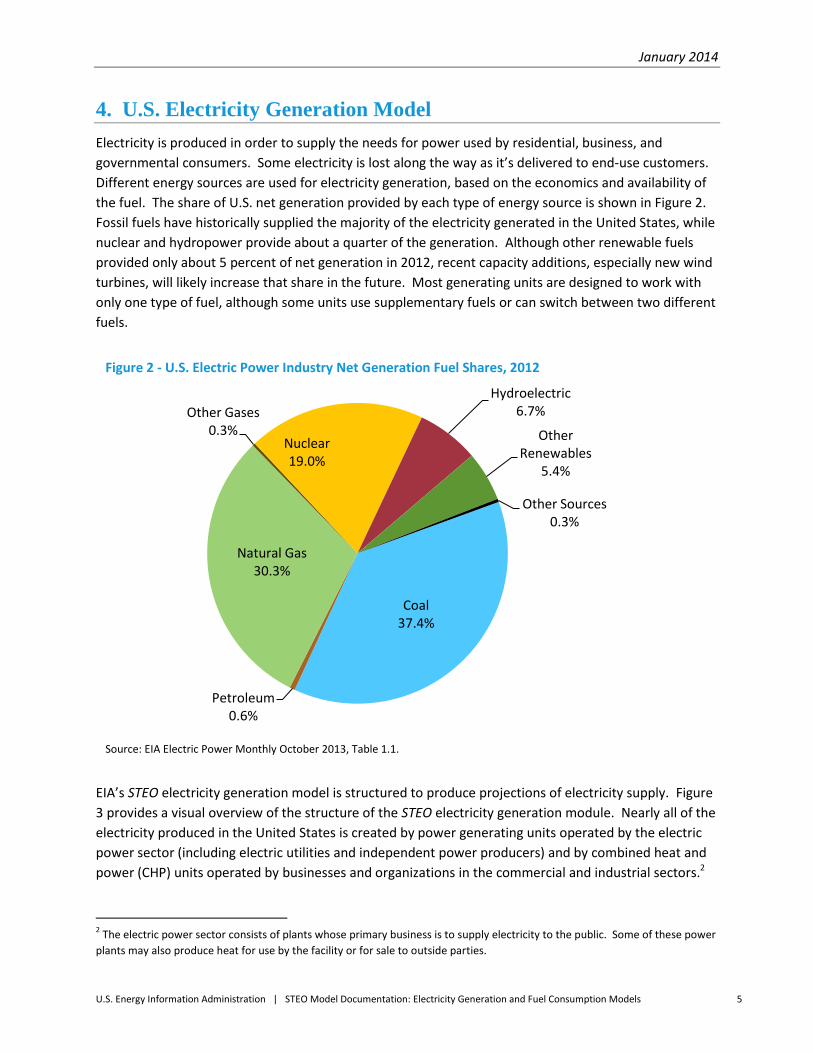
the fuel. The share of U.S. net generation provided by each type of energy source is shown in Figure 2.
Fossil fuels have historically supplied the majority of the electricity generated in the United States, while
nuclear and hydropower provide about a quarter of the generation. Although other renewable fuels
provided only about 5 percent of net generation in 2012, recent capacity additions, especially new wind
turbines, will likely increase that share in the future. Most generating units are designed to work with
only one type of fuel, although some units use supplementary fuels or can switch between two different
fuels.
EIA’s STEO electricity generation model is structured to produce projections of electricity supply. Figure
3 provides a visual overview of the structure of the STEO electricity generation module. Nearly all of the
electricity produced in the United States is created by power generating units operated by the electric
power sector (including electric utilities and independent power producers) and by combined heat and
power (CHP) units operated by businesses and organizations in the commercial and industrial sectors.2
2 The electric power sector consists of plants whose primary business is to supply electricity to the public. Some of these power
plants may also produce heat for use by the facility or for sale to outside parties.
Figure 2 - U.S. Electric Power Industry Net Generation Fuel Shares, 2012
Source: EIA Electric Power Monthly October 2013, Table 1.1.
Coal 37.4%
Petroleum 0.6%
Natural Gas 30.3%
Other Gases 0.3%
Nuclear 19.0%
Hydroelectric 6.7%
Other Renewables
5.4%
Other Sources 0.3%

January 2014
U.S. Energy Information Administration | STEO Model Documentation: Electricity Generation and Fuel Consumption Models 6
The electric power sector supplies more than 95 percent of the total electricity generated in the United
States.
Figure 3 - Short-Term Energy Outlook Electricity Generation Model
The quantity of electricity supplied by electric power generators is directly related to the quantity of
power demanded. In addition to meeting the end-use demand, U.S. generators must be able to cover
any losses associated with the transmission and distribution (T&D) of electricity. Net imports into the
country from Canada and Mexico mitigate some of the need for U.S. generators to produce electricity.
The national electricity demand-supply balance can be summarized by equation 1:
TSEOPUS = EXTCPUS + ELDUPUS + TDLOPUS – ELNIPUS (1) where (all measured in billion kilowatthours per day)
TSEOPUS = Total U.S. electricity generation EXTCPUS = Total U.S. retail sales of electricity ELDUPUS = U.S. direct use of electricity by generating plants TDLOPUS = Transmission and distribution losses ELNIPUS = Net U.S. imports of electricity

January 2014
U.S. Energy Information Administration | STEO Model Documentation: Electricity Generation and Fuel Consumption Models 7
Total electricity consumption in the United States consists of two components: retail sales of electricity
to final consumers and direct use of electricity that is generated by commercial and industrial
establishments. Retail sales of electricity are modeled separately by the STEO electricity consumption
module. Direct use consumption, defined as electricity that is generated onsite (or possibly in an
adjacent facility) and consumed by the same entity that produces the power, is modeled within the
electricity generation module. The ratio of direct use electricity consumption to total commercial and
industrial sector generation is assumed to be the same as in the most recent year for which historical
data is available (equation 2)3:
ELDUPUS = CHEOPUS * (ELDUPUS(-12)/ CHEOPUS(-12)) (2)
where: ELDUPUS = U.S. direct use of electricity by generating plants
CHEOPUS = U.S. generation by the commercial and industrial sectors
Transmission and distribution losses follow a seasonal pattern and are modeled relative to total retail
consumption of electricity as a function of cooling degree days (ZWCDPUS), heating degree days
(ZWHDPUS), and net imports:
TDLOPUS/EXTCPUS = a0 + a1*(ELNIPUS/EXTCPUS) + a2*(ZWCDPUS-ZWCDPUS(-1)) + a3*(ZWHDPUS-ZWHDPUS(-1)) + monthly dummy variables (3)
Imports and exports with Canada and Mexico also follow a seasonal pattern and are assumed to be a
function of U.S. natural gas and coal fuel costs and the level of U.S. hydropower generation. Gross
imports (ELIMPUS) and gross exports (ELEXPUS) are modeled using separate equations but follow the
same function form:
ELIMPUS/EXTCPUS = a0 + a1*CLEUDUS + a2*NGEUDUS + a3*(HYEPTOT/EXTCPUS) + monthly dummy variables (4)
ELEXPUS/EXTCPUS = a0 + a1*CLEUDUS + a2*NGEUDUS + a3*(HYEPTOT/EXTCPUS) + monthly dummy variables (5) where ELIMPUS = Gross imports of electricity into United States, billion kilowatthours per day ELEXPUS = Gross exports of electricity from United States, billion kilowatthours per day EXTCPUS = Total U.S. retail sales / consumption of electricity, billion kilowatthours per day HYEPTOT = U.S. hydroelectric generation by electric power sector, billion kilowatthours per day CLEUDUS = Average cost of coal delivered to electric generators, dollars per million Btu NGEUDUS = Average cost of natural gas delivered to electric generators, dollars per million Btu
Total electricity generated in the United States is produced by two sectors: the electric power sector
and the commercial and industrial sector.
3 The lag operator (-12) indicates the equation is estimating based on the value of the series from 12 months prior to each
observation.

January 2014
U.S. Energy Information Administration | STEO Model Documentation: Electricity Generation and Fuel Consumption Models 8
A. Electric Power Sector Generation
In order to ensure that the national supply-demand balance holds, generation supplied by the U.S.
electric power sector is calculated as the difference between total U.S. generation, as derived above,
and generation by the commercial and industrial sectors (described in the next section).
EPEOPUS = TSEOPUS – CHEOPUS (6)
where (all measured in billion kilowatthours per day) EPEOPUS = U.S. generation by the electric power sector TSEOPUS = Total U.S. generation by all sectors
CHEOPUS = U.S. generation by the commercial and industrial sectors
Electric power sector generation levels are estimated for each Census region as a share of the total U.S.
generation value (equation 7):4
DLOG(EPEO_xx/EPEOPUS) = a0 + a1*DLOG(EXTCP_xx) + a2*DLOG(EXTCP_xx(-1)) + a4*DLOG(CLEUDUS) + a3*DLOG(NGEUDUS) + a5*DLOG(RFEUDUS)
+ a6*DLOG(ELIMPUS) + a7*DLOG(ELEXPUS) (7) where EPEO_xx = Electric power sector generation in Census region [xx], thousand megawatthours per day EXTCP_xx = Total retail sales / consumption of electricity in Census region [xx],
thousand megawatthours per day CLEUDUS = Average U.S. cost of coal delivered to electric generating plants, dollars per million Btu NGEUDUS = Average U.S. cost of natural gas delivered to electric generating plants, dollars per million Btu RFEUDUS = Cost of residual fuel oil delivered to electric generating plants, dollars per million Btu ELIMPUS = Gross imports of electricity into United States, billion kilowatthours per day ELEXPUS = Gross exports of electricity from United States, billion kilowatthours per day
These regional electric power sector generation equations are modeled using the year-over-year growth
in each variable, measured as the twelve-month lagged difference in the logarithm of the variable
(notated in the equation as “DLOG”). The primary drivers of the proportion of total generation
produced within each region are the growth in regional electricity sales; fuel costs for coal, natural gas,
and residual fuel oil; and electricity imports and exports. The lagged value of regional electricity
consumption is included to account for differences in the reporting periods of generation data and
consumption data.5
4 Most of the econometric equations in the electricity generation and fuel consumption models also include autoregressive (AR)
terms to account for the strong correlation between recent and past observations of the dependent variable. 5 EIA collects generation data using Form EIA-923, with survey respondents reporting for each calendar month during the year.
Electricity sales data are collected on Forms EIA-861/EIA-826. Survey respondents may report sales data on a billing-cycle basis,
which does not necessarily correspond to the calendar month.

January 2014
U.S. Energy Information Administration | STEO Model Documentation: Electricity Generation and Fuel Consumption Models 9
Regional electric power sector generation is modeled differently for the various types of energy sources.
Generation from renewable sources is modeled individually for each energy source as a function of
existing and planned capacity within each region. Nuclear generation for individual plants is projected
using information provided by the U.S. Nuclear Regulatory Commission. Hydropower generation is
modeled as a function of projected precipitation levels. The quantity of electric power sector
generation not produced by these other sources is assumed to be produced using fossil fuels.
i. Fossil Fuel Generation
Coal, natural gas, and petroleum (including diesel and residual fuel oil) together accounted for about
two-thirds of the electricity generated in the United States during 2011. The relative costs between
fuels are important determinants of the mix of fossil fuels used by power generators. About 42 percent
of the electricity supplied in the United States is generated using coal. Coal-fired power plants are
expensive to build but historically have experienced low fuel costs. Natural-gas-fired units have lower
construction costs and are more efficient in terms of energy conversion. In recent years, the cost of
natural gas has fallen far enough so that combined cycle generating units fueled by natural gas have
become economically competitive with coal-fired power plants. Petroleum-fired units are often subject
to strict environmental limitations and the cost of the fuel has risen quite rapidly over the last few years,
leading to a rapid decline in its use for power generation.
Total fossil fuel generation for each Census region includes generation from coal, natural gas,
petroleum, and other gases (equation 8):
FFEP_xx = CLEP_xx + NGEP_xx + PAEP_xx + OGEP_xx (8)
where (all measured in thousand megawatthours per day) FFEP_xx = Total fossil fuel generation by electric power section in region xx CLEP_xx = Coal generation by electric power sector in region xx NGEP_xx = Natural gas generation by electric power sector in region xx PAEP_xx = Petroleum generation by electric power sector in region xx OGEP_xx = Other fossil gases generation by electric power sector in region xx
The levels of regional generation supplied by natural gas, other fossil gases, and petroleum are modeled
by projecting the year-over-year change in each fuel’s share of total regional fossil fuel generation.
Generation from each petroleum fuel (residual fuel oil, distillate fuel oil, petroleum coke, and other
petroleum liquids) is modeled separately, and an aggregate petroleum generation value is calculated for
use elsewhere in the model (equation 9):
PAEP_xx = RFEP_xx + DKEP_xx + PCEP_xx + OPEP_xx (9)
where (all measured in thousand megawatthours per day) RFEP_xx = Residual fuel oil generation by electric power sector in region xx DKEP_xx = Distillate fuel oil generation by electric power sector in region xx PCEP_xx = Petroleum coke generation by electric power sector in region xx OPEP_xx = Other petroleum liquids generation by electric power secton in region xx

January 2014
U.S. Energy Information Administration | STEO Model Documentation: Electricity Generation and Fuel Consumption Models 10
The equation for natural gas generation in the South Census region (equation 10) provides an example
of how regional generation for each of the fossil fuels is modeled. The change in the natural gas share of
total fossil fuel generation from the previous year is estimated as a function of the year-over-year
changes (notated as D(xx,12)) in weather, fuel costs, hydroelectric generation and nuclear generation.
The year-over-year changes in cooling and heating degree days in the prior month are also included.
D((NGEP_SO/FFEP_SO),12) = a0 + a1*D(ZWCD_SO,12) + a2*D(ZWHD_SO,12) + a3*D(ZWCD_SO-1,12) + a4*(ZWHD_SO-1,12) + a5*D((CLEUDUS/NGEUDUS),12) + a6*D(RFEUDUS/NGEUDUS),12) + a7*D(HYEP_SO,12) + a8*D(NUEP_SO,12) (10)
where NGEP_SO = Natural gas generation by the electric power sector in the South Census region, thousand megawatthours per day FFEP_SO = Fossil fuel generation by the electric power sector in the South Census region, thousand megawatthours per day HYEP_SO = Conventional hydroelectric generation by the electric power sector in the South Census region, thousand megawatthours per day NUEP_SO = Nuclear generation by the electric power sector in the South Census region, thousand megawatthours per day ZWCD_SO = Cooling degree days in the South Census region ZWHD_SO = Heating degree days in the South Census region CLEUDUS = Average U.S. cost of coal delivered to electric generating plants, dollars per million Btu NGEUDUS = Average U.S. cost of natural gas delivered to electric generating plants, dollars per million Btu RFEUDUS = Average U.S. cost of residual fuel oil delivered to electric generating plants, dollars per million Btu
The relative fuel price variables are the primary drivers for switching among the fossils fuels.
Hydropower and nuclear variables are included in the model equations only for the South and the West
Census regions. Most of the equations are structured using a year-over-year change functional form
(D(xxx,12)), but some equations are estimated using the level form of the fossil fuel share in order to
avoid the possibility of negative generation estimates.
Coal has historically provided the largest share of fossil fuel generation for each region. In order to
ensure that all of the projected fuel shares sum to one, generation from coal is modeled as the
difference between total regional electric power sector generation (EPEO_xx) and the sum of regional
generation from all other energy sources (equation 11). For example, in the South Census region, the
projected amount of electric power sector generation fueled by coal is defined as:
CLEP_SO = EPEO_SO – (NGEP_SO + PAEP_SO + OGEP_SO + HYEP_SO + NUEP_SO + RNEP_SO + OTEP_SO) (11) where (all measured in thousand megawatthours per day)

January 2014
U.S. Energy Information Administration | STEO Model Documentation: Electricity Generation and Fuel Consumption Models 11
EPEO_SO = Total generation by electric power sector in South Census region CLEP_SO = Coal generation by electric power sector in South Census region NGEP_SO = Natural gas generation by electric power sector in South Census region PAEP_SO = Petroleum generation by electric power sector in South Census region OGEP_SO = Other fossil gases generation by electric power sector in South Census region HYEP_SO = Hydroelectric generation by electric power sector in South Census region NUEP_SO = Nuclear generation by electric power sector in South Census region RNEP_SO = Renewable energy generation (other than hydro) by electric power sector in South Census region OTEP_SO = Other energy sources generation by electric power sector in South Census region
ii. Nuclear Generation
As of the end of 2012, there were 64 operable commercial nuclear plants in the United States, most of
which were built between 1970 and 1990. No new nuclear generating unit has come online since 1996
because of increased construction costs, uncertainty regarding the licensing process, and tighter safety
requirements following the Three Mile Island accident in 1979. Plans for a handful of additional units
are currently under review by the U.S. Nuclear Regulatory Commission, but this new capacity will not be
online prior to 2015. In contrast to the high capital costs of constructing nuclear plants, the operating
costs of existing nuclear units are relatively low. For this reason, the capacity factor of most nuclear
plants averages 90 percent or more. Nuclear plant operators generally schedule planned outages in the
spring or fall shoulder months, when demand is lower, to accommodate refueling and maintenance
requirements.
Projections for nuclear generation for the STEO are developed using a reactor-level model called the
Short-Term Nuclear Annual Power Production Simulation (SNAPPS). The model compiles reactor activity
schedules, determining if the reactor is generating power or is in a shutdown. Individual reactor
monthly generation is computed by multiplying the designated capacity (net or gross) times the
appropriate capacity factor times the hours the reactor operates in that month. For the near-term
projections, about 6 months out, the values are calculated in a preprocessor that estimates system-wide
monthly capacity factors by applying time-series techniques to historical generation data. The
relationship between the monthly capacity factor and the percent of capacity on line is modeled using
time-series econometric methods. For the remainder of the projection period, SNAPPS uses average,
full-cycle capacity factors, which are functions of reactor type and fuel cycle. The resulting reactor
generation values are then aggregated into monthly totals for each Census region.
iii. Hydroelectric Generation
Hydroelectric power plants include some of the oldest generating facilities in the United States. The
vast majority were built more than 60 years ago. There are two types of hydroelectric generating
plants: conventional and pumped storage. Conventional hydropower utilizes the mechanical energy of
either water stored within a reservoir or water flowing within a waterway (a run-of-the-river system).
Pumped storage hydroelectricity produces power by releasing water from one reservoir to another at a

January 2014
U.S. Energy Information Administration | STEO Model Documentation: Electricity Generation and Fuel Consumption Models 12
lower elevation; the water is then pumped back to the upper reservoir to repeat the process. Pumped
storage generation generally uses more electricity from outside sources than it produces. Conventional
hydropower facilities are clustered in the western United States, especially in the states of Washington,
Oregon, and California. The amount of hydroelectric generation is dependent on the level of regional
precipitation and is usually highest during the spring snowmelt season.
About two-thirds of conventional hydroelectric generation occurs in the West Census region. Although
many factors affect the level of hydropower output, the level of generation in the West region has
historically been well correlated with water output provided by the Dalles Dam, which spans the
Columbia River in the Pacific Northwest. The National Oceanic and Atmospheric Administration
provides a water supply forecast for the upcoming water year covering the months of April through
September. The STEO model applies the projected water supply information to the correlations
between past Dalles Dam supply and hydroelectric generation to calculate the projected levels of
monthly generation in the West region during the months of April through September of the upcoming
year. Projections for months outside the water year reflect the 30-year average level of generation. The
amount of conventional hydroelectric generation in other regions of the United States is relatively minor
compared with the Pacific Northwest. For simplicity, hydropower generation in other regions is
assumed to follow identical year-over-year growth as the hydroelectric generation in the West region.
Pumped storage hydroelectric power plants operate by pumping water uphill using turbine generators
and then releasing that water at a later time. In this way, pumped storage generating units improve
reliability of the electrical system by shifting generation from periods of the day when electricity
demand is low to higher demand periods. The net amount of generation provided by pumped storage
generating units is usually negative, indicating that more energy is used by the plant for pumping water
than is produced by the release of that water. The STEO models the regional level of pumped storage
hydropower generation as a function of monthly dummy variables to reflect seasonal patterns. In
addition, the change in generation from the previous month acts as a significant explanatory variable
(reflecting the impact of the change in reservoir levels).
iv. Renewable and Other Generation
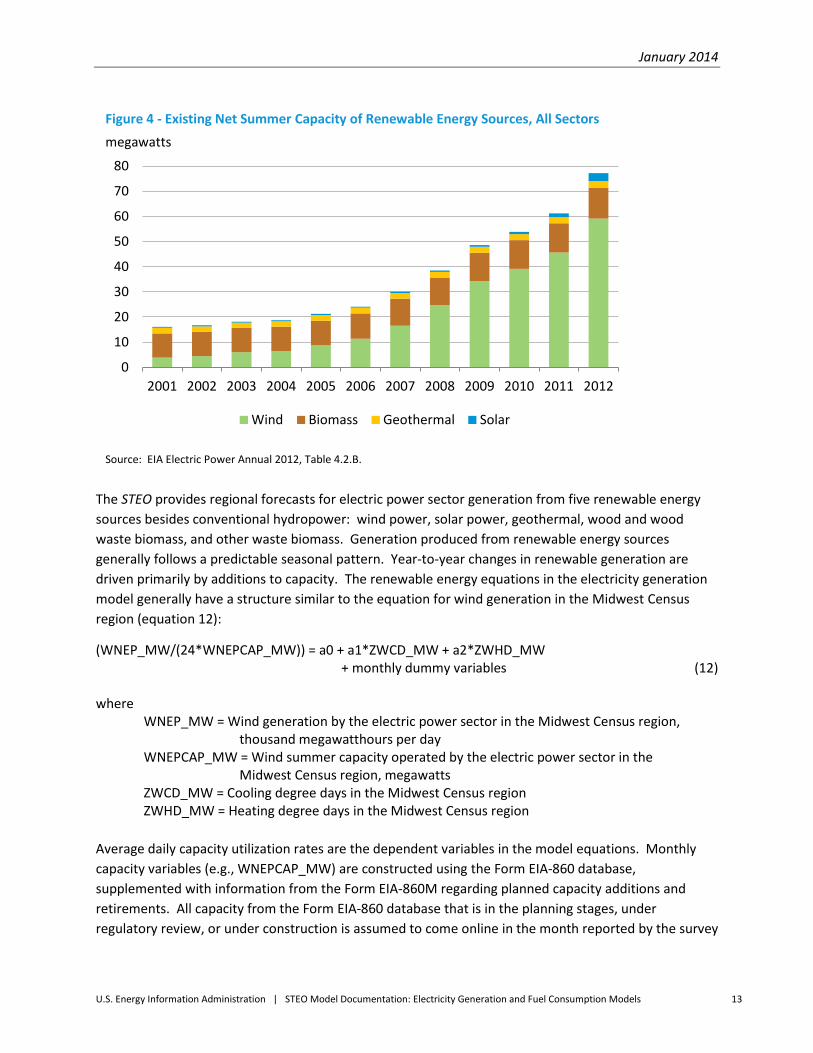
Renewable energy sources (excluding conventional hydropower) accounted for 5.4 percent of total
electricity generated during 2012, but renewable energy generating capacity has grown rapidly over the
last decade. The four primary sources of renewable energy used for electric power generation are wind,
solar, geothermal, and biomass. Wind power accounted for 64 percent of the electricity generated in
2012 from non-hydro renewable sources. This share has been expanding rapidly as a large amount of
new capacity has come online during the past decade (Figure 4). Wind power capacity additions have
been especially abundant in the Midwest and in Texas.
January 2014
U.S. Energy Information Administration | STEO Model Documentation: Electricity Generation and Fuel Consumption Models 13
The STEO provides regional forecasts for electric power sector generation from five renewable energy
sources besides conventional hydropower: wind power, solar power, geothermal, wood and wood
waste biomass, and other waste biomass. Generation produced from renewable energy sources
generally follows a predictable seasonal pattern. Year-to-year changes in renewable generation are
driven primarily by additions to capacity. The renewable energy equations in the electricity generation
model generally have a structure similar to the equation for wind generation in the Midwest Census
region (equation 12):
(WNEP_MW/(24*WNEPCAP_MW)) = a0 + a1*ZWCD_MW + a2*ZWHD_MW + monthly dummy variables (12)
where WNEP_MW = Wind generation by the electric power sector in the Midwest Census region, thousand megawatthours per day WNEPCAP_MW = Wind summer capacity operated by the electric power sector in the Midwest Census region, megawatts ZWCD_MW = Cooling degree days in the Midwest Census region ZWHD_MW = Heating degree days in the Midwest Census region
Average daily capacity utilization rates are the dependent variables in the model equations. Monthly
capacity variables (e.g., WNEPCAP_MW) are constructed using the Form EIA-860 database,
supplemented with information from the Form EIA-860M regarding planned capacity additions and
retirements. All capacity from the Form EIA-860 database that is in the planning stages, under
regulatory review, or under construction is assumed to come online in the month reported by the survey
Figure 4 - Existing Net Summer Capacity of Renewable Energy Sources, All Sectors
megawatts
Source: EIA Electric Power Annual 2012, Table 4.2.B.
0
10
20
30
40
50
60
70
80
2001 2002 2003 2004 2005 2006 2007 2008 2009 2010 2011 2012
Wind Biomass Geothermal Solar

January 2014
U.S. Energy Information Administration | STEO Model Documentation: Electricity Generation and Fuel Consumption Models 14
respondent. In addition to the new or planned power plants reported on Forms EIA-860 and EIA-860M,
the model may include some assumptions about unreported wind power capacity additions.
Monthly dummy variables are included as explanatory variables in order to model seasonal patterns in
generation. The regional generation equations for wind, solar, and wood biomass include variables for
cooling degree days and heating degree days to reflect the impact of weather on the level of generation.
B. Commercial and Industrial Sector Generation
The STEO models generation supplied by CHP plants operated by commercial and industrial
organizations, which is used primarily to support those entities’ own activities.6 In contrast to the model
for generation in the electric power sector, which estimates each fuel’s share from total sectoral
generation, the level of generation supplied by each fuel in the commercial and industrial sector is
estimated individually, and then aggregated to determine the total level of sector generation for each
region and for the United States.
Total CHP generation in the commercial and industrial sectors is modeled individually for each Census
region. Since businesses determined the level of generation based on their own needs, the STEO model
assumes that projected generation will be unaffected by overall levels of electricity demand. Instead
the year-over-year change in CHP generation in each region is modeled as a function of the change in
industrial production activity, the change in commercial employment, and the change in cooling and
heating degree days (equation 13):
D(CHEO_xx,12) = a0 + a1*D(IPMFG_xx,12) + a2*D(EESPP_xx,12) + a3*D(ZWCD_xx,12) + a4*D(ZWHD_xx,12) + monthly dummy variables (13) where CHEO_xx = CHP generation by the commercial and industrial sectors in region xx, thousand megawatthours per day IPMFG_xx = Industrial production index, manufacturing sector, in region xx, 1997=100 EESPP_xx = Commercial sector private employment in region xx, millions ZWCD_xx = Cooling degree days in region xx ZWHD_xx = Heating degree days in region xx
Regional generation for each type of energy source (both fossil fuels and renewable sources) is modeled
as the ratio of that fuel’s generation level to total regional generation. In some cases, there are
opportunities for generators to substitute one type of fossil fuel for another. To reflect this potential for
fuel switching, CHP generation fueled by coal, distillate fuel oil, or residual fuel oil is modeled as a
function of the average U.S. price of the fuel delivered to electric generators and the U.S. price of
natural gas. For example, equation 14 illustrates how coal CHP generation is modeled:
LOG(CLCH_xx) = a0 + a1*LOG(CLEUDUS/NGEUDUS) + monthly dummy variables (14)
6 The electric power sector also includes a small amount of generation by combined heat and power plants that are operated by
companies whose primary business is to provide electricity, or electricity and heat, to the public.

January 2014
U.S. Energy Information Administration | STEO Model Documentation: Electricity Generation and Fuel Consumption Models 15
where CLCH_xx = Coal generation by the commercial and industrial sector in region xx, thousand megawatthours per day CLEUDUS = Average U.S. cost of coal delivered to electric generating plants, dollars per million Btu NGEUDUS = Average U.S. cost of natural gas delivered to electric generating plants, dollars per million Btu
The logarithmic functional form is used to avoid the possibility of forecasted negative values.
Generation from most other energy sources is assumed to take on the same share of total regional CHP
generation is it did in the same month the previous year. Natural gas is the predominant fuel for CHP
generation in most regions. In order to ensure that fuel shares sum to one, equation 15 calculates
generation fueled by natural gas as the difference between total projected CHP generation and the sum
of generation from all other sources:
NGCH_xx = CHEO_xx – (CLCH_xx + PACH_xx + OGCH_xx + RNCH_xx + OTCH_xx) (15)
where (all measured in thousand megawatthours per day) CHEO_xx = Total generation by commercial and industrial sectors in Census region xx NGCH_xx = Natural gas generation by commercial and industrial sectors in Census region xx CLCH_xx = Coal generation by commercial and industrial sectors in Census region xx PACH_xx = Petroleum generation by commercial and industrial sectors in Census region xx OGCH_xx = Other fossil gases generation by commercial and industrial sectors in Census region xx RNCH_xx = Renewable energy generation by commercial and industrial sectors in Census region xx OTCH_xx = Other non-renewable fuels generation by commercial and industrial sectors in Census region xx
5. U.S. Fuel Consumption Model
Data for the amount of fuel consumed by electric power plants and combined heat and power plants is
collected on Schedule 3 of the Form EIA-923. This schedule surveys the respondent’s quantity of fuel
consumed for the reporting period as measured in physical units. Respondents are also asked to report
the average heat content for each type of fuel. Some of the fuel consumed by CHP plants may have
been used for power generation and some for useful thermal output. Respondents do not report how
the fuels were used; EIA estimates how much fuel was used for each purpose.
The STEO models power industry fuel consumption by estimating the efficiency of generation using a
measure referred to as the “heat rate,” which is defined as the ratio of fuel consumption to net
generation. Heat rates are generally measured in Btu per kilowatthour in order to make comparisons
across different types of fuels. The heat rates of individual generating units depend on various factors,
including: the type and quality of fuel used, the design of the unit, the unit’s age, and the level of
maintenance. In addition, a generation unit’s capacity factor can impact its heat rate.

January 2014
U.S. Energy Information Administration | STEO Model Documentation: Electricity Generation and Fuel Consumption Models 16
As Figure 5 shows, the efficiency of the natural-gas-fired generation fleet has been steadily improving
over the last decade (i.e., the average heat rate has been falling). The primary reason for this decline in
natural gas heat rates has been the rapid increase in generating capacity using combined-cycle
technology. This type of technology captures waste heat exiting from one or more natural gas
(combustion) turbines and uses this heat to produce steam for a secondary generation process, which
improves the overall efficiency of the unit. Combined-cycle units are often run at higher capacity factors
than traditional combustion turbine units, which are generally run only to meet peak demand.
In contrast to the falling heat rate for natural-gas-fired power plants, the average heat rate for coal-fired
generators in the U.S. electric power sector has been rising since about 2003. One of the primary
reasons for this increase has been a shift in the types of coal used by generators. Specifically, the
electric power industry has been moving away from using bituminous coal for power generation to
subbituminous coal, which has a lower sulfur content. However, subbituminous coal has a lower heat
content than bituminous coal, and generators have to burn relatively more of it to generate the same
level of electricity. In 2001, about 57 percent of generation by coal in the electric power sector was
fueled by bituminous coal and 38 percent came from subbituminous coal. By 2012, the share of coal
generation supplied by bituminous coal had fallen to 48 percent and the share supplied subbituminous
coal had risen to 47 percent.
A true heat rate compares the heat quantity of the fuel consumed only for electric generation
(measured in Btu) with the level of generation (measured in watthours). The STEO model estimates the
amount of fuel used by the electricity industry for power generation and the amount consumed for
Figure 5 - U.S. Average Heat Rate, Electric Power Sector
Source: Table 8.1, Electric Power Annual
7,500
8,000
8,500
9,000
9,500
10,000
10,500
11,000
2001 2002 2003 2004 2005 2006 2007 2008 2009 2010 2011 2012
Coal heat rate
Natural gas heat rate
British thermal units per kilowatthour

January 2014
U.S. Energy Information Administration | STEO Model Documentation: Electricity Generation and Fuel Consumption Models 17
useful thermal output separately for the electric power sector. Only total fuel consumption is modeled
for the commercial and industrial CHP sector. In addition, the fuel consumption variables are modeled
in physical units. Consumption is converted to Btu by multiplying by the most recent historical
conversion factor published in EIA’s Monthly Energy Review Table A6.
Consumption of fuel for electricity generation in each region is determined by estimating econometric
equations based on the following example for coal consumption by the electric power sector (equation
16):
(CLEPCON_EL_xx/CLEP_xx) = a0 + a1*(CLEP_xx/FFEP_xx) + monthly dummy variables (16) where CLEPCON_EL_xx = Consumption of coal by electric power sector for electricity generation only (excluding useful thermal output) in region xx, thousand tons per day CLEP_xx = Coal generation by electric power sector in region xx, thousand megawatthours / day FFEP_xx = Fossil fuel generation by electric power sector in region xx, thousand megawatthours / day
The modeled heat rate ratios between fuel consumption (as measured in physical units) and generation
are a function of the fuel’s share of regional fossil fuel generation, in order to account for that fuel’s
capacity factor relative to other fuels. There is an observable seasonal pattern to heat rates, which is
modeled by the monthly dummy variables. The electric power sector’s consumption of fuel for useful
thermal output is modeled using only seasonal monthly dummy variables.
Consumption of residual fuel oil and some other petroleum-based fuels in some regions is more
sporadic and difficult to model econometrically. In these cases, the model assumes that the same
growth rate over the previous 12 to 24 months will continue during the forecast period.

January 2014
U.S. Energy Information Administration | STEO Model Documentation: Electricity Generation and Fuel Consumption Models 18
6. Forecast Evaluations
In order to evaluate the reliability of the forecasts, EIA generated out-of-sample forecasts and calculated
forecast errors. Each equation was estimated through December 2010. Dynamic forecasts were then
generated for the period January 2011 through December 2012 using each regression equation. The
forecasts were then compared with the actual outcomes.
Dynamic forecasts of each equation use the actual values of the exogenous variables on the right-hand
side of the regression equations (e.g., fuel price) but simulated values of the lagged dependent variable.
Consequently, the calculated forecast error is not the same as a calculated regression error, which uses
the actual value for the lagged dependent variable.
Summary forecast error statistics are can be calculated for each regression equation. However, this
documentation focuses on the reliability of the aggregrate U.S. projections. The mean error and root
mean squared error statistics depend on the scale of the dependent variable. These are generally used
as relative measures to compare forecasts for the same series using different models; the smaller the
error, the better the forecasting ability of that model. The mean absolute percentage error normalizes
the error to values between zero and one. This statistic can be used to compare the reliability of
forecasts across different series.
A. Electricity Generation
Forecast reliability in the electricity generation model depends on the accuracy of two groups of
projections: (1) the total U.S. supply of electricity, which is derived from estimates of total demand,
losses, and net imports; and (2) the share of supply provided by each fuel. When evaluating the
reliability of the generation model, the forecast for electricity retail sales is taken as exogenous.
Table 4 compares the annual dynamic forecasts of the components of the electricity supply balance
during 2011 and 2012 with their actual historical values. The model overestimated total generation of
electricity across all sectors in both years by an average of 0.3 percent. Of the components of total
generation (other than demand), transmission and distribution losses were the largest contributor to
error in the series during 2011, and net imports contributed the largest share of error to generation
during 2012.
Total generation is supplied by the CHP sector (whose generation is estimated within the model) and by
the electric power sector (whose generation is modeled as the difference between the sum of all the
electricity supply components and CHP generation). During 2011 and 2012, the model overestimated
CHP generation by slightly more than 2 percent. The modeled forecasts for generation in the electric
power sector were less than 1 percent higher than the actual data. However, most of the modeled
generation in this sector is accounted for by total U.S. retail electricity, which here is treated as
exogenous.

January 2014
U.S. Energy Information Administration | STEO Model Documentation: Electricity Generation and Fuel Consumption Models 19
Table 4 - Actual Historical Data and Out-of-Sample Forecasts, Electricity Supply Series
2011
2012
Actual Forecast Actual Forecast
Electricity industry supply balance (billion kilowatthours per day)
TSEOPUS Total generation, all sectors 11.2347 11.2904 11.0778 11.0980
EXTCPUS Total retail electricity sales * 10.2736 N/A 10.0732 N/A
ELDUPUS Direct use of electricity 0.3597 0.3686 0.3678 0.3753
TDLOPUS Transmission and distribution losses 0.7035 0.7293 0.7660 0.7334
ELIMPUS U.S. electricity imports 0.1433 0.1390 0.1619 0.1335
ELEXPUS U.S. electricity exports 0.0412 0.0580 0.0328 0.0495
CHEOPUS CHP sector generation 0.4163 0.4266 0.4256 0.4344
EPEOPUS Electric power sector generation 10.8184 10.8638 10.6522 10.6635
Electric power sector generation by fuel (thousand megawatthours per day)
CLEP_US Coal generation 4,706.55 4,623.81 4,105.82 4,118.98
NGEP_US Natural gas generation 2,537.78 2,645.21 3,109.49 3,147.69
PAEP_US Petroleum generation 77.27 68.08 54.98 61.77
OGEP_US Other gases generation 8.05 7.65 7.43 7.96
HPEP_US Pumped storage generation -16.18 -15.48 -12.73 -15.91
HVEP_US Conventional hydro generation † 869.95 695.07 750.39 693.17
NUEP_US Nuclear generation † 2,164.94 2,230.49 2,102.00 2,229.96
RNEP_US Renewable (non-hydro) generation 449.00 434.06 514.04 497.14
OTEP_US Other fossil fuels generation 20.99 20.14
20.77 19.84
* Total retail sales are taken as exogenous when solving the electricity generation model
† Conventional hydroelectric and nuclear forecasts from the January 2011 Short-Term Energy Outlook
Table 4 also shows the out-of-sample forecasts for generation by fuel in the electric power sector,
where that sector’s total generation is fixed at its actual value and the generation model only projects
the share of generation supplied by each fuel. Generation during the years 2011 and 2012 experienced
a significant shift in the shares provided by coal and natural gas, as the price of the latter fuel reached
record low levels. The model was able to capture the shift from coal to natural gas relatively well, with
an overestimation of natural gas generation of 4.2 percent in 2011 and 1.2 percent in 2012. Coal
generation was underestimated by 1.8 percent in 2011 and was overestimated by 1.2 percent in 2012.
Renewable energy sources grew strongly in 2011 and 2012, particularly wind and solar power. The out-
of-sample forecast for renewable energy (excluding hydropower) was 3.3 percent lower than the actual
value during those years.
The forecast values for conventional hydropower and nuclear power shown in Table 4 are the annual
forecasts for 2011 and 2012 from the January 2011 STEO. This particular forecast underestimated
hydropower generation during 2011 by 20 percent and by 7 percent in 2012. Spring 2011 water runoff
in the Pacific Northwest was significantly higher than normal, and EIA’s forecast for hydropower rose in

January 2014
U.S. Energy Information Administration | STEO Model Documentation: Electricity Generation and Fuel Consumption Models 20
the following months to account for this peak water flow. The January 2011 short-term forecast for
nuclear generation overestimated the actual annual values for 2011 and 2012 by 3 percent and 6
percent, respectively, as a result of some unplanned outages that occurred during those years.
Comparing the out-of-sample forecast for the annual average with the actual annual data may mask
some seasonal patterns in the forecast errors. Figure 6 shows how the historical data for the electricity
supply components compares with the 2011-2012 out-of-sample forecasts. (The chart does not show
retail electricity sales, which represents about 90 percent of total generation, because its forecasts are
determined outside the generation model.) During the out-of-sample forecast period, forecasts of
transmission and distribution losses for about half of the months overestimate the actual value and
underestimate for the remaining months. The forecasts of net imports consistently underestimate the
actual values during the out-of-sample period.
The forecast errors for generation by fuel follow a more seasonal pattern. Figure 7 shows historical data
and 2011-2012 out-of-sample forecasts for electric power sector generation fueled by natural gas and
coal. During these years the model tended to overestimate natural gas generation and underestimate
coal generation during the summer months, and vice versa during the winter months for the first half of
2012. However, the model was able to pick up much of the switching from coal-fired to natural-gas-
fired generation that occurred during 2012.
Figure 6 - U.S. Electricity Supply Historical Data and Out-of-Sample Forecasts (2011-2012)
Source: EIA Monthly Energy Review and simulation of Short-Term Energy Outlook electricity generation model
Note: Data for electricity retail sales not shown (forecasts are exogenous to model)
0.0
0.2
0.4
0.6
0.8
1.0
1.2
1.4
Jan-10 Apr-10 Jul-10 Oct-10 Jan-11 Apr-11 Jul-11 Oct-11 Jan-12 Apr-12 Jul-12 Oct-12
billion kilowatthours per day
Trans. & Dist. Loss (History/Actual) Trans. & Dist. Loss (Forecast)
Direct Use (History/Actual) Direct Use (Forecast)
Net Imports (History/Actual) Net Imports (Forecast)

January 2014
U.S. Energy Information Administration | STEO Model Documentation: Electricity Generation and Fuel Consumption Models 21
The graphs of the forecasted series and its actual value only provides a visual comparison of the forecast
reliability. Various statistics have been developed to measure forecast performance. Simply calculating
the mean of the errors (the difference between each observation’s forecast value and its actual value)
can provide a simple measure of the forecast’s bias. If a forecast underestimates the actual value just as
often as it overestimates, then the mean error should have a value close to zero.
However, negative errors offset positive errors in the mean error statistic, and it does not provide much
information about how “far away” forecasts are from the actual values. A more common measure of
forecast reliability is the root mean squared error statistic (RMSE), defined as the square root of the
average of the squared errors. This statistic measures the overall accuracy of a forecast without respect
to over- or under-estimation. As with the mean error statistic, the RMSE is measured in the same units
as the underlying series. However, by squaring the errors the RMSE gives greater weight to outlier
forecast points. The mean absolute percent error (MAPE) statistic provides a similar measure of
accuracy that is invariant to the scale of the series.
The mean error, RMSE, and MAPE reliability statistics for the electricity industry supply variables are
shown in Table 5. These reflect out-of-sample forecast errors for a model solution over the period 2011-
2012. The forecast for transmission and distribution losses appears approximately unbiased (with mean
errors near 0) over the solution period, but the large values for the RMSE and the MAPE indicate that
the forecast often deviated quite a bit from the actual value. For electric power sector generation by
Figure 7 - U.S. Electric Power Sector Generation by Fuel Historical Data and Out-of-Sample Forecasts (2011-2012)
Source: EIA Monthly Energy Review and simulation of Short-Term Energy Outlook electricity generation model
-1,000
0
1,000
2,000
3,000
4,000
5,000
6,000
7,000
Jan-10 Jul-10 Jan-11 Jul-11 Jan-12 Jul-12
thousand megawatthours
Coal Generation (History/Actual) Coal Generation (Forecast)
Natural Gas Generation (History/Actual) Natural Gas Generation (Forecast)
Coal Forecast Error Natural Gas Forecast Error

January 2014
U.S. Energy Information Administration | STEO Model Documentation: Electricity Generation and Fuel Consumption Models 22
fuel, the RMSE statistic for coal generation indicates that it had the largest error of all the energy
sources. However, coal accounts for the largest share of total generation so it’s relative error as
measured by the MAPE statistic was only 3.2% during the solution period. Conversely, the MAPE
statistic for pumped storage hydropower had the largest value, 26.8%, but accounts for a relatively small
share of total generation.
Table 5 - Electricity Supply Out-of-Sample Forecast Error Statistics
Mean Root Mean Mean Absolute
Error Squared Error Percent Error
Electricity industry supply balance (billion kilowatthours per day)
TSEOPUS Total generation, all sectors 0.0379 0.0938 0.7%
EXTCPUS Total retail electricity sales * N/A N/A N/A
ELDUPUS Direct use of electricity 0.0082 0.0136 2.9%
TDLOPUS Trans. and dist. losses (0.0033) 0.0810 12.3%
ELIMPUS U.S. electricity imports (0.0163) 0.0239 11.4%
ELEXPUS U.S. electricity exports 0.0167 0.0185 50.1%
CHEOPUS CHP sector generation 0.0095 0.0158 2.9%
EPEOPUS Electric power sector generation 0.0284 0.0902 0.7%
Electric power sector generation by fuel (thousand megawatthours per day)
CLEP_US Coal generation (34) 179 3.2%
NGEP_US Natural gas generation 72 151 4.2%
PAEP_US Petroleum generation (1) 10 13.9%
OGEP_US Other gases generation 0 1 13.0%
HPEP_US Pumped storage generation (1) 4 26.8%
HVEP_US Conventional hydro generation † (116) 143 15.0%
NUEP_US Nuclear generation † 97 137 5.2%
RNEP_US Renewable (non-hydro) generation (16) 42 6.9%
OTEP_US Other fossil fuels generation (1) 1 5.6%
* Total retail sales are taken as exogenous when solving the electricity generation model
† Based on conventional hydroelectric and nuclear forecasts from the January 2011 Short-Term Energy Outlook
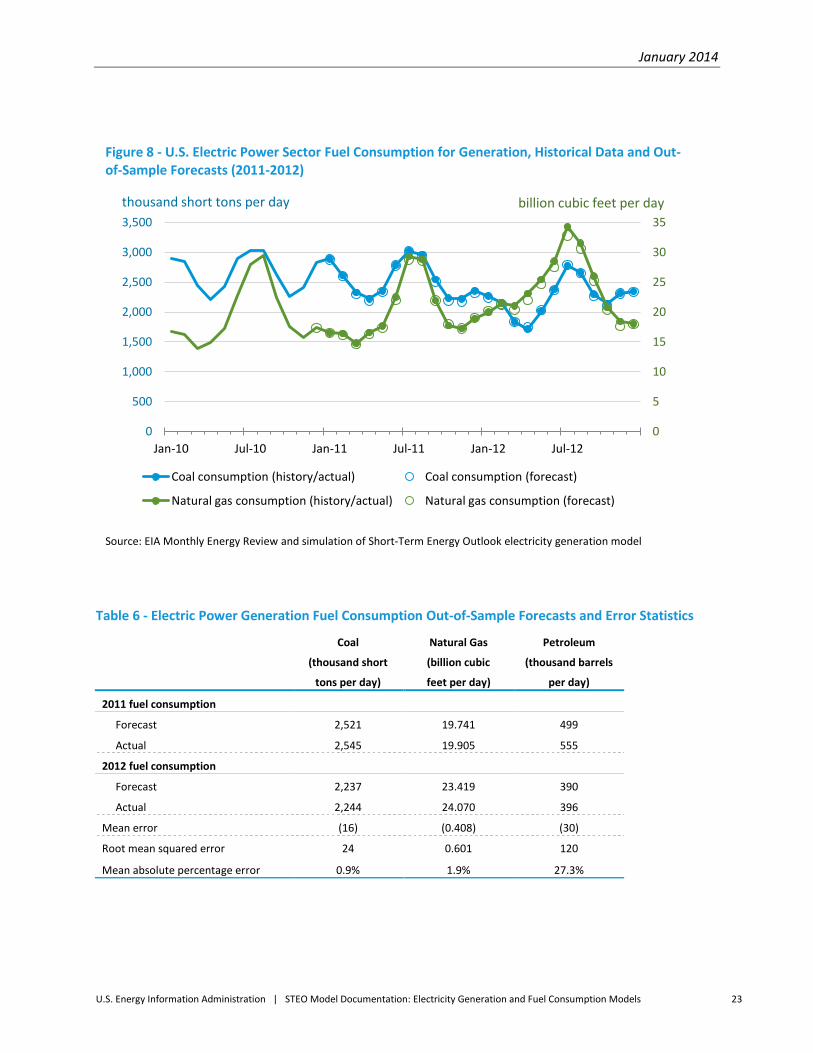
B. Fuel Consumption
The fuel consumption model was solved for the period 2011-2012 (with the electricity supply and
generation values fixed at their actual values) in order to assess the model’s forecast reliability. Figure 8
shows the monthly forecast values compared the actual values for natural gas and coal consumed for
generation in the electric power sector. The forecast of coal consumption is relatively robust. But after
the first quarter of 2012, the forecast of natural gas consumption overestimates actual consumption.
This was the period when fuel switching accelerated, and many generators were running natural-gas-
fired plants at record-high capacity factors, which likely impacted the operational heat rates.
January 2014
U.S. Energy Information Administration | STEO Model Documentation: Electricity Generation and Fuel Consumption Models 23
Table 6 - Electric Power Generation Fuel Consumption Out-of-Sample Forecasts and Error Statistics
Coal Natural Gas Petroleum
(thousand short (billion cubic (thousand barrels
tons per day) feet per day) per day)
2011 fuel consumption
Forecast 2,521 19.741 499
Actual 2,545 19.905 555
2012 fuel consumption
Forecast 2,237 23.419 390
Actual 2,244 24.070 396
Mean error (16) (0.408) (30)
Root mean squared error 24 0.601 120
Mean absolute percentage error 0.9% 1.9% 27.3%
Figure 8 - U.S. Electric Power Sector Fuel Consumption for Generation, Historical Data and Out-of-Sample Forecasts (2011-2012)
Source: EIA Monthly Energy Review and simulation of Short-Term Energy Outlook electricity generation model
0
5
10
15
20
25
30
35
0
500
1,000
1,500
2,000
2,500
3,000
3,500
Jan-10 Jul-10 Jan-11 Jul-11 Jan-12 Jul-12
Coal consumption (history/actual) Coal consumption (forecast)
Natural gas consumption (history/actual) Natural gas consumption (forecast)
thousand short tons per day billion cubic feet per day

January 2014
U.S. Energy Information Administration | STEO Model Documentation: Electricity Generation and Fuel Consumption Models 24
Appendix A. Variable Definitions
Units Key
BkWh/d Billion kilowatthours per day
GWh/d Gigawatthours per day
MW Megawatts
Mbbl/d Thousand barrels per day
MMbbl/d Million barrels per day
Bcf/d Billion cubic feet per day
MMcf/d Million cubic feet per day
Mtons/d Thousand tons per day
MMtons/d Million tons per day
MMBtu Million British thermal units
DD Degree days
VARIABLE DESCRIPTION UNITS
APR = 1 if April, 0 otherwise --
AUG = 1 if August, 0 otherwise --
CHEO_MW Total Net Generation, Comm. and Ind. Sectors, Midwest Region GWh/d
CHEO_NE Total Net Generation, Comm. and Ind. Sectors, Northeast Region GWh/d
CHEO_SO Total Net Generation, Comm. and Ind. Sectors, Southeast Region GWh/d
CHEO_WE Total Net Generation, Comm. and Ind. Sectors, West Region GWh/d
CHEO_US Total Net Generation, Comm. and Ind. Sectors, United States GWh/d
CHEOPUS U.S. Total Net Generation, Comm. and Ind. Sectors BkWh/d
CLCH_MW Coal Net Generation, Comm. and Ind. Sectors, Midwest Region GWh/d
CLCH_NE Coal Net Generation, Comm. and Ind. Sectors, Northeast Region GWh/d
CLCH_SO Coal Net Generation, Comm. and Ind. Sectors, Southeast Region GWh/d
CLCH_WE Coal Net Generation, Comm. and Ind. Sectors, West Region GWh/d
CLCH_US Coal Net Generation, Comm. and Ind. Sectors, United States GWh/d
CLCHCON_EL_MW Coal Consumption for Generation, Comm. and Ind. Sectors, Midwest Region Mtons/d
CLCHCON_EL_NE Coal Consumption for Generation, Comm. and Ind. Sectors, Northeast Region Mtons/d
CLCHCON_EL_SO Coal Consumption for Generation, Comm. and Ind. Sectors, Southeast Region Mtons/d
CLCHCON_EL_WE Coal Consumption for Generation, Comm. and Ind. Sectors, West Region Mtons/d
CLCHCON_EL_US Coal Consumption for Generation, Comm. and Ind. Sectors, United States Mtons/d
CLCHCON_EL U.S. Coal Consumption for Generation, Comm. and Ind. Sectors MMtons/d
CLCHCON_MW Coal Consumption (Total), Comm. and Ind. Sectors, Midwest Region Mtons/d
CLCHCON_NE Coal Consumption (Total), Comm. and Ind. Sectors, Northeast Region Mtons/d
CLCHCON_SO Coal Consumption (Total), Comm. and Ind. Sectors, Southeast Region Mtons/d
CLCHCON_WE Coal Consumption (Total), Comm. and Ind. Sectors, West Region Mtons/d
CLCHCON_US Coal Consumption (Total), Comm. and Ind. Sectors, United States Mtons/d
CLCHCON U.S. Coal Consumption (Total), Comm. and Ind. Sectors MMtons/d
CLEP_MW Coal Net Generation, Electric Power Sector, Midwest Region GWh/d
CLEP_NE Coal Net Generation, Electric Power Sector, Northeast Region GWh/d

January 2014
U.S. Energy Information Administration | STEO Model Documentation: Electricity Generation and Fuel Consumption Models 25
CLEP_SO Coal Net Generation, Electric Power Sector, Southeast Region GWh/d
CLEP_WE Coal Net Generation, Electric Power Sector, West Region GWh/d
CLEP_US Coal Net Generation, Electric Power Sector, United States GWh/d
CLEPTOT U.S. Coal Net Generation, Electric Power Sector BkWh/d
CLEPCAP_MW Coal Capacity, Electric Power Sector, Midwest Region MW
CLEPCAP_NE Coal Capacity, Electric Power Sector, Northeast Region MW
CLEPCAP_SO Coal Capacity, Electric Power Sector, Southeast Region MW
CLEPCON_EL_MW Coal Consumption for Generation, Electric Power Sector, Midwest Region Mtons/d
CLEPCON_EL_NE Coal Consumption for Generation, Electric Power Sector, Northeast Region Mtons/d
CLEPCON_EL_SO Coal Consumption for Generation, Electric Power Sector, Southeast Region Mtons/d
CLEPCON_EL_WE Coal Consumption for Generation, Electric Power Sector, West Region Mtons/d
CLEPCON_EL_US Coal Consumption for Generation, Electric Power Sector, United States Mtons/d
CLEPCON_EL U.S. Coal Consumption for Generation, Electric Power Sector MMtons/d
CLEPCON_UTO_MW Coal Consumption for Useful Thermal Output, Electric Power Sector, Midwest Region Mtons/d
CLEPCON_UTO_NE Coal Consumption for Useful Thermal Output, Electric Power Sector, Northeast Region Mtons/d
CLEPCON_UTO_SO Coal Consumption for Useful Thermal Output, Electric Power Sector, Southeast Region Mtons/d
CLEPCON_UTO_US Coal Consumption for Useful Thermal Output, Electric Power Sector, West Region Mtons/d
CLEPCON_UTO_WE Coal Consumption for Useful Thermal Output, Electric Power Sector, United States Mtons/d
CLEPCON_MW Coal Consumption (Total), Electric Power Sector, Midwest Region Mtons/d
CLEPCON_NE Coal Consumption (Total), Electric Power Sector, Northeast Region Mtons/d
CLEPCON_SO Coal Consumption (Total), Electric Power Sector, Southeast Region Mtons/d
CLEPCON_WE Coal Consumption (Total), Electric Power Sector, West Region Mtons/d
CLEPCON_US Coal Consumption (Total), Electric Power Sector, United States Mtons/d
CLEPCON U.S. Coal Consumption (Total), Electric Power Sector MMtons/d
CLEUDUS U.S. Average Cost of Coal Delivered to Electricity Industry $/MMBtu
CLTO_MW Coal Net Generation, All Sectors, Midwest Region GWh/d
CLTO_NE Coal Net Generation, All Sectors, Northeast Region GWh/d
CLTO_SO Coal Net Generation, All Sectors, Southeast Region GWh/d
CLTO_WE Coal Net Generation, All Sectors, West Region GWh/d
CLTO_US Coal Net Generation, All Sectors, United States GWh/d
CLTOPUS U.S. Coal Net Generation, All Sectors BkWh/d
CLTOCON_EL_MW Coal Consumption for Generation, All Sectors, Midwest Region Mtons/d
CLTOCON_EL_NE Coal Consumption for Generation, All Sectors, Northeast Region Mtons/d
CLTOCON_EL_SO Coal Consumption for Generation, All Sectors, Southeast Region Mtons/d
CLTOCON_EL_WE Coal Consumption for Generation, All Sectors, West Region Mtons/d
CLTOCON_EL_US Coal Consumption for Generation, All Sectors, United States Mtons/d
CLTOCON_EL U.S. Coal Consumption for Generation, All Sectors MMtons/d
CLTOCON_MW Coal Consumption (Total), All Sectors, Midwest Region Mtons/d
CLTOCON_NE Coal Consumption (Total), All Sectors, Northeast Region Mtons/d
CLTOCON_SO Coal Consumption (Total), All Sectors, Southeast Region Mtons/d
CLTOCON_WE Coal Consumption (Total), All Sectors, West Region Mtons/d

January 2014
U.S. Energy Information Administration | STEO Model Documentation: Electricity Generation and Fuel Consumption Models 26
CLTOCON_US Coal Consumption (Total), All Sectors, United States Mtons/d
CLTOCON U.S. Coal Consumption (Total), All Sectors MMtons/d
DEC = 1 if December, 0 otherwise --
DKCH_MW Distillate Fuel Oil Net Generation, Comm. and Ind. Sectors, Midwest Region GWh/d
DKCH_NE Distillate Fuel Oil Net Generation, Comm. and Ind. Sectors, Northeast Region GWh/d
DKCH_SO Distillate Fuel Oil Net Generation, Comm. and Ind. Sectors, Southeast Region GWh/d
DKCH_WE Distillate Fuel Oil Net Generation, Comm. and Ind. Sectors, West Region GWh/d
DKCH_US Distillate Fuel Oil Net Generation, Comm. and Ind. Sectors, United States GWh/d
DKCHCON_EL_MW Distillate Fuel Oil Consumption for Generation, Comm. and Ind. Sectors, Midwest Region Mbbl/d
DKCHCON_EL_NE Distillate Fuel Oil Consumption for Generation, Comm. and Ind. Sectors, Northeast Region
Mbbl/d
DKCHCON_EL_SO Distillate Fuel Oil Consumption for Generation, Comm. and Ind. Sectors, Southeast Region
Mbbl/d
DKCHCON_EL_WE Distillate Fuel Oil Consumption for Generation, Comm. and Ind. Sectors, West Region Mbbl/d
DKCHCON_EL_US Distillate Fuel Oil Consumption for Generation, Comm. and Ind. Sectors, United States Mbbl/d
DKCHCON_EL U.S. Distillate Fuel Oil Consumption for Generation, Comm. and Ind. Sectors MMbbl/d
DKCHCON_MW Distillate Fuel Oil Consumption (Total), Comm. and Ind. Sectors, Midwest Region Mbbl/d
DKCHCON_NE Distillate Fuel Oil Consumption (Total), Comm. and Ind. Sectors, Northeast Region Mbbl/d
DKCHCON_SO Distillate Fuel Oil Consumption (Total), Comm. and Ind. Sectors, Southeast Region Mbbl/d
DKCHCON_WE Distillate Fuel Oil Consumption (Total), Comm. and Ind. Sectors, West Region Mbbl/d
DKCHCON_US Distillate Fuel Oil Consumption (Total), Comm. and Ind. Sectors, United States Mbbl/d
DKCHCON U.S. Distillate Fuel Oil Consumption (Total), Comm. and Ind. Sectors MMbbl/d
DKEP_MW Distillate Fuel Oil Net Generation, Electric Power Sector, Midwest Region GWh/d
DKEP_NE Distillate Fuel Oil Net Generation, Electric Power Sector, Northeast Region GWh/d
DKEP_SO Distillate Fuel Oil Net Generation, Electric Power Sector, Southeast Region GWh/d
DKEP_WE Distillate Fuel Oil Net Generation, Electric Power Sector, West Region GWh/d
DKEP_US Distillate Fuel Oil Net Generation, Electric Power Sector, United States GWh/d
DKEPTOT U.S. Distillate Fuel Oil Net Generation, Electric Power Sector BkWh/d
DKEPCON_EL_MW Distillate Fuel Oil Consumption for Generation, Electric Power Sector, Midwest Region Mbbl/d
DKEPCON_EL_NE Distillate Fuel Oil Consumption for Generation, Electric Power Sector, Northeast Region Mbbl/d
DKEPCON_EL_SO Distillate Fuel Oil Consumption for Generation, Electric Power Sector, Southeast Region Mbbl/d
DKEPCON_EL_WE Distillate Fuel Oil Consumption for Generation, Electric Power Sector, West Region Mbbl/d
DKEPCON_EL_US Distillate Fuel Oil Consumption for Generation, Electric Power Sector, United States Mbbl/d
DKEPCON_EL U.S. Distillate Fuel Oil Consumption for Generation, Electric Power Sector MMbbl/d
DKEPCON_UTO_MW Distillate Fuel Oil Consumption for Useful Thermal Output, Electric Power Sector, Midwest Region
Mbbl/d
DKEPCON_UTO_NE Distillate Fuel Oil Consumption for Useful Thermal Output, Electric Power Sector, Northeast Region
Mbbl/d
DKEPCON_UTO_SO Distillate Fuel Oil Consumption for Useful Thermal Output, Electric Power Sector, Southeast Region
Mbbl/d
DKEPCON_UTO_WE Distillate Fuel Oil Consumption for Useful Thermal Output, Electric Power Sector, West Region
Mbbl/d
DKEPCON_UTO_US Distillate Fuel Oil Consumption for Useful Thermal Output, Electric Power Sector, United States
Mbbl/d
DKEPCON_MW Distillate Fuel Oil Consumption (Total), Electric Power Sector, Midwest Region Mbbl/d

January 2014
U.S. Energy Information Administration | STEO Model Documentation: Electricity Generation and Fuel Consumption Models 27
DKEPCON_NE Distillate Fuel Oil Consumption (Total), Electric Power Sector, Northeast Region Mbbl/d
DKEPCON_SO Distillate Fuel Oil Consumption (Total), Electric Power Sector, Southeast Region Mbbl/d
DKEPCON_WE Distillate Fuel Oil Consumption (Total), Electric Power Sector, West Region Mbbl/d
DKEPCON_US Distillate Fuel Oil Consumption (Total), Electric Power Sector, United States Mbbl/d
DKEPCON U.S. Distillate Fuel Oil Consumption (Total), Electric Power Sector MMbbl/d
DKEUDUS U.S. Average Cost of Distillate Fuel Oil Delivered to Electricity Industry $/MMBtu
DKTO_MW Distillate Fuel Oil Net Generation, All Sectors, Midwest Region GWh/d
DKTO_NE Distillate Fuel Oil Net Generation, All Sectors, Northeast Region GWh/d
DKTO_SO Distillate Fuel Oil Net Generation, All Sectors, Southeast Region GWh/d
DKTO_WE Distillate Fuel Oil Net Generation, All Sectors, West Region GWh/d
DKTO_US Distillate Fuel Oil Net Generation, All Sectors, United States GWh/d
DKTOPUS U.S. Distillate Fuel Oil Net Generation, All Sectors BkWh/d
DKTOCON_EL_MW Distillate Fuel Oil Consumption for Generation, All Sectors, Midwest Region Mbbl/d
DKTOCON_EL_NE Distillate Fuel Oil Consumption for Generation, All Sectors, Northeast Region Mbbl/d
DKTOCON_EL_SO Distillate Fuel Oil Consumption for Generation, All Sectors, Southeast Region Mbbl/d
DKTOCON_EL_WE Distillate Fuel Oil Consumption for Generation, All Sectors, West Region Mbbl/d
DKTOCON_EL_US Distillate Fuel Oil Consumption for Generation, All Sectors, United States Mbbl/d
DKTOCON_EL U.S. Distillate Fuel Oil Consumption for Generation, All Sectors MMbbl/d
DKTOCON_MW Distillate Fuel Oil Consumption (Total), All Sectors, Midwest Region Mbbl/d
DKTOCON_NE Distillate Fuel Oil Consumption (Total), All Sectors, Northeast Region Mbbl/d
DKTOCON_SO Distillate Fuel Oil Consumption (Total), All Sectors, Southeast Region Mbbl/d
DKTOCON_WE Distillate Fuel Oil Consumption (Total), All Sectors, West Region Mbbl/d
DKTOCON_US Distillate Fuel Oil Consumption (Total), All Sectors, United States Mbbl/d
DKTOCON U.S. Distillate Fuel Oil Consumption (Total), All Sectors MMbbl/d
EESPP_NCR Employment, Private Service Providing, Region=North Central Region Millions
EESPP_NER Employment, Private Service Providing, Region=Northeast Region Millions
EESPP_SOR Employment, Private Service Providing, Region=South Region Millions
EESPP_WER Employment, Private Service Providing, Region=West Region Millions
ELDUPUS U.S. Direct Use of Electricity by Comm. and Ind. Sectors BkWh/d
ELEXPUS U.S. Electricity Exports to Canada and Mexico BkWh/d
ELIMPUS U.S. Electricity Imports from Canada and Mexico BkWh/d
ELNIPUS U.S. Electricity Net Imports from Canada and Mexico BkWh/d
EPEO_MW Total Net Generation, Electric Power Sector, Midwest Region GWh/d
EPEO_NE Total Net Generation, Electric Power Sector, Northeast Region GWh/d
EPEO_SO Total Net Generation, Electric Power Sector, Southeast Region GWh/d
EPEO_WE Total Net Generation, Electric Power Sector, West Region GWh/d
EPEO_US Total Net Generation, Electric Power Sector, United States GWh/d
EPEOPUS U.S. Total Net Generation, Electric Power Sector BkWh/d
EPEOX_MW Total Net Generation (unadjusted), Electric Power Sector, Midwest Region GWh/d
EPEOX_NE Total Net Generation (unadjusted), Electric Power Sector, Northeast Region GWh/d
EPEOX_SO Total Net Generation (unadjusted), Electric Power Sector, Southeast Region GWh/d

January 2014
U.S. Energy Information Administration | STEO Model Documentation: Electricity Generation and Fuel Consumption Models 28
EPEOX_WE Total Net Generation (unadjusted), Electric Power Sector, West Region GWh/d
ESTXPUS U.S. Total Electricity Demand, including Total Retail Sales and Direct Use of Electricity BkWh/d
ETXXSUP Total U.S. Electricity Supply, including Total Generation from All Sectors and Net Imports BkWh/d
EXCCP_MW Electricity Retail Sales to Commercial Sector, Midwest Region GWh/d
EXCCP_NE Electricity Retail Sales to Commercial Sector, Northeast Region GWh/d
EXCCP_SO Electricity Retail Sales to Commercial Sector, South Region GWh/d
EXCCP_WE Electricity Retail Sales to Commercial Sector, West Region GWh/d
EXICP_MW Electricity Retail Sales to Industrial Sector, Midwest Region GWh/d
EXICP_NE Electricity Retail Sales to Industrial Sector, Northeast Region GWh/d
EXICP_SO Electricity Retail Sales to Industrial Sector, South Region GWh/d
EXICP_WE Electricity Retail Sales to Industrial Sector, West Region GWh/d
EXTCP_MW Electricity Retail Sales to All Sectors, Midwest Region GWh/d
EXTCP_NE Electricity Retail Sales to All Sectors, Northeast Region GWh/d
EXTCP_SO Electricity Retail Sales to All Sectors, South Region GWh/d
EXTCP_WE Electricity Retail Sales to All Sectors, West Region GWh/d
EXTCPUS U.S. Electricity Retail Sales to All Sectors BkWh/d
FEB = 1 if February, 0 otherwise --
FFCH_MW Fossil Fuel Net Generation, Comm. and Ind. Sectors, Midwest Region GWh/d
FFCH_NE Fossil Fuel Net Generation, Comm. and Ind. Sectors, Northeast Region GWh/d
FFCH_SO Fossil Fuel Net Generation, Comm. and Ind. Sectors, Southeast Region GWh/d
FFCH_WE Fossil Fuel Net Generation, Comm. and Ind. Sectors, West Region GWh/d
FFCH_US Fossil Fuel Net Generation, Comm. and Ind. Sectors, United States GWh/d
FFEP_MW Fossil Fuel Net Generation, Electric Power Sector, Midwest Region GWh/d
FFEP_NE Fossil Fuel Net Generation, Electric Power Sector, Northeast Region GWh/d
FFEP_SO Fossil Fuel Net Generation, Electric Power Sector, Southeast Region GWh/d
FFEP_WE Fossil Fuel Net Generation, Electric Power Sector, West Region GWh/d
FFEP_US Fossil Fuel Net Generation, Electric Power Sector, United States GWh/d
FFEPTOT U.S. Fossil Fuel Net Generation, Electric Power Sector BkWh/d
FFTO_MW Fossil Fuel Net Generation, All Sectors, Midwest Region GWh/d
FFTO_NE Fossil Fuel Net Generation, All Sectors, Northeast Region GWh/d
FFTO_SO Fossil Fuel Net Generation, All Sectors, Southeast Region GWh/d
FFTO_WE Fossil Fuel Net Generation, All Sectors, West Region GWh/d
FFTO_US Fossil Fuel Net Generation, All Sectors, United States GWh/d
GEEP_MW Geothermal Net Generation, Electric Power Sector, Midwest Region GWh/d
GEEP_NE Geothermal Net Generation, Electric Power Sector, Northeast Region GWh/d
GEEP_SO Geothermal Net Generation, Electric Power Sector, Southeast Region GWh/d
GEEP_WE Geothermal Net Generation, Electric Power Sector, West Region GWh/d
GEEP_US Geothermal Net Generation, Electric Power Sector, United States GWh/d
GEEPTOT U.S. Geothermal Net Generation, Electric Power Sector BkWh/d
GEEPCAP_MW Geothermal Capacity, Electric Power Sector, Midwest Region MW
GEEPCAP_NE Geothermal Capacity, Electric Power Sector, Northeast Region MW
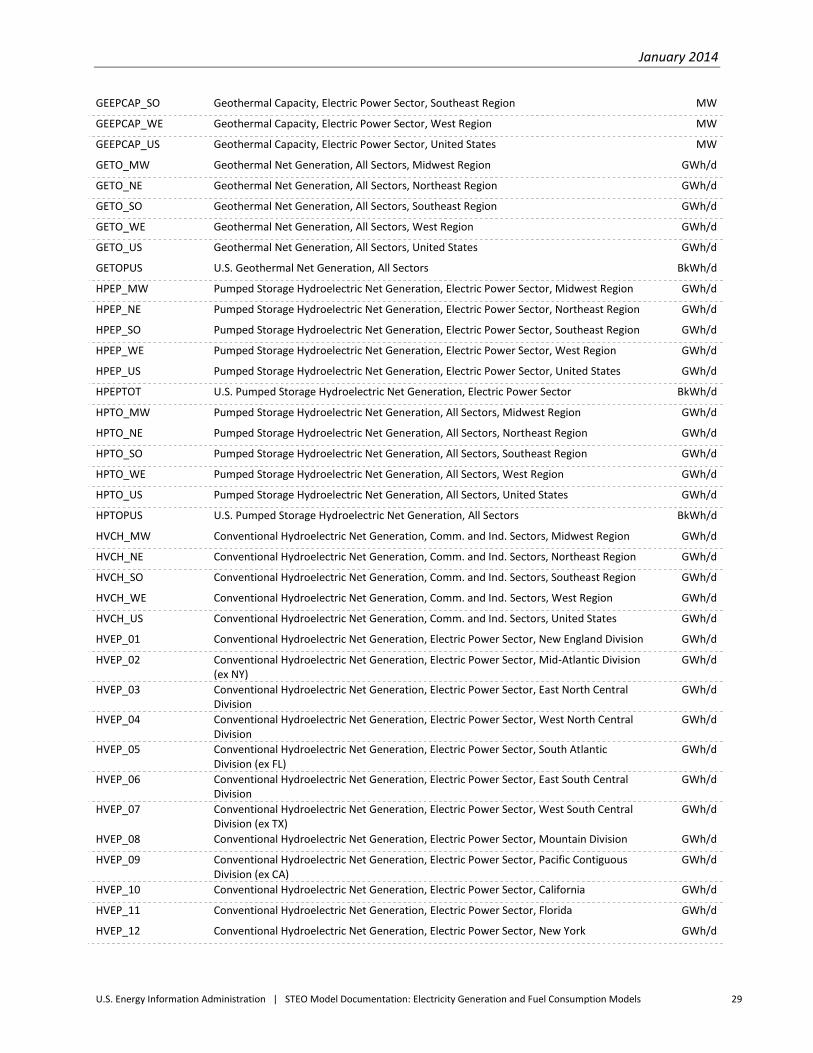
January 2014
U.S. Energy Information Administration | STEO Model Documentation: Electricity Generation and Fuel Consumption Models 29
GEEPCAP_SO Geothermal Capacity, Electric Power Sector, Southeast Region MW
GEEPCAP_WE Geothermal Capacity, Electric Power Sector, West Region MW
GEEPCAP_US Geothermal Capacity, Electric Power Sector, United States MW
GETO_MW Geothermal Net Generation, All Sectors, Midwest Region GWh/d
GETO_NE Geothermal Net Generation, All Sectors, Northeast Region GWh/d
GETO_SO Geothermal Net Generation, All Sectors, Southeast Region GWh/d
GETO_WE Geothermal Net Generation, All Sectors, West Region GWh/d
GETO_US Geothermal Net Generation, All Sectors, United States GWh/d
GETOPUS U.S. Geothermal Net Generation, All Sectors BkWh/d
HPEP_MW Pumped Storage Hydroelectric Net Generation, Electric Power Sector, Midwest Region GWh/d
HPEP_NE Pumped Storage Hydroelectric Net Generation, Electric Power Sector, Northeast Region GWh/d
HPEP_SO Pumped Storage Hydroelectric Net Generation, Electric Power Sector, Southeast Region GWh/d
HPEP_WE Pumped Storage Hydroelectric Net Generation, Electric Power Sector, West Region GWh/d
HPEP_US Pumped Storage Hydroelectric Net Generation, Electric Power Sector, United States GWh/d
HPEPTOT U.S. Pumped Storage Hydroelectric Net Generation, Electric Power Sector BkWh/d
HPTO_MW Pumped Storage Hydroelectric Net Generation, All Sectors, Midwest Region GWh/d
HPTO_NE Pumped Storage Hydroelectric Net Generation, All Sectors, Northeast Region GWh/d
HPTO_SO Pumped Storage Hydroelectric Net Generation, All Sectors, Southeast Region GWh/d
HPTO_WE Pumped Storage Hydroelectric Net Generation, All Sectors, West Region GWh/d
HPTO_US Pumped Storage Hydroelectric Net Generation, All Sectors, United States GWh/d
HPTOPUS U.S. Pumped Storage Hydroelectric Net Generation, All Sectors BkWh/d
HVCH_MW Conventional Hydroelectric Net Generation, Comm. and Ind. Sectors, Midwest Region GWh/d
HVCH_NE Conventional Hydroelectric Net Generation, Comm. and Ind. Sectors, Northeast Region GWh/d
HVCH_SO Conventional Hydroelectric Net Generation, Comm. and Ind. Sectors, Southeast Region GWh/d
HVCH_WE Conventional Hydroelectric Net Generation, Comm. and Ind. Sectors, West Region GWh/d
HVCH_US Conventional Hydroelectric Net Generation, Comm. and Ind. Sectors, United States GWh/d
HVEP_01 Conventional Hydroelectric Net Generation, Electric Power Sector, New England Division GWh/d
HVEP_02 Conventional Hydroelectric Net Generation, Electric Power Sector, Mid-Atlantic Division (ex NY)
GWh/d
HVEP_03 Conventional Hydroelectric Net Generation, Electric Power Sector, East North Central Division
GWh/d
HVEP_04 Conventional Hydroelectric Net Generation, Electric Power Sector, West North Central Division
GWh/d
HVEP_05 Conventional Hydroelectric Net Generation, Electric Power Sector, South Atlantic Division (ex FL)
GWh/d
HVEP_06 Conventional Hydroelectric Net Generation, Electric Power Sector, East South Central Division
GWh/d
HVEP_07 Conventional Hydroelectric Net Generation, Electric Power Sector, West South Central Division (ex TX)
GWh/d
HVEP_08 Conventional Hydroelectric Net Generation, Electric Power Sector, Mountain Division GWh/d
HVEP_09 Conventional Hydroelectric Net Generation, Electric Power Sector, Pacific Contiguous Division (ex CA)
GWh/d
HVEP_10 Conventional Hydroelectric Net Generation, Electric Power Sector, California GWh/d
HVEP_11 Conventional Hydroelectric Net Generation, Electric Power Sector, Florida GWh/d
HVEP_12 Conventional Hydroelectric Net Generation, Electric Power Sector, New York GWh/d
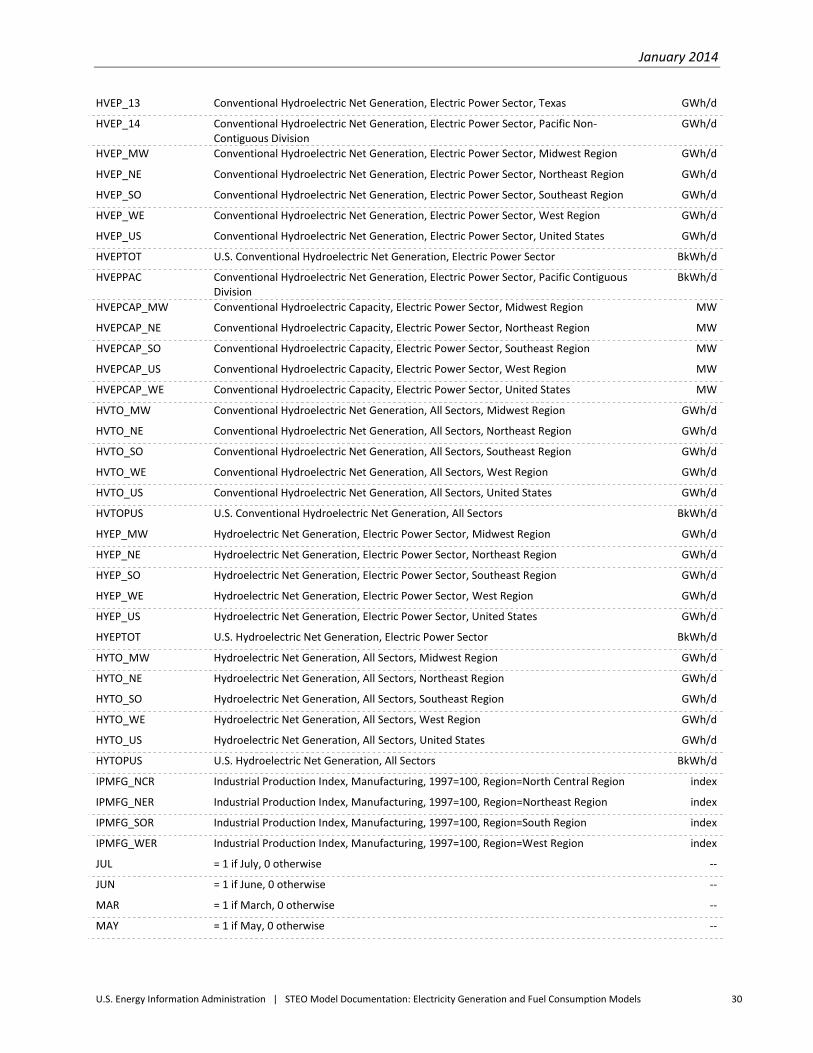
January 2014
U.S. Energy Information Administration | STEO Model Documentation: Electricity Generation and Fuel Consumption Models 30
HVEP_13 Conventional Hydroelectric Net Generation, Electric Power Sector, Texas GWh/d
HVEP_14 Conventional Hydroelectric Net Generation, Electric Power Sector, Pacific Non-Contiguous Division
GWh/d
HVEP_MW Conventional Hydroelectric Net Generation, Electric Power Sector, Midwest Region GWh/d
HVEP_NE Conventional Hydroelectric Net Generation, Electric Power Sector, Northeast Region GWh/d
HVEP_SO Conventional Hydroelectric Net Generation, Electric Power Sector, Southeast Region GWh/d
HVEP_WE Conventional Hydroelectric Net Generation, Electric Power Sector, West Region GWh/d
HVEP_US Conventional Hydroelectric Net Generation, Electric Power Sector, United States GWh/d
HVEPTOT U.S. Conventional Hydroelectric Net Generation, Electric Power Sector BkWh/d
HVEPPAC Conventional Hydroelectric Net Generation, Electric Power Sector, Pacific Contiguous Division
BkWh/d
HVEPCAP_MW Conventional Hydroelectric Capacity, Electric Power Sector, Midwest Region MW
HVEPCAP_NE Conventional Hydroelectric Capacity, Electric Power Sector, Northeast Region MW
HVEPCAP_SO Conventional Hydroelectric Capacity, Electric Power Sector, Southeast Region MW
HVEPCAP_US Conventional Hydroelectric Capacity, Electric Power Sector, West Region MW
HVEPCAP_WE Conventional Hydroelectric Capacity, Electric Power Sector, United States MW
HVTO_MW Conventional Hydroelectric Net Generation, All Sectors, Midwest Region GWh/d
HVTO_NE Conventional Hydroelectric Net Generation, All Sectors, Northeast Region GWh/d
HVTO_SO Conventional Hydroelectric Net Generation, All Sectors, Southeast Region GWh/d
HVTO_WE Conventional Hydroelectric Net Generation, All Sectors, West Region GWh/d
HVTO_US Conventional Hydroelectric Net Generation, All Sectors, United States GWh/d
HVTOPUS U.S. Conventional Hydroelectric Net Generation, All Sectors BkWh/d
HYEP_MW Hydroelectric Net Generation, Electric Power Sector, Midwest Region GWh/d
HYEP_NE Hydroelectric Net Generation, Electric Power Sector, Northeast Region GWh/d
HYEP_SO Hydroelectric Net Generation, Electric Power Sector, Southeast Region GWh/d
HYEP_WE Hydroelectric Net Generation, Electric Power Sector, West Region GWh/d
HYEP_US Hydroelectric Net Generation, Electric Power Sector, United States GWh/d
HYEPTOT U.S. Hydroelectric Net Generation, Electric Power Sector BkWh/d
HYTO_MW Hydroelectric Net Generation, All Sectors, Midwest Region GWh/d
HYTO_NE Hydroelectric Net Generation, All Sectors, Northeast Region GWh/d
HYTO_SO Hydroelectric Net Generation, All Sectors, Southeast Region GWh/d
HYTO_WE Hydroelectric Net Generation, All Sectors, West Region GWh/d
HYTO_US Hydroelectric Net Generation, All Sectors, United States GWh/d
HYTOPUS U.S. Hydroelectric Net Generation, All Sectors BkWh/d
IPMFG_NCR Industrial Production Index, Manufacturing, 1997=100, Region=North Central Region index
IPMFG_NER Industrial Production Index, Manufacturing, 1997=100, Region=Northeast Region index
IPMFG_SOR Industrial Production Index, Manufacturing, 1997=100, Region=South Region index
IPMFG_WER Industrial Production Index, Manufacturing, 1997=100, Region=West Region index
JUL = 1 if July, 0 otherwise --
JUN = 1 if June, 0 otherwise --
MAR = 1 if March, 0 otherwise --
MAY = 1 if May, 0 otherwise --

January 2014
U.S. Energy Information Administration | STEO Model Documentation: Electricity Generation and Fuel Consumption Models 31
MLCH_MW Municipal Waste Biomass Net Generation, Comm. and Ind. Sectors, Midwest Region GWh/d
MLCH_NE Municipal Waste Biomass Net Generation, Comm. and Ind. Sectors, Northeast Region GWh/d
MLCH_SO Municipal Waste Biomass Net Generation, Comm. and Ind. Sectors, Southeast Region GWh/d
MLCH_WE Municipal Waste Biomass Net Generation, Comm. and Ind. Sectors, West Region GWh/d
MLCH_US Municipal Waste Biomass Net Generation, Comm. and Ind. Sectors, United States GWh/d
MLEP_MW Municipal Waste Biomass Net Generation, Electric Power Sector, Midwest Region GWh/d
MLEP_NE Municipal Waste Biomass Net Generation, Electric Power Sector, Northeast Region GWh/d
MLEP_SO Municipal Waste Biomass Net Generation, Electric Power Sector, Southeast Region GWh/d
MLEP_WE Municipal Waste Biomass Net Generation, Electric Power Sector, West Region GWh/d
MLEP_US Municipal Waste Biomass Net Generation, Electric Power Sector, United States GWh/d
MLEPTOT U.S. Municipal Waste Biomass Net Generation, Electric Power Sector BkWh/d
MLEPCAP_MW Municipal Waste Biomass Capacity, Electric Power Sector, Midwest Region MW
MLEPCAP_NE Municipal Waste Biomass Capacity, Electric Power Sector, Northeast Region MW
MLEPCAP_SO Municipal Waste Biomass Capacity, Electric Power Sector, Southeast Region MW
MLEPCAP_WE Municipal Waste Biomass Capacity, Electric Power Sector, West Region MW
MLEPCAP_US Municipal Waste Biomass Capacity, Electric Power Sector, United States MW
MLTO_MW Municipal Waste Biomass Net Generation, All Sectors, Midwest Region GWh/d
MLTO_NE Municipal Waste Biomass Net Generation, All Sectors, Northeast Region GWh/d
MLTO_SO Municipal Waste Biomass Net Generation, All Sectors, Southeast Region GWh/d
MLTO_WE Municipal Waste Biomass Net Generation, All Sectors, West Region GWh/d
MLTO_US Municipal Waste Biomass Net Generation, All Sectors, United States GWh/d
NGCH_MW Natural Gas Net Generation, Comm. and Ind. Sectors, Midwest Region GWh/d
NGCH_NE Natural Gas Net Generation, Comm. and Ind. Sectors, Northeast Region GWh/d
NGCH_SO Natural Gas Net Generation, Comm. and Ind. Sectors, Southeast Region GWh/d
NGCH_WE Natural Gas Net Generation, Comm. and Ind. Sectors, West Region GWh/d
NGCH_US Natural Gas Net Generation, Comm. and Ind. Sectors, United States GWh/d
NGCHCON_EL_MW Natural Gas Consumption for Generation, Comm. and Ind. Sectors, Midwest Region MMcf/d
NGCHCON_EL_NE Natural Gas Consumption for Generation, Comm. and Ind. Sectors, Northeast Region MMcf/d
NGCHCON_EL_SO Natural Gas Consumption for Generation, Comm. and Ind. Sectors, Southeast Region MMcf/d
NGCHCON_EL_WE Natural Gas Consumption for Generation, Comm. and Ind. Sectors, West Region MMcf/d
NGCHCON_EL_US Natural Gas Consumption for Generation, Comm. and Ind. Sectors, United States MMcf/d
NGCHCON_EL U.S. Natural Gas Consumption for Generation, Comm. and Ind. Sectors Bcf/d
NGCHCON_MW Natural Gas Consumption (Total), Comm. and Ind. Sectors, Midwest Region MMcf/d
NGCHCON_NE Natural Gas Consumption (Total), Comm. and Ind. Sectors, Northeast Region MMcf/d
NGCHCON_SO Natural Gas Consumption (Total), Comm. and Ind. Sectors, Southeast Region MMcf/d
NGCHCON_WE Natural Gas Consumption (Total), Comm. and Ind. Sectors, West Region MMcf/d
NGCHCON_US Natural Gas Consumption (Total), Comm. and Ind. Sectors, United States MMcf/d
NGCHCON U.S. Natural Gas Consumption (Total), Comm. and Ind. Sectors Bcf/d
NGEP_MW Natural Gas Net Generation, Electric Power Sector, Midwest Region GWh/d
NGEP_NE Natural Gas Net Generation, Electric Power Sector, Northeast Region GWh/d
NGEP_SO Natural Gas Net Generation, Electric Power Sector, Southeast Region GWh/d

January 2014
U.S. Energy Information Administration | STEO Model Documentation: Electricity Generation and Fuel Consumption Models 32
NGEP_WE Natural Gas Net Generation, Electric Power Sector, West Region GWh/d
NGEP_US Natural Gas Net Generation, Electric Power Sector, United States GWh/d
NGEPTOT U.S. Natural Gas Net Generation, Electric Power Sector BkWh/d
NGEPCAP_MW Natural Gas Capacity, Electric Power Sector, Midwest Region MW
NGEPCAP_NE Natural Gas Capacity, Electric Power Sector, Northeast Region MW
NGEPCAP_SO Natural Gas Capacity, Electric Power Sector, Southeast Region MW
NGEPCAP_WE Natural Gas Capacity, Electric Power Sector, West Region MW
NGEPCAP_US Natural Gas Capacity, Electric Power Sector, United States MW
NGEPCON_EL_MW Natural Gas Consumption for Generation, Electric Power Sector, Midwest Region MMcf/d
NGEPCON_EL_NE Natural Gas Consumption for Generation, Electric Power Sector, Northeast Region MMcf/d
NGEPCON_EL_SO Natural Gas Consumption for Generation, Electric Power Sector, Southeast Region MMcf/d
NGEPCON_EL_WE Natural Gas Consumption for Generation, Electric Power Sector, West Region MMcf/d
NGEPCON_EL_US Natural Gas Consumption for Generation, Electric Power Sector, United States MMcf/d
NGEPCON_EL U.S. Natural Gas Consumption for Generation, Electric Power Sector Bcf/d
NGEPCON_UTO_MW Natural Gas Consumption for Useful Thermal Output, Electric Power Sector, Midwest Region
MMcf/d
NGEPCON_UTO_NE Natural Gas Consumption for Useful Thermal Output, Electric Power Sector, Northeast Region
MMcf/d
NGEPCON_UTO_SO Natural Gas Consumption for Useful Thermal Output, Electric Power Sector, Southeast Region
MMcf/d
NGEPCON_UTO_WE Natural Gas Consumption for Useful Thermal Output, Electric Power Sector, West Region
MMcf/d
NGEPCON_UTO_US Natural Gas Consumption for Useful Thermal Output, Electric Power Sector, United States
MMcf/d
NGEPCON_MW Natural Gas Consumption (Total), Electric Power Sector, Midwest Region MMcf/d
NGEPCON_NE Natural Gas Consumption (Total), Electric Power Sector, Northeast Region MMcf/d
NGEPCON_SO Natural Gas Consumption (Total), Electric Power Sector, Southeast Region MMcf/d
NGEPCON_WE Natural Gas Consumption (Total), Electric Power Sector, West Region MMcf/d
NGEPCON_US Natural Gas Consumption (Total), Electric Power Sector, United States MMcf/d
NGEPCON U.S. Natural Gas Consumption (Total), Electric Power Sector Bcf/d
NGEUDUS U.S. Average Cost of Natural Gas Delivered to Electricity Industry $/MMBtu
NGTO_MW Natural Gas Net Generation, All Sectors, Midwest Region GWh/d
NGTO_NE Natural Gas Net Generation, All Sectors, Northeast Region GWh/d
NGTO_SO Natural Gas Net Generation, All Sectors, Southeast Region GWh/d
NGTO_WE Natural Gas Net Generation, All Sectors, West Region GWh/d
NGTO_US Natural Gas Net Generation, All Sectors, United States GWh/d
NGTOPUS U.S. Natural Gas Net Generation, All Sectors BkWh/d
NGTOCON_EL_MW Natural Gas Consumption for Generation, All Sectors, Midwest Region MMcf/d
NGTOCON_EL_NE Natural Gas Consumption for Generation, All Sectors, Northeast Region MMcf/d
NGTOCON_EL_SO Natural Gas Consumption for Generation, All Sectors, Southeast Region MMcf/d
NGTOCON_EL_WE Natural Gas Consumption for Generation, All Sectors, West Region MMcf/d
NGTOCON_EL_US Natural Gas Consumption for Generation, All Sectors, United States MMcf/d
NGTOCON_EL U.S. Natural Gas Consumption for Generation, All Sectors Bcf/d
NGTOCON_MW Natural Gas Consumption (Total), All Sectors, Midwest Region MMcf/d

January 2014
U.S. Energy Information Administration | STEO Model Documentation: Electricity Generation and Fuel Consumption Models 33
NGTOCON_NE Natural Gas Consumption (Total), All Sectors, Northeast Region MMcf/d
NGTOCON_SO Natural Gas Consumption (Total), All Sectors, Southeast Region MMcf/d
NGTOCON_WE Natural Gas Consumption (Total), All Sectors, West Region MMcf/d
NGTOCON_US Natural Gas Consumption (Total), All Sectors, United States MMcf/d
NGTOCON U.S. Natural Gas Consumption (Total), All Sectors Bcf/d
NOV = 1 if November, 0 otherwise --
NUEP_01 Nuclear Net Generation, Electric Power Sector, New England Division GWh/d
NUEP_02 Nuclear Net Generation, Electric Power Sector, Mid-Atlantic Division (ex NY) GWh/d
NUEP_03 Nuclear Net Generation, Electric Power Sector, East North Central Division GWh/d
NUEP_04 Nuclear Net Generation, Electric Power Sector, West North Central Division GWh/d
NUEP_05 Nuclear Net Generation, Electric Power Sector, South Atlantic Division (ex FL) GWh/d
NUEP_06 Nuclear Net Generation, Electric Power Sector, East South Central Division GWh/d
NUEP_07 Nuclear Net Generation, Electric Power Sector, West South Central Division (ex TX) GWh/d
NUEP_08 Nuclear Net Generation, Electric Power Sector, Mountain Division GWh/d
NUEP_09 Nuclear Net Generation, Electric Power Sector, Pacific Contiguous Division (ex CA) GWh/d
NUEP_10 Nuclear Net Generation, Electric Power Sector, California GWh/d
NUEP_11 Nuclear Net Generation, Electric Power Sector, Florida GWh/d
NUEP_12 Nuclear Net Generation, Electric Power Sector, New York GWh/d
NUEP_13 Nuclear Net Generation, Electric Power Sector, Texas GWh/d
NUEP_14 Nuclear Net Generation, Electric Power Sector, Pacific Non-Contiguous Division GWh/d
NUEP_MW Nuclear Net Generation, Electric Power Sector, Midwest Region GWh/d
NUEP_NE Nuclear Net Generation, Electric Power Sector, Northeast Region GWh/d
NUEP_SO Nuclear Net Generation, Electric Power Sector, Southeast Region GWh/d
NUEP_WE Nuclear Net Generation, Electric Power Sector, West Region GWh/d
NUEP_US Nuclear Net Generation, Electric Power Sector, United States GWh/d
NUEPTOT U.S. Nuclear Net Generation, Electric Power Sector BkWh/d
NUTO_MW Nuclear Net Generation, All Sectors, Midwest Region GWh/d
NUTO_NE Nuclear Net Generation, All Sectors, Northeast Region GWh/d
NUTO_SO Nuclear Net Generation, All Sectors, Southeast Region GWh/d
NUTO_WE Nuclear Net Generation, All Sectors, West Region GWh/d
NUTO_US Nuclear Net Generation, All Sectors, United States GWh/d
NUTOPUS U.S. Nuclear Net Generation, All Sectors BkWh/d
OCT = 1 if October, 0 otherwise --
OGCH_MW Other Gases Net Generation, Comm. and Ind. Sectors, Midwest Region GWh/d
OGCH_NE Other Gases Net Generation, Comm. and Ind. Sectors, Northeast Region GWh/d
OGCH_SO Other Gases Net Generation, Comm. and Ind. Sectors, Southeast Region GWh/d
OGCH_WE Other Gases Net Generation, Comm. and Ind. Sectors, West Region GWh/d
OGCH_US Other Gases Net Generation, Comm. and Ind. Sectors, United States GWh/d
OGEP_MW Other Gases Net Generation, Electric Power Sector, Midwest Region GWh/d
OGEP_NE Other Gases Net Generation, Electric Power Sector, Northeast Region GWh/d
OGEP_SO Other Gases Net Generation, Electric Power Sector, Southeast Region GWh/d
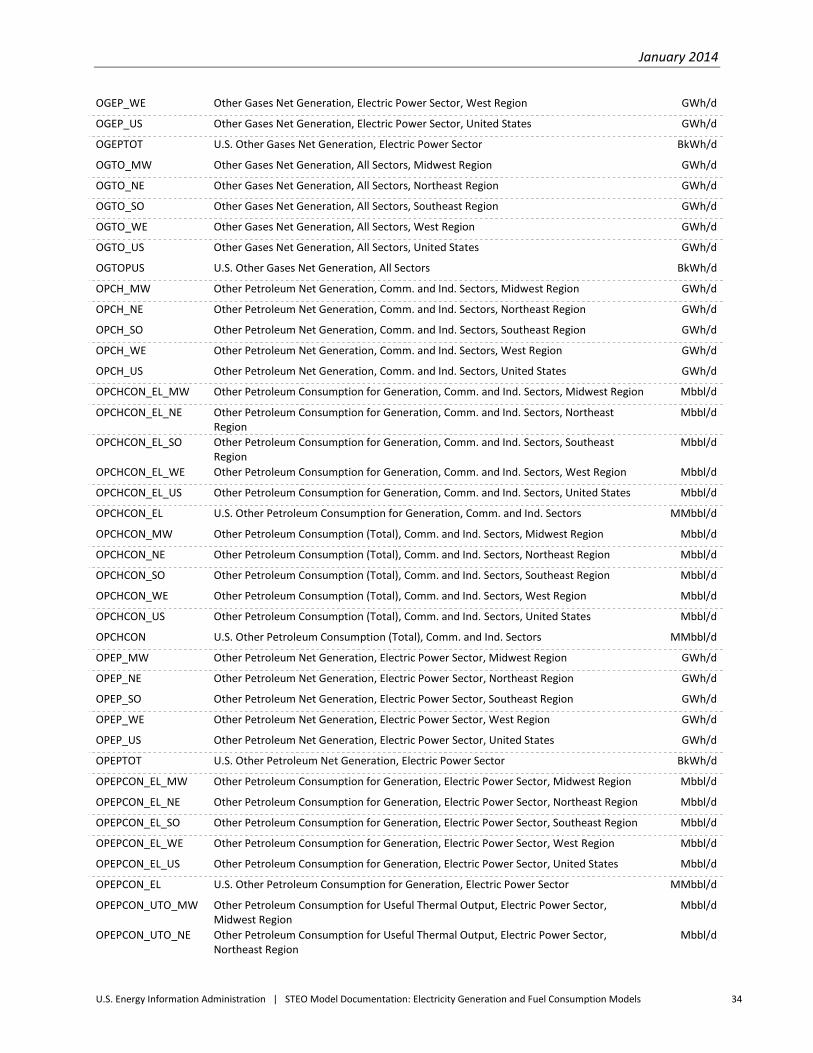
January 2014
U.S. Energy Information Administration | STEO Model Documentation: Electricity Generation and Fuel Consumption Models 34
OGEP_WE Other Gases Net Generation, Electric Power Sector, West Region GWh/d
OGEP_US Other Gases Net Generation, Electric Power Sector, United States GWh/d
OGEPTOT U.S. Other Gases Net Generation, Electric Power Sector BkWh/d
OGTO_MW Other Gases Net Generation, All Sectors, Midwest Region GWh/d
OGTO_NE Other Gases Net Generation, All Sectors, Northeast Region GWh/d
OGTO_SO Other Gases Net Generation, All Sectors, Southeast Region GWh/d
OGTO_WE Other Gases Net Generation, All Sectors, West Region GWh/d
OGTO_US Other Gases Net Generation, All Sectors, United States GWh/d
OGTOPUS U.S. Other Gases Net Generation, All Sectors BkWh/d
OPCH_MW Other Petroleum Net Generation, Comm. and Ind. Sectors, Midwest Region GWh/d
OPCH_NE Other Petroleum Net Generation, Comm. and Ind. Sectors, Northeast Region GWh/d
OPCH_SO Other Petroleum Net Generation, Comm. and Ind. Sectors, Southeast Region GWh/d
OPCH_WE Other Petroleum Net Generation, Comm. and Ind. Sectors, West Region GWh/d
OPCH_US Other Petroleum Net Generation, Comm. and Ind. Sectors, United States GWh/d
OPCHCON_EL_MW Other Petroleum Consumption for Generation, Comm. and Ind. Sectors, Midwest Region Mbbl/d
OPCHCON_EL_NE Other Petroleum Consumption for Generation, Comm. and Ind. Sectors, Northeast Region
Mbbl/d
OPCHCON_EL_SO Other Petroleum Consumption for Generation, Comm. and Ind. Sectors, Southeast Region
Mbbl/d
OPCHCON_EL_WE Other Petroleum Consumption for Generation, Comm. and Ind. Sectors, West Region Mbbl/d
OPCHCON_EL_US Other Petroleum Consumption for Generation, Comm. and Ind. Sectors, United States Mbbl/d
OPCHCON_EL U.S. Other Petroleum Consumption for Generation, Comm. and Ind. Sectors MMbbl/d
OPCHCON_MW Other Petroleum Consumption (Total), Comm. and Ind. Sectors, Midwest Region Mbbl/d
OPCHCON_NE Other Petroleum Consumption (Total), Comm. and Ind. Sectors, Northeast Region Mbbl/d
OPCHCON_SO Other Petroleum Consumption (Total), Comm. and Ind. Sectors, Southeast Region Mbbl/d
OPCHCON_WE Other Petroleum Consumption (Total), Comm. and Ind. Sectors, West Region Mbbl/d
OPCHCON_US Other Petroleum Consumption (Total), Comm. and Ind. Sectors, United States Mbbl/d
OPCHCON U.S. Other Petroleum Consumption (Total), Comm. and Ind. Sectors MMbbl/d
OPEP_MW Other Petroleum Net Generation, Electric Power Sector, Midwest Region GWh/d
OPEP_NE Other Petroleum Net Generation, Electric Power Sector, Northeast Region GWh/d
OPEP_SO Other Petroleum Net Generation, Electric Power Sector, Southeast Region GWh/d
OPEP_WE Other Petroleum Net Generation, Electric Power Sector, West Region GWh/d
OPEP_US Other Petroleum Net Generation, Electric Power Sector, United States GWh/d
OPEPTOT U.S. Other Petroleum Net Generation, Electric Power Sector BkWh/d
OPEPCON_EL_MW Other Petroleum Consumption for Generation, Electric Power Sector, Midwest Region Mbbl/d
OPEPCON_EL_NE Other Petroleum Consumption for Generation, Electric Power Sector, Northeast Region Mbbl/d
OPEPCON_EL_SO Other Petroleum Consumption for Generation, Electric Power Sector, Southeast Region Mbbl/d
OPEPCON_EL_WE Other Petroleum Consumption for Generation, Electric Power Sector, West Region Mbbl/d
OPEPCON_EL_US Other Petroleum Consumption for Generation, Electric Power Sector, United States Mbbl/d
OPEPCON_EL U.S. Other Petroleum Consumption for Generation, Electric Power Sector MMbbl/d
OPEPCON_UTO_MW Other Petroleum Consumption for Useful Thermal Output, Electric Power Sector, Midwest Region
Mbbl/d
OPEPCON_UTO_NE Other Petroleum Consumption for Useful Thermal Output, Electric Power Sector, Northeast Region
Mbbl/d

January 2014
U.S. Energy Information Administration | STEO Model Documentation: Electricity Generation and Fuel Consumption Models 35
OPEPCON_UTO_SO Other Petroleum Consumption for Useful Thermal Output, Electric Power Sector, Southeast Region
Mbbl/d
OPEPCON_UTO_WE Other Petroleum Consumption for Useful Thermal Output, Electric Power Sector, West Region
Mbbl/d
OPEPCON_UTO_US Other Petroleum Consumption for Useful Thermal Output, Electric Power Sector, United States
Mbbl/d
OPEPCON_MW Other Petroleum Consumption (Total), Electric Power Sector, Midwest Region Mbbl/d
OPEPCON_NE Other Petroleum Consumption (Total), Electric Power Sector, Northeast Region Mbbl/d
OPEPCON_SO Other Petroleum Consumption (Total), Electric Power Sector, Southeast Region Mbbl/d
OPEPCON_WE Other Petroleum Consumption (Total), Electric Power Sector, West Region Mbbl/d
OPEPCON_US Other Petroleum Consumption (Total), Electric Power Sector, United States Mbbl/d
OPEPCON U.S. Other Petroleum Consumption (Total), Electric Power Sector MMbbl/d
OPTO_MW Other Petroleum Net Generation, All Sectors, Midwest Region GWh/d
OPTO_NE Other Petroleum Net Generation, All Sectors, Northeast Region GWh/d
OPTO_SO Other Petroleum Net Generation, All Sectors, Southeast Region GWh/d
OPTO_WE Other Petroleum Net Generation, All Sectors, West Region GWh/d
OPTO_US Other Petroleum Net Generation, All Sectors, United States GWh/d
OPTOPUS U.S. Other Petroleum Net Generation, All Sectors BkWh/d
OPTOCON_EL_MW Other Petroleum Consumption for Generation, All Sectors, Midwest Region Mbbl/d
OPTOCON_EL_NE Other Petroleum Consumption for Generation, All Sectors, Northeast Region Mbbl/d
OPTOCON_EL_SO Other Petroleum Consumption for Generation, All Sectors, Southeast Region Mbbl/d
OPTOCON_EL_WE Other Petroleum Consumption for Generation, All Sectors, West Region Mbbl/d
OPTOCON_EL_US Other Petroleum Consumption for Generation, All Sectors, United States Mbbl/d
OPTOCON_EL U.S. Other Petroleum Consumption for Generation, All Sectors MMbbl/d
OPTOCON_MW Other Petroleum Consumption (Total), All Sectors, Midwest Region Mbbl/d
OPTOCON_NE Other Petroleum Consumption (Total), All Sectors, Northeast Region Mbbl/d
OPTOCON_SO Other Petroleum Consumption (Total), All Sectors, Southeast Region Mbbl/d
OPTOCON_WE Other Petroleum Consumption (Total), All Sectors, West Region Mbbl/d
OPTOCON_US Other Petroleum Consumption (Total), All Sectors, United States Mbbl/d
OPTOCON U.S. Other Petroleum Consumption (Total), All Sectors MMbbl/d
ORCH_MW Other Waste Biomass Net Generation, Comm. and Ind. Sectors, Midwest Region GWh/d
ORCH_NE Other Waste Biomass Net Generation, Comm. and Ind. Sectors, Northeast Region GWh/d
ORCH_SO Other Waste Biomass Net Generation, Comm. and Ind. Sectors, Southeast Region GWh/d
ORCH_WE Other Waste Biomass Net Generation, Comm. and Ind. Sectors, West Region GWh/d
ORCH_US Other Waste Biomass Net Generation, Comm. and Ind. Sectors, United States GWh/d
OREP_MW Other Waste Biomass Net Generation, Electric Power Sector, Midwest Region GWh/d
OREP_NE Other Waste Biomass Net Generation, Electric Power Sector, Northeast Region GWh/d
OREP_SO Other Waste Biomass Net Generation, Electric Power Sector, Southeast Region GWh/d
OREP_WE Other Waste Biomass Net Generation, Electric Power Sector, West Region GWh/d
OREP_US Other Waste Biomass Net Generation, Electric Power Sector, United States GWh/d
OREPTOT U.S. Other Waste Biomass Net Generation, Electric Power Sector BkWh/d
OREPCAP_MW Other Waste Biomass Capacity, Electric Power Sector, Midwest Region MW
OREPCAP_NE Other Waste Biomass Capacity, Electric Power Sector, Northeast Region MW

January 2014
U.S. Energy Information Administration | STEO Model Documentation: Electricity Generation and Fuel Consumption Models 36
OREPCAP_SO Other Waste Biomass Capacity, Electric Power Sector, Southeast Region MW
OREPCAP_WE Other Waste Biomass Capacity, Electric Power Sector, West Region MW
OREPCAP_US Other Waste Biomass Capacity, Electric Power Sector, United States MW
ORTO_MW Other Waste Biomass Net Generation, All Sectors, Midwest Region GWh/d
ORTO_NE Other Waste Biomass Net Generation, All Sectors, Northeast Region GWh/d
ORTO_SO Other Waste Biomass Net Generation, All Sectors, Southeast Region GWh/d
ORTO_WE Other Waste Biomass Net Generation, All Sectors, West Region GWh/d
ORTO_US Other Waste Biomass Net Generation, All Sectors, United States GWh/d
OTCH_MW Other Nonrenewable Fuels Net Generation, Comm. and Ind. Sectors, Midwest Region GWh/d
OTCH_NE Other Nonrenewable Fuels Net Generation, Comm. and Ind. Sectors, Northeast Region GWh/d
OTCH_SO Other Nonrenewable Fuels Net Generation, Comm. and Ind. Sectors, Southeast Region GWh/d
OTCH_WE Other Nonrenewable Fuels Net Generation, Comm. and Ind. Sectors, West Region GWh/d
OTCH_US Other Nonrenewable Fuels Net Generation, Comm. and Ind. Sectors, United States GWh/d
OTEP_MW Other Nonrenewable Fuels Net Generation, Electric Power Sector, Midwest Region GWh/d
OTEP_NE Other Nonrenewable Fuels Net Generation, Electric Power Sector, Northeast Region GWh/d
OTEP_SO Other Nonrenewable Fuels Net Generation, Electric Power Sector, Southeast Region GWh/d
OTEP_WE Other Nonrenewable Fuels Net Generation, Electric Power Sector, West Region GWh/d
OTEP_US Other Nonrenewable Fuels Net Generation, Electric Power Sector, United States GWh/d
OTEPTOT U.S. Other Nonrenewable Fuels Net Generation, Electric Power Sector BkWh/d
OTTO_MW Other Nonrenewable Fuels Net Generation, All Sectors, Midwest Region GWh/d
OTTO_NE Other Nonrenewable Fuels Net Generation, All Sectors, Northeast Region GWh/d
OTTO_SO Other Nonrenewable Fuels Net Generation, All Sectors, Southeast Region GWh/d
OTTO_WE Other Nonrenewable Fuels Net Generation, All Sectors, West Region GWh/d
OTTO_US Other Nonrenewable Fuels Net Generation, All Sectors, United States GWh/d
OTTOPUS U.S. Other Nonrenewable Fuels Net Generation, All Sectors BkWh/d
OWCH_MW Waste Biomass Net Generation, Comm. and Ind. Sectors, Midwest Region GWh/d
OWCH_NE Waste Biomass Net Generation, Comm. and Ind. Sectors, Northeast Region GWh/d
OWCH_SO Waste Biomass Net Generation, Comm. and Ind. Sectors, Southeast Region GWh/d
OWCH_WE Waste Biomass Net Generation, Comm. and Ind. Sectors, West Region GWh/d
OWCH_US Waste Biomass Net Generation, Comm. and Ind. Sectors, United States GWh/d
OWEP_MW Waste Biomass Net Generation, Electric Power Sector, Midwest Region GWh/d
OWEP_NE Waste Biomass Net Generation, Electric Power Sector, Northeast Region GWh/d
OWEP_SO Waste Biomass Net Generation, Electric Power Sector, Southeast Region GWh/d
OWEP_WE Waste Biomass Net Generation, Electric Power Sector, West Region GWh/d
OWEP_US Waste Biomass Net Generation, Electric Power Sector, United States GWh/d
OWEPTOT U.S. Waste Biomass Net Generation, Electric Power Sector BkWh/d
OWEPCAP_MW Waste Biomass Capacity, Electric Power Sector, Midwest Region MW
OWEPCAP_NE Waste Biomass Capacity, Electric Power Sector, Northeast Region MW
OWEPCAP_SO Waste Biomass Capacity, Electric Power Sector, Southeast Region MW
OWEPCAP_WE Waste Biomass Capacity, Electric Power Sector, West Region MW
OWEPCAP_US Waste Biomass Capacity, Electric Power Sector, United States MW

January 2014
U.S. Energy Information Administration | STEO Model Documentation: Electricity Generation and Fuel Consumption Models 37
OWTO_MW Waste Biomass Net Generation, All Sectors, Midwest Region GWh/d
OWTO_NE Waste Biomass Net Generation, All Sectors, Northeast Region GWh/d
OWTO_SO Waste Biomass Net Generation, All Sectors, Southeast Region GWh/d
OWTO_WE Waste Biomass Net Generation, All Sectors, West Region GWh/d
OWTO_US Waste Biomass Net Generation, All Sectors, United States GWh/d
OWTOPUS U.S. Waste Biomass Net Generation, All Sectors BkWh/d
PACH_MW Petroleum Net Generation, Comm. and Ind. Sectors, Midwest Region GWh/d
PACH_NE Petroleum Net Generation, Comm. and Ind. Sectors, Northeast Region GWh/d
PACH_SO Petroleum Net Generation, Comm. and Ind. Sectors, Southeast Region GWh/d
PACH_WE Petroleum Net Generation, Comm. and Ind. Sectors, West Region GWh/d
PACH_US Petroleum Net Generation, Comm. and Ind. Sectors, United States GWh/d
PACHCON_EL_MW Petroleum Consumption for Generation, Comm. and Ind. Sectors, Midwest Region Mbbl/d
PACHCON_EL_NE Petroleum Consumption for Generation, Comm. and Ind. Sectors, Northeast Region Mbbl/d
PACHCON_EL_SO Petroleum Consumption for Generation, Comm. and Ind. Sectors, Southeast Region Mbbl/d
PACHCON_EL_WE Petroleum Consumption for Generation, Comm. and Ind. Sectors, West Region Mbbl/d
PACHCON_EL_US Petroleum Consumption for Generation, Comm. and Ind. Sectors, United States Mbbl/d
PACHCON_EL U.S. Petroleum Consumption for Generation, Comm. and Ind. Sectors MMbbl/d
PACHCON_MW Petroleum Consumption (Total), Comm. and Ind. Sectors, Midwest Region Mbbl/d
PACHCON_NE Petroleum Consumption (Total), Comm. and Ind. Sectors, Northeast Region Mbbl/d
PACHCON_SO Petroleum Consumption (Total), Comm. and Ind. Sectors, Southeast Region Mbbl/d
PACHCON_WE Petroleum Consumption (Total), Comm. and Ind. Sectors, West Region Mbbl/d
PACHCON_US Petroleum Consumption (Total), Comm. and Ind. Sectors, United States Mbbl/d
PACHCON U.S. Petroleum Consumption (Total), Comm. and Ind. Sectors MMbbl/d
PAEP_MW Petroleum Net Generation, Electric Power Sector, Midwest Region GWh/d
PAEP_NE Petroleum Net Generation, Electric Power Sector, Northeast Region GWh/d
PAEP_SO Petroleum Net Generation, Electric Power Sector, Southeast Region GWh/d
PAEP_WE Petroleum Net Generation, Electric Power Sector, West Region GWh/d
PAEP_US Petroleum Net Generation, Electric Power Sector, United States GWh/d
PAEPTOT U.S. Petroleum Net Generation, Electric Power Sector BkWh/d
PAEPCON_EL_MW Petroleum Consumption for Generation, Electric Power Sector, Midwest Region Mbbl/d
PAEPCON_EL_NE Petroleum Consumption for Generation, Electric Power Sector, Northeast Region Mbbl/d
PAEPCON_EL_SO Petroleum Consumption for Generation, Electric Power Sector, Southeast Region Mbbl/d
PAEPCON_EL_WE Petroleum Consumption for Generation, Electric Power Sector, West Region Mbbl/d
PAEPCON_EL_US Petroleum Consumption for Generation, Electric Power Sector, United States Mbbl/d
PAEPCON_EL U.S. Petroleum Consumption for Generation, Electric Power Sector MMbbl/d
PAEPCON_MW Petroleum Consumption (Total), Electric Power Sector, Midwest Region Mbbl/d
PAEPCON_NE Petroleum Consumption (Total), Electric Power Sector, Northeast Region Mbbl/d
PAEPCON_SO Petroleum Consumption (Total), Electric Power Sector, Southeast Region Mbbl/d
PAEPCON_WE Petroleum Consumption (Total), Electric Power Sector, West Region Mbbl/d
PAEPCON_US Petroleum Consumption (Total), Electric Power Sector, United States Mbbl/d
PAEPCON U.S. Petroleum Consumption (Total), Electric Power Sector MMbbl/d

January 2014
U.S. Energy Information Administration | STEO Model Documentation: Electricity Generation and Fuel Consumption Models 38
PATO_MW Petroleum Net Generation, All Sectors, Midwest Region GWh/d
PATO_NE Petroleum Net Generation, All Sectors, Northeast Region GWh/d
PATO_SO Petroleum Net Generation, All Sectors, Southeast Region GWh/d
PATO_WE Petroleum Net Generation, All Sectors, West Region GWh/d
PATO_US Petroleum Net Generation, All Sectors, United States GWh/d
PATOPUS U.S. Petroleum Net Generation, All Sectors BkWh/d
PATOCON_EL_MW Petroleum Consumption for Generation, All Sectors, Midwest Region Mbbl/d
PATOCON_EL_NE Petroleum Consumption for Generation, All Sectors, Northeast Region Mbbl/d
PATOCON_EL_SO Petroleum Consumption for Generation, All Sectors, Southeast Region Mbbl/d
PATOCON_EL_WE Petroleum Consumption for Generation, All Sectors, West Region Mbbl/d
PATOCON_EL_US Petroleum Consumption for Generation, All Sectors, United States Mbbl/d
PATOCON_EL U.S. Petroleum Consumption for Generation, All Sectors MMbbl/d
PATOCON_MW Petroleum Consumption (Total), All Sectors, Midwest Region Mbbl/d
PATOCON_NE Petroleum Consumption (Total), All Sectors, Northeast Region Mbbl/d
PATOCON_SO Petroleum Consumption (Total), All Sectors, Southeast Region Mbbl/d
PATOCON_WE Petroleum Consumption (Total), All Sectors, West Region Mbbl/d
PATOCON_US Petroleum Consumption (Total), All Sectors, United States Mbbl/d
PATOCON U.S. Petroleum Consumption (Total), All Sectors MMbbl/d
PCCH_MW Petroleum Coke Net Generation, Comm. and Ind. Sectors, Midwest Region GWh/d
PCCH_NE Petroleum Coke Net Generation, Comm. and Ind. Sectors, Northeast Region GWh/d
PCCH_SO Petroleum Coke Net Generation, Comm. and Ind. Sectors, Southeast Region GWh/d
PCCH_WE Petroleum Coke Net Generation, Comm. and Ind. Sectors, West Region GWh/d
PCCH_US Petroleum Coke Net Generation, Comm. and Ind. Sectors, United States GWh/d
PCCHCON_EL_MW Petroleum Coke Consumption for Generation, Comm. and Ind. Sectors, Midwest Region Mbbl/d
PCCHCON_EL_NE Petroleum Coke Consumption for Generation, Comm. and Ind. Sectors, Northeast Region
Mbbl/d
PCCHCON_EL_SO Petroleum Coke Consumption for Generation, Comm. and Ind. Sectors, Southeast Region
Mbbl/d
PCCHCON_EL_WE Petroleum Coke Consumption for Generation, Comm. and Ind. Sectors, West Region Mbbl/d
PCCHCON_EL_US Petroleum Coke Consumption for Generation, Comm. and Ind. Sectors, United States Mbbl/d
PCCHCON_EL U.S. Petroleum Coke Consumption for Generation, Comm. and Ind. Sectors MMbbl/d
PCCHCON_MW Petroleum Coke Consumption (Total), Comm. and Ind. Sectors, Midwest Region Mbbl/d
PCCHCON_NE Petroleum Coke Consumption (Total), Comm. and Ind. Sectors, Northeast Region Mbbl/d
PCCHCON_SO Petroleum Coke Consumption (Total), Comm. and Ind. Sectors, Southeast Region Mbbl/d
PCCHCON_WE Petroleum Coke Consumption (Total), Comm. and Ind. Sectors, West Region Mbbl/d
PCCHCON_US Petroleum Coke Consumption (Total), Comm. and Ind. Sectors, United States Mbbl/d
PCCHCON U.S. Petroleum Coke Consumption (Total), Comm. and Ind. Sectors MMbbl/d
PCEP_MW Petroleum Coke Net Generation, Electric Power Sector, Midwest Region GWh/d
PCEP_NE Petroleum Coke Net Generation, Electric Power Sector, Northeast Region GWh/d
PCEP_SO Petroleum Coke Net Generation, Electric Power Sector, Southeast Region GWh/d
PCEP_WE Petroleum Coke Net Generation, Electric Power Sector, West Region GWh/d
PCEP_US Petroleum Coke Net Generation, Electric Power Sector, United States GWh/d
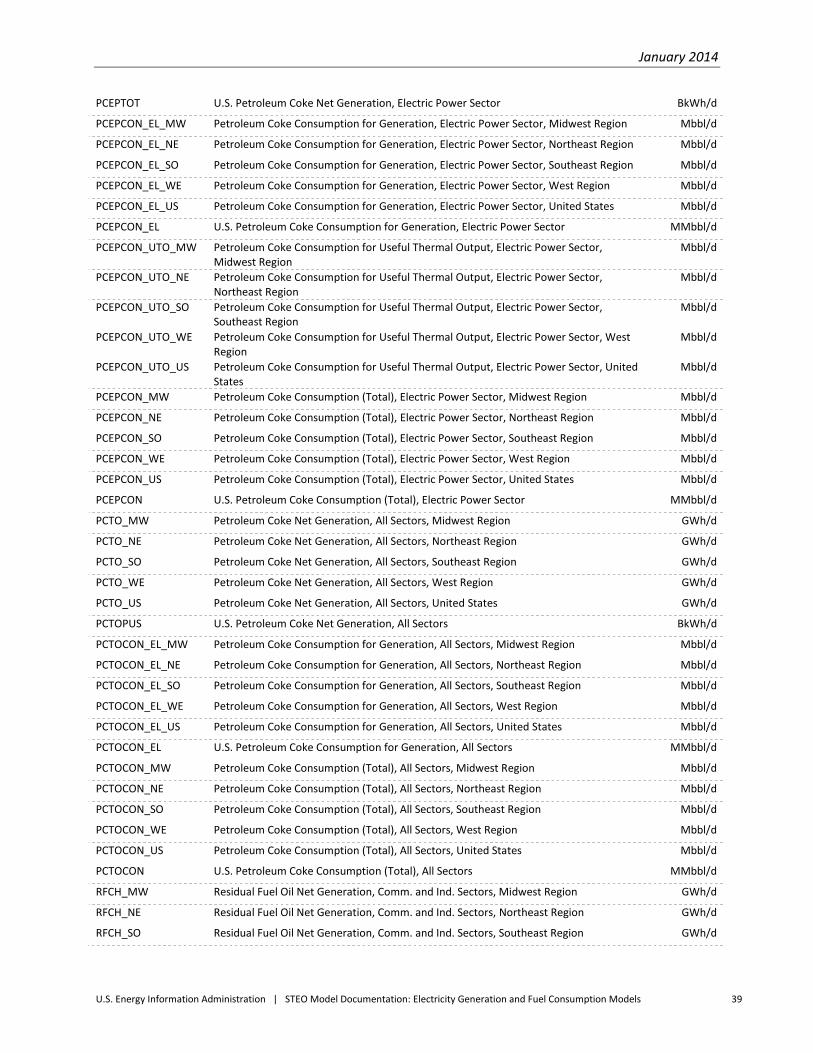
January 2014
U.S. Energy Information Administration | STEO Model Documentation: Electricity Generation and Fuel Consumption Models 39
PCEPTOT U.S. Petroleum Coke Net Generation, Electric Power Sector BkWh/d
PCEPCON_EL_MW Petroleum Coke Consumption for Generation, Electric Power Sector, Midwest Region Mbbl/d
PCEPCON_EL_NE Petroleum Coke Consumption for Generation, Electric Power Sector, Northeast Region Mbbl/d
PCEPCON_EL_SO Petroleum Coke Consumption for Generation, Electric Power Sector, Southeast Region Mbbl/d
PCEPCON_EL_WE Petroleum Coke Consumption for Generation, Electric Power Sector, West Region Mbbl/d
PCEPCON_EL_US Petroleum Coke Consumption for Generation, Electric Power Sector, United States Mbbl/d
PCEPCON_EL U.S. Petroleum Coke Consumption for Generation, Electric Power Sector MMbbl/d
PCEPCON_UTO_MW Petroleum Coke Consumption for Useful Thermal Output, Electric Power Sector, Midwest Region
Mbbl/d
PCEPCON_UTO_NE Petroleum Coke Consumption for Useful Thermal Output, Electric Power Sector, Northeast Region
Mbbl/d
PCEPCON_UTO_SO Petroleum Coke Consumption for Useful Thermal Output, Electric Power Sector, Southeast Region
Mbbl/d
PCEPCON_UTO_WE Petroleum Coke Consumption for Useful Thermal Output, Electric Power Sector, West Region
Mbbl/d
PCEPCON_UTO_US Petroleum Coke Consumption for Useful Thermal Output, Electric Power Sector, United States
Mbbl/d
PCEPCON_MW Petroleum Coke Consumption (Total), Electric Power Sector, Midwest Region Mbbl/d
PCEPCON_NE Petroleum Coke Consumption (Total), Electric Power Sector, Northeast Region Mbbl/d
PCEPCON_SO Petroleum Coke Consumption (Total), Electric Power Sector, Southeast Region Mbbl/d
PCEPCON_WE Petroleum Coke Consumption (Total), Electric Power Sector, West Region Mbbl/d
PCEPCON_US Petroleum Coke Consumption (Total), Electric Power Sector, United States Mbbl/d
PCEPCON U.S. Petroleum Coke Consumption (Total), Electric Power Sector MMbbl/d
PCTO_MW Petroleum Coke Net Generation, All Sectors, Midwest Region GWh/d
PCTO_NE Petroleum Coke Net Generation, All Sectors, Northeast Region GWh/d
PCTO_SO Petroleum Coke Net Generation, All Sectors, Southeast Region GWh/d
PCTO_WE Petroleum Coke Net Generation, All Sectors, West Region GWh/d
PCTO_US Petroleum Coke Net Generation, All Sectors, United States GWh/d
PCTOPUS U.S. Petroleum Coke Net Generation, All Sectors BkWh/d
PCTOCON_EL_MW Petroleum Coke Consumption for Generation, All Sectors, Midwest Region Mbbl/d
PCTOCON_EL_NE Petroleum Coke Consumption for Generation, All Sectors, Northeast Region Mbbl/d
PCTOCON_EL_SO Petroleum Coke Consumption for Generation, All Sectors, Southeast Region Mbbl/d
PCTOCON_EL_WE Petroleum Coke Consumption for Generation, All Sectors, West Region Mbbl/d
PCTOCON_EL_US Petroleum Coke Consumption for Generation, All Sectors, United States Mbbl/d
PCTOCON_EL U.S. Petroleum Coke Consumption for Generation, All Sectors MMbbl/d
PCTOCON_MW Petroleum Coke Consumption (Total), All Sectors, Midwest Region Mbbl/d
PCTOCON_NE Petroleum Coke Consumption (Total), All Sectors, Northeast Region Mbbl/d
PCTOCON_SO Petroleum Coke Consumption (Total), All Sectors, Southeast Region Mbbl/d
PCTOCON_WE Petroleum Coke Consumption (Total), All Sectors, West Region Mbbl/d
PCTOCON_US Petroleum Coke Consumption (Total), All Sectors, United States Mbbl/d
PCTOCON U.S. Petroleum Coke Consumption (Total), All Sectors MMbbl/d
RFCH_MW Residual Fuel Oil Net Generation, Comm. and Ind. Sectors, Midwest Region GWh/d
RFCH_NE Residual Fuel Oil Net Generation, Comm. and Ind. Sectors, Northeast Region GWh/d
RFCH_SO Residual Fuel Oil Net Generation, Comm. and Ind. Sectors, Southeast Region GWh/d

January 2014
U.S. Energy Information Administration | STEO Model Documentation: Electricity Generation and Fuel Consumption Models 40
RFCH_WE Residual Fuel Oil Net Generation, Comm. and Ind. Sectors, West Region GWh/d
RFCH_US Residual Fuel Oil Net Generation, Comm. and Ind. Sectors, United States GWh/d
RFCHCON_EL_MW Residual Fuel Oil Consumption for Generation, Comm. and Ind. Sectors, Midwest Region Mbbl/d
RFCHCON_EL_NE Residual Fuel Oil Consumption for Generation, Comm. and Ind. Sectors, Northeast Region
Mbbl/d
RFCHCON_EL_SO Residual Fuel Oil Consumption for Generation, Comm. and Ind. Sectors, Southeast Region
Mbbl/d
RFCHCON_EL_WE Residual Fuel Oil Consumption for Generation, Comm. and Ind. Sectors, West Region Mbbl/d
RFCHCON_EL_US Residual Fuel Oil Consumption for Generation, Comm. and Ind. Sectors, United States Mbbl/d
RFCHCON_EL U.S. Residual Fuel Oil Consumption for Generation, Comm. and Ind. Sectors MMbbl/d
RFCHCON_MW Residual Fuel Oil Consumption (Total), Comm. and Ind. Sectors, Midwest Region Mbbl/d
RFCHCON_NE Residual Fuel Oil Consumption (Total), Comm. and Ind. Sectors, Northeast Region Mbbl/d
RFCHCON_SO Residual Fuel Oil Consumption (Total), Comm. and Ind. Sectors, Southeast Region Mbbl/d
RFCHCON_WE Residual Fuel Oil Consumption (Total), Comm. and Ind. Sectors, West Region Mbbl/d
RFCHCON_US Residual Fuel Oil Consumption (Total), Comm. and Ind. Sectors, United States Mbbl/d
RFCHCON U.S. Residual Fuel Oil Consumption (Total), Comm. and Ind. Sectors MMbbl/d
RFEP_MW Residual Fuel Oil Net Generation, Electric Power Sector, Midwest Region GWh/d
RFEP_NE Residual Fuel Oil Net Generation, Electric Power Sector, Northeast Region GWh/d
RFEP_SO Residual Fuel Oil Net Generation, Electric Power Sector, Southeast Region GWh/d
RFEP_WE Residual Fuel Oil Net Generation, Electric Power Sector, West Region GWh/d
RFEP_US Residual Fuel Oil Net Generation, Electric Power Sector, United States GWh/d
RFEPTOT U.S. Residual Fuel Oil Net Generation, Electric Power Sector BkWh/d
RFEPCON_EL_MW Residual Fuel Oil Consumption for Generation, Electric Power Sector, Midwest Region Mbbl/d
RFEPCON_EL_NE Residual Fuel Oil Consumption for Generation, Electric Power Sector, Northeast Region Mbbl/d
RFEPCON_EL_SO Residual Fuel Oil Consumption for Generation, Electric Power Sector, Southeast Region Mbbl/d
RFEPCON_EL_WE Residual Fuel Oil Consumption for Generation, Electric Power Sector, West Region Mbbl/d
RFEPCON_EL_US Residual Fuel Oil Consumption for Generation, Electric Power Sector, United States Mbbl/d
RFEPCON_EL U.S. Residual Fuel Oil Consumption for Generation, Electric Power Sector MMbbl/d
RFEPCON_UTO_MW Residual Fuel Oil Consumption for Useful Thermal Output, Electric Power Sector, Midwest Region
Mbbl/d
RFEPCON_UTO_NE Residual Fuel Oil Consumption for Useful Thermal Output, Electric Power Sector, Northeast Region
Mbbl/d
RFEPCON_UTO_SO Residual Fuel Oil Consumption for Useful Thermal Output, Electric Power Sector, Southeast Region
Mbbl/d
RFEPCON_UTO_WE Residual Fuel Oil Consumption for Useful Thermal Output, Electric Power Sector, West Region
Mbbl/d
RFEPCON_UTO_US Residual Fuel Oil Consumption for Useful Thermal Output, Electric Power Sector, United States
Mbbl/d
RFEPCON_MW Residual Fuel Oil Consumption (Total), Electric Power Sector, Midwest Region Mbbl/d
RFEPCON_NE Residual Fuel Oil Consumption (Total), Electric Power Sector, Northeast Region Mbbl/d
RFEPCON_SO Residual Fuel Oil Consumption (Total), Electric Power Sector, Southeast Region Mbbl/d
RFEPCON_WE Residual Fuel Oil Consumption (Total), Electric Power Sector, West Region Mbbl/d
RFEPCON_US Residual Fuel Oil Consumption (Total), Electric Power Sector, United States Mbbl/d
RFEPCON U.S. Residual Fuel Oil Consumption (Total), Electric Power Sector MMbbl/d
RFTOCON_EL_MW Residual Fuel Oil Consumption for Generation, All Sectors, Midwest Region Mbbl/d

January 2014
U.S. Energy Information Administration | STEO Model Documentation: Electricity Generation and Fuel Consumption Models 41
RFTOCON_EL_NE Residual Fuel Oil Consumption for Generation, All Sectors, Northeast Region Mbbl/d
RFTOCON_EL_SO Residual Fuel Oil Consumption for Generation, All Sectors, Southeast Region Mbbl/d
RFTOCON_EL_WE Residual Fuel Oil Consumption for Generation, All Sectors, West Region Mbbl/d
RFTOCON_EL_US Residual Fuel Oil Consumption for Generation, All Sectors, United States Mbbl/d
RFTOCON_EL U.S. Residual Fuel Oil Consumption for Generation, All Sectors MMbbl/d
RFTOCON_MW Residual Fuel Oil Consumption (Total), All Sectors, Midwest Region Mbbl/d
RFTOCON_NE Residual Fuel Oil Consumption (Total), All Sectors, Northeast Region Mbbl/d
RFTOCON_SO Residual Fuel Oil Consumption (Total), All Sectors, Southeast Region Mbbl/d
RFTOCON_WE Residual Fuel Oil Consumption (Total), All Sectors, West Region Mbbl/d
RFTOCON_US Residual Fuel Oil Consumption (Total), All Sectors, United States Mbbl/d
RFTOCON U.S. Residual Fuel Oil Consumption (Total), All Sectors MMbbl/d
RNEPTOT U.S. Renewable Net Generation (Non-hydro), Electric Power Sector BkWh/d
RNTO_MW Renewable Net Generation (Non-hydro), All Sectors, Midwest Region GWh/d
RNTO_NE Renewable Net Generation (Non-hydro), All Sectors, Northeast Region GWh/d
RNTO_SO Renewable Net Generation (Non-hydro), All Sectors, Southeast Region GWh/d
RNTO_WE Renewable Net Generation (Non-hydro), All Sectors, West Region GWh/d
RNTO_US Renewable Net Generation (Non-hydro), All Sectors, United States GWh/d
RNTOPUS U.S. Renewable Net Generation (Non-hydro), All Sectors BkWh/d
SEP = 1 if September, 0 otherwise --
SOCH_MW Solar Net Generation, Comm. and Ind. Sectors, Midwest Region GWh/d
SOCH_NE Solar Net Generation, Comm. and Ind. Sectors, Northeast Region GWh/d
SOCH_SO Solar Net Generation, Comm. and Ind. Sectors, Southeast Region GWh/d
SOCH_WE Solar Net Generation, Comm. and Ind. Sectors, West Region GWh/d
SOCH_US Solar Net Generation, Comm. and Ind. Sectors, United States GWh/d
SOEP_MW Solar Net Generation, Electric Power Sector, Midwest Region GWh/d
SOEP_NE Solar Net Generation, Electric Power Sector, Northeast Region GWh/d
SOEP_SO Solar Net Generation, Electric Power Sector, Southeast Region GWh/d
SOEP_WE Solar Net Generation, Electric Power Sector, West Region GWh/d
SOEP_US Solar Net Generation, Electric Power Sector, United States GWh/d
SOEPTOT U.S. Solar Net Generation, Electric Power Sector BkWh/d
SOEPCAP_MW Solar Capacity, Electric Power Sector, Midwest Region MW
SOEPCAP_NE Solar Capacity, Electric Power Sector, Northeast Region MW
SOEPCAP_SO Solar Capacity, Electric Power Sector, Southeast Region MW
SOEPCAP_WE Solar Capacity, Electric Power Sector, West Region MW
SOEPCAP_US Solar Capacity, Electric Power Sector, United States MW
SOTO_MW Solar Net Generation, All Sectors, Midwest Region GWh/d
SOTO_NE Solar Net Generation, All Sectors, Northeast Region GWh/d
SOTO_SO Solar Net Generation, All Sectors, Southeast Region GWh/d
SOTO_WE Solar Net Generation, All Sectors, West Region GWh/d
SOTO_US Solar Net Generation, All Sectors, United States GWh/d
SOTOPUS U.S. Solar Net Generation, All Sectors BkWh/d
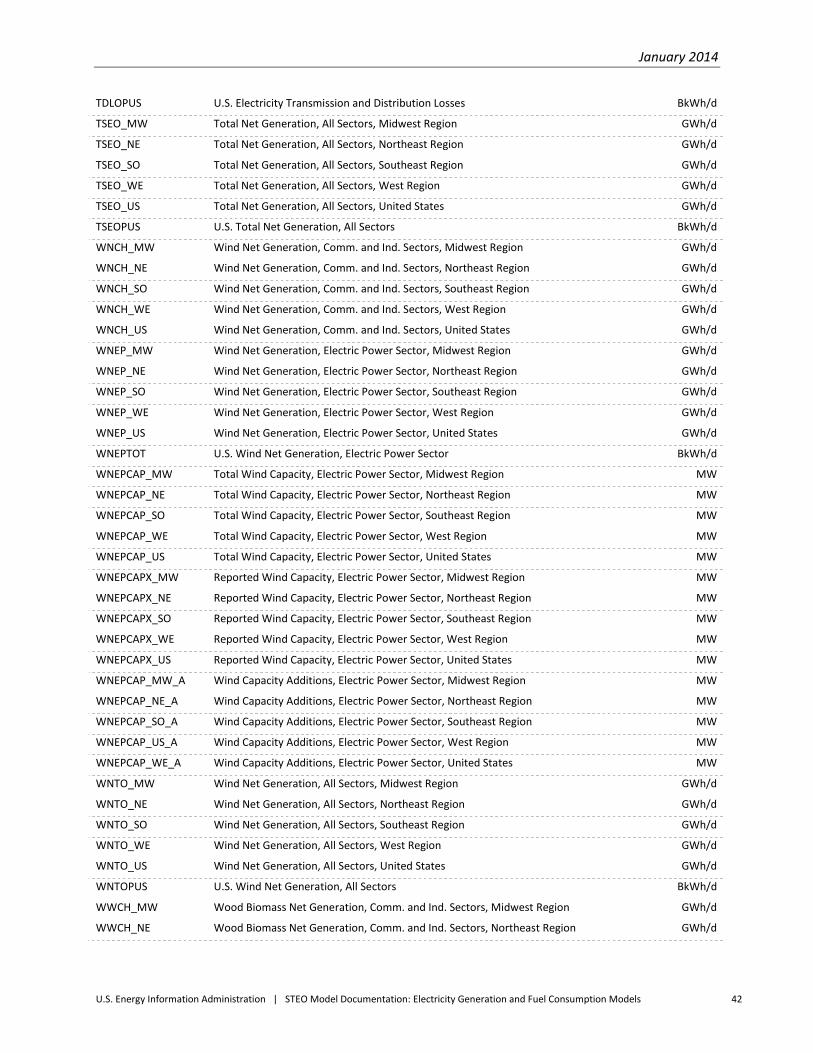
January 2014
U.S. Energy Information Administration | STEO Model Documentation: Electricity Generation and Fuel Consumption Models 42
TDLOPUS U.S. Electricity Transmission and Distribution Losses BkWh/d
TSEO_MW Total Net Generation, All Sectors, Midwest Region GWh/d
TSEO_NE Total Net Generation, All Sectors, Northeast Region GWh/d
TSEO_SO Total Net Generation, All Sectors, Southeast Region GWh/d
TSEO_WE Total Net Generation, All Sectors, West Region GWh/d
TSEO_US Total Net Generation, All Sectors, United States GWh/d
TSEOPUS U.S. Total Net Generation, All Sectors BkWh/d
WNCH_MW Wind Net Generation, Comm. and Ind. Sectors, Midwest Region GWh/d
WNCH_NE Wind Net Generation, Comm. and Ind. Sectors, Northeast Region GWh/d
WNCH_SO Wind Net Generation, Comm. and Ind. Sectors, Southeast Region GWh/d
WNCH_WE Wind Net Generation, Comm. and Ind. Sectors, West Region GWh/d
WNCH_US Wind Net Generation, Comm. and Ind. Sectors, United States GWh/d
WNEP_MW Wind Net Generation, Electric Power Sector, Midwest Region GWh/d
WNEP_NE Wind Net Generation, Electric Power Sector, Northeast Region GWh/d
WNEP_SO Wind Net Generation, Electric Power Sector, Southeast Region GWh/d
WNEP_WE Wind Net Generation, Electric Power Sector, West Region GWh/d
WNEP_US Wind Net Generation, Electric Power Sector, United States GWh/d
WNEPTOT U.S. Wind Net Generation, Electric Power Sector BkWh/d
WNEPCAP_MW Total Wind Capacity, Electric Power Sector, Midwest Region MW
WNEPCAP_NE Total Wind Capacity, Electric Power Sector, Northeast Region MW
WNEPCAP_SO Total Wind Capacity, Electric Power Sector, Southeast Region MW
WNEPCAP_WE Total Wind Capacity, Electric Power Sector, West Region MW
WNEPCAP_US Total Wind Capacity, Electric Power Sector, United States MW
WNEPCAPX_MW Reported Wind Capacity, Electric Power Sector, Midwest Region MW
WNEPCAPX_NE Reported Wind Capacity, Electric Power Sector, Northeast Region MW
WNEPCAPX_SO Reported Wind Capacity, Electric Power Sector, Southeast Region MW
WNEPCAPX_WE Reported Wind Capacity, Electric Power Sector, West Region MW
WNEPCAPX_US Reported Wind Capacity, Electric Power Sector, United States MW
WNEPCAP_MW_A Wind Capacity Additions, Electric Power Sector, Midwest Region MW
WNEPCAP_NE_A Wind Capacity Additions, Electric Power Sector, Northeast Region MW
WNEPCAP_SO_A Wind Capacity Additions, Electric Power Sector, Southeast Region MW
WNEPCAP_US_A Wind Capacity Additions, Electric Power Sector, West Region MW
WNEPCAP_WE_A Wind Capacity Additions, Electric Power Sector, United States MW
WNTO_MW Wind Net Generation, All Sectors, Midwest Region GWh/d
WNTO_NE Wind Net Generation, All Sectors, Northeast Region GWh/d
WNTO_SO Wind Net Generation, All Sectors, Southeast Region GWh/d
WNTO_WE Wind Net Generation, All Sectors, West Region GWh/d
WNTO_US Wind Net Generation, All Sectors, United States GWh/d
WNTOPUS U.S. Wind Net Generation, All Sectors BkWh/d
WWCH_MW Wood Biomass Net Generation, Comm. and Ind. Sectors, Midwest Region GWh/d
WWCH_NE Wood Biomass Net Generation, Comm. and Ind. Sectors, Northeast Region GWh/d

January 2014
U.S. Energy Information Administration | STEO Model Documentation: Electricity Generation and Fuel Consumption Models 43
WWCH_SO Wood Biomass Net Generation, Comm. and Ind. Sectors, Southeast Region GWh/d
WWCH_WE Wood Biomass Net Generation, Comm. and Ind. Sectors, West Region GWh/d
WWCH_US Wood Biomass Net Generation, Comm. and Ind. Sectors, United States GWh/d
WWEP_MW Wood Biomass Net Generation, Electric Power Sector, Midwest Region GWh/d
WWEP_NE Wood Biomass Net Generation, Electric Power Sector, Northeast Region GWh/d
WWEP_SO Wood Biomass Net Generation, Electric Power Sector, Southeast Region GWh/d
WWEP_WE Wood Biomass Net Generation, Electric Power Sector, West Region GWh/d
WWEP_US Wood Biomass Net Generation, Electric Power Sector, United States GWh/d
WWEPTOT U.S. Wood Biomass Net Generation, Electric Power Sector BkWh/d
WWEPCAP_MW Wood Biomass Capacity, Electric Power Sector, Midwest Region MW
WWEPCAP_NE Wood Biomass Capacity, Electric Power Sector, Northeast Region MW
WWEPCAP_SO Wood Biomass Capacity, Electric Power Sector, Southeast Region MW
WWEPCAP_WE Wood Biomass Capacity, Electric Power Sector, West Region MW
WWEPCAP_US Wood Biomass Capacity, Electric Power Sector, United States MW
WWTO_MW Wood Biomass Net Generation, All Sectors, Midwest Region GWh/d
WWTO_NE Wood Biomass Net Generation, All Sectors, Northeast Region GWh/d
WWTO_SO Wood Biomass Net Generation, All Sectors, Southeast Region GWh/d
WWTO_WE Wood Biomass Net Generation, All Sectors, West Region GWh/d
WWTO_US Wood Biomass Net Generation, All Sectors, United States GWh/d
WWTOPUS U.S. Wood Biomass Net Generation, All Sectors BkWh/d
ZWCD_MW Cooling Degree Days, Midwest Region DD
ZWCD_NE Cooling Degree Days, Northeast Region DD
ZWCD_SO Cooling Degree Days, South Region DD
ZWCD_WE Cooling Degree Days, West Region DD
ZWCDPUS U.S. Cooling Degree Days DD
ZWCN_MW Cooling Degree Days (10-Year Average), Midwest Region DD
ZWCN_NE Cooling Degree Days (10-Year Average), Northeast Region DD
ZWCN_SO Cooling Degree Days (10-Year Average), South Region DD
ZWCN_WE Cooling Degree Days (10-Year Average), West Region DD
ZWHD_MW Heating Degree Days, Midwest Region DD
ZWHD_NE Heating Degree Days, Northeast Region DD
ZWHD_SO Heating Degree Days, South Region DD
ZWHD_WE Heating Degree Days, West Region DD
ZWHDPUS U.S. Heating Degree Days DD
ZWHN_MW Heating Degree Days (10-Year Average), Midwest Region DD
ZWHN_NE Heating Degree Days (10-Year Average), Northeast Region DD
ZWHN_SO Heating Degree Days (10-Year Average), South Region DD
ZWHN_WE Heating Degree Days (10-Year Average), West Region DD
January 2014
U.S. Energy Information Administration | STEO Model Documentation: Electricity Generation and Fuel Consumption Models 44
Appendix B. Eviews Model Object File (electricity generation)
'*************************************************************************** ' ------------------- ELECTRICITY BALANCE IDENTITIES --------------------- '*************************************************************************** ' ------------------------------------------------------------------------------------------ ' DIRECT USE OF ELECTRICITY ' ------------------------------------------------------------------------------------------ eldupus = (cheo_us) * (eldupus(-12) / cheo_us(-12)) ' ------------------------------------------------------------------------------------------ ' TRANSMISSION & DISTRIBUTION (T&D) LOSSES ' ------------------------------------------------------------------------------------------ :eq_tdlopus @ADD TDLOPUS TDLOPUS_A ' ------------------------------------------------------------------------------------------ ' ELECTRICITY TRADE WITH CANADA AND MEXICO ' ------------------------------------------------------------------------------------------ :eq_elimpus @ADD ELIMPUS ELIMPUS_A :eq_elexpus @ADD ELEXPUS ELEXPUS_A elnipus = elimpus - elexpus ' ------------------------------------------------------------------------------------------ ' TOTAL CONSUMPTION, OF ELECTRICITY ' ------------------------------------------------------------------------------------------ estxpus = extcpus + eldupus ' ------------------------------------------------------------------------------------------ ' TOTAL U.S. ELECTRICITY OUTPUT IDENTITY ' ------------------------------------------------------------------------------------------ tseopus = estxpus + tdlopus - elnipus '------------------------------------------------------------------------------------------- ' TOTAL ELECTRICITY SUPPLY '------------------------------------------------------------------------------------------- etxxsup = tseopus + elnipus ' ************************************************************************** ' -------------- ELECTRIC POWER SECTOR GENERATION ----------------- ' ************************************************************************** ' ----- TOTAL EP GENERATION ---------------------------------------------------- epeopus = tseopus - (cheo_us / 1000) :eq_epeo_mw :eq_epeo_ne

January 2014
U.S. Energy Information Administration | STEO Model Documentation: Electricity Generation and Fuel Consumption Models 45
:eq_epeo_so :eq_epeo_we epeo_ne = 1000 * epeox_ne * (epeopus / (epeox_ne + epeox_mw + epeox_so + epeox_we)) epeo_mw = 1000 * epeox_mw * (epeopus / (epeox_ne + epeox_mw + epeox_so + epeox_we)) epeo_so = 1000 * epeox_so * (epeopus / (epeox_ne + epeox_mw + epeox_so + epeox_we)) epeo_we = 1000 * epeox_we * (epeopus / (epeox_ne + epeox_mw + epeox_so + epeox_we)) epeo_us = epeo_ne + epeo_mw + epeo_so + epeo_we ' -------------------------------------------------------------------------- ' ----- WIND GENERATION ---------------------------------------------------- :eq_wnep_mw :eq_wnep_ne :eq_wnep_so :eq_wnep_we ' -------------------------------------------------------------------------- ' ----- WOOD & WOOD WASTE GENERATION --------------------------------- :eq_wwep_mw :eq_wwep_ne :eq_wwep_so :eq_wwep_we ' -------------------------------------------------------------------------- ' ----- MUNICIPAL BIOMASS GENERATION ------------------------------------ :eq_mlep_mw :eq_mlep_ne :eq_mlep_so :eq_mlep_we ' -------------------------------------------------------------------------- ' ----- OTHER BIOMASS GENERATION ------------------------------------------ :eq_orep_mw :eq_orep_ne :eq_orep_so :eq_orep_we ' -------------------------------------------------------------------------- ' ----- TOTAL BIOMASS GENERATION ------------------------------------------- owep_mw = mlep_mw + orep_mw

January 2014
U.S. Energy Information Administration | STEO Model Documentation: Electricity Generation and Fuel Consumption Models 46
owep_ne = mlep_ne + orep_ne owep_so = mlep_so + orep_so owep_we = mlep_we + orep_we ' -------------------------------------------------------------------------- ' ----- SOLAR GENERATION -------------------------------------------------------- :eq_soep_we soep_mw = (soepcap_mw + soepcap_mw_a) * (soep_we / (soepcap_we + soepcap_we_a)) soep_ne = (soepcap_ne + soepcap_ne_a) * (soep_we / (soepcap_we + soepcap_we_a)) soep_so = (soepcap_so + soepcap_so_a) * (soep_we / (soepcap_we + soepcap_we_a)) ' -------------------------------------------------------------------------- ' ----- GEOTHERMAL GENERATION --------------------------------------------- :eq_geep_we geep_mw = geepcap_mw * (geep_we / geepcap_we) geep_ne = geepcap_ne * (geep_we / geepcap_we) geep_so = geepcap_so * (geep_we / geepcap_we) ' -------------------------------------------------------------------------- ' ----- PUMPED STORAGE GENERATION -------------------------------------- :eq_hpep_ne :eq_hpep_mw :eq_hpep_so :eq_hpep_we ' -------------------------------------------------------------------------- ' ----- CONVENTIONAL HYDROELECTRIC GENERATION --------------- ' ----- (Regional Forecasts Exogenous) --------------- hvep_ne = hvep_01 + hvep_02 + hvep_12 hvep_mw = hvep_03 + hvep_04 hvep_so = hvep_05 + hvep_06 + hvep_07 + hvep_11 + hvep_13 hvep_we = hvep_08 + hvep_09 + hvep_10 + hvep_14 ' -------------------------------------------------------------------------- ' ----- NET HYDROELECTRIC GENERATION --------------------------------- hyep_mw = hvep_mw + hpep_mw hyep_ne = hvep_ne + hpep_ne hyep_so = hvep_so + hpep_so hyep_we = hvep_we + hpep_we

January 2014
U.S. Energy Information Administration | STEO Model Documentation: Electricity Generation and Fuel Consumption Models 47
' -------------------------------------------------------------------------- ' ----- NUCLEAR GENERATION (Exogenous) --------------------------------- nuep_mw = nuep_03 + nuep_04 nuep_ne = nuep_01 + nuep_02 + nuep_12 nuep_so = nuep_05 + nuep_06 + nuep_07 + nuep_11 + nuep_13 nuep_we = nuep_08 + nuep_09 + nuep_10 + nuep_14 ' -------------------------------------------------------------------------- ' ----- NATURAL GAS GENERATION --------------------------------------------- :eq_ngep_mw @ADD NGEP_MW NGEP_MW_A :eq_ngep_ne @ADD NGEP_NE NGEP_NE_A :eq_ngep_so @ADD NGEP_SO NGEP_SO_A :eq_ngep_we @ADD NGEP_WE NGEP_WE_A ' -------------------------------------------------------------------------- ' ----- RESIDUAL FUEL OIL GENERATION ------------------------------------- :eq_rfep_mw @ADD RFEP_MW RFEP_MW_A :eq_rfep_ne @ADD RFEP_NE RFEP_NE_A :eq_rfep_so @ADD RFEP_SO RFEP_SO_A :eq_rfep_we @ADD RFEP_WE RFEP_WE_A ' -------------------------------------------------------------------------- ' ----- DISTILLATE FUEL OIL GENERATION ----------------------------------- :eq_dkep_mw :eq_dkep_ne :eq_dkep_so :eq_dkep_we ' -------------------------------------------------------------------------- ' ----- PETROLEUM COKE GENERATION -------------------------------------- :eq_pcep_we :eq_pcep_so :eq_pcep_mw
January 2014
U.S. Energy Information Administration | STEO Model Documentation: Electricity Generation and Fuel Consumption Models 48
':eq_pcep_ne pcep_ne = pcep_ne(-12) ' -------------------------------------------------------------------------- ' ----- OTHER PETROLEUM GENERATION ------------------------------------ :eq_opep_mw :eq_opep_ne :eq_opep_so :eq_opep_we ' -------------------------------------------------------------------------- ' ----- TOTAL PETROLEUM GENERATION ------------------------------------ paep_mw = rfep_mw + dkep_mw + pcep_mw + opep_mw paep_ne = rfep_ne + dkep_ne + pcep_ne + opep_ne paep_so = rfep_so + dkep_so + pcep_so + opep_so paep_we = rfep_we + dkep_we + pcep_we + opep_we ' -------------------------------------------------------------------------- ' ----- OTHER GASES GENERATION --------------------------------------------- :eq_ogep_mw :eq_ogep_ne :eq_ogep_so :eq_ogep_we ' -------------------------------------------------------------------------- ' ----- COAL GENERATION IDENTITIES --------------------------------------- clep_mw = epeo_mw - (ngep_mw + rfep_mw + dkep_mw + pcep_mw + opep_mw + ogep_mw + hyep_mw + nuep_mw + wwep_mw + owep_mw + wnep_mw + soep_mw + geep_mw + otep_mw) clep_ne = epeo_ne - (ngep_ne + rfep_ne + dkep_ne + pcep_ne + opep_ne + ogep_ne + hyep_ne + nuep_ne + wwep_ne + owep_ne + wnep_ne + soep_ne + geep_ne + otep_ne) clep_so = epeo_so - (ngep_so + rfep_so + dkep_so + pcep_so + opep_so + ogep_so + hyep_so + nuep_so + wwep_so + owep_so + wnep_so + soep_so + geep_so + otep_so) clep_we = epeo_we - (ngep_we + rfep_we + dkep_we + pcep_we + opep_we + ogep_we + hyep_we + nuep_we + wwep_we + owep_we + wnep_we + soep_we + geep_we + otep_we) ' -------------------------------------------------------------------------- ' ----- GENERATION FROM OTHER SOURCES ------------------------ :eq_otep_mw :eq_otep_ne :eq_otep_so :eq_otep_we

January 2014
U.S. Energy Information Administration | STEO Model Documentation: Electricity Generation and Fuel Consumption Models 49
' -------------------------------------------------------------------------- ' ----- FOSSIL FUEL GENERATION ----------------------------------------------- ffep_ne = clep_ne + ngep_ne + paep_ne + ogep_ne ffep_mw = clep_mw + ngep_mw + paep_mw + ogep_mw ffep_so = clep_so + ngep_so + paep_so + ogep_so ffep_we = clep_we + ngep_we + paep_we + ogep_we ' -------------------------------------------------------------------------- ' ----- NON-HYDRO RENEWABLE GENERATION ---------------------------- rnep_ne = wnep_ne + soep_ne + wwep_ne + mlep_ne + geep_ne + orep_ne rnep_mw = wnep_mw + soep_mw + wwep_mw + mlep_mw + geep_mw + orep_mw rnep_so = wnep_so + soep_so + wwep_so + mlep_so + geep_so + orep_so rnep_we = wnep_we + soep_we + wwep_we + mlep_we + geep_we + orep_we ' -------------------------------------------------------------------------- ' ----- U.S. GENERATION AGGREGATION ---------------------------- ' -------------------------------------------------------------------------- clep_us = clep_ne + clep_mw + clep_so + clep_we cleptot = clep_us / 1000 ngep_us = ngep_ne + ngep_mw + ngep_so + ngep_we ngeptot = ngep_us / 1000 rfep_us = rfep_ne + rfep_mw + rfep_so + rfep_we rfeptot = rfep_us / 1000 dkep_us = dkep_ne + dkep_mw + dkep_so + dkep_we dkeptot = dkep_us / 1000 pcep_us = pcep_ne + pcep_mw + pcep_so + pcep_we pceptot = pcep_us / 1000 opep_us = opep_ne + opep_mw + opep_so + opep_we opeptot = opep_us / 1000 ogep_us = ogep_ne + ogep_mw + ogep_so + ogep_we ogeptot = ogep_us / 1000 wwep_us = wwep_ne + wwep_mw + wwep_so + wwep_we wweptot = wwep_us / 1000 mlep_us = mlep_ne + mlep_mw + mlep_so + mlep_we mleptot = mlep_us / 1000

January 2014
U.S. Energy Information Administration | STEO Model Documentation: Electricity Generation and Fuel Consumption Models 50
orep_us = orep_ne + orep_mw + orep_so + orep_we oreptot = orep_us / 1000 owep_us = owep_ne + owep_mw + owep_so + owep_we oweptot = owep_us / 1000 wnep_us = wnep_ne + wnep_mw + wnep_so + wnep_we wneptot = wnep_us / 1000 soep_us = soep_ne + soep_mw + soep_so + soep_we soeptot = soep_us / 1000 geep_us = geep_ne + geep_mw + geep_so + geep_we geeptot = geep_us / 1000 otep_us = otep_ne + otep_mw + otep_so + otep_we oteptot = otep_us / 1000 paep_us = paep_ne + paep_mw + paep_so + paep_we paeptot = paep_us / 1000 nuep_us = nuep_ne + nuep_mw + nuep_so + nuep_we nueptot = nueptot hvep_us = hvep_ne + hvep_mw + hvep_so + hvep_we hveptot = hveptot hpep_us = hpep_ne + hpep_mw + hpep_so + hpep_we hpeptot = hpep_us / 1000 hyep_us = hvep_us + hpep_us hyeptot = hyep_us / 1000 ffep_us = ffep_ne + ffep_mw + ffep_so + ffep_we ffeptot = ffep_us / 1000 rnep_us = rnep_ne + rnep_mw + rnep_so + rnep_we rneptot = rnep_us / 1000 ' ---------------------------------------------------------------------------------- ' ----- U.S. RENEWABLE CAPACITY AGGREGATION ------------ ' ---------------------------------------------------------------------------------- geepcap_us = geepcap_ne + geepcap_mw + geepcap_so + geepcap_we hvepcap_us = hvepcap_ne + hvepcap_mw + hvepcap_so + hvepcap_we mlepcap_us = mlepcap_ne + mlepcap_mw + mlepcap_so + mlepcap_we

January 2014
U.S. Energy Information Administration | STEO Model Documentation: Electricity Generation and Fuel Consumption Models 51
orepcap_us = orepcap_ne + orepcap_mw + orepcap_so + orepcap_we owepcap_us = owepcap_ne + owepcap_mw + owepcap_so + owepcap_we wwepcap_us = wwepcap_ne + wwepcap_mw + wwepcap_so + wwepcap_we wnepcap_us = wnepcap_mw + wnepcap_ne + wnepcap_so + wnepcap_we wnepcap_us_a = wnepcap_mw_a + wnepcap_ne_a + wnepcap_so_a + wnepcap_we_a soepcap_us = soepcap_mw + soepcap_ne + soepcap_so + soepcap_we soepcap_us_a = soepcap_mw_a + soepcap_ne_a + soepcap_so_a + soepcap_we_a ' ****************************************************************************** ' --------------------- END-USE CHP SECTOR GENERATION -------------------- ' ****************************************************************************** ' ----- TOTAL CHP GENERATION ---------------------------------------------------- :eq_cheo_ne @ADD CHEO_NE CHEO_NE_A @INNOV CHEO_NE 1.6285731 :eq_cheo_so @ADD CHEO_SO CHEO_SO_A :eq_cheo_mw @ADD CHEO_MW CHEO_MW_A :eq_cheo_we @ADD CHEO_WE CHEO_WE_A cheo_us = cheo_ne + cheo_so + cheo_mw + cheo_we cheopus = cheo_us / 1000 ' -------------------------------------------------------------------------- ' ----- NATURAL GAS GENERATION IDENTITIES ------------------------ ngch_ne = cheo_ne - (clch_ne + pach_ne + ogch_ne + hvch_ne + wwch_ne + owch_ne + soch_ne + wnch_ne + otch_ne) ngch_so = cheo_so - (clch_so + pach_so + ogch_so + hvch_so + wwch_so + owch_so + soch_so + wnch_so + otch_so) ngch_mw = cheo_mw - (clch_mw + pach_mw + ogch_mw + hvch_mw + wwch_mw + owch_mw + soch_mw + wnch_mw + otch_mw) ngch_we = cheo_we - (clch_we + pach_we + ogch_we + hvch_we + wwch_we + owch_we + soch_we + wnch_we + otch_we) ' -------------------------------------------------------------------------- ' ----- COAL GENERATION -------------------------------------------------------- :eq_clch_ne :eq_clch_so :eq_clch_mw

January 2014
U.S. Energy Information Administration | STEO Model Documentation: Electricity Generation and Fuel Consumption Models 52
:eq_clch_we ' -------------------------------------------------------------------------- ' ----- RESIDUAL FUEL OIL GENERATION ------------------------------------- :eq_rfch_ne :eq_rfch_so :eq_rfch_mw :eq_rfch_we ' -------------------------------------------------------------------------- ' ----- DISTILLATE FUEL OIL GENERATION ----------------------------------- :eq_dkch_ne :eq_dkch_so :eq_dkch_mw :eq_dkch_we ' -------------------------------------------------------------------------- ' ----- PETROLEUM COKE GENERATION -------------------------------------- pcch_ne = cheo_ne * (pcch_ne(-12) / cheo_ne(-12)) pcch_so = cheo_so * (pcch_so(-12) / cheo_so(-12)) pcch_mw = cheo_mw * (pcch_mw(-12) / cheo_mw(-12)) pcch_we = cheo_we * (pcch_we(-12) / cheo_we(-12)) ' -------------------------------------------------------------------------- ' ----- OTHER PETROLEUM GENERATION ------------------------------------ opch_ne = cheo_ne * (opch_ne(-12) / cheo_ne(-12)) opch_so = cheo_so * (opch_so(-12) / cheo_so(-12)) opch_mw = cheo_mw * (opch_mw(-12) / cheo_mw(-12)) opch_we = cheo_we * (opch_we(-12) / cheo_we(-12)) ' -------------------------------------------------------------------------- ' ----- TOTAL PETROLEUM IDENTITIES ------------------------------------ pach_ne = rfch_ne + dkch_ne + pcch_ne + opch_ne pach_so = rfch_so + dkch_so + pcch_so + opch_so pach_mw = rfch_mw + dkch_mw + pcch_mw + opch_mw pach_we = rfch_we + dkch_we + pcch_we + opch_we ' -------------------------------------------------------------------------- ' ----- OTHER GASES GENERATION --------------------------------------------- ogch_ne = cheo_ne * (ogch_ne(-12) / cheo_ne(-12))

January 2014
U.S. Energy Information Administration | STEO Model Documentation: Electricity Generation and Fuel Consumption Models 53
ogch_so = cheo_so * (ogch_so(-12) / cheo_so(-12)) ogch_mw = cheo_mw * (ogch_mw(-12) / cheo_mw(-12)) ogch_we = cheo_we * (ogch_we(-12) / cheo_we(-12)) ' -------------------------------------------------------------------------- ' ----- CONVENTIONAL HYDROELECTRIC GENERATION --------------- hvch_ne = cheo_ne * (hvch_ne(-12) / cheo_ne(-12)) hvch_so = cheo_so * (hvch_so(-12) / cheo_so(-12)) hvch_mw = cheo_mw * (hvch_mw(-12) / cheo_mw(-12)) hvch_we = cheo_we * (hvch_we(-12) / cheo_we(-12)) ' -------------------------------------------------------------------------- ' ----- WOOD & WOOD WASTE GENERATION --------------------------------- wwch_ne = cheo_ne * (wwch_ne(-12) / cheo_ne(-12)) wwch_so = cheo_so * (wwch_so(-12) / cheo_so(-12)) wwch_mw = cheo_mw * (wwch_mw(-12) / cheo_mw(-12)) wwch_we = cheo_we * (wwch_we(-12) / cheo_we(-12)) ' -------------------------------------------------------------------------- ' ----- MUNICIPAL BIOMASS GENERATION ------------------------------------ mlch_ne = cheo_ne * (mlch_ne(-12) / cheo_ne(-12)) mlch_so = cheo_so * (mlch_so(-12) / cheo_so(-12)) mlch_mw = cheo_mw * (mlch_mw(-12) / cheo_mw(-12)) mlch_we = cheo_we * (mlch_we(-12) / cheo_we(-12)) ' -------------------------------------------------------------------------- ' ----- OTHER BIOMASS GENERATION ------------------------------------ orch_ne = cheo_ne * (orch_ne(-12) / cheo_ne(-12)) orch_so = cheo_so * (orch_so(-12) / cheo_so(-12)) orch_mw = cheo_mw * (orch_mw(-12) / cheo_mw(-12)) orch_we = cheo_we * (orch_we(-12) / cheo_we(-12)) ' -------------------------------------------------------------------------- ' ----- TOTAL BIOMASS GENERATION ------------------------------------ owch_ne = mlch_ne + orch_ne owch_so = mlch_so + orch_so owch_mw = mlch_mw + orch_mw owch_we = mlch_we + orch_we ' --------------------------------------------------------------------------

January 2014
U.S. Energy Information Administration | STEO Model Documentation: Electricity Generation and Fuel Consumption Models 54
' ----- SOLAR GENERATION ------------------------------------ soch_ne = cheo_ne * (soch_ne(-12) / cheo_ne(-12)) soch_so = cheo_so * (soch_so(-12) / cheo_so(-12)) soch_mw = cheo_mw * (soch_mw(-12) / cheo_mw(-12)) soch_we = cheo_we * (soch_we(-12) / cheo_we(-12)) ' -------------------------------------------------------------------------- ' ----- WIND GENERATION ------------------------------------ wnch_ne = cheo_ne * (wnch_ne(-12) / cheo_ne(-12)) wnch_so = cheo_so * (wnch_so(-12) / cheo_so(-12)) wnch_mw = cheo_mw * (wnch_mw(-12) / cheo_mw(-12)) wnch_we = cheo_we * (wnch_we(-12) / cheo_we(-12)) ' -------------------------------------------------------------------------- ' ----- OTHER GENERATION ------------------------------------ otch_ne = cheo_ne * (otch_ne(-12) / cheo_ne(-12)) otch_so = cheo_so * (otch_so(-12) / cheo_so(-12)) otch_mw = cheo_mw * (otch_mw(-12) / cheo_mw(-12)) otch_we = cheo_we * (otch_we(-12) / cheo_we(-12)) ' -------------------------------------------------------------------------- ' ----- FOSSIL FUEL GENERATION ----------------------------------------------- ffch_ne = clch_ne + ngch_ne + pach_ne + ogch_ne ffch_mw = clch_mw + ngch_mw + pach_mw + ogch_mw ffch_so = clch_so + ngch_so + pach_so + ogch_so ffch_we = clch_we + ngch_we + pach_we + ogch_we ' -------------------------------------------------------------------------- ' ----- NON-HYDRO RENEWABLE GENERATION ---------------------------- rnch_ne = wnch_ne + soch_ne + wwch_ne + mlch_ne + orch_ne rnch_mw = wnch_mw + soch_mw + wwch_mw + mlch_mw + orch_mw rnch_so = wnch_so + soch_so + wwch_so + mlch_so + orch_so rnch_we = wnch_we + soch_we + wwch_we + mlch_we + orch_we ' -------------------------------------------------------------------------- ' ----- U.S. GENERATION AGGREGATION ---------------------------- ' -------------------------------------------------------------------------- ngch_us = ngch_ne + ngch_so + ngch_mw + ngch_we clch_us = clch_ne + clch_so + clch_mw + clch_we

January 2014
U.S. Energy Information Administration | STEO Model Documentation: Electricity Generation and Fuel Consumption Models 55
rfch_us = rfch_ne + rfch_so + rfch_mw + rfch_we dkch_us = dkch_ne + dkch_so + dkch_mw + dkch_we pcch_us = pcch_ne + pcch_so + pcch_mw + pcch_we opch_us = opch_ne + opch_so + opch_mw + opch_we pach_us = pach_ne + pach_so + pach_mw + pach_we ogch_us = ogch_ne + ogch_so + ogch_mw + ogch_we hvch_us = hvch_ne + hvch_so + hvch_mw + hvch_we wwch_us = wwch_ne + wwch_so + wwch_mw + wwch_we mlch_us = mlch_ne + mlch_so + mlch_mw + mlch_we orch_us = orch_ne + orch_so + orch_mw + orch_we owch_us = owch_ne + owch_so + owch_mw + owch_we otch_us = otch_ne + otch_so + otch_mw + otch_we soch_us = soch_ne + soch_so + soch_mw + soch_we wnch_us = wnch_ne + wnch_so + wnch_mw + wnch_we ffch_us = ffch_ne + ffch_so + ffch_mw + ffch_we rnch_us = rnch_ne + rnch_so + rnch_mw + rnch_we ' ****************************************************************************** ' ------------- GENERATION BY FUEL FOR ALL SECTORS -------------------- ' ****************************************************************************** clto_ne = clep_ne + clch_ne clto_so = clep_so + clch_so clto_mw = clep_mw + clch_mw clto_we = clep_we + clch_we clto_us = clep_us + clch_us ngto_ne = ngep_ne + ngch_ne ngto_so = ngep_so + ngch_so ngto_mw = ngep_mw + ngch_mw ngto_we = ngep_we + ngch_we ngto_us = ngep_us + ngch_us rfto_ne = rfep_ne + rfch_ne rfto_so = rfep_so + rfch_so rfto_mw = rfep_mw + rfch_mw
January 2014
U.S. Energy Information Administration | STEO Model Documentation: Electricity Generation and Fuel Consumption Models 56
rfto_we = rfep_we + rfch_we rfto_us = rfep_us + rfch_us dkto_ne = dkep_ne + dkch_ne dkto_so = dkep_so + dkch_so dkto_mw = dkep_mw + dkch_mw dkto_we = dkep_we + dkch_we dkto_us = dkep_us + dkch_us pcto_ne = pcep_ne + pcch_ne pcto_so = pcep_so + pcch_so pcto_mw = pcep_mw + pcch_mw pcto_we = pcep_we + pcch_we pcto_us = pcep_us + pcch_us opto_ne = opep_ne + opch_ne opto_so = opep_so + opch_so opto_mw = opep_mw + opch_mw opto_we = opep_we + opch_we opto_us = opep_us + opch_us pato_ne = paep_ne + pach_ne pato_so = paep_so + pach_so pato_mw = paep_mw + pach_mw pato_we = paep_we + pach_we pato_us = paep_us + pach_us ogto_ne = ogep_ne + ogch_ne ogto_so = ogep_so + ogch_so ogto_mw = ogep_mw + ogch_mw ogto_we = ogep_we + ogch_we ogto_us = ogep_us + ogch_us nuto_ne = nuep_ne nuto_so = nuep_so nuto_mw = nuep_mw nuto_we = nuep_we

January 2014
U.S. Energy Information Administration | STEO Model Documentation: Electricity Generation and Fuel Consumption Models 57
nuto_us = nuep_us hvto_ne = hvep_ne + hvch_ne hvto_so = hvep_so + hvch_so hvto_mw = hvep_mw + hvch_mw hvto_we = hvep_we + hvch_we hvto_us = hvep_us + hvch_us hpto_ne = hpep_ne hpto_so = hpep_so hpto_mw = hpep_mw hpto_we = hpep_we hpto_us = hpep_us hyto_ne = hvto_ne + hpto_ne hyto_so = hvto_so + hpto_so hyto_mw = hvto_mw + hpto_mw hyto_we = hvto_we + hpto_we hyto_us = hvto_us + hpto_us geto_ne = geep_ne geto_so = geep_so geto_mw = geep_mw geto_we = geep_we geto_us = geep_us soto_ne = soep_ne + soch_ne soto_so = soep_so + soch_so soto_mw = soep_mw + soch_mw soto_we = soep_we + soch_we soto_us = soep_us + soch_us wnto_ne = wnep_ne + wnch_ne wnto_so = wnep_so + wnch_so wnto_mw = wnep_mw + wnch_mw wnto_we = wnep_we + wnch_we wnto_us = wnep_us + wnch_us

January 2014
U.S. Energy Information Administration | STEO Model Documentation: Electricity Generation and Fuel Consumption Models 58
wwto_ne = wwep_ne + wwch_ne wwto_so = wwep_so + wwch_so wwto_mw = wwep_mw + wwch_mw wwto_we = wwep_we + wwch_we wwto_us = wwep_us + wwch_us mlto_ne = mlep_ne + mlch_ne mlto_so = mlep_so + mlch_so mlto_mw = mlep_mw + mlch_mw mlto_we = mlep_we + mlch_we mlto_us = mlep_us + mlch_us orto_ne = orep_ne + orch_ne orto_so = orep_so + orch_so orto_mw = orep_mw + orch_mw orto_we = orep_we + orch_we orto_us = orep_us + orch_us owto_ne = owep_ne + owch_ne owto_so = owep_so + owch_so owto_mw = owep_mw + owch_mw owto_we = owep_we + owch_we owto_us = owep_us + owch_us otto_ne = otep_ne + otch_ne otto_so = otep_so + otch_so otto_mw = otep_mw + otch_mw otto_we = otep_we + otch_we otto_us = otep_us + otch_us ffto_ne = ffep_ne + ffch_ne ffto_so = ffep_so + ffch_so ffto_mw = ffep_mw + ffch_mw ffto_we = ffep_we + ffch_we ffto_us = ffep_us + ffch_us rnto_ne = rnep_ne + rnch_ne
January 2014
U.S. Energy Information Administration | STEO Model Documentation: Electricity Generation and Fuel Consumption Models 59
rnto_so = rnep_so + rnch_so rnto_mw = rnep_mw + rnch_mw rnto_we = rnep_we + rnch_we rnto_us = rnep_us + rnch_us cltopus = clto_us / 1000 ngtopus = ngto_us / 1000 rftopus = rfto_us / 1000 dktopus = dkto_us / 1000 pctopus = pcto_us / 1000 optopus = opto_us / 1000 patopus = pato_us / 1000 ogtopus = ogto_us / 1000 hvtopus = hvto_us / 1000 hptopus = hpto_us / 1000 hytopus = hyto_us / 1000 getopus = geto_us / 1000 sotopus = soto_us / 1000 wntopus = wnto_us / 1000 nutopus = nuto_us / 1000 wwtopus = wwto_us / 1000 owtopus = owto_us / 1000 ottopus = otto_us / 1000 rntopus = rnto_us / 1000 ' ****************************************************************************** ' --------------- TOTAL GENERATION FOR ALL SECTORS --------------------- ' ****************************************************************************** tseo_ne = epeo_ne + cheo_ne tseo_so = epeo_so + cheo_so tseo_mw = epeo_mw + cheo_mw tseo_we = epeo_we + cheo_we tseo_us = epeo_us + cheo_us

January 2014
U.S. Energy Information Administration | STEO Model Documentation: Electricity Generation and Fuel Consumption Models 60
' ------------------------------------------------------------------------------------------ ' STORE 14-REGION HYDRO & NUCLEAR FORECASTS ' ------------------------------------------------------------------------------------------ hvep_01 = hvep_01 hvep_02 = hvep_02 hvep_03 = hvep_03 hvep_04 = hvep_04 hvep_05 = hvep_05 hvep_06 = hvep_06 hvep_07 = hvep_07 hvep_08 = hvep_08 hvep_09 = hvep_09 hvep_10 = hvep_10 hvep_11 = hvep_11 hvep_12 = hvep_12 hvep_13 = hvep_13 hvep_14 = hvep_14 nuep_01 = nuep_01 nuep_02 = nuep_02 nuep_03 = nuep_03 nuep_04 = nuep_04 nuep_05 = nuep_05 nuep_06 = nuep_06 nuep_07 = nuep_07 nuep_08 = nuep_08 nuep_09 = nuep_09 nuep_10 = nuep_10 nuep_11 = nuep_11 nuep_12 = nuep_12 nuep_13 = nuep_13 nuep_14 = nuep_14 hveppac = (hvep_09 + hvep_10) / 1000

January 2014
U.S. Energy Information Administration | STEO Model Documentation: Electricity Generation and Fuel Consumption Models 61
' ------------------------------------------------------------------------------------------ ' AGGREGATE REPORTED (F860) AND MODELED WIND CAPACITY ' ------------------------------------------------------------------------------------------ WNEPCAPX_NE = WNEPCAP_NE + WNEPCAP_NE_A WNEPCAPX_MW = WNEPCAP_MW + WNEPCAP_MW_A WNEPCAPX_SO = WNEPCAP_SO + WNEPCAP_SO_A WNEPCAPX_WE = WNEPCAP_WE + WNEPCAP_WE_A WNEPCAPX_US = WNEPCAPX_NE + WNEPCAPX_MW + WNEPCAPX_SO + WNEPCAPX_WE

January 2014
U.S. Energy Information Administration | STEO Model Documentation: Electricity Generation and Fuel Consumption Models 62
Appendix C. Generation Model Regression Results
Table 7 – TDLOPUS, United States total transmission and distribution losses ............................................................ 64
Table 8 – ELIMPUS, United States total imports of electricity ..................................................................................... 65
Table 9 – ELEXPUS, United States total exports of electricity ..................................................................................... 66
Table 10 – EPEOX_MW, total generation by electric power sector, Midwest region ................................................. 67
Table 11 – EPEOX_NE, total generation by electric power sector, Northeast region ................................................. 68
Table 12 – EPEOX_SO, total generation by electric power sector, South region ........................................................ 69
Table 13 – EPEOX_WE, total generation by electric power sector, West region ........................................................ 70
Table 14 – WNEP_MW, wind generation by electric power sector, Midwest region ................................................. 71
Table 15 – WNEP_NE, wind generation by electric power sector, Northeast region .................................................. 72
Table 16 – WNEP_SO, wind generation by electric power sector, South region ........................................................ 73
Table 17 – WNEP_WE, wind generation by electric power sector, West region ........................................................ 74
Table 18 – WWEP_MW, wood biomass generation by electric power sector, Midwest region ................................. 75
Table 19 – WWEP_NE, wood biomass generation by electric power sector, Northeast region ................................. 76
Table 20 – WWEP_SO, wood biomass generation by electric power sector, South region ........................................ 77
Table 21 – WWEP_WE, wood biomass generation by electric power sector, West region ........................................ 78
Table 22 – MLEP_MW, municipal biomass generation by electric power sector, Midwest region ............................ 79
Table 23 – MLEP_NE, municipal biomass generation by electric power sector, Northeast region ............................. 80
Table 24 – MLEP_SO, municipal biomass generation by electric power sector, South region.................................... 81
Table 25 – MLEP_WE, municipal biomass generation by electric power sector, West region ................................... 82
Table 26 – OREP_MW, other biomass generation by electric power sector, Midwest region ................................... 83
Table 27 – OREP_NE, other biomass generation by electric power sector, Northeast region .................................... 84
Table 28 – OREP_SO, other biomass generation by electric power sector, South region ........................................... 85
Table 29 – OREP_WE, other biomass generation by electric power sector, West region ........................................... 86
Table 30 – SOEP_WE, solar generation by electric power sector, West region .......................................................... 87
Table 31 – GEEP_WE, geothermal generation by electric power sector, West region ............................................... 88
Table 32 – HPEP_MW, pumped storage hydroelectric generation by electric power sector, Midwest region .......... 89
Table 33 – HPEP_NE, pumped storage hydroelectric generation by electric power sector, Northeast region .......... 90
Table 34 – HPEP_SO, pumped storage hydroelectric generation by electric power sector, South region ................. 91
Table 35 – HPEP_WE, pumped storage hydroelectric generation by electric power sector, West region ................. 92
Table 36 – NGEP_MW, natural gas generation by electric power sector, Midwest region ........................................ 93
Table 37 – NGEP_NE, natural gas generation by electric power sector, Northeast region ......................................... 94
Table 38 – NGEP_SO, natural gas generation by electric power sector, South region................................................ 95
Table 39 – NGEP_WE, natural gas generation by electric power sector, West region ................................................ 96
Table 40 – RFEP_MW, residual fuel oil generation by electric power sector, Midwest region ................................... 97
Table 41 – RFEP_NE, residual fuel oil generation by electric power sector, Northeast region ................................... 98
Table 42 – RFEP_SO, residual fuel oil generation by electric power sector, South region .......................................... 99
Table 43 – RFEP_WE, residual fuel oil generation by electric power sector, West region ........................................ 100
Table 44 – DKEP_MW, distillate fuel oil generation by electric power sector, Midwest region ............................... 101
Table 45 - DKEP_NE, distillate fuel oil generation by electric power sector, Northeast region ................................ 102
Table 46 – DKEP_SO, distillate fuel oil generation by electric power sector, South region ...................................... 103
Table 47 – DKEP_WE, distillate fuel oil generation by electric power sector, West region ...................................... 104
January 2014
U.S. Energy Information Administration | STEO Model Documentation: Electricity Generation and Fuel Consumption Models 63
Table 48 – PCEP_MW, petroleum coke generation by electric power sector, Midwest region ................................ 105
Table 49 – PCEP_NE, petroleum coke generation by electric power sector, Northeast region ................................ 106
Table 50 – PCEP_SO, petroleum coke generation by electric power sector, South region ....................................... 107
Table 51 – PCEP_WE, petroleum coke generation by electric power sector, West region ....................................... 108
Table 52 – OPEP_MW, other petroleum generation by electric power sector, Midwest region .............................. 109
Table 53 – OPEP_NE, other petroleum generation by electric power sector, Northeast region .............................. 110
Table 54 - OPEP_SO, other petroleum generation by electric power sector, South region ...................................... 111
Table 55 – OPEP_WE, other petroleum generation by electric power sector, West region ..................................... 112
Table 56 – OGEP_MW, other fossil gases generation by electric power sector, Midwest region ............................ 113
Table 57 – OGEP_NE, other fossil gases generation by electric power sector, Northeast region ............................. 114
Table 58 – OGEP_SO, other fossil gases generation by electric power sector, South region .................................... 115
Table 59 – OGEP_WE, other fossil gases generation by electric power sector, West region .................................... 116
Table 60 – OTEP_MW, other fossil fuel generation by electric power sector, Midwest region ................................ 117
Table 61 – OTEP_NE, other fossil fuel generation by electric power sector, Northeast region ................................ 118
Table 62 – OTEP_SO, other fossil fuel generation by electric power sector, South region ....................................... 119
Table 63 – OTEP_WE, other fossil fuel generation by electric power sector, West region ....................................... 120
Table 64 – CHEO_MW, total generation by end-use CHP sector, Midwest region ................................................... 121
Table 65 – CHEO_NE, total generation by end-use CHP sector, Northeast region ................................................... 122
Table 66 – CHEO_SO, total generation by end-use CHP sector, South region .......................................................... 123
Table 67 – CHEO_WE, total generation by end-use CHP sector, West region .......................................................... 124
Table 68 – CLCH_MW, coal generation by end-use CHP sector, Midwest region ..................................................... 125
Table 69 – CLCH_NE, coal generation by end-use CHP sector, Northeast region ..................................................... 126
Table 70 – CLCH_SO, coal generation by end-use CHP sector, South region ............................................................ 127
Table 71 – CLCH_WE, coal generation by end-use CHP sector, West region ............................................................ 128
Table 72 – RFCH_MW, residual fuel oil generation by end-use CHP sector, Midwest region ................................... 129
Table 73 – RFCH_NE, residual fuel oil generation by end-use CHP sector, Northeast region ................................... 130
Table 74 – RFCH_SO, residual fuel oil generation by end-use CHP sector, South region .......................................... 131
Table 75 – RFCH_WE, residual fuel oil generation by end-use CHP sector, West region .......................................... 132
Table 76 – DKCH_MW, distillate fuel oil generation by end-use CHP sector, Midwest region ................................. 133
Table 77 – DKCH_NE, distillate fuel oil generation by end-use CHP sector, Northeast region ................................. 134
Table 78 – DKCH_SO, distillate fuel oil generation by end-use CHP sector, South region ........................................ 135
Table 79 – DKCH_WE, distillate fuel oil generation by end-use CHP sector, West region ........................................ 136

January 2014
U.S. Energy Information Administration | STEO Model Documentation: Electricity Generation and Fuel Consumption Models 64
Table 7 – TDLOPUS, United States total transmission and distribution losses
Dependent Variable: TDLOPUS/EXTCPUS
Method: Least Squares
Date: 07/16/13 Time: 11:18
Sample: 2001M01 2013M03
Included observations: 147 Variable Coefficient Std. Error t-Statistic Prob. C 0.058595 0.002997 19.54946 0.0000
FEB -0.014856 0.004352 -3.413269 0.0009
MAR 0.017042 0.004504 3.783587 0.0002
APR 0.022094 0.005339 4.138654 0.0001
MAY 0.038823 0.004929 7.876107 0.0000
JUN 0.012873 0.005573 2.309996 0.0225
JUL 0.003129 0.005197 0.602029 0.5482
AUG 0.022161 0.003854 5.750489 0.0000
SEP -0.001973 0.006391 -0.308685 0.7581
OCT 0.002619 0.005458 0.479840 0.6321
NOV 0.003441 0.004218 0.815796 0.4161
DEC 0.006405 0.004603 1.391613 0.1664
D0402 0.025292 0.009605 2.633196 0.0095
ELNIPUS/EXTCPUS 0.493807 0.204364 2.416316 0.0171
ZWCDPUS-ZWCDPUS(-1) 0.000281 3.45E-05 8.166994 0.0000
ZWHDPUS-ZWHDPUS(-1) 9.62E-05 1.26E-05 7.622828 0.0000 R-squared 0.903808 Mean dependent var 0.071234
Adjusted R-squared 0.892793 S.D. dependent var 0.027652
S.E. of regression 0.009054 Akaike info criterion -6.468788
Sum squared resid 0.010739 Schwarz criterion -6.143299
Log likelihood 491.4559 Hannan-Quinn criter. -6.336538
F-statistic 82.05685 Durbin-Watson stat 1.880527
Prob(F-statistic) 0.000000

January 2014
U.S. Energy Information Administration | STEO Model Documentation: Electricity Generation and Fuel Consumption Models 65
Table 8 – ELIMPUS, United States total imports of electricity
Dependent Variable: ELIMPUS/EXTCPUS
Method: Least Squares
Date: 08/09/13 Time: 13:34
Sample: 2001M01 2013M03
Included observations: 147
Convergence achieved after 6 iterations Variable Coefficient Std. Error t-Statistic Prob. C 0.002566 0.002720 0.943348 0.3472
FEB 5.85E-05 0.000444 0.131738 0.8954
MAR 0.000704 0.000595 1.183725 0.2387
APR 0.001409 0.000733 1.921266 0.0569
MAY 0.001919 0.000850 2.257326 0.0256
JUN 0.001075 0.000783 1.372855 0.1721
JUL 0.001900 0.000750 2.533237 0.0125
AUG 0.001569 0.000802 1.956421 0.0525
SEP -0.001604 0.000839 -1.913086 0.0579
OCT -0.001558 0.000740 -2.105333 0.0372
NOV -0.000459 0.000598 -0.768337 0.4437
DEC -0.000108 0.000438 -0.245544 0.8064
HYEPTOT/EXTCPUS -0.007208 0.021639 -0.333108 0.7396
NGEUDUS 0.000339 0.000160 2.124472 0.0355
CLEUDUS 0.004511 0.000993 4.542221 0.0000
AR(1) 0.729655 0.061242 11.91437 0.0000 R-squared 0.788104 Mean dependent var 0.012498
Adjusted R-squared 0.763841 S.D. dependent var 0.003004
S.E. of regression 0.001460 Akaike info criterion -10.11833
Sum squared resid 0.000279 Schwarz criterion -9.792836
Log likelihood 759.6969 Hannan-Quinn criter. -9.986075
F-statistic 32.48183 Durbin-Watson stat 2.172216
Prob(F-statistic) 0.000000 Inverted AR Roots .73

January 2014
U.S. Energy Information Administration | STEO Model Documentation: Electricity Generation and Fuel Consumption Models 66
Table 9 – ELEXPUS, United States total exports of electricity
Dependent Variable: ELEXPUS/EXTCPUS
Method: Least Squares
Date: 08/09/13 Time: 13:35
Sample: 2001M03 2013M03
Included observations: 145
Convergence achieved after 8 iterations Variable Coefficient Std. Error t-Statistic Prob. C 0.001835 0.001617 1.135371 0.2583
FEB -0.000121 0.000341 -0.354937 0.7232
MAR 0.000789 0.000432 1.825705 0.0702
APR 0.000190 0.000528 0.360196 0.7193
MAY 0.000384 0.000594 0.646764 0.5189
JUN 0.000185 0.000542 0.341997 0.7329
JUL -0.001002 0.000518 -1.933792 0.0553
AUG -0.000512 0.000558 -0.917627 0.3605
SEP 0.001297 0.000588 2.205771 0.0292
OCT 0.001032 0.000527 1.957689 0.0524
NOV 0.001083 0.000438 2.472368 0.0147
DEC -0.000252 0.000337 -0.748130 0.4558
D0804 -0.004178 0.000935 -4.467685 0.0000
HYEPTOT/EXTCPUS 0.041044 0.015219 2.696925 0.0079
NGEUDUS 0.000353 9.78E-05 3.613800 0.0004
CLEUDUS -0.000999 0.000505 -1.978553 0.0500
AR(1) 0.610515 0.066130 9.231996 0.0000 R-squared 0.689114 Mean dependent var 0.005293
Adjusted R-squared 0.650253 S.D. dependent var 0.001768
S.E. of regression 0.001046 Akaike info criterion -10.77855
Sum squared resid 0.000140 Schwarz criterion -10.42956
Log likelihood 798.4451 Hannan-Quinn criter. -10.63674
F-statistic 17.73292 Durbin-Watson stat 1.673512
Prob(F-statistic) 0.000000 Inverted AR Roots .61

January 2014
U.S. Energy Information Administration | STEO Model Documentation: Electricity Generation and Fuel Consumption Models 67
Table 10 – EPEOX_MW, total generation by electric power sector, Midwest region
Dependent Variable: DLOG(EPEOX_MW,0,12)
Method: Least Squares
Date: 08/09/13 Time: 13:37
Sample: 2001M01 2013M03
Included observations: 147
Convergence achieved after 6 iterations Variable Coefficient Std. Error t-Statistic Prob. C 0.002732 0.003540 0.771657 0.4416
DLOG(EXTCP_MW,0,12) 0.949439 0.037623 25.23550 0.0000
DLOG(EXTCP_MW(-1),0,12) -0.060223 0.038130 -1.579430 0.1165
DLOG(CLEUDUS,0,12) -0.035558 0.042702 -0.832703 0.4065
DLOG(NGEUDUS,0,12) 0.000687 0.008542 0.080431 0.9360
DLOG(RFEUDUS,0,12) -0.002857 0.009161 -0.311867 0.7556
DLOG(ELIMPUS,0,12) -0.010306 0.006822 -1.510832 0.1331
DLOG(ELEXPUS,0,12) 0.000599 0.004435 0.134984 0.8928
AR(1) 0.443779 0.081909 5.417924 0.0000 R-squared 0.897858 Mean dependent var 0.004787
Adjusted R-squared 0.891936 S.D. dependent var 0.048390
S.E. of regression 0.015907 Akaike info criterion -5.384819
Sum squared resid 0.034919 Schwarz criterion -5.201731
Log likelihood 404.7842 Hannan-Quinn criter. -5.310429
F-statistic 151.6318 Durbin-Watson stat 2.084603
Prob(F-statistic) 0.000000 Inverted AR Roots .44
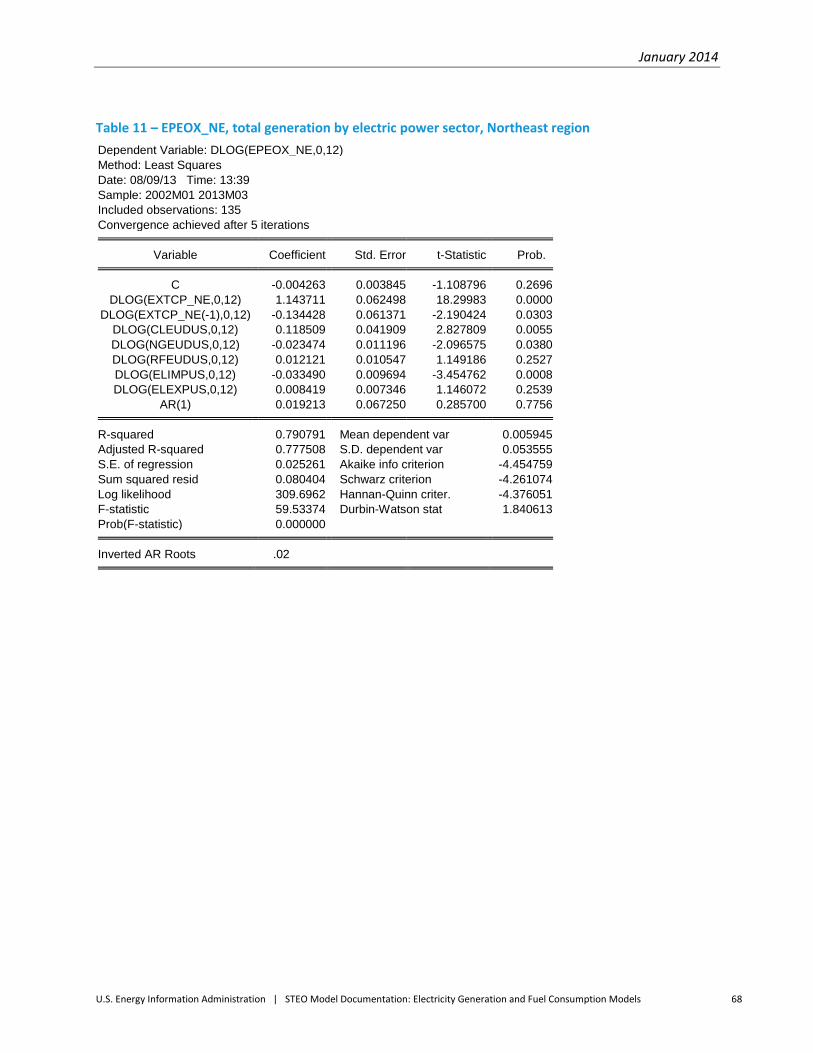
January 2014
U.S. Energy Information Administration | STEO Model Documentation: Electricity Generation and Fuel Consumption Models 68
Table 11 – EPEOX_NE, total generation by electric power sector, Northeast region
Dependent Variable: DLOG(EPEOX_NE,0,12)
Method: Least Squares
Date: 08/09/13 Time: 13:39
Sample: 2002M01 2013M03
Included observations: 135
Convergence achieved after 5 iterations Variable Coefficient Std. Error t-Statistic Prob. C -0.004263 0.003845 -1.108796 0.2696
DLOG(EXTCP_NE,0,12) 1.143711 0.062498 18.29983 0.0000
DLOG(EXTCP_NE(-1),0,12) -0.134428 0.061371 -2.190424 0.0303
DLOG(CLEUDUS,0,12) 0.118509 0.041909 2.827809 0.0055
DLOG(NGEUDUS,0,12) -0.023474 0.011196 -2.096575 0.0380
DLOG(RFEUDUS,0,12) 0.012121 0.010547 1.149186 0.2527
DLOG(ELIMPUS,0,12) -0.033490 0.009694 -3.454762 0.0008
DLOG(ELEXPUS,0,12) 0.008419 0.007346 1.146072 0.2539
AR(1) 0.019213 0.067250 0.285700 0.7756 R-squared 0.790791 Mean dependent var 0.005945
Adjusted R-squared 0.777508 S.D. dependent var 0.053555
S.E. of regression 0.025261 Akaike info criterion -4.454759
Sum squared resid 0.080404 Schwarz criterion -4.261074
Log likelihood 309.6962 Hannan-Quinn criter. -4.376051
F-statistic 59.53374 Durbin-Watson stat 1.840613
Prob(F-statistic) 0.000000 Inverted AR Roots .02
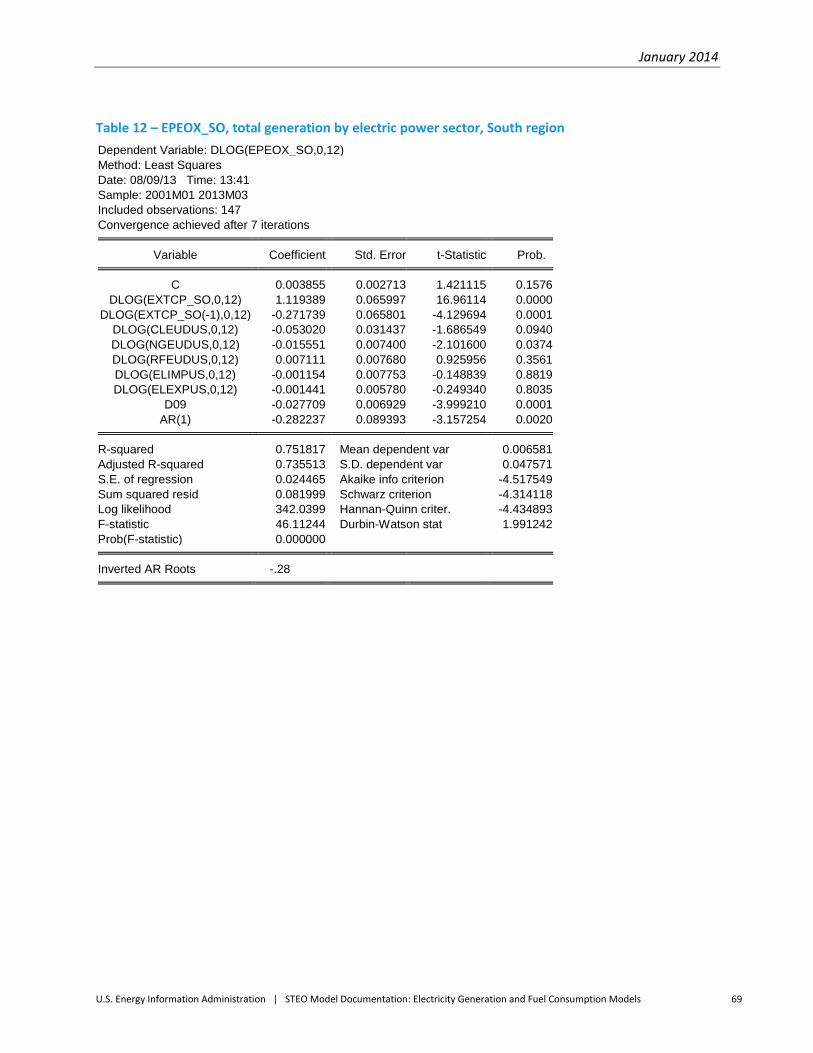
January 2014
U.S. Energy Information Administration | STEO Model Documentation: Electricity Generation and Fuel Consumption Models 69
Table 12 – EPEOX_SO, total generation by electric power sector, South region
Dependent Variable: DLOG(EPEOX_SO,0,12)
Method: Least Squares
Date: 08/09/13 Time: 13:41
Sample: 2001M01 2013M03
Included observations: 147
Convergence achieved after 7 iterations Variable Coefficient Std. Error t-Statistic Prob. C 0.003855 0.002713 1.421115 0.1576
DLOG(EXTCP_SO,0,12) 1.119389 0.065997 16.96114 0.0000
DLOG(EXTCP_SO(-1),0,12) -0.271739 0.065801 -4.129694 0.0001
DLOG(CLEUDUS,0,12) -0.053020 0.031437 -1.686549 0.0940
DLOG(NGEUDUS,0,12) -0.015551 0.007400 -2.101600 0.0374
DLOG(RFEUDUS,0,12) 0.007111 0.007680 0.925956 0.3561
DLOG(ELIMPUS,0,12) -0.001154 0.007753 -0.148839 0.8819
DLOG(ELEXPUS,0,12) -0.001441 0.005780 -0.249340 0.8035
D09 -0.027709 0.006929 -3.999210 0.0001
AR(1) -0.282237 0.089393 -3.157254 0.0020 R-squared 0.751817 Mean dependent var 0.006581
Adjusted R-squared 0.735513 S.D. dependent var 0.047571
S.E. of regression 0.024465 Akaike info criterion -4.517549
Sum squared resid 0.081999 Schwarz criterion -4.314118
Log likelihood 342.0399 Hannan-Quinn criter. -4.434893
F-statistic 46.11244 Durbin-Watson stat 1.991242
Prob(F-statistic) 0.000000 Inverted AR Roots -.28

January 2014
U.S. Energy Information Administration | STEO Model Documentation: Electricity Generation and Fuel Consumption Models 70
Table 13 – EPEOX_WE, total generation by electric power sector, West region
Dependent Variable: DLOG(EPEOX_WE,0,12)
Method: Least Squares
Date: 08/09/13 Time: 13:42
Sample: 2002M01 2013M03
Included observations: 135
Convergence achieved after 8 iterations Variable Coefficient Std. Error t-Statistic Prob. C 0.006156 0.002440 2.522743 0.0129
DLOG(EXTCP_WE,0,12) 0.702616 0.057943 12.12593 0.0000
DLOG(EXTCP_WE(-1),0,12) 0.032608 0.058514 0.557275 0.5783
DLOG(CLEUDUS,0,12) -0.030136 0.029074 -1.036512 0.3020
DLOG(NGEUDUS,0,12) -0.005702 0.007062 -0.807485 0.4209
DLOG(RFEUDUS,0,12) 0.012377 0.008395 1.474327 0.1429
DLOG(ELIMPUS,0,12) -0.000408 0.008217 -0.049709 0.9604
DLOG(ELEXPUS,0,12) 0.019594 0.006508 3.010586 0.0032
DLOG(HYEP_WE,0,12) 0.022749 0.010166 2.237721 0.0270
D10 -0.024222 0.006063 -3.994972 0.0001
AR(12) -0.347180 0.056908 -6.100686 0.0000 R-squared 0.713612 Mean dependent var 0.013104
Adjusted R-squared 0.690516 S.D. dependent var 0.032888
S.E. of regression 0.018296 Akaike info criterion -5.086300
Sum squared resid 0.041508 Schwarz criterion -4.849574
Log likelihood 354.3252 Hannan-Quinn criter. -4.990101
F-statistic 30.89792 Durbin-Watson stat 2.069591
Prob(F-statistic) 0.000000 Inverted AR Roots .88+.24i .88-.24i .65+.65i .65-.65i
.24+.88i .24-.88i -.24-.88i -.24+.88i
-.65+.65i -.65+.65i -.88+.24i -.88-.24i
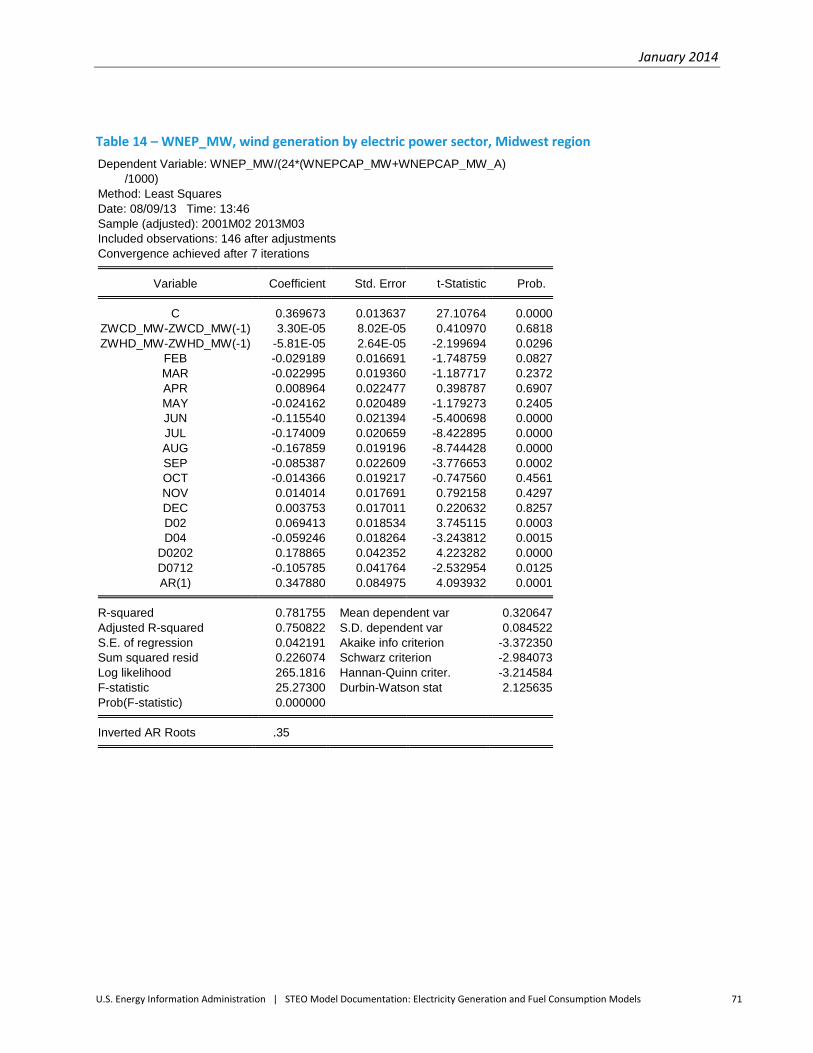
January 2014
U.S. Energy Information Administration | STEO Model Documentation: Electricity Generation and Fuel Consumption Models 71
Table 14 – WNEP_MW, wind generation by electric power sector, Midwest region
Dependent Variable: WNEP_MW/(24*(WNEPCAP_MW+WNEPCAP_MW_A)
/1000)
Method: Least Squares
Date: 08/09/13 Time: 13:46
Sample (adjusted): 2001M02 2013M03
Included observations: 146 after adjustments
Convergence achieved after 7 iterations Variable Coefficient Std. Error t-Statistic Prob. C 0.369673 0.013637 27.10764 0.0000
ZWCD_MW-ZWCD_MW(-1) 3.30E-05 8.02E-05 0.410970 0.6818
ZWHD_MW-ZWHD_MW(-1) -5.81E-05 2.64E-05 -2.199694 0.0296
FEB -0.029189 0.016691 -1.748759 0.0827
MAR -0.022995 0.019360 -1.187717 0.2372
APR 0.008964 0.022477 0.398787 0.6907
MAY -0.024162 0.020489 -1.179273 0.2405
JUN -0.115540 0.021394 -5.400698 0.0000
JUL -0.174009 0.020659 -8.422895 0.0000
AUG -0.167859 0.019196 -8.744428 0.0000
SEP -0.085387 0.022609 -3.776653 0.0002
OCT -0.014366 0.019217 -0.747560 0.4561
NOV 0.014014 0.017691 0.792158 0.4297
DEC 0.003753 0.017011 0.220632 0.8257
D02 0.069413 0.018534 3.745115 0.0003
D04 -0.059246 0.018264 -3.243812 0.0015
D0202 0.178865 0.042352 4.223282 0.0000
D0712 -0.105785 0.041764 -2.532954 0.0125
AR(1) 0.347880 0.084975 4.093932 0.0001 R-squared 0.781755 Mean dependent var 0.320647
Adjusted R-squared 0.750822 S.D. dependent var 0.084522
S.E. of regression 0.042191 Akaike info criterion -3.372350
Sum squared resid 0.226074 Schwarz criterion -2.984073
Log likelihood 265.1816 Hannan-Quinn criter. -3.214584
F-statistic 25.27300 Durbin-Watson stat 2.125635
Prob(F-statistic) 0.000000 Inverted AR Roots .35

January 2014
U.S. Energy Information Administration | STEO Model Documentation: Electricity Generation and Fuel Consumption Models 72
Table 15 – WNEP_NE, wind generation by electric power sector, Northeast region
Dependent Variable: WNEP_NE/(24*(WNEPCAP_NE+WNEPCAP_NE_A)
/1000)
Method: Least Squares
Date: 08/09/13 Time: 13:56
Sample: 2003M01 2013M03
Included observations: 123 Variable Coefficient Std. Error t-Statistic Prob. C 0.313014 0.015805 19.80490 0.0000
ZWCD_NE-ZWCD_NE(-1) 6.55E-05 0.000141 0.464362 0.6433
ZWHD_NE-ZWHD_NE(-1) 3.02E-05 4.41E-05 0.684829 0.4949
FEB 0.011709 0.024432 0.479241 0.6327
MAR -0.010268 0.024885 -0.412619 0.6807
APR -0.012773 0.030221 -0.422672 0.6734
MAY -0.101343 0.027348 -3.705695 0.0003
JUN -0.134168 0.027630 -4.855928 0.0000
JUL -0.167539 0.028488 -5.880991 0.0000
AUG -0.167372 0.022355 -7.486951 0.0000
SEP -0.120416 0.030052 -4.006875 0.0001
OCT -0.071382 0.022628 -3.154583 0.0021
NOV -0.038260 0.020468 -1.869207 0.0643
DEC 0.028406 0.021877 1.298457 0.1969
D03 -0.086820 0.013986 -6.207662 0.0000
D0512 -0.191675 0.048881 -3.921264 0.0002 R-squared 0.743718 Mean dependent var 0.239262
Adjusted R-squared 0.707791 S.D. dependent var 0.085075
S.E. of regression 0.045988 Akaike info criterion -3.200049
Sum squared resid 0.226298 Schwarz criterion -2.834236
Log likelihood 212.8030 Hannan-Quinn criter. -3.051457
F-statistic 20.70064 Durbin-Watson stat 1.240137
Prob(F-statistic) 0.000000

January 2014
U.S. Energy Information Administration | STEO Model Documentation: Electricity Generation and Fuel Consumption Models 73
Table 16 – WNEP_SO, wind generation by electric power sector, South region
Dependent Variable: WNEP_SO/(24*(WNEPCAP_SO+WNEPCAP_SO_A)
/1000)
Method: Least Squares
Date: 08/09/13 Time: 13:57
Sample: 2002M01 2013M03
Included observations: 135
Convergence achieved after 4 iterations Variable Coefficient Std. Error t-Statistic Prob. C 0.303466 0.016244 18.68213 0.0000
ZWCD_SO-ZWCD_SO(-1) 0.000227 0.000111 2.047755 0.0428
ZWHD_SO-ZWHD_SO(-1) 1.76E-06 6.00E-05 0.029391 0.9766
FEB 0.006976 0.019693 0.354248 0.7238
MAR 0.036625 0.023645 1.548989 0.1240
APR 0.059991 0.025139 2.386421 0.0186
MAY -0.001401 0.025542 -0.054850 0.9563
JUN -0.014300 0.027367 -0.522539 0.6023
JUL -0.077241 0.023386 -3.302890 0.0013
AUG -0.079014 0.021914 -3.605545 0.0005
SEP -0.030964 0.029802 -1.038985 0.3009
OCT 0.026985 0.028308 0.953252 0.3424
NOV 0.029654 0.022341 1.327319 0.1869
DEC 0.015956 0.019810 0.805450 0.4222
D10ON 0.035354 0.014266 2.478257 0.0146
AR(1) 0.372557 0.083787 4.446507 0.0000 R-squared 0.554537 Mean dependent var 0.311144
Adjusted R-squared 0.498386 S.D. dependent var 0.067750
S.E. of regression 0.047984 Akaike info criterion -3.125023
Sum squared resid 0.273990 Schwarz criterion -2.780694
Log likelihood 226.9391 Hannan-Quinn criter. -2.985097
F-statistic 9.875857 Durbin-Watson stat 1.959452
Prob(F-statistic) 0.000000 Inverted AR Roots .37
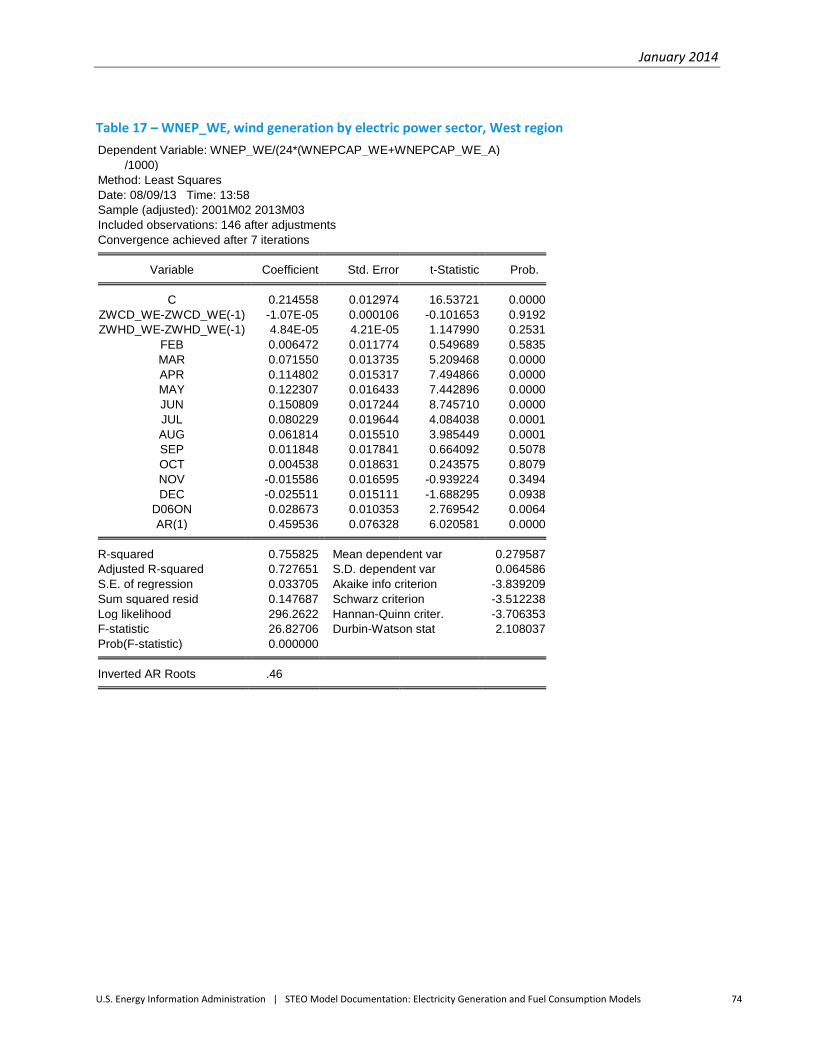
January 2014
U.S. Energy Information Administration | STEO Model Documentation: Electricity Generation and Fuel Consumption Models 74
Table 17 – WNEP_WE, wind generation by electric power sector, West region
Dependent Variable: WNEP_WE/(24*(WNEPCAP_WE+WNEPCAP_WE_A)
/1000)
Method: Least Squares
Date: 08/09/13 Time: 13:58
Sample (adjusted): 2001M02 2013M03
Included observations: 146 after adjustments
Convergence achieved after 7 iterations Variable Coefficient Std. Error t-Statistic Prob. C 0.214558 0.012974 16.53721 0.0000
ZWCD_WE-ZWCD_WE(-1) -1.07E-05 0.000106 -0.101653 0.9192
ZWHD_WE-ZWHD_WE(-1) 4.84E-05 4.21E-05 1.147990 0.2531
FEB 0.006472 0.011774 0.549689 0.5835
MAR 0.071550 0.013735 5.209468 0.0000
APR 0.114802 0.015317 7.494866 0.0000
MAY 0.122307 0.016433 7.442896 0.0000
JUN 0.150809 0.017244 8.745710 0.0000
JUL 0.080229 0.019644 4.084038 0.0001
AUG 0.061814 0.015510 3.985449 0.0001
SEP 0.011848 0.017841 0.664092 0.5078
OCT 0.004538 0.018631 0.243575 0.8079
NOV -0.015586 0.016595 -0.939224 0.3494
DEC -0.025511 0.015111 -1.688295 0.0938
D06ON 0.028673 0.010353 2.769542 0.0064
AR(1) 0.459536 0.076328 6.020581 0.0000 R-squared 0.755825 Mean dependent var 0.279587
Adjusted R-squared 0.727651 S.D. dependent var 0.064586
S.E. of regression 0.033705 Akaike info criterion -3.839209
Sum squared resid 0.147687 Schwarz criterion -3.512238
Log likelihood 296.2622 Hannan-Quinn criter. -3.706353
F-statistic 26.82706 Durbin-Watson stat 2.108037
Prob(F-statistic) 0.000000 Inverted AR Roots .46

January 2014
U.S. Energy Information Administration | STEO Model Documentation: Electricity Generation and Fuel Consumption Models 75
Table 18 – WWEP_MW, wood biomass generation by electric power sector, Midwest region
Dependent Variable: WWEP_MW/(24*WWEPCAP_MW/1000)
Method: Least Squares
Date: 08/09/13 Time: 13:44
Sample (adjusted): 2001M02 2013M03
Included observations: 146 after adjustments
Convergence achieved after 6 iterations Variable Coefficient Std. Error t-Statistic Prob. C 0.494022 0.017824 27.71605 0.0000
ZWCD_MW-ZWCD_MW(-1) 0.000166 9.11E-05 1.826340 0.0701
ZWHD_MW-ZWHD_MW(-1) -7.68E-06 2.98E-05 -0.257497 0.7972
FEB -0.007371 0.019037 -0.387177 0.6993
MAR -0.042069 0.023383 -1.799120 0.0743
APR -0.057238 0.027470 -2.083659 0.0391
MAY -0.060315 0.025966 -2.322855 0.0217
JUN -0.047694 0.027161 -1.756018 0.0814
JUL 0.018358 0.026504 0.692627 0.4898
AUG 0.030714 0.024962 1.230441 0.2207
SEP -0.007654 0.028197 -0.271431 0.7865
OCT -0.013062 0.024247 -0.538720 0.5910
NOV -0.001068 0.021788 -0.049020 0.9610
DEC -0.000800 0.019319 -0.041389 0.9670
AR(1) 0.497812 0.076255 6.528252 0.0000 R-squared 0.392103 Mean dependent var 0.478028
Adjusted R-squared 0.327137 S.D. dependent var 0.063640
S.E. of regression 0.052203 Akaike info criterion -2.970292
Sum squared resid 0.356992 Schwarz criterion -2.663757
Log likelihood 231.8313 Hannan-Quinn criter. -2.845740
F-statistic 6.035500 Durbin-Watson stat 2.178949
Prob(F-statistic) 0.000000 Inverted AR Roots .50

January 2014
U.S. Energy Information Administration | STEO Model Documentation: Electricity Generation and Fuel Consumption Models 76
Table 19 – WWEP_NE, wood biomass generation by electric power sector, Northeast region
Dependent Variable: WWEP_NE/(24*WWEPCAP_NE/1000)
Method: Least Squares
Date: 08/09/13 Time: 14:01
Sample (adjusted): 2001M02 2013M03
Included observations: 146 after adjustments
Convergence achieved after 3 iterations Variable Coefficient Std. Error t-Statistic Prob. C 0.811581 0.023386 34.70331 0.0000
FEB -0.006435 0.017065 -0.377103 0.7067
MAR -0.056356 0.022279 -2.529540 0.0126
APR -0.229936 0.025618 -8.975725 0.0000
MAY -0.122755 0.027492 -4.465044 0.0000
JUN -0.065850 0.028469 -2.313043 0.0223
JUL -0.021691 0.028784 -0.753563 0.4524
AUG 0.009217 0.028513 0.323242 0.7470
SEP -0.032632 0.027610 -1.181891 0.2394
OCT -0.139851 0.025893 -5.401117 0.0000
NOV -0.074778 0.022937 -3.260133 0.0014
DEC -0.014149 0.017649 -0.801735 0.4241
AR(1) 0.704697 0.061501 11.45834 0.0000 R-squared 0.719413 Mean dependent var 0.747884
Adjusted R-squared 0.694097 S.D. dependent var 0.102378
S.E. of regression 0.056624 Akaike info criterion -2.819947
Sum squared resid 0.426433 Schwarz criterion -2.554283
Log likelihood 218.8561 Hannan-Quinn criter. -2.712001
F-statistic 28.41726 Durbin-Watson stat 2.179812
Prob(F-statistic) 0.000000 Inverted AR Roots .70

January 2014
U.S. Energy Information Administration | STEO Model Documentation: Electricity Generation and Fuel Consumption Models 77
Table 20 – WWEP_SO, wood biomass generation by electric power sector, South region
Dependent Variable: WWEP_SO/(24*WWEPCAP_SO/1000)
Method: Least Squares
Date: 08/09/13 Time: 14:03
Sample (adjusted): 2001M02 2013M03
Included observations: 146 after adjustments
Convergence achieved after 4 iterations Variable Coefficient Std. Error t-Statistic Prob. C 2.188709 0.839500 2.607159 0.0102
ZWCD_SO-ZWCD_SO(-1) 0.000242 0.000138 1.759815 0.0808
ZWHD_SO-ZWHD_SO(-1) 0.000141 7.02E-05 2.012005 0.0463
FEB 0.038436 0.025719 1.494461 0.1375
MAR -0.011800 0.033409 -0.353199 0.7245
APR -0.047384 0.039195 -1.208917 0.2289
MAY -0.065849 0.042418 -1.552370 0.1230
JUN 0.034068 0.045914 0.741985 0.4594
JUL 0.067787 0.043187 1.569602 0.1189
AUG 0.102693 0.041447 2.477679 0.0145
SEP 0.086058 0.047380 1.816335 0.0716
OCT -0.055200 0.043040 -1.282504 0.2019
NOV -0.024650 0.033319 -0.739800 0.4608
DEC 0.006032 0.026134 0.230821 0.8178
@TREND -0.003837 0.002091 -1.835028 0.0688
AR(1) 0.918577 0.033369 27.52792 0.0000 R-squared 0.887956 Mean dependent var 0.690671
Adjusted R-squared 0.875028 S.D. dependent var 0.229735
S.E. of regression 0.081215 Akaike info criterion -2.080339
Sum squared resid 0.857455 Schwarz criterion -1.753368
Log likelihood 167.8647 Hannan-Quinn criter. -1.947483
F-statistic 68.68412 Durbin-Watson stat 2.374649
Prob(F-statistic) 0.000000 Inverted AR Roots .92

January 2014
U.S. Energy Information Administration | STEO Model Documentation: Electricity Generation and Fuel Consumption Models 78
Table 21 – WWEP_WE, wood biomass generation by electric power sector, West region
Dependent Variable: WWEP_WE/(24*WWEPCAP_WE/1000)
Method: Least Squares
Date: 08/09/13 Time: 14:04
Sample (adjusted): 2001M02 2013M03
Included observations: 146 after adjustments
Convergence achieved after 5 iterations Variable Coefficient Std. Error t-Statistic Prob. C 0.691172 0.021787 31.72453 0.0000
ZWCD_WE-ZWCD_WE(-1) 4.56E-05 0.000132 0.346092 0.7298
ZWHD_WE-ZWHD_WE(-1) 9.15E-05 5.37E-05 1.702776 0.0910
FEB -0.011551 0.015527 -0.743959 0.4582
MAR -0.046239 0.019619 -2.356847 0.0199
APR -0.112590 0.022909 -4.914706 0.0000
MAY -0.187390 0.025247 -7.422164 0.0000
JUN -0.046698 0.026813 -1.741604 0.0839
JUL 0.001678 0.029588 0.056711 0.9549
AUG 0.006540 0.025216 0.259346 0.7958
SEP -0.008957 0.026864 -0.333434 0.7393
OCT -0.052200 0.026840 -1.944851 0.0540
NOV -0.043894 0.023529 -1.865531 0.0644
DEC -0.025779 0.020428 -1.261925 0.2092
D0701 0.537403 0.042123 12.75781 0.0000
AR(1) 0.738524 0.058284 12.67104 0.0000 R-squared 0.798306 Mean dependent var 0.649799
Adjusted R-squared 0.775034 S.D. dependent var 0.102865
S.E. of regression 0.048790 Akaike info criterion -3.099491
Sum squared resid 0.309456 Schwarz criterion -2.772520
Log likelihood 242.2628 Hannan-Quinn criter. -2.966635
F-statistic 34.30270 Durbin-Watson stat 2.317545
Prob(F-statistic) 0.000000 Inverted AR Roots .74

January 2014
U.S. Energy Information Administration | STEO Model Documentation: Electricity Generation and Fuel Consumption Models 79
Table 22 – MLEP_MW, municipal biomass generation by electric power sector, Midwest region
Dependent Variable: MLEP_MW/(24*MLEPCAP_MW/1000)
Method: Least Squares
Date: 08/12/13 Time: 08:43
Sample (adjusted): 2001M02 2013M03
Included observations: 146 after adjustments
Convergence achieved after 14 iterations Variable Coefficient Std. Error t-Statistic Prob. C 0.530729 0.025532 20.78687 0.0000
D01 -0.092545 0.064467 -1.435546 0.1536
D02 -0.145933 0.050806 -2.872360 0.0048
D03 -0.087380 0.043909 -1.990012 0.0487
D04 -0.058789 0.035583 -1.652157 0.1009
FEB 0.004211 0.011658 0.361220 0.7185
MAR 0.008206 0.015644 0.524554 0.6008
APR 0.016113 0.018371 0.877087 0.3821
MAY 0.022919 0.020072 1.141854 0.2556
JUN 0.038387 0.021046 1.823911 0.0705
JUL 0.034121 0.021426 1.592524 0.1137
AUG 0.038906 0.021255 1.830487 0.0695
SEP 0.016249 0.020514 0.792134 0.4297
OCT 5.37E-05 0.019111 0.002809 0.9978
NOV 0.020904 0.016831 1.242034 0.2165
DEC 0.003407 0.013127 0.259529 0.7956
AR(1) 0.837030 0.050268 16.65135 0.0000 R-squared 0.851239 Mean dependent var 0.514828
Adjusted R-squared 0.832788 S.D. dependent var 0.099127
S.E. of regression 0.040534 Akaike info criterion -3.464247
Sum squared resid 0.211952 Schwarz criterion -3.116841
Log likelihood 269.8900 Hannan-Quinn criter. -3.323088
F-statistic 46.13501 Durbin-Watson stat 2.425681
Prob(F-statistic) 0.000000 Inverted AR Roots .84

January 2014
U.S. Energy Information Administration | STEO Model Documentation: Electricity Generation and Fuel Consumption Models 80
Table 23 – MLEP_NE, municipal biomass generation by electric power sector, Northeast region
Dependent Variable: MLEP_NE/(24*MLEPCAP_NE/1000)
Method: Least Squares
Date: 08/12/13 Time: 08:43
Sample (adjusted): 2001M02 2013M03
Included observations: 146 after adjustments
Convergence achieved after 8 iterations Variable Coefficient Std. Error t-Statistic Prob. C 0.456415 0.006320 72.21436 0.0000
D11 -0.029433 0.009729 -3.025329 0.0030
FEB 0.004741 0.004338 1.092898 0.2764
MAR 0.024082 0.005696 4.227750 0.0000
APR 0.027446 0.006577 4.173000 0.0001
MAY 0.035930 0.007083 5.072977 0.0000
JUN 0.049473 0.007350 6.730883 0.0000
JUL 0.047886 0.007438 6.438258 0.0000
AUG 0.038452 0.007364 5.221760 0.0000
SEP 0.036152 0.007117 5.079369 0.0000
OCT 0.026271 0.006653 3.948421 0.0001
NOV 0.044537 0.005867 7.590464 0.0000
DEC 0.045859 0.004489 10.21655 0.0000
AR(1) 0.729391 0.060027 12.15107 0.0000 R-squared 0.695092 Mean dependent var 0.485515
Adjusted R-squared 0.665063 S.D. dependent var 0.025092
S.E. of regression 0.014522 Akaike info criterion -5.535347
Sum squared resid 0.027837 Schwarz criterion -5.249248
Log likelihood 418.0804 Hannan-Quinn criter. -5.419099
F-statistic 23.14752 Durbin-Watson stat 2.342452
Prob(F-statistic) 0.000000 Inverted AR Roots .73

January 2014
U.S. Energy Information Administration | STEO Model Documentation: Electricity Generation and Fuel Consumption Models 81
Table 24 – MLEP_SO, municipal biomass generation by electric power sector, South region
Dependent Variable: MLEP_SO/(24*MLEPCAP_SO/1000)
Method: Least Squares
Date: 08/12/13 Time: 08:44
Sample (adjusted): 2001M02 2013M03
Included observations: 146 after adjustments
Convergence achieved after 9 iterations Variable Coefficient Std. Error t-Statistic Prob. C 0.456938 0.009046 50.51206 0.0000
D01 0.002397 0.019082 0.125641 0.9002
D02 0.024016 0.015581 1.541374 0.1256
FEB -0.020099 0.007636 -2.632247 0.0095
MAR -0.014244 0.009744 -1.461893 0.1462
APR -0.008493 0.011011 -0.771329 0.4419
MAY -0.016143 0.011656 -1.384934 0.1684
JUN 0.012217 0.011970 1.020566 0.3093
JUL 0.024204 0.012070 2.005290 0.0470
AUG 0.005074 0.011992 0.423083 0.6729
SEP -0.019328 0.011713 -1.650071 0.1013
OCT -0.043573 0.011148 -3.908711 0.0001
NOV -0.025851 0.010091 -2.561910 0.0115
DEC 0.003694 0.008020 0.460579 0.6459
AR(1) 0.611720 0.072454 8.442901 0.0000 R-squared 0.578281 Mean dependent var 0.450940
Adjusted R-squared 0.533212 S.D. dependent var 0.035816
S.E. of regression 0.024470 Akaike info criterion -4.485663
Sum squared resid 0.078441 Schwarz criterion -4.179128
Log likelihood 342.4534 Hannan-Quinn criter. -4.361111
F-statistic 12.83096 Durbin-Watson stat 2.201417
Prob(F-statistic) 0.000000 Inverted AR Roots .61

January 2014
U.S. Energy Information Administration | STEO Model Documentation: Electricity Generation and Fuel Consumption Models 82
Table 25 – MLEP_WE, municipal biomass generation by electric power sector, West region
Dependent Variable: MLEP_WE/(24*MLEPCAP_WE/1000)
Method: Least Squares
Date: 08/12/13 Time: 08:44
Sample (adjusted): 2001M02 2013M03
Included observations: 146 after adjustments
Convergence achieved after 7 iterations Variable Coefficient Std. Error t-Statistic Prob. C 0.570062 0.033843 16.84427 0.0000
D07 -0.081428 0.030999 -2.626771 0.0097
D08 -0.023703 0.030996 -0.764689 0.4458
FEB 0.013849 0.010766 1.286352 0.2006
MAR 0.002176 0.014368 0.151453 0.8799
APR -0.017241 0.016848 -1.023338 0.3080
MAY -0.009967 0.018408 -0.541433 0.5891
JUN 0.024009 0.019290 1.244618 0.2155
JUL 0.039966 0.019599 2.039213 0.0435
AUG 0.033316 0.019367 1.720268 0.0878
SEP 0.025720 0.018575 1.384665 0.1685
OCT 0.005233 0.017137 0.305366 0.7606
NOV 0.017648 0.014853 1.188222 0.2369
DEC 0.016851 0.011182 1.506976 0.1342
D1101 -0.149375 0.029300 -5.098046 0.0000
AR(1) 0.899717 0.040111 22.43042 0.0000 R-squared 0.833769 Mean dependent var 0.583377
Adjusted R-squared 0.814588 S.D. dependent var 0.087485
S.E. of regression 0.037670 Akaike info criterion -3.616775
Sum squared resid 0.184478 Schwarz criterion -3.289805
Log likelihood 280.0246 Hannan-Quinn criter. -3.483920
F-statistic 43.46952 Durbin-Watson stat 2.148382
Prob(F-statistic) 0.000000 Inverted AR Roots .90

January 2014
U.S. Energy Information Administration | STEO Model Documentation: Electricity Generation and Fuel Consumption Models 83
Table 26 – OREP_MW, other biomass generation by electric power sector, Midwest region
Dependent Variable: OREP_MW/(24*OREPCAP_MW/1000)
Method: Least Squares
Date: 08/12/13 Time: 08:51
Sample (adjusted): 2001M02 2013M03
Included observations: 146 after adjustments
Convergence achieved after 7 iterations Variable Coefficient Std. Error t-Statistic Prob. C 0.494160 0.177263 2.787726 0.0061
FEB 0.046378 0.033679 1.377063 0.1709
MAR 0.098618 0.046089 2.139736 0.0342
APR 0.131445 0.053614 2.451685 0.0155
MAY 0.050091 0.058735 0.852827 0.3953
JUN 0.079312 0.061646 1.286586 0.2005
JUL 0.093504 0.062667 1.492080 0.1381
AUG 0.140489 0.061902 2.269542 0.0249
SEP 0.116208 0.059785 1.943742 0.0541
OCT 0.069588 0.055111 1.262678 0.2090
NOV 0.042762 0.047014 0.909548 0.3647
DEC 0.014442 0.034928 0.413479 0.6799
D0203 0.300297 0.093553 3.209910 0.0017
D0210 -0.504629 0.093819 -5.378741 0.0000
D0709 0.428762 0.093611 4.580260 0.0000
AR(1) 0.939748 0.030628 30.68234 0.0000 R-squared 0.882773 Mean dependent var 0.496714
Adjusted R-squared 0.869247 S.D. dependent var 0.339558
S.E. of regression 0.122784 Akaike info criterion -1.253678
Sum squared resid 1.959861 Schwarz criterion -0.926707
Log likelihood 107.5185 Hannan-Quinn criter. -1.120822
F-statistic 65.26388 Durbin-Watson stat 1.845396
Prob(F-statistic) 0.000000 Inverted AR Roots .94

January 2014
U.S. Energy Information Administration | STEO Model Documentation: Electricity Generation and Fuel Consumption Models 84
Table 27 – OREP_NE, other biomass generation by electric power sector, Northeast region
Dependent Variable: OREP_NE/(24*OREPCAP_NE/1000)
Method: Least Squares
Date: 08/12/13 Time: 08:51
Sample (adjusted): 2001M02 2013M03
Included observations: 146 after adjustments
Convergence achieved after 6 iterations Variable Coefficient Std. Error t-Statistic Prob. C 0.029923 0.008480 3.528595 0.0006
FEB 0.003405 0.005361 0.635166 0.5264
MAR -0.002431 0.007083 -0.343181 0.7320
APR -0.011073 0.008217 -1.347499 0.1801
MAY -0.008382 0.008883 -0.943606 0.3471
JUN 0.001699 0.009241 0.183831 0.8544
JUL 0.005602 0.009360 0.598513 0.5505
AUG 0.005338 0.009261 0.576366 0.5654
SEP -0.004060 0.008932 -0.454596 0.6502
OCT -0.009152 0.008320 -1.100019 0.2733
NOV -0.008077 0.007300 -1.106451 0.2706
DEC -0.010687 0.005549 -1.926066 0.0563
D03 0.294440 0.012358 23.82645 0.0000
D06 0.141008 0.012395 11.37654 0.0000
AR(1) 0.759485 0.056720 13.39016 0.0000 R-squared 0.965549 Mean dependent var 0.062226
Adjusted R-squared 0.961867 S.D. dependent var 0.092889
S.E. of regression 0.018139 Akaike info criterion -5.084439
Sum squared resid 0.043102 Schwarz criterion -4.777904
Log likelihood 386.1640 Hannan-Quinn criter. -4.959886
F-statistic 262.2487 Durbin-Watson stat 1.787503
Prob(F-statistic) 0.000000 Inverted AR Roots .76

January 2014
U.S. Energy Information Administration | STEO Model Documentation: Electricity Generation and Fuel Consumption Models 85
Table 28 – OREP_SO, other biomass generation by electric power sector, South region
Dependent Variable: OREP_SO/(24*OREPCAP_SO/1000)
Method: Least Squares
Date: 08/12/13 Time: 08:51
Sample (adjusted): 2001M02 2013M03
Included observations: 146 after adjustments
Convergence achieved after 8 iterations Variable Coefficient Std. Error t-Statistic Prob. C 0.330390 0.036401 9.076486 0.0000
D01 -0.174027 0.065351 -2.662945 0.0087
D08ON 0.017688 0.037559 0.470933 0.6385
FEB -0.011510 0.024591 -0.468075 0.6405
MAR -0.011258 0.031821 -0.353798 0.7241
APR -0.079115 0.036360 -2.175916 0.0314
MAY -0.065401 0.038822 -1.684627 0.0944
JUN -0.052114 0.040082 -1.300194 0.1958
JUL -0.048556 0.040501 -1.198861 0.2327
AUG -0.042307 0.040196 -1.052531 0.2945
SEP -0.074381 0.039101 -1.902293 0.0593
OCT -0.091191 0.036948 -2.468083 0.0149
NOV -0.024358 0.033115 -0.735572 0.4633
DEC 0.009891 0.026022 0.380108 0.7045
AR(1) 0.662876 0.065833 10.06905 0.0000 R-squared 0.631866 Mean dependent var 0.282055
Adjusted R-squared 0.592524 S.D. dependent var 0.125676
S.E. of regression 0.080224 Akaike info criterion -2.110920
Sum squared resid 0.843099 Schwarz criterion -1.804386
Log likelihood 169.0972 Hannan-Quinn criter. -1.986368
F-statistic 16.06065 Durbin-Watson stat 1.976704
Prob(F-statistic) 0.000000 Inverted AR Roots .66

January 2014
U.S. Energy Information Administration | STEO Model Documentation: Electricity Generation and Fuel Consumption Models 86
Table 29 – OREP_WE, other biomass generation by electric power sector, West region
Dependent Variable: OREP_WE/(24*OREPCAP_WE/1000)
Method: Least Squares
Date: 08/12/13 Time: 08:51
Sample (adjusted): 2001M02 2013M03
Included observations: 146 after adjustments
Convergence achieved after 10 iterations Variable Coefficient Std. Error t-Statistic Prob. C 0.367643 0.037123 9.903341 0.0000
D01 -0.144027 0.075841 -1.899061 0.0599
D02 -0.129310 0.058012 -2.229023 0.0276
D03 0.053771 0.044511 1.208050 0.2293
D09 0.015149 0.045072 0.336101 0.7374
D0701 0.329713 0.040087 8.224941 0.0000
D0906 0.204683 0.048751 4.198515 0.0001
D0907 -0.122103 0.056093 -2.176785 0.0314
D0908 -0.165292 0.048676 -3.395764 0.0009
D09ON -0.052091 0.048234 -1.079973 0.2823
FEB 0.029957 0.014692 2.038996 0.0436
MAR 0.044468 0.019530 2.276947 0.0245
APR 0.021877 0.022885 0.955949 0.3410
MAY 0.032131 0.024996 1.285444 0.2010
JUN 0.053669 0.026531 2.022852 0.0452
JUL 0.046251 0.027120 1.705407 0.0906
AUG 0.043783 0.026844 1.631034 0.1054
SEP 0.023319 0.025655 0.908946 0.3651
OCT 0.015512 0.023977 0.646968 0.5188
NOV 0.043407 0.021250 2.042698 0.0432
DEC 0.002051 0.016865 0.121594 0.9034
AR(1) 0.839949 0.052171 16.09998 0.0000 R-squared 0.842429 Mean dependent var 0.370373
Adjusted R-squared 0.815743 S.D. dependent var 0.116217
S.E. of regression 0.049887 Akaike info criterion -3.020087
Sum squared resid 0.308595 Schwarz criterion -2.570502
Log likelihood 242.4663 Hannan-Quinn criter. -2.837410
F-statistic 31.56881 Durbin-Watson stat 2.131058
Prob(F-statistic) 0.000000 Inverted AR Roots .84

January 2014
U.S. Energy Information Administration | STEO Model Documentation: Electricity Generation and Fuel Consumption Models 87
Table 30 – SOEP_WE, solar generation by electric power sector, West region
Dependent Variable: SOEP_WE/(24*(SOEPCAP_WE+SOEPCAP_WE_A)
/1000)
Method: Least Squares
Date: 08/12/13 Time: 08:56
Sample (adjusted): 2001M02 2013M03
Included observations: 146 after adjustments
Convergence achieved after 6 iterations Variable Coefficient Std. Error t-Statistic Prob. C 0.027028 0.009758 2.769852 0.0064
FEB 0.044139 0.009430 4.680834 0.0000
MAR 0.123029 0.011404 10.78850 0.0000
APR 0.173687 0.012420 13.98487 0.0000
MAY 0.231432 0.012795 18.08748 0.0000
JUN 0.276838 0.012939 21.39578 0.0000
JUL 0.236783 0.012978 18.24566 0.0000
AUG 0.228400 0.012942 17.64773 0.0000
SEP 0.184969 0.012808 14.44119 0.0000
OCT 0.098556 0.012480 7.897210 0.0000
NOV 0.043974 0.011701 3.758072 0.0003
DEC -0.000646 0.009735 -0.066370 0.9472
D10ON 0.056463 0.009448 5.976094 0.0000
AR(1) 0.448027 0.078937 5.675769 0.0000 R-squared 0.928067 Mean dependent var 0.177836
Adjusted R-squared 0.920983 S.D. dependent var 0.101746
S.E. of regression 0.028601 Akaike info criterion -4.179785
Sum squared resid 0.107977 Schwarz criterion -3.893686
Log likelihood 319.1243 Hannan-Quinn criter. -4.063537
F-statistic 131.0037 Durbin-Watson stat 2.110263
Prob(F-statistic) 0.000000 Inverted AR Roots .45

January 2014
U.S. Energy Information Administration | STEO Model Documentation: Electricity Generation and Fuel Consumption Models 88
Table 31 – GEEP_WE, geothermal generation by electric power sector, West region
Dependent Variable: GEEP_WE/(24*GEEPCAP_WE/1000)
Method: Least Squares
Date: 08/12/13 Time: 08:57
Sample (adjusted): 2001M02 2013M03
Included observations: 146 after adjustments
Convergence achieved after 4 iterations Variable Coefficient Std. Error t-Statistic Prob. C 0.764826 0.008762 87.29087 0.0000
FEB -0.012617 0.006418 -1.965968 0.0514
MAR -0.016818 0.008306 -2.024847 0.0449
APR -0.038290 0.009495 -4.032611 0.0001
MAY -0.040893 0.010145 -4.031051 0.0001
JUN -0.018192 0.010477 -1.736306 0.0848
JUL -0.016381 0.010587 -1.547364 0.1242
AUG -0.020269 0.010501 -1.930149 0.0557
SEP -0.019014 0.010204 -1.863415 0.0646
OCT -0.026072 0.009624 -2.708977 0.0076
NOV -0.017607 0.008598 -2.047838 0.0426
DEC -0.008116 0.006705 -1.210599 0.2282
D11ON -0.012644 0.011884 -1.064037 0.2893
AR(1) 0.669276 0.064524 10.37244 0.0000 R-squared 0.538810 Mean dependent var 0.742678
Adjusted R-squared 0.493390 S.D. dependent var 0.029548
S.E. of regression 0.021031 Akaike info criterion -4.794626
Sum squared resid 0.058386 Schwarz criterion -4.508527
Log likelihood 364.0077 Hannan-Quinn criter. -4.678377
F-statistic 11.86277 Durbin-Watson stat 2.097827
Prob(F-statistic) 0.000000 Inverted AR Roots .67

January 2014
U.S. Energy Information Administration | STEO Model Documentation: Electricity Generation and Fuel Consumption Models 89
Table 32 – HPEP_MW, pumped storage hydroelectric generation by electric power sector, Midwest region
Dependent Variable: HPEP_MW
Method: Least Squares
Date: 08/12/13 Time: 10:41
Sample: 2001M01 2013M03
Included observations: 147 Variable Coefficient Std. Error t-Statistic Prob. C -0.115381 0.288076 -0.400520 0.6894
HPEP_MW(-1) 0.829503 0.061808 13.42066 0.0000
D(HPEP_MW(-1),0,12) -0.147653 0.064505 -2.289002 0.0237
FEB -0.189808 0.339728 -0.558705 0.5773
MAR 0.147580 0.339906 0.434178 0.6649
APR 0.045019 0.348498 0.129180 0.8974
MAY -0.114301 0.350026 -0.326549 0.7445
JUN -0.642190 0.350541 -1.831994 0.0692
JUL -0.990477 0.347151 -2.853162 0.0050
AUG -1.034685 0.346700 -2.984384 0.0034
SEP 0.728514 0.351365 2.073387 0.0401
OCT 0.043427 0.346486 0.125334 0.9004
NOV -0.430360 0.347646 -1.237927 0.2179
DEC -0.482009 0.346825 -1.389777 0.1669 R-squared 0.653627 Mean dependent var -2.247980
Adjusted R-squared 0.619771 S.D. dependent var 1.402550
S.E. of regression 0.864850 Akaike info criterion 2.637872
Sum squared resid 99.47950 Schwarz criterion 2.922675
Log likelihood -179.8836 Hannan-Quinn criter. 2.753591
F-statistic 19.30609 Durbin-Watson stat 2.380077
Prob(F-statistic) 0.000000

January 2014
U.S. Energy Information Administration | STEO Model Documentation: Electricity Generation and Fuel Consumption Models 90
Table 33 – HPEP_NE, pumped storage hydroelectric generation by electric power sector, Northeast region
Dependent Variable: HPEP_NE
Method: Least Squares
Date: 08/12/13 Time: 10:42
Sample: 2001M01 2013M03
Included observations: 147 Variable Coefficient Std. Error t-Statistic Prob. C -0.766407 0.373033 -2.054531 0.0421
HPEP_NE(-1) 0.826924 0.050988 16.21809 0.0000
D(HPEP_NE(-1),0,12) -0.242613 0.048864 -4.965026 0.0000
FEB 0.280962 0.335701 0.836942 0.4043
MAR -0.097845 0.332027 -0.294690 0.7687
APR 0.069334 0.344197 0.201437 0.8407
MAY -0.703544 0.353924 -1.987840 0.0491
JUN -1.020824 0.351358 -2.905371 0.0044
JUL -0.540563 0.344382 -1.569663 0.1191
AUG -0.070116 0.347244 -0.201923 0.8403
SEP 0.401850 0.337726 1.189871 0.2364
OCT 0.274039 0.342710 0.799623 0.4255
NOV 0.302271 0.335070 0.902112 0.3688
DEC -0.330134 0.335276 -0.984664 0.3267
D02 -0.479178 0.258489 -1.853762 0.0662
D0710 -4.887847 0.864063 -5.656819 0.0000
D0804 5.168114 0.859364 6.013886 0.0000
D0805 -3.337755 0.895041 -3.729164 0.0003
D0806 6.990059 0.862266 8.106617 0.0000
D0807 -10.40656 0.928490 -11.20805 0.0000
D0808 3.662276 0.933414 3.923529 0.0001
D1005 0.536393 0.860994 0.622993 0.5345
D1006 1.224520 0.861395 1.421554 0.1577
D1101 5.389136 0.855028 6.302876 0.0000
D1102 2.154134 0.920358 2.340539 0.0209 R-squared 0.852760 Mean dependent var -5.545595
Adjusted R-squared 0.823794 S.D. dependent var 1.954633
S.E. of regression 0.820494 Akaike info criterion 2.595903
Sum squared resid 82.13160 Schwarz criterion 3.104480
Log likelihood -165.7989 Hannan-Quinn criter. 2.802544
F-statistic 29.44071 Durbin-Watson stat 2.376816
Prob(F-statistic) 0.000000

January 2014
U.S. Energy Information Administration | STEO Model Documentation: Electricity Generation and Fuel Consumption Models 91
Table 34 – HPEP_SO, pumped storage hydroelectric generation by electric power sector, South region
Dependent Variable: HPEP_SO
Method: Least Squares
Date: 08/12/13 Time: 10:42
Sample: 2001M01 2013M03
Included observations: 147 Variable Coefficient Std. Error t-Statistic Prob. C -2.988478 0.862786 -3.463753 0.0007
HPEP_SO(-1) 0.651254 0.086828 7.500547 0.0000
D(HPEP_SO(-1),0,12) -0.032117 0.063024 -0.509594 0.6112
FEB 0.027504 0.663067 0.041480 0.9670
MAR 0.189651 0.647581 0.292861 0.7701
APR -0.394590 0.660082 -0.597789 0.5510
MAY -1.552484 0.661772 -2.345949 0.0205
JUN -3.533769 0.680350 -5.194049 0.0000
JUL -2.548192 0.783311 -3.253105 0.0015
AUG -1.476450 0.827739 -1.783715 0.0768
SEP -0.761527 0.802574 -0.948856 0.3444
OCT 2.039400 0.756233 2.696786 0.0079
NOV 0.187237 0.663992 0.281987 0.7784
DEC 0.534832 0.660974 0.809157 0.4199
D0801 -7.700480 1.692753 -4.549086 0.0000
D1002 4.927516 1.689527 2.916506 0.0042 R-squared 0.751843 Mean dependent var -10.35055
Adjusted R-squared 0.723428 S.D. dependent var 3.073865
S.E. of regression 1.616550 Akaike info criterion 3.900917
Sum squared resid 342.3337 Schwarz criterion 4.226407
Log likelihood -270.7174 Hannan-Quinn criter. 4.033167
F-statistic 26.45939 Durbin-Watson stat 2.115597
Prob(F-statistic) 0.000000
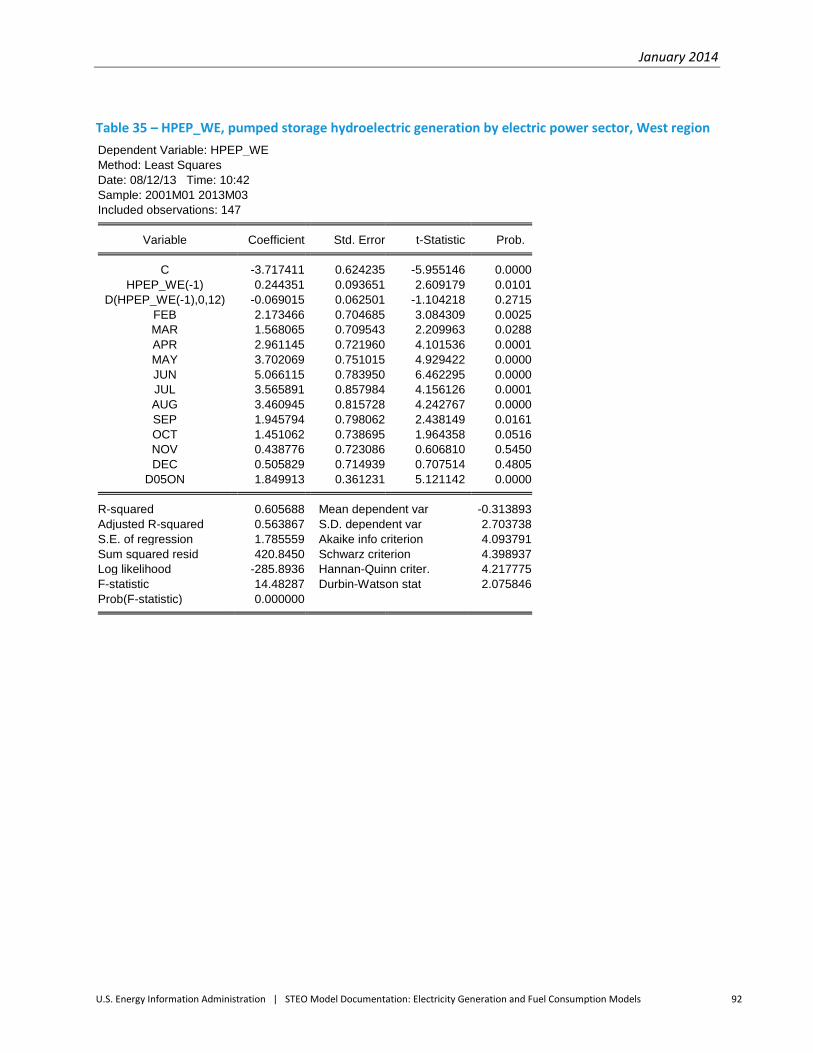
January 2014
U.S. Energy Information Administration | STEO Model Documentation: Electricity Generation and Fuel Consumption Models 92
Table 35 – HPEP_WE, pumped storage hydroelectric generation by electric power sector, West region
Dependent Variable: HPEP_WE
Method: Least Squares
Date: 08/12/13 Time: 10:42
Sample: 2001M01 2013M03
Included observations: 147 Variable Coefficient Std. Error t-Statistic Prob. C -3.717411 0.624235 -5.955146 0.0000
HPEP_WE(-1) 0.244351 0.093651 2.609179 0.0101
D(HPEP_WE(-1),0,12) -0.069015 0.062501 -1.104218 0.2715
FEB 2.173466 0.704685 3.084309 0.0025
MAR 1.568065 0.709543 2.209963 0.0288
APR 2.961145 0.721960 4.101536 0.0001
MAY 3.702069 0.751015 4.929422 0.0000
JUN 5.066115 0.783950 6.462295 0.0000
JUL 3.565891 0.857984 4.156126 0.0001
AUG 3.460945 0.815728 4.242767 0.0000
SEP 1.945794 0.798062 2.438149 0.0161
OCT 1.451062 0.738695 1.964358 0.0516
NOV 0.438776 0.723086 0.606810 0.5450
DEC 0.505829 0.714939 0.707514 0.4805
D05ON 1.849913 0.361231 5.121142 0.0000 R-squared 0.605688 Mean dependent var -0.313893
Adjusted R-squared 0.563867 S.D. dependent var 2.703738
S.E. of regression 1.785559 Akaike info criterion 4.093791
Sum squared resid 420.8450 Schwarz criterion 4.398937
Log likelihood -285.8936 Hannan-Quinn criter. 4.217775
F-statistic 14.48287 Durbin-Watson stat 2.075846
Prob(F-statistic) 0.000000

January 2014
U.S. Energy Information Administration | STEO Model Documentation: Electricity Generation and Fuel Consumption Models 93
Table 36 – NGEP_MW, natural gas generation by electric power sector, Midwest region
Dependent Variable: D((NGEP_MW/FFEP_MW),0,12)
Method: Least Squares
Date: 08/12/13 Time: 12:03
Sample (adjusted): 2003M01 2013M03
Included observations: 123 after adjustments
Convergence achieved after 13 iterations Variable Coefficient Std. Error t-Statistic Prob. C -0.001965 0.001902 -1.033425 0.3037
D(ZWCD_MW,0,12) 0.000350 2.93E-05 11.94499 0.0000
D(ZWHD_MW,0,12) 3.12E-05 1.02E-05 3.063495 0.0028
D(ZWCD_MW(-1),0,12) 3.63E-05 2.57E-05 1.415617 0.1597
D(ZWHD_MW(-1),0,12) 7.37E-06 9.60E-06 0.767485 0.4444
D((CLEUDUS/NGEUDUS),0,12) 0.028441 0.022176 1.282519 0.2024
D((RFEUDUS/NGEUDUS),0,12) 0.022504 0.002252 9.992251 0.0000
D((NUEP_MW/EPEO_MW),0,12) -0.186226 0.091936 -2.025597 0.0452
D((HYEP_MW/EPEO_MW),0,12) -1.207692 0.488528 -2.472103 0.0150
D((RNEP_MW/EPEO_MW),0,12) -0.344297 0.190526 -1.807087 0.0735 D(NGEPCAP_MW/(NGEPCAP_MW+CLEPC
AP_MW),0,12) 0.071681 0.083002 0.863612 0.3897
AR(1) 0.415312 0.076873 5.402574 0.0000
AR(12) -0.401290 0.079086 -5.074088 0.0000 R-squared 0.892142 Mean dependent var 0.008333
Adjusted R-squared 0.880376 S.D. dependent var 0.032073
S.E. of regression 0.011093 Akaike info criterion -6.065350
Sum squared resid 0.013536 Schwarz criterion -5.768127
Log likelihood 386.0190 Hannan-Quinn criter. -5.944619
F-statistic 75.82172 Durbin-Watson stat 1.922569
Prob(F-statistic) 0.000000 Inverted AR Roots .94-.24i .94+.24i .69-.65i .69+.65i
.27+.89i .27-.89i -.21+.89i -.21-.89i
-.63-.65i -.63+.65i -.87+.24i -.87-.24i
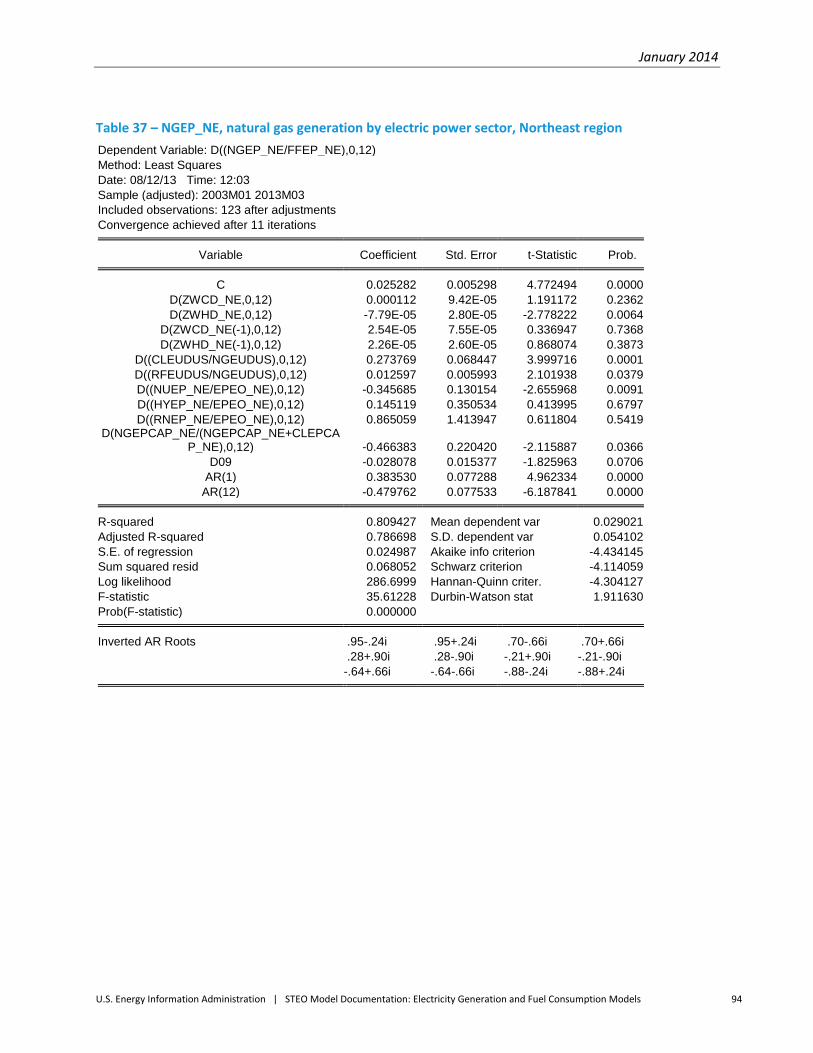
January 2014
U.S. Energy Information Administration | STEO Model Documentation: Electricity Generation and Fuel Consumption Models 94
Table 37 – NGEP_NE, natural gas generation by electric power sector, Northeast region
Dependent Variable: D((NGEP_NE/FFEP_NE),0,12)
Method: Least Squares
Date: 08/12/13 Time: 12:03
Sample (adjusted): 2003M01 2013M03
Included observations: 123 after adjustments
Convergence achieved after 11 iterations Variable Coefficient Std. Error t-Statistic Prob. C 0.025282 0.005298 4.772494 0.0000
D(ZWCD_NE,0,12) 0.000112 9.42E-05 1.191172 0.2362
D(ZWHD_NE,0,12) -7.79E-05 2.80E-05 -2.778222 0.0064
D(ZWCD_NE(-1),0,12) 2.54E-05 7.55E-05 0.336947 0.7368
D(ZWHD_NE(-1),0,12) 2.26E-05 2.60E-05 0.868074 0.3873
D((CLEUDUS/NGEUDUS),0,12) 0.273769 0.068447 3.999716 0.0001
D((RFEUDUS/NGEUDUS),0,12) 0.012597 0.005993 2.101938 0.0379
D((NUEP_NE/EPEO_NE),0,12) -0.345685 0.130154 -2.655968 0.0091
D((HYEP_NE/EPEO_NE),0,12) 0.145119 0.350534 0.413995 0.6797
D((RNEP_NE/EPEO_NE),0,12) 0.865059 1.413947 0.611804 0.5419 D(NGEPCAP_NE/(NGEPCAP_NE+CLEPCA
P_NE),0,12) -0.466383 0.220420 -2.115887 0.0366
D09 -0.028078 0.015377 -1.825963 0.0706
AR(1) 0.383530 0.077288 4.962334 0.0000
AR(12) -0.479762 0.077533 -6.187841 0.0000 R-squared 0.809427 Mean dependent var 0.029021
Adjusted R-squared 0.786698 S.D. dependent var 0.054102
S.E. of regression 0.024987 Akaike info criterion -4.434145
Sum squared resid 0.068052 Schwarz criterion -4.114059
Log likelihood 286.6999 Hannan-Quinn criter. -4.304127
F-statistic 35.61228 Durbin-Watson stat 1.911630
Prob(F-statistic) 0.000000 Inverted AR Roots .95-.24i .95+.24i .70-.66i .70+.66i
.28+.90i .28-.90i -.21+.90i -.21-.90i
-.64+.66i -.64-.66i -.88-.24i -.88+.24i
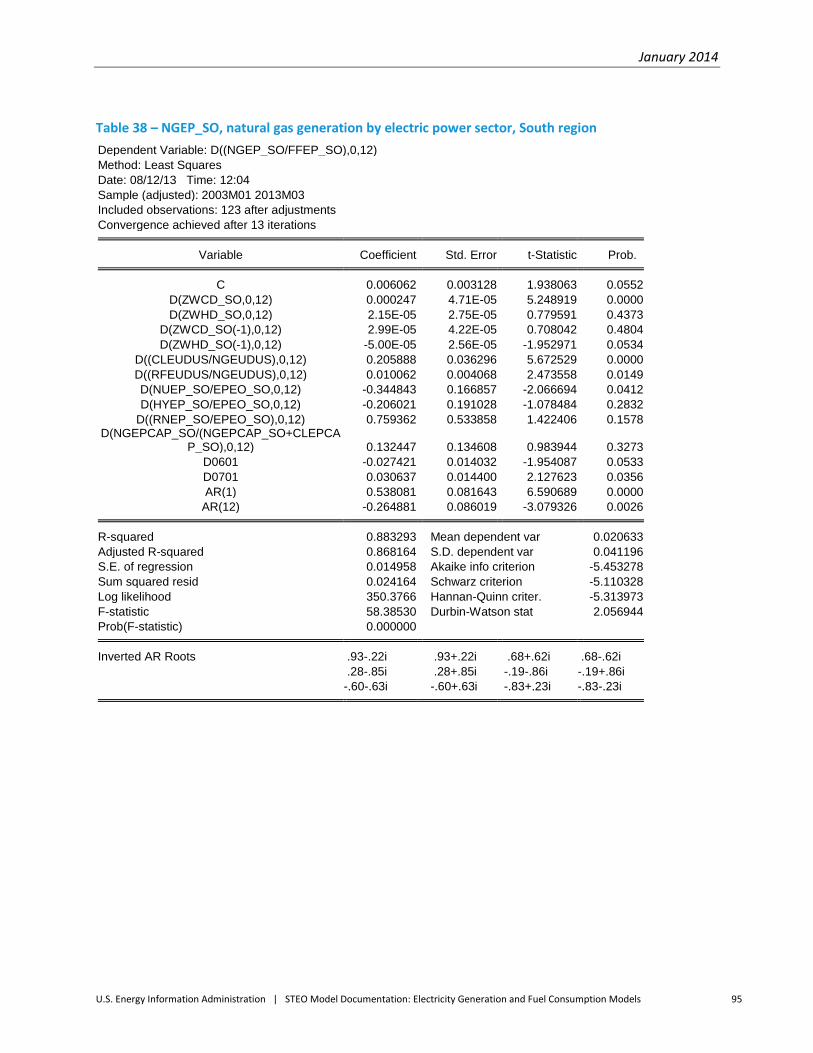
January 2014
U.S. Energy Information Administration | STEO Model Documentation: Electricity Generation and Fuel Consumption Models 95
Table 38 – NGEP_SO, natural gas generation by electric power sector, South region
Dependent Variable: D((NGEP_SO/FFEP_SO),0,12)
Method: Least Squares
Date: 08/12/13 Time: 12:04
Sample (adjusted): 2003M01 2013M03
Included observations: 123 after adjustments
Convergence achieved after 13 iterations Variable Coefficient Std. Error t-Statistic Prob. C 0.006062 0.003128 1.938063 0.0552
D(ZWCD_SO,0,12) 0.000247 4.71E-05 5.248919 0.0000
D(ZWHD_SO,0,12) 2.15E-05 2.75E-05 0.779591 0.4373
D(ZWCD_SO(-1),0,12) 2.99E-05 4.22E-05 0.708042 0.4804
D(ZWHD_SO(-1),0,12) -5.00E-05 2.56E-05 -1.952971 0.0534
D((CLEUDUS/NGEUDUS),0,12) 0.205888 0.036296 5.672529 0.0000
D((RFEUDUS/NGEUDUS),0,12) 0.010062 0.004068 2.473558 0.0149
D(NUEP_SO/EPEO_SO,0,12) -0.344843 0.166857 -2.066694 0.0412
D(HYEP_SO/EPEO_SO,0,12) -0.206021 0.191028 -1.078484 0.2832
D((RNEP_SO/EPEO_SO),0,12) 0.759362 0.533858 1.422406 0.1578 D(NGEPCAP_SO/(NGEPCAP_SO+CLEPCA
P_SO),0,12) 0.132447 0.134608 0.983944 0.3273
D0601 -0.027421 0.014032 -1.954087 0.0533
D0701 0.030637 0.014400 2.127623 0.0356
AR(1) 0.538081 0.081643 6.590689 0.0000
AR(12) -0.264881 0.086019 -3.079326 0.0026 R-squared 0.883293 Mean dependent var 0.020633
Adjusted R-squared 0.868164 S.D. dependent var 0.041196
S.E. of regression 0.014958 Akaike info criterion -5.453278
Sum squared resid 0.024164 Schwarz criterion -5.110328
Log likelihood 350.3766 Hannan-Quinn criter. -5.313973
F-statistic 58.38530 Durbin-Watson stat 2.056944
Prob(F-statistic) 0.000000 Inverted AR Roots .93-.22i .93+.22i .68+.62i .68-.62i
.28-.85i .28+.85i -.19-.86i -.19+.86i
-.60-.63i -.60+.63i -.83+.23i -.83-.23i

January 2014
U.S. Energy Information Administration | STEO Model Documentation: Electricity Generation and Fuel Consumption Models 96
Table 39 – NGEP_WE, natural gas generation by electric power sector, West region
Dependent Variable: D((NGEP_WE/FFEP_WE),0,12)
Method: Least Squares
Date: 08/12/13 Time: 12:04
Sample: 2001M01 2013M03
Included observations: 147
Convergence achieved after 10 iterations Variable Coefficient Std. Error t-Statistic Prob. C 0.003429 0.004636 0.739639 0.4608
D(ZWCD_WE,0,12) 0.000541 8.51E-05 6.355940 0.0000
D(ZWHD_WE,0,12) 0.000107 2.83E-05 3.778125 0.0002
D(ZWCD_WE(-1),0,12) 9.28E-05 8.15E-05 1.137697 0.2573
D(ZWHD_WE(-1),0,12) -3.45E-05 2.80E-05 -1.232512 0.2199
D((CLEUDUS/NGEUDUS),0,12) 0.084540 0.048907 1.728567 0.0862
D((RFEUDUS/NGEUDUS),0,12) 0.009479 0.006260 1.514335 0.1323
D((NUEP_WE/EPEO_WE),0,12) -0.740835 0.139689 -5.303466 0.0000
D((HYEP_WE/EPEO_WE),0,12) -0.499410 0.055558 -8.989037 0.0000
D((RNEP_WE/EPEO_WE),0,12) -0.590011 0.312563 -1.887657 0.0613
D0206 0.037658 0.017230 2.185655 0.0306
D0306 -0.057049 0.016617 -3.433294 0.0008
D0607 -0.045853 0.016807 -2.728157 0.0072
AR(1) 0.720228 0.061773 11.65923 0.0000
AR(12) -0.133238 0.061219 -2.176410 0.0313 R-squared 0.857994 Mean dependent var 0.010378
Adjusted R-squared 0.842933 S.D. dependent var 0.050359
S.E. of regression 0.019958 Akaike info criterion -4.893901
Sum squared resid 0.052580 Schwarz criterion -4.588755
Log likelihood 374.7017 Hannan-Quinn criter. -4.769917
F-statistic 56.96708 Durbin-Watson stat 2.090850
Prob(F-statistic) 0.000000 Inverted AR Roots .91+.20i .91-.20i .67-.57i .67+.57i
.27+.79i .27-.79i -.17-.80i -.17+.80i
-.55+.59i -.55-.59i -.77+.22i -.77-.22i

January 2014
U.S. Energy Information Administration | STEO Model Documentation: Electricity Generation and Fuel Consumption Models 97
Table 40 – RFEP_MW, residual fuel oil generation by electric power sector, Midwest region
Dependent Variable: RFEP_MW/FFEP_MW
Method: Least Squares
Date: 08/12/13 Time: 12:22
Sample: 2006M01 2013M03
Included observations: 87 Variable Coefficient Std. Error t-Statistic Prob. C 0.000402 0.000212 1.900314 0.0612
ZWCD_MW 6.61E-07 2.09E-07 3.170327 0.0022
ZWHD_MW -8.59E-08 6.07E-08 -1.415713 0.1609
ZWCD_MW(-1) -2.46E-07 2.04E-07 -1.204549 0.2321
ZWHD_MW(-1) 1.31E-08 6.01E-08 0.218455 0.8277
NGEUDUS 1.74E-05 9.75E-06 1.784073 0.0784
CLEUDUS -0.000160 9.82E-05 -1.625200 0.1083
RFEUDUS -1.82E-06 4.37E-06 -0.416446 0.6783
D0702 0.001355 0.000132 10.22504 0.0000
D0708 0.000571 0.000134 4.253731 0.0001
D0710 0.000516 0.000132 3.917066 0.0002 R-squared 0.754235 Mean dependent var 0.000159
Adjusted R-squared 0.721898 S.D. dependent var 0.000242
S.E. of regression 0.000127 Akaike info criterion -14.98036
Sum squared resid 1.23E-06 Schwarz criterion -14.66858
Log likelihood 662.6457 Hannan-Quinn criter. -14.85482
F-statistic 23.32387 Durbin-Watson stat 1.993851
Prob(F-statistic) 0.000000

January 2014
U.S. Energy Information Administration | STEO Model Documentation: Electricity Generation and Fuel Consumption Models 98
Table 41 – RFEP_NE, residual fuel oil generation by electric power sector, Northeast region
Dependent Variable: D((RFEP_NE/FFEP_NE),0,12)
Method: Least Squares
Date: 08/12/13 Time: 12:23
Sample: 2001M01 2013M03
Included observations: 147
Convergence achieved after 8 iterations Variable Coefficient Std. Error t-Statistic Prob. C -0.006346 0.002645 -2.398790 0.0178
D(ZWCD_NE,0,12) 0.000191 5.29E-05 3.617347 0.0004
D(ZWHD_NE,0,12) 0.000117 1.86E-05 6.280357 0.0000
D(ZWCD_NE(-1),0,12) -1.99E-05 5.30E-05 -0.375240 0.7081
D(ZWHD_NE(-1),0,12) -1.65E-05 1.90E-05 -0.867549 0.3871
D((NGEUDUS/RFEUDUS),0,12) 0.090202 0.012356 7.300076 0.0000
D((CLEUDUS/RFEUDUS),0,12) -0.127150 0.052774 -2.409337 0.0173
AR(1) 0.495402 0.068891 7.191081 0.0000
AR(12) -0.257444 0.059241 -4.345741 0.0000 R-squared 0.808387 Mean dependent var -0.009767
Adjusted R-squared 0.797279 S.D. dependent var 0.047206
S.E. of regression 0.021254 Akaike info criterion -4.805251
Sum squared resid 0.062340 Schwarz criterion -4.622163
Log likelihood 362.1859 Hannan-Quinn criter. -4.730860
F-statistic 72.77507 Durbin-Watson stat 1.973505
Prob(F-statistic) 0.000000 Inverted AR Roots .92+.23i .92-.23i .68+.62i .68-.62i
.27-.85i .27+.85i -.19+.85i -.19-.85i
-.60-.63i -.60+.63i -.83-.23i -.83+.23i

January 2014
U.S. Energy Information Administration | STEO Model Documentation: Electricity Generation and Fuel Consumption Models 99
Table 42 – RFEP_SO, residual fuel oil generation by electric power sector, South region
Dependent Variable: D((RFEP_SO/FFEP_SO),0,12)
Method: Least Squares
Date: 08/12/13 Time: 12:23
Sample: 2001M01 2013M03
Included observations: 147 Variable Coefficient Std. Error t-Statistic Prob. C -0.000160 0.000515 -0.309729 0.7572
D(ZWCD_SO,0,12) 1.55E-05 1.42E-05 1.095923 0.2750
D(ZWHD_SO,0,12) 9.17E-06 7.31E-06 1.254462 0.2118
D(ZWCD_SO(-1),0,12) -2.26E-05 1.45E-05 -1.556959 0.1218
D(ZWHD_SO(-1),0,12) 4.05E-07 7.97E-06 0.050850 0.9595
D((NGEUDUS/RFEUDUS),0,12) 0.031175 0.002032 15.33848 0.0000
D((CLEUDUS/RFEUDUS),0,12) -0.018273 0.006920 -2.640484 0.0092
D06 -0.007336 0.001799 -4.077626 0.0001 R-squared 0.740539 Mean dependent var -0.002682
Adjusted R-squared 0.727472 S.D. dependent var 0.011066
S.E. of regression 0.005777 Akaike info criterion -7.417082
Sum squared resid 0.004638 Schwarz criterion -7.254338
Log likelihood 553.1555 Hannan-Quinn criter. -7.350957
F-statistic 56.67502 Durbin-Watson stat 1.061072
Prob(F-statistic) 0.000000
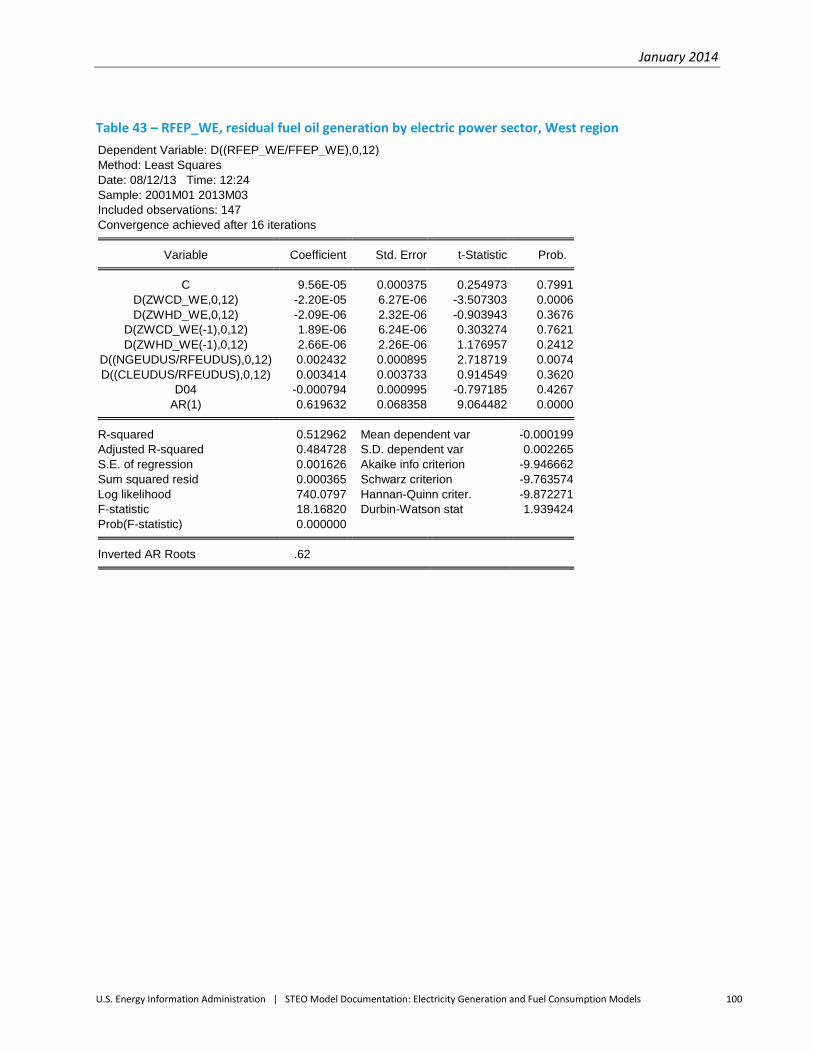
January 2014
U.S. Energy Information Administration | STEO Model Documentation: Electricity Generation and Fuel Consumption Models 100
Table 43 – RFEP_WE, residual fuel oil generation by electric power sector, West region
Dependent Variable: D((RFEP_WE/FFEP_WE),0,12)
Method: Least Squares
Date: 08/12/13 Time: 12:24
Sample: 2001M01 2013M03
Included observations: 147
Convergence achieved after 16 iterations Variable Coefficient Std. Error t-Statistic Prob. C 9.56E-05 0.000375 0.254973 0.7991
D(ZWCD_WE,0,12) -2.20E-05 6.27E-06 -3.507303 0.0006
D(ZWHD_WE,0,12) -2.09E-06 2.32E-06 -0.903943 0.3676
D(ZWCD_WE(-1),0,12) 1.89E-06 6.24E-06 0.303274 0.7621
D(ZWHD_WE(-1),0,12) 2.66E-06 2.26E-06 1.176957 0.2412
D((NGEUDUS/RFEUDUS),0,12) 0.002432 0.000895 2.718719 0.0074
D((CLEUDUS/RFEUDUS),0,12) 0.003414 0.003733 0.914549 0.3620
D04 -0.000794 0.000995 -0.797185 0.4267
AR(1) 0.619632 0.068358 9.064482 0.0000 R-squared 0.512962 Mean dependent var -0.000199
Adjusted R-squared 0.484728 S.D. dependent var 0.002265
S.E. of regression 0.001626 Akaike info criterion -9.946662
Sum squared resid 0.000365 Schwarz criterion -9.763574
Log likelihood 740.0797 Hannan-Quinn criter. -9.872271
F-statistic 18.16820 Durbin-Watson stat 1.939424
Prob(F-statistic) 0.000000 Inverted AR Roots .62

January 2014
U.S. Energy Information Administration | STEO Model Documentation: Electricity Generation and Fuel Consumption Models 101
Table 44 – DKEP_MW, distillate fuel oil generation by electric power sector, Midwest region
Dependent Variable: LOG(DKEP_MW/FFEP_MW)
Method: Least Squares
Date: 08/12/13 Time: 12:47
Sample (adjusted): 2001M02 2013M03
Included observations: 146 after adjustments
Convergence achieved after 8 iterations Variable Coefficient Std. Error t-Statistic Prob. C -6.120545 0.124944 -48.98612 0.0000
ZWCD_MW-ZWCN_MW 0.001063 0.000427 2.487964 0.0142
ZWHD_MW-ZWHN_MW 0.000423 0.000156 2.708764 0.0077
LOG(NGEUDUS) 0.112475 0.073432 1.531680 0.1281
LOG(CLEUDUS) -0.644269 0.195502 -3.295456 0.0013
LOG(RFEUDUS) 0.176297 0.147943 1.191661 0.2357
LOG(DKEUDUS) -0.155642 0.179016 -0.869431 0.3863
FEB -0.239620 0.057710 -4.152157 0.0001
MAR -0.103043 0.060995 -1.689373 0.0937
APR 0.023511 0.063526 0.370100 0.7119
MAY 0.137263 0.063582 2.158830 0.0328
JUN -0.059033 0.063928 -0.923430 0.3576
JUL -0.240547 0.065710 -3.660721 0.0004
AUG -0.240378 0.064452 -3.729566 0.0003
SEP -0.231225 0.064807 -3.567894 0.0005
OCT -0.158421 0.065083 -2.434124 0.0164
NOV -0.113970 0.062413 -1.826052 0.0702
DEC -0.087260 0.057645 -1.513763 0.1326
D0212 -0.270327 0.158001 -1.710917 0.0896
D0302 0.511095 0.158890 3.216667 0.0017
D0702 0.862814 0.163234 5.285736 0.0000
AR(1) 0.216271 0.090261 2.396052 0.0181 R-squared 0.692519 Mean dependent var -6.411220
Adjusted R-squared 0.640446 S.D. dependent var 0.252556
S.E. of regression 0.151440 Akaike info criterion -0.799213
Sum squared resid 2.843815 Schwarz criterion -0.349629
Log likelihood 80.34256 Hannan-Quinn criter. -0.616537
F-statistic 13.29893 Durbin-Watson stat 2.040771
Prob(F-statistic) 0.000000 Inverted AR Roots .22

January 2014
U.S. Energy Information Administration | STEO Model Documentation: Electricity Generation and Fuel Consumption Models 102
Table 45 - DKEP_NE, distillate fuel oil generation by electric power sector, Northeast region
Dependent Variable: LOG(DKEP_NE/FFEP_NE)
Method: Least Squares
Date: 08/12/13 Time: 12:47
Sample (adjusted): 2001M02 2013M03
Included observations: 146 after adjustments
Convergence achieved after 11 iterations Variable Coefficient Std. Error t-Statistic Prob. C -4.276358 0.349525 -12.23477 0.0000
ZWCD_NE-ZWCN_NE 0.004767 0.001148 4.153899 0.0001
ZWHD_NE-ZWHN_NE 0.001523 0.000423 3.598783 0.0005
LOG(NGEUDUS) 0.275141 0.195673 1.406124 0.1622
LOG(CLEUDUS) -1.840511 0.539364 -3.412375 0.0009
LOG(RFEUDUS) -0.242810 0.386541 -0.628161 0.5310
LOG(DKEUDUS) 0.170585 0.459867 0.370945 0.7113
FEB -0.620368 0.120528 -5.147071 0.0000
MAR -0.724824 0.139725 -5.187499 0.0000
APR -0.877364 0.152684 -5.746268 0.0000
MAY -0.679793 0.152392 -4.460829 0.0000
JUN -0.691567 0.153977 -4.491353 0.0000
JUL -0.647202 0.155628 -4.158639 0.0001
AUG -0.682623 0.156735 -4.355267 0.0000
SEP -1.111830 0.156061 -7.124346 0.0000
OCT -0.991853 0.153768 -6.450318 0.0000
NOV -0.932270 0.143652 -6.489803 0.0000
DEC -0.475957 0.121101 -3.930238 0.0001
D0604 1.022678 0.352758 2.899094 0.0044
D0702 0.775176 0.352499 2.199085 0.0297
AR(1) 0.384637 0.087953 4.373210 0.0000 R-squared 0.805576 Mean dependent var -5.617854
Adjusted R-squared 0.774468 S.D. dependent var 0.730771
S.E. of regression 0.347045 Akaike info criterion 0.853653
Sum squared resid 15.05502 Schwarz criterion 1.282802
Log likelihood -41.31668 Hannan-Quinn criter. 1.028026
F-statistic 25.89619 Durbin-Watson stat 1.903612
Prob(F-statistic) 0.000000 Inverted AR Roots .38

January 2014
U.S. Energy Information Administration | STEO Model Documentation: Electricity Generation and Fuel Consumption Models 103
Table 46 – DKEP_SO, distillate fuel oil generation by electric power sector, South region
Dependent Variable: LOG(DKEP_SO/FFEP_SO)
Method: Least Squares
Date: 08/12/13 Time: 12:48
Sample (adjusted): 2001M02 2013M03
Included observations: 146 after adjustments
Convergence achieved after 8 iterations Variable Coefficient Std. Error t-Statistic Prob. C -4.291248 0.304877 -14.07534 0.0000
ZWCD_SO-ZWCN_SO 0.004451 0.001096 4.061857 0.0001
ZWHD_SO-ZWHN_SO 0.002919 0.000596 4.898939 0.0000
LOG(NGEUDUS) 0.503791 0.172549 2.919695 0.0041
LOG(CLEUDUS) -0.645388 0.471189 -1.369702 0.1732
LOG(RFEUDUS) 0.639042 0.344669 1.854073 0.0660
LOG(DKEUDUS) -1.231950 0.418907 -2.940866 0.0039
FEB -0.471296 0.111084 -4.242678 0.0000
MAR -0.462058 0.129297 -3.573632 0.0005
APR -0.508604 0.138064 -3.683818 0.0003
MAY -0.526600 0.139198 -3.783105 0.0002
JUN -0.673416 0.141259 -4.767246 0.0000
JUL -0.734050 0.140560 -5.222337 0.0000
AUG -0.781621 0.142790 -5.473921 0.0000
SEP -0.746596 0.142248 -5.248551 0.0000
OCT -0.636552 0.141010 -4.514215 0.0000
NOV -0.756017 0.132638 -5.699868 0.0000
DEC -0.428997 0.113767 -3.770856 0.0002
AR(1) 0.336792 0.085261 3.950154 0.0001 R-squared 0.733312 Mean dependent var -6.090571
Adjusted R-squared 0.695514 S.D. dependent var 0.581878
S.E. of regression 0.321082 Akaike info criterion 0.686613
Sum squared resid 13.09288 Schwarz criterion 1.074890
Log likelihood -31.12273 Hannan-Quinn criter. 0.844379
F-statistic 19.40065 Durbin-Watson stat 2.078884
Prob(F-statistic) 0.000000 Inverted AR Roots .34

January 2014
U.S. Energy Information Administration | STEO Model Documentation: Electricity Generation and Fuel Consumption Models 104
Table 47 – DKEP_WE, distillate fuel oil generation by electric power sector, West region
Dependent Variable: LOG(DKEP_WE/FFEP_WE)
Method: Least Squares
Date: 08/12/13 Time: 12:48
Sample (adjusted): 2001M02 2013M03
Included observations: 146 after adjustments
Convergence achieved after 8 iterations Variable Coefficient Std. Error t-Statistic Prob. C -4.745233 0.155541 -30.50798 0.0000
ZWCD_WE-ZWCN_WE -0.001102 0.000526 -2.096125 0.0381
ZWHD_WE-ZWHN_WE -0.000580 0.000226 -2.565283 0.0115
LOG(NGEUDUS) -0.200000 0.079310 -2.521748 0.0129
LOG(CLEUDUS) -0.482856 0.250152 -1.930253 0.0558
LOG(RFEUDUS) -0.163507 0.137073 -1.192848 0.2352
LOG(DKEUDUS) 0.183394 0.151225 1.212722 0.2275
FEB -0.077796 0.035563 -2.187547 0.0305
MAR -0.040896 0.045444 -0.899932 0.3699
APR 0.100157 0.051350 1.950478 0.0533
MAY 0.106417 0.053859 1.975867 0.0504
JUN 0.032299 0.055637 0.580528 0.5626
JUL -0.185810 0.056357 -3.297028 0.0013
AUG -0.233136 0.055918 -4.169230 0.0001
SEP -0.210197 0.055568 -3.782680 0.0002
OCT -0.123249 0.053159 -2.318517 0.0220
NOV -0.098975 0.047184 -2.097645 0.0379
DEC -0.078552 0.036576 -2.147646 0.0337
D0301 -0.489765 0.104085 -4.705435 0.0000
AR(1) 0.630935 0.050400 12.51859 0.0000 R-squared 0.827377 Mean dependent var -5.294626
Adjusted R-squared 0.801347 S.D. dependent var 0.247595
S.E. of regression 0.110355 Akaike info criterion -1.443588
Sum squared resid 1.534445 Schwarz criterion -1.034875
Log likelihood 125.3819 Hannan-Quinn criter. -1.277519
F-statistic 31.78503 Durbin-Watson stat 2.112754
Prob(F-statistic) 0.000000 Inverted AR Roots .63

January 2014
U.S. Energy Information Administration | STEO Model Documentation: Electricity Generation and Fuel Consumption Models 105
Table 48 – PCEP_MW, petroleum coke generation by electric power sector, Midwest region
Dependent Variable: PCEP_MW/FFEP_MW
Method: Least Squares
Date: 08/12/13 Time: 13:03
Sample: 2001M01 2013M03
Included observations: 147
Convergence achieved after 8 iterations Variable Coefficient Std. Error t-Statistic Prob. C 0.003741 0.000336 11.12889 0.0000
RFEUDUS -8.01E-05 3.10E-05 -2.586568 0.0108
D01 -0.001376 0.000350 -3.931850 0.0001
D02 -0.001254 0.000349 -3.588921 0.0005
D03 -0.001654 0.000331 -4.999430 0.0000
FEB 0.000183 0.000227 0.808056 0.4205
MAR -2.74E-05 0.000265 -0.103371 0.9178
APR -7.93E-05 0.000283 -0.280462 0.7796
MAY 0.000172 0.000288 0.596697 0.5518
JUN 0.000116 0.000292 0.398475 0.6909
JUL -0.000399 0.000292 -1.366717 0.1741
AUG -0.000116 0.000292 -0.399555 0.6901
SEP 7.46E-05 0.000290 0.256761 0.7978
OCT -0.000321 0.000286 -1.121382 0.2642
NOV -0.000317 0.000272 -1.162650 0.2471
DEC -0.000455 0.000232 -1.961627 0.0520
D11ON 0.001490 0.000390 3.815257 0.0002
AR(1) 0.360450 0.082806 4.352963 0.0000 R-squared 0.571643 Mean dependent var 0.002773
Adjusted R-squared 0.515193 S.D. dependent var 0.000966
S.E. of regression 0.000673 Akaike info criterion -11.65659
Sum squared resid 5.84E-05 Schwarz criterion -11.29042
Log likelihood 874.7596 Hannan-Quinn criter. -11.50781
F-statistic 10.12650 Durbin-Watson stat 1.832652
Prob(F-statistic) 0.000000 Inverted AR Roots .36

January 2014
U.S. Energy Information Administration | STEO Model Documentation: Electricity Generation and Fuel Consumption Models 106
Table 49 – PCEP_NE, petroleum coke generation by electric power sector, Northeast region
Dependent Variable: PCEP_NE/FFEP_NE
Method: Least Squares
Date: 08/12/13 Time: 13:04
Sample: 2001M01 2013M03
Included observations: 147
Convergence achieved after 9 iterations Variable Coefficient Std. Error t-Statistic Prob. C 0.002293 0.000293 7.831229 0.0000
RFEUDUS -9.06E-05 1.84E-05 -4.914395 0.0000
D01 -0.001540 0.000354 -4.345586 0.0000
D05 0.002892 0.000343 8.430192 0.0000
D1103 0.005899 0.000682 8.646284 0.0000
FEB -7.10E-05 0.000234 -0.304143 0.7615
MAR -0.000170 0.000284 -0.599916 0.5496
APR 7.56E-05 0.000302 0.250415 0.8027
MAY -0.000483 0.000310 -1.558493 0.1215
JUN -0.000252 0.000313 -0.804510 0.4226
JUL -0.000165 0.000314 -0.527132 0.5990
AUG -0.000207 0.000313 -0.661845 0.5092
SEP -0.000165 0.000310 -0.531900 0.5957
OCT -0.000241 0.000303 -0.797557 0.4266
NOV -0.000345 0.000284 -1.212506 0.2275
DEC -0.000340 0.000236 -1.439460 0.1524
AR(1) 0.426705 0.080286 5.314828 0.0000 R-squared 0.782775 Mean dependent var 0.001359
Adjusted R-squared 0.756040 S.D. dependent var 0.001437
S.E. of regression 0.000710 Akaike info criterion -11.55477
Sum squared resid 6.55E-05 Schwarz criterion -11.20893
Log likelihood 866.2753 Hannan-Quinn criter. -11.41425
F-statistic 29.27865 Durbin-Watson stat 2.239409
Prob(F-statistic) 0.000000 Inverted AR Roots .43

January 2014
U.S. Energy Information Administration | STEO Model Documentation: Electricity Generation and Fuel Consumption Models 107
Table 50 – PCEP_SO, petroleum coke generation by electric power sector, South region
Dependent Variable: PCEP_SO/FFEP_SO
Method: Least Squares
Date: 08/12/13 Time: 13:04
Sample: 2007M01 2013M03
Included observations: 75
Convergence achieved after 5 iterations Variable Coefficient Std. Error t-Statistic Prob. C 0.008560 0.000764 11.20599 0.0000
RFEUDUS -5.19E-05 5.31E-05 -0.976598 0.3327
FEB -0.000489 0.000476 -1.027981 0.3081
MAR -0.000284 0.000559 -0.508133 0.6132
APR -0.000951 0.000612 -1.553117 0.1257
MAY -0.001550 0.000626 -2.476839 0.0161
JUN -0.001564 0.000637 -2.456072 0.0170
JUL -0.001850 0.000637 -2.901673 0.0052
AUG -0.002185 0.000634 -3.448406 0.0010
SEP -0.001259 0.000632 -1.992436 0.0509
OCT -0.001274 0.000623 -2.046541 0.0451
NOV -0.002052 0.000589 -3.485595 0.0009
DEC -0.001331 0.000496 -2.681369 0.0095
D12ON -0.002206 0.000612 -3.605666 0.0006
AR(1) 0.372473 0.118708 3.137735 0.0026 R-squared 0.674023 Mean dependent var 0.006203
Adjusted R-squared 0.597962 S.D. dependent var 0.001639
S.E. of regression 0.001039 Akaike info criterion -10.72405
Sum squared resid 6.48E-05 Schwarz criterion -10.26056
Log likelihood 417.1520 Hannan-Quinn criter. -10.53898
F-statistic 8.861592 Durbin-Watson stat 1.936484
Prob(F-statistic) 0.000000 Inverted AR Roots .37

January 2014
U.S. Energy Information Administration | STEO Model Documentation: Electricity Generation and Fuel Consumption Models 108
Table 51 – PCEP_WE, petroleum coke generation by electric power sector, West region
Dependent Variable: PCEP_WE/FFEP_WE
Method: Least Squares
Date: 08/12/13 Time: 13:04
Sample: 2001M01 2013M03
Included observations: 147
Convergence achieved after 6 iterations Variable Coefficient Std. Error t-Statistic Prob. C 0.006241 0.000321 19.44858 0.0000
RFEUDUS -0.000193 2.38E-05 -8.101913 0.0000
FEB -1.00E-05 0.000167 -0.059843 0.9524
MAR 0.000464 0.000217 2.132500 0.0348
APR 0.000553 0.000249 2.218313 0.0282
MAY 0.000495 0.000267 1.853941 0.0660
JUN 0.000555 0.000276 2.008278 0.0466
JUL -0.000345 0.000279 -1.238761 0.2176
AUG -0.000714 0.000276 -2.590055 0.0107
SEP -0.000280 0.000267 -1.049907 0.2957
OCT -0.000148 0.000250 -0.591404 0.5553
NOV 1.51E-05 0.000221 0.068428 0.9455
DEC -6.09E-05 0.000168 -0.362767 0.7174
AR(1) 0.695929 0.064353 10.81429 0.0000 R-squared 0.858976 Mean dependent var 0.004425
Adjusted R-squared 0.845192 S.D. dependent var 0.001411
S.E. of regression 0.000555 Akaike info criterion -12.06478
Sum squared resid 4.10E-05 Schwarz criterion -11.77998
Log likelihood 900.7614 Hannan-Quinn criter. -11.94906
F-statistic 62.31565 Durbin-Watson stat 2.076273
Prob(F-statistic) 0.000000 Inverted AR Roots .70
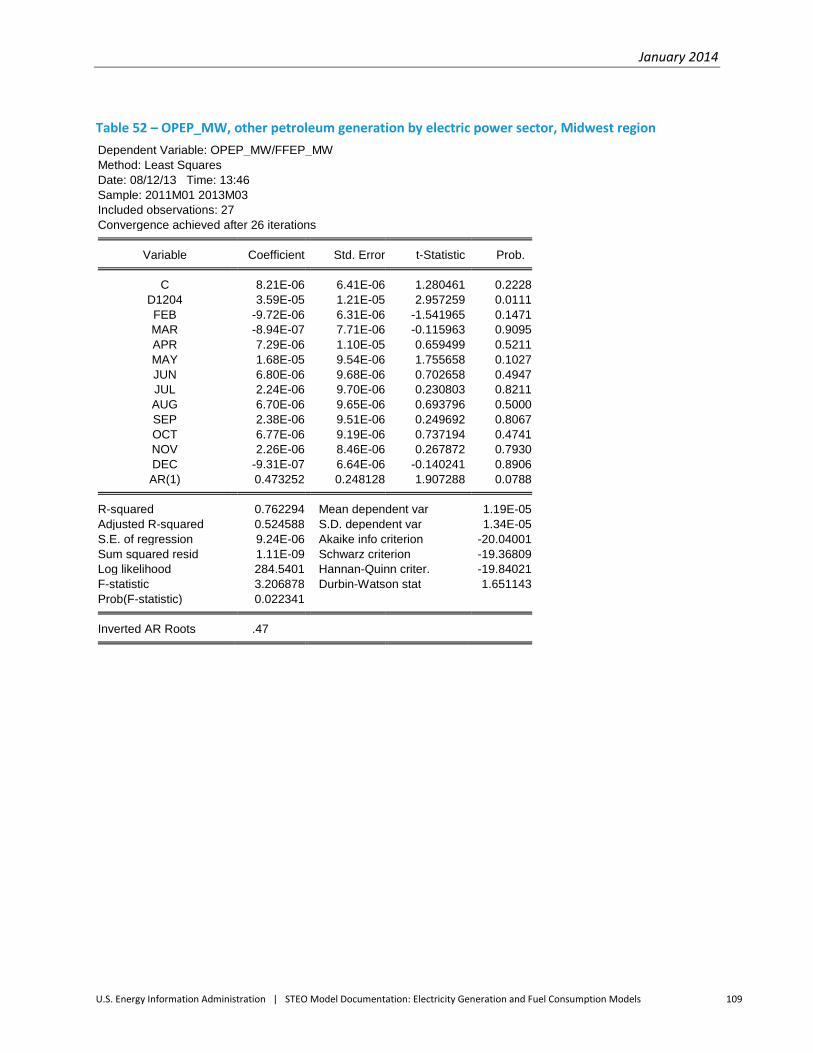
January 2014
U.S. Energy Information Administration | STEO Model Documentation: Electricity Generation and Fuel Consumption Models 109
Table 52 – OPEP_MW, other petroleum generation by electric power sector, Midwest region
Dependent Variable: OPEP_MW/FFEP_MW
Method: Least Squares
Date: 08/12/13 Time: 13:46
Sample: 2011M01 2013M03
Included observations: 27
Convergence achieved after 26 iterations Variable Coefficient Std. Error t-Statistic Prob. C 8.21E-06 6.41E-06 1.280461 0.2228
D1204 3.59E-05 1.21E-05 2.957259 0.0111
FEB -9.72E-06 6.31E-06 -1.541965 0.1471
MAR -8.94E-07 7.71E-06 -0.115963 0.9095
APR 7.29E-06 1.10E-05 0.659499 0.5211
MAY 1.68E-05 9.54E-06 1.755658 0.1027
JUN 6.80E-06 9.68E-06 0.702658 0.4947
JUL 2.24E-06 9.70E-06 0.230803 0.8211
AUG 6.70E-06 9.65E-06 0.693796 0.5000
SEP 2.38E-06 9.51E-06 0.249692 0.8067
OCT 6.77E-06 9.19E-06 0.737194 0.4741
NOV 2.26E-06 8.46E-06 0.267872 0.7930
DEC -9.31E-07 6.64E-06 -0.140241 0.8906
AR(1) 0.473252 0.248128 1.907288 0.0788 R-squared 0.762294 Mean dependent var 1.19E-05
Adjusted R-squared 0.524588 S.D. dependent var 1.34E-05
S.E. of regression 9.24E-06 Akaike info criterion -20.04001
Sum squared resid 1.11E-09 Schwarz criterion -19.36809
Log likelihood 284.5401 Hannan-Quinn criter. -19.84021
F-statistic 3.206878 Durbin-Watson stat 1.651143
Prob(F-statistic) 0.022341 Inverted AR Roots .47

January 2014
U.S. Energy Information Administration | STEO Model Documentation: Electricity Generation and Fuel Consumption Models 110
Table 53 – OPEP_NE, other petroleum generation by electric power sector, Northeast region
Dependent Variable: OPEP_NE/FFEP_NE
Method: Least Squares
Date: 08/12/13 Time: 13:46
Sample: 2001M01 2013M03
Included observations: 147
Convergence achieved after 5 iterations Variable Coefficient Std. Error t-Statistic Prob. C 0.002796 0.000281 9.963990 0.0000
D0401 0.009527 0.000780 12.21959 0.0000
D0702 0.005431 0.000782 6.947942 0.0000
FEB -0.001476 0.000282 -5.225310 0.0000
MAR -0.001696 0.000336 -5.045030 0.0000
APR -0.002222 0.000369 -6.014916 0.0000
MAY -0.002160 0.000384 -5.631024 0.0000
JUN -0.002304 0.000389 -5.916058 0.0000
JUL -0.002072 0.000391 -5.300014 0.0000
AUG -0.002081 0.000389 -5.346222 0.0000
SEP -0.002392 0.000383 -6.241583 0.0000
OCT -0.002466 0.000370 -6.666464 0.0000
NOV -0.002391 0.000342 -6.998906 0.0000
DEC -0.001734 0.000278 -6.247704 0.0000
AR(1) 0.510252 0.075138 6.790877 0.0000 R-squared 0.724077 Mean dependent var 0.000999
Adjusted R-squared 0.694812 S.D. dependent var 0.001521
S.E. of regression 0.000840 Akaike info criterion -11.22879
Sum squared resid 9.32E-05 Schwarz criterion -10.92364
Log likelihood 840.3158 Hannan-Quinn criter. -11.10480
F-statistic 24.74239 Durbin-Watson stat 1.901692
Prob(F-statistic) 0.000000 Inverted AR Roots .51

January 2014
U.S. Energy Information Administration | STEO Model Documentation: Electricity Generation and Fuel Consumption Models 111
Table 54 - OPEP_SO, other petroleum generation by electric power sector, South region
Dependent Variable: OPEP_SO/FFEP_SO
Method: Least Squares
Date: 08/12/13 Time: 13:46
Sample: 2006M01 2013M03
Included observations: 87
Convergence achieved after 3 iterations Variable Coefficient Std. Error t-Statistic Prob. C 7.62E-05 1.56E-05 4.871850 0.0000
FEB -2.82E-05 2.25E-05 -1.250074 0.2152
MAR -5.51E-05 2.16E-05 -2.551466 0.0128
APR -6.21E-05 2.24E-05 -2.771633 0.0071
MAY -6.33E-05 2.24E-05 -2.823106 0.0061
JUN -3.09E-05 2.24E-05 -1.378522 0.1722
JUL -5.18E-05 2.24E-05 -2.311895 0.0236
AUG -5.97E-05 2.24E-05 -2.663708 0.0095
SEP -6.01E-05 2.24E-05 -2.680373 0.0091
OCT -6.74E-05 2.24E-05 -3.005215 0.0036
NOV -4.81E-05 2.24E-05 -2.149838 0.0348
DEC -2.84E-05 2.32E-05 -1.222060 0.2256
AR(1) -0.071643 0.074366 -0.963378 0.3385 R-squared 0.198041 Mean dependent var 3.02E-05
Adjusted R-squared 0.067993 S.D. dependent var 4.39E-05
S.E. of regression 4.24E-05 Akaike info criterion -17.16340
Sum squared resid 1.33E-07 Schwarz criterion -16.79493
Log likelihood 759.6079 Hannan-Quinn criter. -17.01503
F-statistic 1.522836 Durbin-Watson stat 1.793050
Prob(F-statistic) 0.135211 Inverted AR Roots -.07

January 2014
U.S. Energy Information Administration | STEO Model Documentation: Electricity Generation and Fuel Consumption Models 112
Table 55 – OPEP_WE, other petroleum generation by electric power sector, West region
Dependent Variable: OPEP_WE/FFEP_WE
Method: Least Squares
Date: 08/12/13 Time: 13:46
Sample: 2002M01 2013M03
Included observations: 135
Convergence achieved after 7 iterations Variable Coefficient Std. Error t-Statistic Prob. C 0.001904 0.000128 14.87606 0.0000
D0702 -0.000568 0.000292 -1.944891 0.0541
FEB -8.56E-05 0.000108 -0.788931 0.4317
MAR -1.22E-05 0.000135 -0.089739 0.9286
APR 7.69E-05 0.000154 0.499540 0.6183
MAY 5.62E-05 0.000164 0.343887 0.7315
JUN -0.000161 0.000168 -0.957147 0.3404
JUL -0.000376 0.000170 -2.213786 0.0287
AUG -0.000361 0.000168 -2.147119 0.0338
SEP -0.000340 0.000164 -2.080658 0.0396
OCT -0.000254 0.000155 -1.644625 0.1026
NOV -0.000233 0.000138 -1.687076 0.0942
DEC -0.000113 0.000107 -1.060018 0.2912
AR(1) 0.641916 0.063725 10.07323 0.0000 R-squared 0.512618 Mean dependent var 0.001735
Adjusted R-squared 0.460254 S.D. dependent var 0.000451
S.E. of regression 0.000331 Akaike info criterion -13.08991
Sum squared resid 1.33E-05 Schwarz criterion -12.78862
Log likelihood 897.5689 Hannan-Quinn criter. -12.96747
F-statistic 9.789617 Durbin-Watson stat 2.106551
Prob(F-statistic) 0.000000 Inverted AR Roots .64

January 2014
U.S. Energy Information Administration | STEO Model Documentation: Electricity Generation and Fuel Consumption Models 113
Table 56 – OGEP_MW, other fossil gases generation by electric power sector, Midwest region
Dependent Variable: D((OGEP_MW/FFEP_MW),0,12)
Method: Least Squares
Date: 08/13/13 Time: 08:54
Sample: 2005M01 2013M03
Included observations: 99
Convergence achieved after 8 iterations Variable Coefficient Std. Error t-Statistic Prob. C -0.000111 8.96E-05 -1.237839 0.2193
D((NGEP_MW/FFEP_MW),0,12) -0.000308 0.000933 -0.330569 0.7418
FEB 2.13E-05 9.00E-05 0.236884 0.8133
MAR 4.23E-05 0.000110 0.385289 0.7010
APR 2.53E-05 0.000121 0.208918 0.8350
MAY 7.85E-05 0.000129 0.610585 0.5432
JUN 1.61E-05 0.000127 0.126041 0.9000
JUL 2.43E-05 0.000128 0.189692 0.8500
AUG 3.02E-05 0.000127 0.237645 0.8127
SEP 5.36E-05 0.000125 0.427743 0.6700
OCT 5.97E-05 0.000122 0.491166 0.6246
NOV -1.52E-05 0.000120 -0.126332 0.8998
DEC 4.69E-05 9.16E-05 0.511311 0.6105
D0811 -0.000264 0.000226 -1.168349 0.2461
D0905 -0.000526 0.000223 -2.356258 0.0208
D0911 0.000336 0.000225 1.491092 0.1398
AR(1) 0.476945 0.090695 5.258798 0.0000 R-squared 0.353140 Mean dependent var -7.88E-05
Adjusted R-squared 0.226924 S.D. dependent var 0.000263
S.E. of regression 0.000231 Akaike info criterion -13.75079
Sum squared resid 4.39E-06 Schwarz criterion -13.30516
Log likelihood 697.6640 Hannan-Quinn criter. -13.57049
F-statistic 2.797893 Durbin-Watson stat 1.688904
Prob(F-statistic) 0.001238 Inverted AR Roots .48

January 2014
U.S. Energy Information Administration | STEO Model Documentation: Electricity Generation and Fuel Consumption Models 114
Table 57 – OGEP_NE, other fossil gases generation by electric power sector, Northeast region
Dependent Variable: D((OGEP_NE/FFEP_NE),0,12)
Method: Least Squares
Date: 08/13/13 Time: 08:54
Sample: 2001M01 2013M03
Included observations: 147
Convergence achieved after 8 iterations Variable Coefficient Std. Error t-Statistic Prob. C -2.96E-05 3.38E-05 -0.876362 0.3825
D((NGEP_NE/FFEP_NE),0,12) 2.76E-05 0.000142 0.193957 0.8465
D06 3.20E-05 4.46E-05 0.716228 0.4752
D08 0.000244 4.40E-05 5.547690 0.0000
D0203 0.000409 5.04E-05 8.123108 0.0000
D0303 -0.000403 5.04E-05 -8.005815 0.0000
D1001 0.000196 5.07E-05 3.871820 0.0002
FEB 1.27E-05 1.84E-05 0.691987 0.4902
MAR 9.94E-06 2.49E-05 0.399284 0.6903
APR 1.70E-05 2.82E-05 0.604871 0.5463
MAY 1.42E-05 3.05E-05 0.466018 0.6420
JUN 7.45E-06 3.18E-05 0.234116 0.8153
JUL -6.60E-06 3.22E-05 -0.204518 0.8383
AUG 1.40E-05 3.18E-05 0.440980 0.6600
SEP 1.19E-05 3.06E-05 0.388177 0.6985
OCT -6.90E-06 2.83E-05 -0.243867 0.8077
NOV -6.16E-06 2.46E-05 -0.250858 0.8023
DEC -4.81E-06 1.84E-05 -0.261851 0.7939
AR(1) 0.812734 0.053297 15.24926 0.0000 R-squared 0.764600 Mean dependent var 3.35E-06
Adjusted R-squared 0.731497 S.D. dependent var 0.000120
S.E. of regression 6.20E-05 Akaike info criterion -16.41790
Sum squared resid 4.92E-07 Schwarz criterion -16.03138
Log likelihood 1225.716 Hannan-Quinn criter. -16.26086
F-statistic 23.09748 Durbin-Watson stat 1.631577
Prob(F-statistic) 0.000000 Inverted AR Roots .81

January 2014
U.S. Energy Information Administration | STEO Model Documentation: Electricity Generation and Fuel Consumption Models 115
Table 58 – OGEP_SO, other fossil gases generation by electric power sector, South region
Dependent Variable: D((OGEP_SO/FFEP_SO),0,12)
Method: Least Squares
Date: 08/13/13 Time: 08:55
Sample: 2001M01 2013M03
Included observations: 147
Convergence achieved after 8 iterations Variable Coefficient Std. Error t-Statistic Prob. C 0.000153 0.000159 0.968303 0.3347
D((NGEP_SO/FFEP_SO),0,12) -0.000703 0.001132 -0.621306 0.5355
D01 -0.001117 0.000231 -4.831047 0.0000
FEB -2.24E-05 9.90E-05 -0.225941 0.8216
MAR -3.05E-05 0.000131 -0.232960 0.8162
APR -3.02E-05 0.000152 -0.199286 0.8423
MAY -5.52E-05 0.000164 -0.336258 0.7372
JUN -4.60E-05 0.000171 -0.269608 0.7879
JUL -5.88E-05 0.000173 -0.340257 0.7342
AUG -4.99E-05 0.000171 -0.292655 0.7702
SEP -3.25E-05 0.000164 -0.198216 0.8432
OCT -1.63E-05 0.000152 -0.107037 0.9149
NOV -1.61E-05 0.000133 -0.120958 0.9039
DEC 1.15E-05 9.93E-05 0.115815 0.9080
AR(1) 0.766892 0.056573 13.55583 0.0000 R-squared 0.637411 Mean dependent var 2.72E-05
Adjusted R-squared 0.598955 S.D. dependent var 0.000532
S.E. of regression 0.000337 Akaike info criterion -13.05761
Sum squared resid 1.50E-05 Schwarz criterion -12.75247
Log likelihood 974.7344 Hannan-Quinn criter. -12.93363
F-statistic 16.57489 Durbin-Watson stat 2.215525
Prob(F-statistic) 0.000000 Inverted AR Roots .77
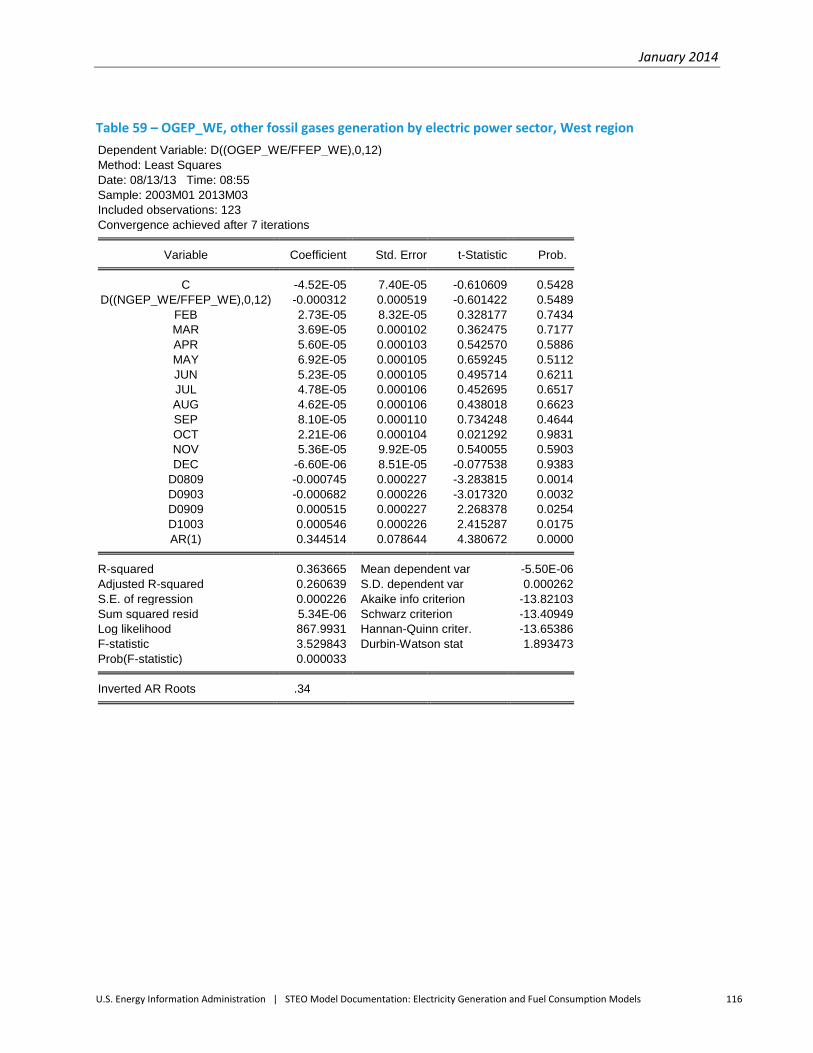
January 2014
U.S. Energy Information Administration | STEO Model Documentation: Electricity Generation and Fuel Consumption Models 116
Table 59 – OGEP_WE, other fossil gases generation by electric power sector, West region
Dependent Variable: D((OGEP_WE/FFEP_WE),0,12)
Method: Least Squares
Date: 08/13/13 Time: 08:55
Sample: 2003M01 2013M03
Included observations: 123
Convergence achieved after 7 iterations Variable Coefficient Std. Error t-Statistic Prob. C -4.52E-05 7.40E-05 -0.610609 0.5428
D((NGEP_WE/FFEP_WE),0,12) -0.000312 0.000519 -0.601422 0.5489
FEB 2.73E-05 8.32E-05 0.328177 0.7434
MAR 3.69E-05 0.000102 0.362475 0.7177
APR 5.60E-05 0.000103 0.542570 0.5886
MAY 6.92E-05 0.000105 0.659245 0.5112
JUN 5.23E-05 0.000105 0.495714 0.6211
JUL 4.78E-05 0.000106 0.452695 0.6517
AUG 4.62E-05 0.000106 0.438018 0.6623
SEP 8.10E-05 0.000110 0.734248 0.4644
OCT 2.21E-06 0.000104 0.021292 0.9831
NOV 5.36E-05 9.92E-05 0.540055 0.5903
DEC -6.60E-06 8.51E-05 -0.077538 0.9383
D0809 -0.000745 0.000227 -3.283815 0.0014
D0903 -0.000682 0.000226 -3.017320 0.0032
D0909 0.000515 0.000227 2.268378 0.0254
D1003 0.000546 0.000226 2.415287 0.0175
AR(1) 0.344514 0.078644 4.380672 0.0000 R-squared 0.363665 Mean dependent var -5.50E-06
Adjusted R-squared 0.260639 S.D. dependent var 0.000262
S.E. of regression 0.000226 Akaike info criterion -13.82103
Sum squared resid 5.34E-06 Schwarz criterion -13.40949
Log likelihood 867.9931 Hannan-Quinn criter. -13.65386
F-statistic 3.529843 Durbin-Watson stat 1.893473
Prob(F-statistic) 0.000033 Inverted AR Roots .34

January 2014
U.S. Energy Information Administration | STEO Model Documentation: Electricity Generation and Fuel Consumption Models 117
Table 60 – OTEP_MW, other fossil fuel generation by electric power sector, Midwest region
Dependent Variable: OTEP_MW/EPEO_MW
Method: Least Squares
Date: 08/13/13 Time: 08:59
Sample: 2001M01 2013M03
Included observations: 147
Convergence achieved after 9 iterations Variable Coefficient Std. Error t-Statistic Prob. C 0.000639 4.07E-05 15.69573 0.0000
D0101 0.000467 6.76E-05 6.909842 0.0000
D0207 0.000961 8.05E-05 11.93190 0.0000
D0208 0.000706 9.22E-05 7.660853 0.0000
D0209 0.000411 8.05E-05 5.101011 0.0000
FEB 3.50E-05 2.44E-05 1.432726 0.1543
MAR 8.98E-05 3.21E-05 2.801251 0.0059
APR 0.000113 3.72E-05 3.046665 0.0028
MAY 0.000155 4.02E-05 3.862447 0.0002
JUN 0.000107 4.18E-05 2.545874 0.0121
JUL 4.57E-06 4.29E-05 0.106656 0.9152
AUG 4.77E-05 4.25E-05 1.121386 0.2642
SEP 8.38E-05 4.07E-05 2.056327 0.0418
OCT 0.000106 3.73E-05 2.841300 0.0052
NOV 9.65E-05 3.25E-05 2.971879 0.0035
DEC 3.42E-05 2.44E-05 1.400897 0.1636
AR(1) 0.790309 0.045100 17.52334 0.0000 R-squared 0.841350 Mean dependent var 0.000709
Adjusted R-squared 0.821824 S.D. dependent var 0.000193
S.E. of regression 8.16E-05 Akaike info criterion -15.88112
Sum squared resid 8.66E-07 Schwarz criterion -15.53529
Log likelihood 1184.263 Hannan-Quinn criter. -15.74061
F-statistic 43.08845 Durbin-Watson stat 2.065258
Prob(F-statistic) 0.000000 Inverted AR Roots .79

January 2014
U.S. Energy Information Administration | STEO Model Documentation: Electricity Generation and Fuel Consumption Models 118
Table 61 – OTEP_NE, other fossil fuel generation by electric power sector, Northeast region
Dependent Variable: OTEP_NE/EPEO_NE
Method: Least Squares
Date: 08/13/13 Time: 09:00
Sample: 2001M01 2013M03
Included observations: 147
Convergence achieved after 4 iterations Variable Coefficient Std. Error t-Statistic Prob. C 0.006448 0.000118 54.53227 0.0000
D02 0.001282 0.000142 9.049778 0.0000
FEB 0.000127 0.000151 0.841301 0.4017
MAR 0.000803 0.000162 4.953144 0.0000
APR 0.001500 0.000167 8.981313 0.0000
MAY 0.001299 0.000167 7.764826 0.0000
JUN 0.000443 0.000167 2.646298 0.0091
JUL -5.81E-05 0.000167 -0.347248 0.7290
AUG -0.000202 0.000167 -1.204038 0.2307
SEP 0.000578 0.000167 3.454337 0.0007
OCT 0.001048 0.000167 6.272677 0.0000
NOV 0.001175 0.000166 7.095947 0.0000
DEC 0.000631 0.000155 4.083522 0.0001
AR(1) 0.145675 0.048901 2.978988 0.0034 R-squared 0.745565 Mean dependent var 0.007150
Adjusted R-squared 0.720695 S.D. dependent var 0.000772
S.E. of regression 0.000408 Akaike info criterion -12.67935
Sum squared resid 2.22E-05 Schwarz criterion -12.39454
Log likelihood 945.9319 Hannan-Quinn criter. -12.56363
F-statistic 29.97894 Durbin-Watson stat 1.222647
Prob(F-statistic) 0.000000 Inverted AR Roots .15

January 2014
U.S. Energy Information Administration | STEO Model Documentation: Electricity Generation and Fuel Consumption Models 119
Table 62 – OTEP_SO, other fossil fuel generation by electric power sector, South region
Dependent Variable: OTEP_SO/EPEO_SO
Method: Least Squares
Date: 08/13/13 Time: 09:00
Sample: 2001M01 2013M03
Included observations: 147
Convergence achieved after 7 iterations Variable Coefficient Std. Error t-Statistic Prob. C 0.001355 7.13E-05 19.01606 0.0000
D0101 0.000457 0.000125 3.653770 0.0004
FEB 1.81E-05 4.50E-05 0.402274 0.6881
MAR 9.61E-05 5.90E-05 1.628851 0.1057
APR 0.000183 6.82E-05 2.679547 0.0083
MAY 1.24E-05 7.36E-05 0.168758 0.8662
JUN -5.35E-05 7.65E-05 -0.700119 0.4851
JUL -0.000103 7.74E-05 -1.333247 0.1847
AUG -0.000123 7.64E-05 -1.614037 0.1089
SEP -0.000134 7.36E-05 -1.821574 0.0708
OCT -6.47E-05 6.83E-05 -0.946803 0.3455
NOV 1.33E-05 5.97E-05 0.223310 0.8236
DEC 2.95E-05 4.50E-05 0.654468 0.5139
AR(1) 0.774502 0.044929 17.23823 0.0000 R-squared 0.714116 Mean dependent var 0.001320
Adjusted R-squared 0.686172 S.D. dependent var 0.000267
S.E. of regression 0.000150 Akaike info criterion -14.68707
Sum squared resid 2.98E-06 Schwarz criterion -14.40226
Log likelihood 1093.499 Hannan-Quinn criter. -14.57135
F-statistic 25.55563 Durbin-Watson stat 1.570629
Prob(F-statistic) 0.000000 Inverted AR Roots .77

January 2014
U.S. Energy Information Administration | STEO Model Documentation: Electricity Generation and Fuel Consumption Models 120
Table 63 – OTEP_WE, other fossil fuel generation by electric power sector, West region
Dependent Variable: OTEP_WE/EPEO_WE
Method: Least Squares
Date: 08/13/13 Time: 09:01
Sample: 2001M01 2013M03
Included observations: 147
Convergence achieved after 6 iterations Variable Coefficient Std. Error t-Statistic Prob. C 0.000650 6.35E-05 10.22705 0.0000
D04 0.001934 9.80E-05 19.74077 0.0000
D0307 0.003257 0.000125 26.01859 0.0000
D0308 0.005178 0.000156 33.20175 0.0000
D0309 0.004631 0.000169 27.42863 0.0000
D0310 0.004971 0.000172 28.95397 0.0000
D0311 0.004363 0.000166 26.29139 0.0000
D0312 0.001659 0.000148 11.16950 0.0000
D09ON 0.000474 7.35E-05 6.450298 0.0000
D1101 -0.000232 9.98E-05 -2.322597 0.0218
FEB 2.51E-05 3.62E-05 0.692876 0.4897
MAR 7.77E-06 4.73E-05 0.164185 0.8699
APR 1.73E-05 5.46E-05 0.317248 0.7516
MAY 2.02E-05 5.89E-05 0.342415 0.7326
JUN -4.34E-05 6.12E-05 -0.708995 0.4796
JUL -0.000101 6.28E-05 -1.609897 0.1099
AUG -9.55E-05 6.25E-05 -1.526671 0.1294
SEP -4.44E-05 6.06E-05 -0.732303 0.4654
OCT 1.24E-05 5.67E-05 0.218608 0.8273
NOV 2.38E-05 5.01E-05 0.474402 0.6360
DEC -2.45E-05 3.86E-05 -0.635495 0.5263
AR(1) 0.756564 0.054333 13.92465 0.0000 R-squared 0.986393 Mean dependent var 0.001105
Adjusted R-squared 0.984107 S.D. dependent var 0.000951
S.E. of regression 0.000120 Akaike info criterion -15.08180
Sum squared resid 1.80E-06 Schwarz criterion -14.63425
Log likelihood 1130.512 Hannan-Quinn criter. -14.89996
F-statistic 431.5072 Durbin-Watson stat 1.890646
Prob(F-statistic) 0.000000 Inverted AR Roots .76
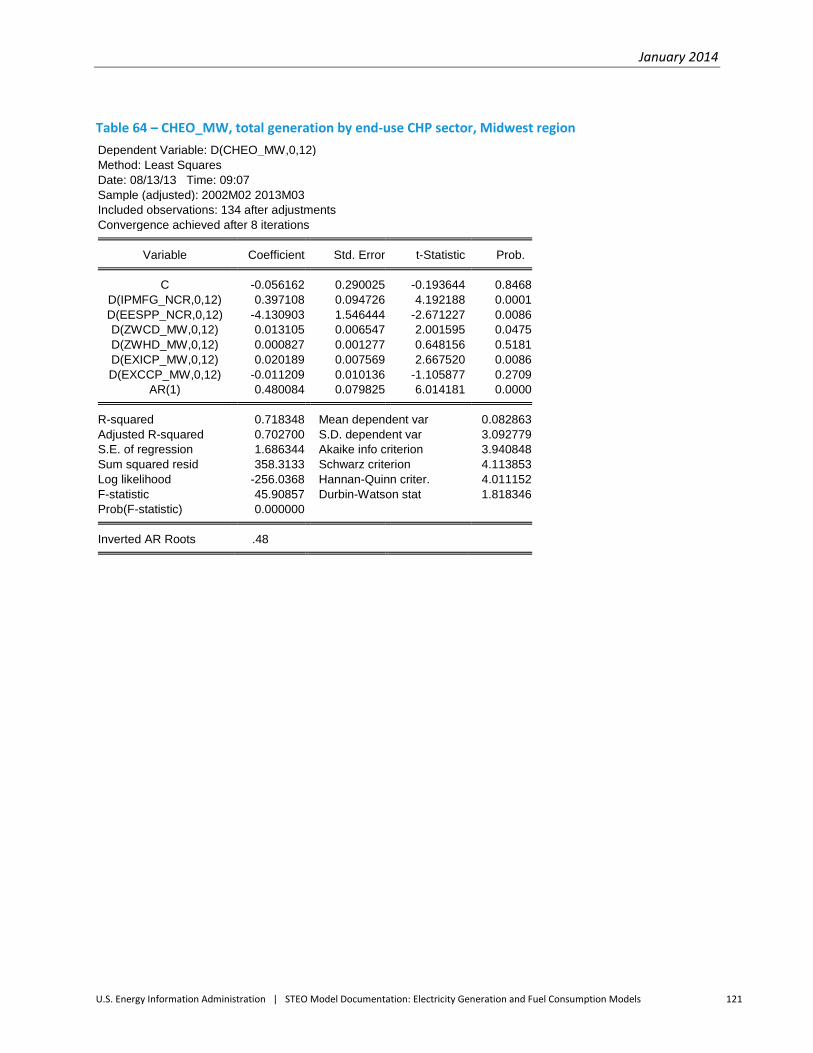
January 2014
U.S. Energy Information Administration | STEO Model Documentation: Electricity Generation and Fuel Consumption Models 121
Table 64 – CHEO_MW, total generation by end-use CHP sector, Midwest region
Dependent Variable: D(CHEO_MW,0,12)
Method: Least Squares
Date: 08/13/13 Time: 09:07
Sample (adjusted): 2002M02 2013M03
Included observations: 134 after adjustments
Convergence achieved after 8 iterations Variable Coefficient Std. Error t-Statistic Prob. C -0.056162 0.290025 -0.193644 0.8468
D(IPMFG_NCR,0,12) 0.397108 0.094726 4.192188 0.0001
D(EESPP_NCR,0,12) -4.130903 1.546444 -2.671227 0.0086
D(ZWCD_MW,0,12) 0.013105 0.006547 2.001595 0.0475
D(ZWHD_MW,0,12) 0.000827 0.001277 0.648156 0.5181
D(EXICP_MW,0,12) 0.020189 0.007569 2.667520 0.0086
D(EXCCP_MW,0,12) -0.011209 0.010136 -1.105877 0.2709
AR(1) 0.480084 0.079825 6.014181 0.0000 R-squared 0.718348 Mean dependent var 0.082863
Adjusted R-squared 0.702700 S.D. dependent var 3.092779
S.E. of regression 1.686344 Akaike info criterion 3.940848
Sum squared resid 358.3133 Schwarz criterion 4.113853
Log likelihood -256.0368 Hannan-Quinn criter. 4.011152
F-statistic 45.90857 Durbin-Watson stat 1.818346
Prob(F-statistic) 0.000000 Inverted AR Roots .48
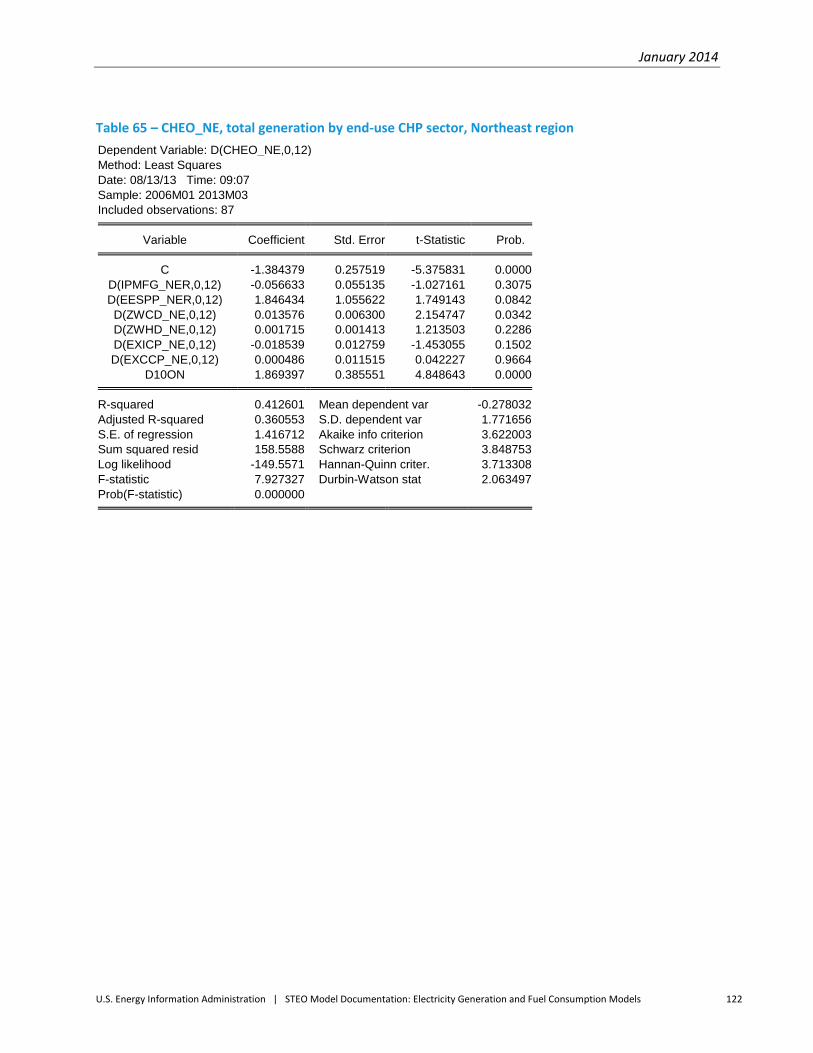
January 2014
U.S. Energy Information Administration | STEO Model Documentation: Electricity Generation and Fuel Consumption Models 122
Table 65 – CHEO_NE, total generation by end-use CHP sector, Northeast region
Dependent Variable: D(CHEO_NE,0,12)
Method: Least Squares
Date: 08/13/13 Time: 09:07
Sample: 2006M01 2013M03
Included observations: 87 Variable Coefficient Std. Error t-Statistic Prob. C -1.384379 0.257519 -5.375831 0.0000
D(IPMFG_NER,0,12) -0.056633 0.055135 -1.027161 0.3075
D(EESPP_NER,0,12) 1.846434 1.055622 1.749143 0.0842
D(ZWCD_NE,0,12) 0.013576 0.006300 2.154747 0.0342
D(ZWHD_NE,0,12) 0.001715 0.001413 1.213503 0.2286
D(EXICP_NE,0,12) -0.018539 0.012759 -1.453055 0.1502
D(EXCCP_NE,0,12) 0.000486 0.011515 0.042227 0.9664
D10ON 1.869397 0.385551 4.848643 0.0000 R-squared 0.412601 Mean dependent var -0.278032
Adjusted R-squared 0.360553 S.D. dependent var 1.771656
S.E. of regression 1.416712 Akaike info criterion 3.622003
Sum squared resid 158.5588 Schwarz criterion 3.848753
Log likelihood -149.5571 Hannan-Quinn criter. 3.713308
F-statistic 7.927327 Durbin-Watson stat 2.063497
Prob(F-statistic) 0.000000

January 2014
U.S. Energy Information Administration | STEO Model Documentation: Electricity Generation and Fuel Consumption Models 123
Table 66 – CHEO_SO, total generation by end-use CHP sector, South region
Dependent Variable: D(CHEO_SO,0,12)
Method: Least Squares
Date: 08/13/13 Time: 09:08
Sample (adjusted): 2002M02 2013M03
Included observations: 134 after adjustments
Convergence achieved after 14 iterations Variable Coefficient Std. Error t-Statistic Prob. C 8.162342 1.998553 4.084126 0.0001
D(IPMFG_SOR,0,12) 3.587583 0.745198 4.814266 0.0000
D(EESPP_SOR,0,12) -21.94062 5.628880 -3.897866 0.0002
D(ZWCD_SO,0,12) 0.061851 0.041501 1.490364 0.1388
D(ZWHD_SO,0,12) 0.048949 0.019951 2.453425 0.0156
D(EXICP_SO,0,12) -0.026764 0.038143 -0.701675 0.4842
D(EXCCP_SO,0,12) 0.008994 0.036042 0.249535 0.8034
D05 -26.97491 5.723471 -4.713035 0.0000
D07 -15.10104 5.371797 -2.811171 0.0058
D0510 -32.29475 13.03806 -2.476960 0.0146
D0511 -14.51674 12.45999 -1.165068 0.2463
D0610 51.37762 12.53921 4.097356 0.0001
D0611 26.29443 12.31343 2.135428 0.0348
AR(1) 0.320064 0.092700 3.452667 0.0008 R-squared 0.669426 Mean dependent var 1.114036
Adjusted R-squared 0.633614 S.D. dependent var 19.94741
S.E. of regression 12.07414 Akaike info criterion 7.918616
Sum squared resid 17494.18 Schwarz criterion 8.221375
Log likelihood -516.5473 Hannan-Quinn criter. 8.041648
F-statistic 18.69268 Durbin-Watson stat 2.057841
Prob(F-statistic) 0.000000 Inverted AR Roots .32

January 2014
U.S. Energy Information Administration | STEO Model Documentation: Electricity Generation and Fuel Consumption Models 124
Table 67 – CHEO_WE, total generation by end-use CHP sector, West region
Dependent Variable: D(CHEO_WE,0,12)
Method: Least Squares
Date: 08/13/13 Time: 09:08
Sample (adjusted): 2002M02 2013M03
Included observations: 134 after adjustments
Convergence achieved after 10 iterations Variable Coefficient Std. Error t-Statistic Prob. C -0.250335 0.522221 -0.479365 0.6326
D(IPMFG_WER,0,12) 0.413452 0.165697 2.495233 0.0140
D(EESPP_WER,0,12) -4.214964 1.914541 -2.201554 0.0296
D(HVEP_WE,0,12) -0.011019 0.003842 -2.867932 0.0049
D(ZWCD_WE,0,12) 0.021670 0.013231 1.637835 0.1041
D(ZWHD_WE,0,12) 0.010425 0.004870 2.140719 0.0343
D(EXICP_WE,0,12) 0.013654 0.020574 0.663647 0.5082
D(EXCCP_WE,0,12) 0.037722 0.014878 2.535385 0.0125
D0506 8.167107 3.217974 2.537965 0.0124
D0507 10.23612 3.481790 2.939901 0.0039
D0508 9.042859 3.234229 2.795986 0.0060
D0607 -5.388963 2.980033 -1.808357 0.0731
D0610 7.421366 2.971108 2.497845 0.0139
D1103 -6.237492 2.981062 -2.092372 0.0385
AR(1) 0.427344 0.085429 5.002323 0.0000 R-squared 0.517375 Mean dependent var -0.133762
Adjusted R-squared 0.460596 S.D. dependent var 4.349479
S.E. of regression 3.194437 Akaike info criterion 5.265863
Sum squared resid 1214.327 Schwarz criterion 5.590248
Log likelihood -337.8128 Hannan-Quinn criter. 5.397683
F-statistic 9.112028 Durbin-Watson stat 1.951177
Prob(F-statistic) 0.000000 Inverted AR Roots .43

January 2014
U.S. Energy Information Administration | STEO Model Documentation: Electricity Generation and Fuel Consumption Models 125
Table 68 – CLCH_MW, coal generation by end-use CHP sector, Midwest region
Dependent Variable: LOG(CLCH_MW/CHEO_MW)
Method: Least Squares
Date: 08/13/13 Time: 09:14
Sample (adjusted): 2001M02 2013M03
Included observations: 146 after adjustments
Convergence achieved after 8 iterations Variable Coefficient Std. Error t-Statistic Prob. C -0.869303 0.023218 -37.44066 0.0000
LOG(CLEUDUS/NGEUDUS) -0.115903 0.018346 -6.317469 0.0000
FEB -0.008844 0.011000 -0.803983 0.4229
MAR -0.039454 0.013989 -2.820279 0.0056
APR -0.053257 0.015737 -3.384135 0.0009
MAY -0.039442 0.016588 -2.377774 0.0189
JUN -0.046497 0.016993 -2.736258 0.0071
JUL -0.029687 0.017136 -1.732434 0.0856
AUG -0.036583 0.017074 -2.142616 0.0340
SEP -0.036777 0.016797 -2.189495 0.0304
OCT -0.016656 0.015969 -1.043032 0.2989
NOV 0.000519 0.014437 0.035938 0.9714
DEC -0.004078 0.011501 -0.354587 0.7235
D01 -0.123277 0.025101 -4.911256 0.0000
D03 -0.087388 0.022777 -3.836636 0.0002
D04 -0.095003 0.023952 -3.966342 0.0001
D05 -0.068891 0.023481 -2.933934 0.0040
AR(1) 0.595653 0.075268 7.913799 0.0000 R-squared 0.762410 Mean dependent var -0.794494
Adjusted R-squared 0.730855 S.D. dependent var 0.067455
S.E. of regression 0.034995 Akaike info criterion -3.752216
Sum squared resid 0.156757 Schwarz criterion -3.384374
Log likelihood 291.9117 Hannan-Quinn criter. -3.602753
F-statistic 24.16135 Durbin-Watson stat 2.113030
Prob(F-statistic) 0.000000 Inverted AR Roots .60
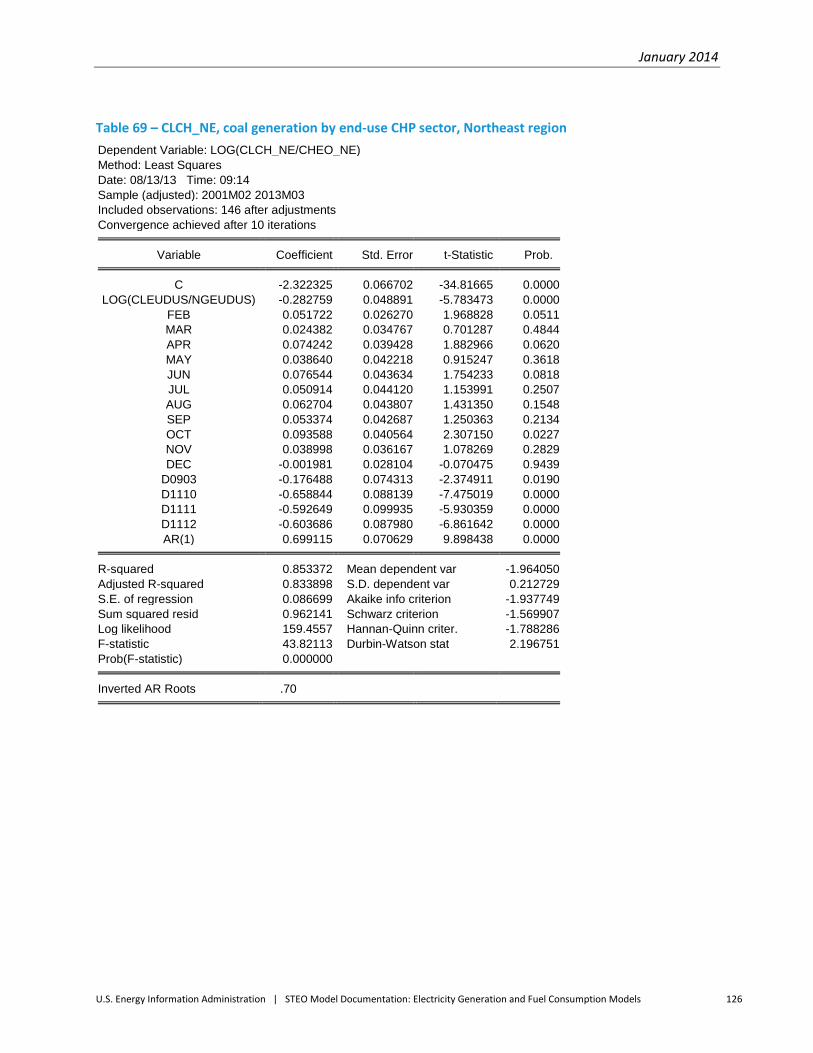
January 2014
U.S. Energy Information Administration | STEO Model Documentation: Electricity Generation and Fuel Consumption Models 126
Table 69 – CLCH_NE, coal generation by end-use CHP sector, Northeast region
Dependent Variable: LOG(CLCH_NE/CHEO_NE)
Method: Least Squares
Date: 08/13/13 Time: 09:14
Sample (adjusted): 2001M02 2013M03
Included observations: 146 after adjustments
Convergence achieved after 10 iterations Variable Coefficient Std. Error t-Statistic Prob. C -2.322325 0.066702 -34.81665 0.0000
LOG(CLEUDUS/NGEUDUS) -0.282759 0.048891 -5.783473 0.0000
FEB 0.051722 0.026270 1.968828 0.0511
MAR 0.024382 0.034767 0.701287 0.4844
APR 0.074242 0.039428 1.882966 0.0620
MAY 0.038640 0.042218 0.915247 0.3618
JUN 0.076544 0.043634 1.754233 0.0818
JUL 0.050914 0.044120 1.153991 0.2507
AUG 0.062704 0.043807 1.431350 0.1548
SEP 0.053374 0.042687 1.250363 0.2134
OCT 0.093588 0.040564 2.307150 0.0227
NOV 0.038998 0.036167 1.078269 0.2829
DEC -0.001981 0.028104 -0.070475 0.9439
D0903 -0.176488 0.074313 -2.374911 0.0190
D1110 -0.658844 0.088139 -7.475019 0.0000
D1111 -0.592649 0.099935 -5.930359 0.0000
D1112 -0.603686 0.087980 -6.861642 0.0000
AR(1) 0.699115 0.070629 9.898438 0.0000 R-squared 0.853372 Mean dependent var -1.964050
Adjusted R-squared 0.833898 S.D. dependent var 0.212729
S.E. of regression 0.086699 Akaike info criterion -1.937749
Sum squared resid 0.962141 Schwarz criterion -1.569907
Log likelihood 159.4557 Hannan-Quinn criter. -1.788286
F-statistic 43.82113 Durbin-Watson stat 2.196751
Prob(F-statistic) 0.000000 Inverted AR Roots .70

January 2014
U.S. Energy Information Administration | STEO Model Documentation: Electricity Generation and Fuel Consumption Models 127
Table 70 – CLCH_SO, coal generation by end-use CHP sector, South region
Dependent Variable: LOG(CLCH_SO/CHEO_SO)
Method: Least Squares
Date: 08/13/13 Time: 09:15
Sample (adjusted): 2001M02 2013M03
Included observations: 146 after adjustments
Convergence achieved after 9 iterations Variable Coefficient Std. Error t-Statistic Prob. C -3.117300 0.871174 -3.578273 0.0005
LOG(CLEUDUS/NGEUDUS) -0.112926 0.056703 -1.991539 0.0486
FEB 0.016810 0.017376 0.967395 0.3352
MAR 0.002894 0.023677 0.122219 0.9029
APR 0.002081 0.028045 0.074200 0.9410
MAY -0.034397 0.030232 -1.137770 0.2574
JUN -0.001043 0.031549 -0.033060 0.9737
JUL 0.024075 0.032191 0.747874 0.4559
AUG 0.026042 0.032111 0.810995 0.4189
SEP 0.008467 0.031643 0.267572 0.7895
OCT 0.058975 0.028463 2.072022 0.0403
NOV 0.026249 0.024095 1.089366 0.2781
DEC 0.021491 0.018164 1.183161 0.2390
D07 -0.379278 0.055767 -6.801140 0.0000
D08 -0.419113 0.064127 -6.535653 0.0000
D09 -0.436581 0.055753 -7.830654 0.0000
D0809 0.236211 0.047426 4.980653 0.0000
D1004 -0.425105 0.047474 -8.954496 0.0000
D1012 0.403613 0.047702 8.461168 0.0000
AR(1) 0.987249 0.021760 45.36920 0.0000 R-squared 0.960567 Mean dependent var -2.635156
Adjusted R-squared 0.954620 S.D. dependent var 0.299055
S.E. of regression 0.063706 Akaike info criterion -2.542420
Sum squared resid 0.511369 Schwarz criterion -2.133707
Log likelihood 205.5967 Hannan-Quinn criter. -2.376351
F-statistic 161.5404 Durbin-Watson stat 2.306209
Prob(F-statistic) 0.000000 Inverted AR Roots .99

January 2014
U.S. Energy Information Administration | STEO Model Documentation: Electricity Generation and Fuel Consumption Models 128
Table 71 – CLCH_WE, coal generation by end-use CHP sector, West region
Dependent Variable: LOG(CLCH_WE/CHEO_WE)
Method: Least Squares
Date: 08/13/13 Time: 09:15
Sample: 2006M01 2013M03
Included observations: 87
Convergence achieved after 3 iterations Variable Coefficient Std. Error t-Statistic Prob. C -3.006416 0.064672 -46.48728 0.0000
LOG(CLEUDUS/NGEUDUS) -0.132077 0.046290 -2.853236 0.0056
FEB 0.032273 0.047935 0.673263 0.5029
MAR 0.487019 0.056754 8.581169 0.0000
APR 0.516312 0.061525 8.391870 0.0000
MAY 0.528035 0.062824 8.404935 0.0000
JUN 0.514749 0.063261 8.136973 0.0000
JUL 0.502126 0.063424 7.916976 0.0000
AUG 0.505080 0.063454 7.959822 0.0000
SEP 0.476889 0.063399 7.522063 0.0000
OCT 0.497678 0.062092 8.015188 0.0000
NOV 0.020644 0.058597 0.352305 0.7256
DEC -0.022296 0.049045 -0.454608 0.6507
AR(1) 0.388080 0.105013 3.695528 0.0004 R-squared 0.846108 Mean dependent var -2.541524
Adjusted R-squared 0.818703 S.D. dependent var 0.264238
S.E. of regression 0.112510 Akaike info criterion -1.385156
Sum squared resid 0.924073 Schwarz criterion -0.988344
Log likelihood 74.25430 Hannan-Quinn criter. -1.225372
F-statistic 30.87375 Durbin-Watson stat 1.595781
Prob(F-statistic) 0.000000 Inverted AR Roots .39

January 2014
U.S. Energy Information Administration | STEO Model Documentation: Electricity Generation and Fuel Consumption Models 129
Table 72 – RFCH_MW, residual fuel oil generation by end-use CHP sector, Midwest region
Dependent Variable: LOG(RFCH_MW/CHEO_MW)
Method: Least Squares
Date: 08/13/13 Time: 09:40
Sample (adjusted): 2001M02 2013M03
Included observations: 146 after adjustments
Convergence achieved after 7 iterations Variable Coefficient Std. Error t-Statistic Prob. C -4.887724 0.418812 -11.67045 0.0000
LOG(RFEUDUS) -1.299026 0.114120 -11.38300 0.0000
LOG(NGEUDUS) 1.067179 0.192664 5.539077 0.0000
FEB 0.186850 0.124255 1.503755 0.1351
MAR -0.026023 0.154996 -0.167896 0.8669
APR -0.054101 0.172028 -0.314491 0.7536
MAY -0.134517 0.179415 -0.749753 0.4547
JUN 0.015038 0.182707 0.082307 0.9345
JUL 0.008582 0.183918 0.046664 0.9629
AUG -0.023688 0.183424 -0.129141 0.8974
SEP -0.140808 0.181438 -0.776064 0.4391
OCT -0.093456 0.173981 -0.537162 0.5921
NOV -0.007387 0.159013 -0.046457 0.9630
DEC 0.206318 0.127913 1.612951 0.1092
AR(1) 0.537176 0.074203 7.239287 0.0000 R-squared 0.860657 Mean dependent var -5.835032
Adjusted R-squared 0.845766 S.D. dependent var 0.989131
S.E. of regression 0.388458 Akaike info criterion 1.043807
Sum squared resid 19.76785 Schwarz criterion 1.350342
Log likelihood -61.19788 Hannan-Quinn criter. 1.168359
F-statistic 57.79496 Durbin-Watson stat 2.193947
Prob(F-statistic) 0.000000 Inverted AR Roots .54

January 2014
U.S. Energy Information Administration | STEO Model Documentation: Electricity Generation and Fuel Consumption Models 130
Table 73 – RFCH_NE, residual fuel oil generation by end-use CHP sector, Northeast region
Dependent Variable: LOG(RFCH_NE/CHEO_NE)
Method: Least Squares
Date: 08/13/13 Time: 09:41
Sample (adjusted): 2001M02 2013M03
Included observations: 146 after adjustments
Convergence achieved after 7 iterations Variable Coefficient Std. Error t-Statistic Prob. C -2.180760 0.263337 -8.281258 0.0000
LOG(RFEUDUS) -1.147034 0.074035 -15.49316 0.0000
LOG(NGEUDUS) 1.005237 0.122587 8.200196 0.0000
FEB -0.083213 0.067145 -1.239301 0.2174
MAR -0.235099 0.085653 -2.744775 0.0069
APR -0.248478 0.096571 -2.573008 0.0112
MAY -0.456220 0.101896 -4.477293 0.0000
JUN -0.363962 0.104503 -3.482802 0.0007
JUL -0.465611 0.105482 -4.414118 0.0000
AUG -0.548708 0.105044 -5.223631 0.0000
SEP -0.337060 0.103411 -3.259429 0.0014
OCT -0.153106 0.097988 -1.562506 0.1206
NOV -0.298385 0.087963 -3.392178 0.0009
DEC -0.198299 0.069122 -2.868826 0.0048
AR(1) 0.610548 0.069090 8.837043 0.0000 R-squared 0.941075 Mean dependent var -3.191817
Adjusted R-squared 0.934778 S.D. dependent var 0.841764
S.E. of regression 0.214974 Akaike info criterion -0.139525
Sum squared resid 6.054036 Schwarz criterion 0.167010
Log likelihood 25.18532 Hannan-Quinn criter. -0.014973
F-statistic 149.4416 Durbin-Watson stat 2.177544
Prob(F-statistic) 0.000000 Inverted AR Roots .61

January 2014
U.S. Energy Information Administration | STEO Model Documentation: Electricity Generation and Fuel Consumption Models 131
Table 74 – RFCH_SO, residual fuel oil generation by end-use CHP sector, South region
Dependent Variable: LOG(RFCH_SO/CHEO_SO)
Method: Least Squares
Date: 08/13/13 Time: 09:41
Sample (adjusted): 2001M02 2013M03
Included observations: 146 after adjustments
Convergence achieved after 8 iterations Variable Coefficient Std. Error t-Statistic Prob. C -3.978509 0.238827 -16.65851 0.0000
LOG(RFEUDUS) -1.404209 0.065059 -21.58361 0.0000
LOG(NGEUDUS) 1.129388 0.110603 10.21121 0.0000
FEB -0.041597 0.066051 -0.629764 0.5299
MAR -0.151209 0.083203 -1.817360 0.0714
APR -0.146826 0.093025 -1.578355 0.1169
MAY -0.178928 0.097531 -1.834581 0.0688
JUN -0.241506 0.099601 -2.424731 0.0167
JUL -0.260202 0.100367 -2.592501 0.0106
AUG -0.184575 0.100026 -1.845281 0.0673
SEP -0.095208 0.098741 -0.964213 0.3367
OCT -0.141035 0.094185 -1.497430 0.1367
NOV -0.127000 0.085405 -1.487032 0.1394
DEC -0.105190 0.067992 -1.547091 0.1243
AR(1) 0.568740 0.074936 7.589632 0.0000 R-squared 0.957607 Mean dependent var -5.175839
Adjusted R-squared 0.953077 S.D. dependent var 0.963104
S.E. of regression 0.208625 Akaike info criterion -0.199486
Sum squared resid 5.701701 Schwarz criterion 0.107049
Log likelihood 29.56245 Hannan-Quinn criter. -0.074933
F-statistic 211.3686 Durbin-Watson stat 2.148683
Prob(F-statistic) 0.000000 Inverted AR Roots .57
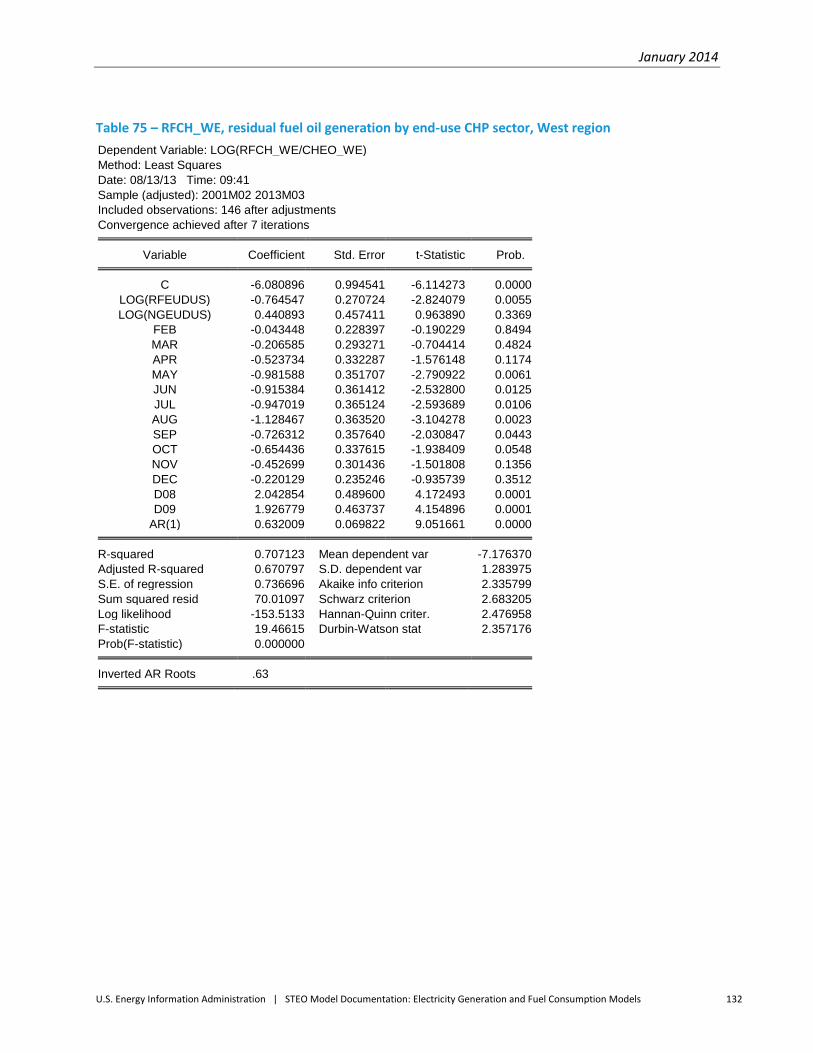
January 2014
U.S. Energy Information Administration | STEO Model Documentation: Electricity Generation and Fuel Consumption Models 132
Table 75 – RFCH_WE, residual fuel oil generation by end-use CHP sector, West region
Dependent Variable: LOG(RFCH_WE/CHEO_WE)
Method: Least Squares
Date: 08/13/13 Time: 09:41
Sample (adjusted): 2001M02 2013M03
Included observations: 146 after adjustments
Convergence achieved after 7 iterations Variable Coefficient Std. Error t-Statistic Prob. C -6.080896 0.994541 -6.114273 0.0000
LOG(RFEUDUS) -0.764547 0.270724 -2.824079 0.0055
LOG(NGEUDUS) 0.440893 0.457411 0.963890 0.3369
FEB -0.043448 0.228397 -0.190229 0.8494
MAR -0.206585 0.293271 -0.704414 0.4824
APR -0.523734 0.332287 -1.576148 0.1174
MAY -0.981588 0.351707 -2.790922 0.0061
JUN -0.915384 0.361412 -2.532800 0.0125
JUL -0.947019 0.365124 -2.593689 0.0106
AUG -1.128467 0.363520 -3.104278 0.0023
SEP -0.726312 0.357640 -2.030847 0.0443
OCT -0.654436 0.337615 -1.938409 0.0548
NOV -0.452699 0.301436 -1.501808 0.1356
DEC -0.220129 0.235246 -0.935739 0.3512
D08 2.042854 0.489600 4.172493 0.0001
D09 1.926779 0.463737 4.154896 0.0001
AR(1) 0.632009 0.069822 9.051661 0.0000 R-squared 0.707123 Mean dependent var -7.176370
Adjusted R-squared 0.670797 S.D. dependent var 1.283975
S.E. of regression 0.736696 Akaike info criterion 2.335799
Sum squared resid 70.01097 Schwarz criterion 2.683205
Log likelihood -153.5133 Hannan-Quinn criter. 2.476958
F-statistic 19.46615 Durbin-Watson stat 2.357176
Prob(F-statistic) 0.000000 Inverted AR Roots .63

January 2014
U.S. Energy Information Administration | STEO Model Documentation: Electricity Generation and Fuel Consumption Models 133
Table 76 – DKCH_MW, distillate fuel oil generation by end-use CHP sector, Midwest region
Dependent Variable: LOG(DKCH_MW/CHEO_MW)
Method: Least Squares
Date: 08/13/13 Time: 09:45
Sample (adjusted): 2001M02 2013M03
Included observations: 146 after adjustments
Convergence achieved after 5 iterations Variable Coefficient Std. Error t-Statistic Prob. C -6.143822 0.295170 -20.81449 0.0000
LOG(DKEUDUS) -0.352516 0.083751 -4.209083 0.0000
LOG(NGEUDUS) 0.204915 0.136793 1.497996 0.1366
FEB 0.098535 0.114170 0.863048 0.3897
MAR -0.087792 0.133604 -0.657105 0.5123
APR -0.039785 0.142482 -0.279229 0.7805
MAY 0.067420 0.144781 0.465669 0.6422
JUN -0.010498 0.145483 -0.072158 0.9426
JUL -0.097247 0.145788 -0.667043 0.5059
AUG -0.021595 0.145911 -0.148001 0.8826
SEP -0.148669 0.145937 -1.018724 0.3102
OCT 0.089436 0.143477 0.623349 0.5342
NOV -0.173968 0.136623 -1.273342 0.2052
DEC -0.010516 0.117070 -0.089825 0.9286
D06 -0.712152 0.152041 -4.683938 0.0000
D07 -0.577936 0.152624 -3.786672 0.0002
AR(1) 0.356227 0.080830 4.407133 0.0000 R-squared 0.534901 Mean dependent var -6.810183
Adjusted R-squared 0.477214 S.D. dependent var 0.461797
S.E. of regression 0.333898 Akaike info criterion 0.753118
Sum squared resid 14.38190 Schwarz criterion 1.100524
Log likelihood -37.97758 Hannan-Quinn criter. 0.894277
F-statistic 9.272521 Durbin-Watson stat 2.032710
Prob(F-statistic) 0.000000 Inverted AR Roots .36

January 2014
U.S. Energy Information Administration | STEO Model Documentation: Electricity Generation and Fuel Consumption Models 134
Table 77 – DKCH_NE, distillate fuel oil generation by end-use CHP sector, Northeast region
Dependent Variable: LOG(DKCH_NE/CHEO_NE)
Method: Least Squares
Date: 08/13/13 Time: 09:45
Sample (adjusted): 2001M02 2013M03
Included observations: 146 after adjustments
Convergence achieved after 10 iterations Variable Coefficient Std. Error t-Statistic Prob. C -2.264748 0.399102 -5.674612 0.0000
LOG(DKEUDUS) -1.359400 0.126815 -10.71959 0.0000
LOG(NGEUDUS) 0.874973 0.181493 4.820972 0.0000
FEB -0.149535 0.094640 -1.580048 0.1165
MAR -0.316138 0.120597 -2.621442 0.0098
APR -0.418595 0.136292 -3.071324 0.0026
MAY -0.314751 0.144117 -2.183989 0.0308
JUN -0.401606 0.148034 -2.712925 0.0076
JUL -0.252740 0.149494 -1.690641 0.0933
AUG -0.257879 0.148902 -1.731868 0.0857
SEP -0.324147 0.146406 -2.214026 0.0286
OCT -0.289758 0.138513 -2.091916 0.0384
NOV -0.549875 0.123857 -4.439613 0.0000
DEC -0.319573 0.097708 -3.270686 0.0014
D0401 1.082185 0.263422 4.108177 0.0001
AR(1) 0.634926 0.067916 9.348678 0.0000 R-squared 0.883054 Mean dependent var -4.487623
Adjusted R-squared 0.869561 S.D. dependent var 0.826086
S.E. of regression 0.298352 Akaike info criterion 0.522022
Sum squared resid 11.57183 Schwarz criterion 0.848993
Log likelihood -22.10760 Hannan-Quinn criter. 0.654878
F-statistic 65.44188 Durbin-Watson stat 2.105239
Prob(F-statistic) 0.000000 Inverted AR Roots .63

January 2014
U.S. Energy Information Administration | STEO Model Documentation: Electricity Generation and Fuel Consumption Models 135
Table 78 – DKCH_SO, distillate fuel oil generation by end-use CHP sector, South region
Dependent Variable: LOG(DKCH_SO/CHEO_SO)
Method: Least Squares
Date: 08/13/13 Time: 09:45
Sample (adjusted): 2001M02 2013M03
Included observations: 146 after adjustments
Convergence achieved after 8 iterations Variable Coefficient Std. Error t-Statistic Prob. C -5.059609 0.599044 -8.446140 0.0000
LOG(DKEUDUS) -1.209484 0.200197 -6.041472 0.0000
LOG(NGEUDUS) 1.056383 0.269242 3.923543 0.0001
FEB -0.018308 0.120408 -0.152047 0.8794
MAR -0.051791 0.157558 -0.328710 0.7429
APR -0.081572 0.180721 -0.451369 0.6525
MAY -0.029327 0.192778 -0.152130 0.8793
JUN -0.181643 0.199106 -0.912294 0.3633
JUL -0.007649 0.201620 -0.037938 0.9698
AUG -0.071028 0.200811 -0.353706 0.7241
SEP -0.048628 0.199061 -0.244287 0.8074
OCT 0.035418 0.184352 0.192121 0.8479
NOV 0.073639 0.161816 0.455077 0.6498
DEC -0.061788 0.124068 -0.498020 0.6193
D0809 1.850248 0.341596 5.416483 0.0000
AR(1) 0.695307 0.064089 10.84914 0.0000 R-squared 0.829554 Mean dependent var -6.330131
Adjusted R-squared 0.809888 S.D. dependent var 0.909371
S.E. of regression 0.396503 Akaike info criterion 1.090839
Sum squared resid 20.43788 Schwarz criterion 1.417809
Log likelihood -63.63123 Hannan-Quinn criter. 1.223694
F-statistic 42.18044 Durbin-Watson stat 2.236101
Prob(F-statistic) 0.000000 Inverted AR Roots .70

January 2014
U.S. Energy Information Administration | STEO Model Documentation: Electricity Generation and Fuel Consumption Models 136
Table 79 – DKCH_WE, distillate fuel oil generation by end-use CHP sector, West region
Dependent Variable: LOG(DKCH_WE/CHEO_WE)
Method: Least Squares
Date: 08/13/13 Time: 09:45
Sample (adjusted): 2001M02 2013M03
Included observations: 146 after adjustments
Convergence achieved after 8 iterations Variable Coefficient Std. Error t-Statistic Prob. C -4.395401 0.300703 -14.61706 0.0000
LOG(DKEUDUS) -0.614159 0.095134 -6.455717 0.0000
LOG(NGEUDUS) 0.297933 0.136379 2.184589 0.0307
FEB -0.003594 0.072707 -0.049434 0.9606
MAR -0.036031 0.092999 -0.387440 0.6991
APR -0.141896 0.105130 -1.349718 0.1794
MAY -0.105547 0.110891 -0.951811 0.3429
JUN -0.219823 0.113653 -1.934158 0.0552
JUL -0.202712 0.114664 -1.767879 0.0794
AUG -0.187352 0.114245 -1.639918 0.1034
SEP -0.164922 0.112456 -1.466543 0.1449
OCT -0.118188 0.106554 -1.109188 0.2694
NOV -0.137587 0.095364 -1.442747 0.1515
DEC -0.080160 0.074819 -1.071394 0.2860
AR(1) 0.615666 0.068400 9.000939 0.0000 R-squared 0.762342 Mean dependent var -5.532959
Adjusted R-squared 0.736944 S.D. dependent var 0.454375
S.E. of regression 0.233045 Akaike info criterion 0.021896
Sum squared resid 7.114581 Schwarz criterion 0.328431
Log likelihood 13.40157 Hannan-Quinn criter. 0.146448
F-statistic 30.01524 Durbin-Watson stat 2.031619
Prob(F-statistic) 0.000000 Inverted AR Roots .62
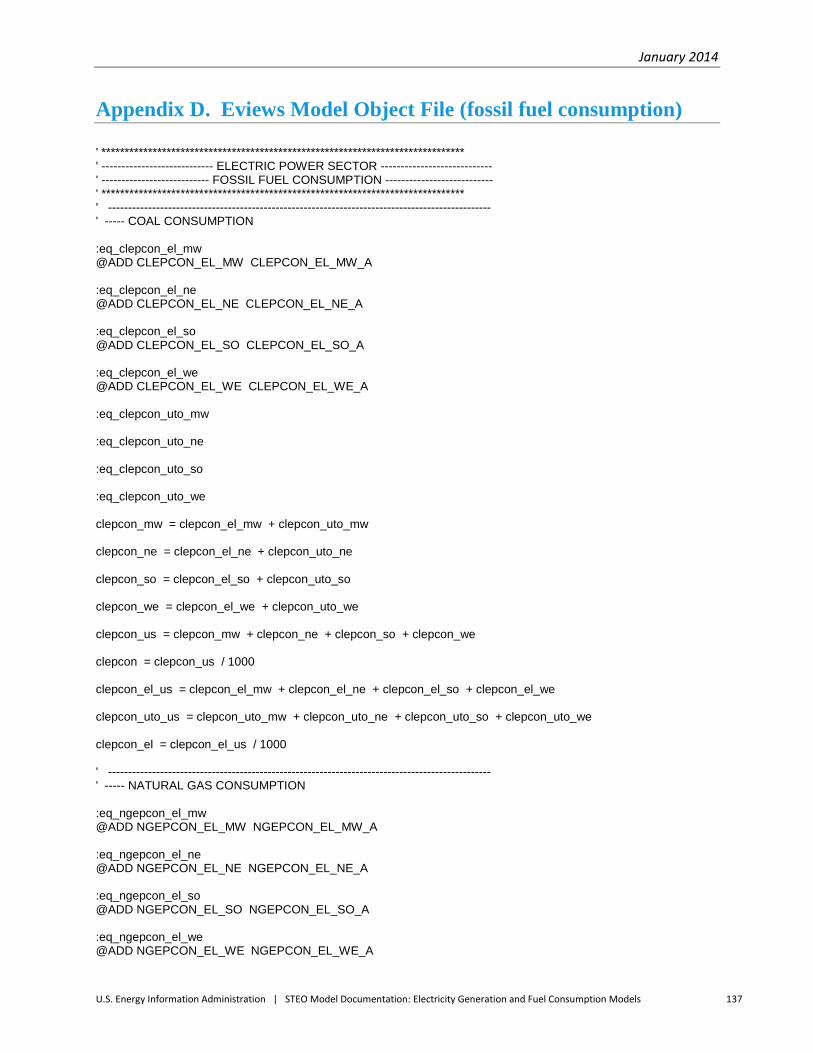
January 2014
U.S. Energy Information Administration | STEO Model Documentation: Electricity Generation and Fuel Consumption Models 137
Appendix D. Eviews Model Object File (fossil fuel consumption)
' ****************************************************************************** ' ---------------------------- ELECTRIC POWER SECTOR ---------------------------- ' --------------------------- FOSSIL FUEL CONSUMPTION --------------------------- ' ****************************************************************************** ' ------------------------------------------------------------------------------------------------ ' ----- COAL CONSUMPTION :eq_clepcon_el_mw @ADD CLEPCON_EL_MW CLEPCON_EL_MW_A :eq_clepcon_el_ne @ADD CLEPCON_EL_NE CLEPCON_EL_NE_A :eq_clepcon_el_so @ADD CLEPCON_EL_SO CLEPCON_EL_SO_A :eq_clepcon_el_we @ADD CLEPCON_EL_WE CLEPCON_EL_WE_A :eq_clepcon_uto_mw :eq_clepcon_uto_ne :eq_clepcon_uto_so :eq_clepcon_uto_we clepcon_mw = clepcon_el_mw + clepcon_uto_mw clepcon_ne = clepcon_el_ne + clepcon_uto_ne clepcon_so = clepcon_el_so + clepcon_uto_so clepcon_we = clepcon_el_we + clepcon_uto_we clepcon_us = clepcon_mw + clepcon_ne + clepcon_so + clepcon_we clepcon = clepcon_us / 1000 clepcon_el_us = clepcon_el_mw + clepcon_el_ne + clepcon_el_so + clepcon_el_we clepcon_uto_us = clepcon_uto_mw + clepcon_uto_ne + clepcon_uto_so + clepcon_uto_we clepcon_el = clepcon_el_us / 1000 ' ------------------------------------------------------------------------------------------------ ' ----- NATURAL GAS CONSUMPTION :eq_ngepcon_el_mw @ADD NGEPCON_EL_MW NGEPCON_EL_MW_A :eq_ngepcon_el_ne @ADD NGEPCON_EL_NE NGEPCON_EL_NE_A :eq_ngepcon_el_so @ADD NGEPCON_EL_SO NGEPCON_EL_SO_A :eq_ngepcon_el_we @ADD NGEPCON_EL_WE NGEPCON_EL_WE_A
January 2014
U.S. Energy Information Administration | STEO Model Documentation: Electricity Generation and Fuel Consumption Models 138
:eq_ngepcon_uto_mw :eq_ngepcon_uto_ne :eq_ngepcon_uto_so :eq_ngepcon_uto_we ngepcon_mw = ngepcon_el_mw + ngepcon_uto_mw ngepcon_ne = ngepcon_el_ne + ngepcon_uto_ne ngepcon_so = ngepcon_el_so + ngepcon_uto_so ngepcon_we = ngepcon_el_we + ngepcon_uto_we ngepcon_us = ngepcon_mw + ngepcon_ne + ngepcon_so + ngepcon_we ngepcon = ngepcon_us / 1000 ngepcon_el_us = ngepcon_el_mw + ngepcon_el_ne + ngepcon_el_so + ngepcon_el_we ngepcon_uto_us = ngepcon_uto_mw + ngepcon_uto_ne + ngepcon_uto_so + ngepcon_uto_we ngepcon_el = ngepcon_el_us / 1000 ' ------------------------------------------------------------------------------------------------ ' ----- RESIDUAL FUEL OIL CONSUMPTION rfepcon_el_mw = rfep_mw * (@movsum(rfepcon_el_mw(-1) , 24) / @movsum(rfep_mw(-1) , 24)) rfepcon_el_ne = rfep_ne * (@movsum(rfepcon_el_ne(-1) , 24) / @movsum(rfep_ne(-1) , 24)) rfepcon_el_so = rfep_so * (@movsum(rfepcon_el_so(-1) , 24) / @movsum(rfep_so(-1) , 24)) rfepcon_el_we = rfep_we * (@movsum(rfepcon_el_we(-1) , 24) / @movsum(rfep_we(-1) , 24)) rfepcon_uto_mw = rfepcon_uto_mw(-12) rfepcon_uto_ne = rfepcon_uto_ne(-12) rfepcon_uto_so = rfepcon_uto_so(-12) rfepcon_uto_we = rfepcon_uto_we(-12) rfepcon_mw = rfepcon_el_mw + rfepcon_uto_mw rfepcon_ne = rfepcon_el_ne + rfepcon_uto_ne rfepcon_so = rfepcon_el_so + rfepcon_uto_so rfepcon_we = rfepcon_el_we + rfepcon_uto_we rfepcon_us = rfepcon_mw + rfepcon_ne + rfepcon_so + rfepcon_we rfepcon = rfepcon_us / 1000 rfepcon_el_us = rfepcon_el_mw + rfepcon_el_ne + rfepcon_el_so + rfepcon_el_we rfepcon_el = rfepcon_el_us / 1000

January 2014
U.S. Energy Information Administration | STEO Model Documentation: Electricity Generation and Fuel Consumption Models 139
rfepcon_uto_us = rfepcon_uto_mw + rfepcon_uto_ne + rfepcon_uto_so + rfepcon_uto_we ' ------------------------------------------------------------------------------------------------ ' ----- DISTILLATE FUEL OIL CONSUMPTION :eq_dkepcon_el_mw :eq_dkepcon_el_ne :eq_dkepcon_el_so :eq_dkepcon_el_we dkepcon_uto_mw = dkepcon_uto_mw(-12) dkepcon_uto_ne = dkepcon_uto_ne(-12) dkepcon_uto_so = dkepcon_uto_so(-12) dkepcon_uto_we = dkepcon_uto_we(-12) dkepcon_mw = dkepcon_el_mw + dkepcon_uto_mw dkepcon_ne = dkepcon_el_ne + dkepcon_uto_ne dkepcon_so = dkepcon_el_so + dkepcon_uto_so dkepcon_we = dkepcon_el_we + dkepcon_uto_we dkepcon_us = dkepcon_mw + dkepcon_ne + dkepcon_so + dkepcon_we dkepcon = dkepcon_us / 1000 dkepcon_el_us = dkepcon_el_mw + dkepcon_el_ne + dkepcon_el_so + dkepcon_el_we dkepcon_el = dkepcon_el_us / 1000 dkepcon_uto_us = dkepcon_uto_mw + dkepcon_uto_ne + dkepcon_uto_so + dkepcon_uto_we ' ------------------------------------------------------------------------------------------------ ' ----- PETROLEUM COKE CONSUMPTION :eq_pcepcon_el_mw pcepcon_el_ne = pcepcon_el_ne(-12) :eq_pcepcon_el_so :eq_pcepcon_el_we pcepcon_uto_mw = pcepcon_uto_mw(-12) pcepcon_uto_ne = pcepcon_uto_ne(-12) pcepcon_uto_so = pcepcon_uto_so(-12) pcepcon_uto_we = pcepcon_uto_we(-12) pcepcon_mw = pcepcon_el_mw + pcepcon_uto_mw pcepcon_ne = pcepcon_el_ne + pcepcon_uto_ne
January 2014
U.S. Energy Information Administration | STEO Model Documentation: Electricity Generation and Fuel Consumption Models 140
pcepcon_so = pcepcon_el_so + pcepcon_uto_so pcepcon_we = pcepcon_el_we + pcepcon_uto_we pcepcon_us = pcepcon_mw + pcepcon_ne + pcepcon_so + pcepcon_we pcepcon = pcepcon_us / 1000 pcepcon_el_us = pcepcon_el_mw + pcepcon_el_ne + pcepcon_el_so + pcepcon_el_we pcepcon_el = pcepcon_el_us / 1000 pcepcon_uto_us = pcepcon_uto_mw + pcepcon_uto_ne + pcepcon_uto_so + pcepcon_uto_we ' ------------------------------------------------------------------------------------------------ ' ----- OTHER PETROLEUM LIQUIDS CONSUMPTION opepcon_el_mw = opep_mw * (@movsum(opepcon_el_mw(-1) , 24) / @movsum(opep_mw(-1) , 24)) :eq_opepcon_el_ne :eq_opepcon_el_so :eq_opepcon_el_we opepcon_uto_mw = opepcon_uto_mw(-12) opepcon_uto_ne = opepcon_uto_ne(-12) opepcon_uto_so = opepcon_uto_so(-12) opepcon_uto_we = opepcon_uto_we(-12) opepcon_mw = opepcon_el_mw + opepcon_uto_mw opepcon_ne = opepcon_el_ne + opepcon_uto_ne opepcon_so = opepcon_el_so + opepcon_uto_so opepcon_we = opepcon_el_we + opepcon_uto_we opepcon_us = opepcon_mw + opepcon_ne + opepcon_so + opepcon_we opepcon = opepcon_us / 1000 opepcon_el_us = opepcon_el_mw + opepcon_el_ne + opepcon_el_so + opepcon_el_we opepcon_el = opepcon_el_us / 1000 opepcon_uto_us = opepcon_uto_mw + opepcon_uto_ne + opepcon_uto_so + opepcon_uto_we ' ------------------------------------------------------------------------------------------------ ' ----- TOTAL PETROLEUM CONSUMPTION paepcon_mw = rfepcon_mw + dkepcon_mw + pcepcon_mw + opepcon_mw paepcon_ne = rfepcon_ne + dkepcon_ne + pcepcon_ne + opepcon_ne paepcon_so = rfepcon_so + dkepcon_so + pcepcon_so + opepcon_so paepcon_we = rfepcon_we + dkepcon_we + pcepcon_we + opepcon_we

January 2014
U.S. Energy Information Administration | STEO Model Documentation: Electricity Generation and Fuel Consumption Models 141
paepcon_el_mw = rfepcon_el_mw + dkepcon_el_mw + pcepcon_el_mw + opepcon_el_mw paepcon_el_ne = rfepcon_el_ne + dkepcon_el_ne + pcepcon_el_ne + opepcon_el_ne paepcon_el_so = rfepcon_el_so + dkepcon_el_so + pcepcon_el_so + opepcon_el_so paepcon_el_we = rfepcon_el_we + dkepcon_el_we + pcepcon_el_we + opepcon_el_we paepcon_us = paepcon_mw + paepcon_ne + paepcon_so + paepcon_we paepcon = paepcon_us / 1000 paepcon_el_us = paepcon_el_mw + paepcon_el_ne + paepcon_el_so + paepcon_el_we paepcon_el = paepcon_el_us / 1000 ' ' ****************************************************************************** ' ----------END-USE SECTORS (COMMERCIAL AND INDUSTRIAL)------ ' ----------------------- FOSSIL FUEL CONSUMPTION --------------------------- ' ****************************************************************************** ' ------------------------------------------------------------------------------------------------ ' ----- COAL CONSUMPTION clchcon_mw = clch_mw * (clchcon_mw(-12) / clch_mw(-12)) clchcon_ne = clch_ne * (clchcon_ne(-12) / clch_ne(-12)) clchcon_so = clch_so * (clchcon_so(-12) / clch_so(-12)) clchcon_we = clch_we * (clchcon_we(-12) / clch_we(-12)) clchcon_us = clchcon_mw + clchcon_ne + clchcon_so + clchcon_we clchcon_el_mw = clchcon_mw * (clchcon_el_mw(-12) / clchcon_mw(-12)) clchcon_el_ne = clchcon_ne * (clchcon_el_ne(-12) / clchcon_ne(-12)) clchcon_el_so = clchcon_so * (clchcon_el_so(-12) / clchcon_so(-12)) clchcon_el_we = clchcon_we * (clchcon_el_we(-12) / clchcon_we(-12)) clchcon_el_us = clchcon_el_mw + clchcon_el_ne + clchcon_el_so + clchcon_el_we clchcon = clchcon_us / 1000 clchcon_el = clchcon_el_us / 1000 ' ------------------------------------------------------------------------------------------------ ' ----- NATURAL GAS CONSUMPTION ngchcon_mw = ngch_mw * (ngchcon_mw(-12) / ngch_mw(-12)) ngchcon_ne = ngch_ne * (ngchcon_ne(-12) / ngch_ne(-12)) ngchcon_so = ngch_so * (ngchcon_so(-12) / ngch_so(-12)) ngchcon_we = ngch_we * (ngchcon_we(-12) / ngch_we(-12)) ngchcon_us = ngchcon_mw + ngchcon_ne + ngchcon_so + ngchcon_we ngchcon_el_mw = ngchcon_mw * (ngchcon_el_mw(-12) / ngchcon_mw(-12))
January 2014
U.S. Energy Information Administration | STEO Model Documentation: Electricity Generation and Fuel Consumption Models 142
ngchcon_el_ne = ngchcon_ne * (ngchcon_el_ne(-12) / ngchcon_ne(-12)) ngchcon_el_so = ngchcon_so * (ngchcon_el_so(-12) / ngchcon_so(-12)) ngchcon_el_we = ngchcon_we * (ngchcon_el_we(-12) / ngchcon_we(-12)) ngchcon_el_us = ngchcon_el_mw + ngchcon_el_ne + ngchcon_el_so + ngchcon_el_we ngchcon = ngchcon_us / 1000 ngchcon_el = ngchcon_el_us / 1000 ' ------------------------------------------------------------------------------------------------ ' ----- RESIDUAL FUEL OIL CONSUMPTION rfchcon_mw = rfch_mw * (rfchcon_mw(-12) / rfch_mw(-12)) rfchcon_ne = rfch_ne * (rfchcon_ne(-12) / rfch_ne(-12)) rfchcon_so = rfch_so * (rfchcon_so(-12) / rfch_so(-12)) rfchcon_we = rfch_we * (rfchcon_we(-12) / rfch_we(-12)) rfchcon_us = rfchcon_mw + rfchcon_ne + rfchcon_so + rfchcon_we rfchcon_el_mw = rfchcon_mw * (rfchcon_el_mw(-12) / rfchcon_mw(-12)) rfchcon_el_ne = rfchcon_ne * (rfchcon_el_ne(-12) / rfchcon_ne(-12)) rfchcon_el_so = rfchcon_so * (rfchcon_el_so(-12) / rfchcon_so(-12)) rfchcon_el_we = rfchcon_we * (rfchcon_el_we(-12) / rfchcon_we(-12)) rfchcon_el_us = rfchcon_el_mw + rfchcon_el_ne + rfchcon_el_so + rfchcon_el_we rfchcon = rfchcon_us / 1000 rfchcon_el = rfchcon_el_us / 1000 ' ------------------------------------------------------------------------------------------------ ' ----- DISTILLATE FUEL OIL CONSUMPTION dkchcon_mw = dkch_mw * (dkchcon_mw(-12) / dkch_mw(-12)) dkchcon_ne = dkch_ne * (dkchcon_ne(-12) / dkch_ne(-12)) dkchcon_so = dkch_so * (dkchcon_so(-12) / dkch_so(-12)) dkchcon_we = dkch_we * (dkchcon_we(-12) / dkch_we(-12)) dkchcon_us = dkchcon_mw + dkchcon_ne + dkchcon_so + dkchcon_we dkchcon_el_mw = dkchcon_mw * (dkchcon_el_mw(-12) / dkchcon_mw(-12)) dkchcon_el_ne = dkchcon_ne * (dkchcon_el_ne(-12) / dkchcon_ne(-12)) dkchcon_el_so = dkchcon_so * (dkchcon_el_so(-12) / dkchcon_so(-12)) dkchcon_el_we = dkchcon_we * (dkchcon_el_we(-12) / dkchcon_we(-12)) dkchcon_el_us = dkchcon_el_mw + dkchcon_el_ne + dkchcon_el_so + dkchcon_el_we

January 2014
U.S. Energy Information Administration | STEO Model Documentation: Electricity Generation and Fuel Consumption Models 143
dkchcon = dkchcon_us / 1000 dkchcon_el = dkchcon_el_us / 1000 ' ------------------------------------------------------------------------------------------------ ' ----- PETROLEUM COKE CONSUMPTION pcchcon_mw = pcch_mw * (pcchcon_mw(-12) / pcch_mw(-12)) pcchcon_ne = pcch_ne * (pcchcon_us(-12) / pcch_us(-12)) pcchcon_so = pcch_so * (pcchcon_so(-12) / pcch_so(-12)) pcchcon_we = pcch_we * (pcchcon_us(-12) / pcch_us(-12)) pcchcon_us = pcchcon_mw + pcchcon_ne + pcchcon_so + pcchcon_we pcchcon_el_mw = pcchcon_mw * (pcchcon_el_mw(-12) / pcchcon_mw(-12)) pcchcon_el_ne = pcchcon_ne * (pcchcon_el_us(-12) / pcchcon_us(-12)) pcchcon_el_so = pcchcon_so * (pcchcon_el_so(-12) / pcchcon_so(-12)) pcchcon_el_we = pcchcon_we * (pcchcon_el_us(-12) / pcchcon_us(-12)) pcchcon_el_us = pcchcon_el_mw + pcchcon_el_ne + pcchcon_el_so + pcchcon_el_we pcchcon = pcchcon_us / 1000 pcchcon_el = pcchcon_el_us / 1000 ' ------------------------------------------------------------------------------------------------ ' ----- OTHER PETROLEUM LIQUIDS CONSUMPTION opchcon_mw = opch_mw * (opchcon_mw(-12) / opch_mw(-12)) opchcon_ne = opch_ne * (opchcon_ne(-12) / opch_ne(-12)) opchcon_so = opch_so * (opchcon_so(-12) / opch_so(-12)) opchcon_we = opch_we * (opchcon_we(-12) / opch_we(-12)) opchcon_us = opchcon_mw + opchcon_ne + opchcon_so + opchcon_we opchcon_el_mw = opchcon_mw * (opchcon_el_mw(-12) / opchcon_mw(-12)) opchcon_el_ne = opchcon_ne * (opchcon_el_ne(-12) / opchcon_ne(-12)) opchcon_el_so = opchcon_so * (opchcon_el_so(-12) / opchcon_so(-12)) opchcon_el_we = opchcon_we * (opchcon_el_we(-12) / opchcon_we(-12)) opchcon_el_us = opchcon_el_mw + opchcon_el_ne + opchcon_el_so + opchcon_el_we opchcon = opchcon_us / 1000 opchcon_el = opchcon_el_us / 1000 ' ------------------------------------------------------------------------------------------------ ' ----- TOTAL PETROLEUM CONSUMPTION

January 2014
U.S. Energy Information Administration | STEO Model Documentation: Electricity Generation and Fuel Consumption Models 144
pachcon_mw = rfchcon_mw + dkchcon_mw + pcchcon_mw + opchcon_mw pachcon_ne = rfchcon_ne + dkchcon_ne + pcchcon_ne + opchcon_ne pachcon_so = rfchcon_so + dkchcon_so + pcchcon_so + opchcon_so pachcon_we = rfchcon_we + dkchcon_we + pcchcon_we + opchcon_we pachcon_el_mw = rfchcon_el_mw + dkchcon_el_mw + pcchcon_el_mw + opchcon_el_mw pachcon_el_ne = rfchcon_el_ne + dkchcon_el_ne + pcchcon_el_ne + opchcon_el_ne pachcon_el_so = rfchcon_el_so + dkchcon_el_so + pcchcon_el_so + opchcon_el_so pachcon_el_we = rfchcon_el_we + dkchcon_el_we + pcchcon_el_we + opchcon_el_we pachcon_us = pachcon_mw + pachcon_ne + pachcon_so + pachcon_we pachcon = pachcon_us / 1000 pachcon_el_us = pachcon_el_mw + pachcon_el_ne + pachcon_el_so + pachcon_el_we pachcon_el = pachcon_el_us / 1000 ' ' ****************************************************************************** ' --------------------------------- INDUSTRIAL SECTOR -------------------------------- ' --------------------------- FOSSIL FUEL CONSUMPTION --------------------------- ' ****************************************************************************** ' ------------------------------------------------------------------------------------------------ ' ----- COAL CONSUMPTION clcgcon = clchcon * (clcgcon(-12) / clchcon(-12)) clcgcon_el = clcgcon * (clcgcon_el(-12) / clcgcon(-12)) ' ------------------------------------------------------------------------------------------------ ' ----- NATURAL GAS CONSUMPTION ngcgcon = ngchcon * (ngcgcon(-12) / ngchcon(-12)) ngcgcon_el = ngcgcon * (ngcgcon_el(-12) / ngcgcon(-12)) ' ------------------------------------------------------------------------------------------------ ' ----- RESIDUAL FUEL OIL CONSUMPTION rfcgcon = rfchcon * (rfcgcon(-12) / rfchcon(-12)) rfcgcon_el = rfcgcon * (rfcgcon_el(-12) / rfcgcon(-12)) ' ------------------------------------------------------------------------------------------------ ' ----- DISTILLATE FUEL OIL CONSUMPTION dkcgcon = dkchcon * (dkcgcon(-12) / dkchcon(-12)) dkcgcon_el = dkcgcon * (dkcgcon_el(-12) / dkcgcon(-12)) ' ------------------------------------------------------------------------------------------------ ' ----- PETROLEUM COKE CONSUMPTION pccgcon = pcchcon * (pccgcon(-12) / pcchcon(-12))

January 2014
U.S. Energy Information Administration | STEO Model Documentation: Electricity Generation and Fuel Consumption Models 145
pccgcon_el = pccgcon * (pccgcon_el(-12) / pccgcon(-12)) ' ------------------------------------------------------------------------------------------------ ' ----- OTHER PETROLEUM LIQUIDS CONSUMPTION opcgcon = opchcon * (opcgcon(-12) / opchcon(-12)) opcgcon_el = opcgcon * (opcgcon_el(-12) / opcgcon(-12)) ' ------------------------------------------------------------------------------------------------ ' ----- TOTAL PETROLEUM CONSUMPTION pacgcon = rfcgcon + dkcgcon + pccgcon + opcgcon pacgcon_el = rfcgcon_el + dkcgcon_el + pccgcon_el + opcgcon_el ' ****************************************************************************** ' -------------------------------- COMMERCIAL SECTOR ------------------------------- ' --------------------------- FOSSIL FUEL CONSUMPTION --------------------------- ' ****************************************************************************** ' ------------------------------------------------------------------------------------------------ ' ----- COAL CONSUMPTION clcecon = clchcon * (clcecon(-12) / clchcon(-12)) clcecon_el = clcecon * (clcecon_el(-12) / clcecon(-12)) ' ------------------------------------------------------------------------------------------------ ' ----- NATURAL GAS CONSUMPTION ngcecon = ngchcon * (ngcecon(-12) / ngchcon(-12)) ngcecon_el = ngcecon * (ngcecon_el(-12) / ngcecon(-12)) ' ------------------------------------------------------------------------------------------------ ' ----- RESIDUAL FUEL OIL CONSUMPTION rfcecon = rfchcon * (rfcecon(-12) / rfchcon(-12)) rfcecon_el = rfcecon * (rfcecon_el(-12) / rfcecon(-12)) ' ------------------------------------------------------------------------------------------------ ' ----- DISTILLATE FUEL OIL CONSUMPTION dkcecon = dkchcon * (dkcecon(-12) / dkchcon(-12)) dkcecon_el = dkcecon * (dkcecon_el(-12) / dkcecon(-12)) ' ------------------------------------------------------------------------------------------------ ' ----- PETROLEUM COKE CONSUMPTION pccecon = pcchcon * (pccecon(-12) / pcchcon(-12)) pccecon_el = pccecon * (@movsum(pccecon_el(-1) , 12) / @movsum(pccecon(-1) , 12)) ' ------------------------------------------------------------------------------------------------ ' ----- OTHER PETROLEUM LIQUIDS CONSUMPTION opcecon = opchcon * (opcecon(-12) / opchcon(-12)) opcecon_el = opcecon * (@movsum(opcecon_el(-1) , 12) / @movsum(opcecon(-1) , 12))

January 2014
U.S. Energy Information Administration | STEO Model Documentation: Electricity Generation and Fuel Consumption Models 146
' ------------------------------------------------------------------------------------------------ ' ----- TOTAL PETROLEUM CONSUMPTION pacecon = rfcecon + dkcecon + pccecon + opcecon pacecon_el = rfcecon_el + dkcecon_el + pccecon_el + opcecon_el ' ****************************************************************************** ' --------------------------- FOSSIL FUEL CONSUMPTION --------------------------- ' -------------------------------------- ALL SECTORS ------------------------------------- ' ****************************************************************************** ' ------------------------------------------------------------------------------------------------ ' ----- TOTAL PHYSICAL CONSUMPTION (FOR GENERATION & HEATING) cltocon = clepcon + clchcon cltocon_mw = clepcon_mw + clchcon_mw cltocon_ne = clepcon_ne + clchcon_ne cltocon_so = clepcon_so + clchcon_so cltocon_we = clepcon_we + clchcon_we cltocon_us = clepcon_us + clchcon_us ngtocon = ngepcon + ngchcon ngtocon_mw = ngepcon_mw + ngchcon_mw ngtocon_ne = ngepcon_ne + ngchcon_ne ngtocon_so = ngepcon_so + ngchcon_so ngtocon_we = ngepcon_we + ngchcon_we ngtocon_us = ngepcon_us + ngchcon_us rftocon = rfepcon + rfchcon rftocon_mw = rfepcon_mw + rfchcon_mw rftocon_ne = rfepcon_ne + rfchcon_ne rftocon_so = rfepcon_so + rfchcon_so rftocon_we = rfepcon_we + rfchcon_we rftocon_us = rfepcon_us + rfchcon_us dktocon = dkepcon + dkchcon dktocon_mw = dkepcon_mw + dkchcon_mw dktocon_ne = dkepcon_ne + dkchcon_ne dktocon_so = dkepcon_so + dkchcon_so dktocon_we = dkepcon_we + dkchcon_we dktocon_us = dkepcon_us + dkchcon_us

January 2014
U.S. Energy Information Administration | STEO Model Documentation: Electricity Generation and Fuel Consumption Models 147
pctocon = pcepcon + pcchcon pctocon_mw = pcepcon_mw + pcchcon_mw pctocon_ne = pcepcon_ne + pcchcon_ne pctocon_so = pcepcon_so + pcchcon_so pctocon_we = pcepcon_we + pcchcon_we pctocon_us = pcepcon_us + pcchcon_us optocon = opepcon + opchcon optocon_mw = opepcon_mw + opchcon_mw optocon_ne = opepcon_ne + opchcon_ne optocon_so = opepcon_so + opchcon_so optocon_we = opepcon_we + opchcon_we optocon_us = opepcon_us + opchcon_us patocon = paepcon + pachcon patocon_mw = paepcon_mw + pachcon_mw patocon_ne = paepcon_ne + pachcon_ne patocon_so = paepcon_so + pachcon_so patocon_we = paepcon_we + pachcon_we patocon_us = paepcon_us + pachcon_us ' ------------------------------------------------------------------------------------------------ ' ----- PHYSICAL CONSUMPTION (FOR ELECTRIC GENERATION ONLY) cltocon_el = clepcon_el + clchcon_el cltocon_el_mw = clepcon_el_mw + clchcon_el_mw cltocon_el_ne = clepcon_el_ne + clchcon_el_ne cltocon_el_so = clepcon_el_so + clchcon_el_so cltocon_el_we = clepcon_el_we + clchcon_el_we cltocon_el_us = clepcon_el_us + clchcon_el_us ngtocon_el = ngepcon_el + ngchcon_el ngtocon_el_mw = ngepcon_el_mw + ngchcon_el_mw ngtocon_el_ne = ngepcon_el_ne + ngchcon_el_ne ngtocon_el_so = ngepcon_el_so + ngchcon_el_so ngtocon_el_we = ngepcon_el_we + ngchcon_el_we

January 2014
U.S. Energy Information Administration | STEO Model Documentation: Electricity Generation and Fuel Consumption Models 148
ngtocon_el_us = ngepcon_el_us + ngchcon_el_us rftocon_el = rfepcon_el + rfchcon_el rftocon_el_mw = rfepcon_el_mw + rfchcon_el_mw rftocon_el_ne = rfepcon_el_ne + rfchcon_el_ne rftocon_el_so = rfepcon_el_so + rfchcon_el_so rftocon_el_we = rfepcon_el_we + rfchcon_el_we rftocon_el_us = rfepcon_el_us + rfchcon_el_us dktocon_el = dkepcon_el + dkchcon_el dktocon_el_mw = dkepcon_el_mw + dkchcon_el_mw dktocon_el_ne = dkepcon_el_ne + dkchcon_el_ne dktocon_el_so = dkepcon_el_so + dkchcon_el_so dktocon_el_we = dkepcon_el_we + dkchcon_el_we dktocon_el_us = dkepcon_el_us + dkchcon_el_us pctocon_el = pcepcon_el + pcchcon_el pctocon_el_mw = pcepcon_el_mw + pcchcon_el_mw pctocon_el_ne = pcepcon_el_ne + pcchcon_el_ne pctocon_el_so = pcepcon_el_so + pcchcon_el_so pctocon_el_we = pcepcon_el_we + pcchcon_el_we pctocon_el_us = pcepcon_el_us + pcchcon_el_us optocon_el = opepcon_el + opchcon_el optocon_el_mw = opepcon_el_mw + opchcon_el_mw optocon_el_ne = opepcon_el_ne + opchcon_el_ne optocon_el_so = opepcon_el_so + opchcon_el_so optocon_el_we = opepcon_el_we + opchcon_el_we optocon_el_us = opepcon_el_us + opchcon_el_us patocon_el = paepcon_el + pachcon_el patocon_el_mw = paepcon_el_mw + pachcon_el_mw patocon_el_ne = paepcon_el_ne + pachcon_el_ne patocon_el_so = paepcon_el_so + pachcon_el_so patocon_el_we = paepcon_el_we + pachcon_el_we patocon_el_us = paepcon_el_us + pachcon_el_us

January 2014
U.S. Energy Information Administration | STEO Model Documentation: Electricity Generation and Fuel Consumption Models 149
' ****************************************************************************** ' ---------------------------- ELECTRIC POWER SECTOR --------------------------- ' -------------------------------- PETROLEUM STOCKS -------------------------------- ' ****************************************************************************** :EQ_RFPS_EP @ADD RFPS_EP RFPS_EP_A :EQ_DKPS_EP @ADD DKPS_EP DKPS_EP_A :EQ_PCPS_EP @ADD PCPS_EP PCPS_EP_A ' ****************************************************************************** ' ---------------------------- ELECTRIC POWER SECTOR --------------------------- ' ------------------------------ PETROLEUM DELIVERIES ---------------------------- ' ****************************************************************************** DFEPDEL = DKEPCON + (DKPS_EP - DKPS_EP(-1)) / ZSAJQUS RFEPDEL = RFEPCON + (RFPS_EP - RFPS_EP(-1)) / ZSAJQUS PCEPDEL = PCEPCON + (PCPS_EP - PCPS_EP(-1)) / ZSAJQUS
January 2014
U.S. Energy Information Administration | STEO Model Documentation: Electricity Generation and Fuel Consumption Models 150
Appendix E. Fuel Consumption Model Regression Results
Table 80 – CLEPCON_EL_MW, coal consumption for generation by electric power sector, Midwest region .............................. 151
Table 81 – CLEPCON_EL_NE, coal consumption for generation by electric power sector, Northeast region ............................... 152
Table 82 – CLEPCON_EL_SO, coal consumption for generation by electric power sector, South region ..................................... 153
Table 83 – CLEPCON_EL_WE, coal consumption for generation by electric power sector, West region ..................................... 154
Table 84 – CLEPCON_UTO_MW, coal consumption for useful thermal output by electric power sector, Midwest region ......... 155
Table 85 – CLEPCON_UTO_NE, coal consumption for useful thermal output by electric power sector, Northeast region ......... 156
Table 86 – CLEPCON_UTO_SO, coal consumption for useful thermal output by electric power sector, South region ................ 157
Table 87 – CLEPCON_UTO_WE, coal consumption for useful thermal output by electric power sector, West region ................ 158
Table 88 – NGEPCON_EL_MW, natural gas consumption for generation by electric power sector, Midwest region .................. 159
Table 89 – NGEPCON_EL_NE, natural gas consumption for generation by electric power sector, Northeast region .................. 160
Table 90 – NGEPCON_EL_SO, natural gas consumption for generation by electric power sector, South region ......................... 161
Table 91 – NGEPCON_EL_WE, natural gas consumption for generation by electric power sector, West region ......................... 162
Table 92 – NGEPCON_UTO_MW, natural gas consumption for useful thermal output by electric power sector, Midwest region
...................................................................................................................................................................................................... 163
Table 93 – NGEPCON_UTO_NE, natural gas consumption for useful thermal output by electric power sector, Northeast region
...................................................................................................................................................................................................... 164
Table 94 – NGEPCON_UTO_SO, natural gas consumption for useful thermal output by electric power sector, South region .... 165
Table 95 – NGEPCON_UTO_WE, natural gas consumption for useful thermal output by electric power sector, West region .... 166
Table 96 – DKEPCON_EL_MW, distillate fuel oil consumption for generation by electric power sector, Midwest region ........... 167
Table 97 – DKEPCON_EL_NE, distillate fuel oil consumption for generation by electric power sector, Northeast region ........... 168
Table 98 – DKEPCON_EL_SO, distillate fuel oil consumption for generation by electric power sector, South region .................. 169
Table 99 – DKEPCON_EL_WE, distillate fuel oil consumption for generation by electric power sector, West region .................. 170
Table 100 – PCEPCON_EL_MW, petroleum coke consumption for generation by electric power sector, Midwest region ......... 171
Table 101 – PCEPCON_EL_SO, petroleum coke consumption for generation by electric power sector, South region ................ 172
Table 102 – PCEPCON_EL_WE, petroleum coke consumption for generation by electric power sector, West region ................ 173
Table 103 – OPEPCON_EL_NE, other petroleum liquids consumption for generation by electric power sector, Northeast
generation .................................................................................................................................................................................... 174
Table 104 – OPEPCON_EL_SO, other petroleum liquids consumption for generation by electric power sector, South region ... 175
Table 105 – OPEPCON_EL_WE, other petroleum liquids consumption for generation by electric power sector, West region ... 176

January 2014
U.S. Energy Information Administration | STEO Model Documentation: Electricity Generation and Fuel Consumption Models 151
Table 80 – CLEPCON_EL_MW, coal consumption for generation by electric power sector, Midwest region
Dependent Variable: CLEPCON_EL_MW/CLEP_MW
Method: Least Squares
Date: 08/15/13 Time: 12:42
Sample: 2004M01 2013M03
Included observations: 111 Variable Coefficient Std. Error t-Statistic Prob. C 0.440895 0.056122 7.856039 0.0000
CLEP_MW/EPEO_MW -0.049286 0.010656 -4.625324 0.0000
FEB 3.64E-05 0.001453 0.025039 0.9801
MAR 0.000481 0.001476 0.325794 0.7453
APR 0.000910 0.001545 0.588947 0.5573
MAY 0.000285 0.001531 0.186208 0.8527
JUN 0.000519 0.001497 0.346816 0.7295
JUL 0.003020 0.001501 2.012251 0.0471
AUG 0.003497 0.001495 2.338895 0.0215
SEP 0.003841 0.001507 2.548344 0.0124
OCT 0.000593 0.001521 0.390057 0.6974
NOV -0.000694 0.001487 -0.466886 0.6417
DEC 0.002858 0.001549 1.844899 0.0682
D08ON 0.004949 0.001040 4.756162 0.0000
D0712 0.010013 0.003471 2.885060 0.0049
D1204 -0.013425 0.003625 -3.703596 0.0004
CLEPCON_EL_MW(-1)/CLEP_MW(-1) 0.269178 0.093258 2.886389 0.0048 R-squared 0.795383 Mean dependent var 0.562134
Adjusted R-squared 0.760554 S.D. dependent var 0.006610
S.E. of regression 0.003234 Akaike info criterion -8.489851
Sum squared resid 0.000983 Schwarz criterion -8.074878
Log likelihood 488.1867 Hannan-Quinn criter. -8.321509
F-statistic 22.83714 Durbin-Watson stat 2.038711
Prob(F-statistic) 0.000000

January 2014
U.S. Energy Information Administration | STEO Model Documentation: Electricity Generation and Fuel Consumption Models 152
Table 81 – CLEPCON_EL_NE, coal consumption for generation by electric power sector, Northeast region
Dependent Variable: CLEPCON_EL_NE/CLEP_NE
Method: Least Squares
Date: 08/15/13 Time: 12:45
Sample: 2005M01 2013M03
Included observations: 99 Variable Coefficient Std. Error t-Statistic Prob. C 0.381650 0.044120 8.650360 0.0000
CLEP_NE/EPEO_NE -0.092335 0.015742 -5.865714 0.0000
FEB 0.001941 0.002783 0.697317 0.4876
MAR 0.003929 0.002883 1.363040 0.1766
APR 0.004970 0.002777 1.789648 0.0772
MAY 0.004657 0.002813 1.655362 0.1016
JUN 0.004453 0.002757 1.615445 0.1100
JUL 0.005862 0.002784 2.105532 0.0383
AUG 0.005727 0.002777 2.062163 0.0423
SEP 0.007418 0.002814 2.635698 0.0100
OCT 0.005184 0.002748 1.886663 0.0627
NOV 0.005837 0.002751 2.121606 0.0369
DEC 0.008312 0.002740 3.033458 0.0032
D05 -0.006577 0.001939 -3.391550 0.0011
D1103 0.022212 0.006025 3.686700 0.0004
CLEPCON_EL_NE(-1)/CLEP_NE(-1) 0.209551 0.088934 2.356241 0.0208 R-squared 0.735075 Mean dependent var 0.456739
Adjusted R-squared 0.687198 S.D. dependent var 0.009997
S.E. of regression 0.005591 Akaike info criterion -7.388388
Sum squared resid 0.002594 Schwarz criterion -6.968975
Log likelihood 381.7252 Hannan-Quinn criter. -7.218693
F-statistic 15.35312 Durbin-Watson stat 1.998203
Prob(F-statistic) 0.000000

January 2014
U.S. Energy Information Administration | STEO Model Documentation: Electricity Generation and Fuel Consumption Models 153
Table 82 – CLEPCON_EL_SO, coal consumption for generation by electric power sector, South region
Dependent Variable: CLEPCON_EL_SO/CLEP_SO
Method: Least Squares
Date: 08/15/13 Time: 12:45
Sample: 2001M01 2013M03
Included observations: 147 Variable Coefficient Std. Error t-Statistic Prob. C 0.303522 0.044969 6.749545 0.0000
CLEP_SO/EPEO_SO -0.120817 0.020094 -6.012613 0.0000
FEB 0.001478 0.001874 0.788850 0.4316
MAR -0.003693 0.001925 -1.918472 0.0572
APR 0.000836 0.002219 0.376692 0.7070
MAY 0.003632 0.001998 1.817864 0.0714
JUN -0.000964 0.001985 -0.485328 0.6282
JUL -0.002074 0.002043 -1.015187 0.3119
AUG -0.000261 0.002152 -0.121045 0.9038
SEP 0.004432 0.001960 2.261068 0.0254
OCT 0.001018 0.001891 0.538100 0.5914
NOV 0.004884 0.001887 2.588733 0.0107
DEC 0.004536 0.001886 2.404848 0.0176
D07ON 0.003008 0.001116 2.696761 0.0079
CLEPCON_EL_SO(-1)/CLEP_SO(-1) 0.512008 0.070859 7.225769 0.0000 R-squared 0.927267 Mean dependent var 0.504036
Adjusted R-squared 0.919553 S.D. dependent var 0.016510
S.E. of regression 0.004683 Akaike info criterion -7.793437
Sum squared resid 0.002894 Schwarz criterion -7.488291
Log likelihood 587.8176 Hannan-Quinn criter. -7.669453
F-statistic 120.2038 Durbin-Watson stat 1.880282
Prob(F-statistic) 0.000000

January 2014
U.S. Energy Information Administration | STEO Model Documentation: Electricity Generation and Fuel Consumption Models 154
Table 83 – CLEPCON_EL_WE, coal consumption for generation by electric power sector, West region
Dependent Variable: CLEPCON_EL_WE/CLEP_WE
Method: Least Squares
Date: 08/15/13 Time: 12:45
Sample: 2001M01 2013M03
Included observations: 147 Variable Coefficient Std. Error t-Statistic Prob. C 0.408773 0.046896 8.716635 0.0000
CLEP_WE/EPEO_WE -0.052963 0.013401 -3.952246 0.0001
FEB 0.002608 0.001367 1.907665 0.0586
MAR 0.000453 0.001384 0.327096 0.7441
APR -0.004525 0.001488 -3.041499 0.0028
MAY -0.009614 0.001569 -6.126517 0.0000
JUN -0.006440 0.001787 -3.604153 0.0004
JUL -0.003895 0.001691 -2.302992 0.0229
AUG -0.002461 0.001522 -1.616961 0.1083
SEP -0.002438 0.001426 -1.709546 0.0897
OCT 0.001149 0.001408 0.815837 0.4161
NOV 0.004122 0.001401 2.942516 0.0039
DEC 0.000889 0.001414 0.628869 0.5305
D01 -0.002352 0.001217 -1.932428 0.0555
D10ON 0.003869 0.000928 4.168204 0.0001
CLEPCON_EL_WE(-1)/CLEP_WE(-1) 0.291350 0.081377 3.580229 0.0005 R-squared 0.759187 Mean dependent var 0.551739
Adjusted R-squared 0.731613 S.D. dependent var 0.006712
S.E. of regression 0.003477 Akaike info criterion -8.382692
Sum squared resid 0.001584 Schwarz criterion -8.057202
Log likelihood 632.1278 Hannan-Quinn criter. -8.250442
F-statistic 27.53269 Durbin-Watson stat 2.050515
Prob(F-statistic) 0.000000
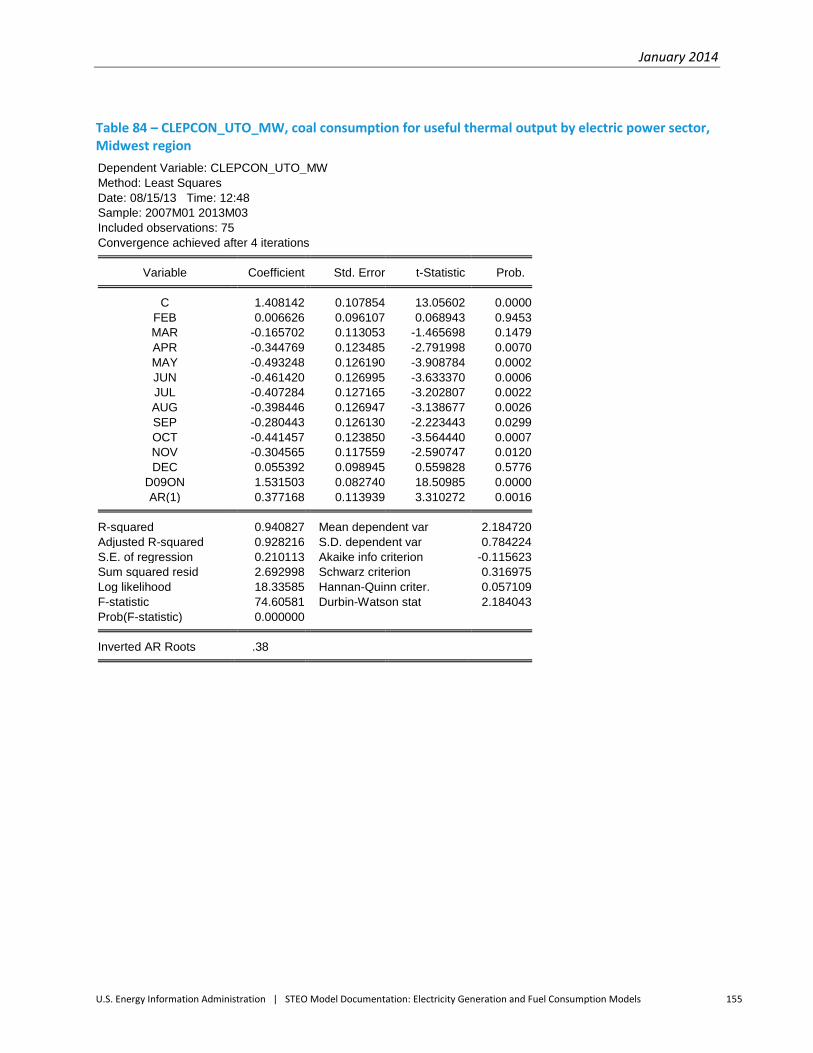
January 2014
U.S. Energy Information Administration | STEO Model Documentation: Electricity Generation and Fuel Consumption Models 155
Table 84 – CLEPCON_UTO_MW, coal consumption for useful thermal output by electric power sector, Midwest region
Dependent Variable: CLEPCON_UTO_MW
Method: Least Squares
Date: 08/15/13 Time: 12:48
Sample: 2007M01 2013M03
Included observations: 75
Convergence achieved after 4 iterations Variable Coefficient Std. Error t-Statistic Prob. C 1.408142 0.107854 13.05602 0.0000
FEB 0.006626 0.096107 0.068943 0.9453
MAR -0.165702 0.113053 -1.465698 0.1479
APR -0.344769 0.123485 -2.791998 0.0070
MAY -0.493248 0.126190 -3.908784 0.0002
JUN -0.461420 0.126995 -3.633370 0.0006
JUL -0.407284 0.127165 -3.202807 0.0022
AUG -0.398446 0.126947 -3.138677 0.0026
SEP -0.280443 0.126130 -2.223443 0.0299
OCT -0.441457 0.123850 -3.564440 0.0007
NOV -0.304565 0.117559 -2.590747 0.0120
DEC 0.055392 0.098945 0.559828 0.5776
D09ON 1.531503 0.082740 18.50985 0.0000
AR(1) 0.377168 0.113939 3.310272 0.0016 R-squared 0.940827 Mean dependent var 2.184720
Adjusted R-squared 0.928216 S.D. dependent var 0.784224
S.E. of regression 0.210113 Akaike info criterion -0.115623
Sum squared resid 2.692998 Schwarz criterion 0.316975
Log likelihood 18.33585 Hannan-Quinn criter. 0.057109
F-statistic 74.60581 Durbin-Watson stat 2.184043
Prob(F-statistic) 0.000000 Inverted AR Roots .38

January 2014
U.S. Energy Information Administration | STEO Model Documentation: Electricity Generation and Fuel Consumption Models 156
Table 85 – CLEPCON_UTO_NE, coal consumption for useful thermal output by electric power sector, Northeast region
Dependent Variable: CLEPCON_UTO_NE
Method: Least Squares
Date: 08/15/13 Time: 12:48
Sample: 2005M01 2013M03
Included observations: 99
Convergence achieved after 5 iterations Variable Coefficient Std. Error t-Statistic Prob. C 3.983985 0.111297 35.79606 0.0000
FEB 0.017930 0.131304 0.136553 0.8917
MAR -0.373517 0.141915 -2.631966 0.0101
APR -0.562697 0.147954 -3.803190 0.0003
MAY -0.680288 0.148379 -4.584813 0.0000
JUN -0.665211 0.148437 -4.481435 0.0000
JUL -0.467333 0.148446 -3.148174 0.0023
AUG -0.506407 0.148440 -3.411523 0.0010
SEP -0.864517 0.148396 -5.825737 0.0000
OCT -1.008511 0.148122 -6.808656 0.0000
NOV -0.405564 0.146415 -2.769963 0.0069
DEC -0.461553 0.135390 -3.409063 0.0010
D09ON -0.795885 0.072067 -11.04373 0.0000
AR(1) 0.161829 0.092444 1.750567 0.0836 R-squared 0.764527 Mean dependent var 3.090814
Adjusted R-squared 0.728513 S.D. dependent var 0.573277
S.E. of regression 0.298703 Akaike info criterion 0.551623
Sum squared resid 7.583978 Schwarz criterion 0.918610
Log likelihood -13.30536 Hannan-Quinn criter. 0.700107
F-statistic 21.22888 Durbin-Watson stat 1.897992
Prob(F-statistic) 0.000000 Inverted AR Roots .16

January 2014
U.S. Energy Information Administration | STEO Model Documentation: Electricity Generation and Fuel Consumption Models 157
Table 86 – CLEPCON_UTO_SO, coal consumption for useful thermal output by electric power sector, South region
Dependent Variable: CLEPCON_UTO_SO
Method: Least Squares
Date: 08/15/13 Time: 12:48
Sample: 2004M01 2013M03
Included observations: 111
Convergence achieved after 8 iterations Variable Coefficient Std. Error t-Statistic Prob. C 5.020095 0.213773 23.48324 0.0000
FEB -0.165767 0.180330 -0.919244 0.3602
MAR -0.358199 0.223302 -1.604104 0.1119
APR -1.106796 0.248794 -4.448651 0.0000
MAY -0.405077 0.259806 -1.559152 0.1222
JUN -0.072681 0.264557 -0.274728 0.7841
JUL -0.075041 0.265886 -0.282228 0.7784
AUG -0.060485 0.264552 -0.228631 0.8196
SEP -0.517717 0.259986 -1.991325 0.0493
OCT -0.602592 0.250017 -2.410202 0.0178
NOV -0.849727 0.229342 -3.705064 0.0004
DEC -0.413756 0.183547 -2.254226 0.0264
D09ON -0.960982 0.193641 -4.962697 0.0000
AR(1) 0.528409 0.078058 6.769400 0.0000 R-squared 0.685880 Mean dependent var 4.177612
Adjusted R-squared 0.643781 S.D. dependent var 0.832302
S.E. of regression 0.496751 Akaike info criterion 1.555979
Sum squared resid 23.93591 Schwarz criterion 1.897722
Log likelihood -72.35683 Hannan-Quinn criter. 1.694614
F-statistic 16.29223 Durbin-Watson stat 1.806170
Prob(F-statistic) 0.000000 Inverted AR Roots .53
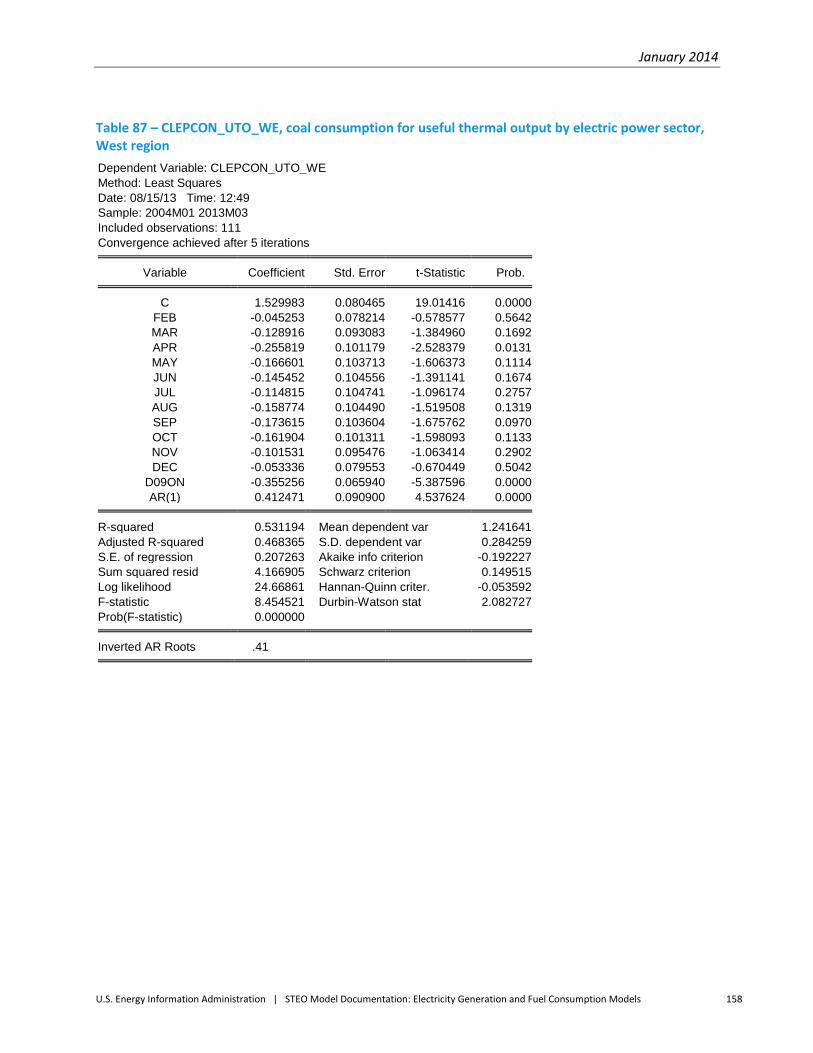
January 2014
U.S. Energy Information Administration | STEO Model Documentation: Electricity Generation and Fuel Consumption Models 158
Table 87 – CLEPCON_UTO_WE, coal consumption for useful thermal output by electric power sector, West region
Dependent Variable: CLEPCON_UTO_WE
Method: Least Squares
Date: 08/15/13 Time: 12:49
Sample: 2004M01 2013M03
Included observations: 111
Convergence achieved after 5 iterations Variable Coefficient Std. Error t-Statistic Prob. C 1.529983 0.080465 19.01416 0.0000
FEB -0.045253 0.078214 -0.578577 0.5642
MAR -0.128916 0.093083 -1.384960 0.1692
APR -0.255819 0.101179 -2.528379 0.0131
MAY -0.166601 0.103713 -1.606373 0.1114
JUN -0.145452 0.104556 -1.391141 0.1674
JUL -0.114815 0.104741 -1.096174 0.2757
AUG -0.158774 0.104490 -1.519508 0.1319
SEP -0.173615 0.103604 -1.675762 0.0970
OCT -0.161904 0.101311 -1.598093 0.1133
NOV -0.101531 0.095476 -1.063414 0.2902
DEC -0.053336 0.079553 -0.670449 0.5042
D09ON -0.355256 0.065940 -5.387596 0.0000
AR(1) 0.412471 0.090900 4.537624 0.0000 R-squared 0.531194 Mean dependent var 1.241641
Adjusted R-squared 0.468365 S.D. dependent var 0.284259
S.E. of regression 0.207263 Akaike info criterion -0.192227
Sum squared resid 4.166905 Schwarz criterion 0.149515
Log likelihood 24.66861 Hannan-Quinn criter. -0.053592
F-statistic 8.454521 Durbin-Watson stat 2.082727
Prob(F-statistic) 0.000000 Inverted AR Roots .41
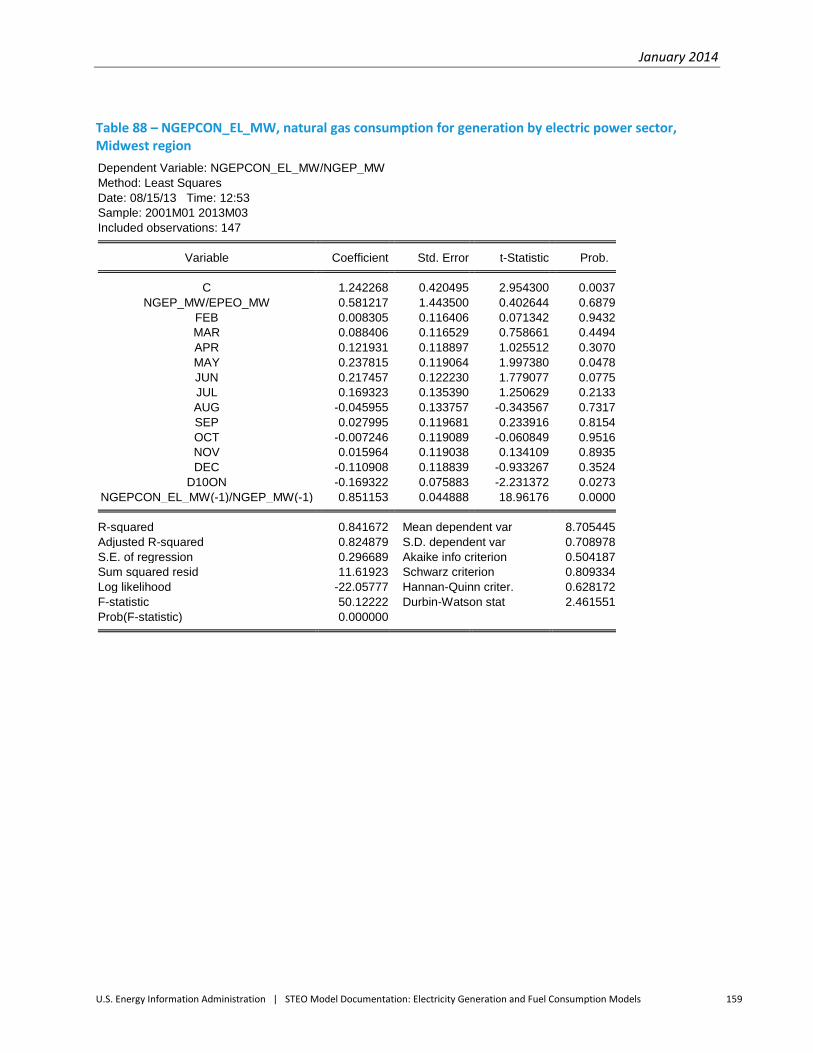
January 2014
U.S. Energy Information Administration | STEO Model Documentation: Electricity Generation and Fuel Consumption Models 159
Table 88 – NGEPCON_EL_MW, natural gas consumption for generation by electric power sector, Midwest region
Dependent Variable: NGEPCON_EL_MW/NGEP_MW
Method: Least Squares
Date: 08/15/13 Time: 12:53
Sample: 2001M01 2013M03
Included observations: 147 Variable Coefficient Std. Error t-Statistic Prob. C 1.242268 0.420495 2.954300 0.0037
NGEP_MW/EPEO_MW 0.581217 1.443500 0.402644 0.6879
FEB 0.008305 0.116406 0.071342 0.9432
MAR 0.088406 0.116529 0.758661 0.4494
APR 0.121931 0.118897 1.025512 0.3070
MAY 0.237815 0.119064 1.997380 0.0478
JUN 0.217457 0.122230 1.779077 0.0775
JUL 0.169323 0.135390 1.250629 0.2133
AUG -0.045955 0.133757 -0.343567 0.7317
SEP 0.027995 0.119681 0.233916 0.8154
OCT -0.007246 0.119089 -0.060849 0.9516
NOV 0.015964 0.119038 0.134109 0.8935
DEC -0.110908 0.118839 -0.933267 0.3524
D10ON -0.169322 0.075883 -2.231372 0.0273
NGEPCON_EL_MW(-1)/NGEP_MW(-1) 0.851153 0.044888 18.96176 0.0000 R-squared 0.841672 Mean dependent var 8.705445
Adjusted R-squared 0.824879 S.D. dependent var 0.708978
S.E. of regression 0.296689 Akaike info criterion 0.504187
Sum squared resid 11.61923 Schwarz criterion 0.809334
Log likelihood -22.05777 Hannan-Quinn criter. 0.628172
F-statistic 50.12222 Durbin-Watson stat 2.461551
Prob(F-statistic) 0.000000

January 2014
U.S. Energy Information Administration | STEO Model Documentation: Electricity Generation and Fuel Consumption Models 160
Table 89 – NGEPCON_EL_NE, natural gas consumption for generation by electric power sector, Northeast region
Dependent Variable: NGEPCON_EL_NE/NGEP_NE
Method: Least Squares
Date: 08/15/13 Time: 12:53
Sample: 2001M01 2013M03
Included observations: 147 Variable Coefficient Std. Error t-Statistic Prob. C 1.358890 0.394258 3.446703 0.0008
NGEP_NE/EPEO_NE -0.554098 0.231611 -2.392365 0.0181
FEB 0.036193 0.054175 0.668088 0.5052
MAR 0.041688 0.054580 0.763783 0.4463
APR 0.115843 0.056272 2.058634 0.0415
MAY 0.208547 0.056777 3.673065 0.0003
JUN 0.243500 0.060001 4.058284 0.0001
JUL 0.223747 0.066544 3.362385 0.0010
AUG 0.112441 0.068713 1.636373 0.1041
SEP -0.022289 0.065925 -0.338098 0.7358
OCT -0.006254 0.060444 -0.103464 0.9178
NOV 0.019803 0.056994 0.347454 0.7288
DEC -0.037192 0.055694 -0.667788 0.5054
NGEPCON_EL_NE(-1)/NGEP_NE(-1) 0.835011 0.046826 17.83233 0.0000 R-squared 0.863560 Mean dependent var 7.915932
Adjusted R-squared 0.850224 S.D. dependent var 0.356456
S.E. of regression 0.137952 Akaike info criterion -1.033435
Sum squared resid 2.531076 Schwarz criterion -0.748632
Log likelihood 89.95746 Hannan-Quinn criter. -0.917716
F-statistic 64.75313 Durbin-Watson stat 2.296724
Prob(F-statistic) 0.000000

January 2014
U.S. Energy Information Administration | STEO Model Documentation: Electricity Generation and Fuel Consumption Models 161
Table 90 – NGEPCON_EL_SO, natural gas consumption for generation by electric power sector, South region
Dependent Variable: NGEPCON_EL_SO/NGEP_SO
Method: Least Squares
Date: 08/15/13 Time: 12:53
Sample: 2001M01 2013M03
Included observations: 147 Variable Coefficient Std. Error t-Statistic Prob. C 0.608306 0.272400 2.233138 0.0272
NGEP_SO/EPEO_SO -0.324562 0.237954 -1.363970 0.1749
FEB 0.031402 0.049889 0.629442 0.5302
MAR 0.152428 0.049941 3.052188 0.0028
APR 0.197659 0.051890 3.809165 0.0002
MAY 0.307153 0.052814 5.815690 0.0000
JUN 0.062140 0.056732 1.095314 0.2754
JUL 0.227730 0.057681 3.948075 0.0001
AUG 0.099431 0.060357 1.647378 0.1019
SEP -0.009550 0.056139 -0.170109 0.8652
OCT 0.079739 0.053051 1.503054 0.1353
NOV -0.090952 0.051266 -1.774131 0.0784
DEC 0.083397 0.051902 1.606804 0.1105
D0101 0.445829 0.128453 3.470749 0.0007
D0112 -0.262263 0.128931 -2.034141 0.0440
D0201 0.509636 0.127752 3.989255 0.0001
NGEPCON_EL_SO(-1)/NGEP_SO(-1) 0.922373 0.029318 31.46109 0.0000 R-squared 0.947262 Mean dependent var 8.207672
Adjusted R-squared 0.940772 S.D. dependent var 0.499727
S.E. of regression 0.121618 Akaike info criterion -1.267469
Sum squared resid 1.922822 Schwarz criterion -0.921637
Log likelihood 110.1590 Hannan-Quinn criter. -1.126954
F-statistic 145.9397 Durbin-Watson stat 2.564210
Prob(F-statistic) 0.000000

January 2014
U.S. Energy Information Administration | STEO Model Documentation: Electricity Generation and Fuel Consumption Models 162
Table 91 – NGEPCON_EL_WE, natural gas consumption for generation by electric power sector, West region
Dependent Variable: NGEPCON_EL_WE/NGEP_WE
Method: Least Squares
Date: 08/15/13 Time: 12:53
Sample: 2006M01 2013M03
Included observations: 87 Variable Coefficient Std. Error t-Statistic Prob. C 3.036756 0.670312 4.530362 0.0000
NGEP_WE/EPEO_WE -0.904145 0.288724 -3.131517 0.0025
FEB -0.013607 0.041583 -0.327224 0.7444
MAR 0.036426 0.041509 0.877543 0.3831
APR 0.150609 0.043208 3.485646 0.0008
MAY 0.123200 0.045944 2.681520 0.0091
JUN 0.109009 0.049010 2.224199 0.0292
JUL 0.140971 0.057378 2.456877 0.0164
AUG 0.130610 0.062363 2.094334 0.0397
SEP 0.065878 0.059951 1.098863 0.2754
OCT 0.010770 0.052361 0.205686 0.8376
NOV 0.031320 0.044878 0.697885 0.4875
DEC -0.052753 0.044308 -1.190584 0.2377
NGEPCON_EL_WE(-1)/NGEP_WE(-1) 0.626366 0.084012 7.455646 0.0000 R-squared 0.830301 Mean dependent var 7.617305
Adjusted R-squared 0.800080 S.D. dependent var 0.184953
S.E. of regression 0.082697 Akaike info criterion -2.000877
Sum squared resid 0.499232 Schwarz criterion -1.604064
Log likelihood 101.0381 Hannan-Quinn criter. -1.841092
F-statistic 27.47481 Durbin-Watson stat 1.883861
Prob(F-statistic) 0.000000

January 2014
U.S. Energy Information Administration | STEO Model Documentation: Electricity Generation and Fuel Consumption Models 163
Table 92 – NGEPCON_UTO_MW, natural gas consumption for useful thermal output by electric power sector, Midwest region
Dependent Variable: NGEPCON_UTO_MW
Method: Least Squares
Date: 08/15/13 Time: 12:58
Sample: 2005M01 2013M03
Included observations: 99
Convergence achieved after 3 iterations Variable Coefficient Std. Error t-Statistic Prob. C 103.0813 4.161650 24.76934 0.0000
FEB 2.696210 4.509563 0.597887 0.5515
MAR -7.632980 5.350447 -1.426606 0.1573
APR -18.97575 5.810755 -3.265626 0.0016
MAY -25.97017 5.949886 -4.364817 0.0000
JUN -6.602003 5.996531 -1.100970 0.2740
JUL 4.213803 6.007395 0.701436 0.4849
AUG 4.845859 5.994496 0.808385 0.4211
SEP -19.15680 5.946655 -3.221441 0.0018
OCT -20.36057 5.820171 -3.498277 0.0007
NOV -16.70334 5.492082 -3.041350 0.0031
DEC -4.069117 4.579421 -0.888566 0.3767
AR(1) 0.404309 0.098477 4.105641 0.0001 R-squared 0.538771 Mean dependent var 94.35548
Adjusted R-squared 0.474414 S.D. dependent var 15.58965
S.E. of regression 11.30208 Akaike info criterion 7.809704
Sum squared resid 10985.38 Schwarz criterion 8.150478
Log likelihood -373.5804 Hannan-Quinn criter. 7.947582
F-statistic 8.371541 Durbin-Watson stat 1.869232
Prob(F-statistic) 0.000000 Inverted AR Roots .40

January 2014
U.S. Energy Information Administration | STEO Model Documentation: Electricity Generation and Fuel Consumption Models 164
Table 93 – NGEPCON_UTO_NE, natural gas consumption for useful thermal output by electric power sector, Northeast region
Dependent Variable: NGEPCON_UTO_NE
Method: Least Squares
Date: 08/15/13 Time: 12:58
Sample: 2005M01 2013M03
Included observations: 99
Convergence achieved after 6 iterations Variable Coefficient Std. Error t-Statistic Prob. C 109.5283 6.306976 17.36622 0.0000
FEB 5.938560 5.921315 1.002912 0.3188
MAR 2.564773 7.070433 0.362746 0.7177
APR 0.173102 7.716033 0.022434 0.9822
MAY -2.603192 7.924395 -0.328504 0.7433
JUN 5.278039 8.216741 0.642352 0.5224
JUL 20.38048 8.015148 2.542745 0.0128
AUG 18.63749 7.995727 2.330931 0.0222
SEP -1.060100 7.923926 -0.133785 0.8939
OCT -11.24824 7.739812 -1.453296 0.1499
NOV -11.60907 7.278832 -1.594908 0.1145
DEC -2.336188 6.041463 -0.386692 0.7000
D0806 101.3305 14.81930 6.837738 0.0000
D09ON -9.524093 5.088015 -1.871868 0.0647
AR(1) 0.420792 0.095268 4.416921 0.0000 R-squared 0.598094 Mean dependent var 107.9714
Adjusted R-squared 0.531110 S.D. dependent var 21.79253
S.E. of regression 14.92255 Akaike info criterion 8.382351
Sum squared resid 18705.33 Schwarz criterion 8.775551
Log likelihood -399.9264 Hannan-Quinn criter. 8.541441
F-statistic 8.928875 Durbin-Watson stat 2.053609
Prob(F-statistic) 0.000000 Inverted AR Roots .42

January 2014
U.S. Energy Information Administration | STEO Model Documentation: Electricity Generation and Fuel Consumption Models 165
Table 94 – NGEPCON_UTO_SO, natural gas consumption for useful thermal output by electric power sector, South region
Dependent Variable: NGEPCON_UTO_SO
Method: Least Squares
Date: 08/15/13 Time: 12:58
Sample: 2006M01 2013M03
Included observations: 87
Convergence achieved after 4 iterations Variable Coefficient Std. Error t-Statistic Prob. C 483.5201 10.18596 47.46929 0.0000
FEB -4.249199 11.35319 -0.374274 0.7093
MAR -23.12374 12.40279 -1.864397 0.0663
APR -21.52254 13.04639 -1.649693 0.1033
MAY -8.083749 13.08396 -0.617836 0.5386
JUN 17.41166 13.08593 1.330563 0.1875
JUL 46.98856 13.08555 3.590873 0.0006
AUG 42.39617 13.08443 3.240200 0.0018
SEP 2.833528 13.07881 0.216650 0.8291
OCT -28.73446 13.04745 -2.202305 0.0308
NOV -21.27351 12.87028 -1.652917 0.1026
DEC -1.057558 11.82804 -0.089411 0.9290
D09ON -10.19752 6.541722 -1.558843 0.1234
AR(1) 0.178376 0.079968 2.230585 0.0288 R-squared 0.552893 Mean dependent var 477.9239
Adjusted R-squared 0.473271 S.D. dependent var 33.61492
S.E. of regression 24.39639 Akaike info criterion 9.373138
Sum squared resid 43448.42 Schwarz criterion 9.769951
Log likelihood -393.7315 Hannan-Quinn criter. 9.532922
F-statistic 6.943991 Durbin-Watson stat 1.366691
Prob(F-statistic) 0.000000 Inverted AR Roots .18

January 2014
U.S. Energy Information Administration | STEO Model Documentation: Electricity Generation and Fuel Consumption Models 166
Table 95 – NGEPCON_UTO_WE, natural gas consumption for useful thermal output by electric power sector, West region
Dependent Variable: NGEPCON_UTO_WE
Method: Least Squares
Date: 08/15/13 Time: 12:58
Sample: 2006M01 2013M03
Included observations: 87
Convergence achieved after 22 iterations Variable Coefficient Std. Error t-Statistic Prob. C 209.5998 10.08289 20.78768 0.0000
FEB -6.831822 4.477869 -1.525686 0.1314
MAR -18.20322 5.935281 -3.066952 0.0030
APR -12.28778 6.976931 -1.761201 0.0824
MAY -22.67327 7.587164 -2.988373 0.0038
JUN -11.85198 7.915947 -1.497228 0.1386
JUL 15.23022 8.026332 1.897532 0.0617
AUG 26.47639 7.939367 3.334824 0.0013
SEP 13.89234 7.645310 1.817106 0.0733
OCT 3.569010 7.099248 0.502731 0.6167
NOV -6.536484 6.193947 -1.055302 0.2948
DEC 5.270742 4.643645 1.135044 0.2601
D09ON -17.13341 10.04193 -1.706187 0.0922
AR(1) 0.773805 0.081260 9.522625 0.0000 R-squared 0.832775 Mean dependent var 198.4262
Adjusted R-squared 0.802995 S.D. dependent var 26.90832
S.E. of regression 11.94331 Akaike info criterion 7.944610
Sum squared resid 10412.92 Schwarz criterion 8.341423
Log likelihood -331.5905 Hannan-Quinn criter. 8.104395
F-statistic 27.96446 Durbin-Watson stat 2.377474
Prob(F-statistic) 0.000000 Inverted AR Roots .77

January 2014
U.S. Energy Information Administration | STEO Model Documentation: Electricity Generation and Fuel Consumption Models 167
Table 96 – DKEPCON_EL_MW, distillate fuel oil consumption for generation by electric power sector, Midwest region
Dependent Variable: DKEPCON_EL_MW/DKEP_MW
Method: Least Squares
Date: 08/22/13 Time: 15:57
Sample: 2001M01 2013M03
Included observations: 147 Variable Coefficient Std. Error t-Statistic Prob. C 1.174552 0.149349 7.864467 0.0000
FEB -0.049983 0.034841 -1.434600 0.1538
MAR -0.081107 0.034803 -2.330448 0.0213
APR -0.044316 0.035857 -1.235890 0.2187
MAY -0.110001 0.035687 -3.082388 0.0025
JUN -0.029597 0.037191 -0.795798 0.4276
JUL -0.028800 0.035529 -0.810599 0.4191
AUG -0.021159 0.036344 -0.582181 0.5614
SEP -0.105165 0.035524 -2.960409 0.0036
OCT -0.070373 0.036000 -1.954816 0.0527
NOV -0.067021 0.035978 -1.862810 0.0647
DEC -0.006626 0.035932 -0.184406 0.8540
D1206 0.434438 0.092823 4.680291 0.0000
D1208 -0.169209 0.092686 -1.825608 0.0702
DKEPCON_EL_MW(-1)/DKEP_MW(-1) 0.459376 0.069351 6.623939 0.0000 R-squared 0.437102 Mean dependent var 2.082260
Adjusted R-squared 0.377401 S.D. dependent var 0.112422
S.E. of regression 0.088707 Akaike info criterion -1.910511
Sum squared resid 1.038693 Schwarz criterion -1.605365
Log likelihood 155.4226 Hannan-Quinn criter. -1.786527
F-statistic 7.321484 Durbin-Watson stat 1.851188
Prob(F-statistic) 0.000000

January 2014
U.S. Energy Information Administration | STEO Model Documentation: Electricity Generation and Fuel Consumption Models 168
Table 97 – DKEPCON_EL_NE, distillate fuel oil consumption for generation by electric power sector, Northeast region
Dependent Variable: DKEPCON_EL_NE/DKEP_NE
Method: Least Squares
Date: 08/22/13 Time: 15:57
Sample: 2001M01 2013M03
Included observations: 147 Variable Coefficient Std. Error t-Statistic Prob. C 1.008260 0.134028 7.522780 0.0000
FEB 0.169268 0.076124 2.223571 0.0279
MAR 0.119077 0.075527 1.576610 0.1173
APR 0.074980 0.078865 0.950744 0.3435
MAY 0.168649 0.077192 2.184813 0.0307
JUN 0.145584 0.077076 1.888835 0.0611
JUL 0.181415 0.077215 2.349471 0.0203
AUG 0.214470 0.077524 2.766492 0.0065
SEP 0.111284 0.078008 1.426575 0.1561
OCT 0.032399 0.077415 0.418513 0.6763
NOV 0.189838 0.077022 2.464728 0.0150
DEC -0.056223 0.078964 -0.712009 0.4777
D0601 -0.937954 0.197103 -4.758698 0.0000
D0604 -1.216809 0.198793 -6.120999 0.0000
D1112 0.598071 0.197736 3.024592 0.0030
DKEPCON_EL_NE(-1)/DKEP_NE(-1) 0.467836 0.060051 7.790612 0.0000 R-squared 0.600856 Mean dependent var 2.084484
Adjusted R-squared 0.555153 S.D. dependent var 0.282844
S.E. of regression 0.188648 Akaike info criterion -0.395414
Sum squared resid 4.662048 Schwarz criterion -0.069924
Log likelihood 45.06290 Hannan-Quinn criter. -0.263164
F-statistic 13.14684 Durbin-Watson stat 2.328204
Prob(F-statistic) 0.000000

January 2014
U.S. Energy Information Administration | STEO Model Documentation: Electricity Generation and Fuel Consumption Models 169
Table 98 – DKEPCON_EL_SO, distillate fuel oil consumption for generation by electric power sector, South region
Dependent Variable: DKEPCON_EL_SO/DKEP_SO
Method: Least Squares
Date: 08/22/13 Time: 15:57
Sample: 2001M01 2013M03
Included observations: 147 Variable Coefficient Std. Error t-Statistic Prob. C 1.101604 0.156442 7.041599 0.0000
FEB 0.027595 0.036364 0.758851 0.4493
MAR -0.013579 0.036301 -0.374064 0.7089
APR 0.015682 0.037288 0.420567 0.6747
MAY 0.081330 0.037180 2.187504 0.0304
JUN 0.084799 0.037027 2.290212 0.0236
JUL 0.052009 0.037241 1.396553 0.1649
AUG 0.143400 0.037099 3.865363 0.0002
SEP -0.004804 0.038166 -0.125864 0.9000
OCT 0.085987 0.036991 2.324564 0.0216
NOV 0.015284 0.037197 0.410888 0.6818
DEC 0.044921 0.036986 1.214544 0.2267
DKEPCON_EL_SO(-1)/DKEP_SO(-1) 0.422376 0.078186 5.402198 0.0000 R-squared 0.348892 Mean dependent var 1.982733
Adjusted R-squared 0.290584 S.D. dependent var 0.109693
S.E. of regression 0.092391 Akaike info criterion -1.841305
Sum squared resid 1.143827 Schwarz criterion -1.576845
Log likelihood 148.3359 Hannan-Quinn criter. -1.733852
F-statistic 5.983588 Durbin-Watson stat 1.903874
Prob(F-statistic) 0.000000

January 2014
U.S. Energy Information Administration | STEO Model Documentation: Electricity Generation and Fuel Consumption Models 170
Table 99 – DKEPCON_EL_WE, distillate fuel oil consumption for generation by electric power sector, West region
Dependent Variable: DKEPCON_EL_WE/DKEP_WE
Method: Least Squares
Date: 08/22/13 Time: 15:57
Sample: 2001M01 2013M03
Included observations: 147 Variable Coefficient Std. Error t-Statistic Prob. C 0.491600 0.103077 4.769271 0.0000
FEB -0.024579 0.019189 -1.280903 0.2024
MAR -0.005559 0.019163 -0.290080 0.7722
APR -0.011029 0.019626 -0.561987 0.5751
MAY 0.002166 0.019627 0.110338 0.9123
JUN -0.019713 0.019711 -1.000130 0.3191
JUL -0.029831 0.019635 -1.519309 0.1310
AUG -0.016771 0.019565 -0.857212 0.3929
SEP -0.004963 0.019563 -0.253683 0.8001
OCT -0.030223 0.019596 -1.542316 0.1254
NOV -0.017453 0.019554 -0.892555 0.3737
DEC -0.036498 0.019555 -1.866469 0.0642
DKEPCON_EL_WE(-1)/DKEP_WE(-1) 0.733511 0.057649 12.72370 0.0000 R-squared 0.564703 Mean dependent var 1.789017
Adjusted R-squared 0.525721 S.D. dependent var 0.070918
S.E. of regression 0.048840 Akaike info criterion -3.116260
Sum squared resid 0.319635 Schwarz criterion -2.851800
Log likelihood 242.0451 Hannan-Quinn criter. -3.008807
F-statistic 14.48633 Durbin-Watson stat 2.204500
Prob(F-statistic) 0.000000

January 2014
U.S. Energy Information Administration | STEO Model Documentation: Electricity Generation and Fuel Consumption Models 171
Table 100 – PCEPCON_EL_MW, petroleum coke consumption for generation by electric power sector, Midwest region
Dependent Variable: PCEPCON_EL_MW/PCEP_MW
Method: Least Squares
Date: 08/22/13 Time: 16:02
Sample: 2011M01 2013M03
Included observations: 27 Variable Coefficient Std. Error t-Statistic Prob. C 1.065995 0.529682 2.012518 0.0638
FEB 0.014057 0.170206 0.082585 0.9354
MAR 0.164953 0.181343 0.909619 0.3784
APR 0.220722 0.177114 1.246216 0.2331
MAY 0.056021 0.172892 0.324021 0.7507
JUN 0.044422 0.185364 0.239647 0.8141
JUL 0.321266 0.192121 1.672213 0.1167
AUG -0.015287 0.170129 -0.089857 0.9297
SEP -0.029205 0.191649 -0.152389 0.8811
OCT 0.245691 0.204481 1.201536 0.2495
NOV 0.283924 0.176307 1.610397 0.1296
DEC 0.340380 0.169697 2.005812 0.0646
PCEPCON_EL_MW(-1)/PCEP_MW(-1) 0.316133 0.258024 1.225208 0.2407 R-squared 0.512681 Mean dependent var 1.753164
Adjusted R-squared 0.094979 S.D. dependent var 0.193541
S.E. of regression 0.184121 Akaike info criterion -0.240266
Sum squared resid 0.474607 Schwarz criterion 0.383656
Log likelihood 16.24359 Hannan-Quinn criter. -0.054741
F-statistic 1.227385 Durbin-Watson stat 1.844200
Prob(F-statistic) 0.353350

January 2014
U.S. Energy Information Administration | STEO Model Documentation: Electricity Generation and Fuel Consumption Models 172
Table 101 – PCEPCON_EL_SO, petroleum coke consumption for generation by electric power sector, South region
Dependent Variable: PCEPCON_EL_SO/PCEP_SO
Method: Least Squares
Date: 08/22/13 Time: 16:02
Sample: 2002M01 2013M03
Included observations: 135 Variable Coefficient Std. Error t-Statistic Prob. C 1.175012 0.128705 9.129505 0.0000
FEB 0.007606 0.020961 0.362878 0.7173
MAR 0.048065 0.020954 2.293800 0.0236
APR 0.014873 0.021512 0.691370 0.4907
MAY 0.018081 0.021424 0.843967 0.4004
JUN 0.027025 0.021984 1.229300 0.2214
JUL -0.003287 0.021669 -0.151706 0.8797
AUG 0.018766 0.021409 0.876546 0.3825
SEP 0.026469 0.021411 1.236239 0.2188
OCT 0.032055 0.022022 1.455596 0.1481
NOV 0.048009 0.021409 2.242514 0.0268
DEC 0.016995 0.021530 0.789383 0.4315
D0206 0.373662 0.054039 6.914621 0.0000
D0810 -0.245797 0.056179 -4.375219 0.0000
D08 0.056427 0.016587 3.401851 0.0009
PCEPCON_EL_SO(-1)/PCEP_SO(-1) 0.370469 0.067543 5.484932 0.0000 R-squared 0.498999 Mean dependent var 1.908839
Adjusted R-squared 0.435847 S.D. dependent var 0.068282
S.E. of regression 0.051287 Akaike info criterion -2.991881
Sum squared resid 0.313010 Schwarz criterion -2.647552
Log likelihood 217.9520 Hannan-Quinn criter. -2.851955
F-statistic 7.901624 Durbin-Watson stat 1.944829
Prob(F-statistic) 0.000000

January 2014
U.S. Energy Information Administration | STEO Model Documentation: Electricity Generation and Fuel Consumption Models 173
Table 102 – PCEPCON_EL_WE, petroleum coke consumption for generation by electric power sector, West region
Dependent Variable: PCEPCON_EL_WE/PCEP_WE
Method: Least Squares
Date: 08/22/13 Time: 16:03
Sample: 2001M01 2013M03
Included observations: 147 Variable Coefficient Std. Error t-Statistic Prob. C 0.310058 0.090701 3.418459 0.0008
FEB -0.025748 0.015355 -1.676854 0.0960
MAR -0.016924 0.015335 -1.103560 0.2718
APR -0.020127 0.015355 -1.310756 0.1922
MAY -0.011772 0.015345 -0.767154 0.4444
JUN -0.020501 0.015357 -1.334962 0.1842
JUL -0.016868 0.015346 -1.099196 0.2737
AUG -0.000528 0.015345 -0.034378 0.9726
SEP -0.035382 0.015397 -2.297945 0.0231
OCT -0.021814 0.015336 -1.422424 0.1573
NOV -0.025358 0.015331 -1.654009 0.1005
DEC -0.012654 0.015330 -0.825455 0.4106
D0201 0.081606 0.039083 2.088037 0.0387
D0202 0.207722 0.039262 5.290628 0.0000
D0203 -0.211549 0.041167 -5.138802 0.0000
PCEPCON_EL_WE(-1)/PCEP_WE(-1) 0.848190 0.046945 18.06783 0.0000 R-squared 0.748882 Mean dependent var 1.933244
Adjusted R-squared 0.720128 S.D. dependent var 0.070978
S.E. of regression 0.037549 Akaike info criterion -3.623864
Sum squared resid 0.184705 Schwarz criterion -3.298375
Log likelihood 282.3540 Hannan-Quinn criter. -3.491615
F-statistic 26.04453 Durbin-Watson stat 2.368236
Prob(F-statistic) 0.000000

January 2014
U.S. Energy Information Administration | STEO Model Documentation: Electricity Generation and Fuel Consumption Models 174
Table 103 – OPEPCON_EL_NE, other petroleum liquids consumption for generation by electric power sector, Northeast generation
Dependent Variable: OPEPCON_EL_NE/OPEP_NE
Method: Least Squares
Date: 08/22/13 Time: 16:06
Sample: 2003M01 2013M03
Included observations: 123 Variable Coefficient Std. Error t-Statistic Prob. C 1.202783 0.180105 6.678238 0.0000
FEB 0.144432 0.110028 1.312679 0.1920
MAR 0.150875 0.110215 1.368914 0.1738
APR 0.152873 0.113548 1.346336 0.1810
MAY 0.092003 0.114185 0.805741 0.4221
JUN 0.226043 0.113646 1.989019 0.0492
JUL 0.146804 0.113104 1.297954 0.1970
AUG 0.221971 0.112798 1.967869 0.0516
SEP 0.311583 0.112987 2.757678 0.0068
OCT 0.298613 0.113864 2.622541 0.0100
NOV 0.169805 0.113850 1.491478 0.1387
DEC 0.052697 0.116087 0.453942 0.6508
D11ON 0.244632 0.057202 4.276648 0.0000
OPEPCON_NE(-1)/OPEP_NE(-1) 0.317870 0.077963 4.077174 0.0001 R-squared 0.344515 Mean dependent var 2.132192
Adjusted R-squared 0.266338 S.D. dependent var 0.300856
S.E. of regression 0.257696 Akaike info criterion 0.232730
Sum squared resid 7.238364 Schwarz criterion 0.552816
Log likelihood -0.312906 Hannan-Quinn criter. 0.362748
F-statistic 4.406852 Durbin-Watson stat 1.864395
Prob(F-statistic) 0.000006

January 2014
U.S. Energy Information Administration | STEO Model Documentation: Electricity Generation and Fuel Consumption Models 175
Table 104 – OPEPCON_EL_SO, other petroleum liquids consumption for generation by electric power sector, South region
Dependent Variable: OPEPCON_EL_SO/OPEP_SO
Method: Least Squares
Date: 08/22/13 Time: 16:07
Sample: 2001M01 2013M03
Included observations: 147 Variable Coefficient Std. Error t-Statistic Prob. C 1.851053 0.214028 8.648664 0.0000
FEB -0.048059 0.296039 -0.162341 0.8713
MAR -0.059294 0.296041 -0.200291 0.8416
APR 0.256521 0.309480 0.828878 0.4087
MAY 0.341193 0.302860 1.126571 0.2620
JUN 0.146593 0.302506 0.484595 0.6288
JUL 0.111651 0.302494 0.369101 0.7127
AUG 0.362226 0.302493 1.197469 0.2333
SEP 0.140568 0.302507 0.464676 0.6429
OCT 0.723235 0.309481 2.336930 0.0210
NOV 0.224282 0.310507 0.722310 0.4714
DEC 0.285679 0.302495 0.944411 0.3467
OPEPCON_EL_SO(-1)/OPEP_SO(-1) -0.006222 0.011553 -0.538531 0.5911
D0810 65.45397 0.788866 82.97228 0.0000
D0904 -17.20947 0.788865 -21.81548 0.0000
D11 0.734887 0.228719 3.213054 0.0017
D12ON 2.499854 0.209467 11.93435 0.0000 R-squared 0.984453 Mean dependent var 2.679744
Adjusted R-squared 0.982539 S.D. dependent var 5.711787
S.E. of regression 0.754749 Akaike info criterion 2.383532
Sum squared resid 74.05402 Schwarz criterion 2.729364
Log likelihood -158.1896 Hannan-Quinn criter. 2.524047
F-statistic 514.4777 Durbin-Watson stat 1.233909
Prob(F-statistic) 0.000000
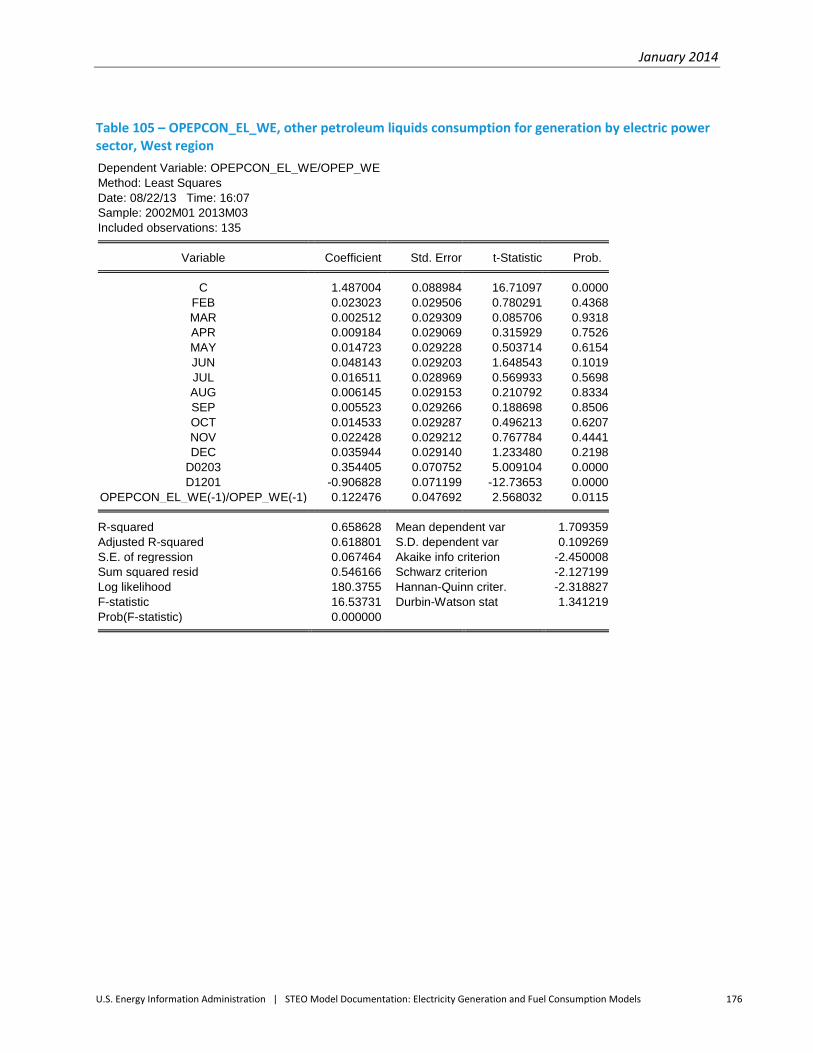
January 2014
U.S. Energy Information Administration | STEO Model Documentation: Electricity Generation and Fuel Consumption Models 176
Table 105 – OPEPCON_EL_WE, other petroleum liquids consumption for generation by electric power sector, West region
Dependent Variable: OPEPCON_EL_WE/OPEP_WE
Method: Least Squares
Date: 08/22/13 Time: 16:07
Sample: 2002M01 2013M03
Included observations: 135 Variable Coefficient Std. Error t-Statistic Prob. C 1.487004 0.088984 16.71097 0.0000
FEB 0.023023 0.029506 0.780291 0.4368
MAR 0.002512 0.029309 0.085706 0.9318
APR 0.009184 0.029069 0.315929 0.7526
MAY 0.014723 0.029228 0.503714 0.6154
JUN 0.048143 0.029203 1.648543 0.1019
JUL 0.016511 0.028969 0.569933 0.5698
AUG 0.006145 0.029153 0.210792 0.8334
SEP 0.005523 0.029266 0.188698 0.8506
OCT 0.014533 0.029287 0.496213 0.6207
NOV 0.022428 0.029212 0.767784 0.4441
DEC 0.035944 0.029140 1.233480 0.2198
D0203 0.354405 0.070752 5.009104 0.0000
D1201 -0.906828 0.071199 -12.73653 0.0000
OPEPCON_EL_WE(-1)/OPEP_WE(-1) 0.122476 0.047692 2.568032 0.0115 R-squared 0.658628 Mean dependent var 1.709359
Adjusted R-squared 0.618801 S.D. dependent var 0.109269
S.E. of regression 0.067464 Akaike info criterion -2.450008
Sum squared resid 0.546166 Schwarz criterion -2.127199
Log likelihood 180.3755 Hannan-Quinn criter. -2.318827
F-statistic 16.53731 Durbin-Watson stat 1.341219
Prob(F-statistic) 0.000000