short-term energy supply/demand outlook --analysis on ...eneken.ieej.or.jp/data/4231.pdf ·...
TRANSCRIPT

- 1 -
The 408th Forum on Research Work December 22, 2011
Short-Term Energy Supply/Demand Outlook
--Analysis on Scenario through FY2012 –
Shigeru Suehiro, Manager
Energy Demand, Supply and Forecast Analysis Group
Energy Data and Modeling Center
Institute of Energy Economics, Japan
Kengo Suzuki, Researcher
Toshiaki Hachiuma, Researcher
Takayuki Yoshioka, Researcher
<Summary>
【Background】
The March 11 Great East Japan Earthquake affected the Japanese economy by disrupting
production facilities and supply chains on the supply side, and dampening consumer sentiment on the
demand side. The disaster also triggered electricity supply shortages, prompting the government to
resort to an electricity consumption restriction order last summer for the first time in 37 years. It thus
imposed constraints on economic and production operations. However, manufacturers took advantage
of holiday and nighttime operations to minimize the impact of such constraint on their production
operations. The residential and commercial sectors also implemented substantial electricity savings.
Japanese people made great efforts to avoid any serious situation and overcome the constraints.
Economic and production operations are now recovering on the restoration of production facilities and
supply chains and a decline in restraints on consumption. But prospects are dim for restarting nuclear
power plants under regular checkups. The problem of electricity shortages still exists, leaving fears to
linger about economic and production operations.
Given such conditions, this report presents forecasts on Japan’s energy supply and demand
in FY2011 and FY2012. For FY2012, we have made two scenarios for forecasting energy supply and
demand. In “Case (A): without electricity restriction,” nuclear power plants will restart from next
summer, with electricity problems having no impact on economic activities. In “Case (B); with
electricity restriction,” no nuclear power plants will restart next summer, with electricity shortages
affecting economic activities.
IEEJ: February 2012 All Right Reserved
- 2 -
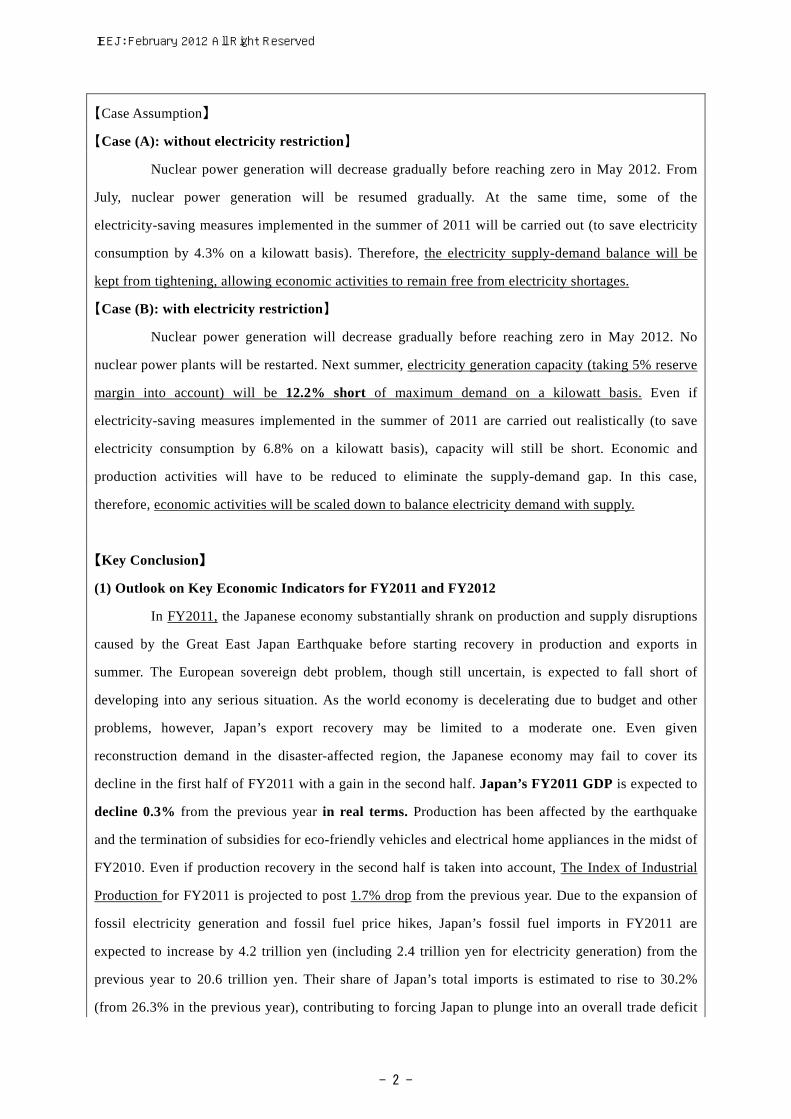
【Case Assumption】
【Case (A): without electricity restriction】
Nuclear power generation will decrease gradually before reaching zero in May 2012. From
July, nuclear power generation will be resumed gradually. At the same time, some of the
electricity-saving measures implemented in the summer of 2011 will be carried out (to save electricity
consumption by 4.3% on a kilowatt basis). Therefore, the electricity supply-demand balance will be
kept from tightening, allowing economic activities to remain free from electricity shortages.
【Case (B): with electricity restriction】
Nuclear power generation will decrease gradually before reaching zero in May 2012. No
nuclear power plants will be restarted. Next summer, electricity generation capacity (taking 5% reserve
margin into account) will be 12.2% short of maximum demand on a kilowatt basis. Even if
electricity-saving measures implemented in the summer of 2011 are carried out realistically (to save
electricity consumption by 6.8% on a kilowatt basis), capacity will still be short. Economic and
production activities will have to be reduced to eliminate the supply-demand gap. In this case,
therefore, economic activities will be scaled down to balance electricity demand with supply.
【Key Conclusion】
(1) Outlook on Key Economic Indicators for FY2011 and FY2012
In FY2011, the Japanese economy substantially shrank on production and supply disruptions
caused by the Great East Japan Earthquake before starting recovery in production and exports in
summer. The European sovereign debt problem, though still uncertain, is expected to fall short of
developing into any serious situation. As the world economy is decelerating due to budget and other
problems, however, Japan’s export recovery may be limited to a moderate one. Even given
reconstruction demand in the disaster-affected region, the Japanese economy may fail to cover its
decline in the first half of FY2011 with a gain in the second half. Japan’s FY2011 GDP is expected to
decline 0.3% from the previous year in real terms. Production has been affected by the earthquake
and the termination of subsidies for eco-friendly vehicles and electrical home appliances in the midst of
FY2010. Even if production recovery in the second half is taken into account, The Index of Industrial
Production for FY2011 is projected to post 1.7% drop from the previous year. Due to the expansion of
fossil electricity generation and fossil fuel price hikes, Japan’s fossil fuel imports in FY2011 are
expected to increase by 4.2 trillion yen (including 2.4 trillion yen for electricity generation) from the
previous year to 20.6 trillion yen. Their share of Japan’s total imports is estimated to rise to 30.2%
(from 26.3% in the previous year), contributing to forcing Japan to plunge into an overall trade deficit
IEEJ: February 2012 All Right Reserved

- 3 -
(at 1.4 trillion yen).
(The CIF-based import price for FY2011 is assumed at $112 per barrel for crude oil, $785 per ton for LNG and $142
per ton for steaming coal.)
In “Case (A): without electricity restriction” for FY2012, the Japanese economy will see a
moderate production expansion on export growth, post-disaster reconstruction demand and an
investment recovery. The Index of Industrial Production is expected to rise 5.0% from the previous
year. As a consumer and investor confidence recovery in the private sector occurs in addition to export
and public investment growth, GDP in FY2012 is projected to grow 1.9% from the previous year with
both domestic and external demand expanding.
In “Case (B) :with electricity restriction,” electricity supply will fall short of satisfying
demand even with electricity-saving measures being carried out for the summer of 2011, which will
affect economic activities. Particularly, production activities will be affected. The Index of Industrial
Production is expected to post a rise of 1.6% (down 3.4 percentage points from the level for Case
(A)) from the previous year. Fossil fuel imports in FY2012 are estimated to expand by 4.6 trillion yen
(including 3.3 trillion yen for electricity generation) from FY2010, helping widen an overall trade
deficit to $4.7 trillion yen.
(The CIF-based import price for FY2012 is assumed at $110 per barrel for crude oil, $749 per ton for LNG and $137
per ton for steaming coal.)
(2) Outlook on Energy Supply and Demand in FY2011 and FY2012
<Primary energy supply and final energy consumption>
In FY2011, final energy consumption in Japan is expected to decline 3.9% from the
previous year. Consumption is projected to fall 3.1% due to a production drop in the industrial sector,
6.2% due to electricity savings and temperature conditions in the residential/commercial sector, and
2.9% due to temperature conditions and slack cargo traffic in the transportation sector. Primary energy
supply, including electricity generation and energy consumption in the energy conversion sector, is
expected to decline 3.7%. Among fossil fuel imports that are increasing on the expansion of fossil
electricity generation, oil is projected to grow by 4.07 million kiloliters from the previous year, and
natural gas by 23.89 million tons in terms of LNG. Thus, Energy-based carbon dioxide emissions are
assumed to increase 2.1%.
In “Case (A): without electricity restriction” for FY2012, final energy consumption is
projected to increase 1.1% from the previous year due mainly to an economic and production activity
recovery. Such consumption is projected to rise 2.7% due to a production recovery in the industrial
IEEJ: February 2012 All Right Reserved

- 4 -
sector. In the transportation sector, such consumption is estimated to decline 1.1% on improvements in
vehicle fuel efficiency. The residential/commercial sector is expected to limit its primary energy
consumption growth to 0.4% due to electricity savings and temperature conditions, despite a recovery
of services. Primary energy supply in Japan is predicted to increase 1.0% from the previous year.
CO2 emissions are projected to decline 5.3% on an increase in nuclear power generation.
In “Case (B): with electricity restriction,” final energy consumption is expected to post a
0.2% drop (1.3 percentage points lower than that in Case (A)). The industrial sector may limit final
energy consumption growth to 0.6%, while the residential/commercial sector may reduce such
consumption by 0.1% on electricity savings. The transportation sector may post a 1.8% drop.
Domestic primary energy supply is expected to score a rise of 0.2% (down 0.8 points from Case (A)).
Energy-based CO2 emissions are projected to increase 5.5% as fossil electricity generation is
expanded to cover a fall in nuclear power generation. Among fossil fuel imports, coal is expected to go
up by 6.3 million tons from FY2010, oil by 15.13 million kiloliters, and natural gas by 19.95 million
tons in LNG terms. If electricity consumption is cut 1% throughout FY2012, natural gas consumption
could be reduced by about 1.5 million tons.
<Sales-based energy demand>
In FY2011, electricity sales are expected to post a substantial decline of 5.3% from the
previous year on a production slowdown, electricity-saving measures and temperature conditions. In
FY 2012, electricity sales are projected to rise 0.2% from the previous year on a production recovery
in “Case (A): without electricity restriction.” In “Case (B): with electricity restriction,” production
stagnation and electricity-saving measures are likely to limit the electricity sales growth to 1.5%.
In FY2011, town gas sales are expected to limit their increase to 0.3% from the previous
year as a substantial decline in air-conditioning demand in the commercial/other sector nearly offset an
expansion in industrial gas demand. In FY 2012, town gas sales are projected to expand 2.5% from the
previous year on a firm gain in industrial and commercial demand amid an economic recovery in “Case
(A): without electricity restriction.” In “Case (B): with electricity restriction,” the growth may be
limited to 1.3%, with industrial demand affected greatly.
In FY2011, fuel oil sales are projected to decrease 0.1% from the previous year as a
substantial increase in demand for fuel oil C for power generation is more than offset by slower
naphtha and fuel oil sales under the production stagnation and sluggish sales of auto and heating fuels
under temperature effects. In FY 2012, fuel sales are estimated to decrease 3.9% from the previous
year on a continued fuel switch from oil to town gas, improvements in auto fuel efficiency and a plunge
IEEJ: February 2012 All Right Reserved

- 5 -
in demand for fuel oil for power generation despite an economic recovery in “Case (A): without
electricity restriction.” In “Case (B): with electricity restriction,” fuel oil sales are expected to rise
1.8% due to a substantial increase in demand for fuel oil for power generation despite a general
demand fall amid an economic stagnation.
(3) Evaluating Possible Impacts of Factors Affecting Energy Supply/Demand in FY2012
If the mean ambient temperature in summer (July to September) is 1°C higher than the
average-year level, domestic primary energy supply will increase by 0.3%. The higher temperature
will boost energy demand in the commercial sector with greater air-conditioning demand faster than in
the residential sector. It will also increase energy demand in the transportation sector as greater
air-conditioning demand in cars deteriorates fuel efficiency. Under the higher temperature, electricity
will post the largest demand growth among energy sources. A town gas demand rise will be limited, but
the impact of higher temperatures on town gas demand has been increasing due to a diffusion of
gas-based air-conditioners over recent years.
If the mean ambient temperature in winter (January to March) is 1°C lower than the
average-year level, annual domestic primary energy supply will increase by 0.3%. In contrast to the
higher summer temperature case, the lower winter temperature will have a greater impact on the
residential sector than on the commercial sector by expanding heating and hot-water demand. Under
the lower winter temperature, town gas and LPG will post the largest demand growth among energy
sources.
An electricity demand increase emerging from temperature changes could surpass any supply
increase. But such situation is not taken into account for this evaluation. If the mean ambient
temperature in summer is 1°C higher in “Case (B): with electricity restriction,” electricity demand
may increase 2.4% on a kilowatt-hour basis. Peak electricity demand may rise 3.6% on a kilowatt-hour
basis. In such event, additional electricity-saving measures, including patience, as well as a further fall
in economic and production activities, may be unavoidable.
IEEJ: February 2012 All Right Reserved

- 6 -
【Summary Table (Case (A): without electricity restriction)】
FY2009 FY2010 (Actual) FY2011 (Forecast) FY2012(Actual) 1st half 2nd half Total 1st half 2nd half Total (Forecast)
GDP 495,417 252,961 258,031 510,992 249,895 259,335 509,230 519,012 (Chained to year 2005, in billions of yen) (-2.1) (4.9) (1.5) (3.1) (-1.2) (0.5) (-0.3) (1.9)
Private demand 364,657 187,200 188,475 375,675 185,736 189,268 375,003 379,730 [-3.1] [2.2] [-0.2] [1.1]
Public demand 118,037 57,189 61,514 118,704 58,226 63,563 121,789 124,453 [0.9] [0.1] [0.6] [0.6]
External demand 11,673 8,635 8,189 16,825 6,240 6,973 13,214 14,839 [0.2] [0.8] [-0.8] [0.1]
Domestic corporate goods price index 102.6 102.9 103.7 103.3 105.6 105.5 105.5 105.9 (100 for 2005) (-5.2) (0.1) (1.4) (0.7) (2.6) (1.8) (2.2) (0.4)
Consumer price index 100.5 100.0 99.8 99.9 99.8 99.4 99.6 99.2 (100 for 2010) (-1.5) (-0.9) (-0.4) (-0.6) (-0.2) (-0.3) (-0.2) (-0.4)
Index of industrial production 86.1 94.6 93.1 93.9 90.3 94.2 92.3 96.9 (100 for 2005) (-8.8) (17.4) (1.7) (9.1) (-4.5) (1.2) (-1.7) (5.0)
Crude steel production 96,449 55,424 55,369 110,792 53,312 54,265 107,576 110,550 (1,000 tons) (-8.6) (27.9) (4.2) (14.9) (-3.8) (-2.0) (-2.9) (2.8)
Ethylene production 7,219 3,327 3,671 6,999 3,293 3,384 6,677 6,942 (1,000 tons) (10.7) (-5.3) (-0.9) (-3.0) (-1.0) (-7.8) (-4.6) (4.0)
Exchange rate 92.8 88.9 82.5 85.7 79.8 77.5 78.6 77.5 (Yen/US$) (-7.6) (-6.8) (-8.6) (-7.7) (-10.3) (-6.0) (-8.2) (-1.4)
Crude oil CIF price 68.9 78.6 89.5 84.0 114.0 110.0 112.0 110.0 (US$/Bbl) (-23.5) (27.5) (17.4) (21.9) (45.0) (23.0) (33.3) (-1.8)
Heating degree-days 952 77 998 1,075 53 946 999 980 (6.1) (122.4) (8.8) (12.9) (-31.1) (-5.2) (-7.1) (-1.9)
Cooling degree-days 329 560 0 560 472 2 474 425 (-17.5) (70.6) (-75.0) (70.5) (-15.7) (1600.0) (-15.4) (-10.4)
Primary energy supply 491,315 250,850 262,902 513,752 236,308 258,561 494,869 500,063 (10^10kcal = KTOE) (-4.0) (8.5) (1.1) (4.6) (-5.8) (-1.7) (-3.7) (1.0)
Final energy consumption 331,043 164,813 177,925 342,738 155,468 173,874 329,342 332,895 (10^10kcal = KTOE) (-2.4) (7.1) (0.4) (3.5) (-5.7) (-2.3) (-3.9) (1.1)
Industrial sector 155,327 78,625 82,480 161,105 75,375 80,816 156,191 160,339 (-3.2) (8.3) (-0.3) (3.7) (-4.1) (-2.0) (-3.1) (2.7)
Residential/commercial sector 92,901 43,574 54,468 98,042 39,658 52,319 91,976 92,309 (-1.7) (9.0) (2.9) (5.5) (-9.0) (-3.9) (-6.2) (0.4)
Transportation sector 82,815 42,614 40,977 83,591 40,435 40,739 81,174 80,247 (-1.7) (3.3) (-1.4) (0.9) (-5.1) (-0.6) (-2.9) (-1.1)
Electricity sales 889.4 476.0 466.1 942.1 439.7 452.6 892.3 917.7 (billion kWh) (-3.4) (9.1) (2.9) (5.9) (-7.6) (-2.9) (-5.3) (2.8)
Town gas sales 33,837 16,574 18,710 35,283 16,380 18,995 35,375 36,252 (million m3/10,000kcal) (-1.9) (8.3) (0.9) (4.3) (-1.2) (1.5) (0.3) (2.5)
Fuel oil sales 195,122 92,031 103,917 195,948 88,605 107,174 195,779 188,199 (1,000 kl) (-3.0) (2.4) (-1.3) (0.4) (-3.7) (3.1) (-0.1) (-3.9)
CO2 emissions (energy-based) 1,075 1,122 1,146 1,086 (milion t.-C) (-5.5) (4.3) (2.1) (-5.3)
(100 for FY1990) 101.5 105.9 108.2 102.5 Sources: Actual results data prepared from various publications; forecasts by IEEJ
Notes:
1. Figures in parentheses indicate year-to-year percentage changes, except contributions to GDP growth.
2. Contributions to GDP growth may not add up to the total due to minor data deviations.
3. Industrial sector consumption includes non-energy uses.
Key energy indicators
Key econom
ic indicators
IEEJ: February 2012 All Right Reserved
- 7 -
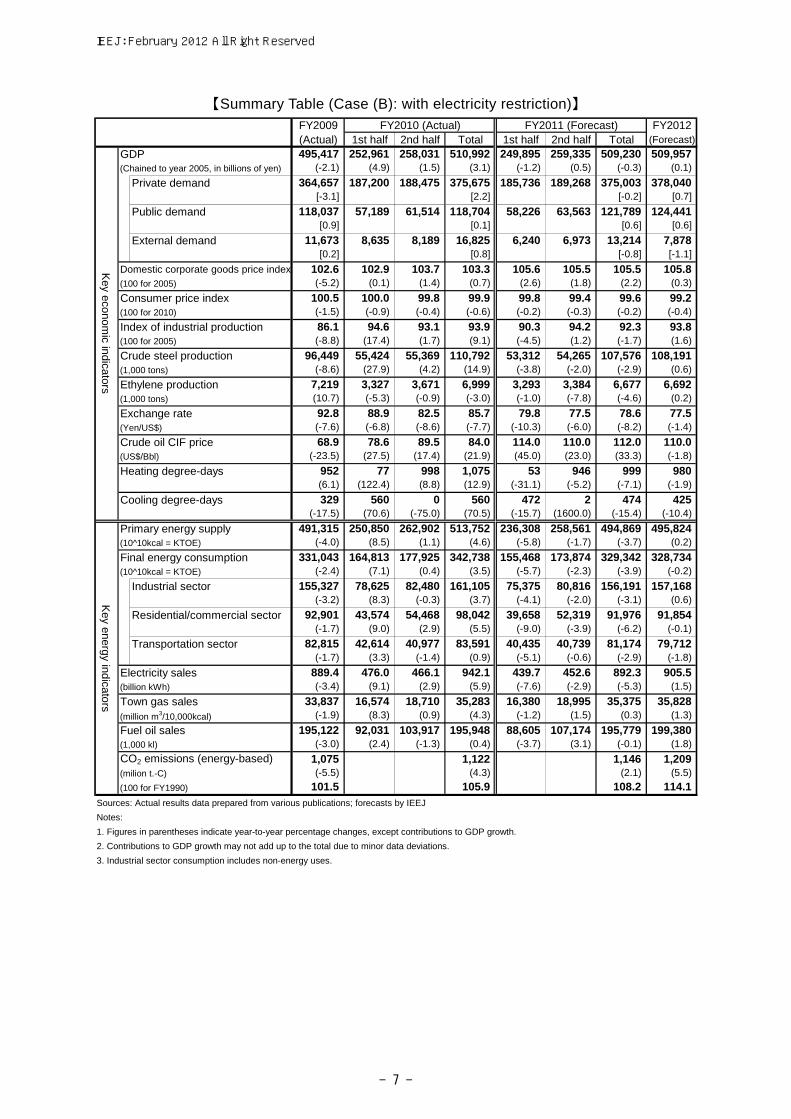
【Summary Table (Case (B): with electricity restriction)】 FY2009 FY2010 (Actual) FY2011 (Forecast) FY2012(Actual) 1st half 2nd half Total 1st half 2nd half Total (Forecast)
GDP 495,417 252,961 258,031 510,992 249,895 259,335 509,230 509,957 (Chained to year 2005, in billions of yen) (-2.1) (4.9) (1.5) (3.1) (-1.2) (0.5) (-0.3) (0.1)
Private demand 364,657 187,200 188,475 375,675 185,736 189,268 375,003 378,040 [-3.1] [2.2] [-0.2] [0.7]
Public demand 118,037 57,189 61,514 118,704 58,226 63,563 121,789 124,441 [0.9] [0.1] [0.6] [0.6]
External demand 11,673 8,635 8,189 16,825 6,240 6,973 13,214 7,878 [0.2] [0.8] [-0.8] [-1.1]
Domestic corporate goods price index 102.6 102.9 103.7 103.3 105.6 105.5 105.5 105.8 (100 for 2005) (-5.2) (0.1) (1.4) (0.7) (2.6) (1.8) (2.2) (0.3)
Consumer price index 100.5 100.0 99.8 99.9 99.8 99.4 99.6 99.2 (100 for 2010) (-1.5) (-0.9) (-0.4) (-0.6) (-0.2) (-0.3) (-0.2) (-0.4)
Index of industrial production 86.1 94.6 93.1 93.9 90.3 94.2 92.3 93.8 (100 for 2005) (-8.8) (17.4) (1.7) (9.1) (-4.5) (1.2) (-1.7) (1.6)
Crude steel production 96,449 55,424 55,369 110,792 53,312 54,265 107,576 108,191 (1,000 tons) (-8.6) (27.9) (4.2) (14.9) (-3.8) (-2.0) (-2.9) (0.6)
Ethylene production 7,219 3,327 3,671 6,999 3,293 3,384 6,677 6,692 (1,000 tons) (10.7) (-5.3) (-0.9) (-3.0) (-1.0) (-7.8) (-4.6) (0.2)
Exchange rate 92.8 88.9 82.5 85.7 79.8 77.5 78.6 77.5 (Yen/US$) (-7.6) (-6.8) (-8.6) (-7.7) (-10.3) (-6.0) (-8.2) (-1.4)
Crude oil CIF price 68.9 78.6 89.5 84.0 114.0 110.0 112.0 110.0 (US$/Bbl) (-23.5) (27.5) (17.4) (21.9) (45.0) (23.0) (33.3) (-1.8)
Heating degree-days 952 77 998 1,075 53 946 999 980 (6.1) (122.4) (8.8) (12.9) (-31.1) (-5.2) (-7.1) (-1.9)
Cooling degree-days 329 560 0 560 472 2 474 425 (-17.5) (70.6) (-75.0) (70.5) (-15.7) (1600.0) (-15.4) (-10.4)
Primary energy supply 491,315 250,850 262,902 513,752 236,308 258,561 494,869 495,824 (10^10kcal = KTOE) (-4.0) (8.5) (1.1) (4.6) (-5.8) (-1.7) (-3.7) (0.2)
Final energy consumption 331,043 164,813 177,925 342,738 155,468 173,874 329,342 328,734 (10^10kcal = KTOE) (-2.4) (7.1) (0.4) (3.5) (-5.7) (-2.3) (-3.9) (-0.2)
Industrial sector 155,327 78,625 82,480 161,105 75,375 80,816 156,191 157,168 (-3.2) (8.3) (-0.3) (3.7) (-4.1) (-2.0) (-3.1) (0.6)
Residential/commercial sector 92,901 43,574 54,468 98,042 39,658 52,319 91,976 91,854 (-1.7) (9.0) (2.9) (5.5) (-9.0) (-3.9) (-6.2) (-0.1)
Transportation sector 82,815 42,614 40,977 83,591 40,435 40,739 81,174 79,712 (-1.7) (3.3) (-1.4) (0.9) (-5.1) (-0.6) (-2.9) (-1.8)
Electricity sales 889.4 476.0 466.1 942.1 439.7 452.6 892.3 905.5 (billion kWh) (-3.4) (9.1) (2.9) (5.9) (-7.6) (-2.9) (-5.3) (1.5)
Town gas sales 33,837 16,574 18,710 35,283 16,380 18,995 35,375 35,828 (million m3/10,000kcal) (-1.9) (8.3) (0.9) (4.3) (-1.2) (1.5) (0.3) (1.3)
Fuel oil sales 195,122 92,031 103,917 195,948 88,605 107,174 195,779 199,380 (1,000 kl) (-3.0) (2.4) (-1.3) (0.4) (-3.7) (3.1) (-0.1) (1.8)
CO2 emissions (energy-based) 1,075 1,122 1,146 1,209 (milion t.-C) (-5.5) (4.3) (2.1) (5.5)
(100 for FY1990) 101.5 105.9 108.2 114.1 Sources: Actual results data prepared from various publications; forecasts by IEEJ
Notes:
1. Figures in parentheses indicate year-to-year percentage changes, except contributions to GDP growth.
2. Contributions to GDP growth may not add up to the total due to minor data deviations.
3. Industrial sector consumption includes non-energy uses.
Key energy indicators
Key econom
ic indicators
IEEJ: February 2012 All Right Reserved

- 8 -
【Trade Balance】 FY2012 (Forecast)
FY2010 (Actual)
FY2011 (Forecast)
Without electricity restriction
With electricity restriction
Exports (in billions of yen) 67,792 67,093 70,529 64,517Imposts (in billions of yen) 62,413 68,479 68,871 69,263 Fossil fuel imports 16,439 20,648 19,079 21,059Net exports (in billions of yen) 5,379 -1,386 1,658 -4,746
【Power Generation Fuel Cut Accompanying 1% Consumption Reduction】
Fuel demand cut Coal (in 1,000 tons of steaming coal) 3,160 Oil (in 1,000 kiloliters of crude oil) 2,160 Natural gas (in 1,000 tons of LNG) 1,487
Note: In this case, electricity consumption is cut by 1% on an annual basis. The demand cut for each fuel covers all power generation reduction.
【Effects of Temperature Changes (Case (A): without electricity restriction)】
Summer (July-September )temperature: up 1℃
Winter (January-March)temperature: down 1℃
Qtr.-to-qtr. Yr.-to-yr. Qtr.-to-qtr. Yr.-to-yr.
Domestic primary energy supply (10^10kcal) 1,535 (1.2) (0.3) 1,450 (1.1) (0.3)
Final energy consumption (10^10kcal) 676 (0.8) (0.2) 976 (1.1) (0.3)
Industrial sector 71 (0.2) (0.0) 185 (0.5) (0.1)
Residential sector 101 (1.1) (0.2) 546 (2.9) (1.1)
Commercial sector 328 (3.0) (0.8) 246 (2.2) (0.6)
Transportation sector 176 (0.8) (0.2) - (0.0) (0.0)
Electricity sales (million kWh) 5,769 (2.4) (0.6) 3,308 (1.4) (0.4)
Town gas sales (million m3/10,000kcal) 57 (0.7) (0.2) 232 (2.1) (0.6)
Fuel oil sales (1,000kl) 621 (1.4) (0.3) 632 (1.3) (0.3)
LPG sales (1,000t) -57 (-1.6) (-0.4) 102 (2.3) (0.6)
CO2 emissions (milion tons) 4 (1.6) (0.4) 4 (1.4) (0.3)
Note: The industrial sector consumption includes non-energy uses.
Percentage change Percentage changeDemandchange
Demandchange
IEEJ: February 2012 All Right Reserved
Contact: [email protected]
- 9 -
Introduction
This report is designed to forecast energy supply and demand in Japan for FY2011 and
FY2012. Because energy demand can be positioned as a "derivative demand" arising out of
economic activities (more fundamental demand), the economic trends need to be evaluated first.
The world economy continues to grow moderately as China and other emerging countries sustain
high growth, despite slowing growth mainly in industrial countries. On the other hand, the
Japanese economy has recovered faster than expected from the damage inflicted by the Great East
Japan Earthquake and is restoring the pre-disaster situation despite the protracted appreciation of
the yen and the delay of political actions for recovery. Energy demand, including electricity
demand, has been held down as an electricity generation capacity decline emerging from the
disaster has forced all sectors to substantially save electricity, with an electricity consumption
restriction order issued last summer for the first time in 37 years.
This report is organized as follows: Chapter 1 presents an outlook on economic and
production trends for FY2011 and FY2012, based on which we have estimated energy supply and
demand. The outlook is given for two cases. In “Case (A): without electricity restriction,” nuclear
power plants will restart from next summer, with no electricity shortages, and no impact on the
national economy or industry due to electricity problems. In “Case (B): with electricity
restriction,” no nuclear power plants will restart during the forecast period, meaning that the
national economy and industry will suffer from an electricity shortage throughout next summer.
Based on the economic and production trends outlined in Chapter 1, Chapter 2 forecasts energy
supply and demand in FY2011 and FY2012. The energy supply and demand outlook, as well as the
economic and industrial outlook, is given for the two cases. Chapter 2 also describes a breakdown
of energy supply and demand by energy source (based on industrial statistics) and domestic
primary energy supply and final energy consumption (based on energy balance sheets). Chapter 3
provides a sensitivity analysis to examine the impact of ambient temperature changes on energy
supply and demand.
1. OUTLOOK ON KEY ECONOMIC INDICATORS FOR FY2011 AND FY2012
1-1 Short-Term Outlook Framework (Note)
In making this outlook, we qualitatively surveyed trends of energy supply and demand
determinants and used two quantitative models—(1) the macroeconomic model and (2) the energy
supply/demand model.
Concerning the major economic indicators on which our forecasts are based, we made the
following assumptions. Even given that a global economic slowdown is likely to occur due to the
European debt and banking crisis, the world economy is expected to continue expanding
moderately as China and other emerging counties are predicted to sustain high growth. The
CIF-based price of crude oil imports into Japan is assumed to average $110/barrel in FY2012,
almost unchanged from the present level, while European and other industrial countries are likely
IEEJ: February 2012 All Right Reserved

- 10 -
to see decelerated economic growth despite a continuous upward trend of global oil demand (for
details, see "Prospects for the International Oil and Gas Markets in 2012" by Ken Koyama,
December 22, 2011). As implementation schedules and financial sizes of various government-cited
policies are uncertain, we did not, in principle, take into account economic, energy, and
environmental policies. As for the foreign exchange rate, we assumed the dollar to remain around
78 yen. Regarding ambient temperatures that affect energy demand particularly in the
residential/commercial sector, we assumed a warmer winter for the second half of FY2011 than for
the same period of the previous year, based on a three-month forecast by the Japan Meteorological
Agency (as released on November 25, 2011). For FY2012, we assumed the summer and winter
averages over the past 10 years.
(Note) The estimates in this report are based on information made available by December 16, 2012.
1-2 Case Assumptions
All nuclear power plants in operation in Japan will be halted for regular checkups from
this winter to next spring. If the plants under the checkups cannot be restarted, no nuclear power
plants will be in operation in Japan in the spring of 2012. For this outlook, we assumed “Case (A):
without electricity restriction” and “Case (B): with electricity restriction” regarding summer
electricity supply and demand.
In Case (A), nuclear power plants are assumed to restart gradually from the summer of
2012. In this case, summer electricity supply capacity is projected at 187.79 GW against the
maximum demand at 178.73 GW. The reserve capacity will become a mere 5.1% (0.1% taking a
5.0% reserve margin into account). However, if continuous electricity-saving measures (for a 4.3%
consumption reduction on a kilowatt basis) are taken into account, the reserve capacity rate may
increase. According to the results of electricity savings and questionnaire surveys for the summer
of 2011, the residential and commercial sector has relatively greater room to save electricity.
Electricity consumption is assumed to be saved by 2.8% on a kilowatt basis in the residential
sector and by 9.9% in the commercial sector. On the other hand, the industrial sector suffered from
increases in the labor costs and the load on workers when it took advantage of holiday and
nighttime operations to reduce peak electricity demand last summer. As such operational shifts are
conceived as difficult in the future, we assumed that the industrial sector will save electricity
consumption by about 1.1% on a kilowatt basis based on questionnaire surveys. In this case, no
electricity supply restriction is assumed for the summer of 2012.
In Case (B), no nuclear power generation is assumed to be implemented after the spring
of 2012, when all the nuclear power plants in operation will be halted for checkups. Given supply
capacity at 165.86 GW, the reserve capacity comes to minus 7.2% (minus 12.2% taking a 5.0%
reserve margin into account), indicating a substantial supply shortage. Electricity-saving measures
for Case (B) are assumed to be enhanced to achieve a 6.8% consumption cut on a kilowatt basis
without affecting civic life and economic activities (electricity consumption is assumed to be saved
by 7.0% on a kilowatt basis in the residential sector, by 11.3% in the commercial sector, and by
IEEJ: February 2012 All Right Reserved

- 11 -
3.1% in the industrial sector). Even if the electricity savings are taken into account, supply will
still be 5.4% short of peak demand. In order to eliminate the supply-demand gap, economic and
production activities will have to be reduced to cut electricity demand to a lower level than in
“Case A without electricity restriction” so as to balance demand with supply. If production were to
be reduced, priority would be given to domestic demand rather than overseas demand (or
production would shift overseas under electricity restriction). Therefore, exports among economic
activities are assumed to plunge. Real GDP in the July-September quarter of 2012 in Case (B) is
estimated to be 4.0 trillion yen (3.1%) less than in Case (A).
1-3 Macroeconomic Outlook (Case (A): without electricity restriction)
The world economy in FY2011 is generally seeing decelerating growth due to the direct
and indirect effects of the European debt and banking crisis. However, China and other emerging
countries are less vulnerable to these effects than such industrial countries as European nations and
the United States, and are expected to sustain high growth. Even among industrial countries, while
some European countries, such as Greece and Italy, are plagued with serious sovereign debt
problems, the United States sees signs of immediate economic improvements.
In the United States, prolonged balance sheet adjustments have worked to slow economic
growth. But signs of the economic recovery have been seen recently, such as recent improvements
in the unemployment rate, retail sales, and the industrial production index. The recovery is
expected to continue as monetary easing effects spill over further with disposable income
increasing. In Europe, however, the banking crisis is spreading due to a deepening sovereign debt
crisis in such countries as Greece and Italy, affecting the real economy. In our analysis, the debt
problem is not assumed to become any more serious. Given high unemployment rates and private
consumption declines, however, an economic growth slowdown in Europe is seen as unavoidable.
Emerging economies have recently decelerated growth, owing to monetary tightening, slack
exports to Europe and the United States, and Thai floods. However, the deceleration is less serious
than for industrial countries. In particular, China is expected to sustain far higher economic growth
than industrial countries because it has maintained high levels of private consumption and fixed
asset investment.
Japan’s real GDP in FY2011 is expected to contract 0.3% from the previous year. The
Japanese economy will recover positive growth thanks to the faster-than-expected restoration of
production facilities and supply chains in the second half of the year after plunging due to the
Great East Japan Earthquake in the first half. As the second half recovery falls short of offsetting
the first half plunge, GDP for the entire FY2011 is expected to post the first contraction in two
years. Among GDP components, external demand may post a substantial decline. Private-sector
demand may limit a drop to a small level because of the faster-than-expected restoration.
Public-sector demand may positively contribute to GDP thanks to an increase in government
spending on anti-disaster measures and support for post-disaster reconstruction.
Domestic private sector demand is expected to contribute to lower real GDP growth by
IEEJ: February 2012 All Right Reserved

- 12 -
0.2 percentage points. Private final consumption plunged just after the disaster, but recovered in
the July-September quarter thanks to an early rally in auto production and robust demand for
energy-saving electrical home appliances. In the second half of FY2011, however, private final
consumption is projected to level off due to a reactionary fall in demand for such home appliances
and a winter bonus drop. For the entire FY2011, private final consumption is likely to post a small
increase (0.2%) from the previous year. Private residential investment posted a high growth rate in
the first half of FY2011 thanks to a recovery from a plunge caused by the Lehman Shock,
reconstruction demand in the disaster-affected region, and a housing rush toward the termination
of the housing eco-point system. Despite some possible reactionary decline after the housing rush,
private residential investment is likely to retain high growth, supported by the reconstruction
demand in the second half. For the entire FY2011, private residential investment is projected to
grow 5.1% from the previous year. Private nonresidential investment turned upward in the
July-September quarter due to the relaxation of supply constraints caused by the disaster and is
expected to recover thanks to the strength of post-disaster reconstruction demand in and after the
second half of FY2011. At present, however, the yen’s further appreciation and an overseas
economic slowdown are dragging down private nonresidential investment in Japan, so a full
recovery cannot be expected to occur within FY2011 (private nonresidential investment for
FY2011 is expected to fall 1.2% from the previous year).
Public demand as a whole is estimated to work to push real GDP growth by 0.6
percentage points. In the first half of FY2011, government consumption was pushed up by
spending on disaster-relief and post-disaster reconstruction support measures, including disaster
aid operations of the Self-Defense Forces and the removal of rubbles. Although part of such
spending is likely to wane, rubble removal and other operations are expected to continue, pushing
up government consumption. Further, healthcare and nursing care spending is likely to continue
increasing as the population ages (government consumption in FY2011 is predicted to grow 1.8%
from the previous year). Public investment growth was limited to a small level in the first half of
FY2011 as the formation of a budget for post-disaster reconstruction demand was delayed. As such
demand is likely to expand in the second half, particularly in the January-March quarter, public
investment for the whole of FY2011 is expected to post a substantial growth rate of 6.1% from the
previous year.
External demand as a whole is projected to work to lower real GDP growth by 0.8
percentage points. Exports declined substantially in the first half due to supply constraints caused
by the disaster. However, they may turn upward thanks to the fast recovery of production facilities
and supply chains in the second half. Nevertheless, export growth in the second-half may fall short
of offsetting the first-half plunge due to an overseas economic slowdown and the yen’s
appreciation. As a result, exports are expected to slip below the previous year’s level (down 0.3%
from the previous year). Imports increased in the first half thanks to three factors: substitutional
demand to cover losses in production capacity caused by the disaster, increased demand for fossil
IEEJ: February 2012 All Right Reserved

- 13 -
fuels for power generation, and the yen’s appreciation. In the second half, domestic production
facilities are recovering to reduce the need for foreign goods covering domestic production losses.
But imports are expected to continue increasing as demand grows for fossil fuels for power
generation amid a decline in the capacity utilization ratio for nuclear power plants and as the yen’s
prolonged strength keeps purchases of cheap imports at high levels. As a result, imports for the
whole of FY2011 are expected to grow 5.0% from the previous year.
The world economy in FY2012 is projected to expand moderately thanks to the strength
of the U.S. economic recovery and emerging countries’ robust growth, despite a further economic
slowdown in Europe. The United States is expected to post faster growth than in FY2011 thanks to
the continuation of the recovery from the second half of FY2011 and a rally in residential demand.
On the other hand, the European debt and banking crisis is unlikely to end soon, indicating that
Europe has little chance to get back on a growth path within FY2012. Nevertheless, Europe as a
whole is projected to maintain positive economic growth because the U.S. recovery and emerging
countries’ growth will allow Germany and other European countries to expand exports. Emerging
countries are projected to sustain high economic growth, even though some deceleration is
expected. If monetary tightening runs its course in these countries, monetary easing may drive
them to maintain high growth. If the Chinese economy maintains high growth, it may have a
positive impact on other export-oriented Asian economies.
The Japanese economy in FY2012 is expected to get back on a recovery path thanks to
the strength of the world economy’s moderate expansion and growing post-disaster reconstruction
demand. Particularly, emerging countries’ high economic growth may serve as a primary driver of
Japan’s economic recovery. Japan’s real GDP in FY2012 is projected to grow 1.9% from the
previous year.
Domestic private sector demand is expected to work to raise real GDP growth by 1.1
percentage points. Private final consumption is projected to expand in line with an overall
economic recovery in FY2012, posting 0.6% increase from the previous year. Private residential
investment is projected to increase 5.0% from the previous year as it is supported by economic
recovery and reconstruction demand. Private nonresidential investment, though dragged down by
the yen’s strength, is expected to expand firmly due to robust domestic and external demand,
logging a 3.3% increase from the previous year.
Public demand as a whole is expected to account for 0.6 percentage points of the real
GDP growth rate for FY2012. Healthcare and nursing care spending may continuously work to
push up government consumption, while disaster-relief and reconstruction spending may drop off.
Among disaster-related expenses, rubble removal expenses are expected to remain in and after
FY2012, helping government consumption in the year to increase 1.0% from the previous year.
Public investment in the year is projected to post substantial growth (up 7.5% from the previous
year) for the second straight year as reconstruction outlays are implemented in a full-fledged
manner.
IEEJ: February 2012 All Right Reserved

- 14 -
External demand as a whole is expected to account for 0.1 percentage points of the real
GDP growth in FY2012. Exports are projected to increase substantially (up 5.3% from the
previous year), supported by the world economy’s moderate expansion, including growth in
emerging countries. Fossil fuel imports are projected to decline as nuclear power plants resume
operations. However, other imports are expected to increase due to a domestic economic recovery.
Imports as a whole are projected to expand 4.0% from the previous year.
1-4 Outlook on Production by Industry (Case (A): without electricity restriction)
In FY2011, the Index of Industrial Production is expected to fall 1.7% from the previous
year after a rise in FY2010. In the first half of the year, the index posted a substantial fall from a
year earlier as industrial production plunged due to production facility and supply chain
interruptions. In the second half, production is expected to turn upward thanks to the completed
recovery from the disaster and post-disaster reconstruction demand for such materials as cement
and steel. However, the index for the whole of FY2011 is expected to decline from the previous
year, owing to the substantial fall in the first half.
In FY2012, the Index of Industrial Production is expected to log a substantial increase of
5.0% from the previous year. Production is projected to be expanded mainly in the export-oriented
industries, including transportation and electric machinery builders, due to continuous high growth
in emerging economies and the U.S. economic recovery. In Japan, private sector demand may
recover thanks to growing reconstruction demand, helping to boost production. Each major
industry’s production trend follows:
(1) Crude steel
In the first half of FY2011, crude steel output plunged as the disaster damaged major
steelmaking facilities and reduced production in other industries. While steel exports declined due
to the supply constraint, imports expanded. In the second half, crude steel output is projected to
rally thanks to the recovery of production facilities and the rebound of output for housing and
manufacturing industries. At present, however, exports are slackening because of the yen’s strength,
monetary tightening in Asian countries, and a steel supply glut in Asia. Inventory adjustments are
now required. Crude steel output in FY2011 may have difficulty in restoring the FY2010 level,
totaling 107.58 million tons (2.9% increase from the previous year).
In FY 2012, crude steel exports may slacken due to the yen’s strength and a supply glut,
with imports remaining high. However, given growing post-disaster reconstruction demand under
the third supplementary budget for FY2011 and a moderate recovery in private sector demand,
crude steel output is projected to rise back to 110.55 million tons (2.8% increase from the previous
year), close to the FY2010 level.
(2) Ethylene
IEEJ: February 2012 All Right Reserved

- 15 -
In the first half of FY2011, ethylene production declined slightly as output recovered
rapidly after a decline caused by disaster-inflicted damage to some production facilities. In the
second half, however, ethylene production is failing to grow due to an export fall and high import
levels under the yen’s strength and inventory adjustments, indicating a sharp decline from FY2010.
Ethylene output in the whole of FY2011 is expected to post a sharp decline of 4.6% from the
previous year to 6.68 million tons.
In FY2012, ethylene output, though continuing to face competition from imports, is
projected to recover thanks to overseas economic growth. Domestic demand is also projected to
increase firmly due to growing post-disaster reconstruction demand and a substantial expansion in
transportation machinery and other production. FY2012 ethylene output in FY2012 is expected to
increase 4.0% from the previous year to 6.94 million tons, almost the same as the FY2010 level.
(3) Paper/paperboard
In the first half of FY2011, paper output declined as the disaster damaged production
facilities and negatively affected consumer sentiment. While paper exports declined with priority
given to domestic shipments under supply constraints, imports increased because of the yen’s
strength, as well as demand for goods covering production losses caused by the disaster. Although
the disaster affected paperboard production facilities as well, paperboard demand, including
food-related demand, was brisk. In the second half, supply constraints may ease thanks to the
restoration of production facilities and the improvement of consumer sentiment. On the other hand,
paper demand is projected to slacken due to the downward trend for newspapers, printing, and
information paper products. Paperboard demand is expected to remain robust as cargo traffic
increases thanks to an overall industrial production recovery. Total paper/paperboard output for
FY2011 is projected at 26.57 million tons (2.8% decrease from the previous year).
In FY2012, paper output, though supported by a moderate expansion in private sector
demand, may have difficulties in restoring the pre-disaster level due to high-level imports amid the
yen’s strength. But paperboard production will remain firm, supported by an overall production
and consumption expansion thanks to an economic recovery. The total paper/paperboard output in
FY2012 is projected to be 27.60 million tons (3.9% increase from the previous year).
(4) Cement
In the first half of FY2011, cement supply capacity declined as the disaster damaged
production facilities and forced public works to be postponed or suspended. However, thanks to
brisk private sector demand, including a housing rush just before the termination of the housing
eco-point system, cement output exceeded the year-before level. In the second half, cement
production will increase further due to the recovery of disaster-affected production facilities and
post-disaster reconstruction demand. Cement output for the whole of FY2011 is estimated at 56.91
million tons (1.5% increase from the previous year).
IEEJ: February 2012 All Right Reserved

- 16 -
In FY2012, cement output will increase faster than in the previous year thanks to the
strength of growing post-disaster reconstruction demand and a housing demand rise due to
economic recovery. Even if domestic demand remains firm, however, exports may be capped by
supply constraints after a production capacity cut in FY2010. Cement production in FY2012 is
projected to be 57.91 million tons (1.7% increase from the previous year).
(5) Automobiles
In the first half of FY2011, automobile output plunged as the disaster disrupted
production facilities and supply chains. As the production plunge was attributable to the supply
constraint, however, vehicle output smoothly recovered due to the fast restoration of production
facilities and firm demand in Asian and other emerging countries. In the second half, vehicle
output is projected to increase to almost offset the first-half drop thanks to robust external demand
and a domestic demand recovery. In the whole of FY2011, vehicle production is expected to total
8.95 million units (0.5% decrease from the previous year), limiting a decline to a small level.
In FY2012, exports to emerging countries are expected to continue robust growth, while
domestic demand is likely to recover moderately. Driven by external demand, vehicle production
in the year is projected to reach 9.65 million units (7.8% increase from the previous year).
(6) General and electrical machinery (Note)
In the first half of FY2011, domestic demand for general and electrical machinery was
brisk thanks to the popularity of power generation equipment as well as energy-saving products,
such as room air conditioners, while a production capacity fall caused by the disaster and the
earlier termination of the eco-point incentive system for electrical appliances forced general and
electrical machinery output to decline from a year earlier. In the second half, the production of
white goods may decline as their sales fall in response to the termination of the eco-point system.
However, the production of heavy electrical equipment is projected to remain brisk due to a rise in
domestic demand, including that for power generation equipment. The production index for
general and electrical machinery for the whole of FY2011 is projected to see a limited decline of
0.4% from the previous year.
In FY2012, general and electrical machinery output is projected to log a high growth rate
of 4.9% from the previous year thanks to continuously high growth in emerging economies, a
moderate increase in domestic consumption and the continuous domestic deployment of power
generation equipment.
(Note) “General and electrical machinery” covers general machinery, electrical machinery, information and telecommunications
equipment, electronic parts and devices, precision machinery and metal products.
1-5 Economic and Industrial Outlook ("Case (B): with electricity restriction")
If no nuclear power plants are restarted next summer, the electricity supply is expected to
IEEJ: February 2012 All Right Reserved

- 17 -
be 5.4% short of demand on a kilowatt basis, even with electricity-saving measures taken in a
manner to refrain from affecting economic activities. In order to eliminate the supply-demand gap,
the reduction of production capacity utilization ratios and other electricity-saving measures to
affect economic and industrial activities may have to be taken to cut electricity demand to a level
lower than in "Case A without electricity restriction" and balance demand with supply. If
companies reduce domestic production to save electricity consumption, they will give priority to
domestic supply, cut exports, and shift their production operations overseas. In addition, fossil fuel
imports for power generation may remain high next summer and thereafter with no nuclear power
plants being restarted. Slack economic and industrial activity is projected to cause a corporate
earnings decline, discouraging companies from implementing capital investment. Wide-ranging
adverse effects may be imposed on the entire economy.
If electricity consumption is saved by 5.4% on a kilowatt basis through measures to affect
economic activities, real GDP growth in FY2012 may be limited to 0.1% (1.8 percentage points or
9.1 trillion yen lower than in Case (A)). A production activity decline emerging from demand and
supply constraints is projected to limit growth in the Index of Industrial Production to 1.6% (3.4
percentage points lower). As demand r for fossil fuel for power generation is projected to remain
high, fossil fuel imports in FY2012 may reach 21.1 trillion yen, an increase of 4.6 trillion yen
(including 3.3 trillion yen for power generation) from FY2010. Lower exports and higher imports
may bring about a trade deficit of 4.7 trillion yen (down 6.4 trillion yen from a trade surplus in
Case (A). Such slack economic and industrial activities are projected to negatively affect
employment; unemployment at the end of FY2012 will increase by 100,000 people in comparison
with Case (A).
2. OUTLOOK ON ENERGY SUPPLY AND DEMAND IN FY2011 AND FY2012
2-1 Outlook on Domestic Primary Energy Supply
Case (A): without electricity restriction
In FY2011, domestic primary energy supply is expected to decline 3.7% from the
previous year due to a production plunge caused by the Great East Japan Earthquake and
electricity savings amid a power supply capacity drop. Particularly, the disaster and electricity
savings negatively affected industrial production, including vehicles, and private sector
consumption, which had been recovering firmly since the previous year. In the second half of
FY2011, domestic primary energy supply may slacken because of the continuation of
electricity/energy-saving consciousness and a pull-back from the previous year’s high level
attributable to severe winter weather.
Focusing on the supply of each energy source in FY2011, coal is projected to decline
0.9% from the previous year due to a drop in steel production and the damage to coal fired power
plants.. Oil supply is projected to decline, owing to the pull-back from the previous year’s high level
attributable to summer heat waves, an improvement of fuel efficiency in the transportation sector,
IEEJ: February 2012 All Right Reserved
- 18 -
and a decrease in industrial demand caused by disaster damage and the fuel switch from oil.
However, an oil supply increase for the expansion of oil fired power plants and private power
generation amid a fall in the capacity utilization ratio for nuclear plants is projected to exceed the
decline in the transportation and industrial sectors. As a result, overall oil supply in FY2011 is
expected to increase 1.7% from the previous year. Natural gas supply is projected to expand 19.0%
from the previous year as the capacity utilization ratio rises substantially for LNG fired power
plants. Hydroelectricity supply is estimated to fall 2.8% despite a higher water flow rate because
the Great East Japan Earthquake and torrential rains in Niigata and Fukushima Prefectures hit
hydroelectric plants. Nuclear energy supply is projected to plunge 64.5% due to the disaster and a
shutdown of nuclear power plants as requested by the government. As a result, fossil fuel
consumption may increase substantially because of a fall in the capacity utilization ratio for
nuclear power plants, leading energy-based carbon dioxide emissions in FY2011 to increase 2.1%
from the previous year.
In FY2012, domestic primary energy supply is projected to rise 1.0% from the previous
year as production and economic activities recover thanks to post-disaster reconstruction. Coal
supply is expected to decline 1.8% from the previous year despite a steel production recovery as
coal thermal power generation falls due to the restart of nuclear power plants. Oil supply is
projected to decrease 5.1% due to a fall in supply for power generation because of the resumption
of nuclear power plants, the fuel switch from oil in the industrial sector, and the fuel and
transportation efficiency improvements in the transportation sector. Natural gas supply is predicted
to fall 7.9% from the previous year despite the fuel switch from oil to town gas as supply for
power generation declines. Nuclear energy supply is projected to shoot up 128.2% as nuclear
power plants are expected to raise the overall capacity utilization ratio, even with new plants
launching operation. As a result, CO2 emissions are expected to decline 5.3% as fossil fuel
consumption falls substantially, owing to the restart of nuclear power plants.
Case (B): with electricity restriction
In FY2012, growth of domestic primary energy supply is projected to remain at the level
of a 0.2% increase from the previous year (0.8 percentage points lower than in Case (A)) as
production and economic activities slacken due to the summer electricity restriction. Although
steel production is expected to remain unchanged from the previous year, coal supply is predicted
to rise 4.1% due to the expansion of coal fired power generation. Oil supply is estimated to expand
4.7% due to the substantial rise in oil fired power generation despite the negative influence of the
fuel switching in the industrial sector and the fuel and transportation efficiency improvements in
the transportation sector. Natural gas supply is expected to increase 6.9% due to the fuel switch
from oil to town gas and an increase in LNG fired power generation as well as coal and oil.
Nuclear energy supply is estimated to plunge 99.9% as no nuclear power plants are assumed to be
in operation from April. As a result, CO2 emissions are estimated to increase 5.5% as fossil fuel
IEEJ: February 2012 All Right Reserved

- 19 -
consumption increases due to the shutdown of nuclear power plants.
2-2 Outlook on Final Energy Consumption
Case (A): without electricity restriction
In FY2011, final energy consumption is projected to decline 3.9% from the previous year.
The industrial sector is expected to cut energy consumption by 3.1% from the previous year as a
plunge in vehicle, steel, and other production in the first half cannot be offset by a recovery in the
second half. The residential sector is projected to cut energy consumption by 5.2% due to
electricity savings amid supply shortages and a pull-back from the previous year’s high level
attributable to summer heat waves. The commercial sector is projected to reduce energy
consumption by 7.4% because of the pull-back from the previous year’s high level attributable to
summer heat waves, a decline in services operations in the aftermath of the disaster, and
electricity-saving efforts. The transportation sector is projected to reduce energy consumption by
2.9% due to the pull-back from the previous year’s high level attributable to summer heat waves, as
well as the fuel efficiency improvements.
In FY2012, energy consumption is expected to increase in the industrial and commercial
sectors as the economy recovers. The industrial sector is projected to expand energy consumption
by 2.7% due to a recovery in general machinery and vehicle production. The residential sector is
projected to cut energy consumption by 0.5%, owing to the continuation of strong energy-saving
consciousness and the combination of a slightly cooler summer and a slightly warmer winter. The
commercial sector is expected to increase energy consumption by 1.5% due to a services operation
recovery despite ongoing energy-saving consciousness. The transportation sector is projected to
cut energy consumption by 1.1% due to the improvements in fuel and transportation efficiency,
despite a transportation demand increase amid an economic recovery. As a result, final energy
consumption in FY2012 is projected to increase 1.1% from the previous year.
Case (B): with electricity restriction
In FY2012, final energy consumption is projected to decline from Case (A) due to slack
production and economic activities under the summer electricity constraint. The industrial sector is
projected to increase energy consumption by 0.6% as production recovers slightly from the
disaster even amid the summer electricity constraint. The residential sector is estimated to reduce
energy consumption by 0.9% thanks to stronger electricity-saving consciousness and the
combination of a slightly cooler summer and a slightly warmer winter. The commercial sector is
projected to expand energy consumption by 0.9% due to a recovery in services operations despite
the stronger electricity-saving consciousness. The transportation sector is projected to cut energy
consumption by 1.8% thanks to the fuel and transportation efficiency improvements. As a result,
final energy consumption in FY2012 is expected to decrease by 0.2% from the previous year (1.3
percentage points lower than that in Case (A)).
IEEJ: February 2012 All Right Reserved

- 20 -
2-3 Outlook on Energy Sales
(1) Electricity
Case (A): without electricity restriction
In FY2011, electricity sales (by electric power utilities) in Japan are projected to decline
5.3% from the previous year due to the production drop caused by the disaster in the first half, the
order and request for the reduction of summer electricity consumption, and the pull-back from the
previous year’s high level attributable to summer heat waves.
In the residential sector, household electricity demand posted a substantial decline of
8.1% from the previous year due to growing electricity-saving consciousness, the diffusion of
energy-saving electrical home appliances, and the pull-back from the previous year’s high level
attributable to summer heat waves. Household electricity demand in the second half is projected to
decline 4.3% from the previous year thanks to a slightly warmer winter and the continuation of
energy-saving consciousness. For the whole of FY2011, household electricity demand is projected
to drop 6.1% from the previous year.
In the industrial sector, production plunged as the disaster damaged production facilities
and supply chains. The sector raised the capacity utilization ratio for private power generation
equipment to hold down electricity purchases in response to the electricity consumption restriction
order and request. In the commercial sector, services operations slackened due to the pull-back
from the previous year’s high level attributable to summer heat waves. As a result, the power service
demand, mainly consisting of the demand for the industrial and commercial sectors (total
electricity sales minus lighting service demand), posted a substantial decline of 7.4% from the
previous year in the first half of FY2011. Of power service demand, that from large industrial
users decreased 4.5% due to the production plunge triggered by the disaster. In the second half of
FY2011, power service demand is projected to decline 2.2% owing to the continuation of
electricity-saving consciousness, despite the recovery in services operations in the commercial
sector. Demand from large industrial users in the second half is projected to limit growth to 0.5%
from the previous year. Power service demand in the whole of FY2011 is predicted to decrease
4.9% from the previous year. Of power service demand, that from large industrial users is
projected to drop 2.1%.
In FY2012, household electricity demand is projected to limit growth to 1.8% from the
previous year due to the continuation of electricity-saving consciousness despite the economic
recovery. Power service demand is predicted to expand 3.4% because of the continuous recovery
in production and services operations. Of power service demand, that from large industrial users is
projected to increase 4.1% as production exceeds the pre-disaster level mainly for exports. As a
result, electricity sales are projected to rise 2.8% from the previous year in FY2012.
"Case (B): with electricity restriction"
IEEJ: February 2012 All Right Reserved

- 21 -
In FY2012, household electricity demand is projected to limit growth to 1.1% from the
previous year due to slack economic activities under the summer electricity constraint and the
enhancement of electricity-saving consciousness. Power service demand is projected to limit
growth to 1.7% as the summer electricity constraint decelerates growth in production and
economic activities. Demand from large industrial users is projected to reduce energy demand
growth from Case (A) to a greater extent than in any other sector. Growth in such demand is
estimated to be 1.7%. As a result, electricity sales are predicted to score a 1.5% increase from the
previous year (1.3 percentage points lower than that in Case (A)).
(2) Town Gas
Case (A): without electricity restriction
In FY2011, town gas sales (by gas utilities) in Japan are projected to increase 0.3% from
the previous year because positive factors, such as the fuel switch from oil to gas and an increase in
fuel for private power generation, are greater than the negative factors, such as the slump in economic
activities due to the disaster and the pull-back from the previous year’s high level attributable to
lower-than-usual spring temperatures and summer heat waves.
Town gas sales in the residential sector in the first half of FY2011 declined 2.1% from the
previous year due to the impact of the disaster and the pull-back from the high level of the previous
year attributable to lower-than-usual spring temperatures. In the second half, which includes gas
demand seasons, heating and hot-water demand is expected to decline due to higher winter
temperatures than in the previous year. Town gas sales in the residential sector for the whole of
FY2011 are projected to decrease 1.3% from the previous year.
Town gas sales in the commercial sector and the “other” sector (including hospitals and
public facilities) in the first half of FY2011 posted a substantial fall of 10.3% from the previous
year due to the disaster-caused slump in services, the pull-back in air conditioning demand from the
previous year’s high level attributable to summer heat waves, and changes in preset air-conditioning
temperatures under electricity-saving campaigns. Since air conditioning demand is expected to fall
due to the warmer winter than in the previous year and the electricity-saving efforts predicted for
the second half of FY2011, town gas sales for the whole FY2011 are forecast to decline 7.6% in
the commercial sector and 7.8% in the “other” sector.
In the industrial sector, despite a sharp fall in production due to the disaster, town gas sales
in the first half of FY2011 increased 3.5% from the previous year as a result of the fuel switch from oil
and an increase in private power generation. Given a production recovery in the second half, town gas
sales in the sector for the whole of FY2011 are projected to expand 4.7% from the previous year.
In FY2012, town gas sales in the residential sector are projected to fall 0.1% from the
previous year due to the warmer winter than in the previous year, despite a steady increase in gas
service contracts and the recovery from the disaster. Given the service recovery and sales
promotion efforts, town gas sales are projected to increase 4.1% in the commercial sector and
IEEJ: February 2012 All Right Reserved

- 22 -
4.1% in the “other” sector. In the industrial sector, town gas sales are predicted to increase 3.2%
due to gas equipment’s increased capacity utilization ratio thanks to the production increase amid a
recovery from the disaster, as well as the fuel switch from oil to gas, despite a drop in private
power generation after the previous year’s expansion. As a result, Japan’s town gas sales in
FY2012 are projected to expand 2.5% from the previous year.
Case (B): with electricity restriction
In FY2012, town gas sales in the residential sector are expected to decline 0.6% from the
previous year due to the growing energy-saving consciousness and the warmer winter than in the
previous year. Given the moderate service recovery and the sales promotion efforts, town gas sales
are projected to rise by 3.2% in the commercial sector and 3.7% in the other sector. Town gas sales
in the industrial sector are projected to rise 1.4% thanks to the fuel switch from oil to gas, despite
the production slump under the electricity constraint. As a result, town gas sales in Japan in
FY2012 are projected to increase of 1.3% from the previous year (1.2 percentage points lower than
that in Case (A)).
(3) Oil
Case (A): without electricity restriction
In FY2011, fuel oil sales are projected to fall just 0.1% from the previous year. The
negative factors, such as the production plunge due to the disaster and the fall in auto fuel demand
from the previous year’s high level attributable to summer heat waves, are almost offset by
positive factors, such as an increase in oil fired power plants and private power generation facility
operations resulting from a decrease in the capacity utilization ratio for nuclear power plants.
Sales of gasoline, used mainly as automobile fuel, have basically followed a downtrend due
to the fuel efficiency improvements and a decrease in travel distances. In addition, operations of car air
conditioners in the first half of FY2011 fell due to a pull-back from the previous year’s high level
attributable to summer heat waves, and special expressway toll discounts expired. As a result,
gasoline sales in the first half of FY2011 decreased 4.4% from the previous year. As the downtrend is
expected to continue in the second half, gasoline sales for the whole of FY2011 are projected to
decline 2.9%. Diesel oil sales have also followed a downtrend due to transportation and fuel efficiency
improvements. Such trend was coupled with the pull-back from the higher year-before sales
attributable to summer heat waves to push down diesel oil sales in the first half of FY2011 2.6% from
the previous year. In the second half, diesel oil sales are projected to restore the level of the previous
year as cargo traffic demand increases thanks to post-disaster reconstruction demand and the
production recovery. Diesel oil sales in the whole of FY2011 are projected to drop 1.4% from the
previous year.
Sales of naphtha, a raw material for petrochemical products, in the first half of FY2011
declined 2.1% from the previous year. As ethylene production in the second half is likely to level off
IEEJ: February 2012 All Right Reserved

- 23 -
from the first half due to the yen’s strength, naphtha sales in the whole of FY2011 are projected to
decline 5.1%.
Kerosene sales in the first half of FY2011 posted a substantial decline of 16.8% from the
previous year due to the switch from kerosene to electricity and town gas in the residential,
commercial, and industrial sectors as well as the pull-back from the previous year’s high level
attributable to the lower-than-usual spring temperatures and the impact of the disaster. As heating and
hot-water demand is expected to fall in the second half as the kerosene demand season, for which a
warmer winter than in the previous year is assumed, kerosene sales in the whole of FY2011 are
projected to decline 6.9%.
Fuel oil A sales in the first half of FY2011 logged a substantial fall of 9.8% from the
previous year. As the downtrend is expected to continue despite the production recovery in the
second half, fuel oil A sales in the whole of FY2011 are projected to drop 6.1% from the previous
year.
Fuel oil C sales for power generation in the first half of FY2011 jumped 37.6% from the
previous year thanks to an increase in the operation of oil fired power plants resulting from a decrease
in the operation of nuclear power plants due to the disaster. As the operation of oil fired power plants
is expected to increase further in the second half, fuel oil C sales for power generation in the whole of
FY2011 are projected to expand 104.3% from the previous year. Fuel oil C sales for other uses
(including industrial and shipping uses) in the first half of FY2011 posted a large fall of 10.8% from
the previous year, owing to a plunge in production and transportation, and the conspicuous fuel switch
to town gas in the industrial sector. As the downtrend is expected to continue despite the production
recovery in the second half, fuel oil C sales for other uses in the whole of FY2011 are projected to
decline 7.9% from the previous year.
In FY2012, gasoline sales are projected to fall 1.5% from the previous year thanks to the
fuel efficiency improvements due to the diffusion of eco-friendly vehicles and the shift to
fuel-efficient minivehicles, as well as the termination of special expressway toll discounts. Diesel
oil sales are forecast to decrease 1.4% due to the transportation and fuel efficiency improvements
while cargo transportation demand recovers thanks to the post-disaster reconstruction demand and
the production rally. Naphtha sales are projected to increase 2.7% in line with growth in ethylene
production. Kerosene sales are projected to decline 3.9% despite an increase in demand due to the
economic recovery, the ongoing fuel switch to electricity and town gas in the residential,
commercial, and industrial sectors. Fuel oil A sales are projected to drop 2.6% due to the fuel
switch to town gas while the production and transport demand recover. Fuel oil C sales for power
generation in FY2012 are projected to drop 37.9% from the previous year due to an increase in the
operation of nuclear power plants. Fuel oil C sales for other uses are projected to decline 4.8% due
to the fuel switch along with fuel oil A. Given all these factors, overall fuel oil sales in FY2012 are
projected to decrease 3.9% from the previous year.
LPG sales in FY2011 are expected to fall 5.4% from the previous year due to the impact
IEEJ: February 2012 All Right Reserved

- 24 -
of the disaster. In FY2012, LPG sales are projected to grow 1.8% from the previous year thanks to
the substantial increase in sales of LPG as chemical material.
Case (B): with electricity restriction
In FY2012, gasoline sales are projected to fall 1.9% from the previous year because of
the economic slowdown under the electricity constraint, the fuel efficiency improvements due to
the diffusion of eco-friendly vehicles and a shift to fuel-efficient minivehicles, and the termination
of special expressway toll discounts. Diesel oil sales are projected to decrease 2.7% because of the
improvement in transportation and fuel efficiency and the limited recovery of cargo transportation
demand due to the economic slump under the summer electricity constraint. Naphtha sales are
projected to decrease 0.5% despite growth in ethylene production because the share of LPG in the
materials of ethylene increased from the second half of the previous year. Kerosene sales are
expected to decline 4.3% as the fuel switch to electricity and town gas makes progress in the
residential, commercial, and industrial sectors. Fuel oil A sales are projected to drop 3.3% as the
fuel switch to town gas coincides with the production and transportation slump under the summer
electricity constraint. Fuel oil C sales for power generation are projected to expand 48.3% from the
previous year in the absence of nuclear power plants in operation. Fuel oil C sales for other uses
are projected to decline 5.4% due to the fuel switch along with fuel oil A. Given all these factors,
toverall fuel oil sales in FY2012 are projected to increase 1.8% from the previous year (5.7
percentage points more than in Case (A). When excluding sales for power generation, 1.3
percentage points lower than in Case (A)).
LPG sales are forecast to increase 1.0% due to an increase in sales of LPG as a chemical
material.
3. EVALUATING POSSIBLE IMPACTS OF FACTORS AFFECTING ENERGY
SUPPLY/DEMAND IN FY2012
In order to evaluate impacts of the factors affecting energy supply and demand, we have
conducted a sensitivity analysis on our forecasts for FY2012. In a sensitivity analysis, we analyze
the influence of a change in only one of the assumptions (exogenous variables) quantitatively by
comparing the outputs (forecasts) of both the base case and a case with the changed assumption. In
this report, we analyzed the possible impacts of ambient temperature changes, which tend to affect
energy demand.
3-1 Impacts of Ambient Temperature Changes
Energy demand is sensitive to ambient temperature changes. Particularly, air conditioning
and water heating demand in the residential and commercial sectors are conspicuously sensitive.
As the recent years have seen wild temperature fluctuations due to record summer heat waves and
warm winter weather, needs have grown for the evaluation of ambient temperature changes’
IEEJ: February 2012 All Right Reserved

- 25 -
impacts on energy demand. The average temperatures for the past 10 years are assumed as the base
case here. In our sensitivity analysis, we evaluate impacts of a 1° C temperature change on energy
supply and demand in the summer (July–September) and winter (January–March) seasons that are
vulnerable to temperature changes.
(1) 1° C rise in summer (July-September)
If the mean ambient temperature in summer is 1° C higher than the average-year level,
the annual domestic primary energy supply will increase 0.3% from the base case, and final energy
consumption will increase 0.2%. In the residential sector, an increase in air-conditioning demand
will be greater than a decrease in water heating demand due to the temperature rise, resulting in a
0.2% rise in energy consumption. In the commercial sector, which features greater air conditioning
demand and less water heating demand than the residential sector, energy consumption will expand
0.8%, receiving a greater impact than the residential sector. In the transportation sector, where fuel
efficiency declines due to an increase in vehicle air conditioning demand, energy consumption will
increase 0.2%. Among energy sales, the electricity sales will rise 0.6% because of an air
conditioning demand increase. A town gas sales rise will be increase by just 0.2% as a fall in water
heating demand in the residential and commercial sectors almost offsets an increase in air
conditioning demand mainly in the commercial sector. Fuel oil sales will increase 0.3%, owing to a
rise in gasoline consumption for vehicles and in fuel oil C consumption for power generation amid
an electricity demand expansion.
While the electricity demand increase emerging from temperature changes could surpass
any supply increase, we did not take such a situation into account for this evaluation. If the mean
ambient temperature in summer is 1° C higher in Case (B),” electricity demand may increase 2.4%
on a kilowatt-hour basis. Peak electricity demand may rise 3.6% on a kilowatt-hour basis. In such
event, additional electricity-saving measures, including patience, as well as a further fall in
economic and production activities, may be unavoidable.
(2) 1° C fall in winter (January–March)
If the mean ambient temperature in winter (January to March) is 1° C lower than the
average-year level, annual domestic primary energy supply will increase 0.3% from the base case.
Final energy consumption will also increase 0.3%. As a temperature fall causes a heating demand
rise and a water temperature fall triggers a water heating demand rise in the residential and
commercial sector, energy consumption will increase 1.1% in the residential sector and 0.6% in the
commercial sector. Among energy sales, the electricity sales will increase 0.4 percent due to the
growing heating demand. Fuel oil sales will also rise 0.3%. Town gas sales will expand 0.6%
thanks to growth in heating and hot-water demand. LPG sales will also rise 0.6% because of the
same factor. Town gas and LPG sales will thus receive greater impacts than other energy sources.
If the mean ambient temperature in winter is 1° C lower than the average-year level in
IEEJ: February 2012 All Right Reserved

- 26 -
Case (B), electricity demand will increase 1.4% on a kilowatt-hour basis, with the maximum
demand expanding 2.0% on a kilowatt basis. Such changes could affect the electricity
supply-demand balance.
Contact: [email protected]
IEEJ: February 2012 All Right Reserved

- 27 -
FY2009 FY2010 (Actual) FY2011 (Forecast) FY2012(Actual) 1st half 2nd half Total 1st half 2nd half Total (Forecast)
GDP 495,417 252,961 258,031 510,992 249,895 259,335 509,230 519,012 (Chained to year 2005, in billions of yen) (-2.1) (4.9) (1.5) (3.1) (-1.2) (0.5) (-0.3) (1.9)
Private demand 364,657 187,200 188,475 375,675 185,736 189,268 375,003 379,730 [-3.1] [2.2] [-0.2] [1.1]
Public demand 118,037 57,189 61,514 118,704 58,226 63,563 121,789 124,453 [0.9] [0.1] [0.6] [0.6]
External demand 11,673 8,635 8,189 16,825 6,240 6,973 13,214 14,839 [0.2] [0.8] [-0.8] [0.1]
Domestic corporate goods price index 102.6 102.9 103.7 103.3 105.6 105.5 105.5 105.9 (100 for 2005) (-5.2) (0.1) (1.4) (0.7) (2.6) (1.8) (2.2) (0.4)
Consumer price index 100.5 100.0 99.8 99.9 99.8 99.4 99.6 99.2 (100 for 2010) (-1.5) (-0.9) (-0.4) (-0.6) (-0.2) (-0.3) (-0.2) (-0.4)
Index of industrial production 86.1 94.6 93.1 93.9 90.3 94.2 92.3 96.9 (100 for 2005) (-8.8) (17.4) (1.7) (9.1) (-4.5) (1.2) (-1.7) (5.0)
Crude steel production 96,449 55,424 55,369 110,792 53,312 54,265 107,576 110,550 (1,000 tons) (-8.6) (27.9) (4.2) (14.9) (-3.8) (-2.0) (-2.9) (2.8)
Ethylene production 7,219 3,327 3,671 6,999 3,293 3,384 6,677 6,942 (1,000 tons) (10.7) (-5.3) (-0.9) (-3.0) (-1.0) (-7.8) (-4.6) (4.0)
Exchange rate 92.8 88.9 82.5 85.7 79.8 77.5 78.6 77.5 (Yen/US$) (-7.6) (-6.8) (-8.6) (-7.7) (-10.3) (-6.0) (-8.2) (-1.4)
Crude oil CIF price 68.9 78.6 89.5 84.0 114.0 110.0 112.0 110.0 (US$/Bbl) (-23.5) (27.5) (17.4) (21.9) (45.0) (23.0) (33.3) (-1.8)
Heating degree-days 952 77 998 1,075 53 946 999 980 (6.1) (122.4) (8.8) (12.9) (-31.1) (-5.2) (-7.1) (-1.9)
Cooling degree-days 329 560 0 560 472 2 474 425 (-17.5) (70.6) (-75.0) (70.5) (-15.7) (1600.0) (-15.4) (-10.4)
Primary energy supply 491,315 250,850 262,902 513,752 236,308 258,561 494,869 500,063 (10^10kcal = KTOE) (-4.0) (8.5) (1.1) (4.6) (-5.8) (-1.7) (-3.7) (1.0)
Final energy consumption 331,043 164,813 177,925 342,738 155,468 173,874 329,342 332,895 (10^10kcal = KTOE) (-2.4) (7.1) (0.4) (3.5) (-5.7) (-2.3) (-3.9) (1.1)
Industrial sector 155,327 78,625 82,480 161,105 75,375 80,816 156,191 160,339 (-3.2) (8.3) (-0.3) (3.7) (-4.1) (-2.0) (-3.1) (2.7)
Residential/commercial sector 92,901 43,574 54,468 98,042 39,658 52,319 91,976 92,309 (-1.7) (9.0) (2.9) (5.5) (-9.0) (-3.9) (-6.2) (0.4)
Transportation sector 82,815 42,614 40,977 83,591 40,435 40,739 81,174 80,247 (-1.7) (3.3) (-1.4) (0.9) (-5.1) (-0.6) (-2.9) (-1.1)
Electricity sales 889.4 476.0 466.1 942.1 439.7 452.6 892.3 917.7 (billion kWh) (-3.4) (9.1) (2.9) (5.9) (-7.6) (-2.9) (-5.3) (2.8)
Town gas sales 33,837 16,574 18,710 35,283 16,380 18,995 35,375 36,252 (million m3/10,000kcal) (-1.9) (8.3) (0.9) (4.3) (-1.2) (1.5) (0.3) (2.5)
Fuel oil sales 195,122 92,031 103,917 195,948 88,605 107,174 195,779 188,199 (1,000 kl) (-3.0) (2.4) (-1.3) (0.4) (-3.7) (3.1) (-0.1) (-3.9)
CO2 emissions (energy-based) 1,075 1,122 1,146 1,086 (milion t.-C) (-5.5) (4.3) (2.1) (-5.3)
(100 for FY1990) 101.5 105.9 108.2 102.5 Sources: Actual results data prepared from various publications; forecasts by IEEJ
Notes:
1. Figures in parentheses indicate year-to-year percentage changes, except contributions to GDP growth.
2. Contributions to GDP growth may not add up to the total due to minor data deviations.
3. Industrial sector consumption includes non-energy uses.
Key energy indicators
Key econom
ic indicators
Table 1-1 Overview (Case (A) without electricity restriction)
IEEJ: February 2012 All Right Reserved

- 28 -
FY2009 FY2010 (Actual) FY2011 (Forecast) FY2012(Actual) 1st half 2nd half Total 1st half 2nd half Total (Forecast)
GDP 495,417 252,961 258,031 510,992 249,895 259,335 509,230 509,957 (Chained to year 2005, in billions of yen) (-2.1) (4.9) (1.5) (3.1) (-1.2) (0.5) (-0.3) (0.1)
Private demand 364,657 187,200 188,475 375,675 185,736 189,268 375,003 378,040 [-3.1] [2.2] [-0.2] [0.7]
Public demand 118,037 57,189 61,514 118,704 58,226 63,563 121,789 124,441 [0.9] [0.1] [0.6] [0.6]
External demand 11,673 8,635 8,189 16,825 6,240 6,973 13,214 7,878 [0.2] [0.8] [-0.8] [-1.1]
Domestic corporate goods price index 102.6 102.9 103.7 103.3 105.6 105.5 105.5 105.8 (100 for 2005) (-5.2) (0.1) (1.4) (0.7) (2.6) (1.8) (2.2) (0.3)
Consumer price index 100.5 100.0 99.8 99.9 99.8 99.4 99.6 99.2 (100 for 2010) (-1.5) (-0.9) (-0.4) (-0.6) (-0.2) (-0.3) (-0.2) (-0.4)
Index of industrial production 86.1 94.6 93.1 93.9 90.3 94.2 92.3 93.8 (100 for 2005) (-8.8) (17.4) (1.7) (9.1) (-4.5) (1.2) (-1.7) (1.6)
Crude steel production 96,449 55,424 55,369 110,792 53,312 54,265 107,576 108,191 (1,000 tons) (-8.6) (27.9) (4.2) (14.9) (-3.8) (-2.0) (-2.9) (0.6)
Ethylene production 7,219 3,327 3,671 6,999 3,293 3,384 6,677 6,692 (1,000 tons) (10.7) (-5.3) (-0.9) (-3.0) (-1.0) (-7.8) (-4.6) (0.2)
Exchange rate 92.8 88.9 82.5 85.7 79.8 77.5 78.6 77.5 (Yen/US$) (-7.6) (-6.8) (-8.6) (-7.7) (-10.3) (-6.0) (-8.2) (-1.4)
Crude oil CIF price 68.9 78.6 89.5 84.0 114.0 110.0 112.0 110.0 (US$/Bbl) (-23.5) (27.5) (17.4) (21.9) (45.0) (23.0) (33.3) (-1.8)
Heating degree-days 952 77 998 1,075 53 946 999 980 (6.1) (122.4) (8.8) (12.9) (-31.1) (-5.2) (-7.1) (-1.9)
Cooling degree-days 329 560 0 560 472 2 474 425 (-17.5) (70.6) (-75.0) (70.5) (-15.7) (1600.0) (-15.4) (-10.4)
Primary energy supply 491,315 250,850 262,902 513,752 236,308 258,561 494,869 495,824 (10^10kcal = KTOE) (-4.0) (8.5) (1.1) (4.6) (-5.8) (-1.7) (-3.7) (0.2)
Final energy consumption 331,043 164,813 177,925 342,738 155,468 173,874 329,342 328,734 (10^10kcal = KTOE) (-2.4) (7.1) (0.4) (3.5) (-5.7) (-2.3) (-3.9) (-0.2)
Industrial sector 155,327 78,625 82,480 161,105 75,375 80,816 156,191 157,168 (-3.2) (8.3) (-0.3) (3.7) (-4.1) (-2.0) (-3.1) (0.6)
Residential/commercial sector 92,901 43,574 54,468 98,042 39,658 52,319 91,976 91,854 (-1.7) (9.0) (2.9) (5.5) (-9.0) (-3.9) (-6.2) (-0.1)
Transportation sector 82,815 42,614 40,977 83,591 40,435 40,739 81,174 79,712 (-1.7) (3.3) (-1.4) (0.9) (-5.1) (-0.6) (-2.9) (-1.8)
Electricity sales 889.4 476.0 466.1 942.1 439.7 452.6 892.3 905.5 (billion kWh) (-3.4) (9.1) (2.9) (5.9) (-7.6) (-2.9) (-5.3) (1.5)
Town gas sales 33,837 16,574 18,710 35,283 16,380 18,995 35,375 35,828 (million m3/10,000kcal) (-1.9) (8.3) (0.9) (4.3) (-1.2) (1.5) (0.3) (1.3)
Fuel oil sales 195,122 92,031 103,917 195,948 88,605 107,174 195,779 199,380 (1,000 kl) (-3.0) (2.4) (-1.3) (0.4) (-3.7) (3.1) (-0.1) (1.8)
CO2 emissions (energy-based) 1,075 1,122 1,146 1,209 (milion t.-C) (-5.5) (4.3) (2.1) (5.5)
(100 for FY1990) 101.5 105.9 108.2 114.1 Sources: Actual results data prepared from various publications; forecasts by IEEJ
Notes:
1. Figures in parentheses indicate year-to-year percentage changes, except contributions to GDP growth.
2. Contributions to GDP growth may not add up to the total due to minor data deviations.
3. Industrial sector consumption includes non-energy uses.
Key energy indicators
Key econom
ic indicators
Table 1-2 Overview (Case (B) with electricity restriction)
IEEJ: February 2012 All Right Reserved

- 29 -
FY2009 FY2010 (Actual) FY2011 (Forecast) FY2012(Actual) 1H 2H Total 1H 2H Total (Forecast)
Real GDP 495,417 252,961 258,031 510,992 249,895 259,335 509,230 519,012 (Chained to Year 2005, in billion yen) (-2.1) (4.9) (1.5) (3.1) (-1.2) (0.5) (-0.3) (1.9)
Private demand 364,657 187,200 188,475 375,675 185,736 189,268 375,003 379,730 (-4.0) (3.9) (2.1) (3.0) (-0.8) (0.4) (-0.2) (1.3)
Private consumption 295,021 148,843 150,834 299,677 148,834 151,476 300,310 302,247 (1.2) (2.6) (0.6) (1.6) (-0.0) (0.4) (0.2) (0.6)
Private residential 12,268 6,090 6,462 12,552 6,427 6,764 13,191 13,856 investment (-21.0) (-2.9) (7.8) (2.3) (5.5) (4.7) (5.1) (5.0)
Private nonresidential 62,560 31,315 33,441 64,756 30,691 33,290 63,980 66,105 investment (-12.0) (3.9) (3.2) (3.5) (-2.0) (-0.5) (-1.2) (3.3)
Public demand 118,037 57,189 61,514 118,704 58,226 63,563 121,789 124,453 (4.2) (1.8) (-0.5) (0.6) (1.8) (3.3) (2.6) (2.2)
Government 95,942 48,452 49,719 98,171 49,360 50,555 99,915 100,948 consumption (2.7) (2.4) (2.2) (2.3) (1.9) (1.7) (1.8) (1.0)
Public investment 22,124 8,810 11,817 20,627 8,858 13,029 21,888 23,519 (11.5) (-1.4) (-10.4) (-6.8) (0.5) (10.3) (6.1) (7.5)
Net exports of goods 11,673 8,635 8,189 16,825 6,240 6,973 13,214 14,839 & services (-4.8) (103.0) (10.4) (44.1) (-27.7) (-14.8) (-21.5) (12.3)
Exports of goods & 71,286 41,431 42,135 83,566 40,508 42,815 83,324 87,770 services (-9.8) (25.7) (10.0) (17.2) (-2.2) (1.6) (-0.3) (5.3)
Imports of goods & 59,613 32,795 33,946 66,741 34,268 35,842 70,110 72,931 services (-10.7) (14.2) (9.9) (12.0) (4.5) (5.6) (5.0) (4.0)
Nominal GDP 473,859 238,125 241,080 479,205 229,880 238,019 467,899 475,904 (billion yen) (-3.2) (2.8) (-0.5) (1.1) (-3.5) (-1.3) (-2.4) (1.7)
Industrial production index 86.1 94.6 93.1 93.9 90.3 94.2 92.3 96.9 (100 for 2005) (-8.8) (17.4) (1.7) (9.1) (-4.5) (1.2) (-1.7) (5.0)
Tertiary industry activity 96.7 97.5 98.2 97.8 97.2 99.3 98.2 99.4 index (100 for 2005) (-3.4) (1.6) (0.8) (1.2) (-0.3) (1.1) (0.4) (1.2)
Domestic corporate goods 102.6 102.9 103.7 103.3 105.6 105.5 105.5 105.9 price index (100 for 2005) (-5.2) (0.1) (1.4) (0.7) (2.6) (1.8) (2.2) (0.4)
Consumer price index 100.5 100.0 99.8 99.9 99.8 99.4 99.6 99.2 (100 for 2005) (-1.5) (-0.9) (-0.4) (-0.6) (-0.2) (-0.3) (-0.2) (-0.4)
Exchange rate 92.8 88.9 82.5 85.7 79.8 77.5 78.6 77.5 (Yen/US$) (-7.6) (-6.8) (-8.6) (-7.7) (-10.3) (-6.0) (-8.2) (-1.4)
Crude oil CIF price 68.9 78.6 89.5 84.0 114.0 110.0 112.0 110.0 (US$/Bbl) (-23.5) (27.5) (17.4) (21.9) (45.0) (23.0) (33.3) (-1.8)
Sources: Actual results data prepared from various publications, forecasts by IEEJ
Notes:
1. Bracketed figures indicate year-to-year percentage changes.
Table 2 Macroeconomic Outlook (Case (A) without electricity restriction)
2. GDP components may not add up to the total GDP due to minor data deviations.
IEEJ: February 2012 All Right Reserved

- 30 -
FY2009 FY2010 (Actual) FY2011 (Forecast) FY2012(Actual) 1H 2H Total 1H 2H Total (Forecast)
Crude steel 96,449 55,424 55,369 110,792 53,312 54,265 107,576 110,550 (-8.6) (27.9) (4.2) (14.9) (-3.8) (-2.0) (-2.9) (2.8)
Ethylene 7,219 3,327 3,671 6,999 3,293 3,384 6,677 6,942 (10.7) (-5.3) (-0.9) (-3.0) (-1.0) (-7.8) (-4.6) (4.0)
Cement 58,378 27,194 28,857 56,051 27,263 29,648 56,911 57,906 (-11.4) (-5.4) (-2.6) (-4.0) (0.3) (2.7) (1.5) (1.7)
Paper/paperboard 26,892 13,755 13,587 27,341 13,047 13,523 26,570 27,604 (-6.8) (3.2) (0.2) (1.7) (-5.1) (-0.5) (-2.8) (3.9)
Automobiles 8,865 4,787 4,207 8,994 3,902 5,050 8,952 9,649 (1,000 unit) (-11.4) (24.1) (-16.0) (1.5) (-18.5) (20.0) (-0.5) (7.8)
Foods 102.5 107.5 95.9 101.7 104.3 97.0 100.6 102.1 (1.8) (1.1) (-2.9) (-0.8) (-3.0) (1.1) (-1.1) (1.5)
Textiles (excl. 66.8 66.4 67.7 67.1 66.4 64.9 65.6 64.5 chemical fibers) (-14.4) (-0.5) (1.2) (0.3) (-0.1) (-4.1) (-2.1) (-1.7)
Iron & steel 81.0 94.4 94.1 94.2 89.7 90.6 90.2 93.6 (-11.1) (32.0) (4.0) (16.4) (-5.0) (-3.7) (-4.3) (3.8)
Chemicals (incl. 97.8 98.0 100.2 99.1 97.5 97.3 97.4 99.5 chemical fibers) (2.9) (3.2) (-0.4) (1.3) (-0.5) (-2.9) (-1.7) (2.2)
Ceramics, stone 80.1 84.3 86.9 85.6 82.3 87.7 85.0 87.7 and clay products (-11.3) (11.1) (3.0) (6.8) (-2.3) (1.0) (-0.7) (3.2)
Paper/pulp 87.7 89.4 88.5 88.9 84.3 87.6 85.9 89.9 (-6.8) (2.8) (0.1) (1.4) (-5.7) (-1.0) (-3.3) (4.6)
Nonferrous metals 84.0 89.9 88.8 89.3 84.5 88.1 86.3 90.2 (-5.3) (14.5) (-0.7) (6.4) (-6.0) (-0.7) (-3.4) (4.5)
Transportation 84.3 94.0 86.1 90.0 80.2 97.0 88.6 96.6 machinery (-11.0) (28.3) (-9.8) (6.7) (-14.7) (12.7) (-1.6) (9.0)
Electrical machinery 82.5 95.9 96.8 96.3 93.9 97.9 95.9 100.6 and others (-13.0) (25.8) (9.0) (16.7) (-2.1) (1.2) (-0.4) (4.9)
Industrial production 86.1 94.6 93.1 93.9 90.3 94.2 92.3 96.9 total (-8.8) (17.4) (1.7) (9.1) (-4.5) (1.2) (-1.7) (5.0)
Sources: Actual results data prepared from various publications, forecasts by IEEJ
Notes:1. Bracketed figures indicate year-to-year percentage changes.2. "General and electrical machinery" covers general machinery, electrical machinery, information and telecommunications equipment,electronic parts and devices, precision machinery and metal products.
Table 3 Outlook on Industrial Activities (Case (A) without electricity restriction)
Industrial production index(100 for 2005)
Production
(1,000 tons)
IEEJ: February 2012 All Right Reserved

- 31 -
FY2009 FY2010 (Actual) FY2011 (Forecast)
(Actual) 1H 2H Total 1H 2H TotalWithout
restrictionWith
restrictionHousehold demand 285.0 146.2 158.1 304.2 134.3 151.3 285.6 290.7 288.7
(-0.1) (10.2) (3.7) (6.8) (-8.1) (-4.3) (-6.1) (1.8) (1.1)
Industrial demand 604.4 329.8 308.0 637.9 305.5 301.2 606.7 627.0 616.9 (incl. specified scale demand) (-4.9) (8.6) (2.4) (5.5) (-7.4) (-2.2) (-4.9) (3.4) (1.7)
Total 889.4 476.0 466.1 942.1 439.7 452.6 892.3 917.7 905.5 (incl. specified scale demand) (-3.4) (9.1) (2.9) (5.9) (-7.6) (-2.9) (-5.3) (2.8) (1.5)
(Regrouped) 280.9 153.9 146.3 300.2 146.9 147.0 293.9 306.1 299.0 Large-scale industrial users (-6.3) (11.4) (2.5) (6.9) (-4.5) (0.5) (-2.1) (4.1) (1.7)
Chemicals 26.7 14.2 13.9 28.1 13.8 13.6 27.4 28.3 27.8 (-10.9) (10.0) (0.7) (5.2) (-3.0) (-2.3) (-2.7) (3.4) (1.7)
Iron & steel 46.3 26.5 26.8 53.3 26.4 26.8 53.2 54.6 53.3 (-9.7) (22.9) (8.5) (15.2) (-0.5) (-0.0) (-0.3) (2.7) (0.2)
Machinery 69.5 38.7 35.8 74.6 36.2 37.0 73.2 77.7 74.7 (-8.8) (13.6) (1.2) (7.3) (-6.6) (3.4) (-1.8) (6.1) (2.0)
Total 232.1 128.5 122.9 251.3 123.6 123.7 247.3 257.5 250.5 (-7.5) (13.4) (3.4) (8.3) (-3.8) (0.7) (-1.6) (4.1) (1.3)
Sources: Actual results data prepared from METI’s “Monthly Electricity Survey and Statistics,” forecasts by IEEJ
Notes:
1. Bracketed figures indicate year-to-year percentage changes.
2. The data include specified supplies by electric power utilities and exclude captive consumption. But captive consumption at Tobata Co-operative ThermalPower Company, Inc. and Oita Co-operative Thermal Power Company, Inc. is treated as specified supplies.
3. We estimated demand in and after FY2010 in accordance with the categorization before an institutional change to secure the continuity of the statistics.
Table 4 Outlook on Electricity Demand (Electric power utilities, by use)
(billio
n kW
h)
Ele
ctricity de
ma
nd
FY2012 (Forecast)
FY2009 FY2010 (Actual) FY2011 (Forecast)
(Actual) 1H 2H Total 1H 2H TotalWithout
restrictionWith
restrictionHousehold 9,629 3,806 5,985 9,791 3,727 5,933 9,660 9,648 9,605
(-0.2) (3.0) (0.9) (1.7) (-2.1) (-0.9) (-1.3) (-0.1) (-0.6)
Commercial 4,616 2,480 2,258 4,739 2,226 2,154 4,380 4,561 4,521 (-3.0) (5.0) (0.2) (2.7) (-10.3) (-4.6) (-7.6) (4.1) (3.2)
Industrial 16,707 8,733 8,896 17,628 9,036 9,417 18,452 19,041 18,713 (-3.1) (11.0) (0.7) (5.5) (3.5) (5.9) (4.7) (3.2) (1.4)
Others 2,886 1,555 1,571 3,125 1,392 1,491 2,883 3,002 2,989 (1.2) (13.2) (3.8) (8.3) (-10.5) (-5.0) (-7.8) (4.1) (3.7)
Total 33,837 16,574 18,710 35,283 16,380 18,995 35,375 36,252 35,828 (-1.9) (8.3) (0.9) (4.3) (-1.2) (1.5) (0.3) (2.5) (1.3)
Sources: Actual results data prepared from METI’s “Monthly Gas Industry Statistics,” forecast by IEEJ
Notes:
1. Bracketed figures indicate year-to-year percentage changes.
2. Converted at 2. 1m3=41.8605MJ (10,000kcal)
To
wn g
as sa
les
(million
m3)
FY2012 (Forecast)
Table 5 Outlook on Town Gas Sales (by gas utilities)
IEEJ: February 2012 All Right Reserved

- 32 -
FY2009 FY2010 (Actual) FY2011 (Forecast)
(Actual) 1H 2H Total 1H 2H TotalWithout
restrictionWith
restrictionGasoline 57,597 29,841 28,356 58,197 28,537 27,952 56,489 55,627 55,398
(0.2) (2.5) (-0.5) (1.0) (-4.4) (-1.4) (-2.9) (-1.5) (-1.9)
Naphtha 47,320 22,138 24,529 46,668 21,672 22,597 44,268 45,444 44,057 (10.4) (-0.7) (-2.0) (-1.4) (-2.1) (-7.9) (-5.1) (2.7) (-0.5)
Jet fuel 5,283 2,778 2,376 5,154 2,173 2,493 4,666 4,724 4,703 (-6.9) (7.4) (-11.9) (-2.4) (-21.8) (4.9) (-9.5) (1.3) (0.8)
Kerosene 20,057 5,494 14,838 20,332 4,572 14,353 18,925 18,181 18,069 (-1.0) (10.7) (-1.7) (1.4) (-16.8) (-3.3) (-6.9) (-3.9) (-4.5)
Diesel oil 32,388 16,253 16,611 32,864 15,824 16,579 32,403 31,940 31,522 (-4.0) (4.0) (-0.9) (1.5) (-2.6) (-0.2) (-1.4) (-1.4) (-2.7)
Fuel oil A 16,043 6,712 8,693 15,404 6,055 8,407 14,462 14,082 13,981 (-10.3) (-3.3) (-4.5) (-4.0) (-9.8) (-3.3) (-6.1) (-2.6) (-3.3)
Fuel oil B/C 16,434 8,816 8,515 17,330 9,772 14,794 24,566 18,201 31,650 (-29.0) (5.5) (5.4) (5.5) (10.8) (73.7) (41.7) (-25.9) (28.8)
7,378 3,944 3,724 7,668 5,427 10,235 15,662 9,723 23,229 (-42.5) (-3.2) (12.7) (3.9) (37.6) (174.8) (104.3) (-37.9) (48.3)
For other uses 9,056 4,872 4,791 9,662 4,345 4,559 8,904 8,477 8,421 (-12.4) (13.8) (0.4) (6.7) (-10.8) (-4.8) (-7.9) (-4.8) (-5.4)
Total 195,122 92,031 103,917 195,948 88,605 107,174 195,779 188,199 199,380 (-3.0) (2.4) (-1.3) (0.4) (-3.7) (3.1) (-0.1) (-3.9) (1.8)
LPG sales 16,419 7,616 8,830 16,446 6,976 8,576 15,553 15,836 15,702 (1,000 tons) (-5.5) (-1.0) (1.2) (0.2) (-8.4) (-2.9) (-5.4) (1.8) (1.0)
Note: Bracketed figures indicate year-to-year percentage changes.
Sources: Actual results data prepared from METI, “Monthly Resources and Energy Statistics” Petroleum Association of Japan, “Monthly OilStatistics,” and Japan LP Gas Association, “LP Gas Receipt and Delivery Monthly Report;” forecast by IEEJ
For powergeneration
(1,0
00 kl)
Fu
el oil sa
les
FY2012 (Forecast)
Table 6 Outlook on Fuel Oil Sales
IEEJ: February 2012 All Right Reserved
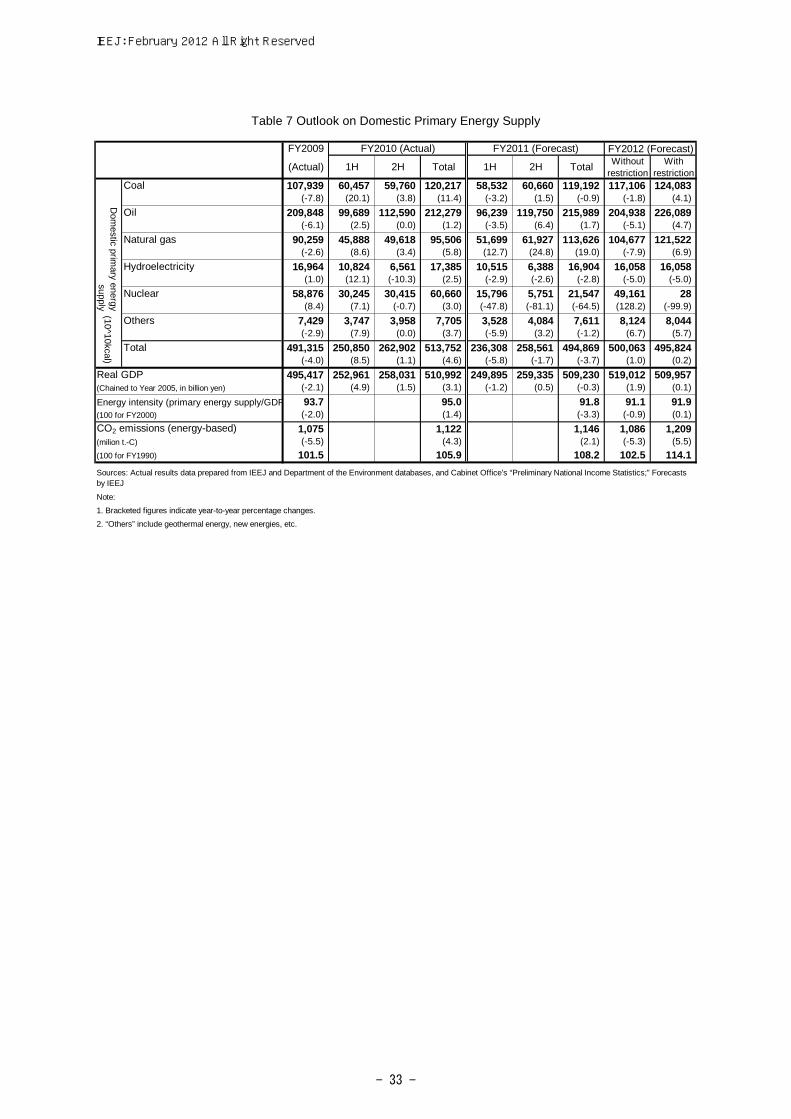
- 33 -
FY2009 FY2010 (Actual) FY2011 (Forecast)
(Actual) 1H 2H Total 1H 2H TotalWithout
restrictionWith
restrictionCoal 107,939 60,457 59,760 120,217 58,532 60,660 119,192 117,106 124,083
(-7.8) (20.1) (3.8) (11.4) (-3.2) (1.5) (-0.9) (-1.8) (4.1)
Oil 209,848 99,689 112,590 212,279 96,239 119,750 215,989 204,938 226,089 (-6.1) (2.5) (0.0) (1.2) (-3.5) (6.4) (1.7) (-5.1) (4.7)
Natural gas 90,259 45,888 49,618 95,506 51,699 61,927 113,626 104,677 121,522 (-2.6) (8.6) (3.4) (5.8) (12.7) (24.8) (19.0) (-7.9) (6.9)
Hydroelectricity 16,964 10,824 6,561 17,385 10,515 6,388 16,904 16,058 16,058 (1.0) (12.1) (-10.3) (2.5) (-2.9) (-2.6) (-2.8) (-5.0) (-5.0)
Nuclear 58,876 30,245 30,415 60,660 15,796 5,751 21,547 49,161 28 (8.4) (7.1) (-0.7) (3.0) (-47.8) (-81.1) (-64.5) (128.2) (-99.9)
Others 7,429 3,747 3,958 7,705 3,528 4,084 7,611 8,124 8,044 (-2.9) (7.9) (0.0) (3.7) (-5.9) (3.2) (-1.2) (6.7) (5.7)
Total 491,315 250,850 262,902 513,752 236,308 258,561 494,869 500,063 495,824 (-4.0) (8.5) (1.1) (4.6) (-5.8) (-1.7) (-3.7) (1.0) (0.2)
Real GDP 495,417 252,961 258,031 510,992 249,895 259,335 509,230 519,012 509,957 (Chained to Year 2005, in billion yen) (-2.1) (4.9) (1.5) (3.1) (-1.2) (0.5) (-0.3) (1.9) (0.1)
Energy intensity (primary energy supply/GDP 93.7 95.0 91.8 91.1 91.9 (100 for FY2000) (-2.0) (1.4) (-3.3) (-0.9) (0.1)
CO2 emissions (energy-based) 1,075 1,122 1,146 1,086 1,209 (milion t.-C) (-5.5) (4.3) (2.1) (-5.3) (5.5)
(100 for FY1990) 101.5 105.9 108.2 102.5 114.1
Note:
1. Bracketed figures indicate year-to-year percentage changes.
2. “Others” include geothermal energy, new energies, etc.
Table 7 Outlook on Domestic Primary Energy Supply
Sources: Actual results data prepared from IEEJ and Department of the Environment databases, and Cabinet Office’s “Preliminary National Income Statistics;” Forecastsby IEEJ
Dom
estic primary energy
supply(10^10kcal)
FY2012 (Forecast)
IEEJ: February 2012 All Right Reserved

- 34 -
FY2009 FY2010 (Actual) FY2011 (Forecast)
(Actual) 1H 2H Total 1H 2H TotalWithout
restrictionWith
restrictionIndustrial 155,327 78,625 82,480 161,105 75,375 80,816 156,191 160,339 157,168
(-3.2) (8.3) (-0.3) (3.7) (-4.1) (-2.0) (-3.1) (2.7) (0.6)
Residential/commercial 92,901 43,574 54,468 98,042 39,658 52,319 91,976 92,309 91,854 (-1.7) (9.0) (2.9) (5.5) (-9.0) (-3.9) (-6.2) (0.4) (-0.1)
Residential 51,552 21,890 32,574 54,464 20,162 31,469 51,632 51,364 51,153 (-0.8) (9.4) (3.3) (5.6) (-7.9) (-3.4) (-5.2) (-0.5) (-0.9)
Commercial 41,349 21,684 21,894 43,578 19,496 20,849 40,345 40,944 40,701 (-2.7) (8.5) (2.5) (5.4) (-10.1) (-4.8) (-7.4) (1.5) (0.9)
Transportation 82,815 42,614 40,977 83,591 40,435 40,739 81,174 80,247 79,712 (-1.7) (3.3) (-1.4) (0.9) (-5.1) (-0.6) (-2.9) (-1.1) (-1.8)
Coal, etc. 34,418 18,294 18,042 36,336 17,496 17,629 35,125 36,013 35,557 (-4.6) (15.0) (-2.5) (5.6) (-4.4) (-2.3) (-3.3) (2.5) (1.2)
Oil 177,180 83,232 95,148 178,380 78,171 92,285 170,456 169,543 167,509 (-1.7) (2.9) (-1.2) (0.7) (-6.1) (-3.0) (-4.4) (-0.5) (-1.7)
Town gas 32,472 16,202 18,598 34,800 16,158 18,956 35,114 36,114 35,590 (-0.6) (12.2) (3.1) (7.2) (-0.3) (1.9) (0.9) (2.8) (1.4)
Electricity 83,554 45,282 44,276 89,558 41,920 43,113 85,033 87,492 86,408 (-3.4) (10.3) (4.2) (7.2) (-7.4) (-2.6) (-5.1) (2.9) (1.6)
Others 3,419 1,803 1,861 3,664 1,722 1,892 3,614 3,732 3,669 (-7.8) (14.3) (1.1) (7.2) (-4.5) (1.7) (-1.4) (3.3) (1.5)
Total 331,043 164,813 177,925 342,738 155,468 173,874 329,342 332,895 328,734 (-2.4) (7.1) (0.4) (3.5) (-5.7) (-2.3) (-3.9) (1.1) (-0.2)
Real GDP 495,417 252,961 258,031 510,992 249,895 259,335 509,230 519,012 509,957 (Chained to Year 2005, in billion yen) (-2.1) (4.9) (1.5) (3.1) (-1.2) (0.5) (-0.3) (1.9) (0.1)
Industrial production index 86.1 94.6 93.1 93.9 90.3 94.2 92.3 96.9 93.8 (100 for 2005) (-8.8) (17.4) (1.7) (9.1) (-4.5) (1.2) (-1.7) (5.0) (1.6)
Heating deree days 952 77 998 1,075 53 946 999 980 980 (6.1) (122.4) (8.8) (12.9) (-31.1) (-5.2) (-7.1) (-1.9) (-1.9)
Cooling degree days 329 560 0 560 472 2 474 425 425 (-17.5) (70.6) (-75.0) (70.5) (-15.7) (1600.0) (-15.4) (-10.4) (-10.4)
Sources: Actual results data prepared form IEEJ database and others; forecasts by IEEJ.
Note:
1. Bracketed figures indicate year-to-year percentage changes.
2. Industrial sector consumption includes non-energy uses.
FY2012 (Forecast)
Table 8 Outlook on Final Energy Consumption
(10^1
0kcal)
By se
ctor
(10^1
0kcal)
By e
nerg
y source
IEEJ: February 2012 All Right Reserved

- 35 -
FY2009 FY2010 (Actual) FY2011 (Forecast)
(Actual) 1H 2H Total 1H 2H TotalWithout
restrictionWith
restrictionFossil thermal 118,076 62,064 62,909 124,973 69,051 85,951 155,002 131,797 180,142
(-9.6) (9.7) (2.3) (5.8) (11.3) (36.6) (24.0) (-15.0) (16.2)
Coal 48,073 24,678 25,181 49,859 23,694 26,087 49,781 46,181 53,930 (-5.1) (10.1) (-1.8) (3.7) (-4.0) (3.6) (-0.2) (-7.2) (8.3)
Oil, etc. 14,849 8,923 8,439 17,362 11,191 18,828 30,019 20,522 43,729 (-39.8) (20.3) (13.5) (16.9) (25.4) (123.1) (72.9) (-31.6) (45.7)
Crude oil 3,462 2,436 2,054 4,490 3,133 6,129 9,261 5,594 15,583 (-53.9) (53.4) (9.6) (29.7) (28.6) (198.4) (106.3) (-39.6) (68.3)
Fuel oil C 7,198 3,970 3,824 7,794 5,328 10,150 15,478 9,651 22,869 (-42.4) (1.2) (16.8) (8.3) (34.2) (165.4) (98.6) (-37.6) (47.8)
Natural gas 55,154 28,463 29,289 57,752 34,166 41,036 75,202 65,094 82,483 (-0.4) (6.4) (3.1) (4.7) (20.0) (40.1) (30.2) (-13.4) (9.7)
Hydro 15,355 9,878 5,843 15,721 9,599 5,689 15,288 14,514 14,514 (1.0) (12.3) (-10.9) (2.4) (-2.8) (-2.6) (-2.8) (-5.1) (-5.1)
Nuclear 58,876 30,245 30,415 60,660 15,796 5,751 21,547 49,161 28 (8.4) (7.1) (-0.7) (3.0) (-47.8) (-81.1) (-64.5) (128.2) (-99.9)
Others 1,143 537 534 1,071 574 571 1,145 1,220 1,220 (2.5) (-7.4) (-5.2) (-6.3) (6.9) (6.9) (6.9) (6.6) (6.6)
Total 193,450 102,724 99,701 202,425 95,020 97,962 192,982 196,692 195,904 (-3.9) (9.1) (0.4) (4.6) (-7.5) (-1.7) (-4.7) (1.9) (1.5)
Electricity generation 79,144 41,776 41,425 83,201 38,319 39,901 78,219 80,581 79,512 (10^10kcal) (-3.1) (8.8) (1.7) (5.1) (-8.3) (-3.7) (-6.0) (3.0) (1.7)
Source: Both actual results and forecasts are from the IEEJ.
Note: Bracketed figures indicate changes from year-before levels.
Input(10^10kcal)
FY2012 (Forecast)
Table 9 Outlook on Electricity Mix (for utilities)
IEEJ: February 2012 All Right Reserved

- 36 -
Table 10 Trade Balance FY2012 (Forecast)
FY2010 (Actual)
FY2011 (Forecast)
Without electricity restriction
With electricity restriction
Exports (in billions of yen) 67,792 67,093 70,529 64,517Imports (in billions of yen) 62,413 68,479 68,871 69,263 Fossil fuel imports 16,439 20,648 19,079 21,059Net exports (in billions of yen) 5,379 -1,386 1,658 -4,746
Table 11 Power Generation Fuel Cut Accompanying 1% Consumption Reduction Fuel demand cut
Coal (in 1,000 tons of steaming coal) 3,160 Oil (in 1,000 kiloliters of crude oil) 2,160 Natural gas (in 1,000 tons of LNG) 1,487
Note: In this case, electricity consumption is cut by 1% on an annual basis. The demand cut for each fuel covers all power generation reduction.
Summer (July-September )temperature: up 1℃
Winter (January-March)temperature: down 1℃
Qtr.-to-qtr. Yr.-to-yr. Qtr.-to-qtr. Yr.-to-yr.
Domestic primary energy supply (10^10kcal) 1,535 (1.2) (0.3) 1,450 (1.1) (0.3)
Final energy consumption (10^10kcal) 676 (0.8) (0.2) 976 (1.1) (0.3)
Industrial sector 71 (0.2) (0.0) 185 (0.5) (0.1)
Residential sector 101 (1.1) (0.2) 546 (2.9) (1.1)
Commercial sector 328 (3.0) (0.8) 246 (2.2) (0.6)
Transportation sector 176 (0.8) (0.2) - (0.0) (0.0)
Electricity sales (million kWh) 5,769 (2.4) (0.6) 3,308 (1.4) (0.4)
Town gas sales (million m3/10,000kcal) 57 (0.7) (0.2) 232 (2.1) (0.6)
Fuel oil sales (1,000kl) 621 (1.4) (0.3) 632 (1.3) (0.3)
LPG sales (1,000t) -57 (-1.6) (-0.4) 102 (2.3) (0.6)
CO2 emissions (milion tons) 4 (1.6) (0.4) 4 (1.4) (0.3)
Note: The industrial sector consumption includes non-energy uses.
Percentage change Percentage change
Table 12 Impacts of Ambient Temperature Changes (Case A without electricity restriction)
Demandchange
Demandchange
IEEJ: February 2012 All Right Reserved
Contact: [email protected]