should hybrid vehicles be subsidized?
TRANSCRIPT

1616 P St. NW Washington, DC 20036 202-328-5000 www.rff.org
July 2010
Should Hybrid Vehicles Be Subsidized?
Vi rg in ia McConne l l and Tom Tur ren t ine
BAC
KG
ROU
ND
ER

Contents
I. Executive Summary ............................................................................................................ 1
II. Hybrid Vehicles: Overview ............................................................................................... 5
A. Background .................................................................................................................... 5
B. HEVs .............................................................................................................................. 6
C. PHEVs and BEVs......................................................................................................... 11
D. Battery Costs ................................................................................................................ 16
E. The Problem of Import Dependence for Battery Materials .......................................... 18
F. Current and Past Policies for HEVs, PHEVs and BEVs .............................................. 18
III. The National Energy Modeling System, Transportation, and Hybrid Vehicles ...... 20
A. How NEMS Treats Hybrid Vehicles ........................................................................... 21
IV. Alternative Policies for Hybrid Vehicles ...................................................................... 23
A. Arguments for Separate Policies Targeting Hybrid Vehicles ...................................... 24
B. Subsidy Policies ........................................................................................................... 25
C. Other Policies ............................................................................................................... 26
D. Evidence of the Effectiveness of Hybrid Policies ........................................................ 27
E. Policies Modeled in NEMS .......................................................................................... 28
F. Estimating the Costs of Hybrid Policies ....................................................................... 29
V. Changes in NEMS Assumptions for Policy Analysis .................................................... 33
A. Subsidy Policies ........................................................................................................... 33
B. Alternative Cost Assumptions for Batteries and System Costs ................................... 36
C. Combinations of Policies ............................................................................................. 39
VI. Results of the NEMS Runs............................................................................................. 39
A. Results of the Hybrid Subsidy Runs ............................................................................ 40
B. Results of the Optimistic Battery Costs and Combination Policies ............................. 51
C. Combination Policy Results ......................................................................................... 55
D. Summary of Costs and Cost-Effectiveness .................................................................. 55

VII. Discussion and Conclusions ......................................................................................... 61
References .............................................................................................................................. 65
Appendix ................................................................................................................................ 70

Resources for the Future McConnell and Turrentine
1
Should Hybrid Vehicles Be Subsidized?
Virginia McConnell and Tom Turrentine∗
I. Executive Summary
Hybrid-electric vehicles (HEVs) have been sold in the United States since the first Honda Insight of 1999. Growth in hybrid sales has been relatively slow, with the current hybrid market at about 2.5 percent of all new-car sales. Plug-in hybrid-electric vehicles (PHEVs) and battery electric vehicles (BEVs) will soon be introduced to the market in the United States. The extent to which these more fuel-efficient vehicles are able to penetrate the vehicle market and contribute to the goals of reducing oil use and greenhouse gas (GHG) emissions will depend on technology and market outcomes as well as policies pursued by government in coming years.
This part of the overall energy policy analysis focuses on the potential role of HEVs, PHEVs, and BEVs in reducing oil use and GHG emissions in the U.S. Different technology outcomes and policies targeting hybrid vehicles are considered, using NEMS-RFF1 to model policy outcomes. Costs of each of the policies include full welfare costs and are determined outside of the model.
Subsidies are among the major policy tools for increasing the share of hybrid vehicles in the fleet. Here, we analyze a subsidy to consumers for the purchase of hybrid vehicles: the greater the fuel efficiency of the hybrid over a conventional vehicle of similar size, the greater the subsidy. We find that the interaction between a subsidy policy and other policies can be quite
∗ McConnell, Senior Fellow, Resources for the Future. Turrentine, Center for Transportation Studies, University of California, Davis. This background paper is one in a series developed as part of the Resources for the Future and National Energy Policy Institute project entitled “Toward a New National Energy Policy: Assessing the Options.” This project was made possible through the support of the George Kaiser Family Foundation.
© 2010 Resources for the Future. All rights reserved. No portion of this paper may be reproduced without permission of the authors.
Background papers are research materials circulated by their authors for purposes of information and discussion. They have not necessarily undergone formal peer review. 1 The National Energy Modeling System (NEMS) is a computer-based, energy-economy market equilibrium modeling system for the United States developed by the U.S. Department of Energy (DOE). NEMS-RFF is a version of NEMS developed by Resources for the Future (RFF) in cooperation with OnLocation, Inc.
Resources for the Future McConnell and Turrentine
2
important, and subsidies on hybrids should be evaluated in the context of other policies in place or being considered.
A range of policies designed to reduce oil consumption and GHG emissions from the transportation sector are addressed elsewhere in the RFF-NEPI study. These policies, which include oil taxes, gasoline taxes, and feebates, have varying effects on both the rate and timing of hybrid vehicle penetration. For example, the high gasoline tax that is modeled influences consumer and producer decisions about the purchase of alternative fuel vehicles. Under this policy, sales of all hybrids are projected to increase from 23 percent of new-car sales to 30 percent by 2030.
For a number of reasons, it may be efficient to develop policies that separately target hybrid vehicles. These reasons include the effects of scale economies in the production of hybrids, costs incurred by first adopters that are higher than those incurred by later adopters (on both the consumer and the producer side), insufficient incentives for research and development, and the effects of learning in such technology development areas as electric drive trains and batteries.
Subsidies for HEVs have been the most common type of policy for promoting hybrid vehicles to date. Current subsidies for HEVs (from the 2005 Energy Policy Act) are based roughly on fuel economy and provide up to $3,400 per vehicle; but these phase out after 60,000 vehicles per manufacturer are sold and the HEV subsidy is set to expire completely at the end of 2010. The focus of federal subsidies is shifting toward PHEVs and BEVs that are expected on the market at the end of 2010. Under recent legislation these vehicles (but not HEVs) will be eligible for up to $7,500 per vehicle in federal subsidy, depending on battery size. Subsidies are also available for battery development and production, in the form of direct subsidies and loan guarantees.
We examine hybrid subsidy policies here, both alone and in combination with other policies. Subsidies that are directly on the price of the vehicle, rather than in the form of a tax rebate, tend to be most effective (based on evidence from an analysis of current subsidy policies). We examine a subsidy on HEVs and PHEVs that is based on gallons of fuel used per mile, or fuel intensity. The amount of the subsidy received differs by vehicle size class and is based on the difference in fuel intensity between the conventional vehicle and the hybrid vehicle. The subsidies start at about $3,000–$4,000 per vehicle, varying with the size of the vehicle and the fuel efficiency of the hybrid version over the conventional.
Resources for the Future McConnell and Turrentine
3
Separate size categories is the approach used by the U.S. Environmental Protection Agency and the National Highway Traffic Safety Administration (NHTSA) to set corporate average fuel economy (CAFE) rules, so that is the approach we use in this analysis. This approach can be efficient in that it will reward fuel efficiency improvements across all segments of the vehicle market, including for the biggest, most fuel-inefficient cars, which may offer the greatest opportunities for fuel savings.
The subsidy of hybrid vehicles results in an increase in the share of hybrids, with HEVs the most affected. However, despite the greater penetration of these vehicles, there is very little effect on fleet fuel economy, overall energy use, or vehicle-miles traveled (VMT). This is because the CAFE standards, even in the base case, that correspond to the current NHTSA and EPA regulations, are quite strict and will not be easily met by the manufacturers. Because the standards are binding, the subsidy results in the sale of more hybrid vehicles and manufacturers can do less with conventional vehicles to meet those standards. One perspective is that the subsidy is then unnecessary because it does nothing to reduce energy use or GHG emissions – the CAFE standards are already achieving the intended reductions. An alternative view is that there may in fact be an important role for subsidies because they make it easier to meet a strict and increasing standard that may be very difficult to enforce, especially if gas prices remain relatively low. Hybrid subsidies can reduce the overall costs of meeting CAFE standards and may, therefore, be an important policy to consider along with CAFE standards.
We then consider the case where the costs of batteries and of hybrid systems are much lower than the baseline NEMS assumptions. The battery and system costs fall to roughly half of what they are in the NEMs baseline. These are quite optimistic assumptions about battery costs but are consistent with what some analysts believe about future technology opportunities.
When battery costs are lower, we find that the share of hybrid vehicles in the fleet is much larger. But, as with the subsidy, this simply makes it easier for manufacturers to meet the binding CAFE standards, and there is very little effect on energy use. In fact, because hybrid vehicles are less expensive, energy use from light-duty vehicles actually rises very slightly compared to our base case. VMT also increases very slightly.
In our final set of analyses, we consider combined policies. First, we look at the subsidy for hybrids combined with a stricter CAFE standard over the entire time period up to 2030. Fuel economy is higher, as expected, and energy use is lower than the base Core 1 as well. With better fuel economy, we would expect to see a slight rebound effect, and VMTs are slightly greater. The strict CAFE standard pushes the limits of technology, at least according to the technologies

Resources for the Future McConnell and Turrentine
4
assumed in the NEMS model, and the standards cannot be met, even with the subsidy.2 The subsidy results in few additional hybrids because the Model assumes there are more cost-effective technologies for the conventional vehicles as fuel economy levels are pushed to the limit.
We also examine a policy combining optimistic assumptions about battery costs, a high gasoline tax, and the subsidy for hybrid vehicles. This set of policies results in a significant shift toward hybrid vehicles of all types. The light-duty vehicle stock has much higher fuel economy, and energy use falls by quite a bit, but this appears to be due primarily to the high gasoline tax.
Finally, we review issues that may limit the conclusions we can make in examining hybrid policies using DOE’s NEMS. One issue is that compliance with CAFE standards is not fully modeled. The manufacturers have no way to attempt to sell more hybrids by varying their prices to meet CAFE. The only way to introduce more hybrids as a way to meet CAFE is to change the consumer demand side of the model to ensure that consumers buy more of them. We keep the consumer coefficients the same through different runs of the model. We do not model how manufacturers will respond to CAFE requirements or how consumers will respond to greater information about and experience with a larger hybrid fleet. These are important aspects of how both fuel economy and subsidy policies will play out over time.
Another related issue is that NEMS assumes that the CAFE standards are not changed in response to any of the policies or assumptions introduced. In setting CAFE standards, NHTSA is now using an economic feasibility test (NHTSA 2009). If battery costs were to fall, as we model in one of our analyses, and the standards became easier to meet, it is possible that NHTSA would move to tighten the standard under the current rule.3 We have not attempted to build this type of change into the analysis.
2 The Department of Energy’s NEMS-RFF model used for the analyses assumes a set of technologies that are available to the manufacturers. There are likely to be additional new technologies developed in the coming years. Some analysts argue that the NEMS-RFF model is conservative in its forecast for this reason. 3 The Energy Independence and Security Act of 2007.
Resources for the Future McConnell and Turrentine
5
II. Hybrid Vehicles: Overview
A. Background
Hybrid-electric vehicles (HEVs) have begun to transform automobile design and fuel economy in the United States in recent years. Plug-in hybrid-electric vehicles (PHEVs) and pure battery electric vehicles (BEVs) are related automotive technologies that have not yet made it to market but have received renewed attention in the wake of high oil prices and concern both for energy security and for global warming.4
BEV technology has been around for more than 100 years; it competed with the gasoline and diesel internal combustion engine (ICE) and the steam engine in the first decades of the 20th century, eventually losing out to the superior energy storage of liquid fuels from petroleum—gasoline and diesel. The shortcoming of electric vehicles is the limited energy density of electricity stored in chemical batteries. Compared to the high-energy density of liquid fuels for combustion, the ease and speed of refilling liquid from fuel pumps, and the long life of combustion engines, batteries are bulky, heavy, expensive, and slow to charge, and they contain limited energy and wear out sooner than the vehicle, resulting in an expensive replacement cost to the owner. The other technical parts of an electric drive train, the motor, and regenerative braking systems, are more efficient, simpler, easier to control, and more powerful than ICEs.
However, a number of problems result from the use of ICE gasoline- and diesel-fueled vehicles. These vehicles emit pollutants, resulting from combustion and fuel evaporation, which are released at fueling stations and from vehicles and become trapped in urban air basins. These pollutants can become concentrated in road corridors, creating serious health hazards, especially to children, the elderly, and people with lung ailments. Regulations over the last 30 years to reduce these emissions have resulted in a current ICE fleet that is much cleaner, though the size of the fleet and the increasing rate of vehicle-miles traveled (VMTs) means that emissions of local air pollutants from vehicles are still a problem in the United States. Diesel engines and diesel fuels have only begun to be regulated to the same stringency as gasoline engines to reduce local pollutant emissions; thus, they remain a serious problem, especially for particulate emissions.
4 See Turrentine et al. (2006) for more on the potential for hybrid vehicles.

Resources for the Future McConnell and Turrentine
6
Reliance on petroleum fuels for vehicles has additional serious climate and fuel security impacts. Carbon dioxide (CO2) is a primary byproduct of combusting petroleum-based fuels; climate scientists have identified CO2 as a serious greenhouse gas (GHG). Transportation accounts for 27 percent of GHGs in the United States (U.S. EPA 2006). In addition, the increasing share of imported oil in the United States and the continued political instability in many of the oil-exporting countries, has led many to argue that it is in the interests of the United States to reduce oil consumption significantly (Brown and Huntington 2010). The transportation sector is particularly affected because petroleum is the source of more than 95 percent of transportation fuels (U.S. Department of Energy [DOE] 2010).
Electricity for vehicles is one approach to reducing reliance on petroleum. HEVs generate electricity during operation, which then can be used to reduce the use of gasoline during various parts of the driving cycles. PHEVs have the potential to reduce the use of petroleum even more, though how much more and at what cost are still questions that must be addressed. PHEVs draw on electricity from the grid, which can be produced from a variety of feedstocks. And although currently existing electricity production accounts for the biggest percentage of GHGs worldwide, potential low-carbon sources of electricity, such as wind, solar, biofuels, geothermal, nuclear, and hydroelectric, are available. Evidence suggests that the lifecycle reductions in GHGs from moving toward PHEVs are likely to depend critically on the sources of electricity (Samaras and Meisterling 2008).
A range of issues are critical to explore when considering public policies targeting gasoline–electric hybrids and PHEVs. These include the potential for new battery development and for reductions in production costs over time, the potential for import dependence on battery materials in the future, and preferences on the part of the public for various types of hybrid and electric vehicles. We discuss these and other issues to provide an overview of the technologies and their challenges.
B. HEVs
HEVs made a heralded entry into the auto market in the late 1990s, with the introduction of the Honda Insight and the Toyota Prius. Hybrids are designed to increase the efficiency and lower the emissions of gasoline and diesel ICEs. The Honda Insight is a small, two-seat, very aerodynamic and lightweight vehicle. The vehicle was capable of traveling 70 miles per gallon (mpg) of gasoline. The hybrid aspect of its design was the ability of the vehicle to recapture energy lost in idling, braking, coasting, and in downhill mode as well as engine downsizing. The energy was captured through a generator, stored in a small battery, and returned to the wheels by

Resources for the Future McConnell and Turrentine
7
a small electric motor that assisted the gasoline engine. This hybrid design improved fuel economy by 25 percent or more (Burke et al. 2002, Table S-4).
The Toyota Prius is a five-seat sedan, marketed by Toyota as a car that does everything described above and more. With a larger battery and motor, the Prius can, for short periods and at low power demands, drive the vehicle entirely on electricity from the battery. At times of moderate power demand or low battery charge, the vehicle uses the gasoline engine; and at times of high power demands and adequate battery charge, it uses both the gasoline engine and the electric motor. A set of computer programs, the control system, makes second-by-second decisions about how much power is needed according to foot pedal pressure, grade, and headwind. This design of hybrid can offer a 40 percent improvement in fuel economy over a conventional ICE of the same size (Schafer et al. 2009, 122; Burke et al. 2002, Table S-4), with the potential for reductions as high as 70 percent (Cheah et al 2007). However, although incredibly efficient, hybrids rely 100 percent on liquid or gaseous fuels and, more likely than not, on gasoline or diesel. Their batteries are not large enough to bother plugging into the grid for storing electricity.
A third category of hybrid vehicles, sometimes called micro-hybrids, are ICE vehicles that use electricity for stop–start devices to avoid idling losses. Micro-hybrid technologies are less costly to implement and are likely to sweep through vehicle designs in the next decade. Some manufacturers, such as Renault, have already said that they will put micro-hybrid technologies in all models, in response to carbon-per-kilometer goals in Europe.
i. HEV Sales in the United States
Total Prius sales in the United States represent close to 10 percent of total Toyota sales in the United States, with about 180,000 sold in 2008 Worldwide, cumulative Prius sales are now over 1 million vehicles, and in 2009 it was the best-selling vehicle in Japan.
Although dominant in sales, the Prius is not the only hybrid in the current vehicle market. A number of manufacturers have produced hybrid versions of particular model types starting around 2005. Figure 1 shows total hybrid sales by year for the major hybrid models from 2001 to 2008, including the Prius, the Civic, the Escape, the Highlander, and the Camry. In 2009, Ford introduced the Fusion Hybrid, GM the Chevy Malibu Hybrid, and Honda the newly designed four-passenger Honda Insight.
As Figure 1 shows, sales reached peak levels in 2007 and were lower in 2008, probably due in large part to the recession that began early that year. In the last year or two, hybrids have

Resources for the Future McConnell and Turrentine
8
composed up to 2–3 percent of sales in the United States, with much higher market penetration in some regional markets, such as Portland, Los Angeles, Seattle, and San Francisco.5 Hybrid sales as a percentage of total sales had been down slightly since the beginning of 2009, but set a record for sales at 3.55 percent of total vehicles sold in July, during the “Cash for Clunkers” stimulus program.
Figure 1. Hybrid Sales by Year for Major Hybrid Models
0
50000
100000
150000
200000
250000
300000
350000
2001 2002 2003 2004 2005 2006 2007 2008
C ivic Hybrid
E s cape Hybrid
Highlander Hybrid
C amry Hybrid
P rius
Model
Figure 2 shows annual sales of hybrid vehicles by model alongside their conventional gasoline vehicle counterparts. Among hybrid models, a clear upward trend in sales is evident only for the Prius. Two factors that are likely to have influenced hybrid sales are the prices of hybrid vehicles compared to those of conventional vehicles and the price of gasoline. Subsidies have been available for light-duty HEVs since the Energy Policy Act of 2005 made available a federal income tax credit for any qualifying vehicle placed in service after December 31, 2005. The credit ranges from $250 to $3,150, depending on the vehicle model and its fuel efficiency. This credit begins to phase out after the manufacturer sells 60,000 light-duty HEVs. The credits phased out for the Prius in 2007 and are being phased out in 2009 for most of the other hybrid models. These HEV subsidies phase out altogether in April 2010.
5 Kahn (2008) found hybrid buyers

Resources for the Future McConnell and Turrentine
9
Figure 2. Sales of Hybrid and Conventional Models, by Year
050000
100000150000200000250000300000350000400000450000
P rius
C amry
C amry H
ybrid
Hig hlander
Hig hlander Hybrid
E sc ape
E sc ape Hybrid C i
v ic
C iv ic Hybrid
2001
2002
2003
2004
2005
2006
2007
2008
Source: Automotive News Annual Sales data, accessed 2010. Note: Data are missing for some years of Camry sales for the 2002–2005 model years.
ii. Hybrid Prices and Fuel Economy Relative to Conventional Gasoline Vehicles
To get an idea of the relative costs of the current hybrids compared to conventional vehicles, we collected data on vehicle prices and fuel economy for models that have both a gasoline and a hybrid counterpart. For the consumer, the hybrid offers reduced fuel costs and less frequent refueling. Of course, the value to the consumer varies according to the cost of gasoline. Table 1 shows the prices of the two vehicles with similar options and their certified fuel economy (from Edmunds, 2009 .6 We tried to obtain prices for the two types of vehicles with similar features, which was sometimes difficult. We use a $3.00/gallon price for gasoline in all cases, but the value of the hybrid version will increase with the price of gasoline. We used both a 3-year time frame and a 13-year time frame—the average life of vehicles in the United States—for consumers to consider fuel economy. Clearly, if consumers consider fuel economy for only three years, none of the hybrid models is cost-effective. With the full government subsidy for HEVs of just over $3,000, the cost with the subsidy and net of fuel savings looks more
6 The median of the city and highway driving estimates for fuel economy was used for the conventional vehicles.

Resources for the Future McConnell and Turrentine
10
economical. However, most of the subsidies on these vehicles are either no longer in effect or are quite small.
Notably, the Chevy Silverado Hybrid results in the most energy savings of all of the vehicles in the table. The Silverado Hybrid was the first full hybrid truck to enter the market and was first sold in the 2009 model year. It has the greatest fuel savings because the conventional version has such low fuel economy and the percentage improvement in fuel savings with the hybrid model is more than 35 percent. The far right column of Table 1 shows the dollar value of the total gallons of gasoline saved with the hybrid version over the conventional. Thus, the most fuel-inefficient vehicles offer the greatest opportunity for savings; this is a key point to keep in mind when assessing energy-reducing policies, and we return to it below. Also, even with the rather extreme assumption of three years of fuel savings discounted at 15 percent, the hybrid version of the Silverado comes close to paying back the difference in price without any subsidy. However, sales of the Silverado Hybrid over the last year since it first came on the market have been very modest.
Table 1. Examples of Price and Fuel Economy of Same-Model Conventional and Hybrid Vehicles, 2010 Model Years
Conventional gas vehicles Hybrid vehicles
Difference in costs between conventional and hybrid models
Price mpg Price mpg Price
difference
Fuel economy savings at
$3.00/gallon, over 3
yearsa,b,c
Fuel economy savings at
$3.00/gallon over 13 yearsb,c
Honda Civic $20,000 29 $24,800 42 $4,800 $1,289 $3,779 Ford Escape $25,000 24 $29,750 33 $4,750 $1,372 $4,024 Ford Fusion $22,650 25 $27,270 35 $4,620 $1,380 $4,047 Toyota Camry
$22,650 26 $26,150 34 $3,500 $1,093 $3,204
Chevrolet Silverado
$36,000 15 $41,000 21 $5,000 $2,300 $6,744
a A three-year period of accounting for fuel savings is assumed in the National Energy Modeling System. b The discount rate was assumed to be 5 percent. c Miles driven per year are from Davis et al. (2008).
Sales of hybrid vehicles are also likely to vary with gasoline prices. Figure 3 shows hybrid sales and gasoline prices by month during 2007 and 2008. Gasoline prices were multiplied by 10 to allow easier comparison to hybrid sales (in thousands). Gasoline prices were

Resources for the Future McConnell and Turrentine
11
trending upward over this period, but with some months of decline. The hybrid sales seem to increase with rising gasoline prices and fall when gas prices are falling or constant. The exception is the later period, after April 2008, when sales of hybrids declined dramatically even while gas prices were continuing to rise. This is probably due to the recessionary pressures that resulted in a sharp decline in all auto sales.
Figure 3. Price of Gasoline and Sales of Hybrid Vehicles by Month, 2007 and 2008
05
101520253035404550
Janu
ary
Febr
uary
Mar
chA
pril
May
June
July
Au
gust
Sep
tem
ber
Oct
ober
Nov
embe
rD
ecem
ber
Janu
ary
Febr
uary
Mar
chA
pril
May
June
July
Au
gust
Sep
tem
ber
Oct
ober
Nov
embe
rD
ecem
ber
2007 2008
Gasoline prices *10 US Hybrid Sales (000s)
Source: Hybrid sales data are from Green Car Congress (2010); gasoline prices are from EIA, 2010 Note: Gasoline prices are in US$ per gallon multiplied by 10.
C. PHEVs and BEVs
Like HEVs, PHEVs are a combination of electric and liquid fueling systems. The PHEV is similar to today’s HEVs but with a much larger battery and the capability to be plugged into the electrical grid to store and supply grid electricity for power to the wheels. PHEVs do use gasoline or diesel for some portion of their power needs, depending on the vehicle design or travel patterns of the user.

Resources for the Future McConnell and Turrentine
12
PHEVs do not have a single design, but offer a range of technology options that combine aspects of pure BEVs and HEVs. Already, manufacturers and researchers have showcased a variety of PHEVs, with some designs that are more like BEVs and some that are modest modifications of existing HEVs. The PHEV always has both an ICE powered by a fuel—like gasoline, diesel, or biofuel—and at least one electric motor. Electricity for the motor is primarily stored in chemical batteries that are recharged from the grid or, in some designs, also by electricity generated from the ICE. In some designs, power for the wheels comes only from the electric motor. In other designs, the power for the electric motor is combined with power from the ICE.
At the heart of each PHEV design is the integration of four systems: the engine; drive trains, which integrate the electric drive and internal combustion power source; the battery system, emphasizing large or modest energy storage and power capabilities; and the control system, computer-guided programs that direct the complex relationships between the electric and internal combustion systems and also manage the battery system.
The first PHEV to come to the market is likely to be one made by GM, the Chevy Volt, a much talked about 40-mile series design, that GM calls an extended range electric vehicle, not a PHEV, to emphasize that its design is nearly that of a BEV and to set it apart in the market from the Toyota PHEV, a modest PHEV 10, to be introduced in limited numbers in 2009. Ford will also introduce a limited number of PHEVs, and is negotiating with the U.S. government over quantities to be supported by funds from the U.S. Department of Energy (DOE).
BEVs, in contrast to both HEVs and PHEVs, obtain all of their power from the electricity grid. They must be recharged every 30–120 miles, depending on the battery size, a process that can take hours and requires a parking spot with a high-powered electrical outlet. Also, according to their weight and maximum miles (range) between recharges, BEVs require larger, and thus more expensive, batteries than dual-fueled PHEVs. BEVs find their logical market niche in urban and suburban situations where drivers have moderate, daily driving needs that fit the vehicle’s driving range, or in which BEV owners have access to an ICE, an HEV or a PHEV for longer-distance travel.
i. Importance of the Battery
A long list of battery chemistries have been tested in the past for BEVs, but the leading technology for BEVs and PHEVs are lithium ion (Li-ion) batteries, now dominant in the electronics industry for phones, cameras, and laptops (Axsen et al. 2008; Anderman 2010). Of
Resources for the Future McConnell and Turrentine
13
course, the battery needed for vehicles is much larger and more complex and is designed to last longer and sustain more abuse than those used in consumer electronics.
Batteries for vehicles are built up by three levels of integration: individual battery cells , which are grouped into modules (like the 12-volt six cellstarter battery in a nonhybrid car), and then grouped into complete battery packs for use in vehicles. Currently, there are no mass produced Li-ion cells of the proper size or design for BEVs or PHEVs, much less ready-made modules or packs for PHEVs, although that day is nearing. All of the batteries for such vehicles are either made of many small consumer cells (the Tesla Electric Roadster battery pack is said to have more than 6,800 Li-ion cells) or, if using large cells, are still in limited, experimental packs (like those for the Chevy Volt).
HEVs have much smaller batteries than BEVs or PHEVs, often in the range of 0.5–1.5 kilowatt-hours (kWh), which are used to store and deliver electricity to and from the electric motors for short periods, often seconds or minutes. The batteries are charge sustained during vehicle operation, maintaining their batteries at a narrow range of a high proportion of their charge capacity (usually 60–80 percent). HEV batteries are optimized for high power density, meaning the ability to deliver high power over short periods of time. The battery must be able to endure millions of these shallow cycles over the life of the vehicle. These batteries cost more per unit of energy stored and less per unit of power to manufacture than pure BEV batteries.
In contrast, pure BEVs have much larger battery packs, shaped primarily by the size, weight, and driving range of the vehicle. Typical BEV batteries can range from 16 kWh for citymicro cars with 50 miles of range (Mitsubishi MiEV) to 35 or more kWh for a small two-seater with 150 miles of range (BMW Mini-E). BEV batteries are charged from the grid, and usually at high-power outlets, either Level Two, 220-Volt, 30-amp outlets (for example, in the United States), which can take several hours, or Level Three, three-phase (industrial grid areas in United States only), fast-charging outlets, which can take 15 to 60 minutes to charge a depleted battery. BEVs are outfitted with enough battery capacity to drive a specified range, for example 40–100 miles, until the vehicle battery is depleted; afterwards, they must be parked and recharged. In technical parlance, BEVs use a charge-depleting mode, essentially draining their batteries, usually going from 100 percent to something like 20–30 percent (Burke et al, 2002; Axsen et al., 2008). These are called deep discharge cycles, and BEV batteries must be able to endure thousands of such daily or semidaily deep discharges and additional shallow cycles over the lifetime of the vehicle. Given that the BEV depends on its battery for all of its energy needs, BEV batteries are optimized to hold a lot of electrical energy, what is called high energy density, to store the most energy per volume and weight. Because this battery is so large, it has plenty of

Resources for the Future McConnell and Turrentine
14
power for rapid acceleration and high speed, although such driving events do deplete the battery sooner than slower speeds and more modest driving habits.
PHEV batteries, drive train, and battery control architectures combine both charge-depleting and charge-sustaining control modes, and in that order. PHEVs begin operation, at the start of a trip, as a charge-depleting vehicle and, once the battery reaches a low state of charge, shift to charge-sustaining mode until they are parked and recharged. There are also distinct strategies to control the discharge of a PHEV battery during the initial charge-sustaining mode. Blended strategies combine electricity and internal combustion power as needed during the charge-depleting mode; series strategies (like that of the GM Volt) rely only on the battery during the depleting mode, shifting to charge-sustaining once the battery reaches a low state of charge, at which time the combustion engine is fired up to recharge the batteries. Regardless of these differences, PHEV batteries must combine attributes of high energy density batteries for charge depletion and then, at a low state of charge, provide high power density for charge-sustaining operation over long distances. PHEV batteries must also sustain more deep discharges in their lifetime than EVs, as well as millions of shallow discharges. This is a unique demand on batteries, and a challenge for vehicle battery designers.
Battery pack energy capacity is typically measured in kWh, and power density in kW. But a more pertinent way to measure battery capacity for PHEVs—particularly for the buyer— is in terms of all-electric range (AER) capability. In other words, if the only source of power to the drive train in charge-depleting mode is the battery, how long could the vehicle drive on the battery alone? Typically PHEVs are described as having 10 miles of AER or 20 miles of AER; the shorthand for such vehicles is then PHEV 10, or PHEV 20, respectively.
This is straightforward for series PHEVs, but complex for blended PHEVs. For example, in a series design PHEV 20, the electricity is depleted in the first 20 miles, at which point the combustion engine comes on to charge the battery or power the wheels. In a blended design, the AER capacity is combined with the use of liquid fuels to produce an mpg boosted range. For example, in one possible blended control strategy, a blended PHEV 20 will blend its 20 miles of electricity with 20 miles of gasoline to produce 40 miles of boosted mpg in the charge-depleting mode.
This difference is important in the market as well as in terms of its impact on fuel use and emissions. A series PHEV 20 driven 20 miles each day and charged each night would hypothetically never use any gasoline. Depending on its control strategy, a blended PHEV 20 might use gasoline for 50 percent of its miles. However, if each is driven 40 miles each day, and

Resources for the Future McConnell and Turrentine
15
each is charged only once that day, a series PHEV 20 and blended PHEV 20 will use the same amount of gas and electricity. Therefore, a series vehicle seller will boast that its AER runs “gasoline-free 20 miles,” whereas a blended PHEV 20 seller will boast of high gasoline fuel economy for the first 40 miles. Of course, in reality, the distribution of miles driven varies greatly from day to day, from week to week, and from household to household. Therefore, the market has room for both types of designs.
ii. Links to Electric Power
In contrast to HEVs or BEVs, PHEV drivers have the choice to refuel with liquid fuels or electricity for much of their driving; the frequency and amount of electricity used is shaped by the relative prices of the two fuels, lifestyle, driving patterns, opportunities to recharge, and the AER or blended range of their vehicle. Therefore, compared to BEVs or HEVs, the benefits of PHEVs as a means to reduce CO2 emissions or the need for petroleum is dependent on the behavior of the driver and the particular technology they have chosen as well as the electricity source.
PHEVs make available a whole new refueling system for the consumer—the electric grid. BEVs will almost certainly demand medium (220-volt) and high (three-phase 220- and 440-volt) fast charging. However, PHEVs—at least small-battery PHEV 10s and 20s, given their dual fuel aspect—will not require high-power charging, and in most cases may work well with low-power, 110-volt outlets for charging. This makes the provision of charging infrastructure for small-battery PHEVs less of a challenge, and indeed opens many possible recharging locations for much lower cost at homes, businesses, campsites, parking garages, and shopping areas.
The recharging of PHEVs is a new load on the power company. As with any new load, this implies new demands on the power system, from the point of charging all the way to the generation of power and management of the grid. A good deal of uncertainty remains about how widespread use of PHEVs will interact with the grid (Hadley and Tsvetkova, 2008; Greenemeier, 2009). The most frequently imagined scenarios are as follows.
• PHEV and BEV users charge their vehicles at night when most power companies have excess capacity. Promoters of this scenario call this idea “filling the trough.” The advantage here for the user is not only that the vehicle is charged at night, when the vehicle is parked at home, but that nighttime electricity can be cheaper in some regions with low use of night time grid. The advantage for the power company is a new source of revenue at night, when demand is lower and electricity is cheaper to provide. This improves the use of power generation investments. From a societal standpoint, this is also

Resources for the Future McConnell and Turrentine
16
the best use of the system, as it makes the best use of existing infrastructure. However, there is one clear disadvantage in many areas of the country: nighttime power is generated from baseload sources and, in many areas, the base is from coal-fired electricity; such power generation tends to have high GHG emissions.
• Drivers may, instead, elect to plug in their vehicles during periods of high-energy use, thus straining the grid. This means, for example, that users might charge during the afternoons in hot climates, when household and commercial air conditioning is heavily used. If even a small number of PHEV or EV owners were to charge at these times, the increased load could be a problem. Although the cost of electricity is potentially the highest at these times, it may still be less than the future cost of gasoline, so consumers may be motivated to charge at these high-demand times, straining the electricity system.
Therefore, the provisioning of electricity to PHEV owners creates a number of risks and opportunities for power companies to improve their business case or, in the worst case, create an unwanted demand on the grid. Fortunately, in both cases, the deployment and development of the PHEV market will happen slowly, over decades rather than years. Thus, the provision of power and charging systems and the management of this new load will have time to evolve. In particular, the utility industrys moving toward what it calls the Smart Grid, a system in which load is managed through new information systems. The PHEV holds some potential to be a positive aspect of that new Smart Grid, as a flexible load that can be controlled.
D. Battery Costs
Battery costs are a central challenge to the widespread development and commercialization of BEVs and PHEVs, especially PHEVs with larger batteries, and BEVs that are larger vehicles or have significant range. Size is paramount, but chemistry, design, purpose, durability, shape, and the final cost also are important. We have noted earlier the design tradeoffs between batteries with higher power density and batteries with higher energy density. High power batteries are generally more expensive per kWh (a measure of energy capacity). This means that, for a given energy storage capacity, HEV power batteries cost more per capacity than BEV batteries. However, HEV batteries are generally small, 0.5–1.5 kWh, whereas BEV batteries are larger, with 15–40 kWh of capacity (National Renewable Energy Laboratory 2006.).
We discuss here primarily the cost of Li-ion batteries. Nickel metal hydride (NiMH) batteries, which have worked well for HEVs, will be replaced in the near future by Li-ion batteries, as they have throughout the portable consumer battery industry. Li-ion batteries for

Resources for the Future McConnell and Turrentine
17
HEVs are expected, in the next few years, to be cheaper, lighter, smaller, and more durable than current Li-ion batteries. Lithium is not an expensive metal compared to the metals used in other batteries, but might cost more in the future as demand increases. Some Li-ion batteries use expensive metals such as nickel, cobalt, manganese, or copper. Finally, some materials, designed specifically for automotive Li-ion batteries, can be more expensive to meet the standards of safety, durability, weight, and power density wanted in automotive applications. For example, nanomaterials, used in some new Li-ion batteries, improve the performance of batteries but add to the complexity, cost, and difficulty of manufacturing.
The wholesale price of batteries paid by vehicle makers is not public knowledge, but estimates are available. Generally, three components should be considered in estimating the price of a battery system: the price of the battery cell, the assembly of the pack, and the price of the accompanying electronics and cooling systems. Consumer Li-ion battery cells are currently around $200–$300 per kWh; automotive Li-ion batteries will cost more because of higher standards for abuse tolerance and longevity.
All of these technologies require significant increases in manufacturing investments and costs. For the Prius, Toyota had to develop an entirely new supply chain for parts. In particular, the battery required the formation of a whole new company—Panasonic EV—that would develop a reliable supply of NiMH batteries of specific and robust design, sufficient size, and of sufficient longevity to last the life of the vehicle. During the early years of the Prius, many analysts and rival automotive companies concluded that the Prius was not and could not be profitable. Honda’s design was thought to be simpler and less costly, especially as used in the Honda Civic Hybrid. That did not include the research and development (R&D) or the investment in manufacturing. All the true numbers are, of course, secrets of Toyota, which says it is committed to eventually changing all of its vehicles to hybrids.
Currently, the cost of batteries is the most important consideration in sizing the battery. Most manufacturers are considering AERs in the 10- to 40-mile size range.. Current estimates of battery pack costs are in the low thousands for PHEV 10s, ranging up to the high teens for PHEV 40s (NRC 2010). Despite considerable optimism about meeting performance and endurance goals for PHEV batteries, there is a good deal of uncertainty about how quickly battery costs will decline over the long term (NRC 2010, Nelson et al. 2009; Baker et al 2010). Currently Li-ion unit battery costs are quite high, and it is not clear how technology and market forces will converge to reduce costs in the future. This could be a particularly important issue for the larger PHEVs, such as the PHEV 40s that require large battery packs. In fact, some recent analytical papers conclude that short-range PHEVs with small batteries have a better chance in the market.

Resources for the Future McConnell and Turrentine
18
In the analysis of benefits and costs of different scenarios below, we address the issue of battery cost uncertainty by using two different sets of forecast battery and system costs.
E. The Problem of Import Dependence for Battery Materials
A number of risks associated with a large increase in the use of Li-ion batteries need to be considered. Cobalt is needed for some Li-ion ion batteries, and neodymium for motors, but sources of both are relatively scarce. Currently, the best sources for these inputs are located in countries that are relatively unstable politically. For example, raw cobalt comes primarily from copper mining in the Democratic Republic of the Congo and Zambia (Sandalow 2009, Chapter 6). It will be important to monitor both the economic and political conditions in the future as policies push toward new technologies and their widespread adoption. We need to be careful that we don’t trade one security problem for another.
F. Current and Past Policies for HEVs, PHEVs and BEVs
Current and future production and sales of HEVs, PHEVs, and BEVs are, and will continue to be, affected by a number of broad transportation policies, such as corporate average fuel economy (CAFE) regulation, local and federal air pollution control programs, and federal and state subsidy programs. New CAFE regulations authorized by the Obama administration in spring 2009, the first changes in the CAFE rules for fuel efficiency since the 1980s for cars, require significant improvements for each manufacturer in fleet fuel efficiency by 2016. These requirements are described and analyzed for their effects on the fleet and on hybrid vehicle penetration elsewhere in this study (Small 2010)). We examine in this report, in the policies section (Section V) below, the effect of subsidies of hybrid vehicles in the presence of strict fuel economy standards. A number of subsidy and loan policies have been implemented to date, and we review those here.
Tax credits to individuals for the purchase of advanced vehicles. Specific income tax credits were made available for HEVs as part of the Energy Policy Act of 2005 to individuals purchasing qualified light-duty HEVs placed in service after December 31, 2005. The credit ranges from $250 to $3,150, depending on the vehicle model. This credit begins to phase out after each manufacturer sells 60,000 light-duty HEVs. For the second and third quarters after the quarter in which the 60,000th vehicle is sold, 50 percent of the credit is available. For the fourth and fifth quarters, 25 percent of the credit is available. No credit is allowed after the fifth quarter. These HEV credits are set to expire in 2010. A heavy-duty HEV tax credit of up to $18,000 was

Resources for the Future McConnell and Turrentine
19
available for the purchase of vehicles weighing more than 8,500 pounds, gross vehicle weight rating (GVWR)7; this credit expired at the end of 2009.
The stimulus package passed in spring 2009 added a special income tax credit for PHEVs and BEVs. To qualify, a vehicle must draw propulsion from a traction battery that has at least 4 kWh of capacity, uses an external source of energy to recharge the battery, has a GVWR of up to 14,000 pounds, and meets specified emissions standards. The base amount of the PHEV or BEV credit is $2,500, plus another $417 for each kWh of battery capacity in excess of 4 kWh, with a maximum subsidy of $7,500 per vehicle with weight less than 10,000 GVWR. This maximum amount increases to $10,000 for vehicles weighing more than 10,000 pounds but not more than 14,000 GVWR. The subsidy will start to phase out after 200,000 vehicles have been produced by each manufacturer. The subsidy tax credit is authorized until the end of 2014 (U.S. House of Representatives 2009).
This tax credit offers a large incentive directed specifically to PHEVs and BEVs. The magnitude of the credit is much larger than the incentive was for HEVs (which is now expiring) and the number of vehicles eligible is also much larger. The PHEV and BEV technologies are more expensive, and the battery cost hurdle is high, as described in the battery section above. We analyze these different subsidies in more detail below.
Tax credits to manufacturers. The stimulus bill provides $1.7 billion in tax credits of up to 30 percent to manufacturers for advanced energy investments, including advanced vehicle production. Tax credits also are directed to businesses involved in infrastructure needs for PHEVs and EVs. For refueling operations, tax credits of $54 million are available and, for the deployment of plug-in infrastructure and vehicles, tax credits of $400 million are available.
Direct loan program for fuel-efficient vehicle development. As part of the Energy Independence and Security Act (EISA) of 2007, a direct loan package of up to $25 billion is available to manufacturers for the development and deployment of advanced technology vehicles and their components made in the United States. These grants and direct loans are not for R&D, but for the costs of reequipping, expanding, or establishing manufacturing facilities in the United States. These loans, though authorized by the earlier legislation, are only now starting to be given out. In June 2009, the first three were given to Ford, Nissan, and Tesla motors.
7 Standard pick-up trucks and vans weigh less than 8,500 pounds, so this credit is for large commercial trucks.

Resources for the Future McConnell and Turrentine
20
Loan guarantee program. The Energy Policy Act of 2005 established a $4 billion loan guarantee program designed to encourage the development and commercialization of innovative green technologies. Loan guarantees are available to selected economically viable projects, including those for advanced fuels and vehicles.
State subsidy programs. Many states have also put their own HEV, PHEV, and EV incentives and regulations in place. In California, the Alternative Fuel Vehicle Rebate Program has allocated $1.8 million to provide rebates of up to $5,000 to consumers who purchase or lease eligible zero-emissions vehicles and PHEVs between May 2007 and March 2009. In a number of states, low-emissions vehicles, such as HEVs, are exempt from the requirements of high-occupancy vehicle (HOV) lanes. In addition, some cities exempt advanced technology vehicles from parking fees, including at streetside parking meters.
In California, the Zero Emission Vehicle (ZEV) Production Requirement specifies that large vehicle manufacturers must produce and deliver for sale a minimum percentage of zero-emissions vehicles each model year, starting at 10 percent in 2005–2008 and increasing to 16 percent by 2018 (AFDC 2010). California announced the inclusion of PHEVs in Phase Three (2012–2014) of its ZEV Program. A new category was formulated—Enhanced Advanced Technology Partial Zero Emission Vehicles, also called Silver Plus. This category allows for some new flexibility in meeting the ZEV requirements in 2012, substituting a higher number of PHEVs for a substantial portion of ZEV vehicles. At least 11 other states, including New York, have adopted California’s program, so the number of vehicles required will be multiplied by these other states.
III. The National Energy Modeling System, Transportation, and Hybrid Vehicles
The National Energy Modeling System (NEMS) includes a model of the transportation sector that is fully integrated with the overall energy and economic components of the model. The model represents different vehicle sizes and types (car and truck), and a range of different fuel and advanced technologies. Technologies represented in the most recent version of the model include HEVs and PHEVs. EVs and fuel cell vehicles are included but with little detail on costs or emissions reductions. The transportation model includes two major actors: (a) manufacturers, which select technologies that are cost-effective or that are necessary to meet fuel economy standards and, therefore, determine the vehicle prices and fuel economy, and (b) consumers, who choose among vehicles based on their prices, fuel economy, and other features. Manufacturers determine vehicle technologies and their prices, and consumers determine the

Resources for the Future McConnell and Turrentine
21
share of vehicle types. Total vehicle sales are determined in the macroeconomic component of the model.
A. How NEMS Treats Hybrid Vehicles
• HEVs are treated as separate vehicles in the model. They are assumed to be full hybrids with 45 percent higher fuel economy than their conventional gasoline counterparts (vehicles vary by manufacturer and size—see below). For example, if a midsize American gasoline car gets 29 mpg, then the hybrid car of the same size would get 42 mpg.
• Two types of PHEVs are included in the recent versions of NEMS: PHEV 10s and PHEV 40s. PHEV fuel economy is assumed to be 60 percent and 90 percent better than that of the conventional gasoline counterparts for the PHEV 10s and PHEV 40s, respectively. For example, if a gasoline compact gets 30 mpg, then a compact PHEV 40 would get 57 mpg. The PHEVs are assumed to be driven 58 percent of the time on electricity and 42 percent of the time on gasoline. In gasoline mode, they get the same fuel efficiency as HEVs, and in electricity mode, they are assumed to get the equivalent of about 200 mpg.
• Major elements of the stimulus package passed by the Obama administration in spring 2009 are included in the model. For example, the subsidy for PHEV vehicles is included, so it is part of the baseline runs of NEMS below. However, the loan guarantee programs are not included in NEMS.
• As for conventional vehicles, NEMS includes 12 different size categories of hybrids, 6 for cars and 6 for trucks. For cars, the size categories include minicompact, subcompact, midsize, large, and two-seater. The size categories for trucks are small pickup, large pickup, small van, large van, small utility, and large utility. The size categories for the advanced technology vehicles, such as HEVs and PHEVs, are assumed to first enter the market on different dates, which are specified as inputs to the model. The specifications for the entry dates are shown in Table 2. Some of these are varied in the runs we present below. We assume in some cases that certain hybrids are introduced at earlier times.
• Choices about hybrid vehicles are included in the model in two ways.
On the manufacturers’ side: The costs of production and fuel economy of different vehicle types, including hybrids, are determined by manufacturer choices. Manufacturers are assumed in the model to consider fuel economy improvements only for the first three years of vehicle life, and to use a 15 percent discount rate. The manufacturers will keep

Resources for the Future McConnell and Turrentine
22
adding additional technologies to both conventional and hybrid vehicles until the fuel economy standards are met.
Under the strict new fuel economy standards that begin in 2011 and become more stringent through 2016 in the Obama CAFE case, and continue in later years to require even more fuel economy under the Pavley CAFE case, it is not economical for manufacturers to meet CAFE. To meet the standards, the model must push the manufacturers to adopt additional technologies by having them face a fee if they do not meet the standards. For most of the runs of the model described below, the manufacturers face a fee of $200/mpg. This means they will improve fuel economy to meet the standard as long as the cost is less than $200/mpg to do so; if the costs exceed $200/mpg, they can elect to pay the fee. It is important to note that if the CAFE standard is not met at this fee, nothing requires the sale of more hybrids, or allows for price changes that would result in more hybrid sales to meet the standard.
When fuel economy standards are met, and technologies that add to either fuel economy or performance are economical (the benefits exceed the costs), manufacturers will add them to vehicles over time.
On the consumer side: Consumers determine the types of vehicles sold. Vehicle choices are modeled using a logit equation, where vehicle choices are a function of income, vehicle prices, fuel prices, and other vehicle characteristics. A set of constants, used to reflect consumer preferences that are not otherwise accounted for in the equations, influence the number of hybrids actually chosen. In the baseline run of the model, the constants are set so that gasoline-electric hybrids, diesel–electric hybrids, and PHEV 10s are disadvantaged relative to conventional gasoline vehicles, and PHEV 40s have a strong positive coefficient relative to gasoline vehicles. These coefficients were initially set to accurately predict the expected penetration of these different vehicle types in the next few years. For example, without the strong positive coefficient on PHEV 40s, virtually none of these vehicles would be purchased. We discuss these assumptions and the assumptions we use for these terms in the section below. The logit equations that depict consumer behavior determine the share of each type of vehicle sold.
• NEMS assumes that the age distribution of the fleet remains constant over time. Therefore, the model does not reflect changes in emissions that would occur as a result of policies that would tend to make the average age of the fleet newer. This is a part of the model that we have not been able to change in the analysis of policies that follows.

Resources for the Future McConnell and Turrentine
23
• The electricity sector is separate from transportation in NEMS. The use of electricity for PHEVs or for BEVs is assumed not to require new capacity in the electricity sector. The amount of electricity used by the transportation sector and the effects on oil use and GHG emissions that result are included in the overall output of NEMS.
Table 2. NEMS Assumptions about Timing of Entry of Hybrid Vehicles by Size and Type
PHEV 10 PHEV 40 Gasoline–
electric hybrid
Diesel–electric hybrid
Cars Subcompact 2031 2031 2011 2023 Compact 2011 2011 1999 2011 Midsize 2015 2020 2005 2016 Large 2020 2015 2009 2019
Trucks Compact pickup 2031 2031 2012 2031 Standard pickup 2031 2031 2012 2031 Compact van 2017 2031 2010 2015 Compact SUV 2011 2031 2008 2020 Standard SUV 2022 2031 2005 2031
Source: From the Transportation Sector Module of NEMS (EIA 2008 input file, Advanced Technology Vehicles). Years in red indicate different assumptions about the year of introduction by the authors compared to the NEMS model assumptions.
IV. Alternative Policies for Hybrid Vehicles
To the extent that some security costs or global warming effects are not fully internalized by the transportation sector, policies that raise the cost of oil and other carbon-based fuels will be efficient. Polices such as an oil tax or fuel taxes on gasoline and diesel fuels have been discussed in another report thas part of this study (Small 2010). The focus here is primarily on hybrid and electric vehicles and whether policies should exclusively target them. Certainly, general oil or fuel taxes would affect the rate and timing of the penetration of hybrid vehicles into the market over time. They would allow the market to decide which fuel efficiency technologies and which vehicles will attain the goals of reducing oil dependence and GHG emissions. It is even possible that conventional ICEs would become so much more fuel efficient in coming years that they will provide much of the solution.
However, it is likely that the best policies to reduce oil use and to reduce CO2 from the transportation sector will actually be a combination of policies. It may make sense to use an oil

Resources for the Future McConnell and Turrentine
24
tax, if politically feasible, to reduce oil consumption by all users. But in addition, the private market may not be efficient with respect to the introduction of hybrid vehicles. This suggests that there might be some reasons to use specific policies toward hybrids or battery development. We discuss some of the possible reasons here.
A. Arguments for Separate Policies Targeting Hybrid Vehicles
1. Scale economies in the production of hybrid vehicles. There has long been evidence of the importance of scale economies in the automobile industry (for example, Friedlander et al. 1983; Truett and Truett 2003. Such scale economies probably exist for the production of the various types of hybrid vehicles. Because many of these vehicles are being produced for the first time, there are likely to be both pure scale economies and learning in the production process, which would also tend to lower costs over time.
2. Learning by doing. In addition, types of learning by doing may occur between early and late adopters, both on the consumption side and on the production side of the hybrid market. On the consumption side, hybrids are a new vehicle technology for which uncertainties remain about performance, maintenance, and costs compared to ICE vehicles. Early adopters will provide information for later adopters. This has been true for Toyota’s Prius—positive reviews from the owners of early models helped to increase sales over time. On the production side, each new hybrid model that comes to the market can provide information for other producers. Although the technologies are not shared directly, and are often kept secret, later adopters nevertheless are able to learn from early adopters. In fact, it is well known that as soon as Toyota’s Prius comes to market each year, each of the other vehicle manufacturers are among the first to purchase one—they take it apart to see what can be learned.
Policy implications of (1) and (2): Scale economies and spillovers suggest either direct loans to manufacturers for advanced technologies or subsidies for hybrid vehicles over a limited period. It is difficult to know the magnitude of the subsidy needed because cost information and new technologies of the auto companies are not publicly available.
3. Battery R&D. Battery costs are still very high, and breakthroughs in technology will be needed to reduce the costs of batteries. The private sector may not have the correct incentives if there are information externalities. The same may be true for the development of alternative technologies, such as fuel cell systems. The issue of the appropriate amount of R&D will be addressed in more detail in another part of this overall energy study.

Resources for the Future McConnell and Turrentine
25
In general, publicly funded R&D efforts, which make information about technology available and allow for new technologies to be transferred more quickly across manufacturers, might be effective.
4. Consumer behavior. If consumers do not fully account for fuel economy in making vehicle purchase decisions, as many have argued (Greene et al. 2009; Allcott and Wozny 2010), then one option is to subsidize more fuel-efficient vehicles—in this case, hybrid vehicles. The argument is that consumers may fail to take into account the full costs of fuel use over the life of the vehicle due to some type of market failure, such as incomplete information, or high discount rates.
5. Second best policy option. Finally, if fuel or oil use cannot be priced correctly for their external effects (GHG emissions and energy security issues) for political reasons, then a second-best alternative may be policies to encourage the penetration of more fuel-efficient vehicles. One approach is a feebate policy, in which vehicles that are efficient in energy use would receive a subsidy, and those that are inefficient would pay a tax (Greene et al. 2004). This policy is discussed in more detail in another part of this study (see Small 2010). An alternative addressed here is the subsidy component to the manufacturers.
Policies suggested by (4) and (5) would be primarily subsidies to either consumers or manufacturers for hybrid vehicles based on their fuel savings.
B. Subsidy Policies
There are a number of possible ways to offer subsidies for hybrid vehicles that are consistent with the reasons for policies directed toward hybrids as discussed above.
• Subsidies for battery development and hybrid system efficiencies—R&D subsidies.
• Subsidies to consumers for the vehicles they purchase.
o Subsidies can be based on the fuel economy (mpg); on the value of the vehicle; or on fuel intensity, measured as the gallons used per mile driven (gpm). The appropriate subsidy for reducing oil use and GHG emissions would be one that provides the most incentive to reduce gasoline use. Basing the subsidy on fuel intensity would provide the most direct incentive. In the analysis below, we use a fuel intensity subsidy compared to the fuel economy of a conventional vehicle.
o Vehicle subsidies can also vary by vehicle size class. A subsidy could be used to provide an incentive to purchase a smaller vehicle that is more fuel efficient.

Resources for the Future McConnell and Turrentine
26
Chandra et al. (2009) and Beresteanu and Li (2009) provide evidence that such subsidies do not result in much switching between vehicle classes.
o Vehicle subsidies can be offered to consumers in different ways. Many of the existing subsidies for HEV vehicles, as described below, have been in the form of a tax credit. An alternative is a rebate at the time of purchase. In an analysis of the two approaches, Beresteanu and Li (2009) find that a rebate at the time of purchase is likely to be more effective.
• Production subsidies to the manufacturers. This approach of subsidizing manufacturers for producing more fuel-efficient vehicles may be particularly effective when CAFE standards are in place and binding. Based on earlier runs of NEMS, it became clear that subsidizing hybrid vehicles when the CAFE standards are binding (and not subject to change) will have the effect of making the CAFE standards easier for manufacturers to meet, and will not result in much in the way of additional energy savings. If more hybrid vehicles are produced and sold in every time period, then all vehicles will have to do less to meet the standards in each period. A possible subsidy to manufacturers would be one that provides them with the incentive to reduce beyond the CAFE requirement. Such a policy adds a price incentive beyond the strict quantity requirement of CAFE.
C. Other Policies
Direct loans to manufacturers and loan guarantee programs. These policies will reduce the costs to manufacturers of building new production facilities for new technologies and deploying new technologies. In the case of hybrid vehicles, this could include the production of new types of vehicles or batteries. These loans may be effective in allowing firms that are new adopters of a technology to learn by doing, which may help lower future costs for all adopters. We do not model these policies using NEMS in the analysis below because the model does not include an endogenous production component. However, these types of programs may be quite important for the penetration of alternative vehicles. They should be designed, if possible, not to promote particular technologies, but to promote those technologies likely to be most cost-effective at achieving the goals of reducing oil dependence or GHG emissions, or both.
Policies to change social preferences. Policies that provide better information about energy efficiency or energy use have the potential to influence consumer behavior. For example, evidence suggests that consumers do not fully value fuel economy over the lifetime of the vehicle (Greene 1991; Greene et al. 2009; Dreyfus and Viscusi 1995; Allcott and Wozny 2009).

Resources for the Future McConnell and Turrentine
27
Understanding consumer value for fuel efficiency is important, as is evident from the cost savings data presented in Table 1. We do not model policies that might influence consumer perceptions or rates of discount with respect to energy savings here, but this will be an important area of research for the future.
Nonmonetary incentives. Many state, local, and private sector organizations are providing incentives to drivers to purchase alternative fuel-efficient vehicles. Some of the policies include the following.
• Some urban areas allow drivers of hybrid and electric vehicles access to HOV lanes, even with a single driver. A commuter might save as much as $1,500 per year.8
• In some areas, drivers of hybrid or electric vehicles have access to preferred parking spaces or free parking. Free parking could be worth more than to $3,000 per year.9
Potoglou and Kanaroglou (2007), in a stated choice study of new-vehicle purchases, find that consumers are sensitive to vehicle price subsidies, but that they do not respond to nonmonetary incentives such as parking and HOV lane privileges in decisions over vehicle choices.
Finally, some private sector companies are trying to provide incentives directly to their workers to reduce greenhouse gas emissions. There are some companies that currently give a monetary reward to each employee who purchases and drives an HEV; for example, Google offers a reward of $5,000
D. Evidence of the Effectiveness of Hybrid Policies
A number of studies have looked at evidence on the effects of subsidies for hybrid vehicles. A range of state and federal subsidies for hybrids have been offered, including sales tax rebates and income tax deductions, as described in Section II.f. above. The major subsidies that have been in place in the United States and Canada and a short summary of findings regarding their effects are shown in Table 3. Studies to date have used a variety of econometric approaches
8 In this example, HOV lane travel is assumed to reduce the average commute time by one half, or by 23 minutes (average round trip commute is 46 minutes in the U.S., according to a recent Gallup poll [2010]). The average after tax hourly wage in the U.S. is about $16 per hour. The number of commuting days is about 250 per year. 9 Parking fees vary by city, but are usually more than $12 a day. Assuming 250 days a year, parking costs would be $3,000 a year.
Resources for the Future McConnell and Turrentine
28
to try to isolate the effect of the subsidy on hybrid vehicle purchases relative to other vehicles. Most studies have found that the subsidies have increased the penetration of hybrid vehicles into the fleet. But they all find that the subsidy policies result in CO2 emissions reductions that are not cost-effective; for most, studies estimate that more than $150 is spent per ton of CO2 removed.
However, these studies do not allow for an examination of the general equilibrium effects of hybrid subsidies across the entire vehicle market, as NEMS does. We compare the results of prior analyses to our own estimates of the cost-effectiveness of hybrid subsidies using NEMS in the next section.
E. Policies Modeled in NEMS
The policies we review using the NEMS framework are the following: a. alternative assumptions about the costs of batteries and system costs; b. a subsidy of hybrid vehicles—a gpm subsidy for mileage over and above standard
gasoline fuel economy; c. a subsidy of hybrid vehicles combined with an accelerated CAFE standard; and d. a combination of policies that includes a., b., and a tax on gasoline.
The results of each of these will be shown in comparison to the Core 1 case.

Resources for the Future McConnell and Turrentine
29
Table 3. Subsidies and Their Effects for HEVs Time period Type of subsidy Size of subsidy Estimated effectsCanada—provincial subsidies of hybrid vehicles
2003–present Sales tax rebate for new hybrid vehicles; rebate based on value of vehicle
Max. rebate $1,000–$3,000; average rebate $500–$1,000
Chandra et al. (2009) found that, for each $1,000 of subsidy, sales of hybrids increase 28%; the shift is away from intermediate cars and SUVs. They also argue that many of the hybrid vehicles would have been bought even without the subsidy. The effect on fuel economy is low, so it has a high cost per ton CO2 compared to other policies.
U.S. federal government
2000, tax deduction; 2005–2015, converted to a full tax credit
Tax deduction; later changed to tax credit (not available to many high‐income households); allowed on the first 60,000 units sold, and then phases out
Initially $2,000 tax deduction; changed in 2006 to tax credit with the amount depending on fuel economy; varies from $3,150 (Prius) to $650 (Saturn Vue)
Beresteanu and Li (2009) found that the effect of the federal income tax credit was estimated to increase hybrid sales by 20% in 2006. This analysis finds that the income tax credit is not very cost‐effective, and that a flat rebate to consumers who purchase hybrids would be more cost‐effective.
State governments in the United States
2000–present Waiving of new‐vehicle sales taxes in some states; rebates at time of purchase; state income tax credits
Mean of income tax credit is $2,011; mean of sales tax exemption is $1,037
Gallagher and Muehlegger (2007) estimate that state tax incentives raised hybrid vehicle sales by 6% from 2000 to 2006.
F. Estimating the Costs of Hybrid Policies
The full costs of the policies targeting hybrid vehicles examined here will be estimated by determining the real resource costs of the program and then comparing those costs to the benefits, in terms of both GHG emissions reductions and oil use changes. The components of the costs for each policy can be positive or negative. For example, the subsidy policy for hybrid vehicles makes hybrids appear less costly to manufacturers and the public, though the real costs of producing the more fuel-efficient vehicles is higher than producing conventional vehicles.10
10 Subsidies could allow manufacturers to achieve scale economies in production. In this case, production costs will not necessarily rise and might actually decline. NEMS-RFF includes learning assumptions that will cause the costs of battery packs and hybrid systems to fall over time. This may coincide with scale as the numbers of vehicles produced increase over time, but the model does not explicitly include economies of scale in vehicle production for any of the hybrids.

Resources for the Future McConnell and Turrentine
30
However, the reduced fuel consumption that results from more fuel-efficient vehicles is considered a negative cost, or a savings. Each of our policies also results in important distributional effects among different groups. Perhaps most significant of these is the transfer of costs from the taxpayer to consumers who purchase hybrid vehicles under the hybrid subsidy. The transfer, in this case, is likely to be quite large, and occurs in each year of the assessment period. It is likely to be an important determinant of the political feasibility of the program. We identify the magnitude of such transfers, and the parties that are affected.
The costs of the subsidy policy will have the following components:
The change in the costs of producing vehicles. We analyze both the conventional vehicle market and the hybrid vehicle markets (there are really several hybrid vehicle markets, including HEVs, PHEVs, and BEVs, but we illustrate them here with one market). When hybrid vehicles are subsidized, it actually becomes easier to meet the CAFE requirements. More hybrid vehicles are produced and sold, which makes the CAFE standards less binding in each period.11 As shown in Figures 4 and 5, the costs fall in both the conventional vehicle market, and the hybrid market, to PCAFE + subsidy from PCAFE. Cost reductions are shown as A + B in the conventional vehicle market, and C + D in the hybrid vehicle market. We include both of these cost savings in our analysis of policies.
11 One reviewer pointed out that if the CAFE standards become easier to meet, they must be made more stringent. The standards must be set to a level that is economically feasible. The argument is that if it becomes easier to meet CAFE, then it would be feasible to meet a tighter standard. In our analysis below, the CAFE standards are established over the entire policy period until 2030, and then they do not change.

Resources for the Future McConnell and Turrentine
31
Figure 4. Conventional ICE Vehicles Market
Price
q conventional vehicles
PCAFE
p0
q CAFE q0
Δ cost of CAFE w/o sub
Demand
Supply
BA
q CAFÉ + sub
PCAFE+ subsidy
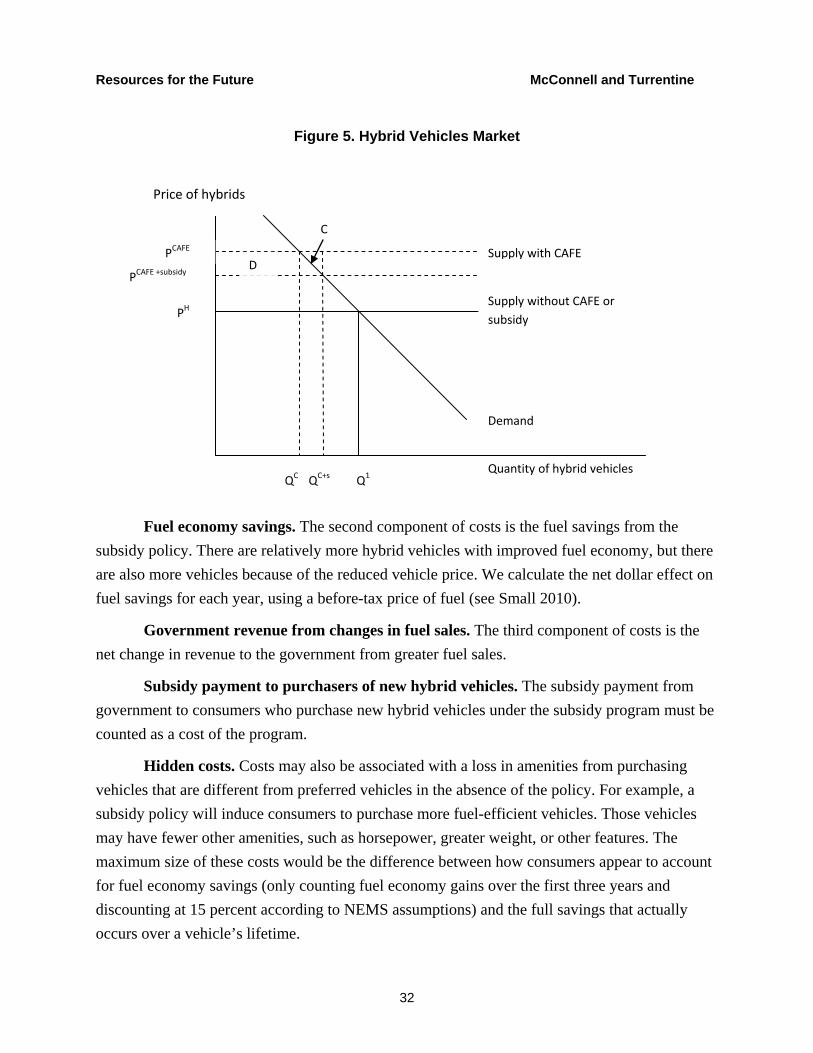
Resources for the Future McConnell and Turrentine
32
Figure 5. Hybrid Vehicles Market
Quantity of hybrid vehicles
Price of hybrids
Supply without CAFE or subsidy
PCAFE
PCAFE +subsidy
PH
Demand
Q1QC QC+s
D
C
Supply with CAFE
Fuel economy savings. The second component of costs is the fuel savings from the subsidy policy. There are relatively more hybrid vehicles with improved fuel economy, but there are also more vehicles because of the reduced vehicle price. We calculate the net dollar effect on fuel savings for each year, using a before-tax price of fuel (see Small 2010).
Government revenue from changes in fuel sales. The third component of costs is the net change in revenue to the government from greater fuel sales.
Subsidy payment to purchasers of new hybrid vehicles. The subsidy payment from government to consumers who purchase new hybrid vehicles under the subsidy program must be counted as a cost of the program.
Hidden costs. Costs may also be associated with a loss in amenities from purchasing vehicles that are different from preferred vehicles in the absence of the policy. For example, a subsidy policy will induce consumers to purchase more fuel-efficient vehicles. Those vehicles may have fewer other amenities, such as horsepower, greater weight, or other features. The maximum size of these costs would be the difference between how consumers appear to account for fuel economy savings (only counting fuel economy gains over the first three years and discounting at 15 percent according to NEMS assumptions) and the full savings that actually occurs over a vehicle’s lifetime.

Resources for the Future McConnell and Turrentine
33
The final cost is the effect of the policy on external costs and benefits. The policy may have an effect of externalities that already exist, such as fewer traffic accidents from reduced VMT.
V. Changes in NEMS Assumptions for Policy Analysis
The base case for the policy analysis here will be the “Core 1” assumptions of NEMS. This version does not include any economywide carbon policy, such as a cap-and-trade program or a carbon tax. But it does assume an increasing price of oil over the 20-year period of the analysis due to market forces. This is in contrast to the earlier scenario, which assumed that energy prices remain relatively low over the entire period: this is the so-called Core 3 policy. The Core 1 baseline assumes that gasoline prices will rise moderately over the period to 2030, to about $3.80/gallon (in 2007$).
Also included under our Core 1 baseline case are the provisions of the 2009 stimulus package, including subsidies for PHEVs and the Obama administration’s acceleration of the CAFE standards to meet the EISA goal of 35.5 mpg for new cars by 2016. Energy use under the Core 1 baseline declines slightly through 2020 because of the stricter fuel economy standards, but then increases again by 2030 as the fuel economy requirements on new vehicles level out and remain at 35.5 mpg for new cars, and VMT continue to increase with higher income.
A. Subsidy Policies
The major policy we examine is a subsidy on hybrid vehicles. Hybrids can be subsidized in a range of possible ways. Here we choose to examine a subsidy policy that is effectively a direct subsidy to consumers on the purchase of a hybrid vehicle. The subsidy is not a flat dollar amount, as is the case for many of the past and current federal subsidies for hybrid vehicles (see Section II.f above). Instead, we design the subsidy to give the greatest incentive to reduce gasoline use by making the subsidy a function of the improvement in the fuel efficiency of the hybrid over a conventional gasoline vehicle. Several important features of the subsidy as applied in NEMS are worth highlighting.
• The subsidy received by the consumer is determined by the gpm saved over the conventional gas vehicle. We use fuel intensity rather than fuel efficiency improvement because basing the subsidy on fuel intensity provides a better direct incentive to save fuel, which is the goal of the policy. A subsidy based on mpg improvement would give a larger subsidy to smaller cars compared to larger cars for each gallon saved.

Resources for the Future McConnell and Turrentine
34
• The amount of the subsidy we use here is $300/gallon saved per 1,000 miles (or $300,000/gpm saved). The subsidy amount is assumed to remain constant over time, so it will fall in real terms relative to the price of vehicles. This allows the subsidy to decline over time as the costs of hybrid vehicle systems and batteries decline as a result of expected learning and technological advances.
• The subsidy, in terms of dollars per gpm improvement over conventional gasoline vehicles, is the same for each vehicle, but the relative improvement over gasoline vehicles is by the relevant size class—subcompact, compact, midsize, or large. For example, a consumer who buys a midsize hybrid vehicle would get a subsidy based on the gpm saved from driving the hybrid compared to driving a conventional midsize. The subsidy varies by size class in part because we want to provide incentives for drivers of larger vehicles to purchase more fuel-efficient vehicles. This approach is also consistent with assumptions in NEMS because the model assumes very little substitution between vehicle size classes So, even if we were to have a subsidy relative to some fixed fuel intensity for all vehicles, and smaller vehicles got much larger subsidies, it is not clear that we would see much substitution away from large vehicles. A further reason to use size classes for the subsidy is that the coming CAFE standards that are included in the baseline runs of NEMS are set by the footprint, or size, of the vehicle.
• The subsidy is a direct reduction in price to the consumer. In NEMS, the vehicle choices that consumers make are determined using a nested logit framework. The shares of vehicles of different types depends on a number of variables, including the vehicle price, fuel price, luggage space, acceleration, maintenance, and the availability of makes and models. The subsidy affects only the vehicle price, but a number of other parameters differ between gasoline and hybrid vehicles, so the model tends not to be as sensitive to price variation as one might expect. We discuss this more in the next section of the report.
Figure 6 below shows an example of the subsidy to car buyers for the year 2015 for different sizes and types of vehicles. The assumed improvements in fuel economy for hybrid vehicles in NEMS were described above in Section III. For example, the fuel economy of a gasoline–electric hybrid (full hybrid) is 45 percent greater than that of a standard gasoline vehicle in any time period, and the PHEV 10’s fuel economy is 60 percent greater than that of the gasoline vehicle. The left-most bars of the figure show the subsidy amount to consumers for a full gasoline–electric hybrid by size category. The subsidies for the PHEV 10 and PHEV 40 are

Resources for the Future McConnell and Turrentine
35
shown only for two vehicle types because only those types are available in 2015 (see Table 2 for assumptions regarding when hybrids of different sizes will enter the market under NEMS).
The fuel savings for the hybrid vehicles are shown in the right half of Figure 6. These are the fuel savings to consumers that would result from purchasing the hybrid vehicles instead of a standard gasoline vehicle of similar size. The fuel savings were calculated as NEMS calculates them on the basis of a three-year payback and a 15 percent discount rate (EIA 2008. The total benefit to the consumer for the purchase of a hybrid, compared to a conventional vehicle, can be thought of as the sum of the subsidy plus the fuel savings. If the sum is greater than the difference in price, then it would make economic sense for the consumer to purchase the hybrid, other things being equal. In NEMS, the subsidy on hybrids increases the probability that a consumer would purchase a hybrid over a conventional vehicle.
The likelihood that consumers will purchase more hybrids depends critically on the differences in prices of the different types of vehicles without the subsidies. For example, Figure 6 shows that the midsize PHEV 40 would get a subsidy plus fuel economy gain over a conventional midsize vehicle of more than $5,000. However, the price differential in 2015 between the midsize conventional vehicle and the midsize PHEV 40 in NEMS, with its assumptions about the cost of the battery and other costs of the PHEV 40, is more than $10,000. This is why we see in the results below that very few PHEV 40s are purchased, even with these sizable subsidies. And, because there is so much uncertainty about future battery and system costs, especially for PHEV vehicles, we explore alternative cost assumptions next.

Resources for the Future McConnell and Turrentine
36
Figure 6. Subsidy and Fuel Savings by Vehicle Type, 2015
B. Alternative Cost Assumptions for Batteries and System Costs
A good deal of evidence suggests that both the battery costs and system costs for producing all types of hybrid vehicles are rapidly changing. The discussion in Section II above about the range of cost forecasts provides a basis for examining the cost assumptions in NEMS for hybrid vehicles. The 2009 NEMS includes separate parameters for the cost of batteries in dollars per kWh and for system costs of hybrid vehicles. The battery costs and system costs are additional costs for vehicles of a given size class and manufacturer that are added to the costs of a base conventional gasoline vehicle in that size class. Both the battery costs and the system costs are different for gasoline hybrids and the two types of PHEVs—PHEV 10 and PHEV 40—and the size of the battery packs needed will vary by size class.
The costs specified in NEMS for hybrid vehicle battery and system costs are shown in Figures 7 and 8. As discussed in Section II above, two types of batteries are used in hybrid vehicles today, NiMH and Li-ion. NEMS assumes in the baseline Core 1 case that the NiMH

Resources for the Future McConnell and Turrentine
37
batteries are used exclusively in full HEVs, and that Li-ion will be used in all PHEVs. The cost assumptions in NEMS for battery pack costs in terms of dollars per kWh are shown in Figure 7 as the two top lines.12 The Li-ion is assumed to be available at a pack cost of about $1,500/kWh in 2010, falling over time to about $600/kWh in 2030. For a PHEV 10, a battery with 4 kWh is required, for a total battery cost in 2010 of $6,000, down to $2,400 in 2030. For a PHEV 40 such as the volt, at least a 14-kWh battery will be required. On the other hand, the NiMH, which is currently used in the Toyota Prius, is assumed to be available at a cost of about $650/kWh today and will fall slightly to $500/kWh by 2030. HEVs of the future will most likely require between 0.5- and 1.5-kWh batteries, so we assume here a 1-kWh battery for these vehicles in the analysis.
In addition to battery costs, it also costs more to combine the different system elements in a hybrid vehicle compared to a conventional vehicle. The additional system costs for hybrids are shown in Figure 8. The costs assumed in NEMS are shown as HEV, PHEV 10, and PHEV 40 in the figure.
Some evidence suggests that battery costs are falling, especially for Li-ion batteries, although a great deal of uncertainty remains, making forecasting costs difficult. As an alternative to the assumptions in NEMS, we have reviewed the literature and developed a set of assumptions about battery costs that takes an extremely optimistic view of cost reductions in the near future. These estimates are based on a review of the literature, and on discussions with experts, but represent the low end of the cost estimate spectrum. The alternative assumptions reflect the view that costs for Li-ion batteries will be much lower very soon, about $600/kWh, and will fall to about $250 by 2030 (shown as the optimistic assumption or “Li-ion optimistic” in Figure 7. See Axsen et al. 2008; Nelson et al. 2009; Anderman 20010. Also, we assume that all vehicles will use Li-ion batteries by 2020, as NiMH batteries are phased out.
12 The costs shown are for battery packs. Battery sizes will vary by type of vehicle and by size class. In addition, NEMS-RFF modelers are aware that the cost per kWh will vary depending on the power output required and storage requirements, but the current version of the model does not include this level of detail in battery type and cost.

Resources for the Future McConnell and Turrentine
38
Figure 7. Battery Cost Assumptions—NEMS and Optimistic Cost Assumptions for Lithium-Ion, 2009$
In Figure 8, we show alternative assumptions about system costs, also drawn from the evidence. We assume that they are the same as the NEMS assumptions in 2010 but that they decline more quickly over time, with the expected greater penetration into the fleet associated with lower battery costs. These more optimistic assumptions are shown as HEV optimistic, PHEV 40 optimistic, and PHEV 10 optimistic in the figure.
Figure 8. System Cost Assumptions for HEVs and PHEVs—NEMS and Optimistic Cases
$0
$500
$1,000
$1,500
$2,000
$2,500
$3,000
$3,500
2010
2012
2014
2016
2018
2020
2022
2024
2026
2028
2030
HEVsPHEV10sPHEV40sHEVs optimisticPHEV10s optimisticPHEV40s optimistic

Resources for the Future McConnell and Turrentine
39
C. Combinations of Policies
To push the model to produce greater reductions in gasoline use, we also combine a number of policies.
1. We combine the subsidy as described above with a CAFE policy that becomes more binding over time. This stricter CAFE policy, referred to as Pavley CAFE,13 includes much stricter standards to be met during the period from 2016 to 2030. These fuel economy requirements are patterned after those passed in California that would require fuel economy to increase every year after 2016. The specifics of the Pavley CAFE modeled here are increases in fuel economy each year of 3.7 percent from 2016 to 2020 and 2.5 percent from 2021 to 2030. We combine this more strict CAFE policy with the hybrid subsidy in the analysis below.
2. We also combine the subsidy for hybrid vehicles with the optimistic assumptions about battery and system costs for hybrids. In this run, we also make conditions more favorable for the purchase of fuel-efficient vehicles by including a high gasoline tax—a tax that rises over time to $3.36/gallon (2007$). This tax is described in detail in Small (2010; see above). In addition, we assume that public and private vehicle fleets have the same incentives to convert to hybrids as the overall fleet.14
VI. Results of the NEMS Runs
We first describe the results of runs of the model in which we incorporate the subsidies on hybrid vehicles. We compare the base case to various other cases that include the subsidy. We then examine the optimistic battery and system cost assumptions. Finally, we present the results of combined policies.
13 This CAFE policy is described in more detail in another paper in this series titled “Energy Policies for Automobile Transportation: A Comparison Using the National Energy Modeling System,” by Kenneth Small (2010). The policy through 2020 is known in California as “Pavley 2”, named for the author of the legislation underlying the California standards. The Pavley rule in California is not strictly a fuel economy standard but is a GHG standard. The standards specified here for Core 1 CAFE and Pavley CAFE are in terms of average mpg of gasoline, or fuel economy standards. 14 The baseline version of NEMS-RFF assumes that the fleets, which make up about 10 percent of the overall number of vehicles produced each year, remain as conventional vehicles. We also made some assumptions about the logit equation constants to better reflect the larger penetration of hybrids into the market.

Resources for the Future McConnell and Turrentine
40
A. Results of the Hybrid Subsidy Runs
The model is run for several different hybrid subsidy cases. First, we apply the subsidy to Core 1, which includes the CAFE requirements that the new car fleet meet 35 mpg by 2016 and remain at that level through the remainder of the period to 2030. We then apply the subsidy to the stricter Pavley CAFE (see combined policy 1 in Section V.c. above).
We find in both cases that the subsidy increases the number of hybrid vehicles significantly but has little other effect, including on overall energy use. The subsidy has the effect of just making it easier for manufacturers to meet the CAFE standard over time. This is because, as soon as the subsidy is available, more consumers will choose hybrid vehicles, improving the fuel economy of all the manufacturers’ fleets. The manufacturers will have to do less in every period to meet the standards. Even conventional gasoline vehicles do not have to do as much to improve fuel economy as they would have to without the hybrid subsidy.
Figure 9 illustrates these results. New-car fuel economy over time is shown under the Core 1 and Pavley CAFE cases, with and without the subsidy. It is clear that the subsidy has very little effect on fuel economy over time in either case. New-car fuel economy is determined by CAFE because the CAFE standards are binding over this period. The subsidies will have an effect on the types of vehicles sold, but not on overall fuel efficiency.
Figure 9. New-Car Fuel Economy

Resources for the Future McConnell and Turrentine
41
Effect of Subsidies on Hybrid Sales and the Share of Hybrids in the Fleet
The subsidy for hybrid vehicles does increase the number and share of gasoline hybrids in the fleet, despite the finding above that overall energy use does not change much. Figure 10 shows the increase in the number of hybrid vehicles over time under different CAFE and subsidy assumptions. It is clear from the figure that more hybrid-electric vehicles are sold with the subsidy program than without it in all time periods under both CAFE standards. Actually, with the subsidy, more hybrid vehicles are sold under the Core 1 CAFE case than the stricter Pavley CAFE in the later years. This is a function of the way NEMS handles compliance with the CAFE standards, as discussed earlier in this study. When the CAFE standards are not met, the manufacturers keep trying to meet them by adding additional fuel economy–improving technologies to conventional vehicles. They have no ability to sell more hybrid vehicles by adjusting prices to consumers. The number of hybrid vehicles is determined on the consumer side. In the case of the Pavley requirements, the manufacturers keep improving the conventional vehicles. By late in the period, the conventional vehicles have fuel economy that is close to that of the hybrid vehicles and the subsidy is very small.
Figure 10. Sales of All Electric Hybrids with and without Hybrid Subsidies over Time

Resources for the Future McConnell and Turrentine
42
Figure 11 shows that sales of all types of hybrids—HEVs, PHEV 10s, and PHEV 40s—increase as shares of new-car sales by 2030 as a result of the subsidies, as expected. Under Core 1 CAFE with no subsidy, HEVs are 25 percent of the fleet, and with the subsidy they increase to 33 percent. PHEVs go from 2 percent with no subsidy to 3 percent with the subsidy in 2030. Under Pavley CAFE, the subsidy also results in an increase in all types of hybrid vehicles, but the effects are smaller than in the Core1 subsidy case.
Figure 11. Shares of Vehicles, by Vehicle Type in 2030
0
0.1
0.2
0.3
0.4
0.5
0.6
Core 1 CAFE Core 1 CAFE w/subsidy
Pavley CAFE Pavley CAFE w/subsidy
Conventional gasoline HEV PHEV 10 and PHEV 40
Despite the fact that hybrids penetrate the fleet to a greater extent under the subsidy policies, these policies have very little effect on overall energy use. This is mostly because the subsidies make it easier for the manufacturers to meet the CAFE requirements, as we discussed above. Fuel economy is very slightly lower for both conventional and hybrid vehicles, as shown in Figure 12. Manufacturers don’t need to add as much additional technology to improve fuel economy.

Resources for the Future McConnell and Turrentine
43
Figure 12. Fuel Economy of Different Types of Vehicles, with and without the Subsidy
0
10
20
30
40
50
60
70
2020 2030 2020 2030 2020 2030 2020 2030
Core1 CAFE Core1 CAFE with subsidy
Pavley CAFE Pavley CAFE with subsidy
mpg
Conventional gasoline HEV
Figure 13 shows the price differences between conventional vehicles and gasoline–hybrid vehicles. First, it is evident that this price difference tends to decline over time in all cases. One reason is that the value of the subsidy is in nominal terms, and so declines over time in real terms with inflation. The other is that, although the hybrids start out 45 percent more fuel efficient than the conventional vehicle counterpart, the array of fuel economy–improving technologies is greater for the conventional vehicles.
In both subsidy cases shown in Figure 13, the price differential is still positive—even with the subsidy, hybrids have a higher price than the conventional vehicles. But the difference is quite small, $700 or less in all periods. Consumers respond to the lower relative prices of hybrids, and we do see increased penetration of hybrids into the fleet under the subsidy.

Resources for the Future McConnell and Turrentine
44
Figure 13. Price Differences between Conventional and Gasoline–Electric Hybrid Vehicles (2007$)
0
500
1000
1500
2000
2500
2020 2030 2020 2030 2020 2030 2020 2030
Core1 CAFE Core1 CAFE with subsidy
Pavley CAFE Pavley CAFE with subsidy
Pric
e di
ffere
nce
Compact
Midsize
Large
Table 4 provides more detail about these cases. The prices of all vehicles decline very slightly with the subsidies because less is required in terms of fuel efficiency. And, as expected with lower vehicle prices, VMT is very slightly higher by 2030 with the subsidies. The table also shows that fuel economy improves slightly for the new-car fleet overall under the subsidies, even though, as we showed above, all of the vehicle types have slightly lower fuel economy. This is because of the changed mix of vehicles under the subsidy policies. There are relatively more of the fuel-efficient hybrid vehicles in the mix in both of the subsidy cases.
In total, it is clear from Table 4 that the net effect of the subsidies is to very slightly reduce energy consumption from light-duty vehicles. Total energy use from light-duty vehicles was 16.18 quadrillion British thermal units (Btus) in the Core 1 case without the subsidy and 16.11 with it in 2030. Under the stricter Pavley CAFE standard, the story is similar. Overall, energy use declines slightly with the subsidy, from 14.86 to 14.78 quadrillion Btus. However, it is important to note that total petroleum used in the United States actually increases slightly under the Core 1 CAFE subsidy case, as we show in the key metrics, Table 8.

Resources for the Future McConnell and Turrentine
45
In general, the subsidy policies for hybrid vehicles appear to have very little effect on overall energy use, CO2 emissions, and oil use. This is primarily because CAFE requirements dominate manufacturers’ decisions over fuel economy and hybrid vehicles make it easier to meet CAFE. However, it is likely that meeting either of the CAFE standards modeled here will be quite difficult. In fact, the Pavley standard cannot be met with the technologies currently specified in NEMS.
The subsidies will make it much more possible for manufacturers to meet CAFE. NEMS pushes the manufacturers to meet CAFE by building in a fee that is specified in dollars per mpg. The manufacturer must keep trying new technologies as long as their cost is below this fee. The fee is currently set at $200/mpg in the model (though the manufacturers do not actually pay a fine). Under the Core 1 CAFE case, about 60 percent of vehicles cannot meet the standards at the fee of $200/mpg in 2016, but after 2016 when the standard flatlines, hardly any of the vehicles cannot meet it at this cost. With the subsidy, only 36 percent of vehicles cannot attain the standard at this cost in 2015, and then none of the vehicles fails to meet it after 2016. Under Pavley CAFE, many vehicles cannot meet the standard at the $200/mpg cost, and by 2030, none can meet the standard at this cost.
These results are summarized in Figure 14. The subsidy reduces the number of vehicles that must pay the fine in the early years under both subsidy policies. Under the Core CAFE, no vehicles fail after about 2017, but in the Pavley CAFE case, by 2025 the subsidy makes almost no difference in the number of vehicles that cannot meet the standard. This is because the conventional vehicles are pushed to become so fuel efficient that there is little difference between the hybrid and conventional vehicles. The standard is not met by 2030 for any of the vehicles under Pavley, even with the subsidy in place. The results of different runs on the number of vehicles that fail over time are shown in Figure 14.
Hybrid Subsidy with Late Start
A major issue with the hybrid subsidy added to either the Core 1 CAFE or to the Pavley CAFE, as described above, is that it has little effect on emissions or oil use because the CAFE limits dominate manufacturer decisions with respect to fuel economy. As an alternative, we introduce the hybrid subsidy with the Core 1 CAFE in place, but have it begin when the CAFE requirement is less binding, after 2016. In 2015 under the Core 1 CAFE, 60 percent of vehicles do not meet the standards even at the $200/mpg cost. By 2017, no vehicles had to pay fines. We introduce the hybrid subsidy in 2017 to the Core 1 CAFE case to determine if the effect of a

Resources for the Future McConnell and Turrentine
46
hybrid subsidy will be greater on emissions reductions when CAFE is less binding. We would expect that when CAFE is less binding, the effects of the subsidy would be larger.
Figure 14. Number of Vehicles Failing CAFE, in Thousands
Note: Vehicles of a given class and manufacturer are considered to be failing if they cannot comply with the standard after spending $200/mpg on additional technology to meet the standard.
Table 4 shows the results of the late-start subsidy Starting the subsidy later allow it to have a greater effect on the fuel economy of the fleet by 2020 through 2030, though the effect is small. By 2030, new-vehicle fuel economy is 40.8 mpg on average with the late-start subsidy, whereas it is 39.3 mpg with the subsidy that starts in 2010. In addition, energy used by light-duty vehicles is slightly lower under the late-start subsidy, 15.78 quadrillion Btus instead of 16.11 quads under the normal-start subsidy. Under the delayed subsidy, the “backsliding” of fuel efficiency for conventional vehicles that we saw with the previous subsidies does not occur. However, the size of the effects on energy use are relatively small. This assessment of the late-start subsidy is not meant to suggest that subsidies should be delayed; rather, it simply shows that the effects of the subsidy are likely to be greater when CAFE standards are less binding.

Resources for the Future McConnell and Turrentine
47
Table 4. Effects of Subsidies for Hybrid Vehicles on the Light-Duty Fleet
Core 1 CAFE Core 1 CAFE, w/ subsidy
Core 1 CAFE, w/ late-
start subsidy
Pavley CAFE
Pavley CAFE w/ subsidy 2020 2025 2030 2020 2025 2030 2020 2025 2030 2020 2025 2030 2020 2025 2030 Light-duty vehicles Energy use (quadrillion Btus) 15.53 15.68 16.18 15.55 15.64 16.11 15.46 15.36 15.78 15.31 14.92 14.86 15.38 14.92 14.78 VMT (billions) 3,147 3,503 3,859 3,149 3,507 3,872 3,161 3,521 3,911 3,150 3,522 3,945 3,152 3,526 3,948 New light-duty vehicles fuel economy 37.2 38.1 38.8 37.7 38.6 39.3 39.2 40.4 40.8 40.2 44.0 46.2 40.5 44.4 46.7
New car (mpg) 41.4 42.2 42.8 41.7 42.4 43.1 43.2 44.5 44.8 45.1 48.6 50.9 45.8 49.4 51.5 New light truck (mpg) 32.1 33.1 33.7 32.7 33.6 34.1 34.4 35.5 35.7 34.7 38.7 40.7 34.5 38.8 41.2 Light-duty vehicle stock (mpg) 25.2 27.9 29.8 25.4 28.1 30.1 25.6 28.8 31.2 25.6 29.5 33.1 25.7 29.6 33.4 Sales shares by vehicle type Conventional gasoline 58% 55% 52% 50% 48% 46% 49% 48% 46% 57% 54% 51% 51% 49% 48% Conventional diesel 5% 8% 10% 4% 7% 8% 4% 7% 8% 5% 7% 9% 4% 6% 8% Ethanol flex-fuel 13% 12% 11% 10% 9% 9% 10% 10% 10% 13% 12% 11% 10% 10% 10% Gasoline–electric hybrid 23% 24% 25% 34% 33% 33% 34% 33% 32% 24% 25% 26% 33% 31% 30% PHEV 1% 1% 2% 2% 3% 3% 2% 2% 3% 1% 2% 2% 2% 3% 4% Miscellaneous 0% 0% 0% 0% 0% 0% 0% 0% 0% 0% 0% 0% 0% 0% 0% % Cars 60% 62% 62% 61% 62% 63% 60% 60% 61% 59% 59% 59% 60% 60% 59% % Trucks 40% 38% 38% 39% 38% 37% 40% 40% 39% 41% 41% 41% 40% 40% 41%

Resources for the Future McConnell and Turrentine
48
Costs of Hybrid Subsidies
Tables 5 and 6 show estimates of the costs of the various subsidy policies. Table 5 shows annual cost estimates in 2007$ in the year in which they occur. We include the changes in production costs of the new vehicles in the year they are produced and the fuel economy changes for the fleet in the year those fuel costs occur. Table 6 shows the present discounted value (PDV) of the stream of costs of each policy, discounted to 2007$.
In Table 5, we include the components of costs, as described in Section IV above. These include the change in vehicle production costs as a result of the policy and changes in consumer surplus due to the greater number of vehicles sold. These costs are negative for the first subsidy policy (on Core 1 CAFE) because the subsidy itself makes the hybrid vehicles less expensive and because the conventional vehicles no longer have to be as efficient because more hybrids are now in the fleet. Under the late-start subsidy, vehicle costs are lower in 2020, but as more fuel-efficient vehicles are produced over time, the costs of conventional vehicles rise and overall vehicle costs are greater than under Core 1 CAFE. For example, vehicle costs are $6.8 billion dollars greater in 2025 for both conventional and hybrid vehicles under the late-start subsidy compared to the Core 1 case with no subsidy. For Pavley CAFE, vehicle costs are quite a bit higher throughout the period compared to Core 1 because of the difficulty of meeting the stricter standard. The costs are slightly lower than they are with no subsidy (the no-subsidy Pavley CAFE results are shown in Small 2010).
The second line in Table 5 shows the dollar value of the overall fuel savings as a result of the policy compared to the Core 1 CAFE policy. The first subsidy policy shows only a small improvement in fuel economy throughout the period because the fuel economy of the fleet is essentially determined by the CAFE requirement. When the subsidy is delayed until 2017 when CAFE is less binding, the fuel savings are much greater in later time periods. Under Pavley CAFE, which is much stricter than Core 1, the fuel savings are quite large, especially in the later periods when much of the fleet is affected by the strict standards. The fuel savings reach $50 billion by 2030.
Government revenue from fuel taxes will also change as a result of changes in fuel use, as shown in the third column. Several things affect this. VMT may increase as a result of the policy, but the fuel economy of the fleet may also change. The net effect on fuel tax revenues is shown in the table. It is a small share of the costs in all three scenarios. Further, the government expenditure on the hybrid subsidy itself, a transfer from government to hybrid vehicle buyers, must be added back in to account for the full costs of the policy. This amount is shown for select

Resources for the Future McConnell and Turrentine
49
years in the fourth row of the table. The subsidy amount is determined by the difference in fuel intensity between the conventional and hybrid vehicles for vehicles of similar size, and the number of hybrids sold. The former amount will be influenced by how much both the conventional and hybrid vehicles are pushed to achieve higher fuel economy as a result of the policy.
The sum of the first four rows is our lower estimate of overall costs. A higher estimate of costs takes into account the “hidden costs” of the policy. As described in Section IV above, improvements in fuel economy may result in the loss of other vehicle attributes, such as horsepower and torque. If we assume that consumers are not myopic15 and that they are properly accounting for fuel costs but are also giving up other features, then we can get an estimate of the value of what is being given up. If consumers are only accounting for about 38 percent of the full fuel costs, then the other 72 percent must be considered hidden costs, assuming that consumers are fully rational. These estimates of hidden costs are shown in the table for each policy, and our higher estimate of costs includes these costs. The final costs reported in Table 8 is the average of these two cost estimates. In all cases, the hidden costs are a relatively large part of the total upper cost estimate.
We also report, in the last row of Table 5, an estimate of the externalities from the additional driving that results from the policy. We include an estimate of the external costs aside from GHG emissions, including the costs of congestion, air pollution, and accidents from additional miles traveled. These costs, which are taken from Small (2010) and Parry and Small (2005), total 11.1 cents/mile in 2010 (2007$) and are assumed to grow at 1.1 percent annually.
15 Recall that NEMS-RFF does assume that consumers are myopic about fuel costs—it accounts for only three years of fuel savings and discounts those savings at a high rate

Resources for the Future McConnell and Turrentine
50
Table 5. Costs of Subsidy Policies Compared to Core 1 CAFE (Billions of 2007$)
Core 1 CAFE w/ subsidy
Core 1 CAFE w/ late
subsidy
Pavley CAFE with
subsidy 2020 2025 2030 2020 2025 2030 2020 2025 2030 Change in new vehicle costs as a result of subsidy
–8.0
–7.7
–7.5
–2.7
6.8
12.5
7.7
27.0
40.0
Fuel cost savings from more fuel-efficient vehicles
–2.4
–4.0
–5.1
–6.0
–14.3
–20.5
–7.1
–25.1
–49.5
Tax revenue changes from changes in VMT
0.01
0.03
0.01
0.14
0.14
0.26
0.05
0.18
0.48
Total subsidy payment for hybrid vehicles
11.7
10.6
10.0
12.4
11.3
10.7
9.9
7.2
5.5
Total cost (lower estimate) 1.4 –1.1 –2.7 3.8 3.9 3.0 10.6 9.2 -3.6 Costs of forgone attributes of vehicles with less fuel economy: hidden costs
1.8
3.15
4.02
4.8
11.3
16.1
5.7
20.0
39.1
Total cost (upper estimate) 3.3 2.1 1.4 8.6 15.4 19.1 16.3 29.2 35.5 Average of lower and upper estimates 2.4 0.5 –0.7 6.2 9.6 11.1
13.4 19.2 19.6
Estimate of externalities from changes in VMT
0.28 0.58 0.15 0.59 3.04 10.7 1.8 2.45 5.59
Table 6 shows the PDV of the costs by category of costs for the three policies. Without accounting for any hidden costs of the subsidy policies that shift the fleet toward more fuel-efficient vehicles, all three programs show negative costs, or savings, from the policies. This is because NEMS assumes that consumers are myopic and do not account for the full value of fuel savings. Therefore, the base, or Core 1, case does not have a fuel-efficient fleet. The subsidy policies push toward that more efficient fleet. However, if there are costs in terms of features that are given up when consumers purchase the more fuel-efficient vehicles, then the upper estimate of costs that includes the estimate of hidden costs may be closer to the true costs. Importantly, the assumptions about the presence and size of the hidden performance costs has a significant effect on the cost estimates in Table 8.

Resources for the Future McConnell and Turrentine
51
Table 6. PDV of Costs for Different Policies (Billions of 2007$) Core 1 w/
subsidy Core 1 w/
late subsidy Pavley
CAFE w/ subsidy
Additional cost of more fuel-efficient vehicles sold –56.5 15.2 93.6 Fuel cost savings from more fuel-efficient vehicles –31.45 –103.6 –213.7 Tax revenue changes from changes in VMT 0.24 1.44 1.95 Total subsidy payment for hybrid vehicles 85.2 67.8 68.5 Total cost (lower estimate) –2.54 –19.2 –49.7 Costs of forgone benefits of vehicles with less fuel economy: hidden costs
25.0
82.13
169.4
Total cost (upper estimate) 22.5 62.9 119.7 Average of lower and upper estimates 10.0
21.9 35.0
Notes: All estimates are discounted to 2007, using a 5 percent interest rate. Costs include any costs that occur after the policy ends in 2030, up to 2045. For example, fuel economy benefits of the policy extend beyond 2030.
We discuss costs further below, in the section summarizing the key metrics for all of the cases. Cost-effectiveness estimates, on both an annual and a PDV basis, are shown in Table 8.
B. Results of the Optimistic Battery Costs and Combination Policies
Optimistic Battery Case
We next examine the results for the assumptions about battery costs that are more optimistic than those assumed under the NEMS baseline. The optimistic assumptions about technology changes that will lead to much lower battery costs for Li-ion batteries and lower system costs for hybrid vehicle production were outlined in Section V above. These alternative costs were used in runs of NEMS and compared to the Core 1 results. Again, the assumptions about the coefficients in the consumer vehicle demand equations remain unchanged from their baseline levels. In particular, NEMS assumes that consumers have a strong preference for PHEV 40s relative to other vehicles.16 This does tend to have a strong effect on the large increase in PHEV shares that we observe in some of the results in this section.
16 These high positive coefficients for PHEV 40s are necessary in the model to ensure that any PHEV 40s are sold under the existing NEMS-RFF cost assumptions.

Resources for the Future McConnell and Turrentine
52
First, in Figure 15, we show the distribution of vehicle types for three years, 2010, 2020, and 2030 for the Core 1 case. As described above, very few PHEV 10s and PHEV 40s are produced and sold, even with the positive preference coefficient for PHEV 40s. Gasoline–electric hybrid vehicles do make up a relatively large share of the fleet by 2030. The fourth and fifth bars in Figure 15 show how sales shares are different from Core 1 in both 2020 and in 2030 under the more optimistic cost assumptions. Gasoline–electric hybrid shares do not change very much by 2030, but shares of both PHEV 10s and PHEV 40s increase a good deal, with PHEV 40 shares increasing the most. The PHEV 40 share is 7 percent by 2020 and it increases to 12 percent of new-car sales by 2030. PHEV 10 shares increase to 4 percent by the end of the period. The PHEV 40s are most strongly affected because of their large battery size (14 kWh), and the presumably significant decline in cost per kWh of Li-ion batteries in the optimistic case. The sales shares of standard gasoline vehicles decrease from 58 percent to 49 percent in 2020, and from 52 percent to 41 percent by 2030 in the optimistic cost case compared to Core 1.
Figure 15. Sales Shares by Vehicle Type under Different Assumptions and Policies
0
0.1
0.2
0.3
0.4
0.5
0.6
0.7
0.8
0.9
1
2010 2020 2030 2020 2030 2020 2030
Core 1 Optimistic battery costs
Optimistic battery costs, subsidies and
high tax
Conventional gasoline Gasoline-electric hybrid PHEV 10 PHEV 40
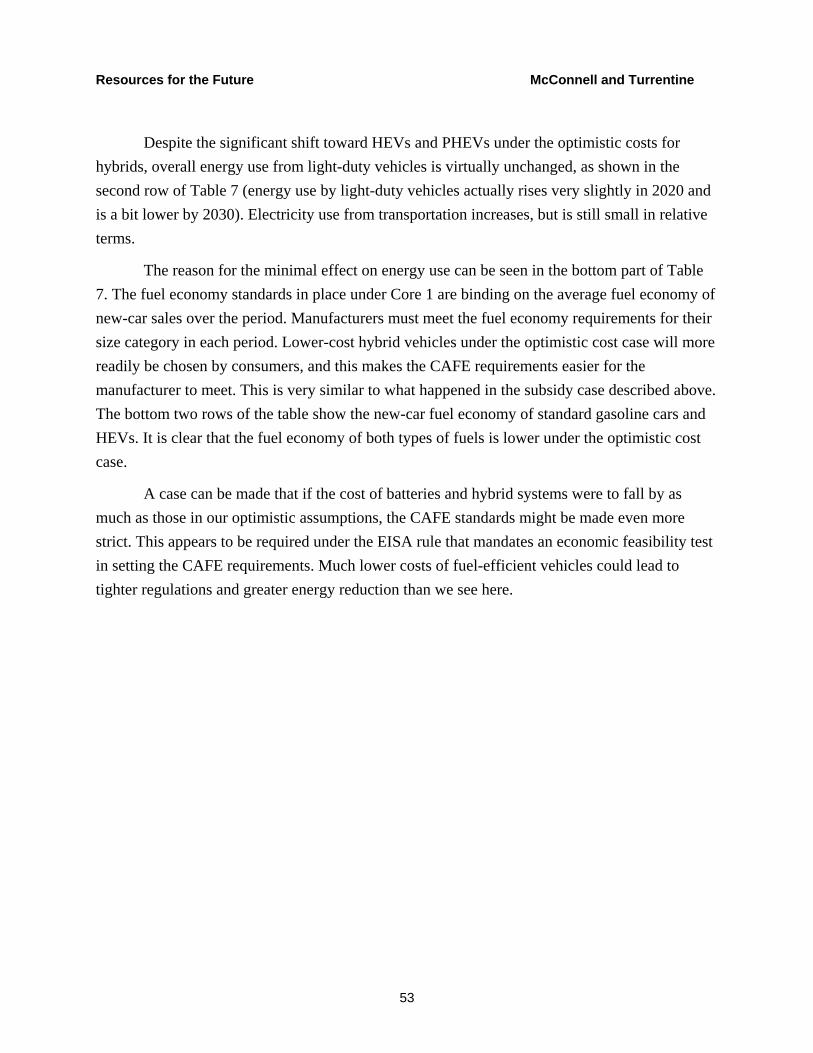
Resources for the Future McConnell and Turrentine
53
Despite the significant shift toward HEVs and PHEVs under the optimistic costs for hybrids, overall energy use from light-duty vehicles is virtually unchanged, as shown in the second row of Table 7 (energy use by light-duty vehicles actually rises very slightly in 2020 and is a bit lower by 2030). Electricity use from transportation increases, but is still small in relative terms.
The reason for the minimal effect on energy use can be seen in the bottom part of Table 7. The fuel economy standards in place under Core 1 are binding on the average fuel economy of new-car sales over the period. Manufacturers must meet the fuel economy requirements for their size category in each period. Lower-cost hybrid vehicles under the optimistic cost case will more readily be chosen by consumers, and this makes the CAFE requirements easier for the manufacturer to meet. This is very similar to what happened in the subsidy case described above. The bottom two rows of the table show the new-car fuel economy of standard gasoline cars and HEVs. It is clear that the fuel economy of both types of fuels is lower under the optimistic cost case.
A case can be made that if the cost of batteries and hybrid systems were to fall by as much as those in our optimistic assumptions, the CAFE standards might be made even more strict. This appears to be required under the EISA rule that mandates an economic feasibility test in setting the CAFE requirements. Much lower costs of fuel-efficient vehicles could lead to tighter regulations and greater energy reduction than we see here.
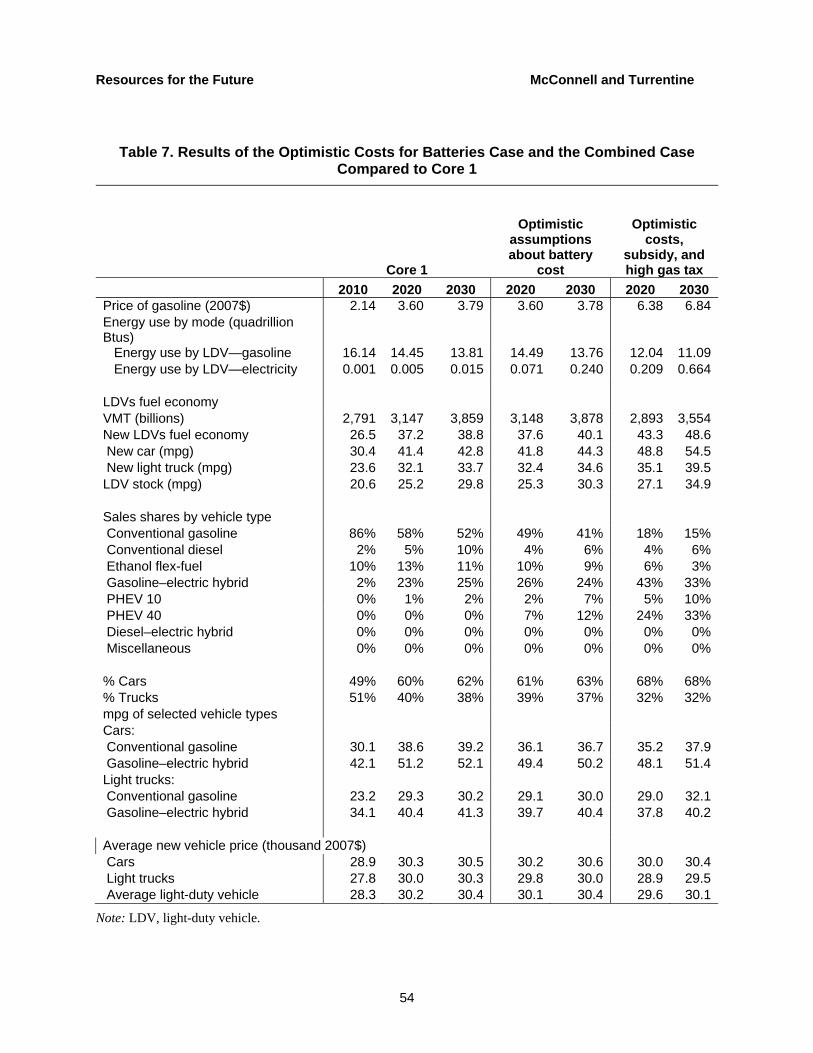
Resources for the Future McConnell and Turrentine
54
Table 7. Results of the Optimistic Costs for Batteries Case and the Combined Case Compared to Core 1
Core 1
Optimistic assumptions about battery
cost
Optimistic
costs, subsidy, and high gas tax
2010 2020 2030 2020 2030 2020 2030 Price of gasoline (2007$) 2.14 3.60 3.79 3.60 3.78 6.38 6.84Energy use by mode (quadrillion Btus)
Energy use by LDV—gasoline 16.14 14.45 13.81 14.49 13.76 12.04 11.09 Energy use by LDV—electricity 0.001 0.005 0.015 0.071 0.240 0.209 0.664
LDVs fuel economy VMT (billions) 2,791 3,147 3,859 3,148 3,878 2,893 3,554New LDVs fuel economy 26.5 37.2 38.8 37.6 40.1 43.3 48.6 New car (mpg) 30.4 41.4 42.8 41.8 44.3 48.8 54.5 New light truck (mpg) 23.6 32.1 33.7 32.4 34.6 35.1 39.5LDV stock (mpg) 20.6 25.2 29.8 25.3 30.3 27.1 34.9
Sales shares by vehicle type Conventional gasoline 86% 58% 52% 49% 41% 18% 15% Conventional diesel 2% 5% 10% 4% 6% 4% 6% Ethanol flex-fuel 10% 13% 11% 10% 9% 6% 3% Gasoline–electric hybrid 2% 23% 25% 26% 24% 43% 33% PHEV 10 0% 1% 2% 2% 7% 5% 10% PHEV 40 0% 0% 0% 7% 12% 24% 33% Diesel–electric hybrid 0% 0% 0% 0% 0% 0% 0% Miscellaneous 0% 0% 0% 0% 0% 0% 0%
% Cars 49% 60% 62% 61% 63% 68% 68%% Trucks 51% 40% 38% 39% 37% 32% 32%mpg of selected vehicle types Cars: Conventional gasoline 30.1 38.6 39.2 36.1 36.7 35.2 37.9 Gasoline–electric hybrid 42.1 51.2 52.1 49.4 50.2 48.1 51.4Light trucks: Conventional gasoline 23.2 29.3 30.2 29.1 30.0 29.0 32.1 Gasoline–electric hybrid 34.1 40.4 41.3 39.7 40.4 37.8 40.2
Average new vehicle price (thousand 2007$) Cars 28.9 30.3 30.5 30.2 30.6 30.0 30.4 Light trucks 27.8 30.0 30.3 29.8 30.0 28.9 29.5 Average light-duty vehicle 28.3 30.2 30.4 30.1 30.4 29.6 30.1
Note: LDV, light-duty vehicle.

Resources for the Future McConnell and Turrentine
55
C. Combination Policy Results
The results of the combination policy run are also shown in Figure 15 and Table 7. This is a combination of the optimistic battery costs and hybrid system cost assumptions, the hybrid subsidy, and a high gasoline tax. The tax rate is described in Small (2010), but it starts at $3.00/gallon in 2010 and increases in real terms to $3.36 by 2030. The results of the previous analyses were disappointing in terms of the energy and oil use reductions they predicted. This combination was designed to explore policies that do yield larger energy reductions.
We do see big effects in a number of markets. HEVs and PHEVs make up about three-quarters of the new car fleet by 2030. HEVs and PHEV 40s each have about a third of the share of new-vehicle sales. VMT are down because of the high tax, and there is a significant shift to cars and away from trucks, with trucks in 2030 at only 32 percent of the fleet. Fuel economy of the fleet is still less than under Core 1, however. Much of the energy reductions may be a result of the assumption about higher gasoline prices.
Energy use from gasoline is down, from close to 14 quadrillion Btus in 2030 in the Core 1 case to 11 quads in the combination case. Energy use from electricity is up significantly, but overall there is a net reduction in energy use.
D. Summary of Costs and Cost-Effectiveness
Table 8 summarizes all of the results of the runs described above, including CO2 emissions reductions, petroleum use, and costs. The top part of the table shows the annual values of the variables in 2007$. The bottom two parts of the table show estimates of costs and benefits over the life of the policy, discounted to 2007. All costs in this table are the average of the lower and upper estimates from Tables 5 and 6.
We first discuss the top part of the table, the annual estimates of costs and benefits in terms of petroleum use and CO2 emissions. Real gross domestic product (GDP) is not affected by any of the policies except for the combination policy that includes a high tax on gasoline, optimistic battery costs, and the hybrid subsidy. In that case, GDP is slightly lower, mostly because of the effect of the tax on gasoline. The annual costs are highest for the Pavley CAFE policy, as would be expected because of its strict requirements for fuel economy, especially toward the later years of the analysis. Note that we do not show costs of the optimistic battery cost case and the combined case (last column) because it is difficult to compare these cases to the base Core 1 case. The underlying costs have changed, so it is not possible to examine just the cost of the policy, such as the subsidy. In addition, these final two cases were meant to explore
Resources for the Future McConnell and Turrentine
56
the effects of some more extreme assumptions on the model and on fleet composition and the resulting effects on petroleum use and CO2 emissions.
The hybrid subsidy on the Core 1 CAFE produces very slight changes in both petroleum use and in CO2 emissions. We display only two years of results in Table 8, 2020 and 2030, but a review of all years for this subsidy case shows very small effects—sometimes increases in oil use and CO2 and sometimes decreases. For the years shown in the first part of Table 8, 2020 and 2030, petroleum use rises slightly, as do CO2 emissions levels under this hybrid subsidy. This is because the subsidy lowers the price of vehicles and VMT actually rise slightly. Costs of the policy in 2020 are $2.4 billion, and a modest increase in oil use and in CO2 emissions occurs. In 2030, the costs are very slightly negative. This is because the fuel economy benefits outweigh the slightly higher costs of the more efficient vehicle fleet. In this year, there are still no emissions benefits, but the subsidy policy may actually reduce overall costs to society.
The delayed subsidy results in some reduction in both petroleum use and CO2 emissions in both 2020 and 2030, but the effects are small. The overall costs are larger than with no delay because the subsidy begins after the Core 1 CAFE requirements level off and cause manufacturers to meet the standard in later years with a different mix of vehicles. The subsidy does not permit the same amount of backsliding that occurs on the conventional vehicles in the early years of the Core 1 subsidy policy. The cost-effectiveness of the late-start subsidy is relatively high, but falls in the later years because the fuel economy benefits are larger when so many vehicles in the fleet are affected by the policy.
The Pavley CAFE policy with the subsidy has the greatest effect on petroleum use and CO2 emissions of the first three subsidy policies, as expected. This CAFE policy is quite strict in its fuel economy requirements, especially in later years. Also, as expected, the total costs per year are higher. The annual estimates of cost-effectiveness are lower than for the other subsidy policies, especially in the later years.
The bottom part of the table shows the PDV estimates of the costs of the three subsidy policies and the total effects of the policies in terms of petroleum and CO2 reductions (not discounted). The costs in 8b include the PDV of the annual costs of the policies through 2030, and 8c also accounts for any costs that occur after 2030, such as the fuel costs savings of the with-policy fleet that continue until about 2045. These bottom sections of the table show that the cost-effectiveness can be quite low for these policies when overall benefits and costs are taken into account. The Core 1 CAFE with subsidy results show that, overall, petroleum uses rise
Resources for the Future McConnell and Turrentine
57
slightly and CO2 falls very slightly. The effects are just not large, and the policy does not appear cost-effective, at $600/ton for CO2.
For the other policies, the costs per ton of CO2 reduction and for petroleum reductions are relatively low. They are about $45/ton CO2 for the late-start subsidy and $25/ton CO2 for the hybrid subsidy with Pavley CAFE. In terms of petroleum reduction, the late-start subsidy is $20/barrel and the subsidy with Pavley is $10/barrel. However, the Pavley CAFE with subsidy estimate should also be compared to the Pavley CAFE cost-effectiveness without the subsidy (see Small 2010). When we compare these two, we find that the subsidy does little to make the Pavley CAFE policy more cost-effective.
We can summarize the points from Table 8 as follows.
• The effects of all of the policies examined here on petroleum use and CO2 emissions are relatively small. This is because the CAFE requirements effectively dominate the fuel efficiency from the fleet, and the subsidy policies and even the lower costs of batteries tend to primarily alter the mix of vehicles sold. The larger effects on petroleum use and CO2 emissions that we do see in Table 8 for Pavley CAFE, for example, come primarily from the stricter CAFE requirements themselves and not from the subsidy. The same can be said for the combination case, where the benefits come primarily from the higher gas tax that affects VMT.
• Although the effects on oil use and CO2 emissions are small, they may be relatively cost-effective compared to other policy options (see Krupnick et al. 2010).

Resources for the Future McConnell and Turrentine
58
Table 8a. Key Metrics, Oil Consumption GHG Emissions, Policy Costs and Cost-Effectiveness
Subsidy on hybrid vehicles
Subsidy on hybrid vehicles, late start
Subsidy on hybrid vehicles with Pavley CAFE
Optimistic assum. about battery costs
Optimistic cost
assum., high tax, and
hybrid subsidy
Subsidy on hybrid vehicles
Subsidy on hybrid vehicles, late start
Subsidy on hybrid vehicles with Pavley CAFE
Optimistic assum. about battery costs
Optimistic cost
assum., high tax, and
hybrid subsidy
Key metrics Real GDP, $ bill ion (2000 $) $11,524 $15,400 $15,399 $15,399 $15,396 $15,399 $15,358 $19,867 $19,871 $19,866 $19,865 $19,871 $20,171 Total welfare cost of policy, $ bil l ion
n/a n/a $2.40 $6.25 $13.39 n/a n/a n/a ‐$0.70 $11.07 $19.56 n/a n/a
Net imports (mmbpd) 10.00 9.33 9.36 9.31 9.23 9.33 8.01 8.16 8.15 7.98 7.59 8.17 6.87
Total petroleum (mmbpd) 15.52 17.84 17.87 17.81 17.74 17.83 16.33 17.96 17.98 17.79 17.28 17.98 16.44Total energy‐related CO2 emissions (mmt) 5,991 5,883 5,888 5,879 5,876 5,885 5,641 6,186 6,191 6,160 6,087 6,173 5,943Total GHG emissions (mmt) 7,282 7,385 7,391 7,382 7,378 7,388 7,139 7,939 7,943 7,914 7,840 7,927 7,698
Average welfare cost of reducing petroleum $/barrel n/a n/a ‐$192 $665 $383 n/a n/a n/a $98 $178 $79 n/a n/a Average welfare cost of reducing CO2, $/ton n/a n/a ‐$447 $1,730 $1,853 n/a n/a n/a $189 $432 $197 n/a n/a
Core 12007
2020
Policy runs
2030
Policy runs
Core 1
Notes: mmbpd, million barrels per day; mmt, million metrics tons.

Resources for the Future McConnell and Turrentine
59
Table 8b. Present Discounted Value of Cost and Cost Effectiveness to 2030
Policy runs (against Core 1 Baseline) costs and
benefits counted only up to 2030
Discount rate Subsidy on
hybrid vehicles
Subsidy on hybrid vehicles, late start
Subsidy on hybrid vehicles
with Pavley CAFE
PDV welfare costs (billion $) 5% $15.00 $43 $87 Total petroleum reductions
(million barrels) –34 588 1,694 Total CO2 reductions (million
metric tons) 25 290 667 PDV cost‐effectiveness
(petroleum reductions, $/barrel) ($441.18) $73.89 $51.36 PDV cost‐effectiveness (CO2
reductions, $/ton) $600 $150 $130
Table 8c. Key Metrics, Present Discounted Value of Cost and Cost Effectiveness to 2045 (Policy ends in 2030)
Policy runs (against Core 1 Baseline) costs and benefits counted through 2045, policy stops in
2030
Discount rate Subsidy on
hybrid vehicles
Subsidy on hybrid vehicles, late start
Subsidy on hybrid vehicles
with Pavley CAFE
PDV welfare costs (billion $) 5% $10.00 $22 $35 Total petroleum reductions
(million barrels) –8.85 1,099 3,585 Total CO2 reductions (million
metric tons) 11 493 1,388 PDV cost‐effectiveness
(petroleum reductions, $/barrel) –$1,130 $20 $10 PDV cost‐effectiveness
(reductions in CO2 emissions, $/ton) $909 $45 $25

Resources for the Future McConnell and Turrentine
60
Comparison to Other Studies
It is important to put the results shown above in the context of other studies of subsidies for hybrid vehicles. In Table 9 we show the results of other analyses of hybrid subsidies from the literature. Many factors can affect the comparability of our results with results from these studies. In particular, these studies examine different policies affecting hybrid vehicles. And some studies have assessed the costs and effects of changes to the fleet without an explicit policy. The studies that examine subsidy policies have assessed other types of subsidies. Other issues that make it difficult to compare across studies include the length of time assumed for the life of the policy and the approach to measuring costs.
Table 9. Cost-Effectiveness Estimates in Terms of CO2 Reduction from Hybrid Policies, Comparison to Other Studies
Study Description of case Cost‐effectiveness
estimate Other assumptions Lutsey and Sperling (2009)
38% reduction in new‐vehicle tailpipe emissions; 50% of fleet is HEVs by 2025
Average cost‐effectiveness is $42/tonne CO2e (2008$); the range of estimates was $–48 to $90/tonne CO2
7% discount rate; includes emissions reductions over lifetime of vehicle
Kinsey & Company (2007, 45)
24% HEV penetration of new car fleet by 2030
$100–$140/ton CO2e(2005$)
7% discount rate; fuel savings over the life of the vehicle
Kammen et al. (2009)
Subsidize HEVs so they break even (vehicle price just offsets fuel economy over lifetime); by individual vehicle type
$100–$420/ ton CO2e(2006$)
16% discount rate; vehicle life is 12 years
Cheah et al. (2007, 30)
Cost of full gasoline–electric hybrid vehicle (cost difference over that of a 2006 conventional vehicle); not accounting for fuel economy benefits
$70/ton CO2e(2007$)
No discount rate; payback with no discounting said to be five years
Morrow et al. (2010)
Tax credits granted for diesels or hybrid vehicles equal to $3–5 per gallon saved over the vehicle’s lifetime; credit is therefore $3,000 to $8,000 per vehicle
$195/ton CO2e (2007$)
Costs are measured as reduction in GDP that results from the policy; costs and emissions reduction assessed over 2010–2030
Chandra et al. (2009)
$93–$247/ton
Beresteanu and Li (2009)
U.S. federal income tax credit for the purchase of a hybrid vehicle
$177/ton
Notes: CO2e, CO2 equivalents.

Resources for the Future McConnell and Turrentine
61
VII. Discussion and Conclusions
The hybrid vehicle policies examined here are influenced very strongly by the CAFE policy that is in place. The CAFE requirements appear to dominate the fuel economy of the fleet, and the hybrid policies mostly affect the distribution of conventional and hybrid vehicles in the fleet.. It would be instructive to be able to run NEMS with a hybrid subsidy against a baseline run with no CAFE requirements to determine the potential for subsidy policies as an alternative to other policies, including CAFE. However, we were not able to run NEMS without the Core 1 CAFE.
The effect of the subsidy policies is to reduce the costs to manufacturers of complying with the CAFE standards; they appear to do so with little or no net costs to society (see costs results in Section VI above). Reducing the costs to manufacturers of meeting CAFE may be important for attaining the CAFE standards, especially for standards as strict as the Pavley CAFE standards. The auto manufacturers were in favor of the earlier Alternative Motor Fuels Act of 1988 because it gave them flexibility in meeting CAFE, allowing them to have lower fuel economy on conventional vehicles (see Liu and Helfand 2009). And evidence suggests that meeting the new CAFE standards will mean major changes in the way technology improvements will be incorporated into vehicle features. Bandivadekar et al. (2008) argue that, to achieve the reductions required by Pavley CAFE by 2030, roughly two-thirds of the efficiency improvements must be used to reduce fuel consumption and therefore would not be available for performance improvements. In addition, weight would have to be reduced by 20 percent and advanced power trains would have to be roughly 80 percent of the market. This is consistent with the NEMS results for Pavley CAFE, and it clearly represents a very great departure from past practice—one that will be difficult to achieve.
Subsidies or other policies, such as feebates or taxes, may be important to pair with CAFE to achieve the reductions intended by CAFE. Without additional policies with CAFE, manufacturers may be left to comply with CAFE by pricing vehicles in ways that induce consumers to purchase vehicles such that, as a fleet, manufacturers meet the standards. According to the results from NEMS, it may be costly to comply with even the more modest

Resources for the Future McConnell and Turrentine
62
Core 1 CAFE standards—more than 60 percent of vehicles cannot meet the standards in 2015 even after spending up to $200 beyond what is economically efficient.17
We have also considered the kinds of subsidies or economic incentive policies that might yield greater reductions in petroleum use and CO2 emissions than those resulting from the CAFE requirements. Policies that reward manufacturers for achieving even better fuel economy than required by CAFE may be a promising approach. A subsidy could be offered to each manufacturer to improve fuel economy even further, once the standards are met. This policy combines the regulatory certainty of CAFE with a price incentive to go beyond CAFE. A feebate instead of a subsidy combined with CAFE offers another promising set of policies. A feebate combines a subsidy for fuel-efficient vehicles, with fuel economy greater than some specified level, with a tax on vehicles that have a fuel economy lower than that level. In fact, a bill before Congress combines such a feebate with the projected new CAFE rules (our Core 1 case). Such feebate policies will provide incentives for manufacturers to go beyond CAFE, and feebates can be self-financing, unlike a straight subsidy. (For more discussion of feebates under the NEMS model, see Small 2010.)
The subsidy policy we examine here was designed to provide incentives for hybrid vehicle production. However, we urge caution about any policy that attempts to pick winners. It is as yet unclear whether it is conventional vehicles, gasoline–electric hybrids, PHEVs, or BEVs that will achieve the greatest improvements in performance and fuel economy in the coming years. Some automotive engineers and policy analysts think that conventional vehicles are likely to see significant improvements in the next few years and that a majority of the fleet will have combined conventional and hybrid technology by the 2025–2030 time frame.18 In fact, to the extent that hybrid technology improves, vehicles may become significantly more fuel efficient without a loss of other vehicle attributes, such as torque and horsepower. In this case, the costs of policies we examined here would actually be lower than our estimates showed because there would be little to give up in the way of performance or safety with hybrid vehicles.
17 Estimates of the past costs of complying with the earlier CAFE standards are much lower. Anderson and Sallee (2009) estimate the costs to be less than $30 per mpg, less than both the current $55/mpg fine, and much less than the NEMS-RFF $200/mpg fine. 18 For example, John German of the International Council on Clean Transportation. Telephone conversation, December 10, 2009.

Resources for the Future McConnell and Turrentine
63
Although it is important to design policies that allow the market to pick the most efficient way to reduce oil use and emissions, rather than policies that attempt to pick winners, barriers may prevent the most efficient outcomes for some technologies. For example, there may be insufficient incentives for R&D or economies of scale in production. These issues may be the most significant for the radically different vehicle types, such as PHEVs and BEVs. We discuss these issues in the report, and many others that arise with respect to bringing these vehicles to market. However, NEMS does not allow for explicit treatment, for example, of policies that introduce loan guarantees for building new capacity, infrastructure investment policies, or R&D policies. Even differential policies on gasoline–electric hybrids and on PHEVs were difficult for us to analyze in NEMS.
Here we highlight additional issues with using NEMS for analyses of hybrid vehicle policies. Future work using NEMS for such policy analyses will need to consider these.
• Manufacturers are not able to completely optimize in their vehicle mix to meet the CAFE standard in the model. If hybrid sales must be increased to meet CAFE, the coefficients on consumer demand have to be adjusted outside of the model. Manufacturers have no ability to juggle sales of hybrids and conventional vehicles to try to meet CAFE requirements.
• In the consumer demand equations of NEMS, a number of factors disadvantage hybrids relative to gasoline vehicles. One is that there are assumed to be significantly fewer hybrid make and model options available to consumers—roughly one-fifth of the number of conventional vehicles. This is certainly likely to change in the future. Maintenance costs are also assumed to be greater for hybrids. Overall, it is likely that preferences over vehicle type and characteristics are likely to change over time. These potential changes will need to be specified and built into the model.
• There is also no feedback on the production side of the market. As the penetration of new vehicles, such as the various types of hybrids, increases, costs of production do not change. We would expect that costs would fall with higher volume.
• Very little substitution among size classes occurs in the model. This may be a problem, especially for PHEVs, many of which are coming to market in the smaller size classes. Consumers may be willing to substitute away from other vehicles to purchase these vehicles, especially if gasoline prices increase substantially in the future.

Resources for the Future McConnell and Turrentine
64
• NEMS assumes that consumers are myopic with respect to choices over fuel economy (a 15 percent interest rate and three-year payback are assumed). It would useful to be able to see how sensitive the model is to this assumption, but we were not able to change it.
• NEMS does not include a component that models the economic decision to scrap old vehicles. Therefore, the effect of policies on the age distribution of the fleet is not included in any analysis with the model. For example, subsidies or feebates are likely to affect not only new-vehicle prices but also used vehicles and the probability that consumers will scrap certain vehicles earlier than they otherwise would. The effect of these outcomes on the costs and benefits of the policies are therefore not included in current NEMS results. This also means that policies to scrap old, fuel-inefficient vehicles cannot be analyzed using NEMS.

Resources for the Future McConnell and Turrentine
65
References
Allcott, Hunt, and Nathan Wozny. 2010. Gasoline Prices, Fuel Economy, and the Energy Paradox. Working paper, February. Cambridge, MA: National Bureau of Economic Research.
Alternative Fuels Data Center (AFDC, now called Alternative Fuels and Advanced Vehicles Data Center). 2010. http://www.afdc.energy.gov/afdc/laws/law/CA/4249 (accessed May 25, 2010).
Anderman, Menahem. 2010. The Plug-In Hybrid and Electric Vehicle Opportunity– A Critical Assessment of the Emerging Market and its Key Underlying Technology: Li-Ion Batteries. SAE 2010 Hybrid Vehicle Technologies Symposium, February 10-11, San Diego, California, USA.
Anderson, Soren T., and Sames M. Sallee. 2009. Using Loopholes to Reveal the Marginal Cost of Regulation: The Case of Fuel-Economy Standards. Harris School working paper series. Chicago, IL: University of Chicago.
Automotive News. 2010. http://www.autonews.com/section/datacenter (accessed May 25, 2010).
Axsen, Jonn, Andrew Burke, and Ken Kurani. 2008. Batteries for Plug-In Hybrid Electric Vehicles (PHEVs): Goals and the State of Technology circa 2008. Institute of Transportation Studies. UCD-ITS-RR-08-14. Davis, CA: University of California.
Baker, Erin, Haewon Chon and Jeffrey Keisler. 2010. Battery Technology for Electric and Hybrid Vehicles: Expert Views About Prospects for Advancement. Technological Forecasting and Social Change, in press.
Bandivadekar, Anup, Kristian Bodek, Lynette Cheah, Christopher Evans, Tiffany Groode, John Heywood, Emmanuel Kasseris, Matthew Kromer, and Malcolm Weiss. 2008. On the Road in 2035: Reducing Transportation’s Petroleum Consumption and GHG Emissions. Laboratory for Energy and the Environment, Report No. LFEE 2008-05 RP, July. Cambridge, MA: Massachusetts Institute of Technology.
Beresteanu, Arie, and Shanjun Li. 2010. Gasoline Prices, Government Support and Demand for Hybrid Vehicles in the U.S. forthcoming, International Economic Review.
Brown, Stephen P.A., and Hillard G. Huntington. 2010. Estimating U.S. Oil Security Premiums. Background paper. Washington, DC: Resources for the Future.
Resources for the Future McConnell and Turrentine
66
Burke, Andrew F., Ethan C. Abeles, Linda Zhou, Daniel Sperling, and Christie-Joy Brodrick. 2002. The Future of Hybrid-Electric ICE Vehicles and Fuels Implications. Institute of Transportation Studies, Research Report UCD-ITS-RR-02-09. Davis, CA: University of California.
Chandra, Ambarish, Sumeet Gulati, and Milind Kandikar. 2009. Evaluating Tax Rebates for Hybrid Vehicles. Draft paper, School of Public Affairs. Vancouver, BC: University of British Columbia.
Cheah, Lynette, Christopher Evans, Anup Bandivadekar, and John Heywood. 2007. Factor of Two: Halving the Fuel Consumption of New U.S. Automobiles by 2035. Laboratory for Energy and Environment, October. Cambridge, MA: Massachusetts Institute of Technology.
Davis, Stacy C., Susan W. Diegel, and Robert G. Boundy. 2008. Transportation Energy Data Book: Edition 27. ORNL-6981. Prepared for the Office of Energy Efficiency and Renewable Energy, U.S. Department of Energy. Oak Ridge, TN: Center for Transportation Analysis, Oak Ridge National Laboratory.
Dreyfus, Mark K., and W. Kip Viscusi. 1995. Rates of Time Preference and Consumer Valuations of Automobile Safety and Fuel Efficiency. Journal of Law and Economics 38(1): 79.
EIA (Energy Information Administration). 2009. Transportation Sector Module of the National Energy Modeling System: Model Documentation. DOE/EIA-0554, Office of Integrated Analysis and Forecasting. Washington, DC: EIA.
EIA. 2010. Annual Energy Outlook. Washington, D.C. http://www.eia.doe.gov/oiaf/aeo/ (accessed May 25, 2010).
Edmunds. 2009. http://www.edmunds.com/ (accessed May 25, 2010).
Friedlander, Ann F., Clifford Winston, and Kung Wang. 1983. Costs, Technology and Productivity in the U.S. Automobile Industry. The Bell Journal of Economics 14(1): 1–20.
Gallagher, K., and E. Muehlegger. 2007. Giving Green To Get Green? The Effect of Incentives and Ideology on Hybrid Vehicle Adoption. Working paper. Cambridge, MA: Harvard University.
Resources for the Future McConnell and Turrentine
67
Green Car Congress. 2010. http://www.greencarcongress.com/2010/01/hybsales-20100107.html (accessed May 25, 2010).
Greene, David L. 1991. Short-Run Pricing Strategies to Increase Corporate Average Fuel Economy. Economic Inquiry 29: 101–114.
Greene, David L., John German, and Mark A. Delucchi. 2009. Fuel Economy: the Case for Market Failure. In Reducing Climate Impacts in the Transportation Sector, edited by D. Sperling and J.S. Cannon. New York, NY: Springer, Chapter 11.
Greene, David L., Philip D. Patterson, Margaret Singh, and Jia Li. 2004. Feebates, Rebates, and Gas-Guzzler Taxes: A Study of Incentives for Increased Fuel Economy. Energy Policy 33(6): 757–775.
Goulder, Lawrence H., Mark R. Jacobsen, and Arthur A. Van Benthem. 2009. Unintended Consequences from Nested State & Federal Regulations: The Case of the Pavley Greenhouse-Gas-per-Mile Limits, Stanford University, August.
Greenemeier, Lary. The Great Electric Car Quandary: How to Build a Charging Infrsatructure Before Demand Grows. Scientific American. 14 August 2009.
Hadley, Stanton and Slexandra Tsvetkova. 2008. Potential Impacts of PHEVs on Regional Power Generation. ORNL/TM-2007/150.
Kammen, Daniel M., Samuel M. Arons, Derek M. Lemoine, and Holmes Hummel. 2009. Cost-Effectiveness of Greenhouse Gas Emission Reductions from Plug-in Hybrid Electric Vehicles. In Plug-In Electric Vehicles: What Role for Washington?, edited by David B. Sandalow. Washington, DC: Brookings Institution.
Kendall, Gary. 2008. Plugged In: The End of the Oil Age. Brussels, Belgium: WWF–World Wide Fund for Nature.
Klier, Thomas, and Joshua Linn. 2008. The Price of Gasoline and the Demand for Fuel Efficiency: Evidence from Monthly New Vehicles Sales Data. Working paper no. 2009-15. Chicago, IL: Federal Reserve Bank of Chicago.
Krupnick, Alan, Ian W.H. Parry, Margaret Walls, Kristin Hayes, and Tony Knowles. 2010. Toward a New National Energy Policy: Assessing the Options. Washington, DC: Resources for the Future and National Energy Policy Institute.
Liu, Yimin, and Gloria E. Helfand. 2009. The Alternative Motor Fuels Act, Alternative-Fuel Vehicles, and Greenhouse Gas Emissions. Transportation Research Part A 43: 755–765.

Resources for the Future McConnell and Turrentine
68
Lutsey, Nicholas, and Daniel Sperling. 2009. Greenhouse Gas Mitigation Supply Curve for the U.S. for Transport versus Other Sectors. Transportation Research, Part D (14): 222–229.
McKinsey & Company. 2007. Reducing U.S. Greenhouse Gas Emissions: How Much at What Cost? U.S. Greenhouse Gas Abatement Mapping Initiative, Executive Report, December. New York, NY.
Morrow, Ross W., Kelly Sims Gallagher, Gustavo Collantes, and Henry Lee. 2010. Analysis of Policies to Reduce Oil Consumption and Greenhouse-Gas Emissions from the U.S. Transportation Sector. Belfer Center for Science and International Affairs, Harvard Kennedy School paper 2010-02. Cambridge, MA: Harvard University.
National Highway Safety Administration (NHTSA). 2009. Corporate Average Fuel Economy for MY 2012–MY 2016 Passenger Cars and Light Trucks. August. Washington, DC: NHTSA, Office of Regulatory Analysis and Evaluation. http://www.nhtsa.gov/DOT/NHTSA/Rulemaking/Rules/Associated%20Files/MY2012-2016_CAFE_PRIA.pdf (accessed May 25, 2010).
National Renewable Energy Laboratory. 2006. Cost–Benefit Analysis of Plug-In Hybrid Electric Vehicle Technology. Presented at the 22nd International Electric Vehicle Symposium. October 25–28, Yokohama, Japan. http://www.nrel.gov/vehiclesandfuels/energystorage/pdfs/40847.pdf (accessed May 25, 2010).
National Research Council, 2010. Alternative Transportation Technologies – Plug-In Hybrid Electric Vehicles. Committee on Assessment of Resource Needs for Fuel Cell and Hydrogen Technologies. Board on Energy and Environmental Systems. Washington, D.C. http://www.nap.edu/openbook.php?record_id=12826&page=R1#
Nelson, Paul A., Danilo J. Santini, and James Barnes. 2009. Factors Determining the Manufacturing Costs of Lithium-Ion Batteries for PHEVs. Presented at EVS24, the International Battery, Hybrid and Fuel Cell Electric Vehicle Symposium. May 13–16, Stavanger, Norway.
Parry, Ian, and Kenneth Small. 2005. Does Britain or the U.S. Have the Right Gasoline Tax? American Economic Review 95: 1276–1289.
Potoglou, Dimitris, and Pavlosw S. Kanaroglou. 2007. Household Demand and Willingness To Pay for Clean Vehicles. Transportation Research Part D 12: 264–274.

Resources for the Future McConnell and Turrentine
69
Samaras, Constantine, and Kyle Meisterling. 2008. Life Cycle Assessment of Greenhouse Gas Emissions from Plug-in Hybrid Vehicles: Implications for Policy.
Environmental Science and Technology. (42): 3170–3176.
Sandalow, David B. (ed.). 2009. Plug-In Electric Vehicles: What Role for Washington? Washington, DC: Brookings Institution.
Shafer, Andreas, John Heywood, Henry Jacoby, and Ian Waitz. 2009. Transportation in a Climate Constrained World. Cambridge, MA: MIT Press.
Small, Kenneth A. 2010. Energy Policies for Automobile Transportation: A Comparison Using the National Energy Modeling System. Background paper. Washington, DC: Resources for the Future.
Truett, Lila, and Dale B. Truett. 2003. The Italian Automotive Industry and Economies of Scale. Contemporary Economic Policy 21(3): 329–337.
Turrentine, Thomas, Mark Delucchi, Rusty Heffner, Kenneth Kurani, and Yongling Sun. 2006. Quantifying the Benefits of Hybrid Vehicles. UCD-ITS-RR-06-17. Institute of Transportation Studies. Davis, CA: University of California.
U.S. EPA (Environmental Protection Agency). 2006. Greenhouse Gas Emissions from the U.S. Transportation Sector: 1990–2003. March. Washington, DC: EPA.
U.S. House of Representatives. 2009. Conference Report to Accompany H.R. 1—The American Recovery and Reinvestment Act of 2009. 111th Cong., 1st sess., Report 111.
Resources for the Future McConnell and Turrentine
70
Appendix
Subsidizing Technologies
Many policymakers are strongly advocating for large subsidies for plug-in hybrid-electric vehicles (PHEVs) over conventional and hybrid-electric vehicles (HEVs). As we discussed above, there may be some reasons why, from a cost perspective, it might make sense to do this—for example, if there are technology hurdles on the manufacturing side or acceptance and information issues on the consumer side.
But it is important to examine the energy savings from PHEVs compared to improvements in fuel economy from conventional vehicles and HEVs. Fuel economy improvements for the less fuel-efficient vehicles have the greatest effect on overall fuel savings. Figures A1 and A2 show the results of simple simulations that illustrate this point.
Figure A1 shows the results from a simple simulation of a fleet of 300,000 vehicles in total, with one-third in each of the three categories—standard gasoline internal combustion engine (ICE), HEV, and PHEV. The standard gasoline engine starts out with a fuel economy of 25 miles per gallon (mpg), the HEV with 45 mpg, and the PHEV with 80 mpg. The figure shows total gallons of fuel used by each group as each group improves fuel economy in 5-mpg increments.

Resources for the Future McConnell and Turrentine
71
Figure A1. Gallons of Gasoline Saved, by Marginal Improvement in Fuel Economy of
Each Vehicle Type
It is clear that improving the fuel economy of the conventional ICE has by far the greatest effect on reducing total fuel used. Improving the fuel economy of the vehicles that already use very little gasoline (PHEVs) has little effect on gasoline use.
Figure A2 shows what happens to the overall fleet’s use of gasoline as the share of different types of vehicles increases. Again, we have a fleet of 300,000 vehicles. In this case, the share of each vehicle type identified starts out at 25 percent and then increases as the share of standard gasoline ICE vehicles declines by an equal percentage. We find that greater penetration by a dramatically more efficient PHEV does not have much more effect on total fuel used than greater penetration by a standard HEV. This is not to say that PHEV technology does not have a role to play, but rather that it is important to weigh the costs and benefits of policies that promote the rapid penetration of these specific types of vehicles. Policies that do not attempt to pick winners, but that instead directly reward a reduction of fuel use and CO2 emissions are likely to be the most effective and the most cost-effective.

Resources for the Future McConnell and Turrentine
72
Figure A2. Total Gallons Used by New-Vehicle Fleet as Share of Vehicle Type
Notes: Fleet is 300,000 vehicles. Share starts out at 25 percent for each vehicle type and increases as the share of standard gasoline ICE vehicles declines by an equal percentage.