should ipos be auctioned? the impacts of japanese …parsons/courses/840-spring-2005/notes/... ·...
TRANSCRIPT

Should IPOs be Auctioned?The Impacts of Japanese Auction-Priced IPOs
By
Richard H. PettwayCollege of Business and Public Administration
239 Middlebush HallUniversity of Missouri-Columbia
Columbia, MO 65211
Phone: (573) 882-3800Fax: (573) 884-0674
3/15/99
Please do not quote without permission.
A special thanks needs to be given to Professor Takashi Kaneko of Keio University inTokyo. He has provided continued assistance and encouragement on this paper.However, all the errors are mine alone.
1
Should IPOs be Auctioned?The Impacts of Japanese Auction-Priced IPOs
Abstract
Many researchers suggest that investment bankers cause U.S. IPOs to beunderpriced. In Japan, all IPOs are auctioned, reducing the role of underwriters. Theseprice-competitive auctions do not result in significantly lower initial returns than those fromU. S. underwriter-priced IPOs. However, initial returns from auctions do not react in thesame manner to market movements, insider sales, and underwriter quality as underwriter-priced initial returns. Yet, initial returns from both auction-priced and underwriter-pricedIPOs are significantly related to issue size and indicate the presence of a strong partialadjustment phenomenon. In sum, investors in auctions underpriced IPOs similar tounderwriters.
In the U.S., IPOs are priced by investment bankers after gaining knowledge of potential
interest from investors, often called “book building.” Various methods are used such as “road
shows” and direct solicitations to obtain indications of interests at various potential offer prices.
See Benveniste and Spindt (1989), Benveniste and Wilhelm (1990), Spatt and Srivastava
(1991), Hanley (1993), and Hanley and Wilhelm (1995).
Most empirical studies of U.S. IPOs find evidence of underpricing, significant initial
returns, and suggest that the investment banker underprices the issue. See Ibbotson, Sindelar,
and Ritter (1991) and Ritter (1998). In adverse selection (or winner’s curse) models, the
underwriter underprices IPOs to induce uninformed investors to purchase IPO shares [Rock
(1986) and Beatty and Ritter (1986)]. In principal-agent models, the issuing firm lets the
underwriter underprice IPOs as compensation for the use of their superior information about
investor demand [Baron (1982), and Muscarella and Vetsuypens (1989)]. In information-

2
gathering marketing models, the underwriter uses underpricing and rationing as devices to
entice selected investors in a “road show” to truthfully reveal their information [Benveniste and
Spindt (1989)].
In Japan price discriminatory auctions are used to price IPOs, and price-setting activities
are removed from both the underwriter and the management of the firm.1 Beginning April 1,
1989, a price discriminatory auction has been required on a portion of all Japanese IPO shares
issued. The offer price for the unauctioned shares is set as a function of the weighted average
of successful bids in the auction. Thus, Japan provides an interesting laboratory to test the
importance of the underwriter and/or the firm in the underpricing process.
Since the role of the underwriter in Japanese auctions differs from their role in the U.S.
allocation system, we wish to study the impact of this difference on the pricing of IPOs. We
generally compares the initial return levels on Japanese price-competitive IPO auctions with
those of U.S. underwriter-priced IPOs. Additionally, we measure the relations between initial
returns from auctions and variables that have been found to explain U.S. underwriter-priced
initial returns. The auction system produces initial returns that are not related to insider sales
levels, market movements, or underwriter quality. However, initial returns are received by
investors who participate in the auction and/or allocation, not the investors on the first day of
trading. It is found that Japanese auctioned IPOs have lower returns when issue size is high
and have a strong partial adjustment phenomenon relating the pre-offer price movements with
the initial returns.2 Japanese price-competitive auctions result in significant underpricing and
do not produce lower initial return levels than U.S. underwriter-priced IPOs. Thus, investors

3
in a price-competitive auction also underprice IPOs similar to underwriters.
I. Japanese IPO Auctions
After April 1, 1989, a price discriminatory auction was required on a portion of all
Japanese IPO shares.3 Investors may bid and purchase some of the IPO shares and the
winning bids then determines the offer price of the unauctioned shares that are subsequently
offered by the underwriters.
For our comparison, data was gathered over the auction period from April 1, 1989
through December 31, 1996. We include all firm commitment type IPOs that were listed on
either the first or second sections of the Tokyo Stock Exchange (TSE) and a sample of IPOs
listed of the Japanese Over-The-Counter market (OTC).4 All privatizations of public companies
are omitted. The resulting Japanese data will be most similar to U.S. IPOs. Four hundred and
fifty-five IPOs satisfy the screening criteria.
II. Testable Hypotheses
Models that explain underpricing (adverse selection, principal-agent, and information-
gathering marketing models) emphasize the importance of the underwriter in the pricing
process. In Japan the underwriter has a much smaller pricing role in the auction system. The
major question for testing is whether the price competitive auction process in Japan results in
lower initial return levels compared to those for underwriter-priced IPOs in the U.S.
Further, Barry and Jennings (1993) find that investors on the first day of trading received
a normal daily return very close to zero on average, much lower than the average initial return
level. We hypothesize that a similar results in Japan will indicate that only the participant in the

4
auction or allocation will receive the initial return.
Many studies of U.S. IPOs find that the initial returns are inversely related to the size of
the issue and directly related to the percentage of insider sales at the offering [Beatty and Ritter
(1989) and Ibbotson, Sindelar, and Ritter (1994)]. We investigate if these common findings
from U.S. IPO studies apply to Japanese auctions. The partial adjustment phenomenon, that
has been found to exist in U.S. IPOs [Hanley (1993)], will be assessed to determine if it also
occurs in Japanese auctioned IPOs. We also measure the relation between initial returns and
market movements over the test period to determine the impact of “hot” and “cold” markets on
the level of underpricing [Ibbotson and Jaffe (1975), Ritter (1984), Ibbotson, Sindelar, and Ritter
(1988)]. In the U.S., initial returns are inversely related to underwriter quality [Carter and
Manaster (1990), Michaely and Shaw (1994), and Carter, Dark, and Singh (1998)]. We test if
high-quality underwriters in Japanese auctioned IPOs have lower initial returns as has been
found in U.S. underwriter-priced IPOs.
III. Results
A. Descriptive Statistics of Japanese Auctioned IPOs
From April 1989 through December 1996, 455 IPOs were made that met the financial
requirements to be traded on the first or second section of the TSE or the OTC. The data in
Table 1 provides descriptive statistics of these companies and issues. First, the size of the
primary offer in share terms averaged 1,328 thousand shares as a thousand shares is the
normal unit of trading in Japan. The size range was from 1,971 thousand to 0 shares.
Secondary shares included as a part of the IPO, those shares held by original owners,

5
averaged 36.31% of the total shares sold. The percent of the primary and secondary shares
that were auctioned averaged 50.23%. In order to test the partial adjustment phenomenon
described by Hanley (1993), we measure the difference between the offer price to the pre-offer
formula price for each issue. The 1.24 average for the ratio of offer price/pre-offer formula
price indicates that the price-discriminatory auction process causes the final offer prices to be
set 24% above the pre-offer formula price established by the underwriter and known to
potential bidders prior to the share auction.5
The initial return, defined as the percentage change from the auction determined offer
price to the investors in the allocation to the close on the first day of trading is 13.39% with a
range of 103% to -23%.6 Very few initial returns are negative as 93.6% of all 455 issues have
a positive initial return. The larger and financially stronger firms that met the listing
requirements of the Tokyo Stock Exchange (TSE) have a smaller initial return at 11.95% than
the OTC listed IPOs at 13.69%. However, these averages are not significant different. Also
notice that 97% of all the OTC issues have positive initial returns while only 76% of the TSE
listed firms have positive initial returns.
The initial return is commonly measured from the offer price to the price at the closing
of the first day of trading. However, Barry and Jennings (1993) report that there is little
difference between the offer price to opening price return and the offer price to the closing price
returns in U.S. IPOs. This is equivalent to saying that the open to close return on the first day
of trading is close to zero and insignificant. In these Japanese auction-priced IPOs, the same
relationship is found. In Table 1 the return on the first day of trading is shown for the TSE and

6
OTC IPOs separately. For the TSE listed IPOs, the return on the first day of trading is 0.02%,
which is statistically insignificant. For the OTC listed IPOs, the return on the first day of trading
is 0.00% as the Japan Securities Dealers Association only allows one quoted price on the first
day of trading equal to the opening transaction price. All transactions on the first day are made
at this price. Since the return on the first day of trading is insignificantly different from zero,
then there is no statistical difference between the offer to close return versus the offer to open
return in Japanese auctioned IPOs just like U.S. IPOs.7 Investors who purchases the IPO at
the offer price either in the auction or in the allocation receive the initial return, not subsequent
investors who purchases on the market after trading begins.
The market value of the average issue is 6,132 million yen or 51.1 million dollars. The
market value of the issue for the TSE listed IPOs is 17,926 million yen or 4.86 times larger than
the average for the OTC listed IPOs. Finally, the book value of capital stock after the issue
averaged 2,902 million yen. Again the book value of the TSE listed IPOs was 4.55 times larger
than the book value of the OTC listed IPO firm. It is clear that the TSE listed firms are much
larger both in terms of the market value of the IPO issue as well as the book value of the
common equity than are the OTC listed firms.
B. Structural Conditions of the Auction System During the Study Period
In April 1989 all Japanese IPOs were made subject to a price discriminatory auction on
a portion of the shares sold (initially between 25% and 50% of the total number of IPO shares
depending on a precise formula) and the weighted average price of successful bids was set as
the offer price of the unauctioned shares that were allocated by the underwriter. Initially, the

7
upper limit on bid prices was set at 30% higher than the lower limit. The lower limit was set
equal to the pre-offer formula price that was based upon a weighted average of prices of similar
companies based upon relative income and asset sizes. These conditions were used until April
1, 1992 when there were three changes in the structure: (1) fifty percent or more of the sum
of primary and secondary shares must be auctioned, (2) the upper limit on bids was abolished,
and (3) the lower limit of bids was reduced by 15%. Nine months later, December 28, 1992,
the underwriter was allowed to discount the average price from the auction to reflect the
popularity of the auction, the term-risk, and the prospect of market demand. See Pettway and
Kaneko (1996) for more details on these structural changes.
Other researchers report that structural changes in the IPO system affect initial returns
levels; therefore, we test if these changes result in significant differences in returns. Both
parametric and nonparametric tests of differences between mean initial return levels in the
three distinct time periods were made. The results clearly indicate that the initial returns are
not significantly affected by these structural changes. Thus, the data were pooled into one
period of analysis.
C. Comparison of Japanese IPO Initial Returns with U.S. IPO Initial Returns
The initial returns on Japanese IPOs that result from the auction and the firm
commitment underwriting of the unauctioned shares are compared to studies of U.S. IPO initial
returns. The spirit of the comparison between auctioned-priced Japanese IPOs and U.S.
underwriter-priced IPOs is to offer only an initial, not detailed comparison, as has been provided
by numerous survey articles such as Smith (1986), Loughran, Ritter and Rydqvist (1994), and

8
many others. The purpose is to provide a general comparison of initial return levels from the
Japanese IPOs made under the auction system versus the initial return levels found in general
studies of U.S. IPOs over approximately the same calendar time period. The data in Table
2 provides a comparison of these levels of return, the source of the returns, the sample sizes,
and the standard deviations of the mean returns. For the Japanese data found in Table 1, the
initial return level of auctioned-priced IPOs is 13.39% during the study period and is repeated
in the first row of Table 2. Since the initial returns from U.S. studies are the returns that would
be obtained by investors in the underwriter allocation from the offer price, we measured the
initial returns of the Japanese IPOs in a similar manner from the offer price to the investor in
the allocation.
Five separate U.S. IPO studies are presented in Table 2. They have been selected for
comparison as they cover somewhat similar time periods and because we were able to obtain
the standard deviation values of the mean initial return levels so that statistical comparisons
could be made.8
The study by Ibbotson, Sindelar, and Ritter (1994), ISR, is given three separate entries
in Table 2 and represent three different parts of their research as each is over a different study
period. The first observation is from the original Table 1 (1994) which covers the period
January 1960 through December 1992. The second line is from January 1960 through
December 1996, an update of their Table 1. The third line is from data provided by J. Ritter,
which matched the beginning date and ending dates of the Japanese auction data period, April
1, 1989 through December 31, 1996.

9
In summary, for the Japanese auction-priced IPOs, the traditional offer-to-close initial
returns are statistically higher in Japan than in two studies of U.S. initial returns, but not
statistically different in two other U.S. studies. The Japanese returns also appear higher than
U.S. returns in the study by Barry and Jennings (1993); however, it can not be confirmed
statistically due to lack of a standard deviation. In general from this brief comparison, the
Japanese auction system appears not to produce a significantly lower initial return level with
its price-discriminatory auction and reduced role for the underwriter. It appears that whether
there is an underwriter heavily involved in the process as in the U.S. or playing a much reduced
role as in Japan, investors in Japanese price-competitive auctions do not bid up prices and
lower their required level of initial return than do investors in underwriter-priced IPO in the U.S.
This suggests that there will be little reduction to the level of initial return and underpricing
levels with the introduction of auctions of IPOs as both investors in Japanese and U.S. IPOs
require similar levels of underpricing as compensation for the risks in IPOs.
D. Impact of Lead Underwriter Quality upon Initial Returns
Carter and Manaster (1992), Michaely and Shaw (1994), Carter, Dark, and Singh (1998),
and others report that underwriter size and/or reputation is a valuable signal of investment
quality and risk in U.S. IPOs. The higher the quality of the underwriter, the lower are the initial
return levels. We investigate whether Japanese underwriters provide the same type of
investment quality signal during the auction period.
Following Michaely and Shaw (1994), we use the level of equity capital (defined as the
sum of capital stock, legal reserve, and surplus) as a proxy for underwriter reputation and

10
quality. In Japan, the four largest underwriters, Nomura, Daiwa, Nikko, and Yamaichi,
dominate the market for new issues. Nomura's capital position was the largest in all periods
of this study and, therefore, Nomura was given the highest quality ranking. See Table 3.
Actually, the "BIG 4" underwriters had capital levels that were much more similar to each other
than to those of the non-BIG 4 underwriters employed in IPOs in this study.
We regress initial returns on underwriter quality and report our results in Table 3 which
also reports the underwriter frequencies, capital levels, and quality rankings. The first model
displayed in Table 3 tests the unique value of Nomura underwriting compared to the other
underwriters in terms of initial returns. The measurement is via a 0/1 dummy variable, NMR,
that was coded 1 if the lead underwriter was Nomura and 0 if another underwriter was the
syndicate head. The second model used the 0/1 dummy variable, BIG 4, to show the impact
of any of the BIG 4 underwriters upon initial returns. The third model employed the dummy
variable, BIG 3, to compare the relative impact of nonNomura major underwriters versus other
underwriters.
The results of the analysis are presented in two separate panels to highlight the major
differences between the impact of the underwriter quality and initial returns for TSE listed
versus OTC issues. For TSE listed IPOs, the data in Panel A of Table 3 do not yield the
expected negative relations between the level of initial returns and underwriter quality or
reputation at conventional levels of significance. In model 3, BIG 3 does have the expected
sign, however it is insignificant. It is apparent that during the period when auctions were
employed in Japan, the differential underwriter quality signal was not related to the level of
11
initial returns. This result is quite different from the studies of underwriter quality and initial
returns using U.S. IPO data. In Japan, since the new auction pricing scheme requires market
information to play a strong part in establishing the offer price, underwriter quality and or
reputation does not appear to be an important signal that is related to the level of the
underpricing for the larger TSE listed IPOs.
The results for the OTC listed IPOs are provided in Panel B. There is an unusual and
unexpected result for these smaller firms, namely the first model finds that the Nomura dummy
has a significant positive sign. This suggests that the OTC firms that employed the underwriter
with the highest reputation and capital, had higher levels of initial returns than did firms that
used less quality underwriters. This unexpected results appears to be validated in model 3
which has the expected significant negative coefficient for the OTC IPOs that use one of the
BIG 3 underwriters other than Nomura, but not one of the smaller underwriters (the 66 issues
that were underwritten by other than BIG 4 underwriters were omitted from this model). Thus,
the results indicate perversely that if the most powerful underwriter is used, the initial returns
for these OTC IPOs is higher.
The relation between underwriter quality and the level of initial returns is found to be
quite different in auction-priced IPOs compared to U.S. underwriter-priced IPOs. There
appears to be no significant relation between these variables for the larger TSE listed IPOs
compared to a significant positive relationship for OTC listed firms that chose to use the highest
quality underwriter.

12
E. Impacts of Issue Size, Insider Sales, Market Timing, and Partial Price Adjustment
Phenomenon
Many U.S. IPO studies report that the initial return levels decrease with offer size and
increase with the percentage of the issues sold by insiders or secondary shares [Beatty and
Ritter (1989) and Ibbotson, Sindelar and Ritter (1994)]. Hanley (1993) reports a significant
positive relation between final offer prices that exceed the initial pricing developed by
underwriters from a “road show,” provided in the firm’s prospectus, and the initial return levels.
Thus, when there is an increase in demand for a new issue, the offer price is increased, but
only partly, and these issues have the highest initial returns. Her results are consistent with the
suggestions of Benveniste and Spindt (1989). We test these U.S. confirmed hypotheses with
the Japanese auction data using regression models which are presented in Table 4.
The first four models are independent regressions to avoid potential multicollinearity
problems. The first model compares the initial returns with the firm’s issue size measured in
log form. The results have the expected sign, and the p-value indicates that the coefficient is
significant when measured as a single independent variable. Thus, in Japan as well as in the
U.S., firms that sell issues of higher total value have smaller initial returns.
The second model tests the relation between insider sales of shares (secondary shares
as a % of total shares sold) and initial returns. Insider sales have often been a signal of
increased risk and other negative characteristics. The regression for 455 Japanese IPOs has
the correct sign, but it is not significant at conventional levels. Thus, in Japanese auctions,
there does not appear to be an increase in initial return when a higher percentage of insiders

13
sell their shares in the offering.
The next model measures the relation between the initial returns and market
movements. The results from model 3 indicate no significant relation between the annual
return on the Tokyo Stock Exchange Stock Price Index (TOPIX), a broad market measure, and
the initial returns of the IPOs made in that same year. The model was also run with a one-year
lag and a one-year advance of the change in the market as the independent variable with no
noticeable change in explanatory power. Thus, even thought the Japanese stock market
returns were quite different over the study period, there was not a significant relation found
between the markets returns and the level of initial returns.
The next two models (4 and 5) measure the partial adjustment phenomenon. We test
to determine if there is a partial price adjustment phenomenon operating in Japanese auctions,
even with a reduced role of the underwriter in price setting. The mechanics of the auction
requires that the underwriter determine a pre-offer formula price for the shares. This was
described in detail in an earlier section. During the period April 1, 1989 through March 31,
1992, the pre-offer formula price was set as the lower limit for bids during the auction and the
upper limit of bids was set at 30% above the lower limit. From April 1, 1992 to the present, the
lower limit was set at 85% of the pre-offer formula price and the upper limit was abolished.
To test the partial adjustment phenomenon we constructed a ratio of the final offer price
from the auction divided by the pre-offer formula price. When this ratio is above 1.0 for an
issue, the final offer price was revised upward from the pre-offer formula price. If it is below
1.0, then the price declined. During the auction period the ranges in this ratio were from 0.85

14
to 3.48 with a mean value of 1.243 as presented in Table 1. Thus, there was an 24.3%
average price adjustment.
Model 4 in Table 3 provides the regression equation results for the overall period and
finds a positive and significant relation between the ratio and initial returns. These results are
consistent with a partial adjustment phenomenon, even without the price setting by an
underwriter. In Japan over the entire study period, the higher the adjustment of the final offer
price to the pre-offer price, the higher is the initial return. However, during the period April 1,
1989 to March 31, 1992, the distribution of the ratio was truncated as the pre-offer formula price
was set at the lower limit of the auction prices and investors could not bid more than the upper
limit, 30% higher than the pre-offer formula price. Thus, during this period, investors could not
totally adjust their average bids up to the “intrinsic” value because of the upper limit.
Because of these limitations on bid prices, we also ran the model on the data from April
1, 1992 through the end of our data, when the pre-offer formula price was not the lower limit
and when bid prices were freer to move about the pre-offer formula price. More important, the
upper limit was abolished on April 1, 1992 allowing bids to be made at any level above the pre-
offer formula price. Model 5 also finds a very significant positive relation between the partial
adjustment ratio and the level of initial returns. Further the coefficients are similar in models
4 and 5 indicating that there is not much difference in this effect between the full period and the
period when there was no upper limit on the bids.
In sum, it has been found that in Japanese auctions there is also a partial adjustment
phenomenon even with the fundamental price being set by a public auction, not an underwriter.

15
Even with a price discriminatory auction process, especially since April 1992, investors do not
totally adjust their average bids up to the “intrinsic” value of the shares. Higher initial returns
are positively and significantly related for the firms that have the highest upward price
adjustment above the pre-offer formula price.
Models 6 and 7 are full models containing all independent variables over the two
different time periods. The p-value for the partial adjustment ratio in both models is the most
significant among the other independent variables, indicating that the partial adjustment is
clearly the most dominant variable. Issue size does provide additional significant explanatory
power and the sign is as expected. Insider sales and the annual change in the TOPIX index
have insignificant explanatory power in the model. The F-values of both of the model are high.9
In U.S. IPO studies it has been suggested by many researchers that the partial
adjustment phenomenon is one that is controlled and established by underwriters as they gain
information during the “road show” and price the issue based upon that information. However,
in Japan the underwriter has no role in the price-discriminatory auction after they provide a pre-
offer formula price for the issue which is similar to the price range provided in U.S. IPO
prospectuses. Also, there are no “road shows” in Japan. Thus, the partial adjustment
phenomenon appears not to be related to the underwriters ability to control the price, but
perhaps due to the demand for the issue which is more than anticipated in those issues which
are adjusted upward in price between the pre-offer and the bid periods.10
IV. Summary and Conclusions
Many researchers suggest that investment bankers cause IPOs to be underpriced.

16
However, in Japan all IPOs from April 1989 through December 1996 were subject to a price-
discriminatory auction process that removes both the underwriter and the firm from the primary
price-setting activities. Thus, these Japanese IPOs provide an interesting laboratory to test the
importance of the underwriter versus an auction process in influencing the initial return levels.
We focus on six main impacts where the results from U.S. underwriter-priced IPOs are
compared with the auction-priced Japanese IPOs: initial returns, first-day returns, impacts of
underwriter reputation, issue size, insider sales, market movements, and the partial adjustment
phenomenon.
If the underwriter is the main source of the underpricing, then a price-discriminatory
auction by investors should price IPOs with significantly lower levels of initial returns than
underwriter-priced U.S. IPOs. We find that the initial return to investors for all IPOs listed on
the Tokyo Stock Exchange (TSE) and a sample of the IPOs listed on the Japanese Over-the-
Counter market (OTC) between April 1, 1989 and December 31, 1996 average 13.39% with
93.6% of these values are nonnegative. These auctioned IPOs do not produce a significantly
lower initial return than those typically found in U.S. IPOs. Our results suggest that
underpricing is not completely attributed to the pricing actions of underwriters as IPOs that are
priced by investors in a price-discriminatory auction pricing process are similarly underpriced.
However, the relation between initial returns and underwriter quality in auction-priced
IPOs is not similar to those reported in most U.S. studies of underwriter-priced IPOs. For the
TSE listed IPOs, underwriter quality was not related significantly to the initial return levels of the
auctioned IPOs. For the OTC IPOs, underwriter quality of the most reputable investment

17
company in Japan, Nomura, positively affects initial return, which contradicts the results of most
studies of U.S. underwriter-priced IPOs. Insider sales as a percentage of total sales and the
change in the market returns when the issue is sold do not appear to have any impact upon
initial return levels. The substitution of a price-competitive auction pricing process for an
underwriter pricing process results in the reduced importance of the underwriter quality, market
returns, and insider sale levels in explaining the variation in initial returns.
Several variables are important in both Japanese and U.S. IPOs: issue size and the ratio
of the offer price to pre-offer price (called an indication of the partial adjustment phenomenon).
Also, initial returns accrue to investors who purchase in the auction or in the allocation at the
offer price. Just as in U.S. IPOs, there appears to be no significant return on the first day of
trading indicating that the initial return of Japanese IPOs accrues to the purchaser of the issue
at the offer price, not to the buyer on the first day of trading. Further, issue size and initial
return levels appear to be have similar impacts between auction-priced and underwriter-priced
IPOs sales as they were negative and significant. More important, the partial adjustment
phenomenon in U.S. IPOs was found to be similarly positive and significant for these Japanese
IPOs. In fact, this was judged to be the most significant independent variable in explaining
variation in auctioned initial returns levels.
Should IPOs be auctioned? There appears to be no gain in terms of underpricing levels.
The comparison of Japanese price-discriminatory IPO auctions with U.S. underwriter-priced
IPOs finds auctions do not remove underpricing from IPOs, or eliminate the partial adjustment
phenomenon, or the importance of issue size. The use of auctions does appear to reduce the
18
impacts of market movements, insider sales, and underwriter quality that were found to affect
initial return levels in U.S. IPOs. Thus, underpricing is not completely attributable to the actions
of underwriters wanting to assure the full sales of issues at favorable prices to their investment
clients. Investors in a price-discriminatory auction also underprice IPOs.

19
Footnotes
1. Loughran, Ritter and Rydqvist (1994) report that as of the date of their study only Japan,Belgium, Chile, France, and Portugal employ an auction process on more than 50% ofthe shares offered in the IPO. Two recent papers describe French auctions by Biais andFaugeron-Crouzet (1998) and Israeli auctions by Kandel, Sarig, and Wohl (forthcoming).
2. It has been found in U.S. IPOs by Hanley (1993) that when underwriters adjust upwardthe price from the initial price to the final offer price, initial returns are more positive.Thus, the price adjustments were only partial as more adjustment occurred between theoffer price and the closing prices on the first day of trading. The partial adjustmentphenomenon is the presence of a positive relation between the size of the priceadjustments and initial returns. This is consistent with the suggestions of Benveniste andSpindt (1989).
3. The following are the distinguishing characteristics of the Japanese IPO auctions. First,the underwriter of a issue has already been determined prior to the offer and there is acontract between the firm and the underwriter that is most similar to the “firmcommitment” type of underwriting in the U.S. Second, many informed investors may notparticipate in the auction. Issuing company employees and their families are excluded,the ten largest shareholders of the issuing company cannot submit bids. Employees ofsecurities companies are also excluded. Further, companies that have existing capital(equity and debt) ownership in the issuing firm cannot participate. Third, the legalmaximum number of shares that can be purchased by a single investor or account is5,000 shares (practically, the individual upper limit is usually within a range of 1,000 to2,000 shares). The offer price of the unauctioned shares is based upon the weightedaverage of successful bids. After the offer price has been determined, the underwriteris free to allocate the remainder of the issues at their discretion. However, no shares maybe sold to investors described in the second characteristic above which means that theinvestors in the allocation cannot be different from those in the auction. The legalmaximum shares sold to an individual or an institutional investor is 5,000 shares (usuallythe individual upper limit is voluntarily set within a range of 1,000 to 2,000 shares). Sincea normal “round lot” trading size on the Tokyo Stock Exchange is 1,000 shares, thenumber of shares that may be received by any one investor is quite small when comparedto the allocation system employed in the U.S. The Japanese IPO system appears to tryto distribute the IPO issue widely among investors.
4. The OTC data was kindly provided by Takashi Kaneko from his study “Are IPOs ReallyUnderpriced? Evidence from a Unique Data Set In Japan,” Kaneko (1998).
5. In calculating the pre-offer formula price, the lead underwriter selects some (usually three)companies that are already listed and very similar to the company going public. The pre-offer formula price is determined by applying the following formula called “comparable

20
companies method”: PA*1/2[(NI0/NIA)+(NA0/NAA)], where PA is the average stock price ofthe similar companies, NI0 is the net income per share of the company going public, NIA
is the average net income per share of the similar companies, NA0 is the net asset pershare of the company going public, and NAA is the average net asset per share of thesimilar companies. This pre-offer formula price is calculated to determine the lower andupper limits on bid prices at the auction. Since the lower limit on bid prices is publishedby the TSE Daily Report four trading days prior to the auction, investors can easily knowthe pre-offer formula price before submitting their bids in the auction.
6. A comparison of the 13.4% initial returns of these 455 TSE and OTC IPOs from 1989 to1996 with the 15.7% average of Japanese OTC issues from 1989-1995 in Hamao, Packerand Ritter (1998) suggests that the OTC issues have higher initial returns than the TSEIPOs as one might expect. This fact is confirmed in our study with data found in Table1. Biais and Faugeron-Crouzet (1998) analyze 92 “Second Marche” (somewhat similarto the second section of the TSE) French IPO auctions made between 1983 and 1996and find underpricing of 13%. This is similar to the 13.4% in Japan.
7. IPOs in Israel are auctioned using a different system (uniform price) from those in Japan.Kandel, Sarig, and Wohl (forthcoming) report that of the 27 Israeli IPOs they study thereis a significant average abnormal return of 4.5% on the first trading day. This result isquite different from the results of Japanese auctions and U.S. underwriter-priced IPOs.
8. Many U.S. studies do not provide details of the standard deviations of the reported initialreturns. All of the listed studies did not provide the standard deviations in the referencedpaper; however, the authors were contacted personally and they provided the standarddeviation values that are reported for the Bhabra and Pettway (1996), Carter, Dark, andSingh (1998), Ibbotson, Sindelar, Ritter (1994), and Spiess and Pettway (1997). We areindebted to these authors for providing the standard deviations to allow our comparisonwith Japanese data.
9. Each of the models presented in Table 4 was also run with a dummy variable designatingwhether the observations was a TSE or OTC listed firm. In Table 3, it was found that therelationship between underwriter reputation and initial return level was a function ofwhether the firm was listed on the TSE or on the OTC. However, none of the dummyvariables added to the regressions in Table 4 were significant and, thus, the classificationof listing and trading of the IPO was not presented.
10. It is very interesting that Biais and Faugeron-Crouzet (1998) in their study of French IPOauctions also found evidence of a partial price adjustment phenomenon. They report anaverage price adjustment of 17.36% in France compared to 24.3% in Japan presentedin Table 1. Further, they report that a regression between the initial returns and thepartial adjustment ratio is also positive and significant. A similar regression and resultsfor Japanese IPOs is found in models 4, 5, 6, and 7 of Table 4. Thus, both Japanese andFrench IPOs that use an auction to price IPOs have partial price adjustments just as doU.S. IPOs sold and priced by underwriters.
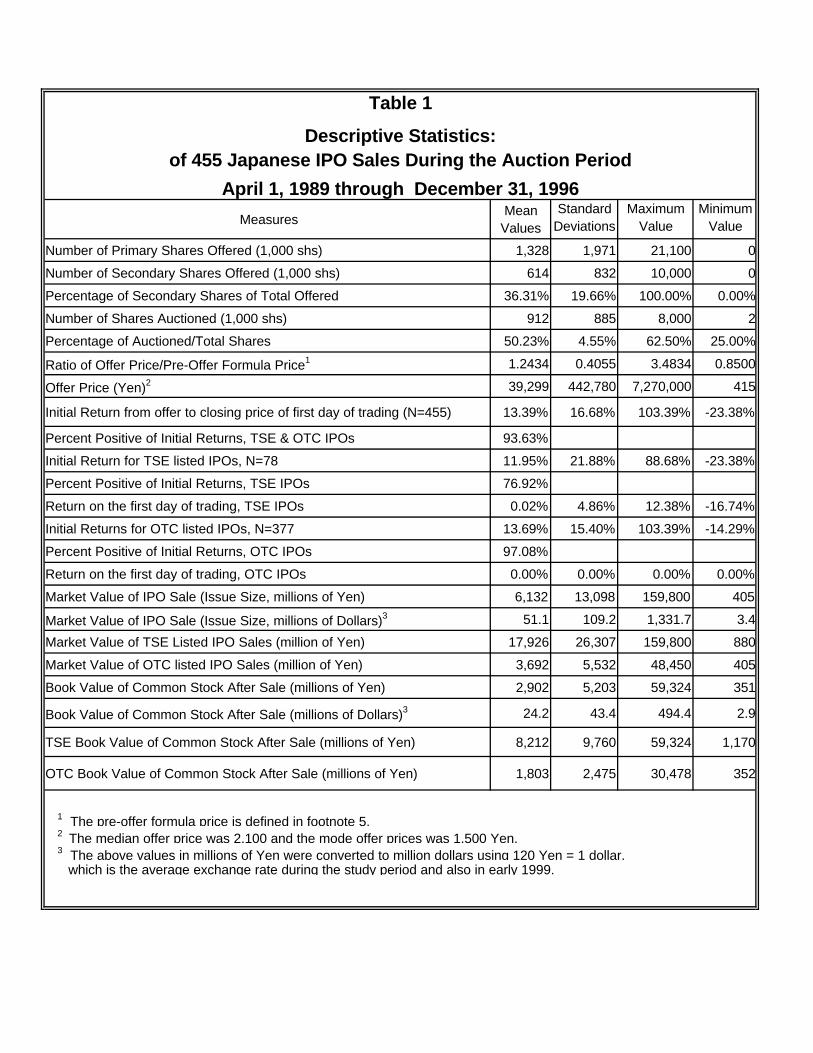
Table 1
Descriptive Statistics:of 455 Japanese IPO Sales During the Auction Period
April 1, 1989 through December 31, 1996
MeasuresMean
ValuesStandard
DeviationsMaximum
ValueMinimum
Value
Number of Primary Shares Offered (1,000 shs) 1,328 1,971 21,100 0
Number of Secondary Shares Offered (1,000 shs) 614 832 10,000 0
Percentage of Secondary Shares of Total Offered 36.31% 19.66% 100.00% 0.00%
Number of Shares Auctioned (1,000 shs) 912 885 8,000 2
Percentage of Auctioned/Total Shares 50.23% 4.55% 62.50% 25.00%
Ratio of Offer Price/Pre-Offer Formula Price1 1.2434 0.4055 3.4834 0.8500
Offer Price (Yen)2 39,299 442,780 7,270,000 415
Initial Return from offer to closing price of first day of trading (N=455) 13.39% 16.68% 103.39% -23.38%
Percent Positive of Initial Returns, TSE & OTC IPOs 93.63%
Initial Return for TSE listed IPOs, N=78 11.95% 21.88% 88.68% -23.38%
Percent Positive of Initial Returns, TSE IPOs 76.92%
Return on the first day of trading, TSE IPOs 0.02% 4.86% 12.38% -16.74%
Initial Returns for OTC listed IPOs, N=377 13.69% 15.40% 103.39% -14.29%
Percent Positive of Initial Returns, OTC IPOs 97.08%
Return on the first day of trading, OTC IPOs 0.00% 0.00% 0.00% 0.00%
Market Value of IPO Sale (Issue Size, millions of Yen) 6,132 13,098 159,800 405
Market Value of IPO Sale (Issue Size, millions of Dollars)3 51.1 109.2 1,331.7 3.4
Market Value of TSE Listed IPO Sales (million of Yen) 17,926 26,307 159,800 880
Market Value of OTC listed IPO Sales (million of Yen) 3,692 5,532 48,450 405
Book Value of Common Stock After Sale (millions of Yen) 2,902 5,203 59,324 351
Book Value of Common Stock After Sale (millions of Dollars)3 24.2 43.4 494.4 2.9
TSE Book Value of Common Stock After Sale (millions of Yen) 8,212 9,760 59,324 1,170
OTC Book Value of Common Stock After Sale (millions of Yen) 1,803 2,475 30,478 352
1 The pre-offer formula price is defined in footnote 5. 2 The median offer price was 2,100 and the mode offer prices was 1,500 Yen. 3 The above values in millions of Yen were converted to million dollars using 120 Yen = 1 dollar, which is the average exchange rate during the study period and also in early 1999.

Table 2
Comparison of Initial Returns:Fixed Commitment Japanese Auction-Priced versus Fixed Commitment US Underwriter-Priced IPOs
Number of IPOs
Study PeriodInitial Return (Close-Offer)
Standard Deviation
Current Study of Japanese IPOs 4554/1/89 - 12/31/96
13.39% 16.68%
Barry and Jennings (1993) 175 12/88 - 12/90 8.69% n.a.
t-value of difference of US - Japanese n.a.
Bhabra and Pettway (1996) 398 1/87 - 12/91 10.03% 14.53%
t-value of difference of US - Japanese -3.14*
Carter, Dark, and Singh (1998)a 2,2921/1/79 - 12/31/91
8.15% 17.41%
t-value of difference of US - Japanese -5.90*
Ibbotson, Sindelar, & Ritter (1994)b 10,626 1/60-12/92 15.26%
Ibbotson, Sindelar, & Ritter (1994)c 13,308 1/60 - 12/96 15.80%
Ibbotson, Sindelar, & Ritter (1994)d 3,053 4/89-12/96 14.22% 21.26%
t-value of difference of US - Japanese 0.95
Spiess and Pettway (1997) 172 1/87 - 12/91 10.94% 14.29%
t-value of difference of US - Japanese -1.83
a CDS provided specific data from their study to match the Japanese data format.b From original Table 1, ISR (1994), Journal of Applied Corporate Finance, 66-74. c Firm commitments from 2/19/97 revision of the original Table 1 in the 1994 paper.d Data provided by J. Ritter of non-unit firm commitment offerings beginning 4/1/89 through 12/31/96,
which is similar to the Japanese auction period used in this study (i.e., beginning with 4/1/89).
* Significantly different (US average - Japanese average) at .05 level

Table 3
Relations between Initial Returns and Underwriter QualityDuring the Auction Period, April 1, 1989 through December 31, 1996
Regression Models:1. IRj = a + b NMRj2. IRj = a + b BIG 4j3. IRj = a + b BIG 3j
Panel A: TSE Listed IPOs
Model Obs a b t-value p-value
1 78 11.83% 0.35% 0.067 0.947
2 78 6.22% 6.04% 0.535 0.594
3 74 12.18% -0.35% -0.067 0.947
Panel B: OTC Listed IPOs
Model Obs a b t-value p-value
1 377 12.10% 4.40% 2.669 0.008
2 377 12.80% 1.12% 0.537 0.592
3 311 16.50% -4.63% -2.595 0.012
Definitions:
IRj = Initial return [Closing price-offer price)/offer price] of IPOj.NMR = 0/1 dummy variable coded as 1 if Nomura was lead underwriter.
BIG 4 = 0/1 dummy variable coded as 1 if either Nomura, Daiwa, Yamaichi,or Nikko was lead underwriter.
BIG 3 = 0/1 dummy variable coded if other than Nomura in the BIG 4 was lead underwriter, all non-BIG 4 observations were omitted.
TSE underwriter frequencies : Normua 28, Daiwa 15, Nikko 17, Yamaichi 14, and non-Big4 4. N=78.OTC underwriter frequencies: Normura 132, Daiwa 61, Nikko 62, Yamaichi 56, non-Big4 66. N=377.Underwriter capital levels, Sept 1996, in million yen, and rank 1 through 4: Big 4: Nomura (1,251,910) 1st, Daiwa (926,817) 2nd, Nikko (789,216) 3rd, Yamaichi (613,262) 4th. Largest non-Big4 is Kokusai (227,371).

Table 4
Relations between Initial Returns, Firm Size, % Insider Sales, Market Movements, and the Partial Adjustment Phenomenon
During the Auction Period, April 1, 1989 through December 31, 1996
Regression Models:1. IRj = a + b LogIPOVj
2. IRj = a + b %ISj
3. IRj = a + b %CTOPIXj
4. IRj = a + b OP/POFPj (Full sample, N=455)
5. IRj = a + b OP/POFPj (04/01/92 - 12/31/96, N=393)
The first value in each cell for each independent variable is the regression coefficient. The second is the p-value of that coefficient.
Model Model 1 Model 2 Model 3 Model 4 Model 5* Model 6* Model 7
Intercept 0.2890 0.1270 0.1330 0.0435 0.0257 0.2620 0.25000.0000 0.0000 0.0000 0.0808 0.3340 0.0011 0.0005
LogIPOVj -0.0192 -0.0314 -0.02740.0154 0.0012 0.0009
% Insider Sales 0.0183 -0.0102 -0.0098
0.6460 0.8130 0.8070% Change in
TOPIX 0.0575 0.0496 0.00170.3440 0.4580 0.9770
OP/POFP 0.0727 0.0893 0.1020 0.08670.0002 0.0000 0.0000 0.0000
Adjusted R2 0.0107 -0.0017 -0.0002 0.0291 0.0436 0.0622 0.0471
F-Value 5.9135 0.2115 0.8986 14.6098 18.8665 7.4971 6.6040
* Models 5 and 6 are regressed with samples of the period of 04/01/92 to 12/31/96.
Definitions:IRj = Initial return [(Closing price-offer price)/offer price] of IPOj.
IPOVj = The size of the offer =(shares sold * offer price) for firm j.%ISj = Insider Sales (secondary shares) as % of total shares sold.%CTOPIXj = The annual % change in the TOPIX for the current year. OP/POFPj = The offer price/pre-offer formula price for each firm j. If the ratio is above 1.0, then there was an upward movement between the initial suggested price and the final offer price, and, thus, a partial adjustment in the offer price.

References
Baron, D. P., 1982, A model of the demand for investment banking advising and distributionservices for new issues, Journal of Finance 37, 955-976.
Barry, C. B. and R. H. Jennings, 1993, The opening price performance of initial public offeringsof common stock, Financial Management (Spring), 54-63.
Beatty, R. P. and J. R. Ritter, 1989, Investment banking, reputation, and the underpricing of Initial public offerings, Journal of Financial Economics 37, 395-976.
Benveniste, L. M. and P. A. Spindt, 1989, How investment bankers determine the offer price andallocation of new issues, Journal of Financial Economics 24, 343-361.
Benveniste, L. M. and W. J. Wilhelm, 1990, A comparative analysis of IPO proceeds underalternative regulatory environments, Journal of Financial Economics 28, 173-208.
Bhabra, H. S. and R. H. Pettway, 1996, Informational asymmetries and pricing of IPOs: An expost analysis of firm quality, Working Paper, Financial Research Institute, University ofMissouri-Columbia.
Biais, B. and A. M. Faugeron-Crouzet, 1998, Large IPO Auctions, memo dated June 1998,University of Toulouse, France.
Carter, R. B., F. H. Dark, and A. K. Singh, 1998, Underwriter reputation, initial returns, andthe long-run performance of IPO stocks, Journal of Finance 53, 285-311.
Carter, R. B. and S. Manaster, 1990, Initial public offerings and underwriter reputation, Journal
of Finance 45, 1045-1068.
Hamao, Y., F. Packer, and J. R. Ritter, 1998, Institutional affiliation and the role of venturecapital: Evidence from initial public offerings in Japan. Memo dated April 1, 1998.
Hanley, K. W., 1993, The underpricing of initial public offerings and the partial adjustmentphenomenon, Journal of Financial Economics 34, 2, (October) 231-250.
Hanley, K. W. and W. J. Wilhelm, 1995, Evidence on the strategic allocation of initial publicofferings, Journal of Financial Economics 37, 2 239-257.
Ibbotson, R. G. and J. F. Jaffe, 1975, Hot issue markets, Journal of Finance 30,1027-42.
Ibbotson, R. G., J. L. Sindelar, and J. R. Ritter, 1988, Initial public offerings, Journal of AppliedCorporate Finance, 37-45.
Ibbotson, R. G., J. L. Sindelar, and J. R. Ritter, 1994, The market’s problems with the pricing ofinitial public offerings, Journal of Applied Corporate Finance, 66-74.

Kandel, S., O. Sarig, A. Wohl, forthcoming, The demand for stocks: An analysis of IPO auctions,Review of Financial Studies, Vol. 12.
Kaneko, T, 1998, Are IPOs really underpriced? Evidence from a unique data set in Japan, KeioUniversity, memo dated November 11, 1998.
Loughran, T., J. R. Ritter, and K. Rydqvist, 1994, Initial public offerings: International insights,Pacific-Basin Finance Journal 2, 165-199.
Michaely, R. and W. H. Shaw, 1994, The pricing of initial public offerings: Tests of adverse-selection and signaling theories, Review of Financial Studies 7, 279-319.
Muscarella, C. J. and M. R. Vetsuypens, 1989, A simple test of Baron’s model of IPOunderpricing, Journal of Financial Economics 24, 125-135.
Pettway, R. H. and T. Kaneko, 1996, The effects of removing price limits and introducing
auctions upon short-term IPO returns: The case of Japanese IPOs, Pacific-Basin FinanceJournal 4, 241-258.
Ritter, J. R., 1984, The ‘hot issue’ market of 1980, Journal of Business 57, 215-240.
Ritter, J. R., 1998, Initial public offerings, Contemporary Finance Digest, Spring, Vol 2, No. 1,5-30.
Rock, K., 1986, Why new issues are underpriced, Journal of Financial Economics 15, 187-212.
Smith, C. W., 1986, Investment banking and the capital acquisition process, Journal of FinancialEconomics 15, 3-29.
Spatt, C. and S. Srivastava, 1991, Preplay communication, participation restrictions, andefficiency in initial public offerings, Carnegie-Mellon University, Graduate School ofIndustrial Administration, Reprint NO. 1415.
Spiess, D. K. and R. H. Pettway, 1997, The IPO and first seasoned equity sale: Issue proceeds,owner/managers’ wealth, and the underpricing signal, Journal of Banking and Finance21, 967-988.