should the labeling of genetically modified foods be harmonized? a focus on transgenic wheat g....
TRANSCRIPT
Should the Labeling of Genetically Modified Foods be
Harmonized? A Focus on Transgenic Wheat
G. Gruère & C. Carter University of California, Davis
INEA seminar, Roma, June 20, 2003

• In 6 years, growth in biotech crop acres has been double-digit & now over 150 m. ac. > 20% of global soybeans, corn, cotton & canola acres are biotech.
• US, Argentina, Canada & China are leading growers of biotech crops.
• Mostly herbicide tolerant (75%) & insect resistant (17%) crops.
Transgenics: Fast Growing Adoption

• > 50% of China's cotton now biotech.• Bollworm resistance to pesticides was a
big problem in China before Bt.• Cotton fields were sprayed up to 40
times. • With Bt cotton, China’s farmers have
saved 20% in production costs.• China’s pesticide use has fallen sharply
with Bt cotton (C. Pray). • Bt cotton has potential to eliminate the
need for 40% of global pesticide use (Clive James, ISAAA).
Importance in Developing Countries: e.g., China

• “Hovis to stop N. America imports if GM wheat planted.” (World-Grain.com, June 5, 2003).
• “E.U., U.S. millers warn against GM wheat at meeting.” (World-Grain.com, August 12, 2002)
• “GM wheat 'devastating' for farmers, CWB warns” The Star Phoenix (Saskatoon), May 28, 2003.
• CWB is now threatening a lawsuit against Monsanto.
GM Wheat: Rich Country Reaction

• EU opposition has caught attention of US and other trading nations.
• Wheat is a food grain, whereas corn, and soybeans are mainly used for feed.
• Soybean, corn, & canola oil largely exempt from labeling regulations in the EU & elsewhere.
• Plenty of GM food now eaten in EU, Japan, & China.
Is Transgenic Wheat Different from other GMOs?
• In WTO case, US alleges violation of Sanitary & Phytosanitary (SPS) Agreement.
• Since Oct. ’98 no new GMOs have been authorized in the EU.
• EU response to WTO case: “lack of consumer demand accounts for low sales of GMOs in the EU” (EU trade directorate).
• EU is finalizing rules on labeling & traceability. EU trade directorate says the EU system is “science based” & not driven by economic considerations.
EU versus GM Technology
• Labeling at 0.9% tolerance.• EU influences other countries (Isaac;
Paarlberg) e.g.: Zambia, Zimbabwe, Russia & China
• Lowering of adventious presence to 0.5% from 0.9%? Including soy & corn oil (whether or not detectable).
• Zero tolerance level for non-authorized GMOs.
• EU Parliament will consider these changes in July.
EU’s Parliament Environ. Committee

International Rules
• UN food code (Codex Alimentarius) unable to reach an agreement on GM labeling.
• Cartagena Biosafety Protocol: uses a "precautionary approach“& allows importers to block GM imports if they are not satisfied with information supplied by exporters.
• Protocol promotes idea of letting each country decide on its own labeling policy.
• US has opposed the Protocol.

Labeling
• Mandatory labeling encourages food processors to switch away from GM ingredients & avoid labels, especially for highly processed products.
• In the EU, Tolerant consumers suffer economic loss due to lack of choice at the retail level.
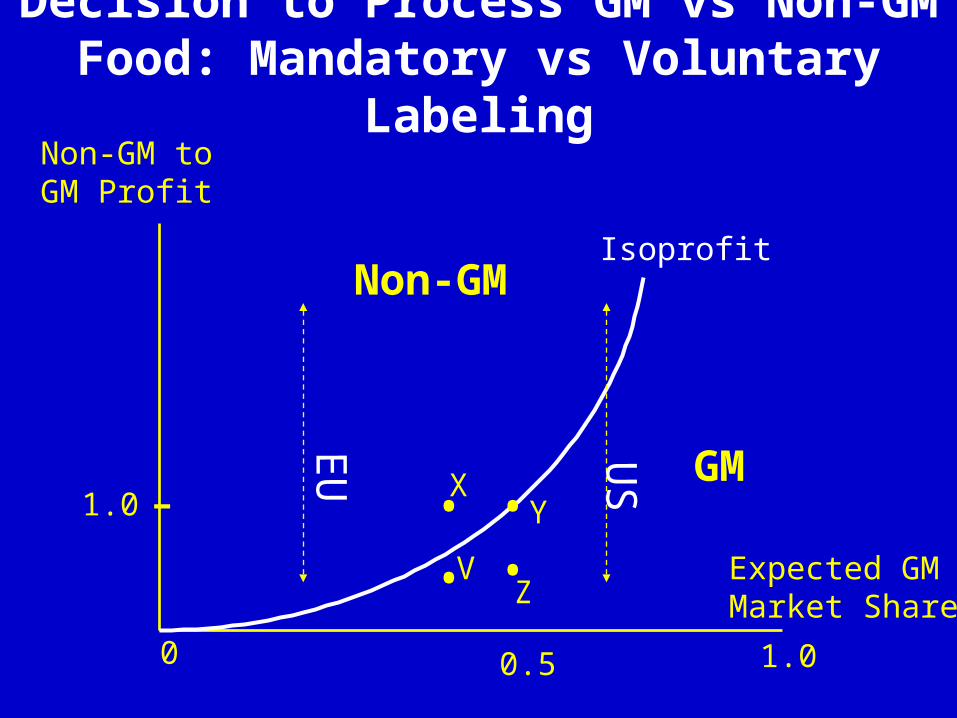
Decision to Process GM vs Non-GM Food: Mandatory vs Voluntary
Labeling
Expected GMMarket Share
Non-GM to GM Profit
Isoprofit
GM
Non-GM
0 1.0EU US
••
•X
Y
Z
0.5
1.0 -V•
Harmonization of Labeling Policies
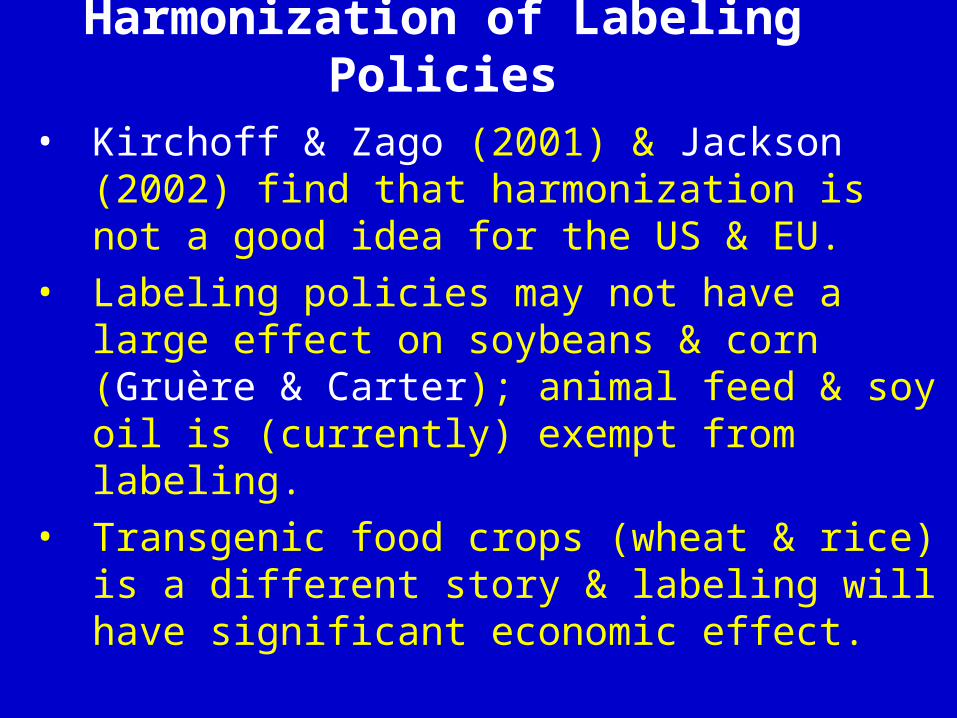
• Kirchoff & Zago (2001) & Jackson (2002) find that harmonization is not a good idea for the US & EU.
• Labeling policies may not have a large effect on soybeans & corn (Gruère & Carter); animal feed & soy oil is (currently) exempt from labeling.
• Transgenic food crops (wheat & rice) is a different story & labeling will have significant economic effect.

Source of EU Maize Imports (1995-2002)
0
500
1,000
1,500
2,000
2,500
3,000
3,500
1995 1996 1997 1998 1999 2000 2001 2002
..
Source: EU Trade Directorate http://europe.eu.int/comm/trade/goods/agri
Argentina
US
'000 mt
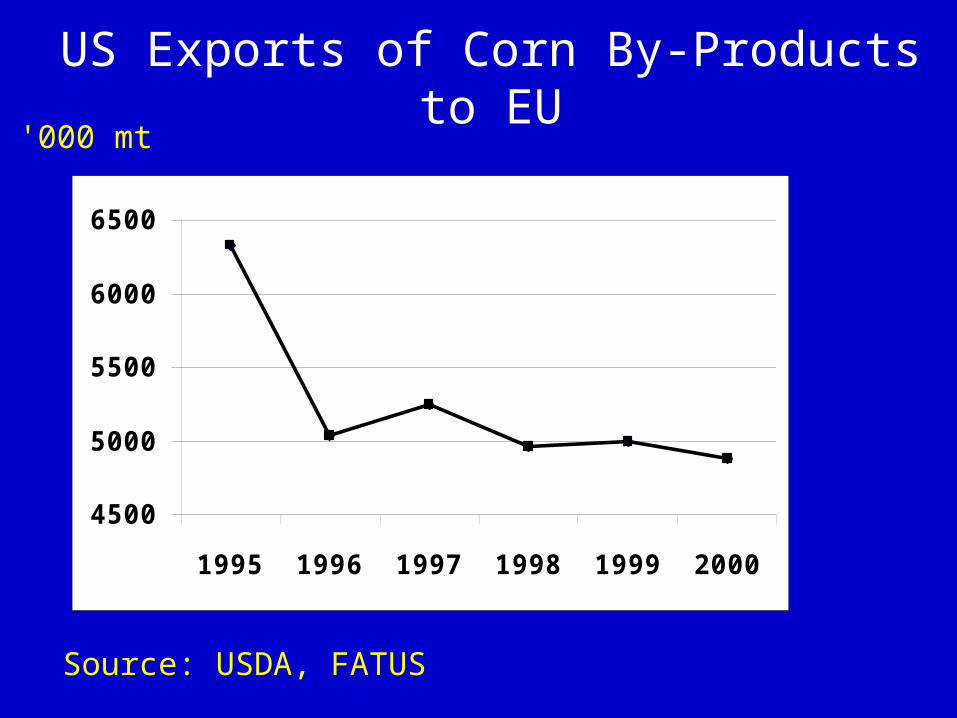
US Exports of Corn By-Products to EU
Source: USDA, FATUS
'000 mt
4500
5000
5500
6000
6500
1995 1996 1997 1998 1999 2000

Source of EU Soybean Imports (1995-2002)
Source: EU Trade Directorate http://europe.eu.int/comm/trade/goods/agri
'000 mt
0
1,000
2,000
3,000
4,000
5,000
6,000
7,000
8,000
9,000
10,000
1995 1996 1997 1998 1999 2000 2001 2002
US
Argentina
Brazil

Foster (ABARE, 2001) AGLINK model; 10% yield boost; 1% cost
increase; 10% IP cost; 60% adoption in US; world price falls by 0.4%; world consumer benefits of $2.1 B.
Furtan, Gray & Holzman (UofS / USDA,’02) Segretation infeasible; GM acceptance in
US/Canada only; TUA $5/$6; if both countries license prices fall by over 75¢/bu; US farmers lose $345M & Canadians farmers lose $314M annually
Including consumers & biotech firms, net gain in US $271M but loss of $47M in Canada.
Wheat Studies
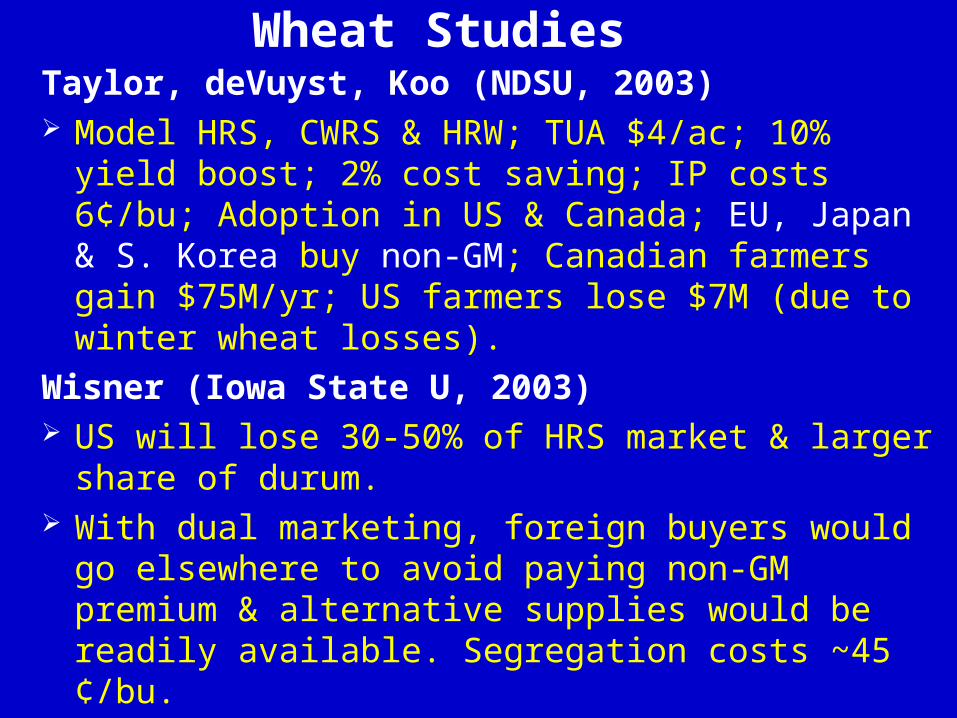
Taylor, deVuyst, Koo (NDSU, 2003) Model HRS, CWRS & HRW; TUA $4/ac; 10%
yield boost; 2% cost saving; IP costs 6¢/bu; Adoption in US & Canada; EU, Japan & S. Korea buy non-GM; Canadian farmers gain $75M/yr; US farmers lose $7M (due to winter wheat losses).
Wisner (Iowa State U, 2003) US will lose 30-50% of HRS market & larger
share of durum. With dual marketing, foreign buyers would go
elsewhere to avoid paying non-GM premium & alternative supplies would be readily available. Segregation costs ~45 ¢/bu.
Wheat Studies

Simulation World Wheat Model
Scenario Production Consum ption Production Consum ption Production Consum ption0. No labeling NGM NGM NGM NGM NGM NGM1. Current Regulations GM & NGM GM & NGM NGM NGM GM & NGM GM & NGM2. Mandatory Labeling GM & NGM GM & NGM NGM NGM GM & NGM GM & NGM3. Voluntary Labeling GM & NGM GM & NGM NGM GM & NGM GM & NGM GM & NGM
Country A Country B Country C
1. 3 Regions (A& B are rich & C is poor).2. Precautionary consumers: 20%(A); 90% (B); 5%(C).3. Segregation costs 10%.4. Regions linked by trade.5. Model calibrated to current Supply & Demand.6. Produce 75% GM in region A & 50% in region C.7. Does Harmonization make sense?
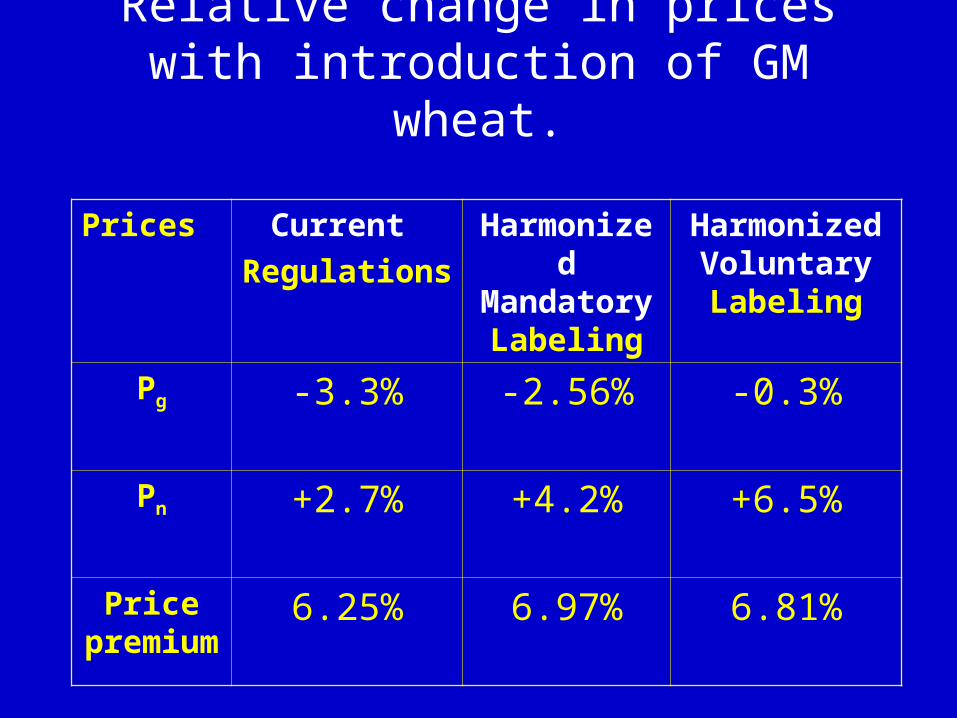
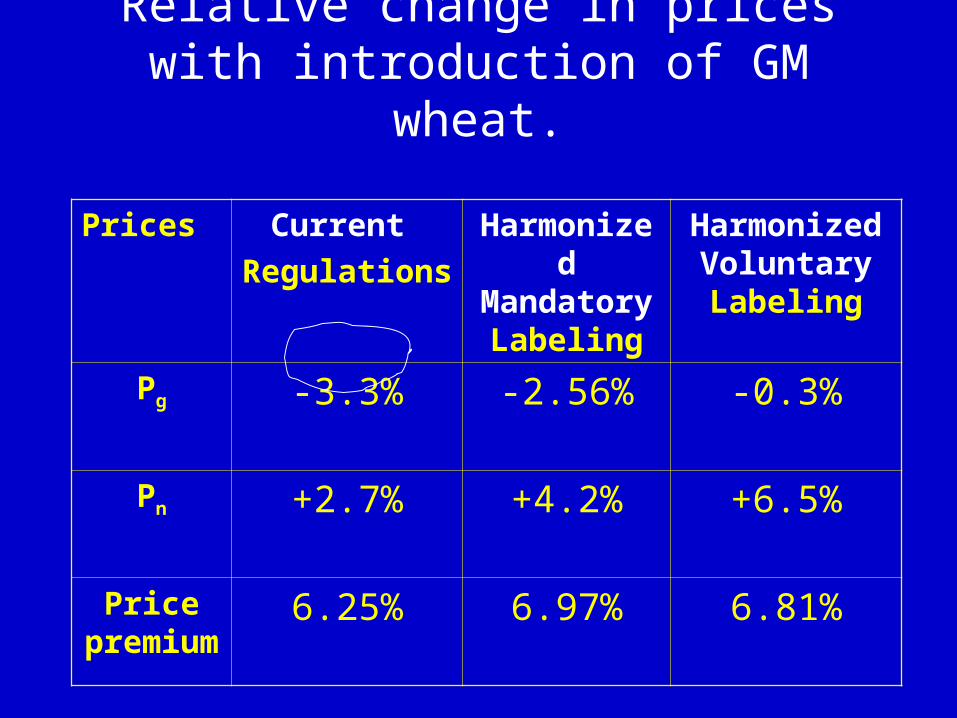
Relative change in prices with introduction of GM wheat.
Prices Current Regulation
s
Harmonized
Mandatory Labeling
Harmonized Voluntary
Labeling
Pg -3.3% -2.56% -0.3%
Pn +2.7% +4.2% +6.5%
Price premiu
m
6.25% 6.97% 6.81%
Relative change in prices with introduction of GM wheat.
Prices Current Regulation
s
Harmonized
Mandatory Labeling
Harmonized Voluntary
Labeling
Pg -3.3% -2.56% -0.3%
Pn +2.7% +4.2% +6.5%
Price premiu
m
6.25% 6.97% 6.81%

Relative change in prices with introduction of GM wheat.
Prices Current Regulation
s
Harmonized
Mandatory Labeling
Harmonized Voluntary
Labeling
Pg -3.3% -2.56% -0.3%
Pn +2.7% +4.2% +6.5%
Price premiu
m
6.25% 6.97% 6.81%

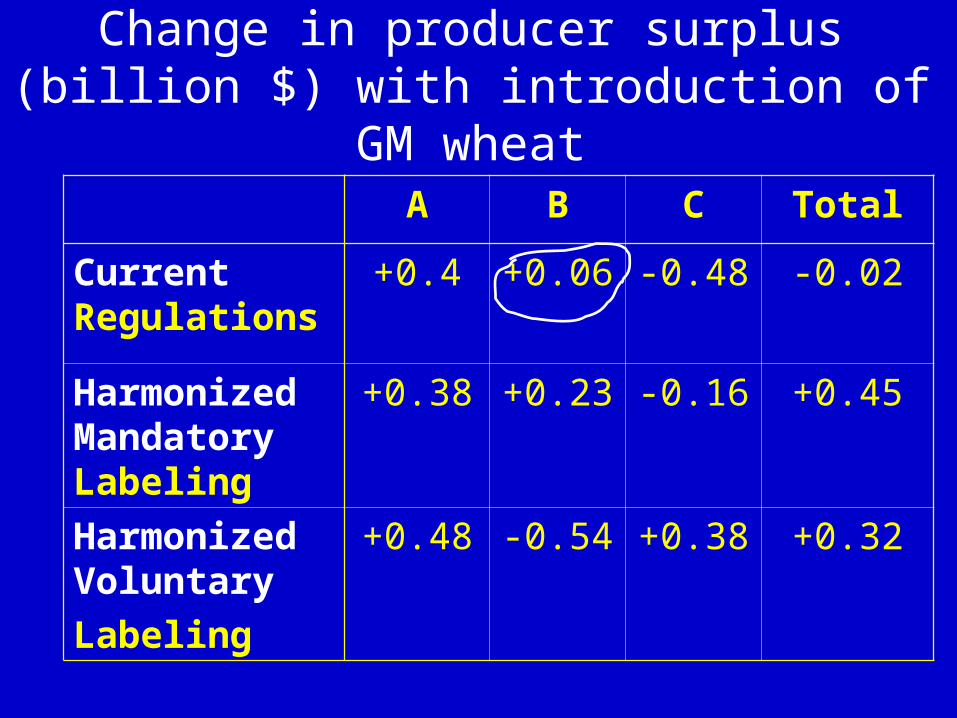
Change in producer surplus (billion $) with introduction of GM wheat
A B C Total
Current Regulations
+0.4 +0.06 -0.48 -0.02
Harmonized Mandatory Labeling
+0.38 +0.23 -0.16 +0.45
Harmonized Voluntary Labeling
+0.48 -0.54 +0.38 +0.32
Change in producer surplus (billion $) with introduction of GM wheat
A B C Total
Current Regulations
+0.4 +0.06 -0.48 -0.02
Harmonized Mandatory Labeling
+0.38 +0.23 -0.16 +0.45
Harmonized Voluntary Labeling
+0.48 -0.54 +0.38 +0.32

Change in producer surplus (billion $) with introduction of GM wheat
A B C Total
Current Regulations
+0.4 +0.06 -0.48 -0.02
Harmonized Mandatory Labeling
+0.38 +0.23 -0.16 +0.45
Harmonized Voluntary Labeling
+0.48 -0.54 +0.38 +0.32

Change in producer surplus (billion $) with introduction of GM wheat
A B C Total
Current Regulations
+0.4 +0.06 -0.48 -0.02
Harmonized Mandatory Labeling
+0.38 +0.23 -0.16 +0.45
Harmonized Voluntary Labeling
+0.48 -0.54 +0.38 +0.32

A B C Total
Current Regulations
+0.03 -1.23 +1.46 +0.26
Harmonized Mandatory Labeling
-0.50 -1.41 +1.61 -0.30
Harmonized Voluntary Labeling
+0.11 -0.62 +5.24 +4.73
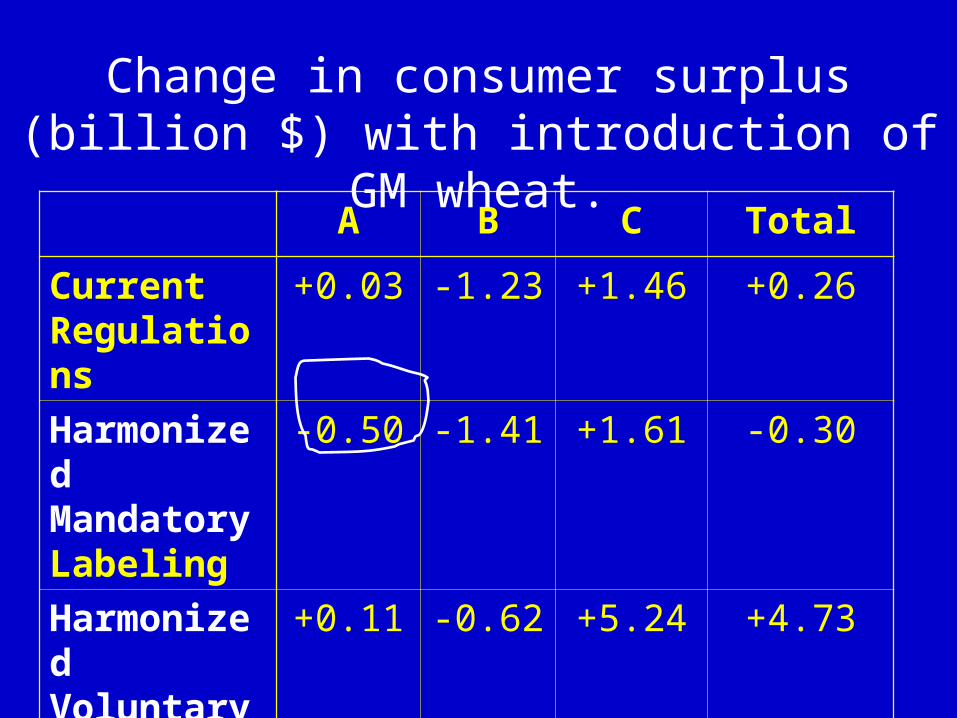
Change in consumer surplus (billion $) with introduction of GM wheat.

A B C Total
Current Regulations
+0.03 -1.23 +1.46 +0.26
Harmonized Mandatory Labeling
-0.50 -1.41 +1.61 -0.30
Harmonized Voluntary Labeling
+0.11 -0.62 +5.24 +4.73
Change in consumer surplus (billion $) with introduction of GM wheat.
A B C Total
Current Regulations
+0.03 -1.23 +1.46 +0.26
Harmonized Mandatory Labeling
-0.50 -1.41 +1.61 -0.30
Harmonized Voluntary Labeling
+0.11 -0.62 +5.24 +4.73
Change in consumer surplus (billion $) with introduction of GM wheat.

A B C Total
Current Regulations
+0.03 -1.23 +1.46 +0.26
Harmonized Mandatory Labeling
-0.50 -1.41 +1.61 -0.30
Harmonized Voluntary Labeling
+0.11 -0.62 +5.24 +4.73
Change in consumer surplus (billion $) with introduction of GM wheat.

Total Producer & Consumer Effects
-2
-1
0
1
2
3
4
5
6
Current Mandatory Voluntary
ABCWorld
$Billion

• In the case of corn or soybeans, harmonization of labeling policies may not be so important.
• However, in the case of food crops, large country labeling policies have significant market impacts.
• Current labeling regulations are not a first-best policy & there are benefits from harmonization.
• Large gains in developing countries.
Conclusions