should there be gender differences when treating raised blood pressure and cholesterol? neil r...
TRANSCRIPT

Should there be gender differences when treating raised blood pressure
and cholesterol?
Neil R Poulter
International Centre for Circulatory Health NHLI, Imperial College London
Hong Kong, April 2006


Risk Factors for CHD
Oral contraceptives
Clotting factors
Homocysteine
Central obesity
Birth weightLeft ventricular hypertrophy
OTHERDiabetes & glucose intolerance
Lack of exercise
GeneticLow HDL cholesterol
Family historySmoking
SexHigh blood pressure
AgeHigh LDL cholesterol
NON-MODIFIABLEMODIFIABLE

Summary report
Sex differences in coronary heart disease
Why are women so superior?
The 1995 Ancel Keys LectureElizabeth Barrett-Connor, MD
Circulation 1997; 95-252-264

• Potentially beneficial mechanisms of oestrogen can be shown (+ some harmful)• Endogenous oestrogen levels do not predict CHD• Lack of oestrogen (menopause) does not ↑ CHD rates• Pre-menopausally exogenous oestrogen increases CVD rates• Post-menopausally exogenous oestrogen provides no CVD benefit
Conclusion:
1 of 8 criteria for assessing a causative link between oestrogen and CVD protection are partially satisfied (laboratory):
7 OF 8 ARE NOT!
Summary
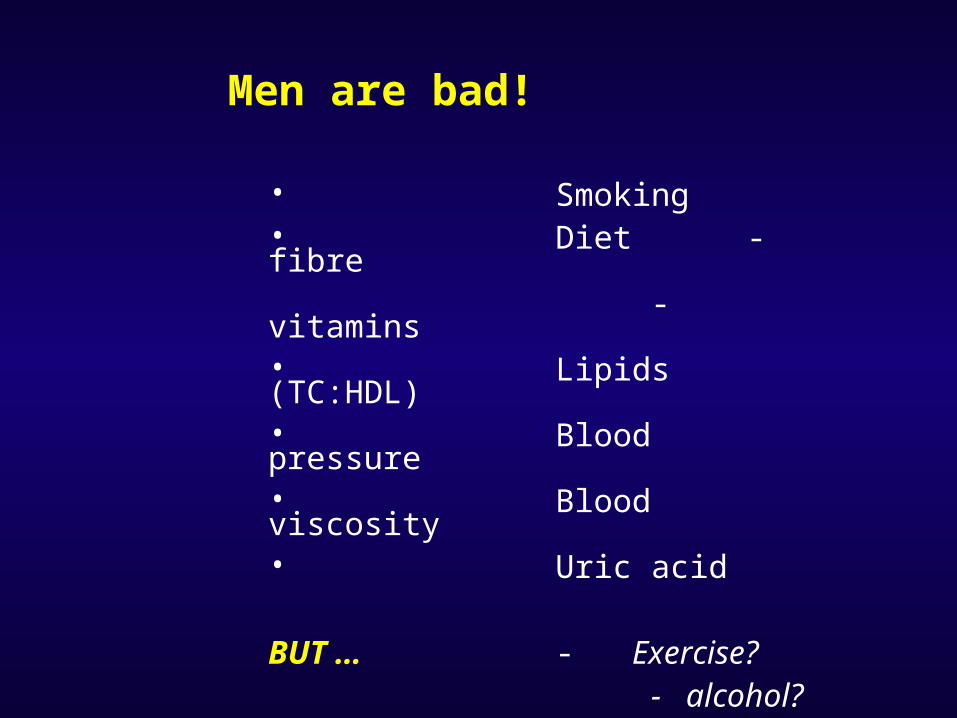
• Smoking• Diet - fibre - vitamins• Lipids (TC:HDL)• Blood pressure• Blood viscosity• Uric acid
BUT … - Exercise?- alcohol?-
fibrinogen?
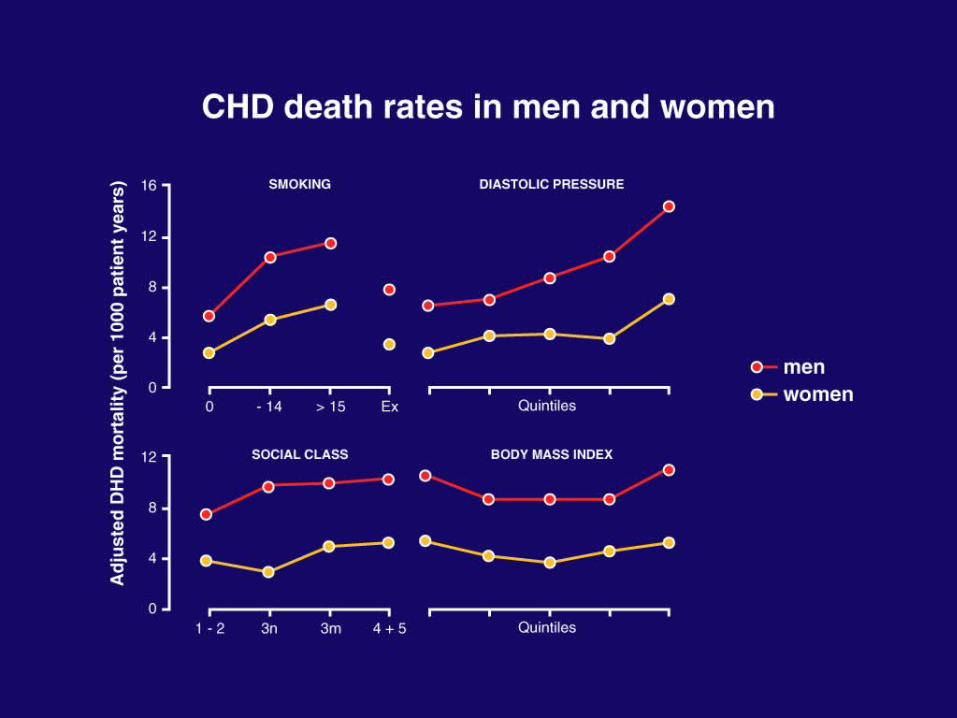
Men are bad!

Nondiabetic women
Nondiabetic men
Diabetic men
Diabetic women

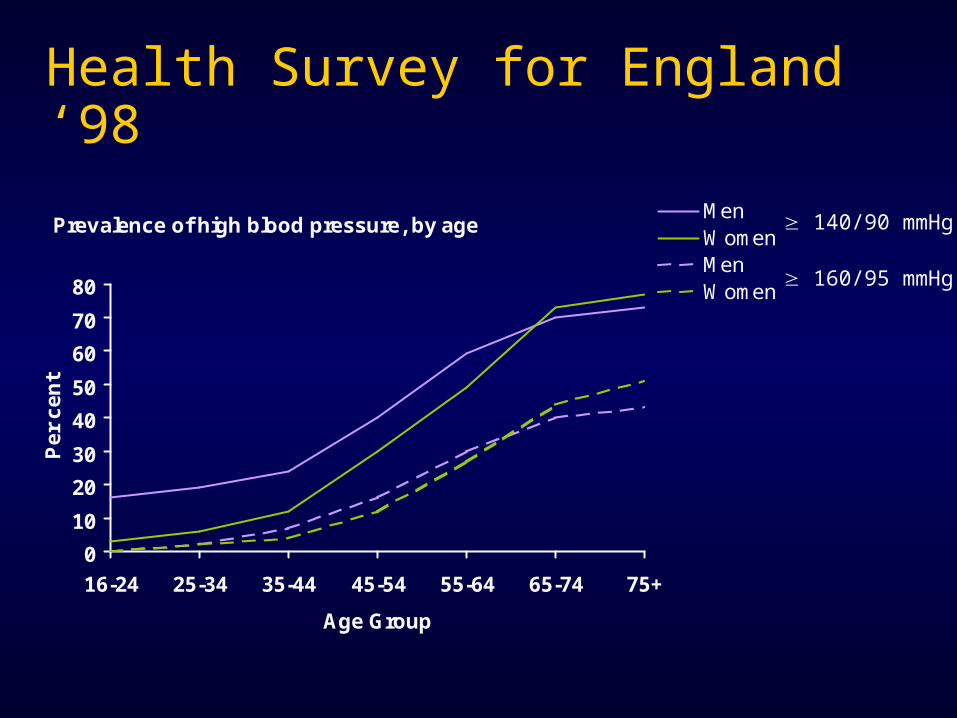
Health Survey for England ‘98
Prevalence of high blood pressure, by age
0
10
20
30
40
50
60
70
80
16-24 25-34 35-44 45-54 55-64 65-74 75+
Age Group
Pe
r c
en
t
MenWomenMenWomen
140/90 mmHg
160/95 mmHg
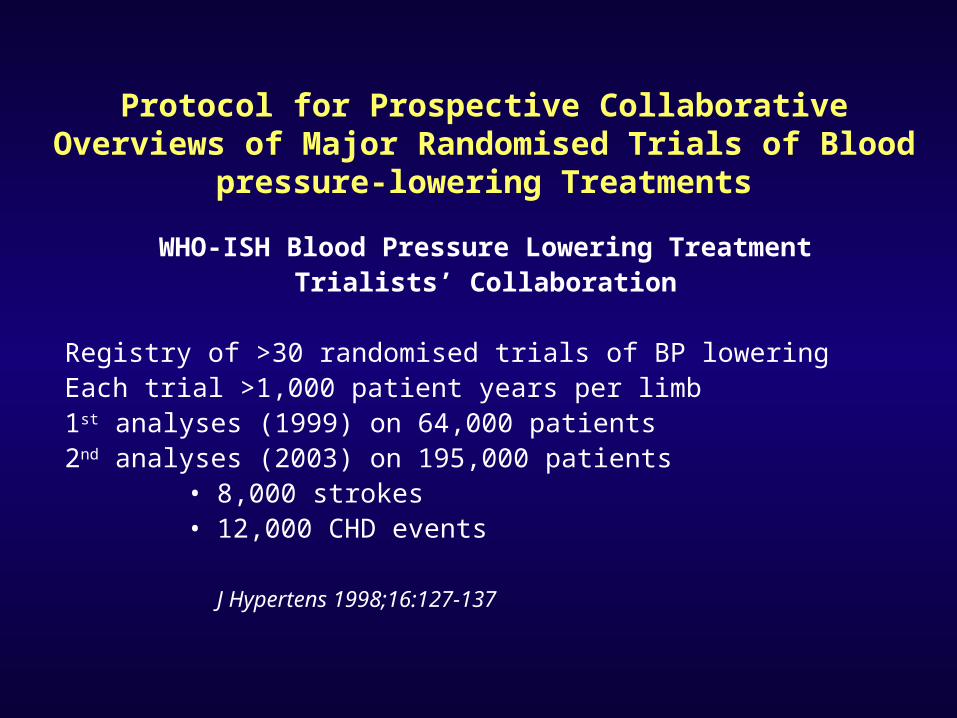
Protocol for Prospective Collaborative Overviews of Major Randomised Trials of Blood pressure-lowering
Treatments
WHO-ISH Blood Pressure Lowering TreatmentTrialists’ Collaboration
Registry of >30 randomised trials of BP loweringEach trial >1,000 patient years per limb1st analyses (1999) on 64,000 patients2nd analyses (2003) on 195,000 patients
• 8,000 strokes• 12,000 CHD events
J Hypertens 1998;16:127-137

ACE-I and CCB’S vs DIURETIC/-BLOCKER
OR (95%CI)
End point ACE-I CCB
Stroke 1.05 0.87 (0.77-0.98)
CHD 1.00 1.12 (1.00-1.26)
Ht failure 0.92 1.12 (0.95-1.33)
Major CV events 1.00 1.02
CV death 1.00 1.05
Total death 1.03 1.01

MORE vs LESS BP LOWERING*
End point OR (95% CI)
Stroke 0.80
CHD 0.81
Ht Failure 0.78 (0.53-1.15)
Major CV events 0.85
CV death 0.90 (0.75-1.09)
Total death 0.97 (0.85-1.11)
* HOT: UKPDS: ABCD

“Therefore, achieved blood pressure, not choice of initial therapy, should be the over-riding concern of clinicians treating hypertension”
Brown, Lancet 2001

Blood Pressure Lowering Treatment Trialists’ CollaborationSecond cycle of overview analyses
Institutefor
InternationalHealth

Similar net effects on total cardio-vascular events of: ACE inhibitors Calcium antagonists Diuretics/beta-blockers
ARBs also effective in reducing total cardiovascular events
Conclusions I

Size of blood pressure difference between randomised groups closely associated with reduction in risk (except for heart failure)
Size of blood pressure reduction appears to be a more important determinant of outcome than drug choice
Conclusions III

Study design
atenolol ± bendroflumethiazide
amlodipine ± perindopril
19,257 hypertensive
patients
PROBE design
ASCOT-BPLA
Investigator-led, multinational randomised controlled trial
placeboatorvastatin 10 mg Double-blind
ASCOT-LLA10,305 patients
TC ≤ 6.5 mmol/L (250 mg/dL)

Summary of all end points
The area of the blue square is proportional to the amount of statistical information
Amlodipine perindopril better Atenolol thiazide better0.50 0.70 1.00 1.45
Primary Non-fatal MI (incl silent) + fatal CHD
SecondaryNon-fatal MI (exc. Silent) +fatal CHDTotal coronary end pointTotal CV event and proceduresAll-cause mortalityCardiovascular mortalityFatal and non-fatal strokeFatal and non-fatal heart failure
Tertiary Silent MIUnstable anginaChronic stable anginaPeripheral arterial diseaseLife-threatening arrhythmiasNew-onset diabetes mellitusNew-onset renal impairment
Post hoc Primary end point + coronary revasc procsCV death + MI + stroke
2.00
Unadjusted Hazard ratio (95% CI)
0.90 (0.79-1.02)
0.87 (0.76-1.00)0.87 (0.79-0.96)0.84 (0.78-0.90)0.89 (0.81-0.99)0.76 (0.65-0.90)0.77 (0.66-0.89)0.84 (0.66-1.05)
1.27 (0.80-2.00)0.68 (0.51-0.92)0.98 (0.81-1.19)0.65 (0.52-0.81)1.07 (0.62-1.85)0.70 (0.63-.078)0.85 (0.75-0.97)
0.86 (0.77-0.96)0.84 (0.76-0.92)

Total CV events and procedures among subgroups
0.60 0.70 0.80 0.90 1.00 1.50Amlodipine perindopril better Atenolol thiazide better
DiabetesNo diabetes
Current smokerNon-current smoker
ObeseNon-obese
Older (>60 years)Younger (≤60 years)
FemaleMale
LVH according to ECG or ECHONo LVH according to ECG or ECHO
Previous vascular diseaseNo previous vascular disease
Renal dysfunctionNo renal dysfunction
With metabolic syndromeWithout metabolic syndrome
All patients
p value
0.0283<0.0001
0.00010.0030
0.0162<0.0001
<0.00010.0227
0.00150.0001
0.0056<0.0001
0.00190.0001
<0.00010.0055
0.00150.0002
<0.0001
Heterogeneity p
0.5205
0.1138
0.6753
0.7816
0.2889
0.6364
0.4863
0.7130
0.9417
The area of the blue square is proportional to the amount of statistical information


Landmark statin trials: effect of therapy on clinical events
Shepherd JM. N Engl J Med 1995;333:1301–1307. Downs JR. JAMA 1998;279:1615–1622. Sever. Lancet 2003;361:1149–1158. HPS Group. Lancet 2002;360:7–22. 4S Group. Lancet 1994;344:1383–1389. Sacks FM. N Engl J Med 1996;335:1001–1009. LIPID Group. N Engl J Med 1998;339:1349–1357.
Primary PreventionWOSCOPSAFCAPS/TexCAPS
ASCOT
4.95.2
3.3
MI+CHD death MI+CHD death+ unstable angina
MI+CHD death
3136
36
StudyBaseline
LDL*Ending LDL*
Years of follow-
up
1° Efficacy parameter
RR reduction
(%)
Primary/Secondary PreventionHPS 5.0 MI+CHD death 24
Secondary Prevention4SCARELIPID
5.4
5.0
6.1
Total mortality
MI+CHD death CHD death
30
24
24
5.0 (192)
3.9 (150)
3.4 (131)
3.4 (131)
4.9 (188)
3.6 (139)
3.9 (150)
3.7 (142)
3.0 (115)
2.3 (90)
2.7 (104)
3.2 (122)
2.5 (98)
2.9 (112)
*mmol/L (mg/dL)

Event rates plotted against LDL cholesterol levels during statin therapy in secondary-prevention studies
Efficacy and safety of cholesterol-lowering treatment: prospective meta-analysis of data from 90 056 participants in 14 randomised trials
Cholesterol Treatment Trialists’ (CTT) Collaborators
Lancet 2005;366:1267-1278


Proportional effects on major CV events/ mmol/L of LDL reduction
Events
Rx Control HR (95% CI)
Men
Women
5097
1257
6504
1490
0.78 (0.75-0.81)
0.83 (0.76-0.91)
CTT Collaboration, Lancet 2005

Study design
atenolol ± bendroflumethiazide
amlodipine ± perindopril
19,257 hypertensive
patients
PROBE design
ASCOT-BPLA
Investigator-led, multinational randomised controlled trial
placeboatorvastatin 10 mg Double-blind
ASCOT-LLA10,305 patients
TC ≤ 6.5 mmol/L (250 mg/dL)
0
1
2
3
4
0.0 0.5 1.0 1.5 2.0 2.5 3.0 3.5
Years
Cu
mu
lati
ve
Inc
ide
nc
e (
%)
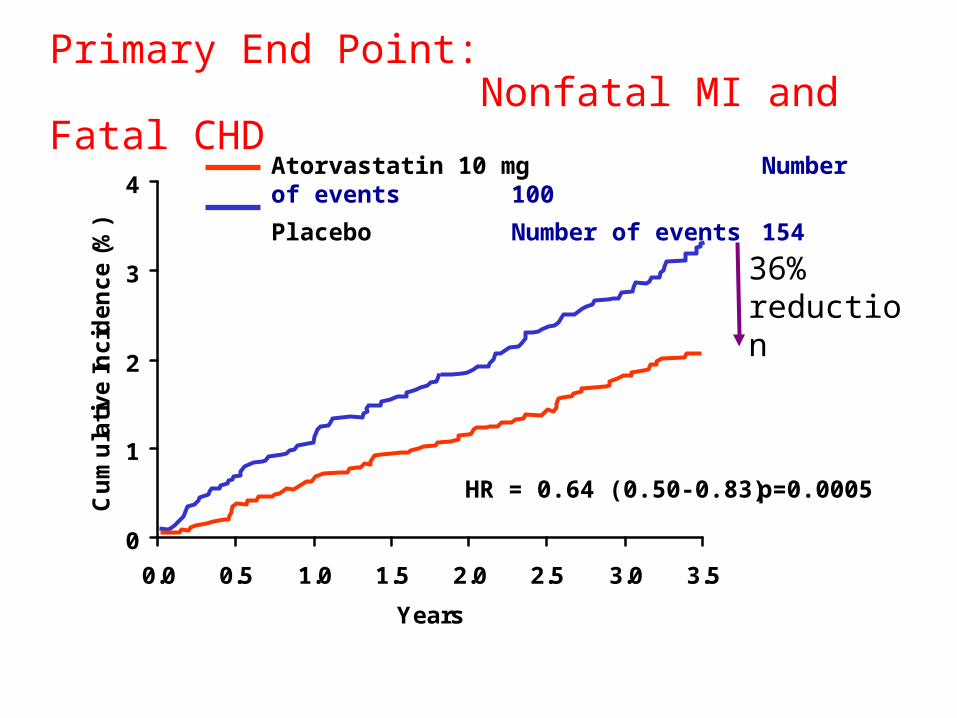
36% reduction
Primary End Point: Nonfatal MI and Fatal CHD
HR = 0.64 (0.50-0.83)
Atorvastatin 10 mg Number of events 100
Placebo Number of events 154
p=0.0005

Prespecified Subgroups: Primary End Point
Area of squares is proportional to the amount of statistical information
0.84 (0.55-1.29)0.56 (0.41-0.77)0.56 (0.37-0.85)0.70 (0.51-0.96)0.59 (0.39-0.90)0.67 (0.49-0.92)0.67 (0.35-1.29)0.64 (0.49-0.84)0.64 (0.47-0.86)0.66 (0.41-1.06)1.10 (0.57-2.12)0.59 (0.44-0.77)0.80 (0.45-1.42)0.61 (0.46-0.81)0.61 (0.44-0.84)0.70 (0.47-1.04)0.77 (0.52-1.12)0.56 (0.40-0.79)
0.64 (0.50-0.83)
Hazard Ratio
DiabetesNondiabetesCurrent smokerNoncurrent smokerObeseNonobeseLVHNo LVHOlder (>60 years)Younger (≤60 years)FemaleMalePrevious vascular diseaseNo previous vascular diseaseRenal dysfunctionNo renal dysfunctionWith metabolic syndromeWithout metabolic syndrome
All patients
0.5 1.0 1.5
Atorvastatin better Placebo better
Risk Ratio
Sever PS, et al. Lancet. 2003;361:1149-1158.

DiabetesNondiabetesCurrent smokerNoncurrent smokerObeseNonobeseLVHNo LVHOlder (>60 years)Younger (≤60 years)FemaleMalePrevious vascular diseaseNo previous vascular diseaseRenal dysfunctionNo renal dysfunctionWith metabolic syndromeWithout metabolic syndrome
All patients
0.5 1.0 1.5
Atorvastatin better Placebo better
Subgroups: Total CV Events and Procedures
Area of squares is proportional to the amount of statistical information
Risk Ratio

HSE Lipids 2003: Treatment and control in subgroups
Treatment * Control * ≠
Subgroup M F M F
CHD or stroke: Hx 71.1 55.8 51.7 28.8
Hypertension 32.7 22.4 22.9 11.1
Diabetes 50.9 50.0 33.3 31.9
* Among those with TC >5 mmol/l or on Rx
≠ <5.0 mmol/l

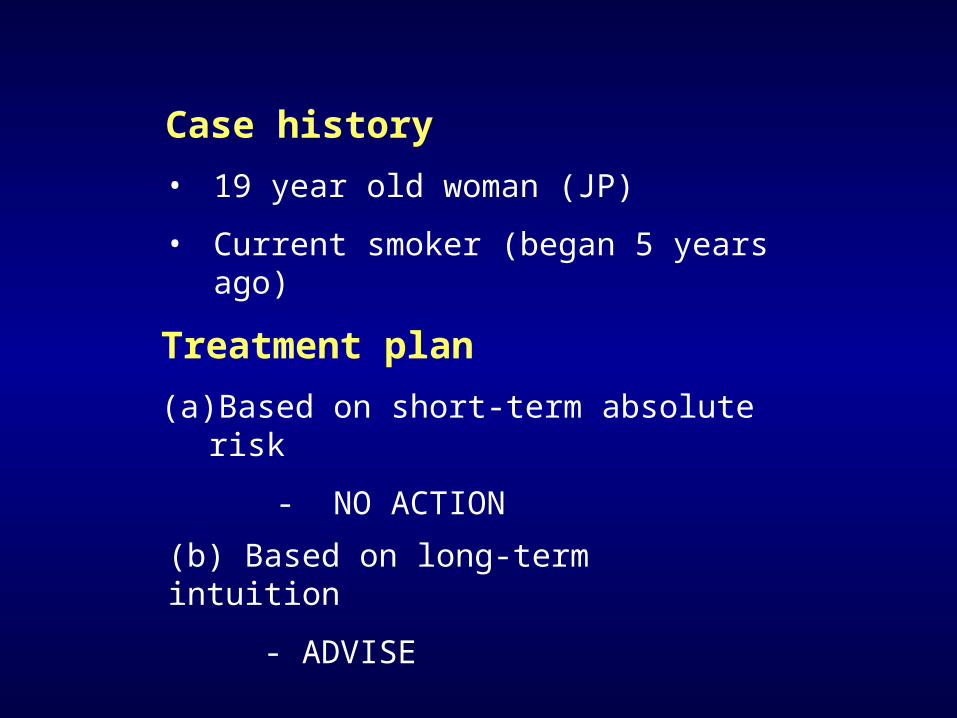
Case history
• 19 year old woman (JP)
• Current smoker (began 5 years ago)
Treatment plan
(a) Based on short-term absolute risk
- NO ACTION
(b) Based on long-term intuition
- ADVISE
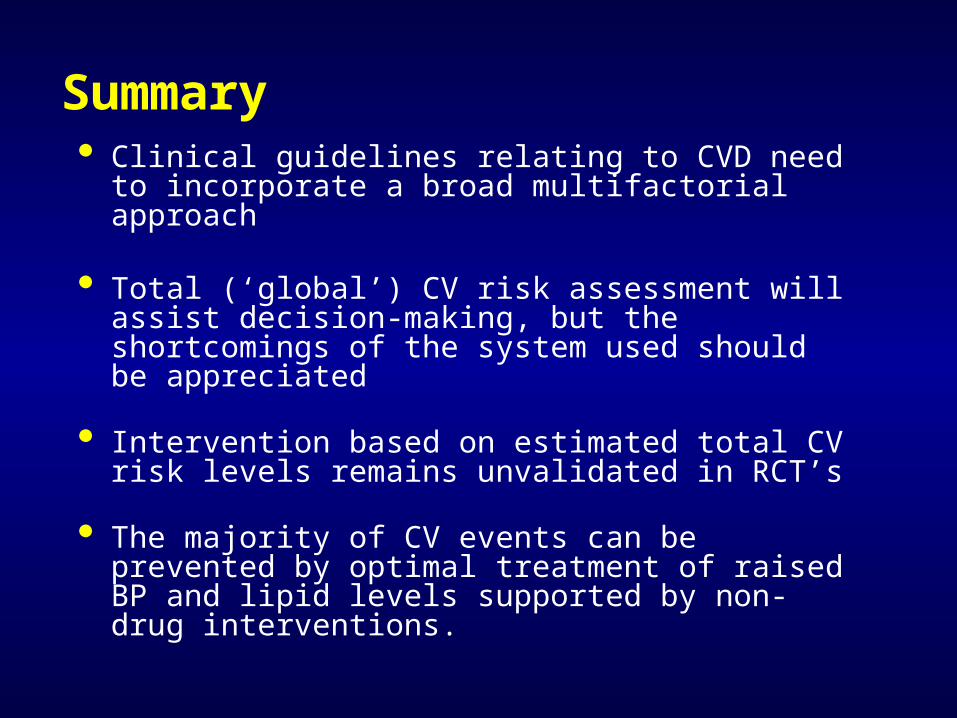
Summary Clinical guidelines relating to CVD need to
incorporate a broad multifactorial approach
Total (‘global’) CV risk assessment will assist decision-making, but the shortcomings of the system used should be appreciated
Intervention based on estimated total CV risk levels remains unvalidated in RCT’s
The majority of CV events can be prevented by optimal treatment of raised BP and lipid levels supported by non-drug interventions.

Should there be gender differences when treating raised blood pressure and cholesterol?
1. If treatment is based on estimated CV risk More man will be treated
2. For the same level of CV risk women benefit as much as men