should top universities be led by top researchers and are they?
TRANSCRIPT

Should Top Universities be Led by Top Researchers and Are They
Amanda H Goodall Warwick Business School
University of Warwick1
Abstract
If the best universities in the world
who have the widest choice of candidates
systematically appoint top researchers as their vice chancellors and presidents is this one form of evidence that on average better researchers make better leaders This paper addresses the first part of the question are they currently appointing distinguished scholars The study documents a positive correlation between the lifetime citations of a university s president and the position of that university in a world ranking The lifetime citations are counted by hand of the leaders of the top 100 universities identified by the Institute of Higher Education at Shanghai Jiao Tong University in their Academic Ranking of World Universities (2004) These numbers are then normalised by adjusting for the different citation conventions across academic disciplines The results are not driven by outliers
Journal of Documentation Volume 62 No 3 (2006)
I am grateful for valuable discussions to Gary Becker David Blanchflower Sara Brailsford Gordon Brown Alison Browning Richard Chait Kim Clark Rafael Di Tella Richard Easterlin Daniel Gilbert John Glier Philip Goodall Amy Gutmann Daniel Hamermesh Alma Harris Patrick Harker Jean Hartley John Heilbron Jeremy Knowles Hermon Leonard Stephen Machin James March Robin Naylor Brendan O Leary Charles Oppenheim Andrew Oswald Andrew Parker Henry Rosovsky Stephen Sharp Lawrence Summers Paul Stoneman William Taylor Howard Thomas Steve Weiland Gareth Williams and David Wilson
1 Email amandaamandagoodallcom wwwamandagoodallcom
1
Should Top Universities be Led by Top Researchers and Are They
Introduction
This paper is a study of universities and those who lead them It appears to be the first of its kind Although there is a large academic literature on leadership there has been little statistical thinking about presidents of universities2
The paper is interested in the question should research universities be led by top researchers It is explored empirically by examining what the world s universities actually do If the best universities -- who arguably have the widest choice of candidates -- systematically appoint top researchers as their presidents this could be one form of evidence that on average better researchers may make better presidents Economists would call this a revealed preference argument
When looking at the individuals who lead the world s top 100 universities it is possible to find both a handful of Nobel Prize winners and a handful of leaders with few or no research citations It might be thought from this fact that there is no systematic link between research output and university leadership Yet there is a pattern This paper uncovers a correlation between the research background of a leader and the position of their university in a world league table
Why is this question important
First around the world interest in university leadership and governance has grown as universities have become increasingly competitive and global Major changes have taken place in universities and subsequently in the role and responsibilities of their leaders (These have been documented in Bargh et al 2000 Bok 2003 Tierney 2004 among others) It seems valuable to understand successful leadership in these times
Second given the centrality of research performance in many university mission statements -- expressed through the quality of research produced the research eminence of staff and the concomitant income they generate -- it is logical to turn to the research background of their presidents The first question addressed in this paper through statistical tests using Pearson s correlation coefficient and Spearman s rho is to ask whether the world s top universities currently appoint top researchers to the position of president Possible interpretations are discussed after the results are presented
Finally the emphasis in this study is on the world s leading research universities This group has been chosen because it is important to understand the actions of successful organisations But it is also significant to note that the majority of these universities are based in the United States Much has been talked of in the press about issues of brain-drain (see for example Time Magazine March 15 2005) as faculty from Europe Asia
2 President is used here to denote the executive leader of a university The term is used to include principal vice chancellor rector director among others
2
and beyond move to the US Given the likely significance of universities to an economy if many top academics leave their home country this might be a cause for concern The role of research universities is currently receiving attention in Europe The European Parliament has created the Lisbon Agenda outlining goals to make the European Union the most competitive and dynamic knowledge-driven economy by 2010 (European Parliament March 2002) In Germany the Social Democratic Party recently announced a plan to spend 19 billion Euros to develop 10 elite universities that can compete with the world s best (April 9 2005 DW-Worldde) In 2002 a group of top universities in Europe founded the League of European Research Universities (LERU) On their website it states LERU acknowledges that Europe has lost its pre-eminent position in basic research (wwwleruorg)
Methodology
This paper focuses on one set of variables or characteristics namely the lifetime citations of presidents This score is used here as a measure of how research-active and successful a president has been in his or her academic career The lifetime citation score of presidents is normalised in this study to adjust for different disciplinary conventions
The university ranking used in this study has been produced by the Institute of Higher Education at Shanghai Jiao Tong University in their Academic Ranking of World Universities (2004) (See Appendix 1 for the full list of 100 universities) As is explained below this is probably the most reliable league table available
Citations
Citations are references to authors in other academic papers as acknowledgement of their contribution to a specific research area Citation information used in this study comes from Web of Science the on-line database comprising the Science Citation Index Social Science Citation Index and the Arts and Humanities Citation Index
Data on the presidents of the world s top 100 universities identified as shown below were collected between mid October and early December 2004 Only those presidents in post during this period are included and to the author s knowledge no presidents changed during this 3 month period Biographical information came from university web sites though direct requests for CVs were made on occasion Each president s lifetime citations were counted by hand
Most important when using citations as any kind of measure is recognition of the huge differences between disciplines For example a highly cited social scientist might have a lifetime citation score of around 5000 whereas a molecular biologist could have a score over 20000 Bibliometric indicators have been used more consistently across the sciences than in the humanities and social sciences Such use is most evident in the natural and life sciences though less so in engineering and the behavioural sciences (van Raan 2003) These disciplines publish more journal articles and have a higher prevalence of co-authorship
3
The social sciences are patchier For example economics relies heavily on journal articles though unlike the science publications that tend to publish quickly in economics it can take up to two years from acceptance for publication of a journal article to appear (Hamermesh 1994) Writing articles for journals is less common in the arts and humanities These disciplines tend more towards publishing monographs Cronin et al (1997) found that in the discipline of sociology two distinct groups of highly cited academics co-existed -- those highly cited through journal articles and those through monographs This should not present a problem here because citations from both books and journals have been counted
ISI has created a Highly Cited (ISI HiCi) category that identifies approximately the top 250 academic researchers (depending on discipline) across 21 broad subject areas They are dominated by science subjects totalling 19 The social sciences are also covered but there are only two social science subject areas namely Economics and Business and Social Sciences - General Currently no Highly Cited category exists for authors in the arts or humanities
The discrepancies in citation levels across disciplines are demonstrated in the number of new cited references that appear in ISI every week The sciences generate approximately 350000 new cited references weekly the social sciences 50000 and the humanities 15000
Using citation thresholds produced by ISI HiCi a normalised citation score has been produced in this paper for 23 subject areas (see next section and Appendix 2) These include a score for the humanities that has been generated for the purposes of this study It is necessary to note that the discipline of law is classified in ISI as being in the social sciences not the humanities It is included here in the Social Sciences - General category
In this paper each university president is assigned a normalised citation score which reflects both the differences across disciplines and their personal citation levels This score is referred to as the P-score = president s individual lifetime citation score normalised for discipline The P-score has been generated by using a scale produced by ISI HiCi It has been used here as an exchange rate normalising the different citation conventions across disciplines Each president s lifetime citation score has then been divided by their subject score The normalised P-score produced through this process makes it possible to do like-for-like comparisons between individuals from different disciplines
Substantial effort has been made to try to accurately assign citation numbers to people s names Though some measurement error must be presumed two studies that adopt different counting methods -- Seng and Willett (1995) who use a very precise method on the one hand and Oppenheim (1995) who assigned citations more approximately on the other -- both report very similar correlations
Van Raan (1998 2003 2005) has raised areas for concern when using citations as measures of quality He suggests that citation indices have become easy tools for policy makers and university administrators keen to make quick assessments of individual research output and quality (2005) Wouters (1999) points out that the ISI system was designed to retrieve information not evaluate it
4
Self-citing is a potential problem that can take two forms first over-citing one s own work in academic papers and second self-citation in journals to try to raise the journal impact factor An example of this is raised by Fassoulaki et al (2000) where authors report a significant correlation between self-citation levels and journal impact scores in the 1995 and 1996 issues of six anaesthesia journals
Other possible difficulties with citations include inconsistencies in methods of referencing and inaccuracies in citation statistics (Moed 2002 King 2004) Finally monopoly concerns have been raised about over-reliance on the Web of Science (Weingart 2003 2004)
Language biases have been shown to exist within ISI (van Leeuwen et al 2001) though it is now considered to be less of a problem because most journals publish in English (King 2004) King suggests that preferential referencing may take place in the US (ie that Americans are more likely to reference Americans) partially a feature of the size of that nation s output To try to circumvent this separate analyses of US data are offered below
Although van Raan (2005) notes the weaknesses of bibliometric measures he also argues that citations are a good indicator of performance over long periods of time His preference for evaluating science is to couple peer review with bibliometric analysis King (2004) suggests that citations are the most reliable measure of research quality and output In a feature in the journal Nature King uses the ISI citation index to measure the quantity and quality of science across different nations (2004)
There have been a number of studies comparing the UK s Research Assessment Exercise (RAE) results with bibliometric measures Oppenheim (1997) uses ISI data to compare 1992 RAE results with citation indicators in three subject areas anatomy genetics and archaeology He finds a strong correlation between the two methods of assessment and notes that in archaeology there is a greater reliance on monographic literature Norris and Oppenheim (2003) replicate this study with the same results following the 2001 RAE Smith and Eysenck (2002) discover a similar correlation across all UK psychology departments in the 2001 RAE
Normalising citations to produce P-scores
To obtain a P-score the individual presidential citations were divided by the ISI Highly Cited disciplinary thresholds (see Appendix 2) The threshold dates correspond to the dates the data were collected within a month The subject thresholds are being used here as an exchange rate for assessing different citation conventions
The humanities score was created by the author using the new cited references generated by ISI each week Corresponding with the data collection dates as closely as possible the sciences approximated at 350000 new cited references weekly the social sciences 50000 and the humanities 15000 If we divide the social science weekly score of 50000 by the humanities 15000 we get a figure of 333 The author has then divided the Social Sciences General score of 117 (see Appendix 2) by 333 which creates a score of 3513 The number 35 has been used here as the Humanities General score
5
League tables
As higher education has become global in the recruitment of international students and staff so have league tables International tables have existed for a number of years in areas such as business education through the Financial Times In 2003 the first global league table of universities was produced by the Institute of Education in Shanghai at Jiao Tong University (SJTU) SJTU used a process of inviting comment through their website to make adjustments to their methodology for the 2004 table
The UK based Times Higher Education Supplement (THES) produced a global ranking in November 2004 (wwwthescouk) which has not been used in this study There are three main problems with the league table First 50 weight is assigned to a subjective peer-review process where 1300 academics across 88 countries are invited to name the top institutions in their geographic area and their academic field This is the largest component in the ranking yet there is no information available on the background of these global academics That is a concern For example how might an individual s choice have been influenced by their own place of education sabbatical leave or co-authorship and so on Second 10 weight is given for the international nature of an institution s student body and staff However there is little explanation about why international is a proxy for high quality Finally because the THES is a commercial organisation it is not possible to access the data or check the calculations
An advantage of the SJTU table is that it is not produced by a newspaper or magazine Media-generated league tables are ubiquitous and controversial Tables such as those in The Times and US News and World Report in the US offer information to potential students across a range of criteria Media-driven league tables may be useful heuristic devices for students but as objective tools of assessment of university quality they are unreliable Perhaps the main criticism is that they are produced by commercial organisations designed to make money by selling their publications Therefore a headline is required To generate a story the methodology is changed often annually which ensures that institutions at the top rotate (Lombardi et al 2002) Lombardi and colleagues suggest instead that in the US university positions actually change very little each year if a fixed method of analysis is used (2002)
The Center for Studies in the Humanities and Social Sciences (wwwthecenterufledu ) was created as a non-profit organisation in 1998 in the United States Its mission is to develop methods for measuring and improving university performance For a number of years TheCenter has produced an alternative ranking The Top American Research Universities (Lombardi et al 2003)
This ranking differs from media equivalents because actual numbered positions are not assigned Instead universities are assessed on nine separate measures Those that score highly in at least one of the nine measures are put into a 1-25 top research university category3
3 The measures include total research federal research endowment assets annual giving national academy members faculty awards doctorates granted postdoctoral appointees and SAT scores Some degree of ranking does exist because they are ordered depending on the number of points they score across the nine categories So the top three universities score 9 out of 9 the next six universities score 8 out of 9 and so on
6
The measures of university quality used in both TheCenter and the SJTU world league tables do not exactly correspond However it is interesting to compare the number of US universities at the top in both tables TheCenter s top-25 category has 52 universities included Of these 44 also feature in the SJTU global table Positions 1-27 are exactly correlated in both rankings In other words these two rankings of top US universities are very similar
The Academic Ranking of World Universities (2004) league table uses 6 different criteria to assess universities The table below comes from the SJTU web site
Table 1 Methodology used in SJTU ranking 2004
Criteria
Indicator Code
Weight
Quality of Education
Alumni of an institution winning Nobel Prizes and Fields Medals
Alumni
10
Staff of an institution winning Nobel Prizes and Fields Medals
Award
20 Quality of Faculty
Highly cited researchers in 21 broad subject categories
HiCi 20
Articles published in Nature and Science
NampS 20 Research
Output Articles in Science Citation Index-expanded and Social Science Citation Index
SCI 20
Size of Institution
Academic performance with respect to the size of an institution
Size 10
Total 100
Copyright copy 2004 Institute of Higher Education Shanghai Jiao Tong University
For institutions specialized in humanities and social sciences such as London School of Economics NampS is not considered and the weight of NampS is relocated to other indicators
There are arguably some weaknesses in the SJTU methodology First younger universities stand to lose out particularly in the first category that assigns weight (10) to alumni awards Second the humanities and the social sciences are weakly represented here -- though SJTU have done some adjustment for this There are no ISI HiCi s in the arts and humanities and far fewer in the social sciences The Awards category is also limited Nobel Prizes are only given for achievement in physics chemistry medicinephysiology economics literature and peace and Fields Medals only for mathematics
7
Data on the 100 university presidents
It is important to note that the world league table ranks institutions by assigning points (as per criteria above) This can result in two or more institutions being given the same position (see the full list in Appendix 1)
The universities in the top-100 table are dominated by the United States where 51 of the institutions are located As can be seen in Figure 1 US institutions are unevenly spread across the world s top 100 dominating the top 20 with 17 universities and with 30 in the top 40 Of the 100 total only 4 in the bottom 20 are US-based If we treat American states as individual nations California with a population of 36 million has the highest number of leading universities Ten Californian institutions are within the top 55 6 of these are in the top 20 and 7 of the 10 are public or state universities
Thirty-seven institutions out of 100 are located in European countries Of these 11 are in the United Kingdom 7 in Germany 4 in both France and Sweden 3 in Switzerland 2 in the Netherlands and 1 each in Austria Denmark Finland Norway Italy and Russia Finally among the top 100 there are 12 universities in the rest of the world -- 5 in Japan 4 in Canada 2 in Australia and 1 in Israel
The nation location of an institution is not always reflected in the nationality of its president For example the top 10 universities are found in two countries -- US (8) and UK (2) whereas the leaders come from four -- Canada New Zealand UK and the US There are 15 female presidents in the sample Six are in the top 20 universities and 10 are within the top 50 North America dominates with 9 US female presidents and 2 in Canada The remaining four are in Denmark France Sweden and the UK
Every president in the group of 100 universities has a PhD The majority have been academics though two presidents spent most of their careers in non-research positions in industry or government and a small group went almost directly into academic administration
The age of a president potentially affects his or her lifetime citation levels The older they are the greater the opportunity to accrue citations It is therefore necessary to check whether presidents with the highest levels of lifetime citations are in fact older than those with fewer citations Some European universities still publish date of birth information though they are in the minority Birth dates can be loosely calculated by using individuals age at graduation from first degree Using this method it is possible to compare the ages of presidents at the top and bottom of the top-100 global league table If it is shown that the top presidents are markedly older than those in the bottom 20 then adjustment of citation scores would be necessary
The ages of only 80 of presidents in the top 20 universities and 80 of presidents in the bottom 20 could be obtained The mean age of presidents in the top 20 universities is 58 years In the bottom 20 category the mean age of president is 60 Because of the closeness in age between these two groups and in particular the slightly older average age of the lowest quintile citation scores have not been adjusted
Figure 2 displays the disciplinary background of the presidents What is noticeable is the evenness of disciplinary spread across each quintile Of the 100 presidents 52 have a
8
scientific background The scientists are dominated by the life sciences at 50 but there are also 11 engineers 6 physicists 5 chemists and 4 computer scientists
Thirty-seven of the 100 presidents are social scientists The largest disciplinary group among the social scientists is that of lawyers who number 15 Within a second group of 16 there is an even spread of educationalists political scientists sociologists and those from public and social policy Finally there are 6 economists
Eleven presidents are from the arts and humanities This group is noticeably smaller Taylor (1986) documents the disciplinary distribution amongst vice chancellors and principals in the UK in 1986 He also cites earlier work by Collison and Millen (1969) who showed that in the UK between 1935 and 1967 the proportion of presidents from the arts declined from 68 to 48 while scientists rose from 19 to 41 Taylor then reports his own findings that by 1981 67 of vice chancellors and principals were scientists 13 from the social sciences and less than 20 were from the arts Cohen and March (1974) showed a similar pattern -- in the number of presidents from the arts - for the US between 1924 and 1969
In a study by Dolton and Ma (2001) on CEO Pay the disciplinary backgrounds of UK vice chancellors are reported Drawn from a wide cross-section of British universities (including Oxbridge civic universities former colleges of advanced technology among others) they note that VCs in position in 1999 included 3 lawyers 13 engineers scientists made up 25 social sciences including business 36 and finally VCs from the arts and humanities made up 13 10 were reported as being non-academics
Of the 100 presidents in the current paper s sample 12 are ISI Highly Cited (HiCi) academics These individuals are more common in the top universities Of the 12 presidents in HiCi 6 are in the top 20 group of universities 3 in the next 20 2 in the next and 1 in the fourth quartile Finally there are 3 Nobel Prize winners among the presidents (all in medicine) -- two in the top 20 and one in the 20-40 category
The distribution of citations across the 100 presidents fits Lotka s Law an application that is often used in bibliometric research Lotka (1926) describes the frequency of publication by authors in a given field As can be observed in Figure 3 using presidents P-scores a version of this law applies here Lotka s power law predicts that of all the authors in a specific field approximately 60 percent will publish just one article 15 percent will have two publications 7 percent of authors will publish three pieces and so on (Potter 1988) According to Lotkas Law of scientific productivity only 6 percent of the authors in a field will produce more than 10 articles (the number making n contributions is about 1nsup2 of those making one) This law is most accurate when applied over long periods of time and to large bodies of work -- for example individuals lifetime citations
The results
As outlined above the 100 presidents lifetime citations are represented by a normalised P-score
The individual citation scores of the 100 presidents before adjustment range from 0 to 28718 The mean citation score is 2731 and the median is 371 After adjusting for discipline the highest P-score is 37 points and the lowest is 0 The mean P-score is 603
9
and the median is 227 When the group of 100 is split into two the top leaders of the 50 universities have a mean P-score of 876 and a median of 457 and those in the bottom half of universities have a mean P-score of 330 and a median of 093 Of the total group of 100 presidents 4 have a citation score of zero
The results are presented here in scatter plots and cross tabulations - that are grouped into quintiles (the 1-20 group always refers to the top of the SJTU table and 1 equals Harvard)
The most highly ranked universities have leaders who are more highly cited Figure 4 shows this It gives a cross-sectional breakdown of P-score by university rank in quintiles This shows a monotonic decline in citation levels as the universities go down in world rank
The next step is to try to establish statistical significance The paper does this in two ways
A natural first approach is to test whether the rank ordering of one variable is correlated with the rank order of the second variable Spearman s rank correlation coefficient is an appropriate measure The highest P-score is ranked 1 and the lowest P-score is ranked100 The actual rank of presidents P-scores is then tested for a correlation against university rank
Using these data Spearman s rho is calculated at 0378 With 100 observations the associated 5 critical value for a two-tailed test is 0195 and at 1 it is 0254 which establishes that the correlation is statistially significant at conventional confidence levels
A second approach can be seen in Figure 5 which gives the distribution of the 100 individual P-scores by world university rank Using Pearson s coefficient (r) the degree of linear relationship between the rank of university and president s P-score can be examined For the data in Figure 5 Pearson s r is 0345 The 1 critical value on a two-tailed test is 0254 which means again that the relationship is statistically significant4 There continues to be a statistically significant relationship if the natural logarithm of P-score is used this can be seen in Figure 5a
This correlation between cites and university quality can also be seen amongst the sub-sample of female presidents though at 15 the group is small (Figure 6) It is also statistically significant at the 1 level The disciplinary breakdown of the 15 female presidents is 7 scientists 7 social scientists and 1 from the humanities One president is Highly Cited
US universities make up 51 out of the 100 The mean P-score for this US group is 807 with a median score of 486 which is higher than the world group mean of 603 and median of 227 There are 25 scientists 21 social scientists and 5 in the humanities Of the 12 Highly Cited presidents in total 9 are based in US universities though two of these are non-Americans -- 1 is from Canada and 1 from the UK who is also a Nobel Prize winner
4 It should be noted that there is evidence that the residuals are skewed
10
Figure 7 presents a scatter plot for the sample of US presidents Again there is a correlation between citation levels and (world) university position The correlation is significant at the 1 level
It is useful to note that university rank explains only 12 of the variance in leaders citations In other words there are many other explanatory factors that are not being measured here However these correlations are significant enough to warrant further investigation and discussion
Is the citation-rank correlation true for universities outside the US
So far we have identified a strong positive relationship between the citation levels of university presidents and the position of their institution within a ranking of 100 universities This association exists amongst the 100 presidents in total the female group and the 51 US presidents
The mean citation P-score for presidents in the 49 countries in the rest of the world is 391 with a median score of 107 This is below the 100-group mean P-score of 6 and it is half the US mean P-score of 8 Therefore US presidents are twice as cited as those in the rest of the world
In the rest of the world the presidents include 27 scientists 16 social scientists and 6 in the humanities There are 3 Highly Cited researchers in the group Two are from the Netherlands and one in Germany
Figure 8 shows there is no statistically significant correlation between citation levels and position of president across the 49 countries in the rest of the world
As can be seen in the data one of the differences between the top American universities and non-American universities is that the former choose leaders who are more highly cited
Outliers
It is important to ensure that the results from this study have not been unduly influenced by a small number of presidents with extremely high P-scores To do this two tests are available First we can return to Spearman s rho which puts an equal weight on each observation instead of assigning continuous values As has been pointed out above a statistically significant rank correlation has been established with a significance level better than 1
The second check on outliers is simply to delete the data used from the highest P-scores for the Pearson s test To do this the top 5 of P-scores all located within ranges 30 and 40 were withdrawn and the correlation re-tested with a result of 0297 With 95 observations the 5 critical value for a two-tailed test is 0200 and at 1 it is 0260 so the correlation remains
11
Possible interpretations
Data on world university rankings have only recently become available That universities with strongly research-intensive missions appoint as their presidents men and women with strong citation records does not appear to have been previously documented The data in this paper do not enable judgements to be made about the weight assigned by selection committees to the research records of presidential candidates as distinct for example from other criteria such as managerial expertise or entrepreneurship But the data do suggest that research universities look for candidates who fit institutional missions
Internationally active researchers lead the world s top universities On average the higher the university is in the global ranking the more highly cited is that institution s president There are of course exceptions Two universities from the Netherlands -- in positions 39 and 63 -- both have presidents who are Highly Cited (It is interesting to note that these are the only two universities in the top 100 from that country) And there are top universities led by presidents with few or no citations However these cases are in a minority
These findings show that in at least one area the top universities are making different choices from those lower in the global ranking What can we learn from this difference Why do those institutions at the top appoint former researchers to the role of president
There are a number of possible reasons for the correlation They include
Hypothesis 1 Better researchers make better leaders of research universities
It has been recognised in the literature that presidents need to learn particular skills to enable them to lead a university (Cohen and March 1974 Rosovsky 1991 Middlehurst 1993 Bargh et al 2000 among others) In the UK an organisation for training academic leaders has recently been established with government funding
Whilst the education and career background of academic leaders has attracted some interest (Cohen and March 1974 Taylor 1986 Bargh at al 2000 Dolton and Ma 2001) little specific attention has been given to the research background of presidents Yet many university websites make a great deal of the eminence of the president
It seems clear that better researchers will tend to have greater prestige within the hierarchy of the academy and presidents who are highly cited may therefore enjoy credibility and negotiating strength that extends beyond their own discipline Jeremy Knowles the former Dean of Harvard s Faculty of Arts and Sciences (from 1991 2002) said that he believed his own research record helped his position as dean because it gave him greater status and therefore negotiating power when dealing with eminent faculty (interview with author April 12 2005) This suggests that being a cited researcher is of symbolic importance
This message was repeated in an interview with Amy Gutmann President of the University of Pennsylvania who said that being a researcher sends a signal to the faculty that you the president share their scholarly values and general understanding of the culture of the academy (interview April 28 2005)
12
Being a successful research academic may also help in attracting faculty particularly stars to a university which has become a preoccupation the world over Having a president who is a distinguished researcher may enhance the appeal of an institution
Alternatively it may be that two separate components are involved when leading a research university namely managerial expertise and inherent knowledge The former pertains to having knowledge of generic functions such as finance and budgeting human resource management corporate governance among others Most presidents running top universities will have had experience in managerial positions -- running large laboratories as head of department or pro-vice chancellor Experienced managers can also be brought in to perform specialised administrative roles Thus a former UK university vice chancellor has suggested (in personal correspondence) that what matters is scholarship not just management -- that we should take management for granted
The term inherent knowledge is used here to suggest a specific knowledge of or insight into academe that is borne out of expertise gained through academic research It suggests that good researchers may bring something else to the role of leader -- a perspective and understanding directly linked to their past as a successful scholar
It is possible that inherent knowledge also helps leaders inform strategy-making For example it may be easier to interpret research trends and future intellectual directions But how easy is it for a highly cited chemist to assess a faculty member from information science or discern the future direction of modern languages One possibility is that faculty at the top of their fields can make a fair assessment about the quality of work produced by those in other fields by using the same mechanisms used generally in academia namely citation indices and peer review
Hypothesis 2 Top universities appoint good researchers for reasons relating to external factors such as PR and fundraising
It has been said that US presidents in top universities spend a great deal of time fundraising and subsequently that they are less involved with running the institution This is not the place to compare US presidential leadership with European rectors or British vice chancellors Briefly however the American system is unitary with the president at the head of the hierarchy Though the president reports to a powerful board of trustees he or she is ultimately in charge with a role similar to that of a chief executive officer Senior academic administrators in the US (deans provosts chairs of departments) are normally appointed not voted into position by faculty In short the US presidential system is recognised as giving greater authority and powers to university leaders when compared to other systems of higher education from Europe to Japan (Rosovsky 1991 Bargh et al 2000) This is particularly true of US private universities US publics on the other hand are more exposed to state government intervention
Amy Gutmann President of University of Pennsylvania was clear in an interview that she is centrally involved in making senior appointments and in deciding the overall strategic direction of the university Long term strategy is designed through a collaborative process involving the president and the deans and provosts that she appoints and whose work she oversees (April 28 2005)
13
Appointment committees may select high-profile academics as presidents for external reasons The alumni may be encouraged to give more generously Gaining greater media exposure for the institution may also be a motive Alternatively if the governing body of a university wants to push an institution in a different direction towards research it may consider appointing a good researcher to signal a change in the internal culture
Hypothesis 3 The correlation is explained through unobservable heterogeneity
This would mean that research talent is merely a proxy for leadership ability The positive relationship between presidents P-scores and university rank may actually be picking up a correlation between other variables For instance presidents who are good at research may just be good at everything This is the alternative to a cause-and-effect relationship
All correlations are potentially susceptible to this kind of criticism It seems implausible however that candidates research records do not play a part in their selection for headship of institutions with prominent research missions
Concluding comments
This study which seems to be the first of its kind finds a correlation between the citations of presidents and the positions of their universities in a world league table Better universities are run by better researchers
The statistical relationship is strong for the group of 100 universities as a whole and for the sub-samples of female presidents and US presidents On average one extra point on a president s adjusted citation score where scores run from zero for the least-cited president to a score of up to 40 for Highly Cited and Nobel-prize winning presidents is associated with ten extra places in the world s top-100 ranking of universities No statistically significant correlation is found however for the sub-sample of universities from the rest of the world
Simple quantitative research of this kind may offer insights into university leadership - insights that are particularly relevant to universities that want to compete for a position amongst the world s top research institutions The best universities which can choose from the widest pool are systematically selecting top researchers to lead them What do such researchers bring to the role of leader This paper posits that there are two central components involved in leading research universities managerial expertise and inherent knowledge It is suggested here that better researchers may have greater inherent knowledge about academe that in turn informs their role as leader A president s research background may also have symbolic value in that it sends out a signal about the values of that institution And finally being a reputed researcher may raise a leader s status within the academic community and enhance his or her powers of negotiation
However the paper notes that other interpretations of the data are possible One is that universities choose top researchers for reasons of prestige and to assist in fundraising This is probably true as a factor for selection though it is unlikely to be the sole function
14
of a president in a top institution Another is that research ability is simply a proxy for some other kind of talent that is useful to leaders
Causality cannot be established through these correlations The performance of a university has not been shown here to be linked to the actions of a president or vice chancellor whether highly cited or not However this type of study starts the process of understanding whether there may be benefits from appointing a researcher as president A further study is underway exploring causality
15
0
5
10
15
20
1 - 20 21 - 40 41 - 60 61 - 80 81 - 100
Figure 1 The cross-country distribution of the worlds top 100 universities
USA EuropeRest World
Num
ber
of u
nive
rsiti
es
University rank (1 is top)
0
5
10
15
20
25
0 - 20 21 - 40 41 - 60 61 - 80 81 - 100
Figure 2 The disciplines of the presidents of the worlds top universites
ScienceHumanitiesSocial science
Dis
cipl
ine
University rank
16
-1
0
1
2
3
4
5
05 1 15 2 25 3 35 4
Figure 3 The distribution of presidents lifetime citations follows Lotkas power law
Loga
rithm
of t
he n
umbe
r of
pre
side
nts
Logarithm of presidents P-scores
17
0
50
100
150
200
0-20 21-40 41-60 61-80 81-100
Figure 4 A cross-tabulation of presidents lifetime citation P-scores by world university rank
(in quintiles)
Pre
side
nts
P-s
core
University rank
18
-10
0
10
20
30
40
0 20 40 60 80 100
Figure 5 Presidents P-scores by rank among
the worlds top 100 universities
y = 11305 - 01047x R= 034479 P
resi
dent
s P
- sc
ore
University rank
-8
-6
-4
-2
0
2
4
0 20 40 60 80 100
Figure 5a Logarithm of presidents P-scores by university rank
y = 14413 - 0021876x R= 026413
Log
of p
resi
dent
s P
-sco
re
University rank
19
-5
0
5
10
15
20
0 20 40 60 80 100
Figure 6 Female presidents P-scores by university rank
y = 97036 - 012631x R= 069052
Pre
side
nts
P-s
core
University rank
-10
0
10
20
30
40
0 20 40 60 80 100
Figure 7 US presidents P-scores by university rank
y = 13492 - 013997x R= 037505
Pre
side
nts
P-s
core
University rank
20
-10
0
10
20
30
40
0 20 40 60 80 100
Figure 8 Presidents from the rest of the world P-scores by university rank
y = 61896 - 003646x R= 014019 P
resi
dent
s P
-sco
re
University rank
21
References
Bargh C Bocock J Scott P and Smith D (2000) University Leadership The Role of the Chief Executive Open University Press Buckingham
Bok D (2003) Universities in the Marketplace The commercialisation of Higher Education Princeton University Press New Jersey
Cohen MD and March JG (1974) Leadership and Ambiguity McGraw-Hill New York
Collison P and Millen J (1969) University chancellors vice chancellors and college principals A social profile Sociology Vol 3 No 1 pp 77-109
Cronin B Snyder H and Atkins H (1997) Comparative citation rankings of authors in monographic and journal literature a study of sociology Journal of Documentation Vol 53 No 3 pp 263-273
Dolton P and Ma A (2001) CEO Pay in the Public Sector The Case of Vice Chancellors in UK Universities Newcastle UK Working paper Newcastle University Discussion Papers in Economics
Fassoulaki A Paraskeva A Papilas K and Karabinis G (2000) Self-citations in six anaesthesia journals and their significance in determining the impact factor British Journal of Anaesthesia Vol 87 No 2 pp 266-269
Hamermesh DS (1994) Facts and Myths about Refereeing Journal of Economic Perspectives Vol 8 No 1 Winter pp 153-163
King DA (2004) The scientific impact of nations Nature Vol 430 pp 311-316
Lombardi JV Craig DD Capaldi ED and Gater DS (2002) The Top American Research Universities An Overview TheCenter Reports University of Florida Gainesville
Lombardi JV Craig DD Capaldi ED Reeves KR and Gater DS (2003) The Top American Research Universities TheCenter University of Florida Gainesville
Lotka AJ (1926) The Frequency Distribution of Scientific Productivity Journal of the Washington Academy of Sciences Vol 16 No12 pp 317-323
Middlehurst R (1993) Leading Academics Open University Press Buckingham
Moed HF (2002) The impact factors debate the ISI s uses and limits Nature Vol 415 pp 731-732
Norris M and Oppenheim C (2003) Citation counts and the Research Assessment Exercise V
Archaeology and the 2001 RAE Journal of Documentation Vol 59 No 6 pp 709-730
Oppenheim C (1995) The correlation between citation counts and the 1992 Research Assessment Exercise Ratings for British library and information science university departments Journal of Documentation Vol 51 pp 18-27
Oppenheim C (1997) The correlation between citation counts and the 1992 Research Assessment Exercise ratings for British research in genetics anatomy and archaeology Journal of Documentation Vol 53 No 5 pp 477-487
Potter W G (1988) Of Making Many Books There is No End Bibliometrics and Libraries The Journal of Academic Librarianship Vol14 pp 238a-238c
Rosovsky H (1991) The University An Owners Manual Norton New York
Seng LB amp Willett P (1995) The citedness of publications by United Kingdom library schools Journal of Information Science Vol 21 pp 68-71
Smith A and Eysenck M (2002) The correlation between RAE ratings and citation counts in psychology Working paper Department of Psychology Royal Holloway University of London
Taylor W (1986) Organisational Culture and Administrative Leadership in Universities In Leadership and Organisational Culture (eds Sergiovanni TJ and Corbally JE) pp125-141 Illini Books University of Illinois
Tierney W Corwin Z amp Colyar JE (Eds) (2004) Competing conceptions of governance Negotiating the perfect storm John Hopkins University Press Baltimore MD
22
van Leeuwen TN Moed HF Tijssen RJW Visser MS and Van Raan AFJ (2001)
Language biases in the coverage of the Science Citation Index and its consequences for international comparisons of national research performance Scientometrics Vol 51 No1 pp 335-346
van Raan AFJ (1998) Assessing the social sciences the use of advanced bibliometric methods as a necessary complement to peer review Research Evaluation Vol 7 pp 2-6
van Raan AFJ (2003) The use of bibliometric analysis in research performance assessment and monitoring of interdisciplinary scientific developments Technikfolgenabschatzung Vol 1 pp 20-29
van Raan AFJ (2005) Fatal Attraction Conceptual and methodological problems in the ranking of universities by bibliometric methods Scientometrics Vol 62 No 1 pp 133-143
Weingart P (2003) Evaluation of research performance the danger of numbers in Bibliometric analysis in science and research Applications Benefits and Limitations Second Conference of the Central Library Forschungszentrum Julich pp 7-19
Weingart P (2004) Impact of bibliometrics upon the science system inadvertent consequences in Handbook on Quantitative Science and Technology Research (eds Moed HF Glanzel W and Schmoch U) Kluwer Academic Publishers Dordrecht The Netherlands
Wouters PF (1999) The Citation Culture PhD Thesis University of Amsterdam The Netherlands
Interviews
Amy Gutmann President University of Pennsylvania -- interview at University of Pennsylvania April 28 2005
Jeremy Knowles Former Dean Faculty of Arts and Sciences Harvard -- interview at Harvard April12 2005
League tables
Academic Ranking of World Universities 2004 Institute of Higher Education Shanghai Jiao Tong University [httpedsjtueducnrankinghtm]
Top American Research Universities TheCenter [httpthecenterufledu]
Statistical packages
Paleontological Statistics Software Package for Education and Data Analysis Palaeontologia Electronica 4(1) 9pp [httppalaeo-electronicaorg2001_1pastissue1_01htm]
KaleidaGraph Synergy Software at [wwwsynergycom]
23
APPENDIX 1
Top 500 World Universities (1-100) 2004
World Rank
Institution Country Total Score
Score on
Alumni
Score
on Award
Score
on HiCi
Score on
NampS
Score on SCI
Score on Size
1 Harvard Univ USA 1000
986 1000
1000
1000
1000
606
2 Stanford Univ USA 772 412 722 961 752 723 681
3 Univ Cambridge UK 762 1000
934 566 585 702 732
4 Univ California - Berkeley USA 742 700 760 741 756 727 451
5 Massachusetts Inst Tech (MIT) USA 724 741 789 736 691 646 475
6 California Inst Tech USA 690 593 665 648 667 532 1000
7 Princeton Univ USA 636 610 768 654 521 468 673
8 Univ Oxford UK 614 644 591 531 553 652 590
9 Columbia Univ USA 612 778 588 573 516 683 370
10 Univ Chicago USA 605 722 819 553 466 541 327
11 Yale Univ USA 586 522 445 636 581 636 504
12 Cornell Univ USA 555 466 524 605 472 662 336
13 Univ California - San Diego USA 538 178 347 636 594 672 479
14 Tokyo Univ Japan 519 361 144 445 550 919 498
15 Univ Pennsylvania USA 518 356 351 612 446 726 340
16 Univ California - Los Angeles USA 516 274 328 605 481 799 248
17 Univ California - San Francisco USA 508 00 376 593 595 629 488
18 Univ Wisconsin - Madison USA 500 431 363 553 480 692 190
19 Univ Michigan - Ann Arbor USA 493 398 193 648 457 767 201
20 Univ Washington - Seattle USA 491 227 302 573 496 788 162
21 Kyoto Univ Japan 483 398 341 400 372 771 464
22 Johns Hopkins Univ USA 475 487 283 437 526 717 142
23 Imperial Coll London UK 464 209 381 462 394 658 445
24 Univ Toronto Canada 446 281 197 391 412 784 428
25 Univ Coll London UK 443 308 329 410 410 611 426
25 Univ Illinois - Urbana Champaign USA 433 417 374 462 360 582 178
24
27 Swiss Fed Inst Tech - Zurich Switzerland
432 403 370 391 432 471 415
28 Washington Univ - St Louis USA 431 251 266 419 468 562 449
29 Rockefeller Univ USA 402 227 598 315 436 271 386
30 Northwestern Univ USA 395 218 193 479 358 572 370
31 Duke Univ USA 389 209 00 486 468 627 362
32 New York Univ USA 387 339 250 437 393 509 191
33 Univ Minnesota - Twin Cities USA 383 361 00 539 359 696 128
34 Univ Colorado - Boulder USA 378 166 298 437 383 475 274
35 Univ California - Santa Barbara USA 370 00 285 454 414 440 362
36 Univ British Columbia Canada 363 209 193 360 316 595 349
36 Univ Texas Southwestern Med Center
USA 363 166 339 338 405 400 349
38 Vanderbilt Univ USA 351 126 302 371 238 502 417
39 Univ Utrecht Netherlands
349 308 214 315 299 581 221
40 Univ Texas - Austin USA 348 218 171 502 288 537 128
41 Univ Paris 06 France 339 357 239 231 247 567 326
42 Univ California - Davis USA 336 00 00 486 372 647 207
43 Pennsylvania State Univ - Univ Park
USA 335 141 00 502 377 587 142
44 Rutgers State Univ - New Brunswick
USA 334 154 204 381 361 482 195
45 Tech Univ Munich Germany 333 431 241 276 204 500 320
46 Karolinska Inst Stockholm Sweden 330 308 278 327 216 498 215
47 Univ Edinburgh UK 329 227 171 276 367 491 316
48 Univ Paris 11 France 325 333 342 214 213 468 312
48 Univ Pittsburgh - Pittsburgh USA 325 189 00 428 265 670 200
48 Univ Southern California USA 325 00 273 419 230 535 205
51 Univ Munich Germany 324 372 211 124 320 560 311
52 Univ Rochester USA 320 333 91 303 272 449 501
53 Australian Natl Univ Australia 319 178 129 410 314 436 307
54 Osaka Univ Japan 315 126 00 262 312 721 302
55 Univ California - Irvine USA 314 00 250 338 296 472 299
56 Univ North Carolina - Chapel Hill USA 312 126 00 381 345 605 203
57 Univ Maryland - Coll Park USA 311 259 00 400 332 540 174
25
57 Univ Zurich Switzerland
311 126 273 214 303 489 299
59 Univ Copenhagen Denmark 310 308 247 231 226 481 298
60 Univ Bristol UK 306 109 182 327 266 491 294
61 McGill Univ Canada 304 288 00 315 263 590 292
62 Carnegie Mellon Univ USA 303 189 302 327 174 388 340
63 Univ Leiden Netherlands
298 251 158 303 220 473 303
64 Univ Heidelberg Germany 297 109 277 231 221 497 285
65 Case Western Reserve Univ USA 296 372 118 231 222 461 406
66 Moscow State Univ Russia 295 515 349 00 81 585 283
67 Univ Florida USA 293 154 00 338 243 664 163
68 Univ Oslo Norway 292 259 341 195 172 421 280
69 Tohoku Univ Japan 288 189 00 195 261 693 277
69 Univ Sheffield UK 288 235 144 231 288 462 277
71 Purdue Univ - West Lafayette USA 287 189 171 315 221 505 138
72 Univ Helsinki Finland 286 189 182 151 237 569 275
73 Ohio State Univ - Columbus USA 285 178 00 410 206 613 96
74 Uppsala Univ Sweden 284 259 329 00 304 525 145
75 Rice Univ USA 283 218 223 262 237 302 446
76 Univ Arizona USA 281 00 00 315 377 565 181
77 Kings Coll London UK 280 166 235 231 198 462 269
78 Univ Manchester UK 279 259 193 214 182 486 268
79 Univ Goettingen Germany 274 388 204 175 182 428 263
80 Michigan State Univ USA 270 126 00 391 284 505 105
80 Univ Nottingham UK 270 154 204 231 201 451 259
82 Brown Univ USA 268 00 139 303 279 414 304
82 Univ Melbourne Australia 268 154 144 214 192 530 258
82 Univ Strasbourg 1 France 268 295 229 214 213 352 257
85 Ecole Normale Super Paris France 265 479 250 175 182 296 254
86 Boston Univ USA 263 154 00 327 296 515 96
86 Univ Vienna Austria 263 251 158 87 220 545 253
88 McMaster Univ Canada 260 166 193 231 162 452 250
26
88 Univ Freiburg Germany 260 251 214 195 180 409 250
90 Hebrew Univ Jerusalem Israel 259 154 00 262 295 483 249
91 Univ Basel Switzerland
258 259 175 214 242 355 248
92 Lund Univ Sweden 256 295 00 262 220 540 112
93 Univ Birmingham UK 255 251 112 247 140 476 245
93 Univ Roma - La Sapienza Italy 255 166 158 124 243 574 79
95 Humboldt Univ Berlin Germany 254 295 219 87 148 497 244
95 Univ Utah USA 254 00 00 327 307 484 201
97 Nagoya Univ Japan 252 00 144 151 237 553 242
97 Stockholm Univ Sweden 252 295 302 175 149 357 153
99 Tufts Univ USA 251 189 171 195 191 406 292
99 Univ Bonn Germany 251 199 204 175 167 439 241
Copyright copy 2004 Institute of Higher Education Shanghai Jiao Tong University All Rights Reserved
The methodology for the 2005 Global Ranking produced by SJTU has been slightly modified (see httpedsjtueducnrankinghtm)
27
APPENDIX 2
Citation thresholds for scientists across different disciplines
(January 1994 - June 2004)
Subject area Scientist Agricultural Sciences 154
Biology amp Biochemistry 780
Chemistry 648
Clinical Medicine 1095
Computer Science 84
Economics amp Business 169
Engineering 182
EnvironmentEcology 248
Geosciences 433
Humanities General 35
Immunology 763
Materials Science 219
Mathematics 130
Microbiology 534
Molecular Biology amp Genetics 1234
Multidisciplinary 123
Neuroscience amp Behaviour 908
Pharmacology amp Toxicology 312
Physics 1832
Plant amp Animal Science 292
PsychiatryPsychology 393
Social Sciences General 117
Space Science 1301 Updated Sept 1 2004 Thomson ISI Highly cited available from
httpin-citescomthresholds-citationhtml
Humanities score created by Amanda H Goodall
Note to Table The above citation thresholds represent the top 1 researchers (approximately 250) in each disciplinary field

1
Should Top Universities be Led by Top Researchers and Are They
Introduction
This paper is a study of universities and those who lead them It appears to be the first of its kind Although there is a large academic literature on leadership there has been little statistical thinking about presidents of universities2
The paper is interested in the question should research universities be led by top researchers It is explored empirically by examining what the world s universities actually do If the best universities -- who arguably have the widest choice of candidates -- systematically appoint top researchers as their presidents this could be one form of evidence that on average better researchers may make better presidents Economists would call this a revealed preference argument
When looking at the individuals who lead the world s top 100 universities it is possible to find both a handful of Nobel Prize winners and a handful of leaders with few or no research citations It might be thought from this fact that there is no systematic link between research output and university leadership Yet there is a pattern This paper uncovers a correlation between the research background of a leader and the position of their university in a world league table
Why is this question important
First around the world interest in university leadership and governance has grown as universities have become increasingly competitive and global Major changes have taken place in universities and subsequently in the role and responsibilities of their leaders (These have been documented in Bargh et al 2000 Bok 2003 Tierney 2004 among others) It seems valuable to understand successful leadership in these times
Second given the centrality of research performance in many university mission statements -- expressed through the quality of research produced the research eminence of staff and the concomitant income they generate -- it is logical to turn to the research background of their presidents The first question addressed in this paper through statistical tests using Pearson s correlation coefficient and Spearman s rho is to ask whether the world s top universities currently appoint top researchers to the position of president Possible interpretations are discussed after the results are presented
Finally the emphasis in this study is on the world s leading research universities This group has been chosen because it is important to understand the actions of successful organisations But it is also significant to note that the majority of these universities are based in the United States Much has been talked of in the press about issues of brain-drain (see for example Time Magazine March 15 2005) as faculty from Europe Asia
2 President is used here to denote the executive leader of a university The term is used to include principal vice chancellor rector director among others
2
and beyond move to the US Given the likely significance of universities to an economy if many top academics leave their home country this might be a cause for concern The role of research universities is currently receiving attention in Europe The European Parliament has created the Lisbon Agenda outlining goals to make the European Union the most competitive and dynamic knowledge-driven economy by 2010 (European Parliament March 2002) In Germany the Social Democratic Party recently announced a plan to spend 19 billion Euros to develop 10 elite universities that can compete with the world s best (April 9 2005 DW-Worldde) In 2002 a group of top universities in Europe founded the League of European Research Universities (LERU) On their website it states LERU acknowledges that Europe has lost its pre-eminent position in basic research (wwwleruorg)
Methodology
This paper focuses on one set of variables or characteristics namely the lifetime citations of presidents This score is used here as a measure of how research-active and successful a president has been in his or her academic career The lifetime citation score of presidents is normalised in this study to adjust for different disciplinary conventions
The university ranking used in this study has been produced by the Institute of Higher Education at Shanghai Jiao Tong University in their Academic Ranking of World Universities (2004) (See Appendix 1 for the full list of 100 universities) As is explained below this is probably the most reliable league table available
Citations
Citations are references to authors in other academic papers as acknowledgement of their contribution to a specific research area Citation information used in this study comes from Web of Science the on-line database comprising the Science Citation Index Social Science Citation Index and the Arts and Humanities Citation Index
Data on the presidents of the world s top 100 universities identified as shown below were collected between mid October and early December 2004 Only those presidents in post during this period are included and to the author s knowledge no presidents changed during this 3 month period Biographical information came from university web sites though direct requests for CVs were made on occasion Each president s lifetime citations were counted by hand
Most important when using citations as any kind of measure is recognition of the huge differences between disciplines For example a highly cited social scientist might have a lifetime citation score of around 5000 whereas a molecular biologist could have a score over 20000 Bibliometric indicators have been used more consistently across the sciences than in the humanities and social sciences Such use is most evident in the natural and life sciences though less so in engineering and the behavioural sciences (van Raan 2003) These disciplines publish more journal articles and have a higher prevalence of co-authorship
3
The social sciences are patchier For example economics relies heavily on journal articles though unlike the science publications that tend to publish quickly in economics it can take up to two years from acceptance for publication of a journal article to appear (Hamermesh 1994) Writing articles for journals is less common in the arts and humanities These disciplines tend more towards publishing monographs Cronin et al (1997) found that in the discipline of sociology two distinct groups of highly cited academics co-existed -- those highly cited through journal articles and those through monographs This should not present a problem here because citations from both books and journals have been counted
ISI has created a Highly Cited (ISI HiCi) category that identifies approximately the top 250 academic researchers (depending on discipline) across 21 broad subject areas They are dominated by science subjects totalling 19 The social sciences are also covered but there are only two social science subject areas namely Economics and Business and Social Sciences - General Currently no Highly Cited category exists for authors in the arts or humanities
The discrepancies in citation levels across disciplines are demonstrated in the number of new cited references that appear in ISI every week The sciences generate approximately 350000 new cited references weekly the social sciences 50000 and the humanities 15000
Using citation thresholds produced by ISI HiCi a normalised citation score has been produced in this paper for 23 subject areas (see next section and Appendix 2) These include a score for the humanities that has been generated for the purposes of this study It is necessary to note that the discipline of law is classified in ISI as being in the social sciences not the humanities It is included here in the Social Sciences - General category
In this paper each university president is assigned a normalised citation score which reflects both the differences across disciplines and their personal citation levels This score is referred to as the P-score = president s individual lifetime citation score normalised for discipline The P-score has been generated by using a scale produced by ISI HiCi It has been used here as an exchange rate normalising the different citation conventions across disciplines Each president s lifetime citation score has then been divided by their subject score The normalised P-score produced through this process makes it possible to do like-for-like comparisons between individuals from different disciplines
Substantial effort has been made to try to accurately assign citation numbers to people s names Though some measurement error must be presumed two studies that adopt different counting methods -- Seng and Willett (1995) who use a very precise method on the one hand and Oppenheim (1995) who assigned citations more approximately on the other -- both report very similar correlations
Van Raan (1998 2003 2005) has raised areas for concern when using citations as measures of quality He suggests that citation indices have become easy tools for policy makers and university administrators keen to make quick assessments of individual research output and quality (2005) Wouters (1999) points out that the ISI system was designed to retrieve information not evaluate it
4
Self-citing is a potential problem that can take two forms first over-citing one s own work in academic papers and second self-citation in journals to try to raise the journal impact factor An example of this is raised by Fassoulaki et al (2000) where authors report a significant correlation between self-citation levels and journal impact scores in the 1995 and 1996 issues of six anaesthesia journals
Other possible difficulties with citations include inconsistencies in methods of referencing and inaccuracies in citation statistics (Moed 2002 King 2004) Finally monopoly concerns have been raised about over-reliance on the Web of Science (Weingart 2003 2004)
Language biases have been shown to exist within ISI (van Leeuwen et al 2001) though it is now considered to be less of a problem because most journals publish in English (King 2004) King suggests that preferential referencing may take place in the US (ie that Americans are more likely to reference Americans) partially a feature of the size of that nation s output To try to circumvent this separate analyses of US data are offered below
Although van Raan (2005) notes the weaknesses of bibliometric measures he also argues that citations are a good indicator of performance over long periods of time His preference for evaluating science is to couple peer review with bibliometric analysis King (2004) suggests that citations are the most reliable measure of research quality and output In a feature in the journal Nature King uses the ISI citation index to measure the quantity and quality of science across different nations (2004)
There have been a number of studies comparing the UK s Research Assessment Exercise (RAE) results with bibliometric measures Oppenheim (1997) uses ISI data to compare 1992 RAE results with citation indicators in three subject areas anatomy genetics and archaeology He finds a strong correlation between the two methods of assessment and notes that in archaeology there is a greater reliance on monographic literature Norris and Oppenheim (2003) replicate this study with the same results following the 2001 RAE Smith and Eysenck (2002) discover a similar correlation across all UK psychology departments in the 2001 RAE
Normalising citations to produce P-scores
To obtain a P-score the individual presidential citations were divided by the ISI Highly Cited disciplinary thresholds (see Appendix 2) The threshold dates correspond to the dates the data were collected within a month The subject thresholds are being used here as an exchange rate for assessing different citation conventions
The humanities score was created by the author using the new cited references generated by ISI each week Corresponding with the data collection dates as closely as possible the sciences approximated at 350000 new cited references weekly the social sciences 50000 and the humanities 15000 If we divide the social science weekly score of 50000 by the humanities 15000 we get a figure of 333 The author has then divided the Social Sciences General score of 117 (see Appendix 2) by 333 which creates a score of 3513 The number 35 has been used here as the Humanities General score
5
League tables
As higher education has become global in the recruitment of international students and staff so have league tables International tables have existed for a number of years in areas such as business education through the Financial Times In 2003 the first global league table of universities was produced by the Institute of Education in Shanghai at Jiao Tong University (SJTU) SJTU used a process of inviting comment through their website to make adjustments to their methodology for the 2004 table
The UK based Times Higher Education Supplement (THES) produced a global ranking in November 2004 (wwwthescouk) which has not been used in this study There are three main problems with the league table First 50 weight is assigned to a subjective peer-review process where 1300 academics across 88 countries are invited to name the top institutions in their geographic area and their academic field This is the largest component in the ranking yet there is no information available on the background of these global academics That is a concern For example how might an individual s choice have been influenced by their own place of education sabbatical leave or co-authorship and so on Second 10 weight is given for the international nature of an institution s student body and staff However there is little explanation about why international is a proxy for high quality Finally because the THES is a commercial organisation it is not possible to access the data or check the calculations
An advantage of the SJTU table is that it is not produced by a newspaper or magazine Media-generated league tables are ubiquitous and controversial Tables such as those in The Times and US News and World Report in the US offer information to potential students across a range of criteria Media-driven league tables may be useful heuristic devices for students but as objective tools of assessment of university quality they are unreliable Perhaps the main criticism is that they are produced by commercial organisations designed to make money by selling their publications Therefore a headline is required To generate a story the methodology is changed often annually which ensures that institutions at the top rotate (Lombardi et al 2002) Lombardi and colleagues suggest instead that in the US university positions actually change very little each year if a fixed method of analysis is used (2002)
The Center for Studies in the Humanities and Social Sciences (wwwthecenterufledu ) was created as a non-profit organisation in 1998 in the United States Its mission is to develop methods for measuring and improving university performance For a number of years TheCenter has produced an alternative ranking The Top American Research Universities (Lombardi et al 2003)
This ranking differs from media equivalents because actual numbered positions are not assigned Instead universities are assessed on nine separate measures Those that score highly in at least one of the nine measures are put into a 1-25 top research university category3
3 The measures include total research federal research endowment assets annual giving national academy members faculty awards doctorates granted postdoctoral appointees and SAT scores Some degree of ranking does exist because they are ordered depending on the number of points they score across the nine categories So the top three universities score 9 out of 9 the next six universities score 8 out of 9 and so on
6
The measures of university quality used in both TheCenter and the SJTU world league tables do not exactly correspond However it is interesting to compare the number of US universities at the top in both tables TheCenter s top-25 category has 52 universities included Of these 44 also feature in the SJTU global table Positions 1-27 are exactly correlated in both rankings In other words these two rankings of top US universities are very similar
The Academic Ranking of World Universities (2004) league table uses 6 different criteria to assess universities The table below comes from the SJTU web site
Table 1 Methodology used in SJTU ranking 2004
Criteria
Indicator Code
Weight
Quality of Education
Alumni of an institution winning Nobel Prizes and Fields Medals
Alumni
10
Staff of an institution winning Nobel Prizes and Fields Medals
Award
20 Quality of Faculty
Highly cited researchers in 21 broad subject categories
HiCi 20
Articles published in Nature and Science
NampS 20 Research
Output Articles in Science Citation Index-expanded and Social Science Citation Index
SCI 20
Size of Institution
Academic performance with respect to the size of an institution
Size 10
Total 100
Copyright copy 2004 Institute of Higher Education Shanghai Jiao Tong University
For institutions specialized in humanities and social sciences such as London School of Economics NampS is not considered and the weight of NampS is relocated to other indicators
There are arguably some weaknesses in the SJTU methodology First younger universities stand to lose out particularly in the first category that assigns weight (10) to alumni awards Second the humanities and the social sciences are weakly represented here -- though SJTU have done some adjustment for this There are no ISI HiCi s in the arts and humanities and far fewer in the social sciences The Awards category is also limited Nobel Prizes are only given for achievement in physics chemistry medicinephysiology economics literature and peace and Fields Medals only for mathematics
7
Data on the 100 university presidents
It is important to note that the world league table ranks institutions by assigning points (as per criteria above) This can result in two or more institutions being given the same position (see the full list in Appendix 1)
The universities in the top-100 table are dominated by the United States where 51 of the institutions are located As can be seen in Figure 1 US institutions are unevenly spread across the world s top 100 dominating the top 20 with 17 universities and with 30 in the top 40 Of the 100 total only 4 in the bottom 20 are US-based If we treat American states as individual nations California with a population of 36 million has the highest number of leading universities Ten Californian institutions are within the top 55 6 of these are in the top 20 and 7 of the 10 are public or state universities
Thirty-seven institutions out of 100 are located in European countries Of these 11 are in the United Kingdom 7 in Germany 4 in both France and Sweden 3 in Switzerland 2 in the Netherlands and 1 each in Austria Denmark Finland Norway Italy and Russia Finally among the top 100 there are 12 universities in the rest of the world -- 5 in Japan 4 in Canada 2 in Australia and 1 in Israel
The nation location of an institution is not always reflected in the nationality of its president For example the top 10 universities are found in two countries -- US (8) and UK (2) whereas the leaders come from four -- Canada New Zealand UK and the US There are 15 female presidents in the sample Six are in the top 20 universities and 10 are within the top 50 North America dominates with 9 US female presidents and 2 in Canada The remaining four are in Denmark France Sweden and the UK
Every president in the group of 100 universities has a PhD The majority have been academics though two presidents spent most of their careers in non-research positions in industry or government and a small group went almost directly into academic administration
The age of a president potentially affects his or her lifetime citation levels The older they are the greater the opportunity to accrue citations It is therefore necessary to check whether presidents with the highest levels of lifetime citations are in fact older than those with fewer citations Some European universities still publish date of birth information though they are in the minority Birth dates can be loosely calculated by using individuals age at graduation from first degree Using this method it is possible to compare the ages of presidents at the top and bottom of the top-100 global league table If it is shown that the top presidents are markedly older than those in the bottom 20 then adjustment of citation scores would be necessary
The ages of only 80 of presidents in the top 20 universities and 80 of presidents in the bottom 20 could be obtained The mean age of presidents in the top 20 universities is 58 years In the bottom 20 category the mean age of president is 60 Because of the closeness in age between these two groups and in particular the slightly older average age of the lowest quintile citation scores have not been adjusted
Figure 2 displays the disciplinary background of the presidents What is noticeable is the evenness of disciplinary spread across each quintile Of the 100 presidents 52 have a
8
scientific background The scientists are dominated by the life sciences at 50 but there are also 11 engineers 6 physicists 5 chemists and 4 computer scientists
Thirty-seven of the 100 presidents are social scientists The largest disciplinary group among the social scientists is that of lawyers who number 15 Within a second group of 16 there is an even spread of educationalists political scientists sociologists and those from public and social policy Finally there are 6 economists
Eleven presidents are from the arts and humanities This group is noticeably smaller Taylor (1986) documents the disciplinary distribution amongst vice chancellors and principals in the UK in 1986 He also cites earlier work by Collison and Millen (1969) who showed that in the UK between 1935 and 1967 the proportion of presidents from the arts declined from 68 to 48 while scientists rose from 19 to 41 Taylor then reports his own findings that by 1981 67 of vice chancellors and principals were scientists 13 from the social sciences and less than 20 were from the arts Cohen and March (1974) showed a similar pattern -- in the number of presidents from the arts - for the US between 1924 and 1969
In a study by Dolton and Ma (2001) on CEO Pay the disciplinary backgrounds of UK vice chancellors are reported Drawn from a wide cross-section of British universities (including Oxbridge civic universities former colleges of advanced technology among others) they note that VCs in position in 1999 included 3 lawyers 13 engineers scientists made up 25 social sciences including business 36 and finally VCs from the arts and humanities made up 13 10 were reported as being non-academics
Of the 100 presidents in the current paper s sample 12 are ISI Highly Cited (HiCi) academics These individuals are more common in the top universities Of the 12 presidents in HiCi 6 are in the top 20 group of universities 3 in the next 20 2 in the next and 1 in the fourth quartile Finally there are 3 Nobel Prize winners among the presidents (all in medicine) -- two in the top 20 and one in the 20-40 category
The distribution of citations across the 100 presidents fits Lotka s Law an application that is often used in bibliometric research Lotka (1926) describes the frequency of publication by authors in a given field As can be observed in Figure 3 using presidents P-scores a version of this law applies here Lotka s power law predicts that of all the authors in a specific field approximately 60 percent will publish just one article 15 percent will have two publications 7 percent of authors will publish three pieces and so on (Potter 1988) According to Lotkas Law of scientific productivity only 6 percent of the authors in a field will produce more than 10 articles (the number making n contributions is about 1nsup2 of those making one) This law is most accurate when applied over long periods of time and to large bodies of work -- for example individuals lifetime citations
The results
As outlined above the 100 presidents lifetime citations are represented by a normalised P-score
The individual citation scores of the 100 presidents before adjustment range from 0 to 28718 The mean citation score is 2731 and the median is 371 After adjusting for discipline the highest P-score is 37 points and the lowest is 0 The mean P-score is 603
9
and the median is 227 When the group of 100 is split into two the top leaders of the 50 universities have a mean P-score of 876 and a median of 457 and those in the bottom half of universities have a mean P-score of 330 and a median of 093 Of the total group of 100 presidents 4 have a citation score of zero
The results are presented here in scatter plots and cross tabulations - that are grouped into quintiles (the 1-20 group always refers to the top of the SJTU table and 1 equals Harvard)
The most highly ranked universities have leaders who are more highly cited Figure 4 shows this It gives a cross-sectional breakdown of P-score by university rank in quintiles This shows a monotonic decline in citation levels as the universities go down in world rank
The next step is to try to establish statistical significance The paper does this in two ways
A natural first approach is to test whether the rank ordering of one variable is correlated with the rank order of the second variable Spearman s rank correlation coefficient is an appropriate measure The highest P-score is ranked 1 and the lowest P-score is ranked100 The actual rank of presidents P-scores is then tested for a correlation against university rank
Using these data Spearman s rho is calculated at 0378 With 100 observations the associated 5 critical value for a two-tailed test is 0195 and at 1 it is 0254 which establishes that the correlation is statistially significant at conventional confidence levels
A second approach can be seen in Figure 5 which gives the distribution of the 100 individual P-scores by world university rank Using Pearson s coefficient (r) the degree of linear relationship between the rank of university and president s P-score can be examined For the data in Figure 5 Pearson s r is 0345 The 1 critical value on a two-tailed test is 0254 which means again that the relationship is statistically significant4 There continues to be a statistically significant relationship if the natural logarithm of P-score is used this can be seen in Figure 5a
This correlation between cites and university quality can also be seen amongst the sub-sample of female presidents though at 15 the group is small (Figure 6) It is also statistically significant at the 1 level The disciplinary breakdown of the 15 female presidents is 7 scientists 7 social scientists and 1 from the humanities One president is Highly Cited
US universities make up 51 out of the 100 The mean P-score for this US group is 807 with a median score of 486 which is higher than the world group mean of 603 and median of 227 There are 25 scientists 21 social scientists and 5 in the humanities Of the 12 Highly Cited presidents in total 9 are based in US universities though two of these are non-Americans -- 1 is from Canada and 1 from the UK who is also a Nobel Prize winner
4 It should be noted that there is evidence that the residuals are skewed
10
Figure 7 presents a scatter plot for the sample of US presidents Again there is a correlation between citation levels and (world) university position The correlation is significant at the 1 level
It is useful to note that university rank explains only 12 of the variance in leaders citations In other words there are many other explanatory factors that are not being measured here However these correlations are significant enough to warrant further investigation and discussion
Is the citation-rank correlation true for universities outside the US
So far we have identified a strong positive relationship between the citation levels of university presidents and the position of their institution within a ranking of 100 universities This association exists amongst the 100 presidents in total the female group and the 51 US presidents
The mean citation P-score for presidents in the 49 countries in the rest of the world is 391 with a median score of 107 This is below the 100-group mean P-score of 6 and it is half the US mean P-score of 8 Therefore US presidents are twice as cited as those in the rest of the world
In the rest of the world the presidents include 27 scientists 16 social scientists and 6 in the humanities There are 3 Highly Cited researchers in the group Two are from the Netherlands and one in Germany
Figure 8 shows there is no statistically significant correlation between citation levels and position of president across the 49 countries in the rest of the world
As can be seen in the data one of the differences between the top American universities and non-American universities is that the former choose leaders who are more highly cited
Outliers
It is important to ensure that the results from this study have not been unduly influenced by a small number of presidents with extremely high P-scores To do this two tests are available First we can return to Spearman s rho which puts an equal weight on each observation instead of assigning continuous values As has been pointed out above a statistically significant rank correlation has been established with a significance level better than 1
The second check on outliers is simply to delete the data used from the highest P-scores for the Pearson s test To do this the top 5 of P-scores all located within ranges 30 and 40 were withdrawn and the correlation re-tested with a result of 0297 With 95 observations the 5 critical value for a two-tailed test is 0200 and at 1 it is 0260 so the correlation remains
11
Possible interpretations
Data on world university rankings have only recently become available That universities with strongly research-intensive missions appoint as their presidents men and women with strong citation records does not appear to have been previously documented The data in this paper do not enable judgements to be made about the weight assigned by selection committees to the research records of presidential candidates as distinct for example from other criteria such as managerial expertise or entrepreneurship But the data do suggest that research universities look for candidates who fit institutional missions
Internationally active researchers lead the world s top universities On average the higher the university is in the global ranking the more highly cited is that institution s president There are of course exceptions Two universities from the Netherlands -- in positions 39 and 63 -- both have presidents who are Highly Cited (It is interesting to note that these are the only two universities in the top 100 from that country) And there are top universities led by presidents with few or no citations However these cases are in a minority
These findings show that in at least one area the top universities are making different choices from those lower in the global ranking What can we learn from this difference Why do those institutions at the top appoint former researchers to the role of president
There are a number of possible reasons for the correlation They include
Hypothesis 1 Better researchers make better leaders of research universities
It has been recognised in the literature that presidents need to learn particular skills to enable them to lead a university (Cohen and March 1974 Rosovsky 1991 Middlehurst 1993 Bargh et al 2000 among others) In the UK an organisation for training academic leaders has recently been established with government funding
Whilst the education and career background of academic leaders has attracted some interest (Cohen and March 1974 Taylor 1986 Bargh at al 2000 Dolton and Ma 2001) little specific attention has been given to the research background of presidents Yet many university websites make a great deal of the eminence of the president
It seems clear that better researchers will tend to have greater prestige within the hierarchy of the academy and presidents who are highly cited may therefore enjoy credibility and negotiating strength that extends beyond their own discipline Jeremy Knowles the former Dean of Harvard s Faculty of Arts and Sciences (from 1991 2002) said that he believed his own research record helped his position as dean because it gave him greater status and therefore negotiating power when dealing with eminent faculty (interview with author April 12 2005) This suggests that being a cited researcher is of symbolic importance
This message was repeated in an interview with Amy Gutmann President of the University of Pennsylvania who said that being a researcher sends a signal to the faculty that you the president share their scholarly values and general understanding of the culture of the academy (interview April 28 2005)
12
Being a successful research academic may also help in attracting faculty particularly stars to a university which has become a preoccupation the world over Having a president who is a distinguished researcher may enhance the appeal of an institution
Alternatively it may be that two separate components are involved when leading a research university namely managerial expertise and inherent knowledge The former pertains to having knowledge of generic functions such as finance and budgeting human resource management corporate governance among others Most presidents running top universities will have had experience in managerial positions -- running large laboratories as head of department or pro-vice chancellor Experienced managers can also be brought in to perform specialised administrative roles Thus a former UK university vice chancellor has suggested (in personal correspondence) that what matters is scholarship not just management -- that we should take management for granted
The term inherent knowledge is used here to suggest a specific knowledge of or insight into academe that is borne out of expertise gained through academic research It suggests that good researchers may bring something else to the role of leader -- a perspective and understanding directly linked to their past as a successful scholar
It is possible that inherent knowledge also helps leaders inform strategy-making For example it may be easier to interpret research trends and future intellectual directions But how easy is it for a highly cited chemist to assess a faculty member from information science or discern the future direction of modern languages One possibility is that faculty at the top of their fields can make a fair assessment about the quality of work produced by those in other fields by using the same mechanisms used generally in academia namely citation indices and peer review
Hypothesis 2 Top universities appoint good researchers for reasons relating to external factors such as PR and fundraising
It has been said that US presidents in top universities spend a great deal of time fundraising and subsequently that they are less involved with running the institution This is not the place to compare US presidential leadership with European rectors or British vice chancellors Briefly however the American system is unitary with the president at the head of the hierarchy Though the president reports to a powerful board of trustees he or she is ultimately in charge with a role similar to that of a chief executive officer Senior academic administrators in the US (deans provosts chairs of departments) are normally appointed not voted into position by faculty In short the US presidential system is recognised as giving greater authority and powers to university leaders when compared to other systems of higher education from Europe to Japan (Rosovsky 1991 Bargh et al 2000) This is particularly true of US private universities US publics on the other hand are more exposed to state government intervention
Amy Gutmann President of University of Pennsylvania was clear in an interview that she is centrally involved in making senior appointments and in deciding the overall strategic direction of the university Long term strategy is designed through a collaborative process involving the president and the deans and provosts that she appoints and whose work she oversees (April 28 2005)
13
Appointment committees may select high-profile academics as presidents for external reasons The alumni may be encouraged to give more generously Gaining greater media exposure for the institution may also be a motive Alternatively if the governing body of a university wants to push an institution in a different direction towards research it may consider appointing a good researcher to signal a change in the internal culture
Hypothesis 3 The correlation is explained through unobservable heterogeneity
This would mean that research talent is merely a proxy for leadership ability The positive relationship between presidents P-scores and university rank may actually be picking up a correlation between other variables For instance presidents who are good at research may just be good at everything This is the alternative to a cause-and-effect relationship
All correlations are potentially susceptible to this kind of criticism It seems implausible however that candidates research records do not play a part in their selection for headship of institutions with prominent research missions
Concluding comments
This study which seems to be the first of its kind finds a correlation between the citations of presidents and the positions of their universities in a world league table Better universities are run by better researchers
The statistical relationship is strong for the group of 100 universities as a whole and for the sub-samples of female presidents and US presidents On average one extra point on a president s adjusted citation score where scores run from zero for the least-cited president to a score of up to 40 for Highly Cited and Nobel-prize winning presidents is associated with ten extra places in the world s top-100 ranking of universities No statistically significant correlation is found however for the sub-sample of universities from the rest of the world
Simple quantitative research of this kind may offer insights into university leadership - insights that are particularly relevant to universities that want to compete for a position amongst the world s top research institutions The best universities which can choose from the widest pool are systematically selecting top researchers to lead them What do such researchers bring to the role of leader This paper posits that there are two central components involved in leading research universities managerial expertise and inherent knowledge It is suggested here that better researchers may have greater inherent knowledge about academe that in turn informs their role as leader A president s research background may also have symbolic value in that it sends out a signal about the values of that institution And finally being a reputed researcher may raise a leader s status within the academic community and enhance his or her powers of negotiation
However the paper notes that other interpretations of the data are possible One is that universities choose top researchers for reasons of prestige and to assist in fundraising This is probably true as a factor for selection though it is unlikely to be the sole function
14
of a president in a top institution Another is that research ability is simply a proxy for some other kind of talent that is useful to leaders
Causality cannot be established through these correlations The performance of a university has not been shown here to be linked to the actions of a president or vice chancellor whether highly cited or not However this type of study starts the process of understanding whether there may be benefits from appointing a researcher as president A further study is underway exploring causality
15
0
5
10
15
20
1 - 20 21 - 40 41 - 60 61 - 80 81 - 100
Figure 1 The cross-country distribution of the worlds top 100 universities
USA EuropeRest World
Num
ber
of u
nive
rsiti
es
University rank (1 is top)
0
5
10
15
20
25
0 - 20 21 - 40 41 - 60 61 - 80 81 - 100
Figure 2 The disciplines of the presidents of the worlds top universites
ScienceHumanitiesSocial science
Dis
cipl
ine
University rank
16
-1
0
1
2
3
4
5
05 1 15 2 25 3 35 4
Figure 3 The distribution of presidents lifetime citations follows Lotkas power law
Loga
rithm
of t
he n
umbe
r of
pre
side
nts
Logarithm of presidents P-scores
17
0
50
100
150
200
0-20 21-40 41-60 61-80 81-100
Figure 4 A cross-tabulation of presidents lifetime citation P-scores by world university rank
(in quintiles)
Pre
side
nts
P-s
core
University rank
18
-10
0
10
20
30
40
0 20 40 60 80 100
Figure 5 Presidents P-scores by rank among
the worlds top 100 universities
y = 11305 - 01047x R= 034479 P
resi
dent
s P
- sc
ore
University rank
-8
-6
-4
-2
0
2
4
0 20 40 60 80 100
Figure 5a Logarithm of presidents P-scores by university rank
y = 14413 - 0021876x R= 026413
Log
of p
resi
dent
s P
-sco
re
University rank
19
-5
0
5
10
15
20
0 20 40 60 80 100
Figure 6 Female presidents P-scores by university rank
y = 97036 - 012631x R= 069052
Pre
side
nts
P-s
core
University rank
-10
0
10
20
30
40
0 20 40 60 80 100
Figure 7 US presidents P-scores by university rank
y = 13492 - 013997x R= 037505
Pre
side
nts
P-s
core
University rank
20
-10
0
10
20
30
40
0 20 40 60 80 100
Figure 8 Presidents from the rest of the world P-scores by university rank
y = 61896 - 003646x R= 014019 P
resi
dent
s P
-sco
re
University rank
21
References
Bargh C Bocock J Scott P and Smith D (2000) University Leadership The Role of the Chief Executive Open University Press Buckingham
Bok D (2003) Universities in the Marketplace The commercialisation of Higher Education Princeton University Press New Jersey
Cohen MD and March JG (1974) Leadership and Ambiguity McGraw-Hill New York
Collison P and Millen J (1969) University chancellors vice chancellors and college principals A social profile Sociology Vol 3 No 1 pp 77-109
Cronin B Snyder H and Atkins H (1997) Comparative citation rankings of authors in monographic and journal literature a study of sociology Journal of Documentation Vol 53 No 3 pp 263-273
Dolton P and Ma A (2001) CEO Pay in the Public Sector The Case of Vice Chancellors in UK Universities Newcastle UK Working paper Newcastle University Discussion Papers in Economics
Fassoulaki A Paraskeva A Papilas K and Karabinis G (2000) Self-citations in six anaesthesia journals and their significance in determining the impact factor British Journal of Anaesthesia Vol 87 No 2 pp 266-269
Hamermesh DS (1994) Facts and Myths about Refereeing Journal of Economic Perspectives Vol 8 No 1 Winter pp 153-163
King DA (2004) The scientific impact of nations Nature Vol 430 pp 311-316
Lombardi JV Craig DD Capaldi ED and Gater DS (2002) The Top American Research Universities An Overview TheCenter Reports University of Florida Gainesville
Lombardi JV Craig DD Capaldi ED Reeves KR and Gater DS (2003) The Top American Research Universities TheCenter University of Florida Gainesville
Lotka AJ (1926) The Frequency Distribution of Scientific Productivity Journal of the Washington Academy of Sciences Vol 16 No12 pp 317-323
Middlehurst R (1993) Leading Academics Open University Press Buckingham
Moed HF (2002) The impact factors debate the ISI s uses and limits Nature Vol 415 pp 731-732
Norris M and Oppenheim C (2003) Citation counts and the Research Assessment Exercise V
Archaeology and the 2001 RAE Journal of Documentation Vol 59 No 6 pp 709-730
Oppenheim C (1995) The correlation between citation counts and the 1992 Research Assessment Exercise Ratings for British library and information science university departments Journal of Documentation Vol 51 pp 18-27
Oppenheim C (1997) The correlation between citation counts and the 1992 Research Assessment Exercise ratings for British research in genetics anatomy and archaeology Journal of Documentation Vol 53 No 5 pp 477-487
Potter W G (1988) Of Making Many Books There is No End Bibliometrics and Libraries The Journal of Academic Librarianship Vol14 pp 238a-238c
Rosovsky H (1991) The University An Owners Manual Norton New York
Seng LB amp Willett P (1995) The citedness of publications by United Kingdom library schools Journal of Information Science Vol 21 pp 68-71
Smith A and Eysenck M (2002) The correlation between RAE ratings and citation counts in psychology Working paper Department of Psychology Royal Holloway University of London
Taylor W (1986) Organisational Culture and Administrative Leadership in Universities In Leadership and Organisational Culture (eds Sergiovanni TJ and Corbally JE) pp125-141 Illini Books University of Illinois
Tierney W Corwin Z amp Colyar JE (Eds) (2004) Competing conceptions of governance Negotiating the perfect storm John Hopkins University Press Baltimore MD
22
van Leeuwen TN Moed HF Tijssen RJW Visser MS and Van Raan AFJ (2001)
Language biases in the coverage of the Science Citation Index and its consequences for international comparisons of national research performance Scientometrics Vol 51 No1 pp 335-346
van Raan AFJ (1998) Assessing the social sciences the use of advanced bibliometric methods as a necessary complement to peer review Research Evaluation Vol 7 pp 2-6
van Raan AFJ (2003) The use of bibliometric analysis in research performance assessment and monitoring of interdisciplinary scientific developments Technikfolgenabschatzung Vol 1 pp 20-29
van Raan AFJ (2005) Fatal Attraction Conceptual and methodological problems in the ranking of universities by bibliometric methods Scientometrics Vol 62 No 1 pp 133-143
Weingart P (2003) Evaluation of research performance the danger of numbers in Bibliometric analysis in science and research Applications Benefits and Limitations Second Conference of the Central Library Forschungszentrum Julich pp 7-19
Weingart P (2004) Impact of bibliometrics upon the science system inadvertent consequences in Handbook on Quantitative Science and Technology Research (eds Moed HF Glanzel W and Schmoch U) Kluwer Academic Publishers Dordrecht The Netherlands
Wouters PF (1999) The Citation Culture PhD Thesis University of Amsterdam The Netherlands
Interviews
Amy Gutmann President University of Pennsylvania -- interview at University of Pennsylvania April 28 2005
Jeremy Knowles Former Dean Faculty of Arts and Sciences Harvard -- interview at Harvard April12 2005
League tables
Academic Ranking of World Universities 2004 Institute of Higher Education Shanghai Jiao Tong University [httpedsjtueducnrankinghtm]
Top American Research Universities TheCenter [httpthecenterufledu]
Statistical packages
Paleontological Statistics Software Package for Education and Data Analysis Palaeontologia Electronica 4(1) 9pp [httppalaeo-electronicaorg2001_1pastissue1_01htm]
KaleidaGraph Synergy Software at [wwwsynergycom]
23
APPENDIX 1
Top 500 World Universities (1-100) 2004
World Rank
Institution Country Total Score
Score on
Alumni
Score
on Award
Score
on HiCi
Score on
NampS
Score on SCI
Score on Size
1 Harvard Univ USA 1000
986 1000
1000
1000
1000
606
2 Stanford Univ USA 772 412 722 961 752 723 681
3 Univ Cambridge UK 762 1000
934 566 585 702 732
4 Univ California - Berkeley USA 742 700 760 741 756 727 451
5 Massachusetts Inst Tech (MIT) USA 724 741 789 736 691 646 475
6 California Inst Tech USA 690 593 665 648 667 532 1000
7 Princeton Univ USA 636 610 768 654 521 468 673
8 Univ Oxford UK 614 644 591 531 553 652 590
9 Columbia Univ USA 612 778 588 573 516 683 370
10 Univ Chicago USA 605 722 819 553 466 541 327
11 Yale Univ USA 586 522 445 636 581 636 504
12 Cornell Univ USA 555 466 524 605 472 662 336
13 Univ California - San Diego USA 538 178 347 636 594 672 479
14 Tokyo Univ Japan 519 361 144 445 550 919 498
15 Univ Pennsylvania USA 518 356 351 612 446 726 340
16 Univ California - Los Angeles USA 516 274 328 605 481 799 248
17 Univ California - San Francisco USA 508 00 376 593 595 629 488
18 Univ Wisconsin - Madison USA 500 431 363 553 480 692 190
19 Univ Michigan - Ann Arbor USA 493 398 193 648 457 767 201
20 Univ Washington - Seattle USA 491 227 302 573 496 788 162
21 Kyoto Univ Japan 483 398 341 400 372 771 464
22 Johns Hopkins Univ USA 475 487 283 437 526 717 142
23 Imperial Coll London UK 464 209 381 462 394 658 445
24 Univ Toronto Canada 446 281 197 391 412 784 428
25 Univ Coll London UK 443 308 329 410 410 611 426
25 Univ Illinois - Urbana Champaign USA 433 417 374 462 360 582 178
24
27 Swiss Fed Inst Tech - Zurich Switzerland
432 403 370 391 432 471 415
28 Washington Univ - St Louis USA 431 251 266 419 468 562 449
29 Rockefeller Univ USA 402 227 598 315 436 271 386
30 Northwestern Univ USA 395 218 193 479 358 572 370
31 Duke Univ USA 389 209 00 486 468 627 362
32 New York Univ USA 387 339 250 437 393 509 191
33 Univ Minnesota - Twin Cities USA 383 361 00 539 359 696 128
34 Univ Colorado - Boulder USA 378 166 298 437 383 475 274
35 Univ California - Santa Barbara USA 370 00 285 454 414 440 362
36 Univ British Columbia Canada 363 209 193 360 316 595 349
36 Univ Texas Southwestern Med Center
USA 363 166 339 338 405 400 349
38 Vanderbilt Univ USA 351 126 302 371 238 502 417
39 Univ Utrecht Netherlands
349 308 214 315 299 581 221
40 Univ Texas - Austin USA 348 218 171 502 288 537 128
41 Univ Paris 06 France 339 357 239 231 247 567 326
42 Univ California - Davis USA 336 00 00 486 372 647 207
43 Pennsylvania State Univ - Univ Park
USA 335 141 00 502 377 587 142
44 Rutgers State Univ - New Brunswick
USA 334 154 204 381 361 482 195
45 Tech Univ Munich Germany 333 431 241 276 204 500 320
46 Karolinska Inst Stockholm Sweden 330 308 278 327 216 498 215
47 Univ Edinburgh UK 329 227 171 276 367 491 316
48 Univ Paris 11 France 325 333 342 214 213 468 312
48 Univ Pittsburgh - Pittsburgh USA 325 189 00 428 265 670 200
48 Univ Southern California USA 325 00 273 419 230 535 205
51 Univ Munich Germany 324 372 211 124 320 560 311
52 Univ Rochester USA 320 333 91 303 272 449 501
53 Australian Natl Univ Australia 319 178 129 410 314 436 307
54 Osaka Univ Japan 315 126 00 262 312 721 302
55 Univ California - Irvine USA 314 00 250 338 296 472 299
56 Univ North Carolina - Chapel Hill USA 312 126 00 381 345 605 203
57 Univ Maryland - Coll Park USA 311 259 00 400 332 540 174
25
57 Univ Zurich Switzerland
311 126 273 214 303 489 299
59 Univ Copenhagen Denmark 310 308 247 231 226 481 298
60 Univ Bristol UK 306 109 182 327 266 491 294
61 McGill Univ Canada 304 288 00 315 263 590 292
62 Carnegie Mellon Univ USA 303 189 302 327 174 388 340
63 Univ Leiden Netherlands
298 251 158 303 220 473 303
64 Univ Heidelberg Germany 297 109 277 231 221 497 285
65 Case Western Reserve Univ USA 296 372 118 231 222 461 406
66 Moscow State Univ Russia 295 515 349 00 81 585 283
67 Univ Florida USA 293 154 00 338 243 664 163
68 Univ Oslo Norway 292 259 341 195 172 421 280
69 Tohoku Univ Japan 288 189 00 195 261 693 277
69 Univ Sheffield UK 288 235 144 231 288 462 277
71 Purdue Univ - West Lafayette USA 287 189 171 315 221 505 138
72 Univ Helsinki Finland 286 189 182 151 237 569 275
73 Ohio State Univ - Columbus USA 285 178 00 410 206 613 96
74 Uppsala Univ Sweden 284 259 329 00 304 525 145
75 Rice Univ USA 283 218 223 262 237 302 446
76 Univ Arizona USA 281 00 00 315 377 565 181
77 Kings Coll London UK 280 166 235 231 198 462 269
78 Univ Manchester UK 279 259 193 214 182 486 268
79 Univ Goettingen Germany 274 388 204 175 182 428 263
80 Michigan State Univ USA 270 126 00 391 284 505 105
80 Univ Nottingham UK 270 154 204 231 201 451 259
82 Brown Univ USA 268 00 139 303 279 414 304
82 Univ Melbourne Australia 268 154 144 214 192 530 258
82 Univ Strasbourg 1 France 268 295 229 214 213 352 257
85 Ecole Normale Super Paris France 265 479 250 175 182 296 254
86 Boston Univ USA 263 154 00 327 296 515 96
86 Univ Vienna Austria 263 251 158 87 220 545 253
88 McMaster Univ Canada 260 166 193 231 162 452 250
26
88 Univ Freiburg Germany 260 251 214 195 180 409 250
90 Hebrew Univ Jerusalem Israel 259 154 00 262 295 483 249
91 Univ Basel Switzerland
258 259 175 214 242 355 248
92 Lund Univ Sweden 256 295 00 262 220 540 112
93 Univ Birmingham UK 255 251 112 247 140 476 245
93 Univ Roma - La Sapienza Italy 255 166 158 124 243 574 79
95 Humboldt Univ Berlin Germany 254 295 219 87 148 497 244
95 Univ Utah USA 254 00 00 327 307 484 201
97 Nagoya Univ Japan 252 00 144 151 237 553 242
97 Stockholm Univ Sweden 252 295 302 175 149 357 153
99 Tufts Univ USA 251 189 171 195 191 406 292
99 Univ Bonn Germany 251 199 204 175 167 439 241
Copyright copy 2004 Institute of Higher Education Shanghai Jiao Tong University All Rights Reserved
The methodology for the 2005 Global Ranking produced by SJTU has been slightly modified (see httpedsjtueducnrankinghtm)
27
APPENDIX 2
Citation thresholds for scientists across different disciplines
(January 1994 - June 2004)
Subject area Scientist Agricultural Sciences 154
Biology amp Biochemistry 780
Chemistry 648
Clinical Medicine 1095
Computer Science 84
Economics amp Business 169
Engineering 182
EnvironmentEcology 248
Geosciences 433
Humanities General 35
Immunology 763
Materials Science 219
Mathematics 130
Microbiology 534
Molecular Biology amp Genetics 1234
Multidisciplinary 123
Neuroscience amp Behaviour 908
Pharmacology amp Toxicology 312
Physics 1832
Plant amp Animal Science 292
PsychiatryPsychology 393
Social Sciences General 117
Space Science 1301 Updated Sept 1 2004 Thomson ISI Highly cited available from
httpin-citescomthresholds-citationhtml
Humanities score created by Amanda H Goodall
Note to Table The above citation thresholds represent the top 1 researchers (approximately 250) in each disciplinary field

2
and beyond move to the US Given the likely significance of universities to an economy if many top academics leave their home country this might be a cause for concern The role of research universities is currently receiving attention in Europe The European Parliament has created the Lisbon Agenda outlining goals to make the European Union the most competitive and dynamic knowledge-driven economy by 2010 (European Parliament March 2002) In Germany the Social Democratic Party recently announced a plan to spend 19 billion Euros to develop 10 elite universities that can compete with the world s best (April 9 2005 DW-Worldde) In 2002 a group of top universities in Europe founded the League of European Research Universities (LERU) On their website it states LERU acknowledges that Europe has lost its pre-eminent position in basic research (wwwleruorg)
Methodology
This paper focuses on one set of variables or characteristics namely the lifetime citations of presidents This score is used here as a measure of how research-active and successful a president has been in his or her academic career The lifetime citation score of presidents is normalised in this study to adjust for different disciplinary conventions
The university ranking used in this study has been produced by the Institute of Higher Education at Shanghai Jiao Tong University in their Academic Ranking of World Universities (2004) (See Appendix 1 for the full list of 100 universities) As is explained below this is probably the most reliable league table available
Citations
Citations are references to authors in other academic papers as acknowledgement of their contribution to a specific research area Citation information used in this study comes from Web of Science the on-line database comprising the Science Citation Index Social Science Citation Index and the Arts and Humanities Citation Index
Data on the presidents of the world s top 100 universities identified as shown below were collected between mid October and early December 2004 Only those presidents in post during this period are included and to the author s knowledge no presidents changed during this 3 month period Biographical information came from university web sites though direct requests for CVs were made on occasion Each president s lifetime citations were counted by hand
Most important when using citations as any kind of measure is recognition of the huge differences between disciplines For example a highly cited social scientist might have a lifetime citation score of around 5000 whereas a molecular biologist could have a score over 20000 Bibliometric indicators have been used more consistently across the sciences than in the humanities and social sciences Such use is most evident in the natural and life sciences though less so in engineering and the behavioural sciences (van Raan 2003) These disciplines publish more journal articles and have a higher prevalence of co-authorship
3
The social sciences are patchier For example economics relies heavily on journal articles though unlike the science publications that tend to publish quickly in economics it can take up to two years from acceptance for publication of a journal article to appear (Hamermesh 1994) Writing articles for journals is less common in the arts and humanities These disciplines tend more towards publishing monographs Cronin et al (1997) found that in the discipline of sociology two distinct groups of highly cited academics co-existed -- those highly cited through journal articles and those through monographs This should not present a problem here because citations from both books and journals have been counted
ISI has created a Highly Cited (ISI HiCi) category that identifies approximately the top 250 academic researchers (depending on discipline) across 21 broad subject areas They are dominated by science subjects totalling 19 The social sciences are also covered but there are only two social science subject areas namely Economics and Business and Social Sciences - General Currently no Highly Cited category exists for authors in the arts or humanities
The discrepancies in citation levels across disciplines are demonstrated in the number of new cited references that appear in ISI every week The sciences generate approximately 350000 new cited references weekly the social sciences 50000 and the humanities 15000
Using citation thresholds produced by ISI HiCi a normalised citation score has been produced in this paper for 23 subject areas (see next section and Appendix 2) These include a score for the humanities that has been generated for the purposes of this study It is necessary to note that the discipline of law is classified in ISI as being in the social sciences not the humanities It is included here in the Social Sciences - General category
In this paper each university president is assigned a normalised citation score which reflects both the differences across disciplines and their personal citation levels This score is referred to as the P-score = president s individual lifetime citation score normalised for discipline The P-score has been generated by using a scale produced by ISI HiCi It has been used here as an exchange rate normalising the different citation conventions across disciplines Each president s lifetime citation score has then been divided by their subject score The normalised P-score produced through this process makes it possible to do like-for-like comparisons between individuals from different disciplines
Substantial effort has been made to try to accurately assign citation numbers to people s names Though some measurement error must be presumed two studies that adopt different counting methods -- Seng and Willett (1995) who use a very precise method on the one hand and Oppenheim (1995) who assigned citations more approximately on the other -- both report very similar correlations
Van Raan (1998 2003 2005) has raised areas for concern when using citations as measures of quality He suggests that citation indices have become easy tools for policy makers and university administrators keen to make quick assessments of individual research output and quality (2005) Wouters (1999) points out that the ISI system was designed to retrieve information not evaluate it
4
Self-citing is a potential problem that can take two forms first over-citing one s own work in academic papers and second self-citation in journals to try to raise the journal impact factor An example of this is raised by Fassoulaki et al (2000) where authors report a significant correlation between self-citation levels and journal impact scores in the 1995 and 1996 issues of six anaesthesia journals
Other possible difficulties with citations include inconsistencies in methods of referencing and inaccuracies in citation statistics (Moed 2002 King 2004) Finally monopoly concerns have been raised about over-reliance on the Web of Science (Weingart 2003 2004)
Language biases have been shown to exist within ISI (van Leeuwen et al 2001) though it is now considered to be less of a problem because most journals publish in English (King 2004) King suggests that preferential referencing may take place in the US (ie that Americans are more likely to reference Americans) partially a feature of the size of that nation s output To try to circumvent this separate analyses of US data are offered below
Although van Raan (2005) notes the weaknesses of bibliometric measures he also argues that citations are a good indicator of performance over long periods of time His preference for evaluating science is to couple peer review with bibliometric analysis King (2004) suggests that citations are the most reliable measure of research quality and output In a feature in the journal Nature King uses the ISI citation index to measure the quantity and quality of science across different nations (2004)
There have been a number of studies comparing the UK s Research Assessment Exercise (RAE) results with bibliometric measures Oppenheim (1997) uses ISI data to compare 1992 RAE results with citation indicators in three subject areas anatomy genetics and archaeology He finds a strong correlation between the two methods of assessment and notes that in archaeology there is a greater reliance on monographic literature Norris and Oppenheim (2003) replicate this study with the same results following the 2001 RAE Smith and Eysenck (2002) discover a similar correlation across all UK psychology departments in the 2001 RAE
Normalising citations to produce P-scores
To obtain a P-score the individual presidential citations were divided by the ISI Highly Cited disciplinary thresholds (see Appendix 2) The threshold dates correspond to the dates the data were collected within a month The subject thresholds are being used here as an exchange rate for assessing different citation conventions
The humanities score was created by the author using the new cited references generated by ISI each week Corresponding with the data collection dates as closely as possible the sciences approximated at 350000 new cited references weekly the social sciences 50000 and the humanities 15000 If we divide the social science weekly score of 50000 by the humanities 15000 we get a figure of 333 The author has then divided the Social Sciences General score of 117 (see Appendix 2) by 333 which creates a score of 3513 The number 35 has been used here as the Humanities General score
5
League tables
As higher education has become global in the recruitment of international students and staff so have league tables International tables have existed for a number of years in areas such as business education through the Financial Times In 2003 the first global league table of universities was produced by the Institute of Education in Shanghai at Jiao Tong University (SJTU) SJTU used a process of inviting comment through their website to make adjustments to their methodology for the 2004 table
The UK based Times Higher Education Supplement (THES) produced a global ranking in November 2004 (wwwthescouk) which has not been used in this study There are three main problems with the league table First 50 weight is assigned to a subjective peer-review process where 1300 academics across 88 countries are invited to name the top institutions in their geographic area and their academic field This is the largest component in the ranking yet there is no information available on the background of these global academics That is a concern For example how might an individual s choice have been influenced by their own place of education sabbatical leave or co-authorship and so on Second 10 weight is given for the international nature of an institution s student body and staff However there is little explanation about why international is a proxy for high quality Finally because the THES is a commercial organisation it is not possible to access the data or check the calculations
An advantage of the SJTU table is that it is not produced by a newspaper or magazine Media-generated league tables are ubiquitous and controversial Tables such as those in The Times and US News and World Report in the US offer information to potential students across a range of criteria Media-driven league tables may be useful heuristic devices for students but as objective tools of assessment of university quality they are unreliable Perhaps the main criticism is that they are produced by commercial organisations designed to make money by selling their publications Therefore a headline is required To generate a story the methodology is changed often annually which ensures that institutions at the top rotate (Lombardi et al 2002) Lombardi and colleagues suggest instead that in the US university positions actually change very little each year if a fixed method of analysis is used (2002)
The Center for Studies in the Humanities and Social Sciences (wwwthecenterufledu ) was created as a non-profit organisation in 1998 in the United States Its mission is to develop methods for measuring and improving university performance For a number of years TheCenter has produced an alternative ranking The Top American Research Universities (Lombardi et al 2003)
This ranking differs from media equivalents because actual numbered positions are not assigned Instead universities are assessed on nine separate measures Those that score highly in at least one of the nine measures are put into a 1-25 top research university category3
3 The measures include total research federal research endowment assets annual giving national academy members faculty awards doctorates granted postdoctoral appointees and SAT scores Some degree of ranking does exist because they are ordered depending on the number of points they score across the nine categories So the top three universities score 9 out of 9 the next six universities score 8 out of 9 and so on
6
The measures of university quality used in both TheCenter and the SJTU world league tables do not exactly correspond However it is interesting to compare the number of US universities at the top in both tables TheCenter s top-25 category has 52 universities included Of these 44 also feature in the SJTU global table Positions 1-27 are exactly correlated in both rankings In other words these two rankings of top US universities are very similar
The Academic Ranking of World Universities (2004) league table uses 6 different criteria to assess universities The table below comes from the SJTU web site
Table 1 Methodology used in SJTU ranking 2004
Criteria
Indicator Code
Weight
Quality of Education
Alumni of an institution winning Nobel Prizes and Fields Medals
Alumni
10
Staff of an institution winning Nobel Prizes and Fields Medals
Award
20 Quality of Faculty
Highly cited researchers in 21 broad subject categories
HiCi 20
Articles published in Nature and Science
NampS 20 Research
Output Articles in Science Citation Index-expanded and Social Science Citation Index
SCI 20
Size of Institution
Academic performance with respect to the size of an institution
Size 10
Total 100
Copyright copy 2004 Institute of Higher Education Shanghai Jiao Tong University
For institutions specialized in humanities and social sciences such as London School of Economics NampS is not considered and the weight of NampS is relocated to other indicators
There are arguably some weaknesses in the SJTU methodology First younger universities stand to lose out particularly in the first category that assigns weight (10) to alumni awards Second the humanities and the social sciences are weakly represented here -- though SJTU have done some adjustment for this There are no ISI HiCi s in the arts and humanities and far fewer in the social sciences The Awards category is also limited Nobel Prizes are only given for achievement in physics chemistry medicinephysiology economics literature and peace and Fields Medals only for mathematics
7
Data on the 100 university presidents
It is important to note that the world league table ranks institutions by assigning points (as per criteria above) This can result in two or more institutions being given the same position (see the full list in Appendix 1)
The universities in the top-100 table are dominated by the United States where 51 of the institutions are located As can be seen in Figure 1 US institutions are unevenly spread across the world s top 100 dominating the top 20 with 17 universities and with 30 in the top 40 Of the 100 total only 4 in the bottom 20 are US-based If we treat American states as individual nations California with a population of 36 million has the highest number of leading universities Ten Californian institutions are within the top 55 6 of these are in the top 20 and 7 of the 10 are public or state universities
Thirty-seven institutions out of 100 are located in European countries Of these 11 are in the United Kingdom 7 in Germany 4 in both France and Sweden 3 in Switzerland 2 in the Netherlands and 1 each in Austria Denmark Finland Norway Italy and Russia Finally among the top 100 there are 12 universities in the rest of the world -- 5 in Japan 4 in Canada 2 in Australia and 1 in Israel
The nation location of an institution is not always reflected in the nationality of its president For example the top 10 universities are found in two countries -- US (8) and UK (2) whereas the leaders come from four -- Canada New Zealand UK and the US There are 15 female presidents in the sample Six are in the top 20 universities and 10 are within the top 50 North America dominates with 9 US female presidents and 2 in Canada The remaining four are in Denmark France Sweden and the UK
Every president in the group of 100 universities has a PhD The majority have been academics though two presidents spent most of their careers in non-research positions in industry or government and a small group went almost directly into academic administration
The age of a president potentially affects his or her lifetime citation levels The older they are the greater the opportunity to accrue citations It is therefore necessary to check whether presidents with the highest levels of lifetime citations are in fact older than those with fewer citations Some European universities still publish date of birth information though they are in the minority Birth dates can be loosely calculated by using individuals age at graduation from first degree Using this method it is possible to compare the ages of presidents at the top and bottom of the top-100 global league table If it is shown that the top presidents are markedly older than those in the bottom 20 then adjustment of citation scores would be necessary
The ages of only 80 of presidents in the top 20 universities and 80 of presidents in the bottom 20 could be obtained The mean age of presidents in the top 20 universities is 58 years In the bottom 20 category the mean age of president is 60 Because of the closeness in age between these two groups and in particular the slightly older average age of the lowest quintile citation scores have not been adjusted
Figure 2 displays the disciplinary background of the presidents What is noticeable is the evenness of disciplinary spread across each quintile Of the 100 presidents 52 have a
8
scientific background The scientists are dominated by the life sciences at 50 but there are also 11 engineers 6 physicists 5 chemists and 4 computer scientists
Thirty-seven of the 100 presidents are social scientists The largest disciplinary group among the social scientists is that of lawyers who number 15 Within a second group of 16 there is an even spread of educationalists political scientists sociologists and those from public and social policy Finally there are 6 economists
Eleven presidents are from the arts and humanities This group is noticeably smaller Taylor (1986) documents the disciplinary distribution amongst vice chancellors and principals in the UK in 1986 He also cites earlier work by Collison and Millen (1969) who showed that in the UK between 1935 and 1967 the proportion of presidents from the arts declined from 68 to 48 while scientists rose from 19 to 41 Taylor then reports his own findings that by 1981 67 of vice chancellors and principals were scientists 13 from the social sciences and less than 20 were from the arts Cohen and March (1974) showed a similar pattern -- in the number of presidents from the arts - for the US between 1924 and 1969
In a study by Dolton and Ma (2001) on CEO Pay the disciplinary backgrounds of UK vice chancellors are reported Drawn from a wide cross-section of British universities (including Oxbridge civic universities former colleges of advanced technology among others) they note that VCs in position in 1999 included 3 lawyers 13 engineers scientists made up 25 social sciences including business 36 and finally VCs from the arts and humanities made up 13 10 were reported as being non-academics
Of the 100 presidents in the current paper s sample 12 are ISI Highly Cited (HiCi) academics These individuals are more common in the top universities Of the 12 presidents in HiCi 6 are in the top 20 group of universities 3 in the next 20 2 in the next and 1 in the fourth quartile Finally there are 3 Nobel Prize winners among the presidents (all in medicine) -- two in the top 20 and one in the 20-40 category
The distribution of citations across the 100 presidents fits Lotka s Law an application that is often used in bibliometric research Lotka (1926) describes the frequency of publication by authors in a given field As can be observed in Figure 3 using presidents P-scores a version of this law applies here Lotka s power law predicts that of all the authors in a specific field approximately 60 percent will publish just one article 15 percent will have two publications 7 percent of authors will publish three pieces and so on (Potter 1988) According to Lotkas Law of scientific productivity only 6 percent of the authors in a field will produce more than 10 articles (the number making n contributions is about 1nsup2 of those making one) This law is most accurate when applied over long periods of time and to large bodies of work -- for example individuals lifetime citations
The results
As outlined above the 100 presidents lifetime citations are represented by a normalised P-score
The individual citation scores of the 100 presidents before adjustment range from 0 to 28718 The mean citation score is 2731 and the median is 371 After adjusting for discipline the highest P-score is 37 points and the lowest is 0 The mean P-score is 603
9
and the median is 227 When the group of 100 is split into two the top leaders of the 50 universities have a mean P-score of 876 and a median of 457 and those in the bottom half of universities have a mean P-score of 330 and a median of 093 Of the total group of 100 presidents 4 have a citation score of zero
The results are presented here in scatter plots and cross tabulations - that are grouped into quintiles (the 1-20 group always refers to the top of the SJTU table and 1 equals Harvard)
The most highly ranked universities have leaders who are more highly cited Figure 4 shows this It gives a cross-sectional breakdown of P-score by university rank in quintiles This shows a monotonic decline in citation levels as the universities go down in world rank
The next step is to try to establish statistical significance The paper does this in two ways
A natural first approach is to test whether the rank ordering of one variable is correlated with the rank order of the second variable Spearman s rank correlation coefficient is an appropriate measure The highest P-score is ranked 1 and the lowest P-score is ranked100 The actual rank of presidents P-scores is then tested for a correlation against university rank
Using these data Spearman s rho is calculated at 0378 With 100 observations the associated 5 critical value for a two-tailed test is 0195 and at 1 it is 0254 which establishes that the correlation is statistially significant at conventional confidence levels
A second approach can be seen in Figure 5 which gives the distribution of the 100 individual P-scores by world university rank Using Pearson s coefficient (r) the degree of linear relationship between the rank of university and president s P-score can be examined For the data in Figure 5 Pearson s r is 0345 The 1 critical value on a two-tailed test is 0254 which means again that the relationship is statistically significant4 There continues to be a statistically significant relationship if the natural logarithm of P-score is used this can be seen in Figure 5a
This correlation between cites and university quality can also be seen amongst the sub-sample of female presidents though at 15 the group is small (Figure 6) It is also statistically significant at the 1 level The disciplinary breakdown of the 15 female presidents is 7 scientists 7 social scientists and 1 from the humanities One president is Highly Cited
US universities make up 51 out of the 100 The mean P-score for this US group is 807 with a median score of 486 which is higher than the world group mean of 603 and median of 227 There are 25 scientists 21 social scientists and 5 in the humanities Of the 12 Highly Cited presidents in total 9 are based in US universities though two of these are non-Americans -- 1 is from Canada and 1 from the UK who is also a Nobel Prize winner
4 It should be noted that there is evidence that the residuals are skewed
10
Figure 7 presents a scatter plot for the sample of US presidents Again there is a correlation between citation levels and (world) university position The correlation is significant at the 1 level
It is useful to note that university rank explains only 12 of the variance in leaders citations In other words there are many other explanatory factors that are not being measured here However these correlations are significant enough to warrant further investigation and discussion
Is the citation-rank correlation true for universities outside the US
So far we have identified a strong positive relationship between the citation levels of university presidents and the position of their institution within a ranking of 100 universities This association exists amongst the 100 presidents in total the female group and the 51 US presidents
The mean citation P-score for presidents in the 49 countries in the rest of the world is 391 with a median score of 107 This is below the 100-group mean P-score of 6 and it is half the US mean P-score of 8 Therefore US presidents are twice as cited as those in the rest of the world
In the rest of the world the presidents include 27 scientists 16 social scientists and 6 in the humanities There are 3 Highly Cited researchers in the group Two are from the Netherlands and one in Germany
Figure 8 shows there is no statistically significant correlation between citation levels and position of president across the 49 countries in the rest of the world
As can be seen in the data one of the differences between the top American universities and non-American universities is that the former choose leaders who are more highly cited
Outliers
It is important to ensure that the results from this study have not been unduly influenced by a small number of presidents with extremely high P-scores To do this two tests are available First we can return to Spearman s rho which puts an equal weight on each observation instead of assigning continuous values As has been pointed out above a statistically significant rank correlation has been established with a significance level better than 1
The second check on outliers is simply to delete the data used from the highest P-scores for the Pearson s test To do this the top 5 of P-scores all located within ranges 30 and 40 were withdrawn and the correlation re-tested with a result of 0297 With 95 observations the 5 critical value for a two-tailed test is 0200 and at 1 it is 0260 so the correlation remains
11
Possible interpretations
Data on world university rankings have only recently become available That universities with strongly research-intensive missions appoint as their presidents men and women with strong citation records does not appear to have been previously documented The data in this paper do not enable judgements to be made about the weight assigned by selection committees to the research records of presidential candidates as distinct for example from other criteria such as managerial expertise or entrepreneurship But the data do suggest that research universities look for candidates who fit institutional missions
Internationally active researchers lead the world s top universities On average the higher the university is in the global ranking the more highly cited is that institution s president There are of course exceptions Two universities from the Netherlands -- in positions 39 and 63 -- both have presidents who are Highly Cited (It is interesting to note that these are the only two universities in the top 100 from that country) And there are top universities led by presidents with few or no citations However these cases are in a minority
These findings show that in at least one area the top universities are making different choices from those lower in the global ranking What can we learn from this difference Why do those institutions at the top appoint former researchers to the role of president
There are a number of possible reasons for the correlation They include
Hypothesis 1 Better researchers make better leaders of research universities
It has been recognised in the literature that presidents need to learn particular skills to enable them to lead a university (Cohen and March 1974 Rosovsky 1991 Middlehurst 1993 Bargh et al 2000 among others) In the UK an organisation for training academic leaders has recently been established with government funding
Whilst the education and career background of academic leaders has attracted some interest (Cohen and March 1974 Taylor 1986 Bargh at al 2000 Dolton and Ma 2001) little specific attention has been given to the research background of presidents Yet many university websites make a great deal of the eminence of the president
It seems clear that better researchers will tend to have greater prestige within the hierarchy of the academy and presidents who are highly cited may therefore enjoy credibility and negotiating strength that extends beyond their own discipline Jeremy Knowles the former Dean of Harvard s Faculty of Arts and Sciences (from 1991 2002) said that he believed his own research record helped his position as dean because it gave him greater status and therefore negotiating power when dealing with eminent faculty (interview with author April 12 2005) This suggests that being a cited researcher is of symbolic importance
This message was repeated in an interview with Amy Gutmann President of the University of Pennsylvania who said that being a researcher sends a signal to the faculty that you the president share their scholarly values and general understanding of the culture of the academy (interview April 28 2005)
12
Being a successful research academic may also help in attracting faculty particularly stars to a university which has become a preoccupation the world over Having a president who is a distinguished researcher may enhance the appeal of an institution
Alternatively it may be that two separate components are involved when leading a research university namely managerial expertise and inherent knowledge The former pertains to having knowledge of generic functions such as finance and budgeting human resource management corporate governance among others Most presidents running top universities will have had experience in managerial positions -- running large laboratories as head of department or pro-vice chancellor Experienced managers can also be brought in to perform specialised administrative roles Thus a former UK university vice chancellor has suggested (in personal correspondence) that what matters is scholarship not just management -- that we should take management for granted
The term inherent knowledge is used here to suggest a specific knowledge of or insight into academe that is borne out of expertise gained through academic research It suggests that good researchers may bring something else to the role of leader -- a perspective and understanding directly linked to their past as a successful scholar
It is possible that inherent knowledge also helps leaders inform strategy-making For example it may be easier to interpret research trends and future intellectual directions But how easy is it for a highly cited chemist to assess a faculty member from information science or discern the future direction of modern languages One possibility is that faculty at the top of their fields can make a fair assessment about the quality of work produced by those in other fields by using the same mechanisms used generally in academia namely citation indices and peer review
Hypothesis 2 Top universities appoint good researchers for reasons relating to external factors such as PR and fundraising
It has been said that US presidents in top universities spend a great deal of time fundraising and subsequently that they are less involved with running the institution This is not the place to compare US presidential leadership with European rectors or British vice chancellors Briefly however the American system is unitary with the president at the head of the hierarchy Though the president reports to a powerful board of trustees he or she is ultimately in charge with a role similar to that of a chief executive officer Senior academic administrators in the US (deans provosts chairs of departments) are normally appointed not voted into position by faculty In short the US presidential system is recognised as giving greater authority and powers to university leaders when compared to other systems of higher education from Europe to Japan (Rosovsky 1991 Bargh et al 2000) This is particularly true of US private universities US publics on the other hand are more exposed to state government intervention
Amy Gutmann President of University of Pennsylvania was clear in an interview that she is centrally involved in making senior appointments and in deciding the overall strategic direction of the university Long term strategy is designed through a collaborative process involving the president and the deans and provosts that she appoints and whose work she oversees (April 28 2005)
13
Appointment committees may select high-profile academics as presidents for external reasons The alumni may be encouraged to give more generously Gaining greater media exposure for the institution may also be a motive Alternatively if the governing body of a university wants to push an institution in a different direction towards research it may consider appointing a good researcher to signal a change in the internal culture
Hypothesis 3 The correlation is explained through unobservable heterogeneity
This would mean that research talent is merely a proxy for leadership ability The positive relationship between presidents P-scores and university rank may actually be picking up a correlation between other variables For instance presidents who are good at research may just be good at everything This is the alternative to a cause-and-effect relationship
All correlations are potentially susceptible to this kind of criticism It seems implausible however that candidates research records do not play a part in their selection for headship of institutions with prominent research missions
Concluding comments
This study which seems to be the first of its kind finds a correlation between the citations of presidents and the positions of their universities in a world league table Better universities are run by better researchers
The statistical relationship is strong for the group of 100 universities as a whole and for the sub-samples of female presidents and US presidents On average one extra point on a president s adjusted citation score where scores run from zero for the least-cited president to a score of up to 40 for Highly Cited and Nobel-prize winning presidents is associated with ten extra places in the world s top-100 ranking of universities No statistically significant correlation is found however for the sub-sample of universities from the rest of the world
Simple quantitative research of this kind may offer insights into university leadership - insights that are particularly relevant to universities that want to compete for a position amongst the world s top research institutions The best universities which can choose from the widest pool are systematically selecting top researchers to lead them What do such researchers bring to the role of leader This paper posits that there are two central components involved in leading research universities managerial expertise and inherent knowledge It is suggested here that better researchers may have greater inherent knowledge about academe that in turn informs their role as leader A president s research background may also have symbolic value in that it sends out a signal about the values of that institution And finally being a reputed researcher may raise a leader s status within the academic community and enhance his or her powers of negotiation
However the paper notes that other interpretations of the data are possible One is that universities choose top researchers for reasons of prestige and to assist in fundraising This is probably true as a factor for selection though it is unlikely to be the sole function
14
of a president in a top institution Another is that research ability is simply a proxy for some other kind of talent that is useful to leaders
Causality cannot be established through these correlations The performance of a university has not been shown here to be linked to the actions of a president or vice chancellor whether highly cited or not However this type of study starts the process of understanding whether there may be benefits from appointing a researcher as president A further study is underway exploring causality
15
0
5
10
15
20
1 - 20 21 - 40 41 - 60 61 - 80 81 - 100
Figure 1 The cross-country distribution of the worlds top 100 universities
USA EuropeRest World
Num
ber
of u
nive
rsiti
es
University rank (1 is top)
0
5
10
15
20
25
0 - 20 21 - 40 41 - 60 61 - 80 81 - 100
Figure 2 The disciplines of the presidents of the worlds top universites
ScienceHumanitiesSocial science
Dis
cipl
ine
University rank
16
-1
0
1
2
3
4
5
05 1 15 2 25 3 35 4
Figure 3 The distribution of presidents lifetime citations follows Lotkas power law
Loga
rithm
of t
he n
umbe
r of
pre
side
nts
Logarithm of presidents P-scores
17
0
50
100
150
200
0-20 21-40 41-60 61-80 81-100
Figure 4 A cross-tabulation of presidents lifetime citation P-scores by world university rank
(in quintiles)
Pre
side
nts
P-s
core
University rank
18
-10
0
10
20
30
40
0 20 40 60 80 100
Figure 5 Presidents P-scores by rank among
the worlds top 100 universities
y = 11305 - 01047x R= 034479 P
resi
dent
s P
- sc
ore
University rank
-8
-6
-4
-2
0
2
4
0 20 40 60 80 100
Figure 5a Logarithm of presidents P-scores by university rank
y = 14413 - 0021876x R= 026413
Log
of p
resi
dent
s P
-sco
re
University rank
19
-5
0
5
10
15
20
0 20 40 60 80 100
Figure 6 Female presidents P-scores by university rank
y = 97036 - 012631x R= 069052
Pre
side
nts
P-s
core
University rank
-10
0
10
20
30
40
0 20 40 60 80 100
Figure 7 US presidents P-scores by university rank
y = 13492 - 013997x R= 037505
Pre
side
nts
P-s
core
University rank
20
-10
0
10
20
30
40
0 20 40 60 80 100
Figure 8 Presidents from the rest of the world P-scores by university rank
y = 61896 - 003646x R= 014019 P
resi
dent
s P
-sco
re
University rank
21
References
Bargh C Bocock J Scott P and Smith D (2000) University Leadership The Role of the Chief Executive Open University Press Buckingham
Bok D (2003) Universities in the Marketplace The commercialisation of Higher Education Princeton University Press New Jersey
Cohen MD and March JG (1974) Leadership and Ambiguity McGraw-Hill New York
Collison P and Millen J (1969) University chancellors vice chancellors and college principals A social profile Sociology Vol 3 No 1 pp 77-109
Cronin B Snyder H and Atkins H (1997) Comparative citation rankings of authors in monographic and journal literature a study of sociology Journal of Documentation Vol 53 No 3 pp 263-273
Dolton P and Ma A (2001) CEO Pay in the Public Sector The Case of Vice Chancellors in UK Universities Newcastle UK Working paper Newcastle University Discussion Papers in Economics
Fassoulaki A Paraskeva A Papilas K and Karabinis G (2000) Self-citations in six anaesthesia journals and their significance in determining the impact factor British Journal of Anaesthesia Vol 87 No 2 pp 266-269
Hamermesh DS (1994) Facts and Myths about Refereeing Journal of Economic Perspectives Vol 8 No 1 Winter pp 153-163
King DA (2004) The scientific impact of nations Nature Vol 430 pp 311-316
Lombardi JV Craig DD Capaldi ED and Gater DS (2002) The Top American Research Universities An Overview TheCenter Reports University of Florida Gainesville
Lombardi JV Craig DD Capaldi ED Reeves KR and Gater DS (2003) The Top American Research Universities TheCenter University of Florida Gainesville
Lotka AJ (1926) The Frequency Distribution of Scientific Productivity Journal of the Washington Academy of Sciences Vol 16 No12 pp 317-323
Middlehurst R (1993) Leading Academics Open University Press Buckingham
Moed HF (2002) The impact factors debate the ISI s uses and limits Nature Vol 415 pp 731-732
Norris M and Oppenheim C (2003) Citation counts and the Research Assessment Exercise V
Archaeology and the 2001 RAE Journal of Documentation Vol 59 No 6 pp 709-730
Oppenheim C (1995) The correlation between citation counts and the 1992 Research Assessment Exercise Ratings for British library and information science university departments Journal of Documentation Vol 51 pp 18-27
Oppenheim C (1997) The correlation between citation counts and the 1992 Research Assessment Exercise ratings for British research in genetics anatomy and archaeology Journal of Documentation Vol 53 No 5 pp 477-487
Potter W G (1988) Of Making Many Books There is No End Bibliometrics and Libraries The Journal of Academic Librarianship Vol14 pp 238a-238c
Rosovsky H (1991) The University An Owners Manual Norton New York
Seng LB amp Willett P (1995) The citedness of publications by United Kingdom library schools Journal of Information Science Vol 21 pp 68-71
Smith A and Eysenck M (2002) The correlation between RAE ratings and citation counts in psychology Working paper Department of Psychology Royal Holloway University of London
Taylor W (1986) Organisational Culture and Administrative Leadership in Universities In Leadership and Organisational Culture (eds Sergiovanni TJ and Corbally JE) pp125-141 Illini Books University of Illinois
Tierney W Corwin Z amp Colyar JE (Eds) (2004) Competing conceptions of governance Negotiating the perfect storm John Hopkins University Press Baltimore MD
22
van Leeuwen TN Moed HF Tijssen RJW Visser MS and Van Raan AFJ (2001)
Language biases in the coverage of the Science Citation Index and its consequences for international comparisons of national research performance Scientometrics Vol 51 No1 pp 335-346
van Raan AFJ (1998) Assessing the social sciences the use of advanced bibliometric methods as a necessary complement to peer review Research Evaluation Vol 7 pp 2-6
van Raan AFJ (2003) The use of bibliometric analysis in research performance assessment and monitoring of interdisciplinary scientific developments Technikfolgenabschatzung Vol 1 pp 20-29
van Raan AFJ (2005) Fatal Attraction Conceptual and methodological problems in the ranking of universities by bibliometric methods Scientometrics Vol 62 No 1 pp 133-143
Weingart P (2003) Evaluation of research performance the danger of numbers in Bibliometric analysis in science and research Applications Benefits and Limitations Second Conference of the Central Library Forschungszentrum Julich pp 7-19
Weingart P (2004) Impact of bibliometrics upon the science system inadvertent consequences in Handbook on Quantitative Science and Technology Research (eds Moed HF Glanzel W and Schmoch U) Kluwer Academic Publishers Dordrecht The Netherlands
Wouters PF (1999) The Citation Culture PhD Thesis University of Amsterdam The Netherlands
Interviews
Amy Gutmann President University of Pennsylvania -- interview at University of Pennsylvania April 28 2005
Jeremy Knowles Former Dean Faculty of Arts and Sciences Harvard -- interview at Harvard April12 2005
League tables
Academic Ranking of World Universities 2004 Institute of Higher Education Shanghai Jiao Tong University [httpedsjtueducnrankinghtm]
Top American Research Universities TheCenter [httpthecenterufledu]
Statistical packages
Paleontological Statistics Software Package for Education and Data Analysis Palaeontologia Electronica 4(1) 9pp [httppalaeo-electronicaorg2001_1pastissue1_01htm]
KaleidaGraph Synergy Software at [wwwsynergycom]
23
APPENDIX 1
Top 500 World Universities (1-100) 2004
World Rank
Institution Country Total Score
Score on
Alumni
Score
on Award
Score
on HiCi
Score on
NampS
Score on SCI
Score on Size
1 Harvard Univ USA 1000
986 1000
1000
1000
1000
606
2 Stanford Univ USA 772 412 722 961 752 723 681
3 Univ Cambridge UK 762 1000
934 566 585 702 732
4 Univ California - Berkeley USA 742 700 760 741 756 727 451
5 Massachusetts Inst Tech (MIT) USA 724 741 789 736 691 646 475
6 California Inst Tech USA 690 593 665 648 667 532 1000
7 Princeton Univ USA 636 610 768 654 521 468 673
8 Univ Oxford UK 614 644 591 531 553 652 590
9 Columbia Univ USA 612 778 588 573 516 683 370
10 Univ Chicago USA 605 722 819 553 466 541 327
11 Yale Univ USA 586 522 445 636 581 636 504
12 Cornell Univ USA 555 466 524 605 472 662 336
13 Univ California - San Diego USA 538 178 347 636 594 672 479
14 Tokyo Univ Japan 519 361 144 445 550 919 498
15 Univ Pennsylvania USA 518 356 351 612 446 726 340
16 Univ California - Los Angeles USA 516 274 328 605 481 799 248
17 Univ California - San Francisco USA 508 00 376 593 595 629 488
18 Univ Wisconsin - Madison USA 500 431 363 553 480 692 190
19 Univ Michigan - Ann Arbor USA 493 398 193 648 457 767 201
20 Univ Washington - Seattle USA 491 227 302 573 496 788 162
21 Kyoto Univ Japan 483 398 341 400 372 771 464
22 Johns Hopkins Univ USA 475 487 283 437 526 717 142
23 Imperial Coll London UK 464 209 381 462 394 658 445
24 Univ Toronto Canada 446 281 197 391 412 784 428
25 Univ Coll London UK 443 308 329 410 410 611 426
25 Univ Illinois - Urbana Champaign USA 433 417 374 462 360 582 178
24
27 Swiss Fed Inst Tech - Zurich Switzerland
432 403 370 391 432 471 415
28 Washington Univ - St Louis USA 431 251 266 419 468 562 449
29 Rockefeller Univ USA 402 227 598 315 436 271 386
30 Northwestern Univ USA 395 218 193 479 358 572 370
31 Duke Univ USA 389 209 00 486 468 627 362
32 New York Univ USA 387 339 250 437 393 509 191
33 Univ Minnesota - Twin Cities USA 383 361 00 539 359 696 128
34 Univ Colorado - Boulder USA 378 166 298 437 383 475 274
35 Univ California - Santa Barbara USA 370 00 285 454 414 440 362
36 Univ British Columbia Canada 363 209 193 360 316 595 349
36 Univ Texas Southwestern Med Center
USA 363 166 339 338 405 400 349
38 Vanderbilt Univ USA 351 126 302 371 238 502 417
39 Univ Utrecht Netherlands
349 308 214 315 299 581 221
40 Univ Texas - Austin USA 348 218 171 502 288 537 128
41 Univ Paris 06 France 339 357 239 231 247 567 326
42 Univ California - Davis USA 336 00 00 486 372 647 207
43 Pennsylvania State Univ - Univ Park
USA 335 141 00 502 377 587 142
44 Rutgers State Univ - New Brunswick
USA 334 154 204 381 361 482 195
45 Tech Univ Munich Germany 333 431 241 276 204 500 320
46 Karolinska Inst Stockholm Sweden 330 308 278 327 216 498 215
47 Univ Edinburgh UK 329 227 171 276 367 491 316
48 Univ Paris 11 France 325 333 342 214 213 468 312
48 Univ Pittsburgh - Pittsburgh USA 325 189 00 428 265 670 200
48 Univ Southern California USA 325 00 273 419 230 535 205
51 Univ Munich Germany 324 372 211 124 320 560 311
52 Univ Rochester USA 320 333 91 303 272 449 501
53 Australian Natl Univ Australia 319 178 129 410 314 436 307
54 Osaka Univ Japan 315 126 00 262 312 721 302
55 Univ California - Irvine USA 314 00 250 338 296 472 299
56 Univ North Carolina - Chapel Hill USA 312 126 00 381 345 605 203
57 Univ Maryland - Coll Park USA 311 259 00 400 332 540 174
25
57 Univ Zurich Switzerland
311 126 273 214 303 489 299
59 Univ Copenhagen Denmark 310 308 247 231 226 481 298
60 Univ Bristol UK 306 109 182 327 266 491 294
61 McGill Univ Canada 304 288 00 315 263 590 292
62 Carnegie Mellon Univ USA 303 189 302 327 174 388 340
63 Univ Leiden Netherlands
298 251 158 303 220 473 303
64 Univ Heidelberg Germany 297 109 277 231 221 497 285
65 Case Western Reserve Univ USA 296 372 118 231 222 461 406
66 Moscow State Univ Russia 295 515 349 00 81 585 283
67 Univ Florida USA 293 154 00 338 243 664 163
68 Univ Oslo Norway 292 259 341 195 172 421 280
69 Tohoku Univ Japan 288 189 00 195 261 693 277
69 Univ Sheffield UK 288 235 144 231 288 462 277
71 Purdue Univ - West Lafayette USA 287 189 171 315 221 505 138
72 Univ Helsinki Finland 286 189 182 151 237 569 275
73 Ohio State Univ - Columbus USA 285 178 00 410 206 613 96
74 Uppsala Univ Sweden 284 259 329 00 304 525 145
75 Rice Univ USA 283 218 223 262 237 302 446
76 Univ Arizona USA 281 00 00 315 377 565 181
77 Kings Coll London UK 280 166 235 231 198 462 269
78 Univ Manchester UK 279 259 193 214 182 486 268
79 Univ Goettingen Germany 274 388 204 175 182 428 263
80 Michigan State Univ USA 270 126 00 391 284 505 105
80 Univ Nottingham UK 270 154 204 231 201 451 259
82 Brown Univ USA 268 00 139 303 279 414 304
82 Univ Melbourne Australia 268 154 144 214 192 530 258
82 Univ Strasbourg 1 France 268 295 229 214 213 352 257
85 Ecole Normale Super Paris France 265 479 250 175 182 296 254
86 Boston Univ USA 263 154 00 327 296 515 96
86 Univ Vienna Austria 263 251 158 87 220 545 253
88 McMaster Univ Canada 260 166 193 231 162 452 250
26
88 Univ Freiburg Germany 260 251 214 195 180 409 250
90 Hebrew Univ Jerusalem Israel 259 154 00 262 295 483 249
91 Univ Basel Switzerland
258 259 175 214 242 355 248
92 Lund Univ Sweden 256 295 00 262 220 540 112
93 Univ Birmingham UK 255 251 112 247 140 476 245
93 Univ Roma - La Sapienza Italy 255 166 158 124 243 574 79
95 Humboldt Univ Berlin Germany 254 295 219 87 148 497 244
95 Univ Utah USA 254 00 00 327 307 484 201
97 Nagoya Univ Japan 252 00 144 151 237 553 242
97 Stockholm Univ Sweden 252 295 302 175 149 357 153
99 Tufts Univ USA 251 189 171 195 191 406 292
99 Univ Bonn Germany 251 199 204 175 167 439 241
Copyright copy 2004 Institute of Higher Education Shanghai Jiao Tong University All Rights Reserved
The methodology for the 2005 Global Ranking produced by SJTU has been slightly modified (see httpedsjtueducnrankinghtm)
27
APPENDIX 2
Citation thresholds for scientists across different disciplines
(January 1994 - June 2004)
Subject area Scientist Agricultural Sciences 154
Biology amp Biochemistry 780
Chemistry 648
Clinical Medicine 1095
Computer Science 84
Economics amp Business 169
Engineering 182
EnvironmentEcology 248
Geosciences 433
Humanities General 35
Immunology 763
Materials Science 219
Mathematics 130
Microbiology 534
Molecular Biology amp Genetics 1234
Multidisciplinary 123
Neuroscience amp Behaviour 908
Pharmacology amp Toxicology 312
Physics 1832
Plant amp Animal Science 292
PsychiatryPsychology 393
Social Sciences General 117
Space Science 1301 Updated Sept 1 2004 Thomson ISI Highly cited available from
httpin-citescomthresholds-citationhtml
Humanities score created by Amanda H Goodall
Note to Table The above citation thresholds represent the top 1 researchers (approximately 250) in each disciplinary field

3
The social sciences are patchier For example economics relies heavily on journal articles though unlike the science publications that tend to publish quickly in economics it can take up to two years from acceptance for publication of a journal article to appear (Hamermesh 1994) Writing articles for journals is less common in the arts and humanities These disciplines tend more towards publishing monographs Cronin et al (1997) found that in the discipline of sociology two distinct groups of highly cited academics co-existed -- those highly cited through journal articles and those through monographs This should not present a problem here because citations from both books and journals have been counted
ISI has created a Highly Cited (ISI HiCi) category that identifies approximately the top 250 academic researchers (depending on discipline) across 21 broad subject areas They are dominated by science subjects totalling 19 The social sciences are also covered but there are only two social science subject areas namely Economics and Business and Social Sciences - General Currently no Highly Cited category exists for authors in the arts or humanities
The discrepancies in citation levels across disciplines are demonstrated in the number of new cited references that appear in ISI every week The sciences generate approximately 350000 new cited references weekly the social sciences 50000 and the humanities 15000
Using citation thresholds produced by ISI HiCi a normalised citation score has been produced in this paper for 23 subject areas (see next section and Appendix 2) These include a score for the humanities that has been generated for the purposes of this study It is necessary to note that the discipline of law is classified in ISI as being in the social sciences not the humanities It is included here in the Social Sciences - General category
In this paper each university president is assigned a normalised citation score which reflects both the differences across disciplines and their personal citation levels This score is referred to as the P-score = president s individual lifetime citation score normalised for discipline The P-score has been generated by using a scale produced by ISI HiCi It has been used here as an exchange rate normalising the different citation conventions across disciplines Each president s lifetime citation score has then been divided by their subject score The normalised P-score produced through this process makes it possible to do like-for-like comparisons between individuals from different disciplines
Substantial effort has been made to try to accurately assign citation numbers to people s names Though some measurement error must be presumed two studies that adopt different counting methods -- Seng and Willett (1995) who use a very precise method on the one hand and Oppenheim (1995) who assigned citations more approximately on the other -- both report very similar correlations
Van Raan (1998 2003 2005) has raised areas for concern when using citations as measures of quality He suggests that citation indices have become easy tools for policy makers and university administrators keen to make quick assessments of individual research output and quality (2005) Wouters (1999) points out that the ISI system was designed to retrieve information not evaluate it
4
Self-citing is a potential problem that can take two forms first over-citing one s own work in academic papers and second self-citation in journals to try to raise the journal impact factor An example of this is raised by Fassoulaki et al (2000) where authors report a significant correlation between self-citation levels and journal impact scores in the 1995 and 1996 issues of six anaesthesia journals
Other possible difficulties with citations include inconsistencies in methods of referencing and inaccuracies in citation statistics (Moed 2002 King 2004) Finally monopoly concerns have been raised about over-reliance on the Web of Science (Weingart 2003 2004)
Language biases have been shown to exist within ISI (van Leeuwen et al 2001) though it is now considered to be less of a problem because most journals publish in English (King 2004) King suggests that preferential referencing may take place in the US (ie that Americans are more likely to reference Americans) partially a feature of the size of that nation s output To try to circumvent this separate analyses of US data are offered below
Although van Raan (2005) notes the weaknesses of bibliometric measures he also argues that citations are a good indicator of performance over long periods of time His preference for evaluating science is to couple peer review with bibliometric analysis King (2004) suggests that citations are the most reliable measure of research quality and output In a feature in the journal Nature King uses the ISI citation index to measure the quantity and quality of science across different nations (2004)
There have been a number of studies comparing the UK s Research Assessment Exercise (RAE) results with bibliometric measures Oppenheim (1997) uses ISI data to compare 1992 RAE results with citation indicators in three subject areas anatomy genetics and archaeology He finds a strong correlation between the two methods of assessment and notes that in archaeology there is a greater reliance on monographic literature Norris and Oppenheim (2003) replicate this study with the same results following the 2001 RAE Smith and Eysenck (2002) discover a similar correlation across all UK psychology departments in the 2001 RAE
Normalising citations to produce P-scores
To obtain a P-score the individual presidential citations were divided by the ISI Highly Cited disciplinary thresholds (see Appendix 2) The threshold dates correspond to the dates the data were collected within a month The subject thresholds are being used here as an exchange rate for assessing different citation conventions
The humanities score was created by the author using the new cited references generated by ISI each week Corresponding with the data collection dates as closely as possible the sciences approximated at 350000 new cited references weekly the social sciences 50000 and the humanities 15000 If we divide the social science weekly score of 50000 by the humanities 15000 we get a figure of 333 The author has then divided the Social Sciences General score of 117 (see Appendix 2) by 333 which creates a score of 3513 The number 35 has been used here as the Humanities General score
5
League tables
As higher education has become global in the recruitment of international students and staff so have league tables International tables have existed for a number of years in areas such as business education through the Financial Times In 2003 the first global league table of universities was produced by the Institute of Education in Shanghai at Jiao Tong University (SJTU) SJTU used a process of inviting comment through their website to make adjustments to their methodology for the 2004 table
The UK based Times Higher Education Supplement (THES) produced a global ranking in November 2004 (wwwthescouk) which has not been used in this study There are three main problems with the league table First 50 weight is assigned to a subjective peer-review process where 1300 academics across 88 countries are invited to name the top institutions in their geographic area and their academic field This is the largest component in the ranking yet there is no information available on the background of these global academics That is a concern For example how might an individual s choice have been influenced by their own place of education sabbatical leave or co-authorship and so on Second 10 weight is given for the international nature of an institution s student body and staff However there is little explanation about why international is a proxy for high quality Finally because the THES is a commercial organisation it is not possible to access the data or check the calculations
An advantage of the SJTU table is that it is not produced by a newspaper or magazine Media-generated league tables are ubiquitous and controversial Tables such as those in The Times and US News and World Report in the US offer information to potential students across a range of criteria Media-driven league tables may be useful heuristic devices for students but as objective tools of assessment of university quality they are unreliable Perhaps the main criticism is that they are produced by commercial organisations designed to make money by selling their publications Therefore a headline is required To generate a story the methodology is changed often annually which ensures that institutions at the top rotate (Lombardi et al 2002) Lombardi and colleagues suggest instead that in the US university positions actually change very little each year if a fixed method of analysis is used (2002)
The Center for Studies in the Humanities and Social Sciences (wwwthecenterufledu ) was created as a non-profit organisation in 1998 in the United States Its mission is to develop methods for measuring and improving university performance For a number of years TheCenter has produced an alternative ranking The Top American Research Universities (Lombardi et al 2003)
This ranking differs from media equivalents because actual numbered positions are not assigned Instead universities are assessed on nine separate measures Those that score highly in at least one of the nine measures are put into a 1-25 top research university category3
3 The measures include total research federal research endowment assets annual giving national academy members faculty awards doctorates granted postdoctoral appointees and SAT scores Some degree of ranking does exist because they are ordered depending on the number of points they score across the nine categories So the top three universities score 9 out of 9 the next six universities score 8 out of 9 and so on
6
The measures of university quality used in both TheCenter and the SJTU world league tables do not exactly correspond However it is interesting to compare the number of US universities at the top in both tables TheCenter s top-25 category has 52 universities included Of these 44 also feature in the SJTU global table Positions 1-27 are exactly correlated in both rankings In other words these two rankings of top US universities are very similar
The Academic Ranking of World Universities (2004) league table uses 6 different criteria to assess universities The table below comes from the SJTU web site
Table 1 Methodology used in SJTU ranking 2004
Criteria
Indicator Code
Weight
Quality of Education
Alumni of an institution winning Nobel Prizes and Fields Medals
Alumni
10
Staff of an institution winning Nobel Prizes and Fields Medals
Award
20 Quality of Faculty
Highly cited researchers in 21 broad subject categories
HiCi 20
Articles published in Nature and Science
NampS 20 Research
Output Articles in Science Citation Index-expanded and Social Science Citation Index
SCI 20
Size of Institution
Academic performance with respect to the size of an institution
Size 10
Total 100
Copyright copy 2004 Institute of Higher Education Shanghai Jiao Tong University
For institutions specialized in humanities and social sciences such as London School of Economics NampS is not considered and the weight of NampS is relocated to other indicators
There are arguably some weaknesses in the SJTU methodology First younger universities stand to lose out particularly in the first category that assigns weight (10) to alumni awards Second the humanities and the social sciences are weakly represented here -- though SJTU have done some adjustment for this There are no ISI HiCi s in the arts and humanities and far fewer in the social sciences The Awards category is also limited Nobel Prizes are only given for achievement in physics chemistry medicinephysiology economics literature and peace and Fields Medals only for mathematics
7
Data on the 100 university presidents
It is important to note that the world league table ranks institutions by assigning points (as per criteria above) This can result in two or more institutions being given the same position (see the full list in Appendix 1)
The universities in the top-100 table are dominated by the United States where 51 of the institutions are located As can be seen in Figure 1 US institutions are unevenly spread across the world s top 100 dominating the top 20 with 17 universities and with 30 in the top 40 Of the 100 total only 4 in the bottom 20 are US-based If we treat American states as individual nations California with a population of 36 million has the highest number of leading universities Ten Californian institutions are within the top 55 6 of these are in the top 20 and 7 of the 10 are public or state universities
Thirty-seven institutions out of 100 are located in European countries Of these 11 are in the United Kingdom 7 in Germany 4 in both France and Sweden 3 in Switzerland 2 in the Netherlands and 1 each in Austria Denmark Finland Norway Italy and Russia Finally among the top 100 there are 12 universities in the rest of the world -- 5 in Japan 4 in Canada 2 in Australia and 1 in Israel
The nation location of an institution is not always reflected in the nationality of its president For example the top 10 universities are found in two countries -- US (8) and UK (2) whereas the leaders come from four -- Canada New Zealand UK and the US There are 15 female presidents in the sample Six are in the top 20 universities and 10 are within the top 50 North America dominates with 9 US female presidents and 2 in Canada The remaining four are in Denmark France Sweden and the UK
Every president in the group of 100 universities has a PhD The majority have been academics though two presidents spent most of their careers in non-research positions in industry or government and a small group went almost directly into academic administration
The age of a president potentially affects his or her lifetime citation levels The older they are the greater the opportunity to accrue citations It is therefore necessary to check whether presidents with the highest levels of lifetime citations are in fact older than those with fewer citations Some European universities still publish date of birth information though they are in the minority Birth dates can be loosely calculated by using individuals age at graduation from first degree Using this method it is possible to compare the ages of presidents at the top and bottom of the top-100 global league table If it is shown that the top presidents are markedly older than those in the bottom 20 then adjustment of citation scores would be necessary
The ages of only 80 of presidents in the top 20 universities and 80 of presidents in the bottom 20 could be obtained The mean age of presidents in the top 20 universities is 58 years In the bottom 20 category the mean age of president is 60 Because of the closeness in age between these two groups and in particular the slightly older average age of the lowest quintile citation scores have not been adjusted
Figure 2 displays the disciplinary background of the presidents What is noticeable is the evenness of disciplinary spread across each quintile Of the 100 presidents 52 have a
8
scientific background The scientists are dominated by the life sciences at 50 but there are also 11 engineers 6 physicists 5 chemists and 4 computer scientists
Thirty-seven of the 100 presidents are social scientists The largest disciplinary group among the social scientists is that of lawyers who number 15 Within a second group of 16 there is an even spread of educationalists political scientists sociologists and those from public and social policy Finally there are 6 economists
Eleven presidents are from the arts and humanities This group is noticeably smaller Taylor (1986) documents the disciplinary distribution amongst vice chancellors and principals in the UK in 1986 He also cites earlier work by Collison and Millen (1969) who showed that in the UK between 1935 and 1967 the proportion of presidents from the arts declined from 68 to 48 while scientists rose from 19 to 41 Taylor then reports his own findings that by 1981 67 of vice chancellors and principals were scientists 13 from the social sciences and less than 20 were from the arts Cohen and March (1974) showed a similar pattern -- in the number of presidents from the arts - for the US between 1924 and 1969
In a study by Dolton and Ma (2001) on CEO Pay the disciplinary backgrounds of UK vice chancellors are reported Drawn from a wide cross-section of British universities (including Oxbridge civic universities former colleges of advanced technology among others) they note that VCs in position in 1999 included 3 lawyers 13 engineers scientists made up 25 social sciences including business 36 and finally VCs from the arts and humanities made up 13 10 were reported as being non-academics
Of the 100 presidents in the current paper s sample 12 are ISI Highly Cited (HiCi) academics These individuals are more common in the top universities Of the 12 presidents in HiCi 6 are in the top 20 group of universities 3 in the next 20 2 in the next and 1 in the fourth quartile Finally there are 3 Nobel Prize winners among the presidents (all in medicine) -- two in the top 20 and one in the 20-40 category
The distribution of citations across the 100 presidents fits Lotka s Law an application that is often used in bibliometric research Lotka (1926) describes the frequency of publication by authors in a given field As can be observed in Figure 3 using presidents P-scores a version of this law applies here Lotka s power law predicts that of all the authors in a specific field approximately 60 percent will publish just one article 15 percent will have two publications 7 percent of authors will publish three pieces and so on (Potter 1988) According to Lotkas Law of scientific productivity only 6 percent of the authors in a field will produce more than 10 articles (the number making n contributions is about 1nsup2 of those making one) This law is most accurate when applied over long periods of time and to large bodies of work -- for example individuals lifetime citations
The results
As outlined above the 100 presidents lifetime citations are represented by a normalised P-score
The individual citation scores of the 100 presidents before adjustment range from 0 to 28718 The mean citation score is 2731 and the median is 371 After adjusting for discipline the highest P-score is 37 points and the lowest is 0 The mean P-score is 603
9
and the median is 227 When the group of 100 is split into two the top leaders of the 50 universities have a mean P-score of 876 and a median of 457 and those in the bottom half of universities have a mean P-score of 330 and a median of 093 Of the total group of 100 presidents 4 have a citation score of zero
The results are presented here in scatter plots and cross tabulations - that are grouped into quintiles (the 1-20 group always refers to the top of the SJTU table and 1 equals Harvard)
The most highly ranked universities have leaders who are more highly cited Figure 4 shows this It gives a cross-sectional breakdown of P-score by university rank in quintiles This shows a monotonic decline in citation levels as the universities go down in world rank
The next step is to try to establish statistical significance The paper does this in two ways
A natural first approach is to test whether the rank ordering of one variable is correlated with the rank order of the second variable Spearman s rank correlation coefficient is an appropriate measure The highest P-score is ranked 1 and the lowest P-score is ranked100 The actual rank of presidents P-scores is then tested for a correlation against university rank
Using these data Spearman s rho is calculated at 0378 With 100 observations the associated 5 critical value for a two-tailed test is 0195 and at 1 it is 0254 which establishes that the correlation is statistially significant at conventional confidence levels
A second approach can be seen in Figure 5 which gives the distribution of the 100 individual P-scores by world university rank Using Pearson s coefficient (r) the degree of linear relationship between the rank of university and president s P-score can be examined For the data in Figure 5 Pearson s r is 0345 The 1 critical value on a two-tailed test is 0254 which means again that the relationship is statistically significant4 There continues to be a statistically significant relationship if the natural logarithm of P-score is used this can be seen in Figure 5a
This correlation between cites and university quality can also be seen amongst the sub-sample of female presidents though at 15 the group is small (Figure 6) It is also statistically significant at the 1 level The disciplinary breakdown of the 15 female presidents is 7 scientists 7 social scientists and 1 from the humanities One president is Highly Cited
US universities make up 51 out of the 100 The mean P-score for this US group is 807 with a median score of 486 which is higher than the world group mean of 603 and median of 227 There are 25 scientists 21 social scientists and 5 in the humanities Of the 12 Highly Cited presidents in total 9 are based in US universities though two of these are non-Americans -- 1 is from Canada and 1 from the UK who is also a Nobel Prize winner
4 It should be noted that there is evidence that the residuals are skewed
10
Figure 7 presents a scatter plot for the sample of US presidents Again there is a correlation between citation levels and (world) university position The correlation is significant at the 1 level
It is useful to note that university rank explains only 12 of the variance in leaders citations In other words there are many other explanatory factors that are not being measured here However these correlations are significant enough to warrant further investigation and discussion
Is the citation-rank correlation true for universities outside the US
So far we have identified a strong positive relationship between the citation levels of university presidents and the position of their institution within a ranking of 100 universities This association exists amongst the 100 presidents in total the female group and the 51 US presidents
The mean citation P-score for presidents in the 49 countries in the rest of the world is 391 with a median score of 107 This is below the 100-group mean P-score of 6 and it is half the US mean P-score of 8 Therefore US presidents are twice as cited as those in the rest of the world
In the rest of the world the presidents include 27 scientists 16 social scientists and 6 in the humanities There are 3 Highly Cited researchers in the group Two are from the Netherlands and one in Germany
Figure 8 shows there is no statistically significant correlation between citation levels and position of president across the 49 countries in the rest of the world
As can be seen in the data one of the differences between the top American universities and non-American universities is that the former choose leaders who are more highly cited
Outliers
It is important to ensure that the results from this study have not been unduly influenced by a small number of presidents with extremely high P-scores To do this two tests are available First we can return to Spearman s rho which puts an equal weight on each observation instead of assigning continuous values As has been pointed out above a statistically significant rank correlation has been established with a significance level better than 1
The second check on outliers is simply to delete the data used from the highest P-scores for the Pearson s test To do this the top 5 of P-scores all located within ranges 30 and 40 were withdrawn and the correlation re-tested with a result of 0297 With 95 observations the 5 critical value for a two-tailed test is 0200 and at 1 it is 0260 so the correlation remains
11
Possible interpretations
Data on world university rankings have only recently become available That universities with strongly research-intensive missions appoint as their presidents men and women with strong citation records does not appear to have been previously documented The data in this paper do not enable judgements to be made about the weight assigned by selection committees to the research records of presidential candidates as distinct for example from other criteria such as managerial expertise or entrepreneurship But the data do suggest that research universities look for candidates who fit institutional missions
Internationally active researchers lead the world s top universities On average the higher the university is in the global ranking the more highly cited is that institution s president There are of course exceptions Two universities from the Netherlands -- in positions 39 and 63 -- both have presidents who are Highly Cited (It is interesting to note that these are the only two universities in the top 100 from that country) And there are top universities led by presidents with few or no citations However these cases are in a minority
These findings show that in at least one area the top universities are making different choices from those lower in the global ranking What can we learn from this difference Why do those institutions at the top appoint former researchers to the role of president
There are a number of possible reasons for the correlation They include
Hypothesis 1 Better researchers make better leaders of research universities
It has been recognised in the literature that presidents need to learn particular skills to enable them to lead a university (Cohen and March 1974 Rosovsky 1991 Middlehurst 1993 Bargh et al 2000 among others) In the UK an organisation for training academic leaders has recently been established with government funding
Whilst the education and career background of academic leaders has attracted some interest (Cohen and March 1974 Taylor 1986 Bargh at al 2000 Dolton and Ma 2001) little specific attention has been given to the research background of presidents Yet many university websites make a great deal of the eminence of the president
It seems clear that better researchers will tend to have greater prestige within the hierarchy of the academy and presidents who are highly cited may therefore enjoy credibility and negotiating strength that extends beyond their own discipline Jeremy Knowles the former Dean of Harvard s Faculty of Arts and Sciences (from 1991 2002) said that he believed his own research record helped his position as dean because it gave him greater status and therefore negotiating power when dealing with eminent faculty (interview with author April 12 2005) This suggests that being a cited researcher is of symbolic importance
This message was repeated in an interview with Amy Gutmann President of the University of Pennsylvania who said that being a researcher sends a signal to the faculty that you the president share their scholarly values and general understanding of the culture of the academy (interview April 28 2005)
12
Being a successful research academic may also help in attracting faculty particularly stars to a university which has become a preoccupation the world over Having a president who is a distinguished researcher may enhance the appeal of an institution
Alternatively it may be that two separate components are involved when leading a research university namely managerial expertise and inherent knowledge The former pertains to having knowledge of generic functions such as finance and budgeting human resource management corporate governance among others Most presidents running top universities will have had experience in managerial positions -- running large laboratories as head of department or pro-vice chancellor Experienced managers can also be brought in to perform specialised administrative roles Thus a former UK university vice chancellor has suggested (in personal correspondence) that what matters is scholarship not just management -- that we should take management for granted
The term inherent knowledge is used here to suggest a specific knowledge of or insight into academe that is borne out of expertise gained through academic research It suggests that good researchers may bring something else to the role of leader -- a perspective and understanding directly linked to their past as a successful scholar
It is possible that inherent knowledge also helps leaders inform strategy-making For example it may be easier to interpret research trends and future intellectual directions But how easy is it for a highly cited chemist to assess a faculty member from information science or discern the future direction of modern languages One possibility is that faculty at the top of their fields can make a fair assessment about the quality of work produced by those in other fields by using the same mechanisms used generally in academia namely citation indices and peer review
Hypothesis 2 Top universities appoint good researchers for reasons relating to external factors such as PR and fundraising
It has been said that US presidents in top universities spend a great deal of time fundraising and subsequently that they are less involved with running the institution This is not the place to compare US presidential leadership with European rectors or British vice chancellors Briefly however the American system is unitary with the president at the head of the hierarchy Though the president reports to a powerful board of trustees he or she is ultimately in charge with a role similar to that of a chief executive officer Senior academic administrators in the US (deans provosts chairs of departments) are normally appointed not voted into position by faculty In short the US presidential system is recognised as giving greater authority and powers to university leaders when compared to other systems of higher education from Europe to Japan (Rosovsky 1991 Bargh et al 2000) This is particularly true of US private universities US publics on the other hand are more exposed to state government intervention
Amy Gutmann President of University of Pennsylvania was clear in an interview that she is centrally involved in making senior appointments and in deciding the overall strategic direction of the university Long term strategy is designed through a collaborative process involving the president and the deans and provosts that she appoints and whose work she oversees (April 28 2005)
13
Appointment committees may select high-profile academics as presidents for external reasons The alumni may be encouraged to give more generously Gaining greater media exposure for the institution may also be a motive Alternatively if the governing body of a university wants to push an institution in a different direction towards research it may consider appointing a good researcher to signal a change in the internal culture
Hypothesis 3 The correlation is explained through unobservable heterogeneity
This would mean that research talent is merely a proxy for leadership ability The positive relationship between presidents P-scores and university rank may actually be picking up a correlation between other variables For instance presidents who are good at research may just be good at everything This is the alternative to a cause-and-effect relationship
All correlations are potentially susceptible to this kind of criticism It seems implausible however that candidates research records do not play a part in their selection for headship of institutions with prominent research missions
Concluding comments
This study which seems to be the first of its kind finds a correlation between the citations of presidents and the positions of their universities in a world league table Better universities are run by better researchers
The statistical relationship is strong for the group of 100 universities as a whole and for the sub-samples of female presidents and US presidents On average one extra point on a president s adjusted citation score where scores run from zero for the least-cited president to a score of up to 40 for Highly Cited and Nobel-prize winning presidents is associated with ten extra places in the world s top-100 ranking of universities No statistically significant correlation is found however for the sub-sample of universities from the rest of the world
Simple quantitative research of this kind may offer insights into university leadership - insights that are particularly relevant to universities that want to compete for a position amongst the world s top research institutions The best universities which can choose from the widest pool are systematically selecting top researchers to lead them What do such researchers bring to the role of leader This paper posits that there are two central components involved in leading research universities managerial expertise and inherent knowledge It is suggested here that better researchers may have greater inherent knowledge about academe that in turn informs their role as leader A president s research background may also have symbolic value in that it sends out a signal about the values of that institution And finally being a reputed researcher may raise a leader s status within the academic community and enhance his or her powers of negotiation
However the paper notes that other interpretations of the data are possible One is that universities choose top researchers for reasons of prestige and to assist in fundraising This is probably true as a factor for selection though it is unlikely to be the sole function
14
of a president in a top institution Another is that research ability is simply a proxy for some other kind of talent that is useful to leaders
Causality cannot be established through these correlations The performance of a university has not been shown here to be linked to the actions of a president or vice chancellor whether highly cited or not However this type of study starts the process of understanding whether there may be benefits from appointing a researcher as president A further study is underway exploring causality
15
0
5
10
15
20
1 - 20 21 - 40 41 - 60 61 - 80 81 - 100
Figure 1 The cross-country distribution of the worlds top 100 universities
USA EuropeRest World
Num
ber
of u
nive
rsiti
es
University rank (1 is top)
0
5
10
15
20
25
0 - 20 21 - 40 41 - 60 61 - 80 81 - 100
Figure 2 The disciplines of the presidents of the worlds top universites
ScienceHumanitiesSocial science
Dis
cipl
ine
University rank
16
-1
0
1
2
3
4
5
05 1 15 2 25 3 35 4
Figure 3 The distribution of presidents lifetime citations follows Lotkas power law
Loga
rithm
of t
he n
umbe
r of
pre
side
nts
Logarithm of presidents P-scores
17
0
50
100
150
200
0-20 21-40 41-60 61-80 81-100
Figure 4 A cross-tabulation of presidents lifetime citation P-scores by world university rank
(in quintiles)
Pre
side
nts
P-s
core
University rank
18
-10
0
10
20
30
40
0 20 40 60 80 100
Figure 5 Presidents P-scores by rank among
the worlds top 100 universities
y = 11305 - 01047x R= 034479 P
resi
dent
s P
- sc
ore
University rank
-8
-6
-4
-2
0
2
4
0 20 40 60 80 100
Figure 5a Logarithm of presidents P-scores by university rank
y = 14413 - 0021876x R= 026413
Log
of p
resi
dent
s P
-sco
re
University rank
19
-5
0
5
10
15
20
0 20 40 60 80 100
Figure 6 Female presidents P-scores by university rank
y = 97036 - 012631x R= 069052
Pre
side
nts
P-s
core
University rank
-10
0
10
20
30
40
0 20 40 60 80 100
Figure 7 US presidents P-scores by university rank
y = 13492 - 013997x R= 037505
Pre
side
nts
P-s
core
University rank
20
-10
0
10
20
30
40
0 20 40 60 80 100
Figure 8 Presidents from the rest of the world P-scores by university rank
y = 61896 - 003646x R= 014019 P
resi
dent
s P
-sco
re
University rank
21
References
Bargh C Bocock J Scott P and Smith D (2000) University Leadership The Role of the Chief Executive Open University Press Buckingham
Bok D (2003) Universities in the Marketplace The commercialisation of Higher Education Princeton University Press New Jersey
Cohen MD and March JG (1974) Leadership and Ambiguity McGraw-Hill New York
Collison P and Millen J (1969) University chancellors vice chancellors and college principals A social profile Sociology Vol 3 No 1 pp 77-109
Cronin B Snyder H and Atkins H (1997) Comparative citation rankings of authors in monographic and journal literature a study of sociology Journal of Documentation Vol 53 No 3 pp 263-273
Dolton P and Ma A (2001) CEO Pay in the Public Sector The Case of Vice Chancellors in UK Universities Newcastle UK Working paper Newcastle University Discussion Papers in Economics
Fassoulaki A Paraskeva A Papilas K and Karabinis G (2000) Self-citations in six anaesthesia journals and their significance in determining the impact factor British Journal of Anaesthesia Vol 87 No 2 pp 266-269
Hamermesh DS (1994) Facts and Myths about Refereeing Journal of Economic Perspectives Vol 8 No 1 Winter pp 153-163
King DA (2004) The scientific impact of nations Nature Vol 430 pp 311-316
Lombardi JV Craig DD Capaldi ED and Gater DS (2002) The Top American Research Universities An Overview TheCenter Reports University of Florida Gainesville
Lombardi JV Craig DD Capaldi ED Reeves KR and Gater DS (2003) The Top American Research Universities TheCenter University of Florida Gainesville
Lotka AJ (1926) The Frequency Distribution of Scientific Productivity Journal of the Washington Academy of Sciences Vol 16 No12 pp 317-323
Middlehurst R (1993) Leading Academics Open University Press Buckingham
Moed HF (2002) The impact factors debate the ISI s uses and limits Nature Vol 415 pp 731-732
Norris M and Oppenheim C (2003) Citation counts and the Research Assessment Exercise V
Archaeology and the 2001 RAE Journal of Documentation Vol 59 No 6 pp 709-730
Oppenheim C (1995) The correlation between citation counts and the 1992 Research Assessment Exercise Ratings for British library and information science university departments Journal of Documentation Vol 51 pp 18-27
Oppenheim C (1997) The correlation between citation counts and the 1992 Research Assessment Exercise ratings for British research in genetics anatomy and archaeology Journal of Documentation Vol 53 No 5 pp 477-487
Potter W G (1988) Of Making Many Books There is No End Bibliometrics and Libraries The Journal of Academic Librarianship Vol14 pp 238a-238c
Rosovsky H (1991) The University An Owners Manual Norton New York
Seng LB amp Willett P (1995) The citedness of publications by United Kingdom library schools Journal of Information Science Vol 21 pp 68-71
Smith A and Eysenck M (2002) The correlation between RAE ratings and citation counts in psychology Working paper Department of Psychology Royal Holloway University of London
Taylor W (1986) Organisational Culture and Administrative Leadership in Universities In Leadership and Organisational Culture (eds Sergiovanni TJ and Corbally JE) pp125-141 Illini Books University of Illinois
Tierney W Corwin Z amp Colyar JE (Eds) (2004) Competing conceptions of governance Negotiating the perfect storm John Hopkins University Press Baltimore MD
22
van Leeuwen TN Moed HF Tijssen RJW Visser MS and Van Raan AFJ (2001)
Language biases in the coverage of the Science Citation Index and its consequences for international comparisons of national research performance Scientometrics Vol 51 No1 pp 335-346
van Raan AFJ (1998) Assessing the social sciences the use of advanced bibliometric methods as a necessary complement to peer review Research Evaluation Vol 7 pp 2-6
van Raan AFJ (2003) The use of bibliometric analysis in research performance assessment and monitoring of interdisciplinary scientific developments Technikfolgenabschatzung Vol 1 pp 20-29
van Raan AFJ (2005) Fatal Attraction Conceptual and methodological problems in the ranking of universities by bibliometric methods Scientometrics Vol 62 No 1 pp 133-143
Weingart P (2003) Evaluation of research performance the danger of numbers in Bibliometric analysis in science and research Applications Benefits and Limitations Second Conference of the Central Library Forschungszentrum Julich pp 7-19
Weingart P (2004) Impact of bibliometrics upon the science system inadvertent consequences in Handbook on Quantitative Science and Technology Research (eds Moed HF Glanzel W and Schmoch U) Kluwer Academic Publishers Dordrecht The Netherlands
Wouters PF (1999) The Citation Culture PhD Thesis University of Amsterdam The Netherlands
Interviews
Amy Gutmann President University of Pennsylvania -- interview at University of Pennsylvania April 28 2005
Jeremy Knowles Former Dean Faculty of Arts and Sciences Harvard -- interview at Harvard April12 2005
League tables
Academic Ranking of World Universities 2004 Institute of Higher Education Shanghai Jiao Tong University [httpedsjtueducnrankinghtm]
Top American Research Universities TheCenter [httpthecenterufledu]
Statistical packages
Paleontological Statistics Software Package for Education and Data Analysis Palaeontologia Electronica 4(1) 9pp [httppalaeo-electronicaorg2001_1pastissue1_01htm]
KaleidaGraph Synergy Software at [wwwsynergycom]
23
APPENDIX 1
Top 500 World Universities (1-100) 2004
World Rank
Institution Country Total Score
Score on
Alumni
Score
on Award
Score
on HiCi
Score on
NampS
Score on SCI
Score on Size
1 Harvard Univ USA 1000
986 1000
1000
1000
1000
606
2 Stanford Univ USA 772 412 722 961 752 723 681
3 Univ Cambridge UK 762 1000
934 566 585 702 732
4 Univ California - Berkeley USA 742 700 760 741 756 727 451
5 Massachusetts Inst Tech (MIT) USA 724 741 789 736 691 646 475
6 California Inst Tech USA 690 593 665 648 667 532 1000
7 Princeton Univ USA 636 610 768 654 521 468 673
8 Univ Oxford UK 614 644 591 531 553 652 590
9 Columbia Univ USA 612 778 588 573 516 683 370
10 Univ Chicago USA 605 722 819 553 466 541 327
11 Yale Univ USA 586 522 445 636 581 636 504
12 Cornell Univ USA 555 466 524 605 472 662 336
13 Univ California - San Diego USA 538 178 347 636 594 672 479
14 Tokyo Univ Japan 519 361 144 445 550 919 498
15 Univ Pennsylvania USA 518 356 351 612 446 726 340
16 Univ California - Los Angeles USA 516 274 328 605 481 799 248
17 Univ California - San Francisco USA 508 00 376 593 595 629 488
18 Univ Wisconsin - Madison USA 500 431 363 553 480 692 190
19 Univ Michigan - Ann Arbor USA 493 398 193 648 457 767 201
20 Univ Washington - Seattle USA 491 227 302 573 496 788 162
21 Kyoto Univ Japan 483 398 341 400 372 771 464
22 Johns Hopkins Univ USA 475 487 283 437 526 717 142
23 Imperial Coll London UK 464 209 381 462 394 658 445
24 Univ Toronto Canada 446 281 197 391 412 784 428
25 Univ Coll London UK 443 308 329 410 410 611 426
25 Univ Illinois - Urbana Champaign USA 433 417 374 462 360 582 178
24
27 Swiss Fed Inst Tech - Zurich Switzerland
432 403 370 391 432 471 415
28 Washington Univ - St Louis USA 431 251 266 419 468 562 449
29 Rockefeller Univ USA 402 227 598 315 436 271 386
30 Northwestern Univ USA 395 218 193 479 358 572 370
31 Duke Univ USA 389 209 00 486 468 627 362
32 New York Univ USA 387 339 250 437 393 509 191
33 Univ Minnesota - Twin Cities USA 383 361 00 539 359 696 128
34 Univ Colorado - Boulder USA 378 166 298 437 383 475 274
35 Univ California - Santa Barbara USA 370 00 285 454 414 440 362
36 Univ British Columbia Canada 363 209 193 360 316 595 349
36 Univ Texas Southwestern Med Center
USA 363 166 339 338 405 400 349
38 Vanderbilt Univ USA 351 126 302 371 238 502 417
39 Univ Utrecht Netherlands
349 308 214 315 299 581 221
40 Univ Texas - Austin USA 348 218 171 502 288 537 128
41 Univ Paris 06 France 339 357 239 231 247 567 326
42 Univ California - Davis USA 336 00 00 486 372 647 207
43 Pennsylvania State Univ - Univ Park
USA 335 141 00 502 377 587 142
44 Rutgers State Univ - New Brunswick
USA 334 154 204 381 361 482 195
45 Tech Univ Munich Germany 333 431 241 276 204 500 320
46 Karolinska Inst Stockholm Sweden 330 308 278 327 216 498 215
47 Univ Edinburgh UK 329 227 171 276 367 491 316
48 Univ Paris 11 France 325 333 342 214 213 468 312
48 Univ Pittsburgh - Pittsburgh USA 325 189 00 428 265 670 200
48 Univ Southern California USA 325 00 273 419 230 535 205
51 Univ Munich Germany 324 372 211 124 320 560 311
52 Univ Rochester USA 320 333 91 303 272 449 501
53 Australian Natl Univ Australia 319 178 129 410 314 436 307
54 Osaka Univ Japan 315 126 00 262 312 721 302
55 Univ California - Irvine USA 314 00 250 338 296 472 299
56 Univ North Carolina - Chapel Hill USA 312 126 00 381 345 605 203
57 Univ Maryland - Coll Park USA 311 259 00 400 332 540 174
25
57 Univ Zurich Switzerland
311 126 273 214 303 489 299
59 Univ Copenhagen Denmark 310 308 247 231 226 481 298
60 Univ Bristol UK 306 109 182 327 266 491 294
61 McGill Univ Canada 304 288 00 315 263 590 292
62 Carnegie Mellon Univ USA 303 189 302 327 174 388 340
63 Univ Leiden Netherlands
298 251 158 303 220 473 303
64 Univ Heidelberg Germany 297 109 277 231 221 497 285
65 Case Western Reserve Univ USA 296 372 118 231 222 461 406
66 Moscow State Univ Russia 295 515 349 00 81 585 283
67 Univ Florida USA 293 154 00 338 243 664 163
68 Univ Oslo Norway 292 259 341 195 172 421 280
69 Tohoku Univ Japan 288 189 00 195 261 693 277
69 Univ Sheffield UK 288 235 144 231 288 462 277
71 Purdue Univ - West Lafayette USA 287 189 171 315 221 505 138
72 Univ Helsinki Finland 286 189 182 151 237 569 275
73 Ohio State Univ - Columbus USA 285 178 00 410 206 613 96
74 Uppsala Univ Sweden 284 259 329 00 304 525 145
75 Rice Univ USA 283 218 223 262 237 302 446
76 Univ Arizona USA 281 00 00 315 377 565 181
77 Kings Coll London UK 280 166 235 231 198 462 269
78 Univ Manchester UK 279 259 193 214 182 486 268
79 Univ Goettingen Germany 274 388 204 175 182 428 263
80 Michigan State Univ USA 270 126 00 391 284 505 105
80 Univ Nottingham UK 270 154 204 231 201 451 259
82 Brown Univ USA 268 00 139 303 279 414 304
82 Univ Melbourne Australia 268 154 144 214 192 530 258
82 Univ Strasbourg 1 France 268 295 229 214 213 352 257
85 Ecole Normale Super Paris France 265 479 250 175 182 296 254
86 Boston Univ USA 263 154 00 327 296 515 96
86 Univ Vienna Austria 263 251 158 87 220 545 253
88 McMaster Univ Canada 260 166 193 231 162 452 250
26
88 Univ Freiburg Germany 260 251 214 195 180 409 250
90 Hebrew Univ Jerusalem Israel 259 154 00 262 295 483 249
91 Univ Basel Switzerland
258 259 175 214 242 355 248
92 Lund Univ Sweden 256 295 00 262 220 540 112
93 Univ Birmingham UK 255 251 112 247 140 476 245
93 Univ Roma - La Sapienza Italy 255 166 158 124 243 574 79
95 Humboldt Univ Berlin Germany 254 295 219 87 148 497 244
95 Univ Utah USA 254 00 00 327 307 484 201
97 Nagoya Univ Japan 252 00 144 151 237 553 242
97 Stockholm Univ Sweden 252 295 302 175 149 357 153
99 Tufts Univ USA 251 189 171 195 191 406 292
99 Univ Bonn Germany 251 199 204 175 167 439 241
Copyright copy 2004 Institute of Higher Education Shanghai Jiao Tong University All Rights Reserved
The methodology for the 2005 Global Ranking produced by SJTU has been slightly modified (see httpedsjtueducnrankinghtm)
27
APPENDIX 2
Citation thresholds for scientists across different disciplines
(January 1994 - June 2004)
Subject area Scientist Agricultural Sciences 154
Biology amp Biochemistry 780
Chemistry 648
Clinical Medicine 1095
Computer Science 84
Economics amp Business 169
Engineering 182
EnvironmentEcology 248
Geosciences 433
Humanities General 35
Immunology 763
Materials Science 219
Mathematics 130
Microbiology 534
Molecular Biology amp Genetics 1234
Multidisciplinary 123
Neuroscience amp Behaviour 908
Pharmacology amp Toxicology 312
Physics 1832
Plant amp Animal Science 292
PsychiatryPsychology 393
Social Sciences General 117
Space Science 1301 Updated Sept 1 2004 Thomson ISI Highly cited available from
httpin-citescomthresholds-citationhtml
Humanities score created by Amanda H Goodall
Note to Table The above citation thresholds represent the top 1 researchers (approximately 250) in each disciplinary field

4
Self-citing is a potential problem that can take two forms first over-citing one s own work in academic papers and second self-citation in journals to try to raise the journal impact factor An example of this is raised by Fassoulaki et al (2000) where authors report a significant correlation between self-citation levels and journal impact scores in the 1995 and 1996 issues of six anaesthesia journals
Other possible difficulties with citations include inconsistencies in methods of referencing and inaccuracies in citation statistics (Moed 2002 King 2004) Finally monopoly concerns have been raised about over-reliance on the Web of Science (Weingart 2003 2004)
Language biases have been shown to exist within ISI (van Leeuwen et al 2001) though it is now considered to be less of a problem because most journals publish in English (King 2004) King suggests that preferential referencing may take place in the US (ie that Americans are more likely to reference Americans) partially a feature of the size of that nation s output To try to circumvent this separate analyses of US data are offered below
Although van Raan (2005) notes the weaknesses of bibliometric measures he also argues that citations are a good indicator of performance over long periods of time His preference for evaluating science is to couple peer review with bibliometric analysis King (2004) suggests that citations are the most reliable measure of research quality and output In a feature in the journal Nature King uses the ISI citation index to measure the quantity and quality of science across different nations (2004)
There have been a number of studies comparing the UK s Research Assessment Exercise (RAE) results with bibliometric measures Oppenheim (1997) uses ISI data to compare 1992 RAE results with citation indicators in three subject areas anatomy genetics and archaeology He finds a strong correlation between the two methods of assessment and notes that in archaeology there is a greater reliance on monographic literature Norris and Oppenheim (2003) replicate this study with the same results following the 2001 RAE Smith and Eysenck (2002) discover a similar correlation across all UK psychology departments in the 2001 RAE
Normalising citations to produce P-scores
To obtain a P-score the individual presidential citations were divided by the ISI Highly Cited disciplinary thresholds (see Appendix 2) The threshold dates correspond to the dates the data were collected within a month The subject thresholds are being used here as an exchange rate for assessing different citation conventions
The humanities score was created by the author using the new cited references generated by ISI each week Corresponding with the data collection dates as closely as possible the sciences approximated at 350000 new cited references weekly the social sciences 50000 and the humanities 15000 If we divide the social science weekly score of 50000 by the humanities 15000 we get a figure of 333 The author has then divided the Social Sciences General score of 117 (see Appendix 2) by 333 which creates a score of 3513 The number 35 has been used here as the Humanities General score
5
League tables
As higher education has become global in the recruitment of international students and staff so have league tables International tables have existed for a number of years in areas such as business education through the Financial Times In 2003 the first global league table of universities was produced by the Institute of Education in Shanghai at Jiao Tong University (SJTU) SJTU used a process of inviting comment through their website to make adjustments to their methodology for the 2004 table
The UK based Times Higher Education Supplement (THES) produced a global ranking in November 2004 (wwwthescouk) which has not been used in this study There are three main problems with the league table First 50 weight is assigned to a subjective peer-review process where 1300 academics across 88 countries are invited to name the top institutions in their geographic area and their academic field This is the largest component in the ranking yet there is no information available on the background of these global academics That is a concern For example how might an individual s choice have been influenced by their own place of education sabbatical leave or co-authorship and so on Second 10 weight is given for the international nature of an institution s student body and staff However there is little explanation about why international is a proxy for high quality Finally because the THES is a commercial organisation it is not possible to access the data or check the calculations
An advantage of the SJTU table is that it is not produced by a newspaper or magazine Media-generated league tables are ubiquitous and controversial Tables such as those in The Times and US News and World Report in the US offer information to potential students across a range of criteria Media-driven league tables may be useful heuristic devices for students but as objective tools of assessment of university quality they are unreliable Perhaps the main criticism is that they are produced by commercial organisations designed to make money by selling their publications Therefore a headline is required To generate a story the methodology is changed often annually which ensures that institutions at the top rotate (Lombardi et al 2002) Lombardi and colleagues suggest instead that in the US university positions actually change very little each year if a fixed method of analysis is used (2002)
The Center for Studies in the Humanities and Social Sciences (wwwthecenterufledu ) was created as a non-profit organisation in 1998 in the United States Its mission is to develop methods for measuring and improving university performance For a number of years TheCenter has produced an alternative ranking The Top American Research Universities (Lombardi et al 2003)
This ranking differs from media equivalents because actual numbered positions are not assigned Instead universities are assessed on nine separate measures Those that score highly in at least one of the nine measures are put into a 1-25 top research university category3
3 The measures include total research federal research endowment assets annual giving national academy members faculty awards doctorates granted postdoctoral appointees and SAT scores Some degree of ranking does exist because they are ordered depending on the number of points they score across the nine categories So the top three universities score 9 out of 9 the next six universities score 8 out of 9 and so on
6
The measures of university quality used in both TheCenter and the SJTU world league tables do not exactly correspond However it is interesting to compare the number of US universities at the top in both tables TheCenter s top-25 category has 52 universities included Of these 44 also feature in the SJTU global table Positions 1-27 are exactly correlated in both rankings In other words these two rankings of top US universities are very similar
The Academic Ranking of World Universities (2004) league table uses 6 different criteria to assess universities The table below comes from the SJTU web site
Table 1 Methodology used in SJTU ranking 2004
Criteria
Indicator Code
Weight
Quality of Education
Alumni of an institution winning Nobel Prizes and Fields Medals
Alumni
10
Staff of an institution winning Nobel Prizes and Fields Medals
Award
20 Quality of Faculty
Highly cited researchers in 21 broad subject categories
HiCi 20
Articles published in Nature and Science
NampS 20 Research
Output Articles in Science Citation Index-expanded and Social Science Citation Index
SCI 20
Size of Institution
Academic performance with respect to the size of an institution
Size 10
Total 100
Copyright copy 2004 Institute of Higher Education Shanghai Jiao Tong University
For institutions specialized in humanities and social sciences such as London School of Economics NampS is not considered and the weight of NampS is relocated to other indicators
There are arguably some weaknesses in the SJTU methodology First younger universities stand to lose out particularly in the first category that assigns weight (10) to alumni awards Second the humanities and the social sciences are weakly represented here -- though SJTU have done some adjustment for this There are no ISI HiCi s in the arts and humanities and far fewer in the social sciences The Awards category is also limited Nobel Prizes are only given for achievement in physics chemistry medicinephysiology economics literature and peace and Fields Medals only for mathematics
7
Data on the 100 university presidents
It is important to note that the world league table ranks institutions by assigning points (as per criteria above) This can result in two or more institutions being given the same position (see the full list in Appendix 1)
The universities in the top-100 table are dominated by the United States where 51 of the institutions are located As can be seen in Figure 1 US institutions are unevenly spread across the world s top 100 dominating the top 20 with 17 universities and with 30 in the top 40 Of the 100 total only 4 in the bottom 20 are US-based If we treat American states as individual nations California with a population of 36 million has the highest number of leading universities Ten Californian institutions are within the top 55 6 of these are in the top 20 and 7 of the 10 are public or state universities
Thirty-seven institutions out of 100 are located in European countries Of these 11 are in the United Kingdom 7 in Germany 4 in both France and Sweden 3 in Switzerland 2 in the Netherlands and 1 each in Austria Denmark Finland Norway Italy and Russia Finally among the top 100 there are 12 universities in the rest of the world -- 5 in Japan 4 in Canada 2 in Australia and 1 in Israel
The nation location of an institution is not always reflected in the nationality of its president For example the top 10 universities are found in two countries -- US (8) and UK (2) whereas the leaders come from four -- Canada New Zealand UK and the US There are 15 female presidents in the sample Six are in the top 20 universities and 10 are within the top 50 North America dominates with 9 US female presidents and 2 in Canada The remaining four are in Denmark France Sweden and the UK
Every president in the group of 100 universities has a PhD The majority have been academics though two presidents spent most of their careers in non-research positions in industry or government and a small group went almost directly into academic administration
The age of a president potentially affects his or her lifetime citation levels The older they are the greater the opportunity to accrue citations It is therefore necessary to check whether presidents with the highest levels of lifetime citations are in fact older than those with fewer citations Some European universities still publish date of birth information though they are in the minority Birth dates can be loosely calculated by using individuals age at graduation from first degree Using this method it is possible to compare the ages of presidents at the top and bottom of the top-100 global league table If it is shown that the top presidents are markedly older than those in the bottom 20 then adjustment of citation scores would be necessary
The ages of only 80 of presidents in the top 20 universities and 80 of presidents in the bottom 20 could be obtained The mean age of presidents in the top 20 universities is 58 years In the bottom 20 category the mean age of president is 60 Because of the closeness in age between these two groups and in particular the slightly older average age of the lowest quintile citation scores have not been adjusted
Figure 2 displays the disciplinary background of the presidents What is noticeable is the evenness of disciplinary spread across each quintile Of the 100 presidents 52 have a
8
scientific background The scientists are dominated by the life sciences at 50 but there are also 11 engineers 6 physicists 5 chemists and 4 computer scientists
Thirty-seven of the 100 presidents are social scientists The largest disciplinary group among the social scientists is that of lawyers who number 15 Within a second group of 16 there is an even spread of educationalists political scientists sociologists and those from public and social policy Finally there are 6 economists
Eleven presidents are from the arts and humanities This group is noticeably smaller Taylor (1986) documents the disciplinary distribution amongst vice chancellors and principals in the UK in 1986 He also cites earlier work by Collison and Millen (1969) who showed that in the UK between 1935 and 1967 the proportion of presidents from the arts declined from 68 to 48 while scientists rose from 19 to 41 Taylor then reports his own findings that by 1981 67 of vice chancellors and principals were scientists 13 from the social sciences and less than 20 were from the arts Cohen and March (1974) showed a similar pattern -- in the number of presidents from the arts - for the US between 1924 and 1969
In a study by Dolton and Ma (2001) on CEO Pay the disciplinary backgrounds of UK vice chancellors are reported Drawn from a wide cross-section of British universities (including Oxbridge civic universities former colleges of advanced technology among others) they note that VCs in position in 1999 included 3 lawyers 13 engineers scientists made up 25 social sciences including business 36 and finally VCs from the arts and humanities made up 13 10 were reported as being non-academics
Of the 100 presidents in the current paper s sample 12 are ISI Highly Cited (HiCi) academics These individuals are more common in the top universities Of the 12 presidents in HiCi 6 are in the top 20 group of universities 3 in the next 20 2 in the next and 1 in the fourth quartile Finally there are 3 Nobel Prize winners among the presidents (all in medicine) -- two in the top 20 and one in the 20-40 category
The distribution of citations across the 100 presidents fits Lotka s Law an application that is often used in bibliometric research Lotka (1926) describes the frequency of publication by authors in a given field As can be observed in Figure 3 using presidents P-scores a version of this law applies here Lotka s power law predicts that of all the authors in a specific field approximately 60 percent will publish just one article 15 percent will have two publications 7 percent of authors will publish three pieces and so on (Potter 1988) According to Lotkas Law of scientific productivity only 6 percent of the authors in a field will produce more than 10 articles (the number making n contributions is about 1nsup2 of those making one) This law is most accurate when applied over long periods of time and to large bodies of work -- for example individuals lifetime citations
The results
As outlined above the 100 presidents lifetime citations are represented by a normalised P-score
The individual citation scores of the 100 presidents before adjustment range from 0 to 28718 The mean citation score is 2731 and the median is 371 After adjusting for discipline the highest P-score is 37 points and the lowest is 0 The mean P-score is 603
9
and the median is 227 When the group of 100 is split into two the top leaders of the 50 universities have a mean P-score of 876 and a median of 457 and those in the bottom half of universities have a mean P-score of 330 and a median of 093 Of the total group of 100 presidents 4 have a citation score of zero
The results are presented here in scatter plots and cross tabulations - that are grouped into quintiles (the 1-20 group always refers to the top of the SJTU table and 1 equals Harvard)
The most highly ranked universities have leaders who are more highly cited Figure 4 shows this It gives a cross-sectional breakdown of P-score by university rank in quintiles This shows a monotonic decline in citation levels as the universities go down in world rank
The next step is to try to establish statistical significance The paper does this in two ways
A natural first approach is to test whether the rank ordering of one variable is correlated with the rank order of the second variable Spearman s rank correlation coefficient is an appropriate measure The highest P-score is ranked 1 and the lowest P-score is ranked100 The actual rank of presidents P-scores is then tested for a correlation against university rank
Using these data Spearman s rho is calculated at 0378 With 100 observations the associated 5 critical value for a two-tailed test is 0195 and at 1 it is 0254 which establishes that the correlation is statistially significant at conventional confidence levels
A second approach can be seen in Figure 5 which gives the distribution of the 100 individual P-scores by world university rank Using Pearson s coefficient (r) the degree of linear relationship between the rank of university and president s P-score can be examined For the data in Figure 5 Pearson s r is 0345 The 1 critical value on a two-tailed test is 0254 which means again that the relationship is statistically significant4 There continues to be a statistically significant relationship if the natural logarithm of P-score is used this can be seen in Figure 5a
This correlation between cites and university quality can also be seen amongst the sub-sample of female presidents though at 15 the group is small (Figure 6) It is also statistically significant at the 1 level The disciplinary breakdown of the 15 female presidents is 7 scientists 7 social scientists and 1 from the humanities One president is Highly Cited
US universities make up 51 out of the 100 The mean P-score for this US group is 807 with a median score of 486 which is higher than the world group mean of 603 and median of 227 There are 25 scientists 21 social scientists and 5 in the humanities Of the 12 Highly Cited presidents in total 9 are based in US universities though two of these are non-Americans -- 1 is from Canada and 1 from the UK who is also a Nobel Prize winner
4 It should be noted that there is evidence that the residuals are skewed
10
Figure 7 presents a scatter plot for the sample of US presidents Again there is a correlation between citation levels and (world) university position The correlation is significant at the 1 level
It is useful to note that university rank explains only 12 of the variance in leaders citations In other words there are many other explanatory factors that are not being measured here However these correlations are significant enough to warrant further investigation and discussion
Is the citation-rank correlation true for universities outside the US
So far we have identified a strong positive relationship between the citation levels of university presidents and the position of their institution within a ranking of 100 universities This association exists amongst the 100 presidents in total the female group and the 51 US presidents
The mean citation P-score for presidents in the 49 countries in the rest of the world is 391 with a median score of 107 This is below the 100-group mean P-score of 6 and it is half the US mean P-score of 8 Therefore US presidents are twice as cited as those in the rest of the world
In the rest of the world the presidents include 27 scientists 16 social scientists and 6 in the humanities There are 3 Highly Cited researchers in the group Two are from the Netherlands and one in Germany
Figure 8 shows there is no statistically significant correlation between citation levels and position of president across the 49 countries in the rest of the world
As can be seen in the data one of the differences between the top American universities and non-American universities is that the former choose leaders who are more highly cited
Outliers
It is important to ensure that the results from this study have not been unduly influenced by a small number of presidents with extremely high P-scores To do this two tests are available First we can return to Spearman s rho which puts an equal weight on each observation instead of assigning continuous values As has been pointed out above a statistically significant rank correlation has been established with a significance level better than 1
The second check on outliers is simply to delete the data used from the highest P-scores for the Pearson s test To do this the top 5 of P-scores all located within ranges 30 and 40 were withdrawn and the correlation re-tested with a result of 0297 With 95 observations the 5 critical value for a two-tailed test is 0200 and at 1 it is 0260 so the correlation remains
11
Possible interpretations
Data on world university rankings have only recently become available That universities with strongly research-intensive missions appoint as their presidents men and women with strong citation records does not appear to have been previously documented The data in this paper do not enable judgements to be made about the weight assigned by selection committees to the research records of presidential candidates as distinct for example from other criteria such as managerial expertise or entrepreneurship But the data do suggest that research universities look for candidates who fit institutional missions
Internationally active researchers lead the world s top universities On average the higher the university is in the global ranking the more highly cited is that institution s president There are of course exceptions Two universities from the Netherlands -- in positions 39 and 63 -- both have presidents who are Highly Cited (It is interesting to note that these are the only two universities in the top 100 from that country) And there are top universities led by presidents with few or no citations However these cases are in a minority
These findings show that in at least one area the top universities are making different choices from those lower in the global ranking What can we learn from this difference Why do those institutions at the top appoint former researchers to the role of president
There are a number of possible reasons for the correlation They include
Hypothesis 1 Better researchers make better leaders of research universities
It has been recognised in the literature that presidents need to learn particular skills to enable them to lead a university (Cohen and March 1974 Rosovsky 1991 Middlehurst 1993 Bargh et al 2000 among others) In the UK an organisation for training academic leaders has recently been established with government funding
Whilst the education and career background of academic leaders has attracted some interest (Cohen and March 1974 Taylor 1986 Bargh at al 2000 Dolton and Ma 2001) little specific attention has been given to the research background of presidents Yet many university websites make a great deal of the eminence of the president
It seems clear that better researchers will tend to have greater prestige within the hierarchy of the academy and presidents who are highly cited may therefore enjoy credibility and negotiating strength that extends beyond their own discipline Jeremy Knowles the former Dean of Harvard s Faculty of Arts and Sciences (from 1991 2002) said that he believed his own research record helped his position as dean because it gave him greater status and therefore negotiating power when dealing with eminent faculty (interview with author April 12 2005) This suggests that being a cited researcher is of symbolic importance
This message was repeated in an interview with Amy Gutmann President of the University of Pennsylvania who said that being a researcher sends a signal to the faculty that you the president share their scholarly values and general understanding of the culture of the academy (interview April 28 2005)
12
Being a successful research academic may also help in attracting faculty particularly stars to a university which has become a preoccupation the world over Having a president who is a distinguished researcher may enhance the appeal of an institution
Alternatively it may be that two separate components are involved when leading a research university namely managerial expertise and inherent knowledge The former pertains to having knowledge of generic functions such as finance and budgeting human resource management corporate governance among others Most presidents running top universities will have had experience in managerial positions -- running large laboratories as head of department or pro-vice chancellor Experienced managers can also be brought in to perform specialised administrative roles Thus a former UK university vice chancellor has suggested (in personal correspondence) that what matters is scholarship not just management -- that we should take management for granted
The term inherent knowledge is used here to suggest a specific knowledge of or insight into academe that is borne out of expertise gained through academic research It suggests that good researchers may bring something else to the role of leader -- a perspective and understanding directly linked to their past as a successful scholar
It is possible that inherent knowledge also helps leaders inform strategy-making For example it may be easier to interpret research trends and future intellectual directions But how easy is it for a highly cited chemist to assess a faculty member from information science or discern the future direction of modern languages One possibility is that faculty at the top of their fields can make a fair assessment about the quality of work produced by those in other fields by using the same mechanisms used generally in academia namely citation indices and peer review
Hypothesis 2 Top universities appoint good researchers for reasons relating to external factors such as PR and fundraising
It has been said that US presidents in top universities spend a great deal of time fundraising and subsequently that they are less involved with running the institution This is not the place to compare US presidential leadership with European rectors or British vice chancellors Briefly however the American system is unitary with the president at the head of the hierarchy Though the president reports to a powerful board of trustees he or she is ultimately in charge with a role similar to that of a chief executive officer Senior academic administrators in the US (deans provosts chairs of departments) are normally appointed not voted into position by faculty In short the US presidential system is recognised as giving greater authority and powers to university leaders when compared to other systems of higher education from Europe to Japan (Rosovsky 1991 Bargh et al 2000) This is particularly true of US private universities US publics on the other hand are more exposed to state government intervention
Amy Gutmann President of University of Pennsylvania was clear in an interview that she is centrally involved in making senior appointments and in deciding the overall strategic direction of the university Long term strategy is designed through a collaborative process involving the president and the deans and provosts that she appoints and whose work she oversees (April 28 2005)
13
Appointment committees may select high-profile academics as presidents for external reasons The alumni may be encouraged to give more generously Gaining greater media exposure for the institution may also be a motive Alternatively if the governing body of a university wants to push an institution in a different direction towards research it may consider appointing a good researcher to signal a change in the internal culture
Hypothesis 3 The correlation is explained through unobservable heterogeneity
This would mean that research talent is merely a proxy for leadership ability The positive relationship between presidents P-scores and university rank may actually be picking up a correlation between other variables For instance presidents who are good at research may just be good at everything This is the alternative to a cause-and-effect relationship
All correlations are potentially susceptible to this kind of criticism It seems implausible however that candidates research records do not play a part in their selection for headship of institutions with prominent research missions
Concluding comments
This study which seems to be the first of its kind finds a correlation between the citations of presidents and the positions of their universities in a world league table Better universities are run by better researchers
The statistical relationship is strong for the group of 100 universities as a whole and for the sub-samples of female presidents and US presidents On average one extra point on a president s adjusted citation score where scores run from zero for the least-cited president to a score of up to 40 for Highly Cited and Nobel-prize winning presidents is associated with ten extra places in the world s top-100 ranking of universities No statistically significant correlation is found however for the sub-sample of universities from the rest of the world
Simple quantitative research of this kind may offer insights into university leadership - insights that are particularly relevant to universities that want to compete for a position amongst the world s top research institutions The best universities which can choose from the widest pool are systematically selecting top researchers to lead them What do such researchers bring to the role of leader This paper posits that there are two central components involved in leading research universities managerial expertise and inherent knowledge It is suggested here that better researchers may have greater inherent knowledge about academe that in turn informs their role as leader A president s research background may also have symbolic value in that it sends out a signal about the values of that institution And finally being a reputed researcher may raise a leader s status within the academic community and enhance his or her powers of negotiation
However the paper notes that other interpretations of the data are possible One is that universities choose top researchers for reasons of prestige and to assist in fundraising This is probably true as a factor for selection though it is unlikely to be the sole function
14
of a president in a top institution Another is that research ability is simply a proxy for some other kind of talent that is useful to leaders
Causality cannot be established through these correlations The performance of a university has not been shown here to be linked to the actions of a president or vice chancellor whether highly cited or not However this type of study starts the process of understanding whether there may be benefits from appointing a researcher as president A further study is underway exploring causality
15
0
5
10
15
20
1 - 20 21 - 40 41 - 60 61 - 80 81 - 100
Figure 1 The cross-country distribution of the worlds top 100 universities
USA EuropeRest World
Num
ber
of u
nive
rsiti
es
University rank (1 is top)
0
5
10
15
20
25
0 - 20 21 - 40 41 - 60 61 - 80 81 - 100
Figure 2 The disciplines of the presidents of the worlds top universites
ScienceHumanitiesSocial science
Dis
cipl
ine
University rank
16
-1
0
1
2
3
4
5
05 1 15 2 25 3 35 4
Figure 3 The distribution of presidents lifetime citations follows Lotkas power law
Loga
rithm
of t
he n
umbe
r of
pre
side
nts
Logarithm of presidents P-scores
17
0
50
100
150
200
0-20 21-40 41-60 61-80 81-100
Figure 4 A cross-tabulation of presidents lifetime citation P-scores by world university rank
(in quintiles)
Pre
side
nts
P-s
core
University rank
18
-10
0
10
20
30
40
0 20 40 60 80 100
Figure 5 Presidents P-scores by rank among
the worlds top 100 universities
y = 11305 - 01047x R= 034479 P
resi
dent
s P
- sc
ore
University rank
-8
-6
-4
-2
0
2
4
0 20 40 60 80 100
Figure 5a Logarithm of presidents P-scores by university rank
y = 14413 - 0021876x R= 026413
Log
of p
resi
dent
s P
-sco
re
University rank
19
-5
0
5
10
15
20
0 20 40 60 80 100
Figure 6 Female presidents P-scores by university rank
y = 97036 - 012631x R= 069052
Pre
side
nts
P-s
core
University rank
-10
0
10
20
30
40
0 20 40 60 80 100
Figure 7 US presidents P-scores by university rank
y = 13492 - 013997x R= 037505
Pre
side
nts
P-s
core
University rank
20
-10
0
10
20
30
40
0 20 40 60 80 100
Figure 8 Presidents from the rest of the world P-scores by university rank
y = 61896 - 003646x R= 014019 P
resi
dent
s P
-sco
re
University rank
21
References
Bargh C Bocock J Scott P and Smith D (2000) University Leadership The Role of the Chief Executive Open University Press Buckingham
Bok D (2003) Universities in the Marketplace The commercialisation of Higher Education Princeton University Press New Jersey
Cohen MD and March JG (1974) Leadership and Ambiguity McGraw-Hill New York
Collison P and Millen J (1969) University chancellors vice chancellors and college principals A social profile Sociology Vol 3 No 1 pp 77-109
Cronin B Snyder H and Atkins H (1997) Comparative citation rankings of authors in monographic and journal literature a study of sociology Journal of Documentation Vol 53 No 3 pp 263-273
Dolton P and Ma A (2001) CEO Pay in the Public Sector The Case of Vice Chancellors in UK Universities Newcastle UK Working paper Newcastle University Discussion Papers in Economics
Fassoulaki A Paraskeva A Papilas K and Karabinis G (2000) Self-citations in six anaesthesia journals and their significance in determining the impact factor British Journal of Anaesthesia Vol 87 No 2 pp 266-269
Hamermesh DS (1994) Facts and Myths about Refereeing Journal of Economic Perspectives Vol 8 No 1 Winter pp 153-163
King DA (2004) The scientific impact of nations Nature Vol 430 pp 311-316
Lombardi JV Craig DD Capaldi ED and Gater DS (2002) The Top American Research Universities An Overview TheCenter Reports University of Florida Gainesville
Lombardi JV Craig DD Capaldi ED Reeves KR and Gater DS (2003) The Top American Research Universities TheCenter University of Florida Gainesville
Lotka AJ (1926) The Frequency Distribution of Scientific Productivity Journal of the Washington Academy of Sciences Vol 16 No12 pp 317-323
Middlehurst R (1993) Leading Academics Open University Press Buckingham
Moed HF (2002) The impact factors debate the ISI s uses and limits Nature Vol 415 pp 731-732
Norris M and Oppenheim C (2003) Citation counts and the Research Assessment Exercise V
Archaeology and the 2001 RAE Journal of Documentation Vol 59 No 6 pp 709-730
Oppenheim C (1995) The correlation between citation counts and the 1992 Research Assessment Exercise Ratings for British library and information science university departments Journal of Documentation Vol 51 pp 18-27
Oppenheim C (1997) The correlation between citation counts and the 1992 Research Assessment Exercise ratings for British research in genetics anatomy and archaeology Journal of Documentation Vol 53 No 5 pp 477-487
Potter W G (1988) Of Making Many Books There is No End Bibliometrics and Libraries The Journal of Academic Librarianship Vol14 pp 238a-238c
Rosovsky H (1991) The University An Owners Manual Norton New York
Seng LB amp Willett P (1995) The citedness of publications by United Kingdom library schools Journal of Information Science Vol 21 pp 68-71
Smith A and Eysenck M (2002) The correlation between RAE ratings and citation counts in psychology Working paper Department of Psychology Royal Holloway University of London
Taylor W (1986) Organisational Culture and Administrative Leadership in Universities In Leadership and Organisational Culture (eds Sergiovanni TJ and Corbally JE) pp125-141 Illini Books University of Illinois
Tierney W Corwin Z amp Colyar JE (Eds) (2004) Competing conceptions of governance Negotiating the perfect storm John Hopkins University Press Baltimore MD
22
van Leeuwen TN Moed HF Tijssen RJW Visser MS and Van Raan AFJ (2001)
Language biases in the coverage of the Science Citation Index and its consequences for international comparisons of national research performance Scientometrics Vol 51 No1 pp 335-346
van Raan AFJ (1998) Assessing the social sciences the use of advanced bibliometric methods as a necessary complement to peer review Research Evaluation Vol 7 pp 2-6
van Raan AFJ (2003) The use of bibliometric analysis in research performance assessment and monitoring of interdisciplinary scientific developments Technikfolgenabschatzung Vol 1 pp 20-29
van Raan AFJ (2005) Fatal Attraction Conceptual and methodological problems in the ranking of universities by bibliometric methods Scientometrics Vol 62 No 1 pp 133-143
Weingart P (2003) Evaluation of research performance the danger of numbers in Bibliometric analysis in science and research Applications Benefits and Limitations Second Conference of the Central Library Forschungszentrum Julich pp 7-19
Weingart P (2004) Impact of bibliometrics upon the science system inadvertent consequences in Handbook on Quantitative Science and Technology Research (eds Moed HF Glanzel W and Schmoch U) Kluwer Academic Publishers Dordrecht The Netherlands
Wouters PF (1999) The Citation Culture PhD Thesis University of Amsterdam The Netherlands
Interviews
Amy Gutmann President University of Pennsylvania -- interview at University of Pennsylvania April 28 2005
Jeremy Knowles Former Dean Faculty of Arts and Sciences Harvard -- interview at Harvard April12 2005
League tables
Academic Ranking of World Universities 2004 Institute of Higher Education Shanghai Jiao Tong University [httpedsjtueducnrankinghtm]
Top American Research Universities TheCenter [httpthecenterufledu]
Statistical packages
Paleontological Statistics Software Package for Education and Data Analysis Palaeontologia Electronica 4(1) 9pp [httppalaeo-electronicaorg2001_1pastissue1_01htm]
KaleidaGraph Synergy Software at [wwwsynergycom]
23
APPENDIX 1
Top 500 World Universities (1-100) 2004
World Rank
Institution Country Total Score
Score on
Alumni
Score
on Award
Score
on HiCi
Score on
NampS
Score on SCI
Score on Size
1 Harvard Univ USA 1000
986 1000
1000
1000
1000
606
2 Stanford Univ USA 772 412 722 961 752 723 681
3 Univ Cambridge UK 762 1000
934 566 585 702 732
4 Univ California - Berkeley USA 742 700 760 741 756 727 451
5 Massachusetts Inst Tech (MIT) USA 724 741 789 736 691 646 475
6 California Inst Tech USA 690 593 665 648 667 532 1000
7 Princeton Univ USA 636 610 768 654 521 468 673
8 Univ Oxford UK 614 644 591 531 553 652 590
9 Columbia Univ USA 612 778 588 573 516 683 370
10 Univ Chicago USA 605 722 819 553 466 541 327
11 Yale Univ USA 586 522 445 636 581 636 504
12 Cornell Univ USA 555 466 524 605 472 662 336
13 Univ California - San Diego USA 538 178 347 636 594 672 479
14 Tokyo Univ Japan 519 361 144 445 550 919 498
15 Univ Pennsylvania USA 518 356 351 612 446 726 340
16 Univ California - Los Angeles USA 516 274 328 605 481 799 248
17 Univ California - San Francisco USA 508 00 376 593 595 629 488
18 Univ Wisconsin - Madison USA 500 431 363 553 480 692 190
19 Univ Michigan - Ann Arbor USA 493 398 193 648 457 767 201
20 Univ Washington - Seattle USA 491 227 302 573 496 788 162
21 Kyoto Univ Japan 483 398 341 400 372 771 464
22 Johns Hopkins Univ USA 475 487 283 437 526 717 142
23 Imperial Coll London UK 464 209 381 462 394 658 445
24 Univ Toronto Canada 446 281 197 391 412 784 428
25 Univ Coll London UK 443 308 329 410 410 611 426
25 Univ Illinois - Urbana Champaign USA 433 417 374 462 360 582 178
24
27 Swiss Fed Inst Tech - Zurich Switzerland
432 403 370 391 432 471 415
28 Washington Univ - St Louis USA 431 251 266 419 468 562 449
29 Rockefeller Univ USA 402 227 598 315 436 271 386
30 Northwestern Univ USA 395 218 193 479 358 572 370
31 Duke Univ USA 389 209 00 486 468 627 362
32 New York Univ USA 387 339 250 437 393 509 191
33 Univ Minnesota - Twin Cities USA 383 361 00 539 359 696 128
34 Univ Colorado - Boulder USA 378 166 298 437 383 475 274
35 Univ California - Santa Barbara USA 370 00 285 454 414 440 362
36 Univ British Columbia Canada 363 209 193 360 316 595 349
36 Univ Texas Southwestern Med Center
USA 363 166 339 338 405 400 349
38 Vanderbilt Univ USA 351 126 302 371 238 502 417
39 Univ Utrecht Netherlands
349 308 214 315 299 581 221
40 Univ Texas - Austin USA 348 218 171 502 288 537 128
41 Univ Paris 06 France 339 357 239 231 247 567 326
42 Univ California - Davis USA 336 00 00 486 372 647 207
43 Pennsylvania State Univ - Univ Park
USA 335 141 00 502 377 587 142
44 Rutgers State Univ - New Brunswick
USA 334 154 204 381 361 482 195
45 Tech Univ Munich Germany 333 431 241 276 204 500 320
46 Karolinska Inst Stockholm Sweden 330 308 278 327 216 498 215
47 Univ Edinburgh UK 329 227 171 276 367 491 316
48 Univ Paris 11 France 325 333 342 214 213 468 312
48 Univ Pittsburgh - Pittsburgh USA 325 189 00 428 265 670 200
48 Univ Southern California USA 325 00 273 419 230 535 205
51 Univ Munich Germany 324 372 211 124 320 560 311
52 Univ Rochester USA 320 333 91 303 272 449 501
53 Australian Natl Univ Australia 319 178 129 410 314 436 307
54 Osaka Univ Japan 315 126 00 262 312 721 302
55 Univ California - Irvine USA 314 00 250 338 296 472 299
56 Univ North Carolina - Chapel Hill USA 312 126 00 381 345 605 203
57 Univ Maryland - Coll Park USA 311 259 00 400 332 540 174
25
57 Univ Zurich Switzerland
311 126 273 214 303 489 299
59 Univ Copenhagen Denmark 310 308 247 231 226 481 298
60 Univ Bristol UK 306 109 182 327 266 491 294
61 McGill Univ Canada 304 288 00 315 263 590 292
62 Carnegie Mellon Univ USA 303 189 302 327 174 388 340
63 Univ Leiden Netherlands
298 251 158 303 220 473 303
64 Univ Heidelberg Germany 297 109 277 231 221 497 285
65 Case Western Reserve Univ USA 296 372 118 231 222 461 406
66 Moscow State Univ Russia 295 515 349 00 81 585 283
67 Univ Florida USA 293 154 00 338 243 664 163
68 Univ Oslo Norway 292 259 341 195 172 421 280
69 Tohoku Univ Japan 288 189 00 195 261 693 277
69 Univ Sheffield UK 288 235 144 231 288 462 277
71 Purdue Univ - West Lafayette USA 287 189 171 315 221 505 138
72 Univ Helsinki Finland 286 189 182 151 237 569 275
73 Ohio State Univ - Columbus USA 285 178 00 410 206 613 96
74 Uppsala Univ Sweden 284 259 329 00 304 525 145
75 Rice Univ USA 283 218 223 262 237 302 446
76 Univ Arizona USA 281 00 00 315 377 565 181
77 Kings Coll London UK 280 166 235 231 198 462 269
78 Univ Manchester UK 279 259 193 214 182 486 268
79 Univ Goettingen Germany 274 388 204 175 182 428 263
80 Michigan State Univ USA 270 126 00 391 284 505 105
80 Univ Nottingham UK 270 154 204 231 201 451 259
82 Brown Univ USA 268 00 139 303 279 414 304
82 Univ Melbourne Australia 268 154 144 214 192 530 258
82 Univ Strasbourg 1 France 268 295 229 214 213 352 257
85 Ecole Normale Super Paris France 265 479 250 175 182 296 254
86 Boston Univ USA 263 154 00 327 296 515 96
86 Univ Vienna Austria 263 251 158 87 220 545 253
88 McMaster Univ Canada 260 166 193 231 162 452 250
26
88 Univ Freiburg Germany 260 251 214 195 180 409 250
90 Hebrew Univ Jerusalem Israel 259 154 00 262 295 483 249
91 Univ Basel Switzerland
258 259 175 214 242 355 248
92 Lund Univ Sweden 256 295 00 262 220 540 112
93 Univ Birmingham UK 255 251 112 247 140 476 245
93 Univ Roma - La Sapienza Italy 255 166 158 124 243 574 79
95 Humboldt Univ Berlin Germany 254 295 219 87 148 497 244
95 Univ Utah USA 254 00 00 327 307 484 201
97 Nagoya Univ Japan 252 00 144 151 237 553 242
97 Stockholm Univ Sweden 252 295 302 175 149 357 153
99 Tufts Univ USA 251 189 171 195 191 406 292
99 Univ Bonn Germany 251 199 204 175 167 439 241
Copyright copy 2004 Institute of Higher Education Shanghai Jiao Tong University All Rights Reserved
The methodology for the 2005 Global Ranking produced by SJTU has been slightly modified (see httpedsjtueducnrankinghtm)
27
APPENDIX 2
Citation thresholds for scientists across different disciplines
(January 1994 - June 2004)
Subject area Scientist Agricultural Sciences 154
Biology amp Biochemistry 780
Chemistry 648
Clinical Medicine 1095
Computer Science 84
Economics amp Business 169
Engineering 182
EnvironmentEcology 248
Geosciences 433
Humanities General 35
Immunology 763
Materials Science 219
Mathematics 130
Microbiology 534
Molecular Biology amp Genetics 1234
Multidisciplinary 123
Neuroscience amp Behaviour 908
Pharmacology amp Toxicology 312
Physics 1832
Plant amp Animal Science 292
PsychiatryPsychology 393
Social Sciences General 117
Space Science 1301 Updated Sept 1 2004 Thomson ISI Highly cited available from
httpin-citescomthresholds-citationhtml
Humanities score created by Amanda H Goodall
Note to Table The above citation thresholds represent the top 1 researchers (approximately 250) in each disciplinary field

5
League tables
As higher education has become global in the recruitment of international students and staff so have league tables International tables have existed for a number of years in areas such as business education through the Financial Times In 2003 the first global league table of universities was produced by the Institute of Education in Shanghai at Jiao Tong University (SJTU) SJTU used a process of inviting comment through their website to make adjustments to their methodology for the 2004 table
The UK based Times Higher Education Supplement (THES) produced a global ranking in November 2004 (wwwthescouk) which has not been used in this study There are three main problems with the league table First 50 weight is assigned to a subjective peer-review process where 1300 academics across 88 countries are invited to name the top institutions in their geographic area and their academic field This is the largest component in the ranking yet there is no information available on the background of these global academics That is a concern For example how might an individual s choice have been influenced by their own place of education sabbatical leave or co-authorship and so on Second 10 weight is given for the international nature of an institution s student body and staff However there is little explanation about why international is a proxy for high quality Finally because the THES is a commercial organisation it is not possible to access the data or check the calculations
An advantage of the SJTU table is that it is not produced by a newspaper or magazine Media-generated league tables are ubiquitous and controversial Tables such as those in The Times and US News and World Report in the US offer information to potential students across a range of criteria Media-driven league tables may be useful heuristic devices for students but as objective tools of assessment of university quality they are unreliable Perhaps the main criticism is that they are produced by commercial organisations designed to make money by selling their publications Therefore a headline is required To generate a story the methodology is changed often annually which ensures that institutions at the top rotate (Lombardi et al 2002) Lombardi and colleagues suggest instead that in the US university positions actually change very little each year if a fixed method of analysis is used (2002)
The Center for Studies in the Humanities and Social Sciences (wwwthecenterufledu ) was created as a non-profit organisation in 1998 in the United States Its mission is to develop methods for measuring and improving university performance For a number of years TheCenter has produced an alternative ranking The Top American Research Universities (Lombardi et al 2003)
This ranking differs from media equivalents because actual numbered positions are not assigned Instead universities are assessed on nine separate measures Those that score highly in at least one of the nine measures are put into a 1-25 top research university category3
3 The measures include total research federal research endowment assets annual giving national academy members faculty awards doctorates granted postdoctoral appointees and SAT scores Some degree of ranking does exist because they are ordered depending on the number of points they score across the nine categories So the top three universities score 9 out of 9 the next six universities score 8 out of 9 and so on
6
The measures of university quality used in both TheCenter and the SJTU world league tables do not exactly correspond However it is interesting to compare the number of US universities at the top in both tables TheCenter s top-25 category has 52 universities included Of these 44 also feature in the SJTU global table Positions 1-27 are exactly correlated in both rankings In other words these two rankings of top US universities are very similar
The Academic Ranking of World Universities (2004) league table uses 6 different criteria to assess universities The table below comes from the SJTU web site
Table 1 Methodology used in SJTU ranking 2004
Criteria
Indicator Code
Weight
Quality of Education
Alumni of an institution winning Nobel Prizes and Fields Medals
Alumni
10
Staff of an institution winning Nobel Prizes and Fields Medals
Award
20 Quality of Faculty
Highly cited researchers in 21 broad subject categories
HiCi 20
Articles published in Nature and Science
NampS 20 Research
Output Articles in Science Citation Index-expanded and Social Science Citation Index
SCI 20
Size of Institution
Academic performance with respect to the size of an institution
Size 10
Total 100
Copyright copy 2004 Institute of Higher Education Shanghai Jiao Tong University
For institutions specialized in humanities and social sciences such as London School of Economics NampS is not considered and the weight of NampS is relocated to other indicators
There are arguably some weaknesses in the SJTU methodology First younger universities stand to lose out particularly in the first category that assigns weight (10) to alumni awards Second the humanities and the social sciences are weakly represented here -- though SJTU have done some adjustment for this There are no ISI HiCi s in the arts and humanities and far fewer in the social sciences The Awards category is also limited Nobel Prizes are only given for achievement in physics chemistry medicinephysiology economics literature and peace and Fields Medals only for mathematics
7
Data on the 100 university presidents
It is important to note that the world league table ranks institutions by assigning points (as per criteria above) This can result in two or more institutions being given the same position (see the full list in Appendix 1)
The universities in the top-100 table are dominated by the United States where 51 of the institutions are located As can be seen in Figure 1 US institutions are unevenly spread across the world s top 100 dominating the top 20 with 17 universities and with 30 in the top 40 Of the 100 total only 4 in the bottom 20 are US-based If we treat American states as individual nations California with a population of 36 million has the highest number of leading universities Ten Californian institutions are within the top 55 6 of these are in the top 20 and 7 of the 10 are public or state universities
Thirty-seven institutions out of 100 are located in European countries Of these 11 are in the United Kingdom 7 in Germany 4 in both France and Sweden 3 in Switzerland 2 in the Netherlands and 1 each in Austria Denmark Finland Norway Italy and Russia Finally among the top 100 there are 12 universities in the rest of the world -- 5 in Japan 4 in Canada 2 in Australia and 1 in Israel
The nation location of an institution is not always reflected in the nationality of its president For example the top 10 universities are found in two countries -- US (8) and UK (2) whereas the leaders come from four -- Canada New Zealand UK and the US There are 15 female presidents in the sample Six are in the top 20 universities and 10 are within the top 50 North America dominates with 9 US female presidents and 2 in Canada The remaining four are in Denmark France Sweden and the UK
Every president in the group of 100 universities has a PhD The majority have been academics though two presidents spent most of their careers in non-research positions in industry or government and a small group went almost directly into academic administration
The age of a president potentially affects his or her lifetime citation levels The older they are the greater the opportunity to accrue citations It is therefore necessary to check whether presidents with the highest levels of lifetime citations are in fact older than those with fewer citations Some European universities still publish date of birth information though they are in the minority Birth dates can be loosely calculated by using individuals age at graduation from first degree Using this method it is possible to compare the ages of presidents at the top and bottom of the top-100 global league table If it is shown that the top presidents are markedly older than those in the bottom 20 then adjustment of citation scores would be necessary
The ages of only 80 of presidents in the top 20 universities and 80 of presidents in the bottom 20 could be obtained The mean age of presidents in the top 20 universities is 58 years In the bottom 20 category the mean age of president is 60 Because of the closeness in age between these two groups and in particular the slightly older average age of the lowest quintile citation scores have not been adjusted
Figure 2 displays the disciplinary background of the presidents What is noticeable is the evenness of disciplinary spread across each quintile Of the 100 presidents 52 have a
8
scientific background The scientists are dominated by the life sciences at 50 but there are also 11 engineers 6 physicists 5 chemists and 4 computer scientists
Thirty-seven of the 100 presidents are social scientists The largest disciplinary group among the social scientists is that of lawyers who number 15 Within a second group of 16 there is an even spread of educationalists political scientists sociologists and those from public and social policy Finally there are 6 economists
Eleven presidents are from the arts and humanities This group is noticeably smaller Taylor (1986) documents the disciplinary distribution amongst vice chancellors and principals in the UK in 1986 He also cites earlier work by Collison and Millen (1969) who showed that in the UK between 1935 and 1967 the proportion of presidents from the arts declined from 68 to 48 while scientists rose from 19 to 41 Taylor then reports his own findings that by 1981 67 of vice chancellors and principals were scientists 13 from the social sciences and less than 20 were from the arts Cohen and March (1974) showed a similar pattern -- in the number of presidents from the arts - for the US between 1924 and 1969
In a study by Dolton and Ma (2001) on CEO Pay the disciplinary backgrounds of UK vice chancellors are reported Drawn from a wide cross-section of British universities (including Oxbridge civic universities former colleges of advanced technology among others) they note that VCs in position in 1999 included 3 lawyers 13 engineers scientists made up 25 social sciences including business 36 and finally VCs from the arts and humanities made up 13 10 were reported as being non-academics
Of the 100 presidents in the current paper s sample 12 are ISI Highly Cited (HiCi) academics These individuals are more common in the top universities Of the 12 presidents in HiCi 6 are in the top 20 group of universities 3 in the next 20 2 in the next and 1 in the fourth quartile Finally there are 3 Nobel Prize winners among the presidents (all in medicine) -- two in the top 20 and one in the 20-40 category
The distribution of citations across the 100 presidents fits Lotka s Law an application that is often used in bibliometric research Lotka (1926) describes the frequency of publication by authors in a given field As can be observed in Figure 3 using presidents P-scores a version of this law applies here Lotka s power law predicts that of all the authors in a specific field approximately 60 percent will publish just one article 15 percent will have two publications 7 percent of authors will publish three pieces and so on (Potter 1988) According to Lotkas Law of scientific productivity only 6 percent of the authors in a field will produce more than 10 articles (the number making n contributions is about 1nsup2 of those making one) This law is most accurate when applied over long periods of time and to large bodies of work -- for example individuals lifetime citations
The results
As outlined above the 100 presidents lifetime citations are represented by a normalised P-score
The individual citation scores of the 100 presidents before adjustment range from 0 to 28718 The mean citation score is 2731 and the median is 371 After adjusting for discipline the highest P-score is 37 points and the lowest is 0 The mean P-score is 603
9
and the median is 227 When the group of 100 is split into two the top leaders of the 50 universities have a mean P-score of 876 and a median of 457 and those in the bottom half of universities have a mean P-score of 330 and a median of 093 Of the total group of 100 presidents 4 have a citation score of zero
The results are presented here in scatter plots and cross tabulations - that are grouped into quintiles (the 1-20 group always refers to the top of the SJTU table and 1 equals Harvard)
The most highly ranked universities have leaders who are more highly cited Figure 4 shows this It gives a cross-sectional breakdown of P-score by university rank in quintiles This shows a monotonic decline in citation levels as the universities go down in world rank
The next step is to try to establish statistical significance The paper does this in two ways
A natural first approach is to test whether the rank ordering of one variable is correlated with the rank order of the second variable Spearman s rank correlation coefficient is an appropriate measure The highest P-score is ranked 1 and the lowest P-score is ranked100 The actual rank of presidents P-scores is then tested for a correlation against university rank
Using these data Spearman s rho is calculated at 0378 With 100 observations the associated 5 critical value for a two-tailed test is 0195 and at 1 it is 0254 which establishes that the correlation is statistially significant at conventional confidence levels
A second approach can be seen in Figure 5 which gives the distribution of the 100 individual P-scores by world university rank Using Pearson s coefficient (r) the degree of linear relationship between the rank of university and president s P-score can be examined For the data in Figure 5 Pearson s r is 0345 The 1 critical value on a two-tailed test is 0254 which means again that the relationship is statistically significant4 There continues to be a statistically significant relationship if the natural logarithm of P-score is used this can be seen in Figure 5a
This correlation between cites and university quality can also be seen amongst the sub-sample of female presidents though at 15 the group is small (Figure 6) It is also statistically significant at the 1 level The disciplinary breakdown of the 15 female presidents is 7 scientists 7 social scientists and 1 from the humanities One president is Highly Cited
US universities make up 51 out of the 100 The mean P-score for this US group is 807 with a median score of 486 which is higher than the world group mean of 603 and median of 227 There are 25 scientists 21 social scientists and 5 in the humanities Of the 12 Highly Cited presidents in total 9 are based in US universities though two of these are non-Americans -- 1 is from Canada and 1 from the UK who is also a Nobel Prize winner
4 It should be noted that there is evidence that the residuals are skewed
10
Figure 7 presents a scatter plot for the sample of US presidents Again there is a correlation between citation levels and (world) university position The correlation is significant at the 1 level
It is useful to note that university rank explains only 12 of the variance in leaders citations In other words there are many other explanatory factors that are not being measured here However these correlations are significant enough to warrant further investigation and discussion
Is the citation-rank correlation true for universities outside the US
So far we have identified a strong positive relationship between the citation levels of university presidents and the position of their institution within a ranking of 100 universities This association exists amongst the 100 presidents in total the female group and the 51 US presidents
The mean citation P-score for presidents in the 49 countries in the rest of the world is 391 with a median score of 107 This is below the 100-group mean P-score of 6 and it is half the US mean P-score of 8 Therefore US presidents are twice as cited as those in the rest of the world
In the rest of the world the presidents include 27 scientists 16 social scientists and 6 in the humanities There are 3 Highly Cited researchers in the group Two are from the Netherlands and one in Germany
Figure 8 shows there is no statistically significant correlation between citation levels and position of president across the 49 countries in the rest of the world
As can be seen in the data one of the differences between the top American universities and non-American universities is that the former choose leaders who are more highly cited
Outliers
It is important to ensure that the results from this study have not been unduly influenced by a small number of presidents with extremely high P-scores To do this two tests are available First we can return to Spearman s rho which puts an equal weight on each observation instead of assigning continuous values As has been pointed out above a statistically significant rank correlation has been established with a significance level better than 1
The second check on outliers is simply to delete the data used from the highest P-scores for the Pearson s test To do this the top 5 of P-scores all located within ranges 30 and 40 were withdrawn and the correlation re-tested with a result of 0297 With 95 observations the 5 critical value for a two-tailed test is 0200 and at 1 it is 0260 so the correlation remains
11
Possible interpretations
Data on world university rankings have only recently become available That universities with strongly research-intensive missions appoint as their presidents men and women with strong citation records does not appear to have been previously documented The data in this paper do not enable judgements to be made about the weight assigned by selection committees to the research records of presidential candidates as distinct for example from other criteria such as managerial expertise or entrepreneurship But the data do suggest that research universities look for candidates who fit institutional missions
Internationally active researchers lead the world s top universities On average the higher the university is in the global ranking the more highly cited is that institution s president There are of course exceptions Two universities from the Netherlands -- in positions 39 and 63 -- both have presidents who are Highly Cited (It is interesting to note that these are the only two universities in the top 100 from that country) And there are top universities led by presidents with few or no citations However these cases are in a minority
These findings show that in at least one area the top universities are making different choices from those lower in the global ranking What can we learn from this difference Why do those institutions at the top appoint former researchers to the role of president
There are a number of possible reasons for the correlation They include
Hypothesis 1 Better researchers make better leaders of research universities
It has been recognised in the literature that presidents need to learn particular skills to enable them to lead a university (Cohen and March 1974 Rosovsky 1991 Middlehurst 1993 Bargh et al 2000 among others) In the UK an organisation for training academic leaders has recently been established with government funding
Whilst the education and career background of academic leaders has attracted some interest (Cohen and March 1974 Taylor 1986 Bargh at al 2000 Dolton and Ma 2001) little specific attention has been given to the research background of presidents Yet many university websites make a great deal of the eminence of the president
It seems clear that better researchers will tend to have greater prestige within the hierarchy of the academy and presidents who are highly cited may therefore enjoy credibility and negotiating strength that extends beyond their own discipline Jeremy Knowles the former Dean of Harvard s Faculty of Arts and Sciences (from 1991 2002) said that he believed his own research record helped his position as dean because it gave him greater status and therefore negotiating power when dealing with eminent faculty (interview with author April 12 2005) This suggests that being a cited researcher is of symbolic importance
This message was repeated in an interview with Amy Gutmann President of the University of Pennsylvania who said that being a researcher sends a signal to the faculty that you the president share their scholarly values and general understanding of the culture of the academy (interview April 28 2005)
12
Being a successful research academic may also help in attracting faculty particularly stars to a university which has become a preoccupation the world over Having a president who is a distinguished researcher may enhance the appeal of an institution
Alternatively it may be that two separate components are involved when leading a research university namely managerial expertise and inherent knowledge The former pertains to having knowledge of generic functions such as finance and budgeting human resource management corporate governance among others Most presidents running top universities will have had experience in managerial positions -- running large laboratories as head of department or pro-vice chancellor Experienced managers can also be brought in to perform specialised administrative roles Thus a former UK university vice chancellor has suggested (in personal correspondence) that what matters is scholarship not just management -- that we should take management for granted
The term inherent knowledge is used here to suggest a specific knowledge of or insight into academe that is borne out of expertise gained through academic research It suggests that good researchers may bring something else to the role of leader -- a perspective and understanding directly linked to their past as a successful scholar
It is possible that inherent knowledge also helps leaders inform strategy-making For example it may be easier to interpret research trends and future intellectual directions But how easy is it for a highly cited chemist to assess a faculty member from information science or discern the future direction of modern languages One possibility is that faculty at the top of their fields can make a fair assessment about the quality of work produced by those in other fields by using the same mechanisms used generally in academia namely citation indices and peer review
Hypothesis 2 Top universities appoint good researchers for reasons relating to external factors such as PR and fundraising
It has been said that US presidents in top universities spend a great deal of time fundraising and subsequently that they are less involved with running the institution This is not the place to compare US presidential leadership with European rectors or British vice chancellors Briefly however the American system is unitary with the president at the head of the hierarchy Though the president reports to a powerful board of trustees he or she is ultimately in charge with a role similar to that of a chief executive officer Senior academic administrators in the US (deans provosts chairs of departments) are normally appointed not voted into position by faculty In short the US presidential system is recognised as giving greater authority and powers to university leaders when compared to other systems of higher education from Europe to Japan (Rosovsky 1991 Bargh et al 2000) This is particularly true of US private universities US publics on the other hand are more exposed to state government intervention
Amy Gutmann President of University of Pennsylvania was clear in an interview that she is centrally involved in making senior appointments and in deciding the overall strategic direction of the university Long term strategy is designed through a collaborative process involving the president and the deans and provosts that she appoints and whose work she oversees (April 28 2005)
13
Appointment committees may select high-profile academics as presidents for external reasons The alumni may be encouraged to give more generously Gaining greater media exposure for the institution may also be a motive Alternatively if the governing body of a university wants to push an institution in a different direction towards research it may consider appointing a good researcher to signal a change in the internal culture
Hypothesis 3 The correlation is explained through unobservable heterogeneity
This would mean that research talent is merely a proxy for leadership ability The positive relationship between presidents P-scores and university rank may actually be picking up a correlation between other variables For instance presidents who are good at research may just be good at everything This is the alternative to a cause-and-effect relationship
All correlations are potentially susceptible to this kind of criticism It seems implausible however that candidates research records do not play a part in their selection for headship of institutions with prominent research missions
Concluding comments
This study which seems to be the first of its kind finds a correlation between the citations of presidents and the positions of their universities in a world league table Better universities are run by better researchers
The statistical relationship is strong for the group of 100 universities as a whole and for the sub-samples of female presidents and US presidents On average one extra point on a president s adjusted citation score where scores run from zero for the least-cited president to a score of up to 40 for Highly Cited and Nobel-prize winning presidents is associated with ten extra places in the world s top-100 ranking of universities No statistically significant correlation is found however for the sub-sample of universities from the rest of the world
Simple quantitative research of this kind may offer insights into university leadership - insights that are particularly relevant to universities that want to compete for a position amongst the world s top research institutions The best universities which can choose from the widest pool are systematically selecting top researchers to lead them What do such researchers bring to the role of leader This paper posits that there are two central components involved in leading research universities managerial expertise and inherent knowledge It is suggested here that better researchers may have greater inherent knowledge about academe that in turn informs their role as leader A president s research background may also have symbolic value in that it sends out a signal about the values of that institution And finally being a reputed researcher may raise a leader s status within the academic community and enhance his or her powers of negotiation
However the paper notes that other interpretations of the data are possible One is that universities choose top researchers for reasons of prestige and to assist in fundraising This is probably true as a factor for selection though it is unlikely to be the sole function
14
of a president in a top institution Another is that research ability is simply a proxy for some other kind of talent that is useful to leaders
Causality cannot be established through these correlations The performance of a university has not been shown here to be linked to the actions of a president or vice chancellor whether highly cited or not However this type of study starts the process of understanding whether there may be benefits from appointing a researcher as president A further study is underway exploring causality
15
0
5
10
15
20
1 - 20 21 - 40 41 - 60 61 - 80 81 - 100
Figure 1 The cross-country distribution of the worlds top 100 universities
USA EuropeRest World
Num
ber
of u
nive
rsiti
es
University rank (1 is top)
0
5
10
15
20
25
0 - 20 21 - 40 41 - 60 61 - 80 81 - 100
Figure 2 The disciplines of the presidents of the worlds top universites
ScienceHumanitiesSocial science
Dis
cipl
ine
University rank
16
-1
0
1
2
3
4
5
05 1 15 2 25 3 35 4
Figure 3 The distribution of presidents lifetime citations follows Lotkas power law
Loga
rithm
of t
he n
umbe
r of
pre
side
nts
Logarithm of presidents P-scores
17
0
50
100
150
200
0-20 21-40 41-60 61-80 81-100
Figure 4 A cross-tabulation of presidents lifetime citation P-scores by world university rank
(in quintiles)
Pre
side
nts
P-s
core
University rank
18
-10
0
10
20
30
40
0 20 40 60 80 100
Figure 5 Presidents P-scores by rank among
the worlds top 100 universities
y = 11305 - 01047x R= 034479 P
resi
dent
s P
- sc
ore
University rank
-8
-6
-4
-2
0
2
4
0 20 40 60 80 100
Figure 5a Logarithm of presidents P-scores by university rank
y = 14413 - 0021876x R= 026413
Log
of p
resi
dent
s P
-sco
re
University rank
19
-5
0
5
10
15
20
0 20 40 60 80 100
Figure 6 Female presidents P-scores by university rank
y = 97036 - 012631x R= 069052
Pre
side
nts
P-s
core
University rank
-10
0
10
20
30
40
0 20 40 60 80 100
Figure 7 US presidents P-scores by university rank
y = 13492 - 013997x R= 037505
Pre
side
nts
P-s
core
University rank
20
-10
0
10
20
30
40
0 20 40 60 80 100
Figure 8 Presidents from the rest of the world P-scores by university rank
y = 61896 - 003646x R= 014019 P
resi
dent
s P
-sco
re
University rank
21
References
Bargh C Bocock J Scott P and Smith D (2000) University Leadership The Role of the Chief Executive Open University Press Buckingham
Bok D (2003) Universities in the Marketplace The commercialisation of Higher Education Princeton University Press New Jersey
Cohen MD and March JG (1974) Leadership and Ambiguity McGraw-Hill New York
Collison P and Millen J (1969) University chancellors vice chancellors and college principals A social profile Sociology Vol 3 No 1 pp 77-109
Cronin B Snyder H and Atkins H (1997) Comparative citation rankings of authors in monographic and journal literature a study of sociology Journal of Documentation Vol 53 No 3 pp 263-273
Dolton P and Ma A (2001) CEO Pay in the Public Sector The Case of Vice Chancellors in UK Universities Newcastle UK Working paper Newcastle University Discussion Papers in Economics
Fassoulaki A Paraskeva A Papilas K and Karabinis G (2000) Self-citations in six anaesthesia journals and their significance in determining the impact factor British Journal of Anaesthesia Vol 87 No 2 pp 266-269
Hamermesh DS (1994) Facts and Myths about Refereeing Journal of Economic Perspectives Vol 8 No 1 Winter pp 153-163
King DA (2004) The scientific impact of nations Nature Vol 430 pp 311-316
Lombardi JV Craig DD Capaldi ED and Gater DS (2002) The Top American Research Universities An Overview TheCenter Reports University of Florida Gainesville
Lombardi JV Craig DD Capaldi ED Reeves KR and Gater DS (2003) The Top American Research Universities TheCenter University of Florida Gainesville
Lotka AJ (1926) The Frequency Distribution of Scientific Productivity Journal of the Washington Academy of Sciences Vol 16 No12 pp 317-323
Middlehurst R (1993) Leading Academics Open University Press Buckingham
Moed HF (2002) The impact factors debate the ISI s uses and limits Nature Vol 415 pp 731-732
Norris M and Oppenheim C (2003) Citation counts and the Research Assessment Exercise V
Archaeology and the 2001 RAE Journal of Documentation Vol 59 No 6 pp 709-730
Oppenheim C (1995) The correlation between citation counts and the 1992 Research Assessment Exercise Ratings for British library and information science university departments Journal of Documentation Vol 51 pp 18-27
Oppenheim C (1997) The correlation between citation counts and the 1992 Research Assessment Exercise ratings for British research in genetics anatomy and archaeology Journal of Documentation Vol 53 No 5 pp 477-487
Potter W G (1988) Of Making Many Books There is No End Bibliometrics and Libraries The Journal of Academic Librarianship Vol14 pp 238a-238c
Rosovsky H (1991) The University An Owners Manual Norton New York
Seng LB amp Willett P (1995) The citedness of publications by United Kingdom library schools Journal of Information Science Vol 21 pp 68-71
Smith A and Eysenck M (2002) The correlation between RAE ratings and citation counts in psychology Working paper Department of Psychology Royal Holloway University of London
Taylor W (1986) Organisational Culture and Administrative Leadership in Universities In Leadership and Organisational Culture (eds Sergiovanni TJ and Corbally JE) pp125-141 Illini Books University of Illinois
Tierney W Corwin Z amp Colyar JE (Eds) (2004) Competing conceptions of governance Negotiating the perfect storm John Hopkins University Press Baltimore MD
22
van Leeuwen TN Moed HF Tijssen RJW Visser MS and Van Raan AFJ (2001)
Language biases in the coverage of the Science Citation Index and its consequences for international comparisons of national research performance Scientometrics Vol 51 No1 pp 335-346
van Raan AFJ (1998) Assessing the social sciences the use of advanced bibliometric methods as a necessary complement to peer review Research Evaluation Vol 7 pp 2-6
van Raan AFJ (2003) The use of bibliometric analysis in research performance assessment and monitoring of interdisciplinary scientific developments Technikfolgenabschatzung Vol 1 pp 20-29
van Raan AFJ (2005) Fatal Attraction Conceptual and methodological problems in the ranking of universities by bibliometric methods Scientometrics Vol 62 No 1 pp 133-143
Weingart P (2003) Evaluation of research performance the danger of numbers in Bibliometric analysis in science and research Applications Benefits and Limitations Second Conference of the Central Library Forschungszentrum Julich pp 7-19
Weingart P (2004) Impact of bibliometrics upon the science system inadvertent consequences in Handbook on Quantitative Science and Technology Research (eds Moed HF Glanzel W and Schmoch U) Kluwer Academic Publishers Dordrecht The Netherlands
Wouters PF (1999) The Citation Culture PhD Thesis University of Amsterdam The Netherlands
Interviews
Amy Gutmann President University of Pennsylvania -- interview at University of Pennsylvania April 28 2005
Jeremy Knowles Former Dean Faculty of Arts and Sciences Harvard -- interview at Harvard April12 2005
League tables
Academic Ranking of World Universities 2004 Institute of Higher Education Shanghai Jiao Tong University [httpedsjtueducnrankinghtm]
Top American Research Universities TheCenter [httpthecenterufledu]
Statistical packages
Paleontological Statistics Software Package for Education and Data Analysis Palaeontologia Electronica 4(1) 9pp [httppalaeo-electronicaorg2001_1pastissue1_01htm]
KaleidaGraph Synergy Software at [wwwsynergycom]
23
APPENDIX 1
Top 500 World Universities (1-100) 2004
World Rank
Institution Country Total Score
Score on
Alumni
Score
on Award
Score
on HiCi
Score on
NampS
Score on SCI
Score on Size
1 Harvard Univ USA 1000
986 1000
1000
1000
1000
606
2 Stanford Univ USA 772 412 722 961 752 723 681
3 Univ Cambridge UK 762 1000
934 566 585 702 732
4 Univ California - Berkeley USA 742 700 760 741 756 727 451
5 Massachusetts Inst Tech (MIT) USA 724 741 789 736 691 646 475
6 California Inst Tech USA 690 593 665 648 667 532 1000
7 Princeton Univ USA 636 610 768 654 521 468 673
8 Univ Oxford UK 614 644 591 531 553 652 590
9 Columbia Univ USA 612 778 588 573 516 683 370
10 Univ Chicago USA 605 722 819 553 466 541 327
11 Yale Univ USA 586 522 445 636 581 636 504
12 Cornell Univ USA 555 466 524 605 472 662 336
13 Univ California - San Diego USA 538 178 347 636 594 672 479
14 Tokyo Univ Japan 519 361 144 445 550 919 498
15 Univ Pennsylvania USA 518 356 351 612 446 726 340
16 Univ California - Los Angeles USA 516 274 328 605 481 799 248
17 Univ California - San Francisco USA 508 00 376 593 595 629 488
18 Univ Wisconsin - Madison USA 500 431 363 553 480 692 190
19 Univ Michigan - Ann Arbor USA 493 398 193 648 457 767 201
20 Univ Washington - Seattle USA 491 227 302 573 496 788 162
21 Kyoto Univ Japan 483 398 341 400 372 771 464
22 Johns Hopkins Univ USA 475 487 283 437 526 717 142
23 Imperial Coll London UK 464 209 381 462 394 658 445
24 Univ Toronto Canada 446 281 197 391 412 784 428
25 Univ Coll London UK 443 308 329 410 410 611 426
25 Univ Illinois - Urbana Champaign USA 433 417 374 462 360 582 178
24
27 Swiss Fed Inst Tech - Zurich Switzerland
432 403 370 391 432 471 415
28 Washington Univ - St Louis USA 431 251 266 419 468 562 449
29 Rockefeller Univ USA 402 227 598 315 436 271 386
30 Northwestern Univ USA 395 218 193 479 358 572 370
31 Duke Univ USA 389 209 00 486 468 627 362
32 New York Univ USA 387 339 250 437 393 509 191
33 Univ Minnesota - Twin Cities USA 383 361 00 539 359 696 128
34 Univ Colorado - Boulder USA 378 166 298 437 383 475 274
35 Univ California - Santa Barbara USA 370 00 285 454 414 440 362
36 Univ British Columbia Canada 363 209 193 360 316 595 349
36 Univ Texas Southwestern Med Center
USA 363 166 339 338 405 400 349
38 Vanderbilt Univ USA 351 126 302 371 238 502 417
39 Univ Utrecht Netherlands
349 308 214 315 299 581 221
40 Univ Texas - Austin USA 348 218 171 502 288 537 128
41 Univ Paris 06 France 339 357 239 231 247 567 326
42 Univ California - Davis USA 336 00 00 486 372 647 207
43 Pennsylvania State Univ - Univ Park
USA 335 141 00 502 377 587 142
44 Rutgers State Univ - New Brunswick
USA 334 154 204 381 361 482 195
45 Tech Univ Munich Germany 333 431 241 276 204 500 320
46 Karolinska Inst Stockholm Sweden 330 308 278 327 216 498 215
47 Univ Edinburgh UK 329 227 171 276 367 491 316
48 Univ Paris 11 France 325 333 342 214 213 468 312
48 Univ Pittsburgh - Pittsburgh USA 325 189 00 428 265 670 200
48 Univ Southern California USA 325 00 273 419 230 535 205
51 Univ Munich Germany 324 372 211 124 320 560 311
52 Univ Rochester USA 320 333 91 303 272 449 501
53 Australian Natl Univ Australia 319 178 129 410 314 436 307
54 Osaka Univ Japan 315 126 00 262 312 721 302
55 Univ California - Irvine USA 314 00 250 338 296 472 299
56 Univ North Carolina - Chapel Hill USA 312 126 00 381 345 605 203
57 Univ Maryland - Coll Park USA 311 259 00 400 332 540 174
25
57 Univ Zurich Switzerland
311 126 273 214 303 489 299
59 Univ Copenhagen Denmark 310 308 247 231 226 481 298
60 Univ Bristol UK 306 109 182 327 266 491 294
61 McGill Univ Canada 304 288 00 315 263 590 292
62 Carnegie Mellon Univ USA 303 189 302 327 174 388 340
63 Univ Leiden Netherlands
298 251 158 303 220 473 303
64 Univ Heidelberg Germany 297 109 277 231 221 497 285
65 Case Western Reserve Univ USA 296 372 118 231 222 461 406
66 Moscow State Univ Russia 295 515 349 00 81 585 283
67 Univ Florida USA 293 154 00 338 243 664 163
68 Univ Oslo Norway 292 259 341 195 172 421 280
69 Tohoku Univ Japan 288 189 00 195 261 693 277
69 Univ Sheffield UK 288 235 144 231 288 462 277
71 Purdue Univ - West Lafayette USA 287 189 171 315 221 505 138
72 Univ Helsinki Finland 286 189 182 151 237 569 275
73 Ohio State Univ - Columbus USA 285 178 00 410 206 613 96
74 Uppsala Univ Sweden 284 259 329 00 304 525 145
75 Rice Univ USA 283 218 223 262 237 302 446
76 Univ Arizona USA 281 00 00 315 377 565 181
77 Kings Coll London UK 280 166 235 231 198 462 269
78 Univ Manchester UK 279 259 193 214 182 486 268
79 Univ Goettingen Germany 274 388 204 175 182 428 263
80 Michigan State Univ USA 270 126 00 391 284 505 105
80 Univ Nottingham UK 270 154 204 231 201 451 259
82 Brown Univ USA 268 00 139 303 279 414 304
82 Univ Melbourne Australia 268 154 144 214 192 530 258
82 Univ Strasbourg 1 France 268 295 229 214 213 352 257
85 Ecole Normale Super Paris France 265 479 250 175 182 296 254
86 Boston Univ USA 263 154 00 327 296 515 96
86 Univ Vienna Austria 263 251 158 87 220 545 253
88 McMaster Univ Canada 260 166 193 231 162 452 250
26
88 Univ Freiburg Germany 260 251 214 195 180 409 250
90 Hebrew Univ Jerusalem Israel 259 154 00 262 295 483 249
91 Univ Basel Switzerland
258 259 175 214 242 355 248
92 Lund Univ Sweden 256 295 00 262 220 540 112
93 Univ Birmingham UK 255 251 112 247 140 476 245
93 Univ Roma - La Sapienza Italy 255 166 158 124 243 574 79
95 Humboldt Univ Berlin Germany 254 295 219 87 148 497 244
95 Univ Utah USA 254 00 00 327 307 484 201
97 Nagoya Univ Japan 252 00 144 151 237 553 242
97 Stockholm Univ Sweden 252 295 302 175 149 357 153
99 Tufts Univ USA 251 189 171 195 191 406 292
99 Univ Bonn Germany 251 199 204 175 167 439 241
Copyright copy 2004 Institute of Higher Education Shanghai Jiao Tong University All Rights Reserved
The methodology for the 2005 Global Ranking produced by SJTU has been slightly modified (see httpedsjtueducnrankinghtm)
27
APPENDIX 2
Citation thresholds for scientists across different disciplines
(January 1994 - June 2004)
Subject area Scientist Agricultural Sciences 154
Biology amp Biochemistry 780
Chemistry 648
Clinical Medicine 1095
Computer Science 84
Economics amp Business 169
Engineering 182
EnvironmentEcology 248
Geosciences 433
Humanities General 35
Immunology 763
Materials Science 219
Mathematics 130
Microbiology 534
Molecular Biology amp Genetics 1234
Multidisciplinary 123
Neuroscience amp Behaviour 908
Pharmacology amp Toxicology 312
Physics 1832
Plant amp Animal Science 292
PsychiatryPsychology 393
Social Sciences General 117
Space Science 1301 Updated Sept 1 2004 Thomson ISI Highly cited available from
httpin-citescomthresholds-citationhtml
Humanities score created by Amanda H Goodall
Note to Table The above citation thresholds represent the top 1 researchers (approximately 250) in each disciplinary field

10
Figure 7 presents a scatter plot for the sample of US presidents Again there is a correlation between citation levels and (world) university position The correlation is significant at the 1 level
It is useful to note that university rank explains only 12 of the variance in leaders citations In other words there are many other explanatory factors that are not being measured here However these correlations are significant enough to warrant further investigation and discussion
Is the citation-rank correlation true for universities outside the US
So far we have identified a strong positive relationship between the citation levels of university presidents and the position of their institution within a ranking of 100 universities This association exists amongst the 100 presidents in total the female group and the 51 US presidents
The mean citation P-score for presidents in the 49 countries in the rest of the world is 391 with a median score of 107 This is below the 100-group mean P-score of 6 and it is half the US mean P-score of 8 Therefore US presidents are twice as cited as those in the rest of the world
In the rest of the world the presidents include 27 scientists 16 social scientists and 6 in the humanities There are 3 Highly Cited researchers in the group Two are from the Netherlands and one in Germany
Figure 8 shows there is no statistically significant correlation between citation levels and position of president across the 49 countries in the rest of the world
As can be seen in the data one of the differences between the top American universities and non-American universities is that the former choose leaders who are more highly cited
Outliers
It is important to ensure that the results from this study have not been unduly influenced by a small number of presidents with extremely high P-scores To do this two tests are available First we can return to Spearman s rho which puts an equal weight on each observation instead of assigning continuous values As has been pointed out above a statistically significant rank correlation has been established with a significance level better than 1
The second check on outliers is simply to delete the data used from the highest P-scores for the Pearson s test To do this the top 5 of P-scores all located within ranges 30 and 40 were withdrawn and the correlation re-tested with a result of 0297 With 95 observations the 5 critical value for a two-tailed test is 0200 and at 1 it is 0260 so the correlation remains
11
Possible interpretations
Data on world university rankings have only recently become available That universities with strongly research-intensive missions appoint as their presidents men and women with strong citation records does not appear to have been previously documented The data in this paper do not enable judgements to be made about the weight assigned by selection committees to the research records of presidential candidates as distinct for example from other criteria such as managerial expertise or entrepreneurship But the data do suggest that research universities look for candidates who fit institutional missions
Internationally active researchers lead the world s top universities On average the higher the university is in the global ranking the more highly cited is that institution s president There are of course exceptions Two universities from the Netherlands -- in positions 39 and 63 -- both have presidents who are Highly Cited (It is interesting to note that these are the only two universities in the top 100 from that country) And there are top universities led by presidents with few or no citations However these cases are in a minority
These findings show that in at least one area the top universities are making different choices from those lower in the global ranking What can we learn from this difference Why do those institutions at the top appoint former researchers to the role of president
There are a number of possible reasons for the correlation They include
Hypothesis 1 Better researchers make better leaders of research universities
It has been recognised in the literature that presidents need to learn particular skills to enable them to lead a university (Cohen and March 1974 Rosovsky 1991 Middlehurst 1993 Bargh et al 2000 among others) In the UK an organisation for training academic leaders has recently been established with government funding
Whilst the education and career background of academic leaders has attracted some interest (Cohen and March 1974 Taylor 1986 Bargh at al 2000 Dolton and Ma 2001) little specific attention has been given to the research background of presidents Yet many university websites make a great deal of the eminence of the president
It seems clear that better researchers will tend to have greater prestige within the hierarchy of the academy and presidents who are highly cited may therefore enjoy credibility and negotiating strength that extends beyond their own discipline Jeremy Knowles the former Dean of Harvard s Faculty of Arts and Sciences (from 1991 2002) said that he believed his own research record helped his position as dean because it gave him greater status and therefore negotiating power when dealing with eminent faculty (interview with author April 12 2005) This suggests that being a cited researcher is of symbolic importance
This message was repeated in an interview with Amy Gutmann President of the University of Pennsylvania who said that being a researcher sends a signal to the faculty that you the president share their scholarly values and general understanding of the culture of the academy (interview April 28 2005)
12
Being a successful research academic may also help in attracting faculty particularly stars to a university which has become a preoccupation the world over Having a president who is a distinguished researcher may enhance the appeal of an institution
Alternatively it may be that two separate components are involved when leading a research university namely managerial expertise and inherent knowledge The former pertains to having knowledge of generic functions such as finance and budgeting human resource management corporate governance among others Most presidents running top universities will have had experience in managerial positions -- running large laboratories as head of department or pro-vice chancellor Experienced managers can also be brought in to perform specialised administrative roles Thus a former UK university vice chancellor has suggested (in personal correspondence) that what matters is scholarship not just management -- that we should take management for granted
The term inherent knowledge is used here to suggest a specific knowledge of or insight into academe that is borne out of expertise gained through academic research It suggests that good researchers may bring something else to the role of leader -- a perspective and understanding directly linked to their past as a successful scholar
It is possible that inherent knowledge also helps leaders inform strategy-making For example it may be easier to interpret research trends and future intellectual directions But how easy is it for a highly cited chemist to assess a faculty member from information science or discern the future direction of modern languages One possibility is that faculty at the top of their fields can make a fair assessment about the quality of work produced by those in other fields by using the same mechanisms used generally in academia namely citation indices and peer review
Hypothesis 2 Top universities appoint good researchers for reasons relating to external factors such as PR and fundraising
It has been said that US presidents in top universities spend a great deal of time fundraising and subsequently that they are less involved with running the institution This is not the place to compare US presidential leadership with European rectors or British vice chancellors Briefly however the American system is unitary with the president at the head of the hierarchy Though the president reports to a powerful board of trustees he or she is ultimately in charge with a role similar to that of a chief executive officer Senior academic administrators in the US (deans provosts chairs of departments) are normally appointed not voted into position by faculty In short the US presidential system is recognised as giving greater authority and powers to university leaders when compared to other systems of higher education from Europe to Japan (Rosovsky 1991 Bargh et al 2000) This is particularly true of US private universities US publics on the other hand are more exposed to state government intervention
Amy Gutmann President of University of Pennsylvania was clear in an interview that she is centrally involved in making senior appointments and in deciding the overall strategic direction of the university Long term strategy is designed through a collaborative process involving the president and the deans and provosts that she appoints and whose work she oversees (April 28 2005)
13
Appointment committees may select high-profile academics as presidents for external reasons The alumni may be encouraged to give more generously Gaining greater media exposure for the institution may also be a motive Alternatively if the governing body of a university wants to push an institution in a different direction towards research it may consider appointing a good researcher to signal a change in the internal culture
Hypothesis 3 The correlation is explained through unobservable heterogeneity
This would mean that research talent is merely a proxy for leadership ability The positive relationship between presidents P-scores and university rank may actually be picking up a correlation between other variables For instance presidents who are good at research may just be good at everything This is the alternative to a cause-and-effect relationship
All correlations are potentially susceptible to this kind of criticism It seems implausible however that candidates research records do not play a part in their selection for headship of institutions with prominent research missions
Concluding comments
This study which seems to be the first of its kind finds a correlation between the citations of presidents and the positions of their universities in a world league table Better universities are run by better researchers
The statistical relationship is strong for the group of 100 universities as a whole and for the sub-samples of female presidents and US presidents On average one extra point on a president s adjusted citation score where scores run from zero for the least-cited president to a score of up to 40 for Highly Cited and Nobel-prize winning presidents is associated with ten extra places in the world s top-100 ranking of universities No statistically significant correlation is found however for the sub-sample of universities from the rest of the world
Simple quantitative research of this kind may offer insights into university leadership - insights that are particularly relevant to universities that want to compete for a position amongst the world s top research institutions The best universities which can choose from the widest pool are systematically selecting top researchers to lead them What do such researchers bring to the role of leader This paper posits that there are two central components involved in leading research universities managerial expertise and inherent knowledge It is suggested here that better researchers may have greater inherent knowledge about academe that in turn informs their role as leader A president s research background may also have symbolic value in that it sends out a signal about the values of that institution And finally being a reputed researcher may raise a leader s status within the academic community and enhance his or her powers of negotiation
However the paper notes that other interpretations of the data are possible One is that universities choose top researchers for reasons of prestige and to assist in fundraising This is probably true as a factor for selection though it is unlikely to be the sole function
14
of a president in a top institution Another is that research ability is simply a proxy for some other kind of talent that is useful to leaders
Causality cannot be established through these correlations The performance of a university has not been shown here to be linked to the actions of a president or vice chancellor whether highly cited or not However this type of study starts the process of understanding whether there may be benefits from appointing a researcher as president A further study is underway exploring causality
15
0
5
10
15
20
1 - 20 21 - 40 41 - 60 61 - 80 81 - 100
Figure 1 The cross-country distribution of the worlds top 100 universities
USA EuropeRest World
Num
ber
of u
nive
rsiti
es
University rank (1 is top)
0
5
10
15
20
25
0 - 20 21 - 40 41 - 60 61 - 80 81 - 100
Figure 2 The disciplines of the presidents of the worlds top universites
ScienceHumanitiesSocial science
Dis
cipl
ine
University rank
16
-1
0
1
2
3
4
5
05 1 15 2 25 3 35 4
Figure 3 The distribution of presidents lifetime citations follows Lotkas power law
Loga
rithm
of t
he n
umbe
r of
pre
side
nts
Logarithm of presidents P-scores
17
0
50
100
150
200
0-20 21-40 41-60 61-80 81-100
Figure 4 A cross-tabulation of presidents lifetime citation P-scores by world university rank
(in quintiles)
Pre
side
nts
P-s
core
University rank
18
-10
0
10
20
30
40
0 20 40 60 80 100
Figure 5 Presidents P-scores by rank among
the worlds top 100 universities
y = 11305 - 01047x R= 034479 P
resi
dent
s P
- sc
ore
University rank
-8
-6
-4
-2
0
2
4
0 20 40 60 80 100
Figure 5a Logarithm of presidents P-scores by university rank
y = 14413 - 0021876x R= 026413
Log
of p
resi
dent
s P
-sco
re
University rank
19
-5
0
5
10
15
20
0 20 40 60 80 100
Figure 6 Female presidents P-scores by university rank
y = 97036 - 012631x R= 069052
Pre
side
nts
P-s
core
University rank
-10
0
10
20
30
40
0 20 40 60 80 100
Figure 7 US presidents P-scores by university rank
y = 13492 - 013997x R= 037505
Pre
side
nts
P-s
core
University rank
20
-10
0
10
20
30
40
0 20 40 60 80 100
Figure 8 Presidents from the rest of the world P-scores by university rank
y = 61896 - 003646x R= 014019 P
resi
dent
s P
-sco
re
University rank
21
References
Bargh C Bocock J Scott P and Smith D (2000) University Leadership The Role of the Chief Executive Open University Press Buckingham
Bok D (2003) Universities in the Marketplace The commercialisation of Higher Education Princeton University Press New Jersey
Cohen MD and March JG (1974) Leadership and Ambiguity McGraw-Hill New York
Collison P and Millen J (1969) University chancellors vice chancellors and college principals A social profile Sociology Vol 3 No 1 pp 77-109
Cronin B Snyder H and Atkins H (1997) Comparative citation rankings of authors in monographic and journal literature a study of sociology Journal of Documentation Vol 53 No 3 pp 263-273
Dolton P and Ma A (2001) CEO Pay in the Public Sector The Case of Vice Chancellors in UK Universities Newcastle UK Working paper Newcastle University Discussion Papers in Economics
Fassoulaki A Paraskeva A Papilas K and Karabinis G (2000) Self-citations in six anaesthesia journals and their significance in determining the impact factor British Journal of Anaesthesia Vol 87 No 2 pp 266-269
Hamermesh DS (1994) Facts and Myths about Refereeing Journal of Economic Perspectives Vol 8 No 1 Winter pp 153-163
King DA (2004) The scientific impact of nations Nature Vol 430 pp 311-316
Lombardi JV Craig DD Capaldi ED and Gater DS (2002) The Top American Research Universities An Overview TheCenter Reports University of Florida Gainesville
Lombardi JV Craig DD Capaldi ED Reeves KR and Gater DS (2003) The Top American Research Universities TheCenter University of Florida Gainesville
Lotka AJ (1926) The Frequency Distribution of Scientific Productivity Journal of the Washington Academy of Sciences Vol 16 No12 pp 317-323
Middlehurst R (1993) Leading Academics Open University Press Buckingham
Moed HF (2002) The impact factors debate the ISI s uses and limits Nature Vol 415 pp 731-732
Norris M and Oppenheim C (2003) Citation counts and the Research Assessment Exercise V
Archaeology and the 2001 RAE Journal of Documentation Vol 59 No 6 pp 709-730
Oppenheim C (1995) The correlation between citation counts and the 1992 Research Assessment Exercise Ratings for British library and information science university departments Journal of Documentation Vol 51 pp 18-27
Oppenheim C (1997) The correlation between citation counts and the 1992 Research Assessment Exercise ratings for British research in genetics anatomy and archaeology Journal of Documentation Vol 53 No 5 pp 477-487
Potter W G (1988) Of Making Many Books There is No End Bibliometrics and Libraries The Journal of Academic Librarianship Vol14 pp 238a-238c
Rosovsky H (1991) The University An Owners Manual Norton New York
Seng LB amp Willett P (1995) The citedness of publications by United Kingdom library schools Journal of Information Science Vol 21 pp 68-71
Smith A and Eysenck M (2002) The correlation between RAE ratings and citation counts in psychology Working paper Department of Psychology Royal Holloway University of London
Taylor W (1986) Organisational Culture and Administrative Leadership in Universities In Leadership and Organisational Culture (eds Sergiovanni TJ and Corbally JE) pp125-141 Illini Books University of Illinois
Tierney W Corwin Z amp Colyar JE (Eds) (2004) Competing conceptions of governance Negotiating the perfect storm John Hopkins University Press Baltimore MD
22
van Leeuwen TN Moed HF Tijssen RJW Visser MS and Van Raan AFJ (2001)
Language biases in the coverage of the Science Citation Index and its consequences for international comparisons of national research performance Scientometrics Vol 51 No1 pp 335-346
van Raan AFJ (1998) Assessing the social sciences the use of advanced bibliometric methods as a necessary complement to peer review Research Evaluation Vol 7 pp 2-6
van Raan AFJ (2003) The use of bibliometric analysis in research performance assessment and monitoring of interdisciplinary scientific developments Technikfolgenabschatzung Vol 1 pp 20-29
van Raan AFJ (2005) Fatal Attraction Conceptual and methodological problems in the ranking of universities by bibliometric methods Scientometrics Vol 62 No 1 pp 133-143
Weingart P (2003) Evaluation of research performance the danger of numbers in Bibliometric analysis in science and research Applications Benefits and Limitations Second Conference of the Central Library Forschungszentrum Julich pp 7-19
Weingart P (2004) Impact of bibliometrics upon the science system inadvertent consequences in Handbook on Quantitative Science and Technology Research (eds Moed HF Glanzel W and Schmoch U) Kluwer Academic Publishers Dordrecht The Netherlands
Wouters PF (1999) The Citation Culture PhD Thesis University of Amsterdam The Netherlands
Interviews
Amy Gutmann President University of Pennsylvania -- interview at University of Pennsylvania April 28 2005
Jeremy Knowles Former Dean Faculty of Arts and Sciences Harvard -- interview at Harvard April12 2005
League tables
Academic Ranking of World Universities 2004 Institute of Higher Education Shanghai Jiao Tong University [httpedsjtueducnrankinghtm]
Top American Research Universities TheCenter [httpthecenterufledu]
Statistical packages
Paleontological Statistics Software Package for Education and Data Analysis Palaeontologia Electronica 4(1) 9pp [httppalaeo-electronicaorg2001_1pastissue1_01htm]
KaleidaGraph Synergy Software at [wwwsynergycom]
23
APPENDIX 1
Top 500 World Universities (1-100) 2004
World Rank
Institution Country Total Score
Score on
Alumni
Score
on Award
Score
on HiCi
Score on
NampS
Score on SCI
Score on Size
1 Harvard Univ USA 1000
986 1000
1000
1000
1000
606
2 Stanford Univ USA 772 412 722 961 752 723 681
3 Univ Cambridge UK 762 1000
934 566 585 702 732
4 Univ California - Berkeley USA 742 700 760 741 756 727 451
5 Massachusetts Inst Tech (MIT) USA 724 741 789 736 691 646 475
6 California Inst Tech USA 690 593 665 648 667 532 1000
7 Princeton Univ USA 636 610 768 654 521 468 673
8 Univ Oxford UK 614 644 591 531 553 652 590
9 Columbia Univ USA 612 778 588 573 516 683 370
10 Univ Chicago USA 605 722 819 553 466 541 327
11 Yale Univ USA 586 522 445 636 581 636 504
12 Cornell Univ USA 555 466 524 605 472 662 336
13 Univ California - San Diego USA 538 178 347 636 594 672 479
14 Tokyo Univ Japan 519 361 144 445 550 919 498
15 Univ Pennsylvania USA 518 356 351 612 446 726 340
16 Univ California - Los Angeles USA 516 274 328 605 481 799 248
17 Univ California - San Francisco USA 508 00 376 593 595 629 488
18 Univ Wisconsin - Madison USA 500 431 363 553 480 692 190
19 Univ Michigan - Ann Arbor USA 493 398 193 648 457 767 201
20 Univ Washington - Seattle USA 491 227 302 573 496 788 162
21 Kyoto Univ Japan 483 398 341 400 372 771 464
22 Johns Hopkins Univ USA 475 487 283 437 526 717 142
23 Imperial Coll London UK 464 209 381 462 394 658 445
24 Univ Toronto Canada 446 281 197 391 412 784 428
25 Univ Coll London UK 443 308 329 410 410 611 426
25 Univ Illinois - Urbana Champaign USA 433 417 374 462 360 582 178
24
27 Swiss Fed Inst Tech - Zurich Switzerland
432 403 370 391 432 471 415
28 Washington Univ - St Louis USA 431 251 266 419 468 562 449
29 Rockefeller Univ USA 402 227 598 315 436 271 386
30 Northwestern Univ USA 395 218 193 479 358 572 370
31 Duke Univ USA 389 209 00 486 468 627 362
32 New York Univ USA 387 339 250 437 393 509 191
33 Univ Minnesota - Twin Cities USA 383 361 00 539 359 696 128
34 Univ Colorado - Boulder USA 378 166 298 437 383 475 274
35 Univ California - Santa Barbara USA 370 00 285 454 414 440 362
36 Univ British Columbia Canada 363 209 193 360 316 595 349
36 Univ Texas Southwestern Med Center
USA 363 166 339 338 405 400 349
38 Vanderbilt Univ USA 351 126 302 371 238 502 417
39 Univ Utrecht Netherlands
349 308 214 315 299 581 221
40 Univ Texas - Austin USA 348 218 171 502 288 537 128
41 Univ Paris 06 France 339 357 239 231 247 567 326
42 Univ California - Davis USA 336 00 00 486 372 647 207
43 Pennsylvania State Univ - Univ Park
USA 335 141 00 502 377 587 142
44 Rutgers State Univ - New Brunswick
USA 334 154 204 381 361 482 195
45 Tech Univ Munich Germany 333 431 241 276 204 500 320
46 Karolinska Inst Stockholm Sweden 330 308 278 327 216 498 215
47 Univ Edinburgh UK 329 227 171 276 367 491 316
48 Univ Paris 11 France 325 333 342 214 213 468 312
48 Univ Pittsburgh - Pittsburgh USA 325 189 00 428 265 670 200
48 Univ Southern California USA 325 00 273 419 230 535 205
51 Univ Munich Germany 324 372 211 124 320 560 311
52 Univ Rochester USA 320 333 91 303 272 449 501
53 Australian Natl Univ Australia 319 178 129 410 314 436 307
54 Osaka Univ Japan 315 126 00 262 312 721 302
55 Univ California - Irvine USA 314 00 250 338 296 472 299
56 Univ North Carolina - Chapel Hill USA 312 126 00 381 345 605 203
57 Univ Maryland - Coll Park USA 311 259 00 400 332 540 174
25
57 Univ Zurich Switzerland
311 126 273 214 303 489 299
59 Univ Copenhagen Denmark 310 308 247 231 226 481 298
60 Univ Bristol UK 306 109 182 327 266 491 294
61 McGill Univ Canada 304 288 00 315 263 590 292
62 Carnegie Mellon Univ USA 303 189 302 327 174 388 340
63 Univ Leiden Netherlands
298 251 158 303 220 473 303
64 Univ Heidelberg Germany 297 109 277 231 221 497 285
65 Case Western Reserve Univ USA 296 372 118 231 222 461 406
66 Moscow State Univ Russia 295 515 349 00 81 585 283
67 Univ Florida USA 293 154 00 338 243 664 163
68 Univ Oslo Norway 292 259 341 195 172 421 280
69 Tohoku Univ Japan 288 189 00 195 261 693 277
69 Univ Sheffield UK 288 235 144 231 288 462 277
71 Purdue Univ - West Lafayette USA 287 189 171 315 221 505 138
72 Univ Helsinki Finland 286 189 182 151 237 569 275
73 Ohio State Univ - Columbus USA 285 178 00 410 206 613 96
74 Uppsala Univ Sweden 284 259 329 00 304 525 145
75 Rice Univ USA 283 218 223 262 237 302 446
76 Univ Arizona USA 281 00 00 315 377 565 181
77 Kings Coll London UK 280 166 235 231 198 462 269
78 Univ Manchester UK 279 259 193 214 182 486 268
79 Univ Goettingen Germany 274 388 204 175 182 428 263
80 Michigan State Univ USA 270 126 00 391 284 505 105
80 Univ Nottingham UK 270 154 204 231 201 451 259
82 Brown Univ USA 268 00 139 303 279 414 304
82 Univ Melbourne Australia 268 154 144 214 192 530 258
82 Univ Strasbourg 1 France 268 295 229 214 213 352 257
85 Ecole Normale Super Paris France 265 479 250 175 182 296 254
86 Boston Univ USA 263 154 00 327 296 515 96
86 Univ Vienna Austria 263 251 158 87 220 545 253
88 McMaster Univ Canada 260 166 193 231 162 452 250
26
88 Univ Freiburg Germany 260 251 214 195 180 409 250
90 Hebrew Univ Jerusalem Israel 259 154 00 262 295 483 249
91 Univ Basel Switzerland
258 259 175 214 242 355 248
92 Lund Univ Sweden 256 295 00 262 220 540 112
93 Univ Birmingham UK 255 251 112 247 140 476 245
93 Univ Roma - La Sapienza Italy 255 166 158 124 243 574 79
95 Humboldt Univ Berlin Germany 254 295 219 87 148 497 244
95 Univ Utah USA 254 00 00 327 307 484 201
97 Nagoya Univ Japan 252 00 144 151 237 553 242
97 Stockholm Univ Sweden 252 295 302 175 149 357 153
99 Tufts Univ USA 251 189 171 195 191 406 292
99 Univ Bonn Germany 251 199 204 175 167 439 241
Copyright copy 2004 Institute of Higher Education Shanghai Jiao Tong University All Rights Reserved
The methodology for the 2005 Global Ranking produced by SJTU has been slightly modified (see httpedsjtueducnrankinghtm)
27
APPENDIX 2
Citation thresholds for scientists across different disciplines
(January 1994 - June 2004)
Subject area Scientist Agricultural Sciences 154
Biology amp Biochemistry 780
Chemistry 648
Clinical Medicine 1095
Computer Science 84
Economics amp Business 169
Engineering 182
EnvironmentEcology 248
Geosciences 433
Humanities General 35
Immunology 763
Materials Science 219
Mathematics 130
Microbiology 534
Molecular Biology amp Genetics 1234
Multidisciplinary 123
Neuroscience amp Behaviour 908
Pharmacology amp Toxicology 312
Physics 1832
Plant amp Animal Science 292
PsychiatryPsychology 393
Social Sciences General 117
Space Science 1301 Updated Sept 1 2004 Thomson ISI Highly cited available from
httpin-citescomthresholds-citationhtml
Humanities score created by Amanda H Goodall
Note to Table The above citation thresholds represent the top 1 researchers (approximately 250) in each disciplinary field

15
0
5
10
15
20
1 - 20 21 - 40 41 - 60 61 - 80 81 - 100
Figure 1 The cross-country distribution of the worlds top 100 universities
USA EuropeRest World
Num
ber
of u
nive
rsiti
es
University rank (1 is top)
0
5
10
15
20
25
0 - 20 21 - 40 41 - 60 61 - 80 81 - 100
Figure 2 The disciplines of the presidents of the worlds top universites
ScienceHumanitiesSocial science
Dis
cipl
ine
University rank
16
-1
0
1
2
3
4
5
05 1 15 2 25 3 35 4
Figure 3 The distribution of presidents lifetime citations follows Lotkas power law
Loga
rithm
of t
he n
umbe
r of
pre
side
nts
Logarithm of presidents P-scores
17
0
50
100
150
200
0-20 21-40 41-60 61-80 81-100
Figure 4 A cross-tabulation of presidents lifetime citation P-scores by world university rank
(in quintiles)
Pre
side
nts
P-s
core
University rank
18
-10
0
10
20
30
40
0 20 40 60 80 100
Figure 5 Presidents P-scores by rank among
the worlds top 100 universities
y = 11305 - 01047x R= 034479 P
resi
dent
s P
- sc
ore
University rank
-8
-6
-4
-2
0
2
4
0 20 40 60 80 100
Figure 5a Logarithm of presidents P-scores by university rank
y = 14413 - 0021876x R= 026413
Log
of p
resi
dent
s P
-sco
re
University rank
19
-5
0
5
10
15
20
0 20 40 60 80 100
Figure 6 Female presidents P-scores by university rank
y = 97036 - 012631x R= 069052
Pre
side
nts
P-s
core
University rank
-10
0
10
20
30
40
0 20 40 60 80 100
Figure 7 US presidents P-scores by university rank
y = 13492 - 013997x R= 037505
Pre
side
nts
P-s
core
University rank
20
-10
0
10
20
30
40
0 20 40 60 80 100
Figure 8 Presidents from the rest of the world P-scores by university rank
y = 61896 - 003646x R= 014019 P
resi
dent
s P
-sco
re
University rank
21
References
Bargh C Bocock J Scott P and Smith D (2000) University Leadership The Role of the Chief Executive Open University Press Buckingham
Bok D (2003) Universities in the Marketplace The commercialisation of Higher Education Princeton University Press New Jersey
Cohen MD and March JG (1974) Leadership and Ambiguity McGraw-Hill New York
Collison P and Millen J (1969) University chancellors vice chancellors and college principals A social profile Sociology Vol 3 No 1 pp 77-109
Cronin B Snyder H and Atkins H (1997) Comparative citation rankings of authors in monographic and journal literature a study of sociology Journal of Documentation Vol 53 No 3 pp 263-273
Dolton P and Ma A (2001) CEO Pay in the Public Sector The Case of Vice Chancellors in UK Universities Newcastle UK Working paper Newcastle University Discussion Papers in Economics
Fassoulaki A Paraskeva A Papilas K and Karabinis G (2000) Self-citations in six anaesthesia journals and their significance in determining the impact factor British Journal of Anaesthesia Vol 87 No 2 pp 266-269
Hamermesh DS (1994) Facts and Myths about Refereeing Journal of Economic Perspectives Vol 8 No 1 Winter pp 153-163
King DA (2004) The scientific impact of nations Nature Vol 430 pp 311-316
Lombardi JV Craig DD Capaldi ED and Gater DS (2002) The Top American Research Universities An Overview TheCenter Reports University of Florida Gainesville
Lombardi JV Craig DD Capaldi ED Reeves KR and Gater DS (2003) The Top American Research Universities TheCenter University of Florida Gainesville
Lotka AJ (1926) The Frequency Distribution of Scientific Productivity Journal of the Washington Academy of Sciences Vol 16 No12 pp 317-323
Middlehurst R (1993) Leading Academics Open University Press Buckingham
Moed HF (2002) The impact factors debate the ISI s uses and limits Nature Vol 415 pp 731-732
Norris M and Oppenheim C (2003) Citation counts and the Research Assessment Exercise V
Archaeology and the 2001 RAE Journal of Documentation Vol 59 No 6 pp 709-730
Oppenheim C (1995) The correlation between citation counts and the 1992 Research Assessment Exercise Ratings for British library and information science university departments Journal of Documentation Vol 51 pp 18-27
Oppenheim C (1997) The correlation between citation counts and the 1992 Research Assessment Exercise ratings for British research in genetics anatomy and archaeology Journal of Documentation Vol 53 No 5 pp 477-487
Potter W G (1988) Of Making Many Books There is No End Bibliometrics and Libraries The Journal of Academic Librarianship Vol14 pp 238a-238c
Rosovsky H (1991) The University An Owners Manual Norton New York
Seng LB amp Willett P (1995) The citedness of publications by United Kingdom library schools Journal of Information Science Vol 21 pp 68-71
Smith A and Eysenck M (2002) The correlation between RAE ratings and citation counts in psychology Working paper Department of Psychology Royal Holloway University of London
Taylor W (1986) Organisational Culture and Administrative Leadership in Universities In Leadership and Organisational Culture (eds Sergiovanni TJ and Corbally JE) pp125-141 Illini Books University of Illinois
Tierney W Corwin Z amp Colyar JE (Eds) (2004) Competing conceptions of governance Negotiating the perfect storm John Hopkins University Press Baltimore MD
22
van Leeuwen TN Moed HF Tijssen RJW Visser MS and Van Raan AFJ (2001)
Language biases in the coverage of the Science Citation Index and its consequences for international comparisons of national research performance Scientometrics Vol 51 No1 pp 335-346
van Raan AFJ (1998) Assessing the social sciences the use of advanced bibliometric methods as a necessary complement to peer review Research Evaluation Vol 7 pp 2-6
van Raan AFJ (2003) The use of bibliometric analysis in research performance assessment and monitoring of interdisciplinary scientific developments Technikfolgenabschatzung Vol 1 pp 20-29
van Raan AFJ (2005) Fatal Attraction Conceptual and methodological problems in the ranking of universities by bibliometric methods Scientometrics Vol 62 No 1 pp 133-143
Weingart P (2003) Evaluation of research performance the danger of numbers in Bibliometric analysis in science and research Applications Benefits and Limitations Second Conference of the Central Library Forschungszentrum Julich pp 7-19
Weingart P (2004) Impact of bibliometrics upon the science system inadvertent consequences in Handbook on Quantitative Science and Technology Research (eds Moed HF Glanzel W and Schmoch U) Kluwer Academic Publishers Dordrecht The Netherlands
Wouters PF (1999) The Citation Culture PhD Thesis University of Amsterdam The Netherlands
Interviews
Amy Gutmann President University of Pennsylvania -- interview at University of Pennsylvania April 28 2005
Jeremy Knowles Former Dean Faculty of Arts and Sciences Harvard -- interview at Harvard April12 2005
League tables
Academic Ranking of World Universities 2004 Institute of Higher Education Shanghai Jiao Tong University [httpedsjtueducnrankinghtm]
Top American Research Universities TheCenter [httpthecenterufledu]
Statistical packages
Paleontological Statistics Software Package for Education and Data Analysis Palaeontologia Electronica 4(1) 9pp [httppalaeo-electronicaorg2001_1pastissue1_01htm]
KaleidaGraph Synergy Software at [wwwsynergycom]
23
APPENDIX 1
Top 500 World Universities (1-100) 2004
World Rank
Institution Country Total Score
Score on
Alumni
Score
on Award
Score
on HiCi
Score on
NampS
Score on SCI
Score on Size
1 Harvard Univ USA 1000
986 1000
1000
1000
1000
606
2 Stanford Univ USA 772 412 722 961 752 723 681
3 Univ Cambridge UK 762 1000
934 566 585 702 732
4 Univ California - Berkeley USA 742 700 760 741 756 727 451
5 Massachusetts Inst Tech (MIT) USA 724 741 789 736 691 646 475
6 California Inst Tech USA 690 593 665 648 667 532 1000
7 Princeton Univ USA 636 610 768 654 521 468 673
8 Univ Oxford UK 614 644 591 531 553 652 590
9 Columbia Univ USA 612 778 588 573 516 683 370
10 Univ Chicago USA 605 722 819 553 466 541 327
11 Yale Univ USA 586 522 445 636 581 636 504
12 Cornell Univ USA 555 466 524 605 472 662 336
13 Univ California - San Diego USA 538 178 347 636 594 672 479
14 Tokyo Univ Japan 519 361 144 445 550 919 498
15 Univ Pennsylvania USA 518 356 351 612 446 726 340
16 Univ California - Los Angeles USA 516 274 328 605 481 799 248
17 Univ California - San Francisco USA 508 00 376 593 595 629 488
18 Univ Wisconsin - Madison USA 500 431 363 553 480 692 190
19 Univ Michigan - Ann Arbor USA 493 398 193 648 457 767 201
20 Univ Washington - Seattle USA 491 227 302 573 496 788 162
21 Kyoto Univ Japan 483 398 341 400 372 771 464
22 Johns Hopkins Univ USA 475 487 283 437 526 717 142
23 Imperial Coll London UK 464 209 381 462 394 658 445
24 Univ Toronto Canada 446 281 197 391 412 784 428
25 Univ Coll London UK 443 308 329 410 410 611 426
25 Univ Illinois - Urbana Champaign USA 433 417 374 462 360 582 178
24
27 Swiss Fed Inst Tech - Zurich Switzerland
432 403 370 391 432 471 415
28 Washington Univ - St Louis USA 431 251 266 419 468 562 449
29 Rockefeller Univ USA 402 227 598 315 436 271 386
30 Northwestern Univ USA 395 218 193 479 358 572 370
31 Duke Univ USA 389 209 00 486 468 627 362
32 New York Univ USA 387 339 250 437 393 509 191
33 Univ Minnesota - Twin Cities USA 383 361 00 539 359 696 128
34 Univ Colorado - Boulder USA 378 166 298 437 383 475 274
35 Univ California - Santa Barbara USA 370 00 285 454 414 440 362
36 Univ British Columbia Canada 363 209 193 360 316 595 349
36 Univ Texas Southwestern Med Center
USA 363 166 339 338 405 400 349
38 Vanderbilt Univ USA 351 126 302 371 238 502 417
39 Univ Utrecht Netherlands
349 308 214 315 299 581 221
40 Univ Texas - Austin USA 348 218 171 502 288 537 128
41 Univ Paris 06 France 339 357 239 231 247 567 326
42 Univ California - Davis USA 336 00 00 486 372 647 207
43 Pennsylvania State Univ - Univ Park
USA 335 141 00 502 377 587 142
44 Rutgers State Univ - New Brunswick
USA 334 154 204 381 361 482 195
45 Tech Univ Munich Germany 333 431 241 276 204 500 320
46 Karolinska Inst Stockholm Sweden 330 308 278 327 216 498 215
47 Univ Edinburgh UK 329 227 171 276 367 491 316
48 Univ Paris 11 France 325 333 342 214 213 468 312
48 Univ Pittsburgh - Pittsburgh USA 325 189 00 428 265 670 200
48 Univ Southern California USA 325 00 273 419 230 535 205
51 Univ Munich Germany 324 372 211 124 320 560 311
52 Univ Rochester USA 320 333 91 303 272 449 501
53 Australian Natl Univ Australia 319 178 129 410 314 436 307
54 Osaka Univ Japan 315 126 00 262 312 721 302
55 Univ California - Irvine USA 314 00 250 338 296 472 299
56 Univ North Carolina - Chapel Hill USA 312 126 00 381 345 605 203
57 Univ Maryland - Coll Park USA 311 259 00 400 332 540 174
25
57 Univ Zurich Switzerland
311 126 273 214 303 489 299
59 Univ Copenhagen Denmark 310 308 247 231 226 481 298
60 Univ Bristol UK 306 109 182 327 266 491 294
61 McGill Univ Canada 304 288 00 315 263 590 292
62 Carnegie Mellon Univ USA 303 189 302 327 174 388 340
63 Univ Leiden Netherlands
298 251 158 303 220 473 303
64 Univ Heidelberg Germany 297 109 277 231 221 497 285
65 Case Western Reserve Univ USA 296 372 118 231 222 461 406
66 Moscow State Univ Russia 295 515 349 00 81 585 283
67 Univ Florida USA 293 154 00 338 243 664 163
68 Univ Oslo Norway 292 259 341 195 172 421 280
69 Tohoku Univ Japan 288 189 00 195 261 693 277
69 Univ Sheffield UK 288 235 144 231 288 462 277
71 Purdue Univ - West Lafayette USA 287 189 171 315 221 505 138
72 Univ Helsinki Finland 286 189 182 151 237 569 275
73 Ohio State Univ - Columbus USA 285 178 00 410 206 613 96
74 Uppsala Univ Sweden 284 259 329 00 304 525 145
75 Rice Univ USA 283 218 223 262 237 302 446
76 Univ Arizona USA 281 00 00 315 377 565 181
77 Kings Coll London UK 280 166 235 231 198 462 269
78 Univ Manchester UK 279 259 193 214 182 486 268
79 Univ Goettingen Germany 274 388 204 175 182 428 263
80 Michigan State Univ USA 270 126 00 391 284 505 105
80 Univ Nottingham UK 270 154 204 231 201 451 259
82 Brown Univ USA 268 00 139 303 279 414 304
82 Univ Melbourne Australia 268 154 144 214 192 530 258
82 Univ Strasbourg 1 France 268 295 229 214 213 352 257
85 Ecole Normale Super Paris France 265 479 250 175 182 296 254
86 Boston Univ USA 263 154 00 327 296 515 96
86 Univ Vienna Austria 263 251 158 87 220 545 253
88 McMaster Univ Canada 260 166 193 231 162 452 250
26
88 Univ Freiburg Germany 260 251 214 195 180 409 250
90 Hebrew Univ Jerusalem Israel 259 154 00 262 295 483 249
91 Univ Basel Switzerland
258 259 175 214 242 355 248
92 Lund Univ Sweden 256 295 00 262 220 540 112
93 Univ Birmingham UK 255 251 112 247 140 476 245
93 Univ Roma - La Sapienza Italy 255 166 158 124 243 574 79
95 Humboldt Univ Berlin Germany 254 295 219 87 148 497 244
95 Univ Utah USA 254 00 00 327 307 484 201
97 Nagoya Univ Japan 252 00 144 151 237 553 242
97 Stockholm Univ Sweden 252 295 302 175 149 357 153
99 Tufts Univ USA 251 189 171 195 191 406 292
99 Univ Bonn Germany 251 199 204 175 167 439 241
Copyright copy 2004 Institute of Higher Education Shanghai Jiao Tong University All Rights Reserved
The methodology for the 2005 Global Ranking produced by SJTU has been slightly modified (see httpedsjtueducnrankinghtm)
27
APPENDIX 2
Citation thresholds for scientists across different disciplines
(January 1994 - June 2004)
Subject area Scientist Agricultural Sciences 154
Biology amp Biochemistry 780
Chemistry 648
Clinical Medicine 1095
Computer Science 84
Economics amp Business 169
Engineering 182
EnvironmentEcology 248
Geosciences 433
Humanities General 35
Immunology 763
Materials Science 219
Mathematics 130
Microbiology 534
Molecular Biology amp Genetics 1234
Multidisciplinary 123
Neuroscience amp Behaviour 908
Pharmacology amp Toxicology 312
Physics 1832
Plant amp Animal Science 292
PsychiatryPsychology 393
Social Sciences General 117
Space Science 1301 Updated Sept 1 2004 Thomson ISI Highly cited available from
httpin-citescomthresholds-citationhtml
Humanities score created by Amanda H Goodall
Note to Table The above citation thresholds represent the top 1 researchers (approximately 250) in each disciplinary field
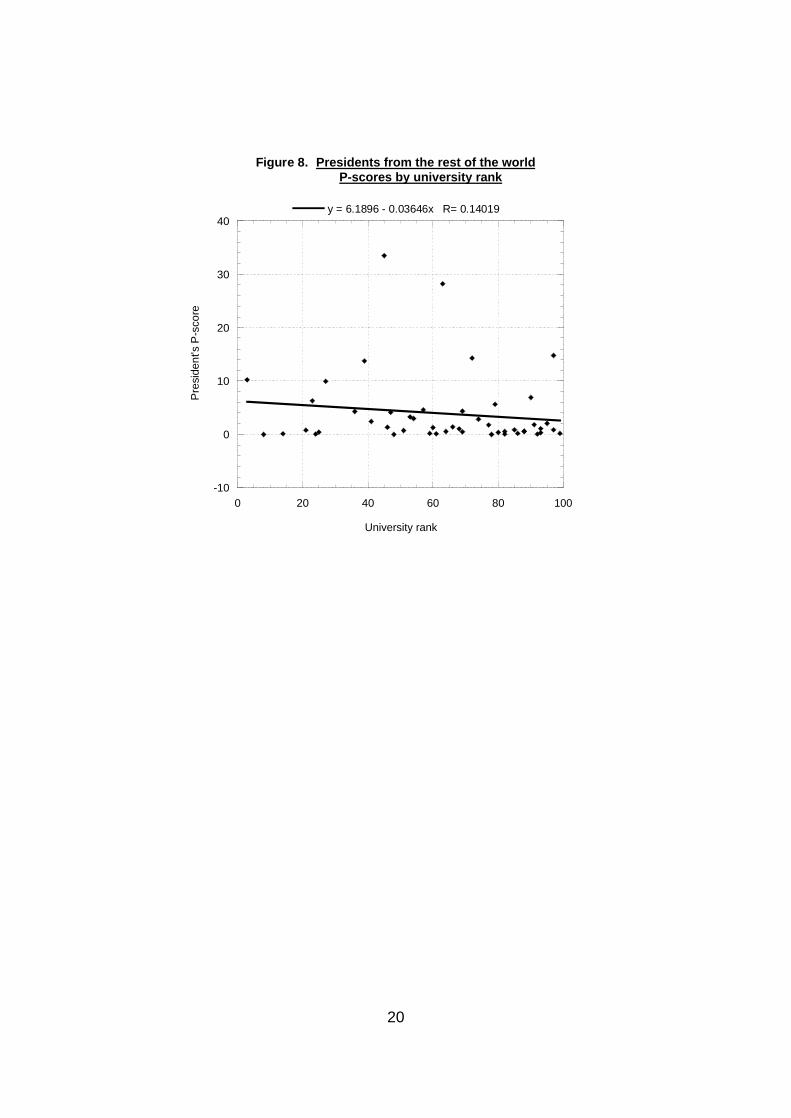
20
-10
0
10
20
30
40
0 20 40 60 80 100
Figure 8 Presidents from the rest of the world P-scores by university rank
y = 61896 - 003646x R= 014019 P
resi
dent
s P
-sco
re
University rank
21
References
Bargh C Bocock J Scott P and Smith D (2000) University Leadership The Role of the Chief Executive Open University Press Buckingham
Bok D (2003) Universities in the Marketplace The commercialisation of Higher Education Princeton University Press New Jersey
Cohen MD and March JG (1974) Leadership and Ambiguity McGraw-Hill New York
Collison P and Millen J (1969) University chancellors vice chancellors and college principals A social profile Sociology Vol 3 No 1 pp 77-109
Cronin B Snyder H and Atkins H (1997) Comparative citation rankings of authors in monographic and journal literature a study of sociology Journal of Documentation Vol 53 No 3 pp 263-273
Dolton P and Ma A (2001) CEO Pay in the Public Sector The Case of Vice Chancellors in UK Universities Newcastle UK Working paper Newcastle University Discussion Papers in Economics
Fassoulaki A Paraskeva A Papilas K and Karabinis G (2000) Self-citations in six anaesthesia journals and their significance in determining the impact factor British Journal of Anaesthesia Vol 87 No 2 pp 266-269
Hamermesh DS (1994) Facts and Myths about Refereeing Journal of Economic Perspectives Vol 8 No 1 Winter pp 153-163
King DA (2004) The scientific impact of nations Nature Vol 430 pp 311-316
Lombardi JV Craig DD Capaldi ED and Gater DS (2002) The Top American Research Universities An Overview TheCenter Reports University of Florida Gainesville
Lombardi JV Craig DD Capaldi ED Reeves KR and Gater DS (2003) The Top American Research Universities TheCenter University of Florida Gainesville
Lotka AJ (1926) The Frequency Distribution of Scientific Productivity Journal of the Washington Academy of Sciences Vol 16 No12 pp 317-323
Middlehurst R (1993) Leading Academics Open University Press Buckingham
Moed HF (2002) The impact factors debate the ISI s uses and limits Nature Vol 415 pp 731-732
Norris M and Oppenheim C (2003) Citation counts and the Research Assessment Exercise V
Archaeology and the 2001 RAE Journal of Documentation Vol 59 No 6 pp 709-730
Oppenheim C (1995) The correlation between citation counts and the 1992 Research Assessment Exercise Ratings for British library and information science university departments Journal of Documentation Vol 51 pp 18-27
Oppenheim C (1997) The correlation between citation counts and the 1992 Research Assessment Exercise ratings for British research in genetics anatomy and archaeology Journal of Documentation Vol 53 No 5 pp 477-487
Potter W G (1988) Of Making Many Books There is No End Bibliometrics and Libraries The Journal of Academic Librarianship Vol14 pp 238a-238c
Rosovsky H (1991) The University An Owners Manual Norton New York
Seng LB amp Willett P (1995) The citedness of publications by United Kingdom library schools Journal of Information Science Vol 21 pp 68-71
Smith A and Eysenck M (2002) The correlation between RAE ratings and citation counts in psychology Working paper Department of Psychology Royal Holloway University of London
Taylor W (1986) Organisational Culture and Administrative Leadership in Universities In Leadership and Organisational Culture (eds Sergiovanni TJ and Corbally JE) pp125-141 Illini Books University of Illinois
Tierney W Corwin Z amp Colyar JE (Eds) (2004) Competing conceptions of governance Negotiating the perfect storm John Hopkins University Press Baltimore MD
22
van Leeuwen TN Moed HF Tijssen RJW Visser MS and Van Raan AFJ (2001)
Language biases in the coverage of the Science Citation Index and its consequences for international comparisons of national research performance Scientometrics Vol 51 No1 pp 335-346
van Raan AFJ (1998) Assessing the social sciences the use of advanced bibliometric methods as a necessary complement to peer review Research Evaluation Vol 7 pp 2-6
van Raan AFJ (2003) The use of bibliometric analysis in research performance assessment and monitoring of interdisciplinary scientific developments Technikfolgenabschatzung Vol 1 pp 20-29
van Raan AFJ (2005) Fatal Attraction Conceptual and methodological problems in the ranking of universities by bibliometric methods Scientometrics Vol 62 No 1 pp 133-143
Weingart P (2003) Evaluation of research performance the danger of numbers in Bibliometric analysis in science and research Applications Benefits and Limitations Second Conference of the Central Library Forschungszentrum Julich pp 7-19
Weingart P (2004) Impact of bibliometrics upon the science system inadvertent consequences in Handbook on Quantitative Science and Technology Research (eds Moed HF Glanzel W and Schmoch U) Kluwer Academic Publishers Dordrecht The Netherlands
Wouters PF (1999) The Citation Culture PhD Thesis University of Amsterdam The Netherlands
Interviews
Amy Gutmann President University of Pennsylvania -- interview at University of Pennsylvania April 28 2005
Jeremy Knowles Former Dean Faculty of Arts and Sciences Harvard -- interview at Harvard April12 2005
League tables
Academic Ranking of World Universities 2004 Institute of Higher Education Shanghai Jiao Tong University [httpedsjtueducnrankinghtm]
Top American Research Universities TheCenter [httpthecenterufledu]
Statistical packages
Paleontological Statistics Software Package for Education and Data Analysis Palaeontologia Electronica 4(1) 9pp [httppalaeo-electronicaorg2001_1pastissue1_01htm]
KaleidaGraph Synergy Software at [wwwsynergycom]
23
APPENDIX 1
Top 500 World Universities (1-100) 2004
World Rank
Institution Country Total Score
Score on
Alumni
Score
on Award
Score
on HiCi
Score on
NampS
Score on SCI
Score on Size
1 Harvard Univ USA 1000
986 1000
1000
1000
1000
606
2 Stanford Univ USA 772 412 722 961 752 723 681
3 Univ Cambridge UK 762 1000
934 566 585 702 732
4 Univ California - Berkeley USA 742 700 760 741 756 727 451
5 Massachusetts Inst Tech (MIT) USA 724 741 789 736 691 646 475
6 California Inst Tech USA 690 593 665 648 667 532 1000
7 Princeton Univ USA 636 610 768 654 521 468 673
8 Univ Oxford UK 614 644 591 531 553 652 590
9 Columbia Univ USA 612 778 588 573 516 683 370
10 Univ Chicago USA 605 722 819 553 466 541 327
11 Yale Univ USA 586 522 445 636 581 636 504
12 Cornell Univ USA 555 466 524 605 472 662 336
13 Univ California - San Diego USA 538 178 347 636 594 672 479
14 Tokyo Univ Japan 519 361 144 445 550 919 498
15 Univ Pennsylvania USA 518 356 351 612 446 726 340
16 Univ California - Los Angeles USA 516 274 328 605 481 799 248
17 Univ California - San Francisco USA 508 00 376 593 595 629 488
18 Univ Wisconsin - Madison USA 500 431 363 553 480 692 190
19 Univ Michigan - Ann Arbor USA 493 398 193 648 457 767 201
20 Univ Washington - Seattle USA 491 227 302 573 496 788 162
21 Kyoto Univ Japan 483 398 341 400 372 771 464
22 Johns Hopkins Univ USA 475 487 283 437 526 717 142
23 Imperial Coll London UK 464 209 381 462 394 658 445
24 Univ Toronto Canada 446 281 197 391 412 784 428
25 Univ Coll London UK 443 308 329 410 410 611 426
25 Univ Illinois - Urbana Champaign USA 433 417 374 462 360 582 178
24
27 Swiss Fed Inst Tech - Zurich Switzerland
432 403 370 391 432 471 415
28 Washington Univ - St Louis USA 431 251 266 419 468 562 449
29 Rockefeller Univ USA 402 227 598 315 436 271 386
30 Northwestern Univ USA 395 218 193 479 358 572 370
31 Duke Univ USA 389 209 00 486 468 627 362
32 New York Univ USA 387 339 250 437 393 509 191
33 Univ Minnesota - Twin Cities USA 383 361 00 539 359 696 128
34 Univ Colorado - Boulder USA 378 166 298 437 383 475 274
35 Univ California - Santa Barbara USA 370 00 285 454 414 440 362
36 Univ British Columbia Canada 363 209 193 360 316 595 349
36 Univ Texas Southwestern Med Center
USA 363 166 339 338 405 400 349
38 Vanderbilt Univ USA 351 126 302 371 238 502 417
39 Univ Utrecht Netherlands
349 308 214 315 299 581 221
40 Univ Texas - Austin USA 348 218 171 502 288 537 128
41 Univ Paris 06 France 339 357 239 231 247 567 326
42 Univ California - Davis USA 336 00 00 486 372 647 207
43 Pennsylvania State Univ - Univ Park
USA 335 141 00 502 377 587 142
44 Rutgers State Univ - New Brunswick
USA 334 154 204 381 361 482 195
45 Tech Univ Munich Germany 333 431 241 276 204 500 320
46 Karolinska Inst Stockholm Sweden 330 308 278 327 216 498 215
47 Univ Edinburgh UK 329 227 171 276 367 491 316
48 Univ Paris 11 France 325 333 342 214 213 468 312
48 Univ Pittsburgh - Pittsburgh USA 325 189 00 428 265 670 200
48 Univ Southern California USA 325 00 273 419 230 535 205
51 Univ Munich Germany 324 372 211 124 320 560 311
52 Univ Rochester USA 320 333 91 303 272 449 501
53 Australian Natl Univ Australia 319 178 129 410 314 436 307
54 Osaka Univ Japan 315 126 00 262 312 721 302
55 Univ California - Irvine USA 314 00 250 338 296 472 299
56 Univ North Carolina - Chapel Hill USA 312 126 00 381 345 605 203
57 Univ Maryland - Coll Park USA 311 259 00 400 332 540 174
25
57 Univ Zurich Switzerland
311 126 273 214 303 489 299
59 Univ Copenhagen Denmark 310 308 247 231 226 481 298
60 Univ Bristol UK 306 109 182 327 266 491 294
61 McGill Univ Canada 304 288 00 315 263 590 292
62 Carnegie Mellon Univ USA 303 189 302 327 174 388 340
63 Univ Leiden Netherlands
298 251 158 303 220 473 303
64 Univ Heidelberg Germany 297 109 277 231 221 497 285
65 Case Western Reserve Univ USA 296 372 118 231 222 461 406
66 Moscow State Univ Russia 295 515 349 00 81 585 283
67 Univ Florida USA 293 154 00 338 243 664 163
68 Univ Oslo Norway 292 259 341 195 172 421 280
69 Tohoku Univ Japan 288 189 00 195 261 693 277
69 Univ Sheffield UK 288 235 144 231 288 462 277
71 Purdue Univ - West Lafayette USA 287 189 171 315 221 505 138
72 Univ Helsinki Finland 286 189 182 151 237 569 275
73 Ohio State Univ - Columbus USA 285 178 00 410 206 613 96
74 Uppsala Univ Sweden 284 259 329 00 304 525 145
75 Rice Univ USA 283 218 223 262 237 302 446
76 Univ Arizona USA 281 00 00 315 377 565 181
77 Kings Coll London UK 280 166 235 231 198 462 269
78 Univ Manchester UK 279 259 193 214 182 486 268
79 Univ Goettingen Germany 274 388 204 175 182 428 263
80 Michigan State Univ USA 270 126 00 391 284 505 105
80 Univ Nottingham UK 270 154 204 231 201 451 259
82 Brown Univ USA 268 00 139 303 279 414 304
82 Univ Melbourne Australia 268 154 144 214 192 530 258
82 Univ Strasbourg 1 France 268 295 229 214 213 352 257
85 Ecole Normale Super Paris France 265 479 250 175 182 296 254
86 Boston Univ USA 263 154 00 327 296 515 96
86 Univ Vienna Austria 263 251 158 87 220 545 253
88 McMaster Univ Canada 260 166 193 231 162 452 250
26
88 Univ Freiburg Germany 260 251 214 195 180 409 250
90 Hebrew Univ Jerusalem Israel 259 154 00 262 295 483 249
91 Univ Basel Switzerland
258 259 175 214 242 355 248
92 Lund Univ Sweden 256 295 00 262 220 540 112
93 Univ Birmingham UK 255 251 112 247 140 476 245
93 Univ Roma - La Sapienza Italy 255 166 158 124 243 574 79
95 Humboldt Univ Berlin Germany 254 295 219 87 148 497 244
95 Univ Utah USA 254 00 00 327 307 484 201
97 Nagoya Univ Japan 252 00 144 151 237 553 242
97 Stockholm Univ Sweden 252 295 302 175 149 357 153
99 Tufts Univ USA 251 189 171 195 191 406 292
99 Univ Bonn Germany 251 199 204 175 167 439 241
Copyright copy 2004 Institute of Higher Education Shanghai Jiao Tong University All Rights Reserved
The methodology for the 2005 Global Ranking produced by SJTU has been slightly modified (see httpedsjtueducnrankinghtm)
27
APPENDIX 2
Citation thresholds for scientists across different disciplines
(January 1994 - June 2004)
Subject area Scientist Agricultural Sciences 154
Biology amp Biochemistry 780
Chemistry 648
Clinical Medicine 1095
Computer Science 84
Economics amp Business 169
Engineering 182
EnvironmentEcology 248
Geosciences 433
Humanities General 35
Immunology 763
Materials Science 219
Mathematics 130
Microbiology 534
Molecular Biology amp Genetics 1234
Multidisciplinary 123
Neuroscience amp Behaviour 908
Pharmacology amp Toxicology 312
Physics 1832
Plant amp Animal Science 292
PsychiatryPsychology 393
Social Sciences General 117
Space Science 1301 Updated Sept 1 2004 Thomson ISI Highly cited available from
httpin-citescomthresholds-citationhtml
Humanities score created by Amanda H Goodall
Note to Table The above citation thresholds represent the top 1 researchers (approximately 250) in each disciplinary field
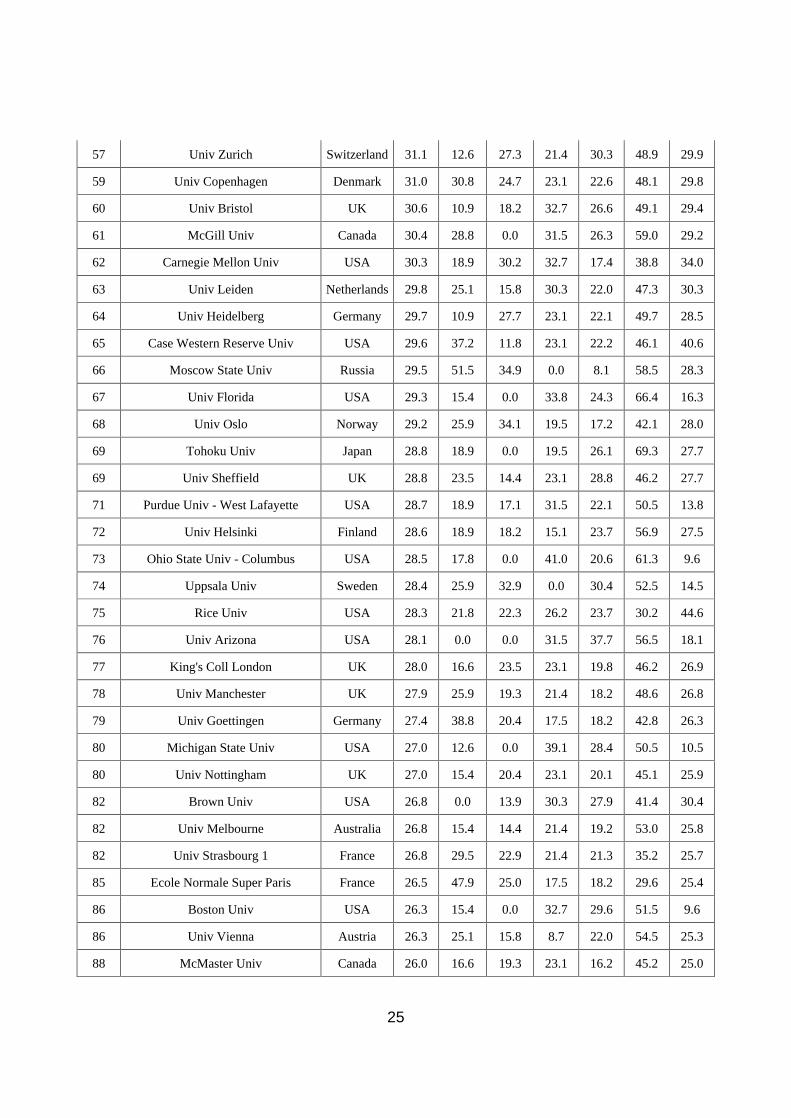