show me the right numbers! - usenix.org our users happy? show me the right numbers! perry statham...
TRANSCRIPT
Are our users happy?Show me the RIGHT numbers!
Perry Statham and Niclas Wretström

Busy Dashboard
2

Busy Dashboard #2
3

Outside-In SRE
4
§ As Reliability Engineers, we should develop and operate our services always with the user’s perspective in mind – from the outside-in.
§ We should engineer our services to help our users reliably achieve their goals with the best possible experience.

Service Levels
§ Service Level: how well we are able to help our users achieve their goals– In other words, how satisfied – or happy – we can make our users.
§ Service Level Indicators (SLI): “a carefully defined quantitative measure of some aspect of the level of service that is provided”
§ Service Level Objectives (SLO): “a target value or range of values for a service level that is measured by an SLI”
§ Service Level Agreements (SLA): “an explicit or implicit contract with your users that includes consequences of meeting (or missing) the SLOs they contain”
5
Outside-In Tools
§ Persona: A model of a user or other kind of stakeholder– Includes the user’s skills, roles, goals, and authority– Often includes personal attributes such as age, sex, and culture.– Often given proper names
§ Scenario: The steps performed to achieve a goal– Often told as stories
6
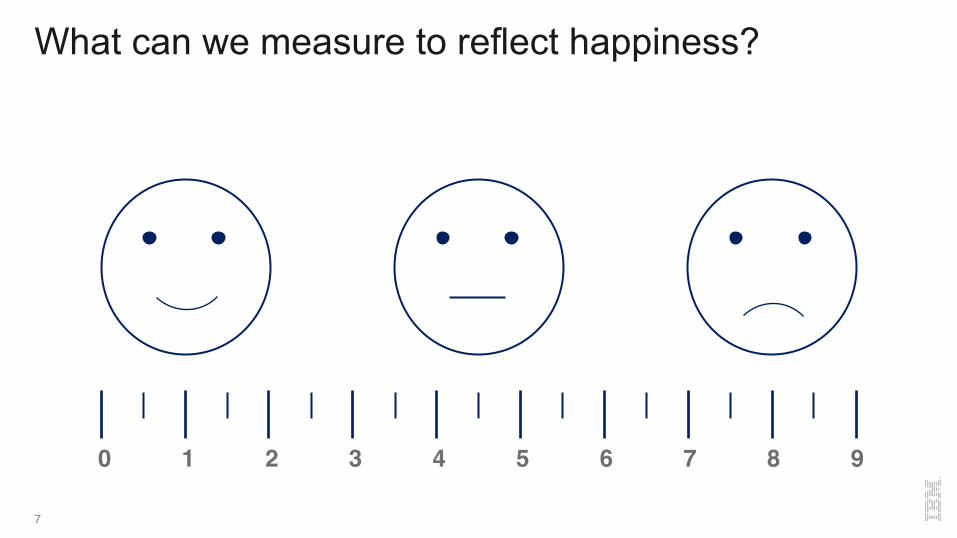
What can we measure to reflect happiness?
7
0 1 2 3 4 5 6 7 8 9

Metric: Time
§ How responsive is the user interface?– Does it feel snappy?– Are we showing a lot of system busy icons?
§ How quickly do our users achieve their goals?– Do back-end transactions complete quickly?– Are there too many steps?– Is there too much time between steps?
8

Metric: Scenario Divergence
§ How much has the user diverged from an expected scenario? – Have they started down a scenario path, then given up?– Have they done a lot of extra interactions to achieve their goal?
§ Interacting with help§ Consecutively clicking the same button or field more than once
9

How do we know if our users are happy?
10
We Can Infer from Interaction
§ Are they getting warnings or errors?– Bad password– Wrong input– Too many transactions
§ Are they repeating the same interactions with the same inputs?– Submitting a form more than once
§ Are they following the interaction scenarios that we expect?
11

We Can Look for Anomalies in the SLIs
§ Automated algorithms such as:– Percentiles and other quantiles– Seasonal-Trend Decomposition Procedure Based on Loess (STL)– Autoregressive Integrated Moving Average (ARIMA)– Decision Tree Learning
§ Classification and Regression Trees (CART)§ Conditional Inference Trees (CIT)§ …
– Many more…
12
We Can Ask Our Users
§ Passive buttons for thumbs up/down, like/dislike, happy/sad, 1-N stars, etc. § Interactively
– during interaction: 'How is your experience?’– post interaction: 'How was your experience?’
§ Semi-interactively– Like/Dislike tooltip that shows on screen refresh, then fades out:
§ "Having a good experience? Let us know by clicking the like button."§ Surveys such as Net Promoter Score (NPS)
– NPS: "How likely is it that you would recommend [brand] to a friend or colleague?"
13

We Can Ask a Representative
§ Anyone that regularly interacts with our users:– Product Managers, Sales People, Support People, User Experience Designers, etc.
§ While all can give us a sense of our users satisfaction:– The sample period can be quite long (such as a release cycle)– Can be difficult to filter out biases
14
We Can Ask Social Media
§ Automatically analyze social media such as:– Twitter, Reddit, Stack Overflow, Quora, Facebook, etc.– Brand specific forums– Any place where people express themselves
§ Leverage tools such as:– Watson Sentiment Analysis– Watson Tone Analyzer
15

Combine and Focus
§ We can also combine methods. – Use one more more methods to roughly identify problems, then other methods to drill
into details
§ Focus on specific personas and scenarios, or on some aspect of a persona such as:
– Users in a specific geography– Inexperienced users
§ Focus on suspected problem areas such as:– Does the UI slow down when back-end systems are being backed up?
16

Caveats
§ Beware the skew!– Understand when and why someone might comment on their experience
§ Unhappy users tend to provide more unsolicited comments
§ Aggregate carefully!– Using the mean (average) tends to hide anomalies
§ Not all users are the same. Even in the same persona, there can be variations in things like:
– Experience, Culture, Personality, Location
17
