shrinkage in europe 2004: a survey of stock loss in the
TRANSCRIPT

SHRINKAGE IN EUROPE 2004: A SURVEY OF STOCK LOSSIN THE FAST MOVINGCONSUMER GOODS SECTOR

i
SHRINKAGE IN EUROPE: A Survey of Stock Loss in the Fast Moving Consumer Goods Sector, 2004
All rights reserved.
ECR Europe holds copyright of this report. It may not be reproduced without the prior written permission of ECR Europe.
The comments expressed in this report are of those of the author and do not necessarily represent the views of ECR Europe.
To contact ECR Europe:
Efficient Consumer Response (ECR) Europe 9 Avenue des Gaulois
1040 Brussels Belgium
Website: www.ercnet.org
To contact the author:
Adrian Beck, Senior Lecturer in Crime and Policing, University of Leicester, Department of Criminology,
154 Upper New Walk, Leicester LE1 7QR UK Email: [email protected]
ECR Europe, July 2004


Contents
ECR Europe Shrinkage Survey 2004 iii
CONTENTS
EXECUTIVE SUMMARY ......................................................................................... v INTRODUCTION....................................................................................................... 1 METHODOLOGY...................................................................................................... 3 I SHRINKAGE IN THE EUROPEAN RETAIL SECTOR .......................... 7 1 Extent of Stock Loss ....................................................................................... 9 1.1 Size of the Problem ...................................................................................... 9 1.2 Awareness of Loss........................................................................................ 9 1.3 Causes of Stock Loss .................................................................................. 10 1.3.1 All Losses........................................................................................... 11 1.3.2 Known Losses Only ......................................................................... 11 1.4 Loss Within the Company ........................................................................ 12
2 Recording and Auditing Stock Loss....................................................... 15 2.1 Calculating Stock Loss............................................................................... 15 2.2 Measuring Loss........................................................................................... 15 2.3 Carrying out Audits................................................................................... 17
3 Responding to the Problem....................................................................... 19 3.1 Company Policy and Prioritisation ......................................................... 19 3.2 Company Co-operation............................................................................. 20 3.3 Use of Specialist Teams ............................................................................. 22 3.4 Spending on Shrinkage Control ............................................................... 22 3.5 Approaches to Reducing Shrinkage ........................................................ 24 3.6 Setting Targets and Rewarding Staff....................................................... 25 3.7 Carrying Out Shrinkage Reduction Projects .......................................... 28
4 Working With Others .................................................................................. 31 4.1 Awareness of ECR Europe Shrinkage Group ........................................ 31 4.2 Working With Other Groups.................................................................... 33
II STOCK LOSS IN RETAIL DISTRIBUTION .......................................... 35
1 Extent of Stock Loss ..................................................................................... 37 1.1 Size of the Problem .................................................................................... 37 1.2 Awareness of Loss...................................................................................... 37 1.3 Causes of Stock Loss .................................................................................. 38

Contents
ECR Europe Shrinkage Survey 2004 iv
2 Recording and Auditing Stock Loss....................................................... 39 2.1 Measuring Loss........................................................................................... 39 2.2 Checking Pick Accuracy............................................................................ 40 2.3 Compensating for Error ............................................................................ 41
3 Responding to the Problem....................................................................... 43 3.1 Company Prioritisation ............................................................................. 43 3.2 Spending on Shrinkage Control ............................................................... 43
III CONCLUSIONS ............................................................................................. 45
Introduction .................................................................................................... 47
1 Extent of Stock Loss ..................................................................................... 47 2 Measuring the Problem .............................................................................. 48 3 Tackling Stock Loss ..................................................................................... 48
4 Working Together and With Others ...................................................... 50
5 Stock Loss in Retail Distribution ............................................................ 51
6 Concluding Comments ............................................................................... 52

Executive Summary
ECR Europe Shrinkage Survey 2004 v
EXECUTIVE SUMMARY This report details the findings from the second ECR Europe survey on stock loss in the fast moving consumer goods (FMCG) sector in Europe. It is based upon a survey of retailers and manufacturers throughout Europe addressing: the extent, nature and impact of shrinkage; methods of recording shrinkage; responding to the problem; and working with others. The data covers retailers from 18 countries with a combined turnover of €137.2 billion.
SHRINKAGE IN THE FAST MOVING CONSUMER GOODS SECTOR
• The cost of shrinkage is enormous, with an annual price tag of €24.17 billion. This is equivalent to €465 million per week and accounts for 2.41 per cent of market turnover.
• Of the three main areas within the supply chain that are particularly vulnerable to loss, they accounted for:
Manufacturer distribution €5.68 billion Retail distribution €1.20 billion Retail stores €17.29 billion
SHRINKAGE IN THE EUROPEAN RETAIL SECTOR
• Throughout Europe, stock loss accounted for 1.84 per cent of turnover equating to losses of €18.49 billion a year.
• Most respondents estimated that the majority of their loss was unknown (51%), with a slightly smaller proportion being estimated as known (49%). This was a significant increase on the last survey for the extent of loss that was known.
• When considering all losses retailers perceived the main threat to be from external theft (38%), followed by process failures (27%), internal theft (28%) and supplier fraud (7%).
• When considering only known losses, retailers perceived the main threat to be from process failures (54%) followed by external theft (26%), internal theft (15%) and supplier fraud (5%).
• 93 per cent of losses occurred in stores (€17.29 billion). Just 7 per cent is thought to occur at the retail distribution centres or while goods are in transit (€1.2 billion).
• Most European retailers calculate stock loss at retail prices and include known and unknown losses, traditional process failures (such as out of date stock, price mark downs and damaged stock) and losses incurred at retail distribution centres (RDCs).
• One-third of respondents did not collect company-wide information about stock loss. It would seem difficult for these organisations to develop a strategic overview of the problem of shrinkage, something which is necessary if Board level support is required.

ECR Europe Shrinkage Survey 2004 vi
• Those companies with a corporate policy had significantly lower levels of stock loss than those companies that did not suggesting that embedding stock loss reduction may be an important component in reducing levels of shrinkage.
• Those companies that considered stock loss to be a high priority had lower levels of stock loss.
• Retailers continue to be fixated with the problem of external theft despite their own data and perceptions indicating that a bigger problem is internal theft and process failures.
• The vast majority of companies set annual targets for stock loss and most had a policy of paying bonuses to staff. The latter was strongly correlated with lower levels of loss – incentivising key staff can be a powerful mechanism for improving a company’s capability of delivering lower levels of shrinkage.
• Those companies that were the most actively involved in carrying out experiments, trials and projects to tackle the stock loss problems they faced were far more likely to have significantly lower levels of stock loss.
• The majority of companies involved in stock loss projects did not use external evaluators and those that did relied upon equipment providers.
• The security/loss prevention department, store management team and the board of directors were those groups considered to be most involved with the prevention of stock loss. Least involved were seen to be buying, human resources, marketing, IT and legal departments.
• Those companies with higher levels of intra company co-operation had significantly lower levels of stock loss.
• In the last financial year European retailers spent €2.92 billion on efforts to reduce stock loss. This is equivalent to 0.29 per cent of turnover.
• A majority of respondents said that they were highly involved with security suppliers while about two fifths were highly involved with manufacturers and the police. Few worked regularly with representative organisations and other retailers on a regular basis.
• The vast majority of retailers were aware of the ECR Europe Shrinkage Group, while two thirds said that they had heard of Shrinkage Road Map. Three quarters of those who had heard of the Road Map had gone on to use it and of those, 92 per cent found it useful or very useful.
SHRINKAGE IN RETAIL DISTRIBUTION
• Supply chain respondents estimated that their rate of stock loss was 0.38 per cent (€3.82 billion) or 21 per cent of all losses identified by the main survey1. While much of this loss probably remains within the company, it is likely to generate a considerable amount of ‘noise’ within the system (such as wrong stock to the
1 This number is different from the data presented earlier – the discrepancy is due to supply chain shrinkage not
necessarily being converted into absolute losses for the organisation as a whole and the extent to which companies have difficulty measuring the problem at company level. Therefore, the earlier, more conservative figure of 7 per cent of losses occurring within retail distribution is used to calculate the total loss for retailers in Europe.

Executive Summary
ECR Europe Shrinkage Survey 2004 vii
wrong stores, which in turn can increase the likelihood of damage, stock going out of date and increased opportunities for staff to steal).
• This data was supported by an average rate of pick accuracy of 98.74, which equates to a margin of error of 1.26 per cent. In financial terms this is the equivalent of €12.64 billion a year of stock errors by European retail distribution. Again, much of this stock remains within the organisation, but it adds to the argument that some of the stock loss problem identified in stores is ‘washed down’ from the supply chain.
• The rate of awareness of the problem of stock loss in the supply chain was markedly similar to the results generated by the main survey. Just over one-half (52%) of stock loss was known. It would seem that levels of transparency within the supply chain are as poor as in the rest of the organisation.
• Nearly three-quarters of stock loss was thought to be caused by process failures (71%), with internal theft (13%) the next largest proportion, followed by inter-company fraud (9%), with external theft accounting for only a small amount of total losses (7%).
• One third of stock loss expenditure was spent on controlling process failures (33%), with a further one quarter being used to target external theft (24%), and a similar amount being used to try and control internal theft (23%). The remaining one fifth of expenditure was spent on inter company fraud (20%). Once again, external theft is over prioritised in the apportionment of the stock loss budget – the continuing retail obsession with the threat from ‘outsiders’ seems to be pervasive throughout the entire organisation.
SURVEY HIGHLIGHTS: 6 STEPS TO SUCCESSFUL SHRINKAGE REDUCTION
Written company policy
High levels of intra-company co-operation
Prioritise the problem
Incentivise staff
Conduct regular shrinkage reduction projects
Make use of the ECR Europe Road Map?


Introduction
ECR Europe Shrinkage Survey 2004 1
INTRODUCTION
This is the second ECR Europe2 survey on the nature and extent of stock loss3 in the Fast Moving Consumer Goods sector4 in Europe. The first was published in February 2001 and played a pivotal role in not only raising awareness of the size of the problem but also the potential contribution effective stock loss control can make to the overall profitability of FMCG companies5. In addition, the report provided a useful benchmark for organisations to compare their performance on stock loss control against the European ‘average’. It also provided important information that helped guide the subsequent work of the ECR Europe Shrinkage Group including the now widely used ECR Shrinkage Reduction Road Map6. It is now over three years since the first report was published and the ECR Europe Shrinkage Group felt it important that a new survey be carried out to provide companies with an up-to-date benchmark on stock loss and to enable a range of new questions to be asked about how organisations are addressing the issue of stock loss. In particular, the 2004 survey collected more detailed information on the nature and extent of stock loss in the retail supply chain – an area that continues to be seriously under investigated. A new survey was also important because of the continuing enlargement of the European Union, with 10 countries joining in May 2004. Consequently, the 2004 survey covered 26 countries, five more than the original survey carried out in 20007. This in turn however, makes some comparisons between the two surveys problematic.
The retail sector in Europe is extremely big business, with a combined market value of €1,004 billion8. It is also a complex and highly competitive market requiring retailers and their suppliers to constantly seek methods of improving the efficiency and profitability of their businesses. The scale of most operations is impressive – it is not unusual to find some retailers with a product range in excess of 40,000 items, while many manufacturers now have enormous logistical webs covering every European country. What all these retailers and manufacturers share is a desire to maximise their profit-making potential. They also share a common problem: shrinkage.
From the first delivery of raw materials to a manufacturer, right through to the point at which a consumer takes a finished product out of a store, there is a multitude of opportunities for a product to be either lost, broken, stolen, eaten, under priced or to go 2 For further information about Efficient Consumer Response (ECR) Europe visit their website at www.ecrnet.org. 3 The terms ‘shrinkage’ and ‘stock loss’ will be used interchangeably throughout this report. 4 The Fast Moving Consumer Goods Sector is defined as retailers and their suppliers who provide a range of goods sold
primarily through supermarkets, hypermarkets and smaller retail stores. The core of their business is providing ‘essentials’ such as various fresh and processed foodstuffs, but they also stock a wide selection of other goods as well including health and beauty products, tobacco, alcohol, clothing, some electrical items, baby products and more general household items. Some retailers may stock more than 40,000 different product lines.
5 Beck A. and Bilby, C. (2001) Shrinkage in Europe: A Survey of Stock Loss in the Fast Moving Consumer Goods Sector, ECR Europe: Brussels.
6 For a detailed review of the Road Map and how to use it see: Beck, A., Chapman, P. and Peacock, C. (2003) Shrinkage: A Collaborative Approach to Reducing Stock Loss in the Supply Chain, ECR Europe: Brussels.
7 The countries covered were: Austria, Belgium, Czech Republic, Denmark, Estonia, Finland, France, Germany, Greece, Hungary, Irish Republic, Italy, Latvia, Lithuania, Luxembourg, The Netherlands, Norway, Poland, Portugal, Slovakia, Slovenia, Spain, Sweden, Switzerland and UK.
8 Planet Retail, 2004.

Introduction
ECR Europe Shrinkage Survey 2004 2
out of date. Some of these events are due to the (usually) unintended outcomes of processes used within companies such as methods of pricing, stock counting or errors in deliveries. Other events are more malicious in nature; suppliers deliberately under delivering, ‘customers’ thieving from stores or the staff helping themselves to the stock or the cash in the tills. As detailed later in this report, this is a problem that is costing European retailers and manufacturers billions of euros a year.
This study is based upon a survey of retailers throughout Europe asking questions on four areas broadly relating to shrinkage. Those areas are:
• Extent, nature and impact of shrinkage within the company.
• Recording shrinkage.
• Responding to the problem.
• Working with others.
The overall aim was to gain a broad understanding of the extent and nature of the shrinkage problem and the methods currently used for its control and management. To date there has been a relative lack of co-operation not only between retailers, but also between retailers and manufacturers on dealing with a common threat. In some countries in Europe excellent work has been done on beginning to understand the extent of certain aspects of stock loss and the first ECR Europe Shrinkage survey significantly helped to raise the profile of the problem, but relatively little is still known about the problem across Europe. This is partly a problem of language, but it is mainly due to a continuing lack of prioritisation – most companies do not appreciate the impact shrinkage has upon their organisation and the potential it has to grow profits.
This report is organised into three main parts. Part one looks at the problem of shrinkage in the European retail sector based upon a survey of 31 companies in 18 countries with a combined turnover of €137.2 billion. The second section focuses on the nature and extent of stock loss in the retail supply chain, based upon responses from 19 companies. The final section draws together the key findings from the survey.
In order to help the reader quickly identify the key results throughout this report, this symbol will appear in the margin.

Methodology
ECR Europe Shrinkage Survey 2004 3
METHODOLOGY Carrying out research that attempts to collect comparable data from different countries is notoriously difficult – besides the obvious problems of language, difficulties can emerge with meaning and terminology. Since the start of the work of the ECR Europe Shrinkage Group, it was quickly agreed that an ECR definition of shrinkage was required so that there was clarity in its work. One of the difficulties that emerged at the start of the study was the lack of an agreed pan-European definition for shrinkage. It is an ‘elastic’ term encompassing many different components of loss depending upon the type of company, range of products and location within Europe. It was therefore important to develop a workable definition that would enable not only companies to complete the questionnaire as fully as possible, but also enable ‘like with like’ comparisons to be made by the research team (the current survey incorporated questions on what organisations included when calculating their stock loss). For the purpose of this research, the agreed definition for shrinkage was a combination of inter-company fraud, process failures, internal theft and external theft. These four areas were defined as:
Process Failures – Losses due to operating procedures within the organisation including products which have gone out of date, or have been reduced in price; incorrect pricing; product identification errors; incorrect stock counting; products which have been damaged; scanning errors; and errors in deliveries to the stores (e.g. short deliveries due to errors in picking and dispatch from distribution centres).
Internal Theft – The unauthorised taking of goods or cash from a store at any time of the day or night by staff employed by the company (including contract staff, for instance third party security staff or maintenance workers). This includes staff theft, collusion between customers and staff, employees eating stock, till shortages and the deliberate manipulation of prices.
External Theft – The unauthorised taking of goods or cash from a store at any time of the day or night by customers or other non-company employees. This includes incidents of shoplifting, fraudulent return of goods, till snatches and burglary (breaking and entering a store whilst it is closed).
Inter-company fraud – Losses due to suppliers or their agents deliberately delivering fewer goods than retailers are eventually charged for by them, or retailers deliberately returning fewer goods to manufacturers/suppliers than agreed/specified. This includes vendor and contractor fraud. Note, for retailers this refers to losses due to discrepancies in the goods supplied by third parties and not from their own distribution centres.
In order to overcome the problem of varying start dates for financial years in different countries, the survey opted to ask respondents to comment on their ‘last full financial year’.
This study made use of three questionnaires: two for European retailers (one requesting information about stock loss in their entire organisation, the other focusing specifically upon the problem of stock loss in their distribution chain), and one for manufacturers that supply them. All instruments were designed in late 2003 by the ECR Europe Shrinkage Group, which is made up of representatives from European retailers and manufacturers, and academics from Cranfield University and the University of Leicester, both in the UK.

Methodology
ECR Europe Shrinkage Survey 2004 4
The questionnaires asked for information on 5 areas: information about the company (number of outlets, number of distribution centres, turnover); extent, nature and impact of stock loss within the company (percentage loss, areas of loss, vulnerable products); recording and measuring stock loss (types of systems currently in place, frequency of stock audits); responding to the problem (use of specialist teams within the company, expenditure on reducing stock loss, types of equipment used); and working with others (types of collaboration with other groups, extent of involvement in inter-retail, inter-manufacturer and retail/manufacturer shrinkage initiatives, and awareness of the ECR Europe Shrinkage Group and its Road Map).
In order to try and encourage as high a response rate as possible, the questionnaire for retailers was translated into 7 languages (Czech, French, German, Italian, Polish, Portuguese and Spanish). The questionnaires were distributed by staff at the University of Leicester in January/February 2004. The questionnaires were sent to senior members of security departments, audit departments, or senior members of staff with responsibility for loss prevention. A sequence of follow-up letters and emails were sent to companies that failed to respond. In addition, where possible, electronic versions of the questionnaire were also sent out to respondents. In Spain, Rosario Pedrosa, from AECOC, kindly co-ordinated the collection of data from the Spanish retailers, while Michael Löw from CCG in Germany translated the retailer questionnaire into German and distribute it in Austria and Germany. Similarly, Armando Mateus from Jeronimo Martins in Portugal arranged for the translation into Portuguese. In other countries, ECR Europe and individual members of the ECR Europe Shrinkage Group played an invaluable role in distributing and ‘chasing up’ companies that had not responded (in particular Justyna Lewandowska, John Fonteijn, Colin Peacock, Katrin Recke, and Gyorgy Ruszkovszky). Overall, 239 questionnaires were sent out to companies in 25 countries. The sample was selected based upon targeting companies that had the largest share of the market within their own country, with the aim being to maximise the representation of the entire market within the survey. M+M Planet Retail was used as a source for information on existing market share within Europe. On average, for those countries selected to be included in the analysis, the market share of the respondents varied between 10 and 40 per cent.
In total, the study received 31 responses from retailers, with a total turnover of €137.2 billion or 13.7% of the total European market share. The rate of response varied considerably between countries and by the end of the data collection phase the research team had sufficient information to enable meaningful analysis to take place on companies from 18 different countries. It is worth noting that the response rate from Germany was too low to enable inclusion (German retailers had been surveyed on a number of occasions prior to the current study and were therefore not willing to complete the questionnaires). The response rate from eastern European countries was also disappointing but perhaps less surprising (no responses were obtained from Estonia, Latvia, Lithuania and Slovenia).
As with the survey in 2001, the research team also sent out questionnaires to manufacturers who supply the FMCG sector, with the aim being to gather data from throughout the supply chain. Some 38 were sent out to the largest companies operating in Europe. Unfortunately, the response rate was very poor with the main reason being cited as an inability to answer the questions on a pan-European basis. Consequently, this report does not include data from the manufacturer survey, other than data on the cost of shrinkage to the sector. This data was collected from a sub sample of companies that

Methodology
ECR Europe Shrinkage Survey 2004 5
were able to provide this number (but were not able to answer the other more detailed questions included in the survey). This sub sample represented eight companies with a pan European turnover of €19 billion. Given this, some caution needs to be exercised when interpreting the overall shrinkage figure for Europe highlighted in the first part of this report.
Throughout this report, all currencies have been converted into Euros, with the average currency exchange rate for 2003 being used. Pan-European estimates of the cost of stock loss were derived from three sources of information. First, estimates of the value of stock loss in retailers were obtained from the question, ‘…what was the total value of stock loss at retail value (including taxes) as a percentage of total sales’, while manufacturers were asked, ‘… what was the total value of stock loss at net sales value as a percentage of total sales’. Secondly, all respondents were asked to state their company turnover (this was validated by data from M+M Planet Retail). Thirdly, published figures on the total size of the retail trade in each country were used. From these data, it was possible to extrapolate to generate firstly, a countrywide figure for stock loss and secondly, a pan-European figure. For those countries without any responses, the overall European average was used to calculate the total loss for that country.
Few companies were able to provide data for every question in the surveys. A distinction was made between entering ‘zero’ meaning that the answer was none, and entering a ‘blank’ or ‘not known’ meaning that the respondent could not provide the data. When analysing the results for each question only those questionnaires that provided a meaningful response were included. Some of the questions asked respondents to comment on known and unknown loss. This clearly relied upon them using their knowledge and experience to estimate what the requested breakdown might be. When this is the case, it is highlighted in the body of the report.
The methodology used cannot avoid the possibility of sampling error and mistakes made by those completing the questionnaires. All extrapolated figures are based upon on a survey of European retailers and manufacturers that is itself subject to sampling errors. Within the report, percentages are rounded to the nearest whole figure, which means in some instances figures do not total 100%. The percentages are based on the number of valid responses to each question, which in some cases are less than the total survey response rate.


Section I
STOCK LOSS IN THE EUROPEAN RETAIL SECTOR


Stock Loss in European Retailers
ECR Europe Shrinkage Survey 2004 9
1 EXTENT OF STOCK LOSS
1.1 Size of the Problem The first task of the survey was to discover the extent of stock loss within European retailers – how big is the problem and what are the areas perceived to be at risk? Retailers were asked a series of questions about levels of loss within their organisation, including the extent of loss that was known and unknown, and the perceived causes of shrinkage (both known and unknown).
Companies were asked to indicate the value of their stock loss as a percentage of total sales for the last complete financial year. Average losses per country were then used to generate a total stock loss figure for Europe. The table below illustrates the average stock loss for the whole of Europe and includes some of the available data from the manufacturer survey to enable a total for the FMCG sector in Europe to be calculated (Table 1).
Table 1 Cost of stock loss in the European FMCG sector Sector Percentage
stock loss Value
(€ billions)
Retailers 1.84 18.49 Manufacturers/Suppliers 0.57 5.68
Total 2.41 24.17
Overall, it is estimated that stock loss accounted for 2.41 per cent of turnover for the most recent financial year, which equates to a total European cost for shrinkage of €24.2 billion. This represents a loss of €465 million per week or, put another way, €2.8 million per hour. For retailers the rate was 1.84 per cent of turnover, which is €18.5 billion per year. Whilst comparisons with the previous survey are difficult due to the enlarged sample and the significant increase in the overall market from €824.4 billion to €1,004 billion, analysis of those respondents that responded to both surveys showed that there was no significant difference between the two surveys in terms of the overall rate of shrinkage for retailers in Europe. The rate in Europe is also markedly similar to those found in surveys carried out in other parts of the world9.
1.2 Awareness of Loss One of the main problems organisations face when dealing with stock loss is trying to address something that, whilst it may be estimated, is very often unknown. A key aim of this survey was to try to uncover a clearer picture of stock loss suffered by European retailers. As well as asking respondents to give an indication of levels of stock loss, they were also asked to estimate what percentage could be attributed to known and unknown
9 For instance the annual survey carried out in the USA by the University of Florida which found that for 2001 the
average rate of shrinkage for retailers was 1.87% (Hollinger, R. and Davis, J. (2002) 2001 National Retail Security Survey, Gainsville: University of Florida); see also the survey by ECR Australia, which found a rate of 1.73% (http://www.ecraustralasia.org.au/public/loss_prevention.htm) and the work produced by EuroHandelsinstituts in Gernamy (http://www.ehi.org/gb_research.html).
Stock Loss in European Retailers
ECR Europe Shrinkage Survey 2004 10
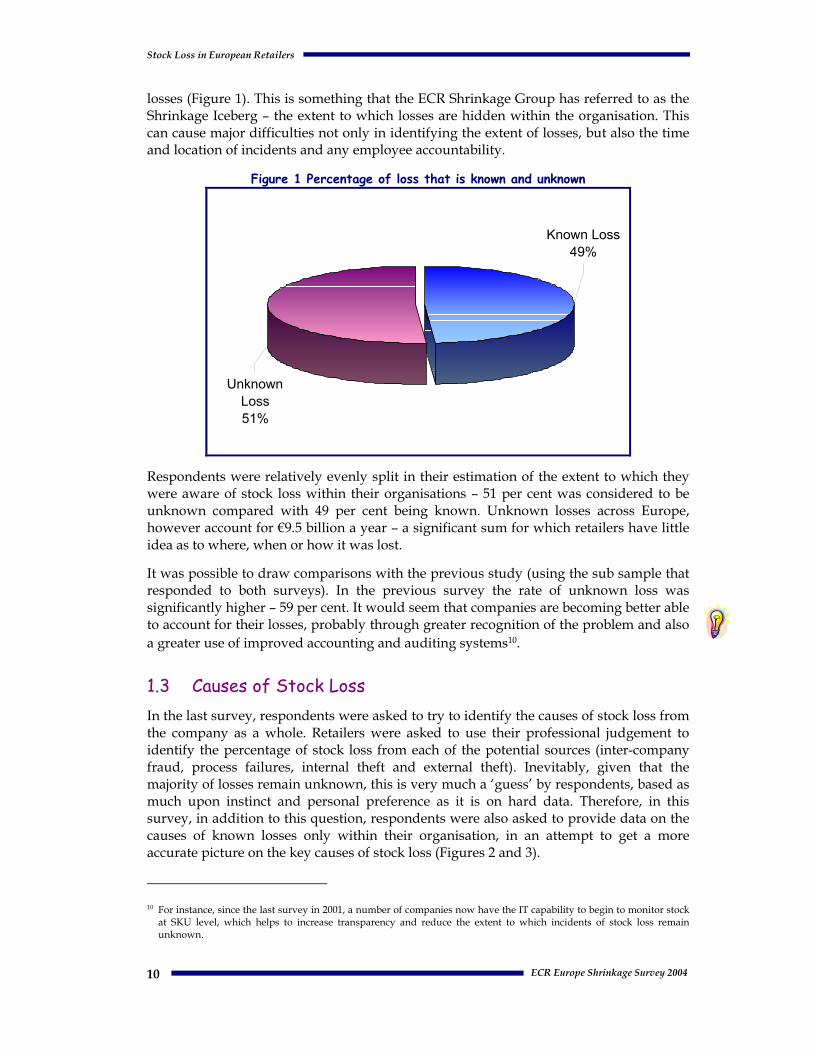
losses (Figure 1). This is something that the ECR Shrinkage Group has referred to as the Shrinkage Iceberg – the extent to which losses are hidden within the organisation. This can cause major difficulties not only in identifying the extent of losses, but also the time and location of incidents and any employee accountability.
Figure 1 Percentage of loss that is known and unknown
Known Loss49%
Unknown Loss51%
Respondents were relatively evenly split in their estimation of the extent to which they were aware of stock loss within their organisations – 51 per cent was considered to be unknown compared with 49 per cent being known. Unknown losses across Europe, however account for €9.5 billion a year – a significant sum for which retailers have little idea as to where, when or how it was lost.
It was possible to draw comparisons with the previous study (using the sub sample that responded to both surveys). In the previous survey the rate of unknown loss was significantly higher – 59 per cent. It would seem that companies are becoming better able to account for their losses, probably through greater recognition of the problem and also a greater use of improved accounting and auditing systems10.
1.3 Causes of Stock Loss In the last survey, respondents were asked to try to identify the causes of stock loss from the company as a whole. Retailers were asked to use their professional judgement to identify the percentage of stock loss from each of the potential sources (inter-company fraud, process failures, internal theft and external theft). Inevitably, given that the majority of losses remain unknown, this is very much a ‘guess’ by respondents, based as much upon instinct and personal preference as it is on hard data. Therefore, in this survey, in addition to this question, respondents were also asked to provide data on the causes of known losses only within their organisation, in an attempt to get a more accurate picture on the key causes of stock loss (Figures 2 and 3).
10 For instance, since the last survey in 2001, a number of companies now have the IT capability to begin to monitor stock
at SKU level, which helps to increase transparency and reduce the extent to which incidents of stock loss remain unknown.

Stock Loss in European Retailers
ECR Europe Shrinkage Survey 2004 11
1.3.1 All Losses
Figure 2 outlines the data for all losses (known and unknown). As can be seen, the largest proportion of loss is considered to be caused by external theft (38%), followed by internal theft (28%) and then process failure (27%). Only 7 per cent of all losses are considered to be due to inter-company fraud. In terms of value, this means that retailers estimate that external theft costs the sector just over €7 billion a year, while process failure and internal theft taken together amount to just over €10 billion a year. If these two factors are combined, then retailers themselves certainly estimate that the biggest problems they face come from within their organisations in the form of mistakes and errors (process failures) and staff helping themselves to stock and cash (internal theft). However, it is perhaps wise to see the information presented below more as a reflection of perceived company priorities and individual prejudices than a genuine picture of where losses occur.
Figure 2 Causes of stock loss (all losses)
Process Failures
27%
Internal Theft28%
External Theft38%
Inter-Company Fraud
7%
1.3.2 Known Losses Only
When companies were asked to provide data on the causes of known stock loss, a different picture emerged from that shown above (Figure 3).
Figure 3 Causes of stock loss (known losses only)
External Theft26%
Inter-Com pany Fraud
5%
Internal Theft15%
Process Failure54%

Stock Loss in European Retailers
ECR Europe Shrinkage Survey 2004 12
The majority of known losses are made up of process failures – over one half (54%). The second largest proportion is then external theft (26%), followed by internal theft (15%). Whilst it is arguable as to whether this data is any better at representing the true causes of stock loss, it is highly instructive in terms of highlighting the extent to which companies are able to measure (and prioritise) different types of problem within their organisations. Certainly particular types of process failures increasingly have very clear processes and procedures associated with them, for instance stock going out of date, price mark downs, damage to stock and so on. The data is also instructive in terms of showing how difficult it is for organisations to get to grips with internal theft – while stock loss practitioners estimate it accounts for 27 per cent of the problem, it only accounts for 15 per cent of recorded incidents. Similarly, while 38 per cent of all stock loss is estimated to be due to external thieves, it accounts for only 26 per cent of recorded incidents.
1.4 Loss Within the Company While the second part of this report will look more specifically at losses in the retail supply chain, the overall company survey also asked respondents to estimate from which point in the supply chain goods were most likely to be lost: whether from the retail distribution centres or from the companies’ stores (Figure 4).
Figure 4 Percentage lost in RDCs compared with stores
Stores93%
Retail Distribution
7%
Stores were perceived to be the location where the vast majority of shrinkage took place – over 90 per cent of all loss is seen to happen in the outlets (€17.3 billion). Just 7 per cent is thought to occur at the RDCs or when goods are in transit from them to the stores (€1.2 billion).
Like the data presented on the causes of stock loss, this information is equally problematic in terms of reliability and validity. Certainly stores are more prone to loss – after all this is the only location in the chain where members of the public are admitted to browse, buy and possibly steal. But, errors occurring in the supply chain may only be discovered once the stock has ‘appeared’ (either electronically or physically) in the store. In other words, stock loss problems may be ‘washed’ through the supply chain and only appear at the store, over emphasising the problem at this point in the supply chain.
Stock Loss in European Retailers
ECR Europe Shrinkage Survey 2004 13
Certainly anecdotal evidence suggests that a lack of checking of deliveries from RDCs together with regular reports of annual overages recorded by RDCs would suggest that the picture painted above may not be completely accurate. It is also worth noting that even with the data provided by this survey, the retail supply chain is responsible for over one billion euros of loss every year – something that cannot be ignored (see Section III for more details on supply chain losses).


Stock Loss in European Retailers
ECR Europe Shrinkage Survey 2004 15
2 RECORDING AND AUDITING STOCK LOSS Recording loss due to shrinkage is notoriously difficult, not least because as detailed earlier, just over a half is unknown. Yet it is very often this data that is used to develop strategies to tackle the problem. Companies record a variety of stock losses in a number of different ways and the research team was interested in finding out about the approaches adopted. Detailed below are data on the types of information included within the stock loss figure, the level at which data is collected within the company and the frequency of audits – traditionally the most often used method for generating stock loss data.
2.1 Calculating Stock Loss Prior to the start of this project, there was considerable debate about the most common method by which European retail organisations measured stock loss. Three methods seemed to be prevalent: stock loss measured at retail sales value; stock loss measured at cost price; and finally stock loss measured at cost price plus an agreed amount to cover additional costs incurred handling the goods. Detailed below is the method adopted by respondents to the survey (Figure 5).
Figure 5 Method used to calculate stock loss results
0
10
20
30
40
50
60
Per c
ent
Retail SalesValue
Cost Price Cost Price + Other
Method
The data indicates that the most popular method adopted by European retailers is to consider stock loss at retail sales value (52%), followed by cost price (39%), with only a very small percentage (3%) using the cost price plus model.
2.2 Measuring Loss Respondents were also asked to give details about the types of incidents that they included within their stock loss calculation, ranging from unknown and known loss, through to losses in the supply chain and various types of process failure (Figure 6).

Stock Loss in European Retailers
ECR Europe Shrinkage Survey 2004 16
Figure 6 Types of shrinkage used to calculate company stock loss statistics
0102030405060708090
100
Unkno
wn
Known
Out of
Date
Price M
arked
Dow
ns
Damag
e
Donati
ons
Other P
roces
s
Loss
es at
RDCs
Loss
es in
Transp
ort
Loss
es by
3PLs
Categories Included
Per c
ent
Perhaps not surprisingly, all respondents included unknown losses within their calculation, with nine in ten stating they also included all known losses (90%). Between 77 per cent and 61 per cent of respondents usually included traditional process failures such as out of date stock, price mark downs and damaged stock. A slightly different picture emerged when losses occurred in the supply chain – only 58 per cent of companies said that they included losses in the RDCs when calculating stock loss, while even fewer (35%) included losses that incurred while goods were being transported between RDCs and stores. Finally only a small minority (19%) included losses that were sustained while third party logistics suppliers were being used. A European consensus would seem to be the inclusion of known and unknown losses, together with key process failures and losses taking place in RDCs. The exclusion of losses while goods are in transport seems incongruous, although it may be more a function of difficulties in recording the incidents rather than a conscious decision to exclude such losses from the overall total.
The survey then went on to ask respondents at what levels within the organisation were they able to measure stock loss: company wide, store, category and SKU (Figure 7).

Stock Loss in European Retailers
ECR Europe Shrinkage Survey 2004 17
Figure 7 Levels at which stock loss can be measured
0
10
20
30
40
50
60
70
80
90
Per c
ent
Company Store Category SKU
Levels of Measurement
Nearly two thirds of respondents stated that they collected stock loss data at company level (61%), while an even greater proportion confirmed that data was collected at store level (84%). Just over one-half (55%) said that they were capable of category level measurement, while 71 per cent were of the view that their company was able to measure stock loss at SKU level.
These data are difficult to interpret although they do highlight the emphasis placed by most companies on focusing measurement at the store level. It also shows that for nearly one-third of respondents a company-wide strategic overview of the problem of shrinkage is not possible. This is often critical if stock loss practitioners are to generate the necessary Board level support required to introduce new approaches to dealing with the problem.
2.3 Carrying out Audits The final question on methods adopted to measure the problem of shrinkage was the frequency with which audits were carried out by the company (Figure 8).
The most popular frequency for respondents was an audit every 6 months – two thirds said this (66%). The only other options selected by a minority of companies was annually (21%) and every 5 weeks or less (14%). None of the respondents to the survey suggested that they carried out an audit when a store manager left. Further analysis of the data did not show any correlation between the frequency of audits and the level of recorded stock loss.

Stock Loss in European Retailers
ECR Europe Shrinkage Survey 2004 18
Figure 8 Frequency of audits
21
66
140
0
10
20
30
40
50
60
70
Per
cen
t
Annually Every 6Months
5 Weeks orLess
WhenManagerLeaves
Frequency
Stock Loss in European Retailers
ECR Europe Shrinkage Survey 2004 19
3 RESPONDING TO THE PROBLEM The following section focuses on the methods adopted by companies to try and deal with the problem of shrinkage. In particular, it looks at the extent to which organisations prioritise the problem, have a written corporate security policy, how departments within the company co-operate, the extent to which specialist teams are used (security and audit dept), spending on stock loss, and the types of measures adopted by companies to tackle the problem.
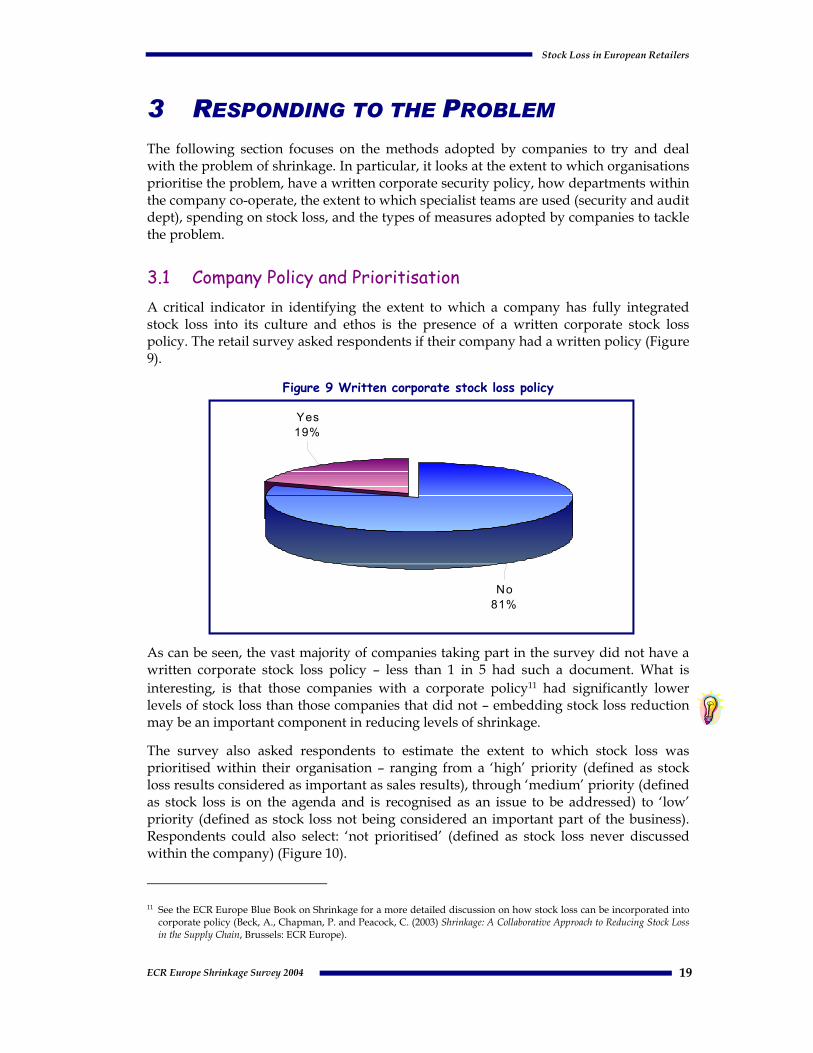
3.1 Company Policy and Prioritisation A critical indicator in identifying the extent to which a company has fully integrated stock loss into its culture and ethos is the presence of a written corporate stock loss policy. The retail survey asked respondents if their company had a written policy (Figure 9).
Figure 9 Written corporate stock loss policy
As can be seen, the vast majority of companies taking part in the survey did not have a written corporate stock loss policy – less than 1 in 5 had such a document. What is interesting, is that those companies with a corporate policy11 had significantly lower levels of stock loss than those companies that did not – embedding stock loss reduction may be an important component in reducing levels of shrinkage.
The survey also asked respondents to estimate the extent to which stock loss was prioritised within their organisation – ranging from a ‘high’ priority (defined as stock loss results considered as important as sales results), through ‘medium’ priority (defined as stock loss is on the agenda and is recognised as an issue to be addressed) to ‘low’ priority (defined as stock loss not being considered an important part of the business). Respondents could also select: ‘not prioritised’ (defined as stock loss never discussed within the company) (Figure 10).
11 See the ECR Europe Blue Book on Shrinkage for a more detailed discussion on how stock loss can be incorporated into
corporate policy (Beck, A., Chapman, P. and Peacock, C. (2003) Shrinkage: A Collaborative Approach to Reducing Stock Loss in the Supply Chain, Brussels: ECR Europe).
No81%
Yes19%

Stock Loss in European Retailers
ECR Europe Shrinkage Survey 2004 20
Figure 10 Perceived priority of stock loss within the organisation
58
32
100
0
10
20
30
40
50
60
Per c
ent
High Medium Low None
Priority
The majority of companies said that stock loss was considered to be a high priority within their company (58%), followed by about one-third who thought it to be of medium priority and one in ten who considered it to be of low priority. Further analysis showed that there was a negative correlation between level of priority and the extent of stock loss within a company. In other words, those companies that considered stock loss to be a high priority had lower levels of stock loss.
3.2 Company Co-operation Arguably, internal co-operation is essential in order to fully address stock loss issues – it is a problem that transcends departmental boundaries. Companies were asked to rate teams within their company in terms of their involvement in preventing or addressing stock loss. Teams were rated on a scale from 1, which showed that they were not involved at all in dealing with stock loss, to 5, which showed that they were highly involved (Figure 1112).
As can be seen, 78 per cent of companies stated that the security/loss prevention department was highly involved (although that does leave 22% who did not think their stock loss department was highly involved in stock loss!). This was followed by store managers (71%) who were the next group to be considered the most involved. In a significant departure from the data collected in the last survey, the Board of Directors was the next highest rated group (in the previous survey, they were ranked 7th). The next most significantly involved group to be perceived to be highly involved in stock loss was the audit department (62%). These four groups are considered to be the most involved of all organisational teams.
There is then a group of three teams that can be described as moderately involved: supply chain management (45%); logistics (33%); and finance (32%). Perhaps of more interest are those groups that are considered to be hardly or rarely involved in issues of stock loss. Those deemed to be the least involved were the buying, human resources, IT,
12 For the sake of clarity, the data has been recalculated into three categories – highly, regularly and hardly involved.

Stock Loss in European Retailers
ECR Europe Shrinkage Survey 2004 21
legal, and marketing departments, with only a small proportion of respondents stating that they were regularly involved. Without doubt, each of these departments could play a role in dealing with shrinkage. For instance, company buyers need to be aware of the potential problems new products may pose, both in terms of risk from process failures and from theft. Similarly, the marketing department clearly need to take account of the risks associated with particular products and the way they are displayed in stores, including the implications of promotional displays on existing security equipment (for instance, will proposed signage obscure CCTV cameras or lines of sight for members of staff?). Likewise, IT departments could look at their existing systems and see whether some of the concerns raised earlier in this report about different types of process failure could be ‘designed out’. Finally, the legal department could become involved in a number of different ways, including looking at how the existing legislative framework could be used to protect the company against, say persistent shoplifters13.
Figure 11 Extent of involvement of other teams
0% 10% 20% 30% 40% 50% 60% 70% 80% 90% 100%Per cent
Marketing
Planning and Design
Legal Dept
IT Dept
Human Resources
Buying
Finance
Logistics
Supply Chain Mangt
Auditing
Board of Directors
Store Mangt
Security/Loss Prevention
High Involved Regularly Involved Hardly Involved
More detailed analysis also revealed the importance of intra company co-operation in keeping stock loss low. There was a negative correlation between the overall level of co-operation expressed by respondents and levels of stock loss. In other words, those companies that indicated high levels of intra-company involvement were also those companies that had lower levels of stock loss.
13 For instance, there has been a considerable amount of work in the US and UK on operationalising civil recovery
initiatives.
Stock Loss in European Retailers
ECR Europe Shrinkage Survey 2004 22
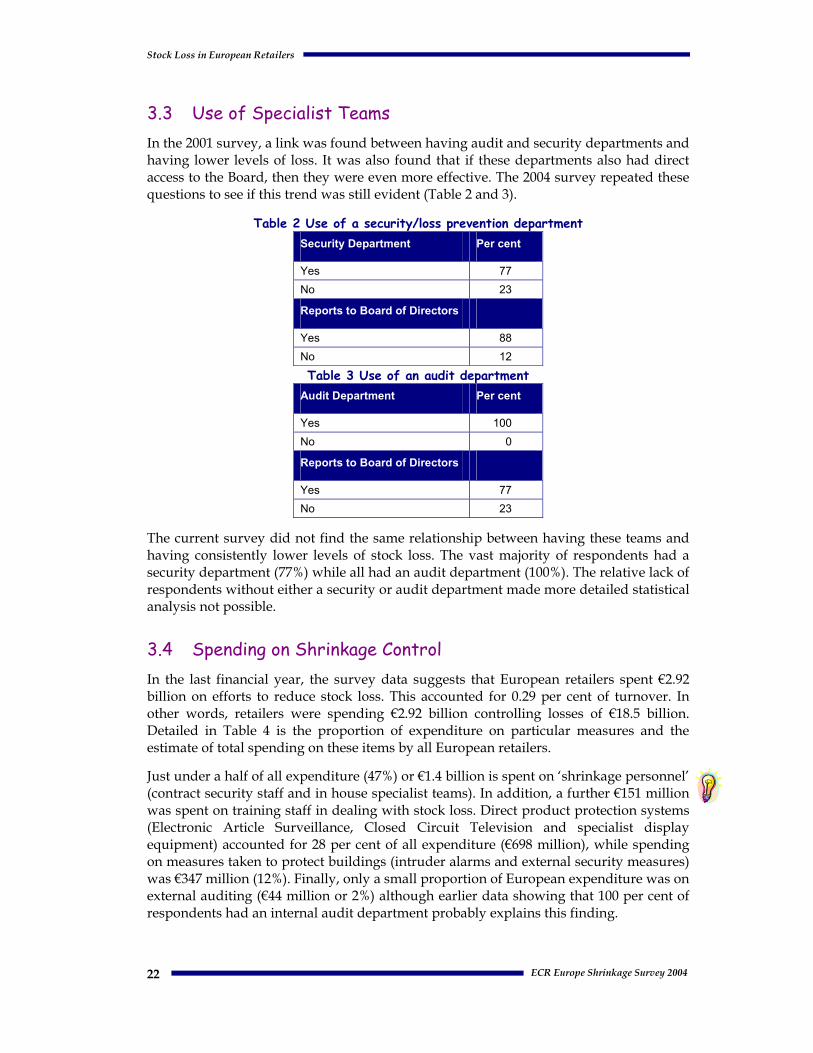
3.3 Use of Specialist Teams In the 2001 survey, a link was found between having audit and security departments and having lower levels of loss. It was also found that if these departments also had direct access to the Board, then they were even more effective. The 2004 survey repeated these questions to see if this trend was still evident (Table 2 and 3).
Table 2 Use of a security/loss prevention department Security Department Per cent
Yes 77 No 23
Reports to Board of Directors
Yes 88 No 12
Table 3 Use of an audit department Audit Department Per cent
Yes 100 No 0
Reports to Board of Directors
Yes 77 No 23
The current survey did not find the same relationship between having these teams and having consistently lower levels of stock loss. The vast majority of respondents had a security department (77%) while all had an audit department (100%). The relative lack of respondents without either a security or audit department made more detailed statistical analysis not possible.
3.4 Spending on Shrinkage Control In the last financial year, the survey data suggests that European retailers spent €2.92 billion on efforts to reduce stock loss. This accounted for 0.29 per cent of turnover. In other words, retailers were spending €2.92 billion controlling losses of €18.5 billion. Detailed in Table 4 is the proportion of expenditure on particular measures and the estimate of total spending on these items by all European retailers.
Just under a half of all expenditure (47%) or €1.4 billion is spent on ‘shrinkage personnel’ (contract security staff and in house specialist teams). In addition, a further €151 million was spent on training staff in dealing with stock loss. Direct product protection systems (Electronic Article Surveillance, Closed Circuit Television and specialist display equipment) accounted for 28 per cent of all expenditure (€698 million), while spending on measures taken to protect buildings (intruder alarms and external security measures) was €347 million (12%). Finally, only a small proportion of European expenditure was on external auditing (€44 million or 2%) although earlier data showing that 100 per cent of respondents had an internal audit department probably explains this finding.

Stock Loss in European Retailers
ECR Europe Shrinkage Survey 2004 23
Table 4 Expenditure on security
Measures Average
percentage of total expenditure
Total spent (millions)
Contract security staff 33 €950.5
In-house security staff/loss prevention/audit team 14 €418.9
Electronic tagging systems 13 €370.5 Closed circuit television 10 €298.4
Intruder alarm systems 6 €182.4 Cash protection equipment: safes, caches 6 €170.0
External security measures: shutters, bollards, fences 6 €164.4
Staff training on stock loss 5 €150.9
External audit companies 2 €43.9
Specialist display equipment 1 €29.3
Other 5 €132.9 Total 100 €2,912.1
It is instructive to look at how respondents identified the way in which their stock loss reduction budgets were focused compared with their estimations of the key problems facing their organisations (see 1.3.1 and 1.3.2). Detailed below (Figure 12) is a comparison between estimates of the proportion of expenditure on the four key areas of stock loss (inter-company fraud, internal and external theft, and process failure) and estimations for all losses and known losses. Clearly, stock loss expenditure is not necessarily correlated with the extent of the problem (some types of shrinkage may require more expensive responses to achieve an impact), but the data is instructive in looking at how organisations operationalise their stock loss budget compared with how they identify the seriousness of particular types of threat.
Figure 12 Expenditure on and causes of stock loss (known and unknown)
60
38
26 27 28
159
26
53
4 7 50
10
20
30
40
50
60
External Theft Internal Theft Process Failure Inter CompanyFraud
SpendingCauses (all)Causes (known)

Stock Loss in European Retailers
ECR Europe Shrinkage Survey 2004 24
Respondents estimated 60 per cent of their total expenditure on stock loss was spent on controlling external theft, compared with 27 per cent on internal theft and then 9 per cent on process failure and just 4 per cent on inter-company fraud. Compared with how respondents perceived the extent of the problem and available data on known losses, a starkly contrasting picture emerges. External theft is seen to account for 38 per cent of all losses and just one-quarter of known losses, and yet nearly two thirds of all expenditure is focused on this problem. In terms of internal theft, there is approximate parity between expenditure and perceived extent of the problem (all losses), although in terms of known losses, then expenditure is greater than the extent of the problem.
Expenditure on process failures is estimated at just 9 per cent and yet for all losses it is thought to represent one-quarter of the problem (26%), and for known losses, it accounts for just over one-half of the problem (53%). This considerable incongruity may partly be explained by the use of other budgets to control and manage process failures, particularly given that most traditional security/loss prevention departments tend to focus primarily on crime and security related issues. However, it is also highly indicative of an ongoing over emphasis upon ‘crime’ as the key focus of shrinkage, in particular the threat posed by shoplifters. It also highlights the influence of security equipment providers, who tend to have readily available (and often expensive) high tech ‘solutions’ for external theft – fixing process failures can often be low tech and cheap (for instance ensuring compliance and suitability of practices to circumstances), which is usually highly unappealing to such organisations.
3.5 Approaches to Reducing Shrinkage Approaches to shrinkage are not simply activities aimed at deterring shoplifters and dishonest members of staff; they also cover stock inventory and auditing systems. Respondents were given a list of 25 measures currently available to retailers, ranging from those designed to target customer and staff theft (for instance CCTV and staff searches) to those aimed at reducing process failures (such as automated stock ordering and process review teams). They were asked to indicate the types of measures they were currently using in their organisations (Table 5).
Most retailers seem willing to invest in a wide range of measures designed to tackle stock loss. Of the 25 measures, 50 per cent or more of the respondents stated they were using 20 of them. Of the top ten most used measures, 9 could be described as designed to deal primarily with the problems of malicious activity (theft by customers and staff). Only one (automated store stock ordering system) could be considered as a process failure-related measure.
The use of security personnel (security guards and plain clothed detectives) was also popular, with a significant proportion of respondents stating that they were in regular use in their stores. The least used measures were full time stock loss analysts (26%) and GPS monitoring systems on delivery vehicles (32%).

Stock Loss in European Retailers
ECR Europe Shrinkage Survey 2004 25
Table 5 Measures in use Measures in use Per cent Cash protection equipment: safes, caches 84
Intruder alarm systems 84
Live closed circuit television 77
Mystery shoppers 74
Electronic Article Surveillance equipment (EAS) 71
Employee integrity checks 71
Plain clothes store detectives 71
Safer cases or protector boxes 71
Automated store stock ordering system 68
Random till checks 68
Checking stock deliveries at the store (at SKU level) 65
Regular counts on vulnerable lines 65
Staff searches 65
Analysis of EPOS data/Data mining 61
Stock loss database 61
Uniformed security guards 61
External security measures: shutters, bollards, fences 58
Unique PIN numbers for till operators 58
Dummy closed circuit television 55
Process review team 55
Specialist display equipment (fixed) 48
EPOS/CCTV linkage software 45
Dummy cards/Empty boxes on display 39
GPS on delivery lorries 32
Full time stock loss analysts 26
3.6 Setting Targets and Rewarding Staff The ECR Europe shrinkage survey was also interested in finding out how organisations used incentives to encourage their staff to prioritise the problem of stock loss. Detailed below are responses to a series of questions focusing on this issue: whether a company set an annual target for stock loss; which members of staff were given such a target; whether bonuses were given for good stock results; and which staff were given such bonuses (Figures 13, 14, 15, and 16).
The vast majority of respondents stated that they did set an annual target for stock loss (90%), with only 1 in 10 companies stating that this was not a company policy.

Stock Loss in European Retailers
ECR Europe Shrinkage Survey 2004 26
Figure 13 Annual target set for stock loss
Yes90%
No10%
Store managers were the most likely to be given an annual target for stock loss, with over two thirds of respondents choosing this category of staff (70%). This was then followed by regional managers (56%) and then members of the security department (48%). The group least likely to be given an annual target were buyers, with only one respondent stating that they used this approach. This data broadly reflects the commonly held view about the groups most likely to have a direct impact upon levels of loss – store managers work on the shop floor and make daily decisions concerning stock loss, whereas buyers are seen to be at some distance from the ‘sharp end’ of stock loss.
Figure 14 Members of staff given an annual target for stock loss
0
10
20
30
40
50
60
70
80
Per
cen
t
StoreManagers
RegionalMangmt
Security Dept Buyers
An even more direct mechanism for generating interest in managing stock loss than annual targets is to provide bonuses to staff for good shrinkage results (Figure 15). A majority of respondents stated that they did not have a policy of paying bonuses to staff (62%) – a much smaller proportion than those that set annual targets for stock loss. Well over one-third did provide such an incentive scheme (38%).
Stock Loss in European Retailers
ECR Europe Shrinkage Survey 2004 27
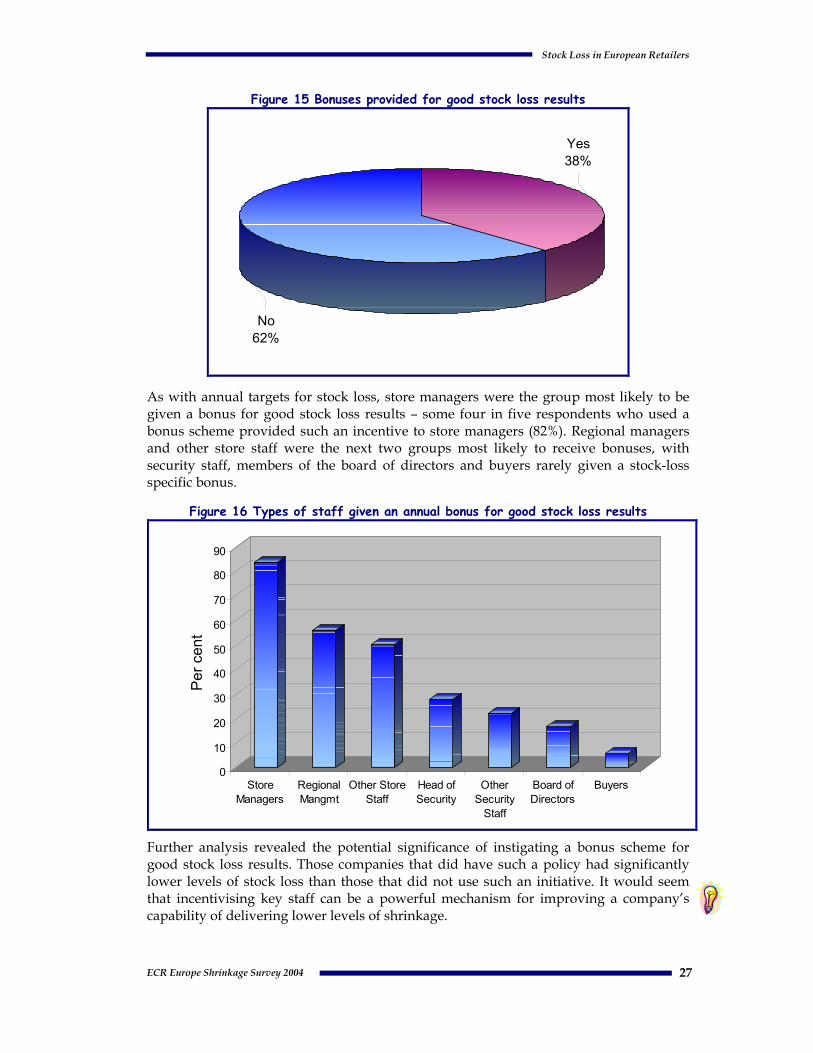
Figure 15 Bonuses provided for good stock loss results
Yes38%
No62%
As with annual targets for stock loss, store managers were the group most likely to be given a bonus for good stock loss results – some four in five respondents who used a bonus scheme provided such an incentive to store managers (82%). Regional managers and other store staff were the next two groups most likely to receive bonuses, with security staff, members of the board of directors and buyers rarely given a stock-loss specific bonus.
Figure 16 Types of staff given an annual bonus for good stock loss results
0
10
20
30
40
50
60
70
80
90
Per
cen
t
StoreManagers
RegionalMangmt
Other StoreStaff
Head ofSecurity
OtherSecurity
Staff
Board ofDirectors
Buyers
Further analysis revealed the potential significance of instigating a bonus scheme for good stock loss results. Those companies that did have such a policy had significantly lower levels of stock loss than those that did not use such an initiative. It would seem that incentivising key staff can be a powerful mechanism for improving a company’s capability of delivering lower levels of shrinkage.

Stock Loss in European Retailers
ECR Europe Shrinkage Survey 2004 28
3.7 Carrying Out Shrinkage Reduction Projects Much of the work of the ECR Europe Shrinkage Group has been focused upon encouraging organisations to develop collaborative projects to target the problem of stock loss (particularly using the ECR Europe Shrinkage Road Map). The current survey therefore offered an opportunity to measure the extent to which organisations were actively involved in stock loss projects and the nature of any independent evaluation methodology (Figures 17 and 18).
Figure 17 Number of stock loss projects undertaken in past 12 months
6 or more32%
3-539%
1-216%
None13%
The survey data was encouraging in that relatively few respondents said that they had not been involved in any projects in the last 12 months – only 13 per cent. In contrast, nearly two-fifths had been involved with between 3 and 5 projects (39%), while about one-third had been particularly active, engaging with 6 more stock loss projects.
Further analysis showed a clear negative correlation between involvement in stock loss reduction projects and lower levels of stock loss. Those companies that were the most actively involved in carrying out experiments, trials and projects to tackle the stock loss problems they faced, were far more likely to have significantly lower levels of stock loss. The message would seem clear – a willingness to innovate and adapt pays dividends.
The survey also asked respondents the extent to which they used independent evaluation as part of their stock loss projects (Figure 18).

Stock Loss in European Retailers
ECR Europe Shrinkage Survey 2004 29
Figure 18 Use of independent evaluation
No83%
Yes17%
As can be seen, the majority of companies did not adopt such an approach (83%) with less than one in five indicating that they did incorporate a degree of ‘outside’ assessment. Of those that did use independent evaluation, the largest proportion stated that they relied upon security equipment providers to perform this role (42%). Only a small minority indicated that they used either security consultants or academics. This data raises two issues. First, in order to ensure rigour and robustness in any findings from stock loss projects an evaluation methodology needs to be properly designed and focused upon generating results that relate specifically to the aims and objectives originally stated for the project. Secondly, considerable concerns abound about the extent to which stock loss projects have been evaluated by the self interested and the untrained. All too often, interested parties can generate statistics to satisfy their own particular agenda. The data from this survey would suggest that too many companies are relying upon third party groups who may have a less than impartial perspective when evaluating stock loss reduction projects.


Stock Loss in European Retailers
ECR Europe Shrinkage Survey 2004 31
4 WORKING WITH OTHERS The final part of the survey was interested in finding out the extent to which European retailers were aware of the ECR Europe Shrinkage Group and its Shrinkage Road Map, and the extent to which companies were currently co-operating with other organisations.
4.1 Awareness of ECR Europe Shrinkage Group As can be seen in Figure 19, the vast majority of respondents did know of the existence of the ECR Europe working group (90%), with only a relatively small proportion not being aware.
Figure 19 Awareness of the ECR Europe Shrinkage Working Group
Yes90%
No10%
When asked if they were aware of the ECR Europe Shrinkage Road Map, two thirds of respondents stated that they had heard of this initiative, with the remaining one-third not being aware (35%).

Stock Loss in European Retailers
ECR Europe Shrinkage Survey 2004 32
Figure 20 Awareness of the ECR Europe Shrinkage Road Map
Yes65%
No35%
The survey then went to ask those that were aware of the Road Map, whether they had made use of it (Figure 21). Overall, three quarters of those that had heard of the Road Map had actually made use of the methodology within their organisation (75%).
Figure 21 Used ECR Europe Shrinkage Road Map
Yes75%
No25%
The final question in this sequence was then to ask users of the Road Map to assess its overall usefulness to them (Figure 22). As can be seen, all respondents thought that it was of use, with 92 per cent thinking it was either very useful or quite useful. In overall terms, this is a ringing endorsement for the ECR Europe Shrinkage Road Map, although the Group should look to ways of increasing awareness of the Road Map and converting those that are aware to those that are users.

Stock Loss in European Retailers
ECR Europe Shrinkage Survey 2004 33
Figure 22 Perceived usefulness of the ECR Europe Shrinkage Road Map
0
10
20
30
40
50
60
70
Per
cen
t
Very Useful Quite Useful SomewhatUseful
Not Useful at all
4.2 Working With Other Groups The final question asked retailers to estimate the extent to which they worked with other groups in the past 12 months, ranging from security equipment providers, through the police and security consultants, to other retailers, manufacturers and academics (Figure 23).
Figure 23 Working with others to deal with stock loss
0% 20% 40% 60% 80% 100%
Per cent
Academics
Rep. Groups for FMCG
Other Retailers
3PL Providers
Joint Groups of Ret. and Manuf.
Security Consultants
Police
Individual Manufacturers
Security Equipment Suppliers
High Involved Regularly Involved Hardly Involved

Stock Loss in European Retailers
ECR Europe Shrinkage Survey 2004 34
Some 68 per cent respondents said that they were highly involved with security equipment suppliers, with individual manufacturers and the police being the next two groups who retailers were the most involved with (43% and 41% respectively). There was much less involvement with joint groups of retailers and manufacturers (21%), Third Party Logistics Providers (18%), other retailers (18%), and very little contact with representative groups for the FMCG sector (12%) and academics (7%).

Section II
STOCK LOSS IN RETAIL DISTRIBUTION


Stock Loss in Retail Distribution
ECR Europe Shrinkage Survey 2004 37
1 EXTENT OF STOCK LOSS A total of 19 retailers were able to complete the additional questionnaire on shrinkage and stock loss control in their supply chain. For the most part the questionnaire covered similar areas to the main survey instrument, although it included additional questions focused on issues such as pick accuracy and the organisation of the supply chain. The survey did not, however, go into any significant detail about expenditure and methods adopted to deal with shrinkage, as pilot research had indicated that retailers would be unable to answer these types of questions.
1.1 Size of the Problem Respondents were asked what the total value of stock loss at retail value as a percentage of total sales was from their retail distribution centre (RDC) network. The average was calculated at 0.38 per cent, which equates to €3.82 billion. This is markedly different from the data presented earlier in the Report, which suggested that known store losses equated to €1.2 billion. The difference is considerable – threefold and is probably explained by respondents basing their response to the main survey upon perception rather than fact. If the new figure of 0.38% is used, then supply chain losses account for 21 per cent of all losses. It is important to recognise, however, that losses in the supply chain do not necessarily mean losses for the organisation – the stock in error will very often stay within the organisation (going to the wrong store, overstocking etc). It would be wrong, therefore, to use this distribution loss figure in isolation. Of more concern is that the 0.38 per cent figure indicates a considerable degree of error, which could potentially be used as a cover for malicious activity.
1.2 Awareness of Loss The rate of awareness of the problem of stock loss in the supply chain was markedly similar to the results generated by the main survey (Figure 24). Just over one-half (52%) of stock loss was known (in the main survey it was 49%). Once again, this means that nearly one-half of the losses within the supply chain are unknown – staff do not know where, when or how incidents occurred. In many respects it was anticipated that levels of awareness would be higher in the supply chain, after all, RDCs do not have the added complication of customers entering their facilities that stores do. The flip side of course is that RDCs have to deal with considerably higher volumes of stock than stores. Either way, levels of transparency within the supply chain are as poor as in the rest of the organisation.

Stock Loss in Retail Distribution
ECR Europe Shrinkage Survey 2004 38
Figure 24 Percentage of loss that is known and unknown
1.3 Causes of Stock Loss Respondents were then asked to estimate the key causes of stock loss in the supply chain (process failure, internal theft, external theft, inter-company fraud) (Figure 25).
Figure 25 Causes of stock loss
Process Failure71%
Internal Theft13%
External Theft7%
Inter-Company Fraud
9%
Nearly three-quarters of stock loss was thought to be caused by process failures (71%), with internal theft the next largest proportion (13%), then inter company fraud (9%), with external theft (7%) accounting for only a small amount of total losses. This contrasts with findings from the main survey, where process failure was the third largest factor (27%) behind external and internal theft. This is not surprising given the nature of the threats posed within the RDC network – customers are not present and the volume of stock movements is more likely to test and strain existing processes and procedures.
Unknown Losses
48%
Known Losses52%

Stock Loss in Retail Distribution
ECR Europe Shrinkage Survey 2004 39
2 RECORDING AND AUDITING STOCK LOSS
2.1 Measuring Loss There was relatively little difference in the method used to calculate stock loss results between the two surveys – most organisations included known and unknown losses, stock going out of date and damage. Not surprisingly, the RDC survey found that losses in RDCs and while goods were in transport were more likely to be included in the stock loss calculation for supply chain losses (Figure 26).
Figure 26 Types of shrinkage used to calculate company stock loss statistics
0102030405060708090
100
Unkno
wn
Known
Out of
Date
Damag
e
Donati
ons
Other P
roces
s
Loss
es at
RDCs
Loss
es in
Transp
ort
Per c
ent
Once again, the data on the levels within the organisation that stock loss was measured (company wide, DC, category and SKU) was very similar to the main survey. The key difference was that supply chain respondents were less able to measure at the DC level (32%) compared with the main survey respondents who recorded a high degree of capability to measure stock loss at the store level (84%). This is probably explained by the overall emphasis within most organisations to traditionally concentrate their stock loss efforts almost exclusively in the stores. The other key difference was that supply chain respondents were less able to collect information at the SKU level compared with their counterparts in the rest of the organisation.

Stock Loss in Retail Distribution
ECR Europe Shrinkage Survey 2004 40
Figure 27 Levels at which stock loss can be measured
0
10
20
30
40
50
60
Per c
ent
Company DC Category SKU
2.2 Checking Pick Accuracy The supplementary survey then went on to ask respondents whether they checked the pick accuracy of their staff in their RDCs (Figure 28). As can be seen, the vast majority of retailers suggested that they did check pick accuracy (89%), with only 11 per cent stating that they did not.
Figure 28 Whether pick accuracy is checked
No11%
Yes89%
The survey then went to ask respondents what their rate of pick accuracy was in the previous 12 months. The average rate was 98.74 per cent, which equates to an overall error rate of 1.26 per cent. This is an extremely significant figure – in financial terms this is the equivalent of €12.64 billion a year of stock errors by European retail distribution. As stated earlier, this is not to suggest that such an enormous figure is necessarily being lost by the European retail companies – the stock is usually somewhere within the organisation. What is more important is that such a high degree of error is likely to cause

Stock Loss in Retail Distribution
ECR Europe Shrinkage Survey 2004 41
two key problems. First, it can lead to an increase in process-related shrinkage such as increased handling damage (misdirected stock having to travail the supply chain more than anticipated), or date sensitive stock not reaching the correct location in time and being destroyed. Secondly, it can generate a considerable amount of ‘noise’ within the supply chain reducing the capability of an organisation to monitor stock levels and collect data accurately on the true picture of shrinkage (stock loss occurring in the supply chain is more likely to be ‘washed’ down into the stores). It can also act as a convenient cover for malicious activity by staff and suppliers – staff will quickly realise that the system is incapable of tracking stock accurately and therefore exploit the loopholes and uncertainties this generates. In other words, a 1.26 per cent primarily process-driven error can be used to emasculate incidents of theft and fraud by company employees and their suppliers.
2.3 Compensating for Error Given the degree of error outlined earlier, it is interesting to go on to evaluate the extent to which the retail supply chain compensated stores for picking errors (Figure 29). Respondents were given three options: yes, where an annual percentage is agreed to be credited to the stores; yes, where stores are compensated when they can provide proof of error; and finally no, stores are never compensated for picking errors.
Figure 29 Claiming compensation for delivery errors
Most respondents (62%) suggested that compensation was given if stores could provide proof of error, while one fifth (19%) said that they provided an annual percentage to all stores. Taken together, over four fifths (81%) offered stores some form of compensation. In contrast, 19 per cent of respondents suggested that they did not compensate stores whatsoever. In some respects this is encouraging in that the ‘wash down’ of stock loss to the stores is partly counteracted by this process. However, what is not clear is the degree to which stores are capable of providing proof of error to the retail distribution network – many large organisations have a policy of not checking stock as it arrives at the store (the volumes are too great and the benefits of checking are not considered cost effective). In which case, perhaps as few as one-fifth of companies provide a routinised approach to compensating stores for distribution failures.
Yes (proof of error)62%
No19%
Yes (annual % agreed)
19%


Stock Loss in Retail Distribution
ECR Europe Shrinkage Survey 2004 43
3 RESPONDING TO THE PROBLEM The final section of the supplementary survey on retail distribution focused on the extent to which stock loss was prioritised and the areas on which the stock loss budget was spent. Unfortunately, most respondents were not able to answer the question on the overall budget for shrinkage control (most stated that it was impossible to separate the overall stock loss budget between the various categories provided). Respondents were able, however to answer two questions: the extent to which stock loss was prioritised in the company, and the overall focus of stock loss expenditure.
3.1 Company Prioritisation As can be seen, just over one-half of respondents (52%) suggested that stock loss within the organisation was a high priority, with 42 per cent stating it was a medium priority. Only 5 per cent considered it a low priority. This data is comparable with the findings presented in the first section of the report.
Figure 30 Perceived priority of stock loss within the organisation
0
10
20
30
40
50
60
Per c
ent
High Medium Low None
3.2 Spending on Shrinkage Control Finally, respondents to the supplementary survey were asked to estimate the extent to which stock loss expenditure was focused on the four types of shrinkage (inter-company fraud, process failures, internal and external theft) (Figure 31).

Stock Loss in Retail Distribution
ECR Europe Shrinkage Survey 2004 44
Figure 31 Expenditure on various types of stock loss
Inter-Company Fraud20%
External Theft24%
Internal Theft23%
Process Failure33%
Respondents were of the view that one third of stock loss expenditure was spent on controlling process failures (33%), with a further one quarter being used to target external theft (24%), and a similar amount being used to try and control internal theft (23%). The remaining one fifth of expenditure was deemed to be spent on inter company fraud (20%). In many respects this data is somewhat at odds with the nature of the threat posed to the supply chain (see Section 1.3). Respondents felt that nearly three quarters of their shrinkage problem was caused by process failure while external theft only accounted for 7 per cent and internal theft 13 per cent. Once again, external theft is over prioritised in the apportionment of the stock loss budget – the continuing retail obsession with the threat from ‘outsiders’ seems to be pervasive throughout the entire organisation.

Section III
CONCLUSIONS

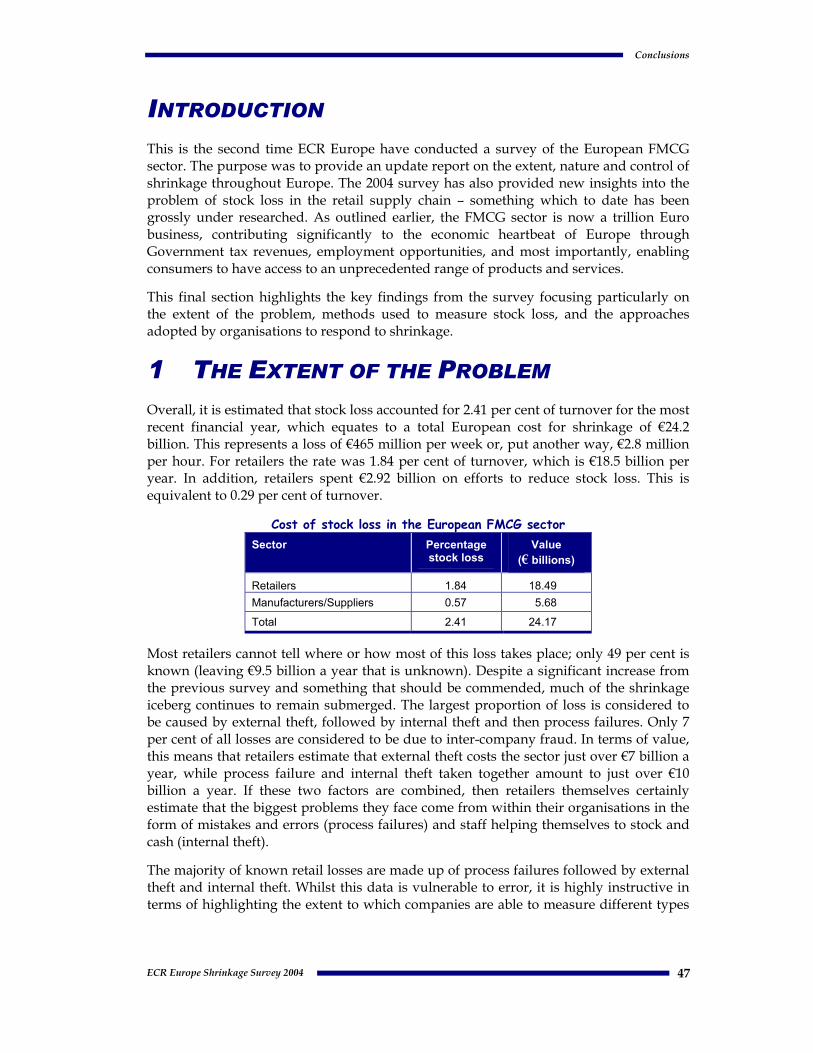
Conclusions
ECR Europe Shrinkage Survey 2004 47
INTRODUCTION This is the second time ECR Europe have conducted a survey of the European FMCG sector. The purpose was to provide an update report on the extent, nature and control of shrinkage throughout Europe. The 2004 survey has also provided new insights into the problem of stock loss in the retail supply chain – something which to date has been grossly under researched. As outlined earlier, the FMCG sector is now a trillion Euro business, contributing significantly to the economic heartbeat of Europe through Government tax revenues, employment opportunities, and most importantly, enabling consumers to have access to an unprecedented range of products and services.
This final section highlights the key findings from the survey focusing particularly on the extent of the problem, methods used to measure stock loss, and the approaches adopted by organisations to respond to shrinkage.
1 THE EXTENT OF THE PROBLEM Overall, it is estimated that stock loss accounted for 2.41 per cent of turnover for the most recent financial year, which equates to a total European cost for shrinkage of €24.2 billion. This represents a loss of €465 million per week or, put another way, €2.8 million per hour. For retailers the rate was 1.84 per cent of turnover, which is €18.5 billion per year. In addition, retailers spent €2.92 billion on efforts to reduce stock loss. This is equivalent to 0.29 per cent of turnover.
Cost of stock loss in the European FMCG sector Sector Percentage
stock loss Value
(€ billions)
Retailers 1.84 18.49 Manufacturers/Suppliers 0.57 5.68
Total 2.41 24.17
Most retailers cannot tell where or how most of this loss takes place; only 49 per cent is known (leaving €9.5 billion a year that is unknown). Despite a significant increase from the previous survey and something that should be commended, much of the shrinkage iceberg continues to remain submerged. The largest proportion of loss is considered to be caused by external theft, followed by internal theft and then process failures. Only 7 per cent of all losses are considered to be due to inter-company fraud. In terms of value, this means that retailers estimate that external theft costs the sector just over €7 billion a year, while process failure and internal theft taken together amount to just over €10 billion a year. If these two factors are combined, then retailers themselves certainly estimate that the biggest problems they face come from within their organisations in the form of mistakes and errors (process failures) and staff helping themselves to stock and cash (internal theft).
The majority of known retail losses are made up of process failures followed by external theft and internal theft. Whilst this data is vulnerable to error, it is highly instructive in terms of highlighting the extent to which companies are able to measure different types

Conclusions
ECR Europe Shrinkage Survey 2004 48
of problem within their organisations – they are relatively good at capturing process problems, but less capable when it comes to issues of theft.
Stores were perceived to be the location where the vast majority of shrinkage took place – over 90 per cent of all loss is seen to happen in the outlets (€17.3 billion). Just 7 per cent is thought to occur at the RDCs or when goods are in transit from them to the stores (€1.2 billion).
2 MEASURING THE PROBLEM A key debate in Europe has been the most appropriate method for measuring stock loss – some companies calculate it using retail prices, others use cost price, while a third group use cost price plus an agreed amount for the cost of handling goods. The survey found that the most popular method adopted by European retailers was to consider stock loss at retail sales value, followed by cost price, with only a very small percentage using the cost price plus model. Within the calculation all respondents included unknown losses, with nine in ten stating they also included all known losses. Between 77 per cent and 61 per cent of respondents usually included traditional process failures such as out of date stock, price mark downs and damaged stock. A slightly different picture emerged when losses occurred in the supply chain – only 58 per cent of companies said that they included losses in the RDCs when calculating stock loss, while even fewer included losses that incurred while goods were being transported between RDCs and stores. Finally only a small minority included losses that were sustained while third party logistics suppliers were being used. A European consensus would seem to be to calculate stock loss at retail prices and include known and unknown losses, together with key process failures and losses taking place in RDCs.
The survey also found that nearly one-third of respondents did not collect company-wide information about stock loss. Clearly for these companies, the development of a more strategic overview of the problem of shrinkage is not possible. This is often critical if stock loss practitioners are to generate the necessary Board level support required to introduce new approaches to dealing with the problem.
3 TACKLING STOCK LOSS The vast majority of companies taking part in the survey did not have a written corporate stock loss policy – less than 1 in 5 had such a document. What is interesting is that those companies with a corporate policy had significantly lower levels of stock loss than those companies that did not – embedding stock loss reduction may be an important component in reducing levels of shrinkage.
The majority of companies said that stock loss was considered to be a high priority within their company, followed by about one-third who thought it to be of medium priority and one in ten who considered it to be of low priority. Further analysis showed that there was a negative correlation between level of priority and the extent of stock loss within a company. In other words, those companies that considered stock loss to be a high priority had lower levels of stock loss.
In the last financial year, the survey data suggests that European retailers spent €2.92 billion on efforts to reduce stock loss. This accounted for 0.29 per cent of turnover. Just

Conclusions
ECR Europe Shrinkage Survey 2004 49
under one-half of all expenditure is spent on shrinkage personnel (contract security staff and in house specialist teams), while a further €151 million is spent on training staff in dealing with stock loss. Direct product protection systems (Electronic Article Surveillance, Closed Circuit Television and specialist display equipment) accounted for 28 per cent of all expenditure (€698 million), while spending on measures taken to protect buildings (intruder alarms and external security measures) was €347 million (12%).
Respondents estimated that 60 per cent of their total expenditure on stock loss was spent on controlling external theft, compared with 27 per cent on internal theft and then 9 per cent on process failure and just 4 per cent on inter-company fraud. Compared with how respondents perceived the extent of the problem and available data on known losses, a starkly contrasting picture emerges. External theft is seen to account for 38 per cent of all losses and just one-quarter of known losses, and yet nearly two thirds of all expenditure is focused on this problem. In terms of internal theft, there is approximate parity between expenditure and perceived extent of the problem (all losses), although in terms of known losses, expenditure is greater than the extent of the problem.
Expenditure on process failures is estimated at just 9 per cent and yet for all losses it is thought to represent one-quarter of the problem, and for known losses, it accounts for just over one-half of the problem. This data is also highly indicative of an ongoing over emphasis upon ‘crime’ as the key focus of shrinkage management, in particular the threat posed by shoplifters. It also highlights the influence of security equipment providers, who tend to have readily available (and often expensive) high tech ‘solutions’ for external theft, while fixing process failures can often be rather low tech and inexpensive (for instance ensuring compliance and suitability of practices to circumstances).
The vast majority of respondents stated that they did set an annual target for stock loss, with only 1 in 10 companies stating that this was not a company policy. A majority of respondents stated that they did have a policy of paying bonuses to staff. A key finding was that those companies that did have such a policy had significantly lower levels of stock loss than those that did not use such an initiative. It would seem that incentivising key staff can be a powerful mechanism for improving a company’s capability of delivering lower levels of shrinkage.
Involvement in stock loss reduction projects was also found to be an important indicator in identifying companies with lower levels of loss. Those companies that were the most actively involved in carrying out experiments, trials and projects to tackle the stock loss problems they faced, were far more likely to have significantly lower levels of stock loss. The message would seem clear – a willingness to innovate and adapt pays dividends.
The majority of companies involved in stock loss projects did not use external evaluators – less than one in five. Of those that did the largest proportion relied upon security equipment providers to perform this role. Only a small minority indicated that they used either security consultants or academics. This data raises two issues. First, in order to ensure rigour and robustness in any findings from stock loss projects an evaluation methodology needs to be properly designed and focused upon generating results that relate specifically to the aims and objectives originally stated for the project. Secondly, considerable concerns abound about the extent to which stock loss projects have been evaluated by the self interested and the untrained. All too often, interested groups can

Conclusions
ECR Europe Shrinkage Survey 2004 50
generate statistics to satisfy their own particular agenda. The data from this survey would suggest that too many companies are relying upon third party groups who may have a less than impartial perspective when evaluating stock loss reduction projects.
4 WORKING TOGETHER AND WITH OTHERS Shrinkage is a problem that transcends departmental and company boundaries – it is something that requires genuine partnership and co-operation if it is to be managed efficiently and effectively. The 2004 survey sought to establish the extent to which departments within an organisation were involved in dealing with the problem of shrinkage. In addition, the survey asked respondents to estimate the degree to which they worked with other organisations, such as other retailers, manufacturers, representative groups and equipment providers.
As to be expected, most companies stated that the security/loss prevention department and store managers were highly involved. In a significant departure from the data collected in the last survey, however, the Board of Directors was the next highest rated group (in the previous survey, they were ranked 7th). The fourth group to be perceived to be highly involved in stock loss was the audit department. These four groups were considered to be the most involved of all organisational teams. Perhaps of more interest were those groups that were considered to be hardly or rarely involved in issues of stock loss. Those deemed to be the least involved were the buying, human resources, IT, legal, and marketing departments, with only a small proportion of respondents stating that they were regularly involved. Without doubt, each of these departments could play a role in dealing with shrinkage. For instance, company buyers need to be aware of the potential problems new products may pose, both in terms of risk from process failures and from theft. Similarly, the marketing department clearly need to take account of the risks associated with particular products and the way they are displayed in stores, including the implications of promotional displays on existing security equipment (for instance, will proposed signage obscure CCTV cameras or lines of sight for members of staff?). Likewise, IT departments could look at their existing systems and see whether some of the concerns raised earlier in this report about different types of process failure could be ‘designed out’. Finally, the legal department could become involved in a number of different ways, including looking at how the existing legislative framework could be used to protect the company against, say persistent shoplifters.
More detailed analysis also revealed the importance of intra company co-operation in keeping stock loss low. There was a negative correlation between the overall level of co-operation expressed by respondents and levels of stock loss. In other words, those companies that indicated high levels of cross-company involvement were also those companies that had lower levels of stock loss.
In terms of working with other organisations, some 68 per cent of respondents said that they were highly involved with security equipment suppliers, with individual manufacturers and the police being the next two groups who retailers were the most involved with. There was much less involvement with joint groups of retailers and manufacturers, Third Party Logistics Providers, other retailers, and very little contact with representative groups for the FMCG sector and academics. Despite the efforts of ECR and other representative organisations to encourage further co-operation, retailers

Conclusions
ECR Europe Shrinkage Survey 2004 51
are still operating to a large extent in isolation (with the exception of equipment providers).
5 STOCK LOSS IN RETAIL DISTRIBUTION A major addition to the ECR Europe Shrinkage Survey in 2004 was an additional questionnaire focused on the problem of stock loss in the supply chain. While not all retailers were able to complete this research instrument (which is an interesting finding in itself, suggesting a lack of systems in place to measure and monitor the problem within the supply chain), the supplementary survey revealed some interesting findings.
Respondents were asked what the total value of stock loss at retail value as a percentage of total sales was from their retail distribution centre (RDC) network. The average was calculated at 0.38 per cent, which equates to €3.82 billion. This is markedly different from the data collected as part of the main survey, which suggested that known store losses equated to €1.2 billion. The difference is considerable – three fold and is probably explained by respondents basing their response to the main survey upon perception rather than fact. If the new figure of 0.38% is used, then supply chain losses account for 21 per cent of all losses. It is important to recognise, however, that losses in the supply chain do not necessarily mean losses for the organisation – the stock in error will very often stay within the organisation (going to the wrong store, overstocking etc). However, the 0.38 per cent figure indicates a considerable degree of error, which could potentially be used as a cover for malicious activity.
The rate of awareness of the problem of stock loss in the supply chain was markedly similar to the results generated by the main survey. Just over one-half (52%) of stock loss was known (in the main survey it was 49%). Once again, this means that nearly one-half of the losses within the supply chain are unknown – staff do not know where, when or how incidents occurred. It would seem that levels of transparency within the supply chain are as poor as in the rest of the organisation.
Nearly three-quarters of stock loss was thought to be caused by process failures, with internal theft the next largest proportion, and then inter company fraud, with external theft accounting for only a small amount of total losses. This contrasts with findings from the main survey, where process failure was the third largest factor (27%) behind external and internal theft. This is not surprising given the nature of the threats posed within the RDC network – customers are not present and the volume of stock movements is more likely to test and strain existing processes and procedures.
A critical finding was that the overall pick accuracy average rate was 98.74 per cent, which equates to an overall error rate of 1.26 per cent. This is an extremely significant figure – in financial terms this is the equivalent of €12.64 billion a year of stock errors by European retail distribution. As stated earlier, this is not to suggest that such an enormous figure is necessarily being lost by the European retail companies – the stock is usually somewhere within the organisation. What is more important is that such a high degree of error is likely to cause two key problems. First, it can lead to an increase in process-related shrinkage such as increased handling damage (misdirected stock having to travail the supply chain more than anticipated), or date sensitive stock not reaching the correct location in time and being destroyed. Secondly, it can generate a considerable amount of ‘noise’ within the supply chain reducing the capability of an organisation to

Conclusions
ECR Europe Shrinkage Survey 2004 52
monitor stock levels and collect data accurately on the true picture of shrinkage (stock loss occurring in the supply chain is more likely to be ‘washed’ down into the stores). It can also act as a convenient cover for malicious activity by staff and suppliers – staff will quickly realise that the system is incapable of tracking stock accurately and therefore exploit the loopholes and uncertainties this generates. In other words, a 1.26 per cent primarily process-driven error can be used to emasculate incidents of theft and fraud by company employees and their suppliers.
Respondents were of the view that one third of stock loss expenditure was spent on controlling process failures, with a further one quarter being used to target external theft, and a similar amount being used to try and control internal theft. The remaining one fifth of expenditure was deemed to be spent on inter company fraud. In many respects this data is somewhat at odds with the nature of the threat posed to the supply chain – respondents felt that nearly three quarters of their shrinkage problem was caused by process failure while external theft only accounted for 7 per cent and internal theft 13 per cent. Once again, external theft is over prioritised in the apportionment of the stock loss budget – the continuing retail obsession with the threat from ‘outsiders’ seems to be pervasive throughout the entire organisation.
6 CONCLUDING COMMENTS The 2004 ECR Shrinkage Survey has once again provided the FMCG sector with a unique series of benchmarks to compare their performance on dealing with stock loss. It has also highlighted the significant cost to the industry of the problem – €24 billion a year, or for retailers, 1.84 per cent of turnover – but it also highlights the extent of the opportunity as well. With the average profit margin in Europe being approximately 3%, tackling stock loss effectively could enable some companies to grow their profit margin by over 50 per cent. There can be few elements of the business that could potentially deliver such remarkable returns.
The survey also highlighted the continuing problem with a lack of transparency in the data on stock loss. While retailers are now better able to measure the problem, more than one half of loss remains unknown. This is an area that needs to be prioritised if organisations are to have the necessary foundations upon which to build an effective and efficient stock loss strategy. Moreover, it was found that those companies that had good levels of intra-company co-operation on stock loss, had a written company policy, prioritised the problem, incentivised their staff through bonuses for good stock loss results, and were prepared to experiment with shrinkage reduction projects, were far more likely to have lower overall levels of stock loss. The message would seem clear, high levels of co-operation, prioritisation, incentivisation, experimentation and the embedding of shrinkage control within corporate policy enable companies to reduce the cost of stock loss.
The data from the retail supply chain survey was also revealing in that it highlighted the considerable degree of error and ‘noise’ that is generated by this part of retail businesses. The data would seem to support the view that many of the problems of shrinkage that are found in retail stores could have been ‘washed down’ from the supply chain – perhaps as much as one quarter.

Conclusions
ECR Europe Shrinkage Survey 2004 53
The data also confirmed the findings from the main survey that companies tend to over prioritise the problem of external theft (particularly in terms of deciding on how to allocate the stock loss reduction budget) and under prioritise process failures and internal theft. Retailers would seem to have an abiding obsession with seeking to apportion blame for the problem of stock loss to those outside the company, despite their own evidence and perceptions telling them otherwise. It may be time for companies to begin to critically scrutinise those that work for them and the extent to which staff are able to exploit the chaos generated by the noise from supply chain inefficiency and the lack of adherence to processes and procedures. If not, then the opportunity to increase profits by as much as 50 per cent will remain unachievable.
SURVEY HIGHLIGHTS: 6 STEPS TO SUCCESSFUL SHRINKAGE REDUCTION
Written company policy
High levels of intra-company co-operation
Prioritise the problem
Incentivise staff
Conduct regular shrinkage reduction projects
Make use of the ECR Europe Road Map?

