shujiro urata - 財務省 behind the formation of such networks include the presence of wide gaps in...
TRANSCRIPT

Policy Research Institute, Ministry of Finance, Japan, Public Policy Review, Vol.10, No.1, March 2014 1
Japan’s Trade Policy with Asia
Shujiro UrataWaseda University
Abstract
Japan’s economic relations with Asian countries have rapidly become increasingly close in recent years, mainly through trade and direct investment. In Asia, Japanese companies have pursued a “fragmentation strategy,” which refers to breaking down production processes and assigning each process, through direct investment, to the country or region suited to implement it most efficiently. As a result, when a certain product is manufactured, its intermediate materials and parts are actively traded between production bases located in various Asian countries, leading to the formation of a regional production network. The formation of such networks has significantly contributed to the economic growth not only of Asian countries but also of Japan. Factors behind the formation of such networks include the presence of wide gaps in the quality of workers and the level of wages between Asian countries due to differences in the degree of economic development as well as the liberalization of policies on trade and direct investment in Asian countries. However, barriers on trade and direct investment remain. To further promote the economic growth of Japan and Asian countries, it is necessary to reduce and abolish such barriers. However, as trade liberalization negotiations under the auspices of the World Trade Organization have stalled, concluding free trade agreements with specific countries to liberalize bilateral/plurilateral trade and investment is one of the few effective policy options available. In Asia, many FTAs have been concluded, mainly involving member countries of the Association of Southeast Asian Nations (ASEAN). However, as for an FTA that covers the whole of Asia, negotiations have just started on the Regional Comprehensive Economic Partnership (RCEP). The negotiations will proceed with a target year of 2015 for the conclusion of an agreement. As the most developed country in Asia, Japan must actively exercise its leadership in designing a partnership that will contribute to the economic growth of Asian countries and concluding an agreement by the target year. When developing a trade policy toward Asia, Japan must firmly recognize that the growth of Asian countries is essential to its own growth.
Key words: FTA, RCEP, production networksJEL Classification: F13, F15, O53
I. Introduction
The Japanese economy continued to stagnate for the long period of time dubbed the lost two decades following the collapse of the bubble economy in the early 1990s. However,

2 S Urata / Public Policy Review
under the Liberal Democratic Party administration of Prime Minister Shinzo Abe, which began in 2012, the “three arrows” strategy was launched, and the signs of economic recovery began to be seen in early 2013. The three arrows refer to aggressive monetary easing, flexible public spending, and a growth strategy to spark private investment, and these constitute “Abenomics.” The aggressive monetary easing and flexible public spending have been implemented, but for the growth strategy, there has only recently been an announcement on June 14 titled the “Japan Revitalization Strategy.” This strategy consists of three action plans: a plan for the revitalization of Japanese industry, a strategic market creation plan, and a strategy of global outreach. However, it is expected that a certain amount of time will be necessary for implementation.
In response to the aggressive monetary easing, a rise in stock prices and a depreciation of the yen proceeded rapidly, and there were inflated hopes for an economic upturn. Afterwards, however, stocks fell and currently are continuing to fluctuate wildly, and the situation is that a feeling of uncertainty over the direction of the Japanese economy cannot be dispelled. Meanwhile, looking at the Japanese economy from a mid- to long-term, structural perspective, there are problems such as a declining population, a declining birthrate, an aging population, a severe fiscal situation, and a closed economy, and unless these problems are appropriately addressed, the future of the Japanese economy is expected to be quite gloomy.
Looking at the global economy, active monetary and fiscal policies were implemented in the US and European economies, which were subjected to the severe effects of the global financial crisis that began in 2008, and have thus gone into remission. On the other hand, the economies of the East Asian countries, including the emerging countries of China, India, Indonesia, and others, were negatively affected by the economic stagnation of the developed nations, but have continued solid growth. Intensification of international economic activities such as trade and foreign direct investment (FDI) has greatly contributed to promoting growth in the global economy. Based on this understanding, countries around the world have stressed the importance of promoting the Doha Round of multilateral trade liberalization negotiations launched in 2001 under the World Trade Organization (WTO), but the round ran aground due to differing ways of thinking among WTO member economies over how to proceed with trade liberalization negotiations. Amidst such circumstances, free trade agreements (FTAs) liberalizing trade between specific countries have come to be actively concluded among countries having the same mindset over trade liberalization. In fact, FTAs have become the most important trade policy means implemented in recent years.
In light of the observations above, this paper analyzes Japan’s trade policy with Asia that is desirable for the future of the Japanese economy. The conclusion is that one effective means for realizing growth and a revival of the Japanese economy is to build close relations with the countries of Asia, for which a high level of growth is anticipated, mediated by trade and investment, and a concrete trade policy is to establish wide-ranging FTAs with Asian countries. Below, Section 2 is an investigation of the trade and direct investment relationship of Japan with East Asia in recent years, and Section 3 considers Japan’s FTA strategy with East Asia based on the analysis in Section 2. Finally, Section 4 examines infrastructure

Policy Research Institute, Ministry of Finance, Japan, Public Policy Review, Vol.10, No.1, March 2014 3
export, which is an important trade policy theme not covered in the FTA policy analysis. It is hoped that the analysis in this paper can contribute to the implementation of the strategy of global outreach included in the Japanese growth strategy (Japan Revitalization Strategy).
II. Japanese trade and foreign direct investment with East Asia
When considering Japan’s trade strategy with Asia, a grasp of the trade and foreign direct investment (FDI) relationship between Japan and East Asia is indispensable. Thus, this section contains an analysis of Japan’s trade and direct investment relationship with East Asia in recent years. One important analysis result is that trade and FDI have been expanding greatly between Japan and East Asia, to build a close relationship through trade networks among them. Below, the trade and FDI relationship between Japan and East Asia in recent years is first elucidated, and then the factors behind it are analyzed.
II-1. The importance of East Asia in Japan’s expanding trade
Japanese trade with East Asia greatly expanded from 1990 to 2011. Exports from Japan to East Asia grew 4.9-fold from $96.3 billion to $469.2 billion (Figure 1A), while imports from East Asia expanded 5.3-fold from $66.2 billion to $354.1 billion (Figure 1B). During the same period, Japanese exports to the world and imports from the world respectively grew 2.8-fold and 3.5-fold, from $294.2 billion and $233.2 billion to $824.4 billion and $824.4 billion. Japanese trade (imports and exports) with East Asia expanded more greatly than that with the world, and so Asia’s share of Japanese trade (imports and exports) with the world increased.

4 S Urata / Public Policy Review
Fugire 1A Japanese Exports by Region
Source: compiled from RIETI, RIETI-TID 2012
Figure 1B Japanese Imports by Region
Source: compiled from RIETI, RIETI-TID 2012
East Asia’s share of Japanese exports to the world was 32.7% in 1990, but grew to 56.9% in 2011, which was a 24 percentage point rise over 21 years (Figure 1C). East Asia’s share of Japanese imports from the world rose 14 percentage points from 28.4% to 42.9%, which was lower than that of exports both in terms of the rate of increase and the actual share (Figure 1D). These figures indicate that to Japan, East Asia is more important as an export destination than as a source of imports. Although the US and the EU have traditionally been important trade partner countries/regions for Japan, their importance fell significantly over the 11 years

Policy Research Institute, Ministry of Finance, Japan, Public Policy Review, Vol.10, No.1, March 2014 5
from 1990.
Figure 1C Japanese Exports by Region (Shares)
Source: compiled from RIETI, RIETI-TID 2012
Figure 1D Japanese Imports by Region (Shares)
Source: compiled from RIETI, RIETI-TID 2012
The US share and the EU27’s share of Japanese exports to the world respectively stood at 31.4% and 22.9% in 1990, but had declined to 15.0% and 12.8% in 2011. Also, for Japanese imports as well, the US share and the EU27 share dropped greatly from 22.3% and 16.3% to 8.9% and 9.6% over the same period. A major reason why the US and EU27 shares of Japanese trade fell significantly while the East Asian share expanded greatly was the

6 S Urata / Public Policy Review
difference in economic growth rates between these countries/regions. For countries/regions achieving a high level of economic growth, export ability expands due to increased production and import demand expands due to increased income, resulting in a large increase in trade. Another reason why Japanese trade with East Asia grew significantly is the fact discussed later that Japanese businesses actively deployed strongly trade-oriented direct investment in East Asia.
The combined East Asian, US, and EU27 share of Japanese exports declined slightly from 87.1% to 84.6% in the 11 years from 1990. Also, the same share of Japanese imports decreased from 67.1% to 61.4%. The decrease in the share represented by these countries/regions in Japanese imports was due to the large import share taken by Russia and Middle Eastern countries, which have energy resources such as crude oil and natural gas.
Japanese trade with East Asia expanded rapidly, but there are major differences among the East Asian countries/regions in their trade relationships with Japan and in the changes in those relationships. If East Asia is subdivided into China, the newly industrializing economies (NIEs), including South Korea, Taiwan, Hong Kong, the Association of Southeast Asian Nations (ASEAN), and India, it can be understood that it is Japan’s trade relationship with China that has been greatly expanding (Figure 1C, Figure 1D). In fact, in terms of share of Japanese trade, it is only China that has been greatly expanding and no major change can be seen in the share of other countries/regions from 1990 to 2011. Looking at the concrete figures, China’s share of Japanese exports and imports in 1990 was respectively 3.0% and 5.1%, but in 2011 these had actually risen to 22.9% and 20.9%. The share of Japanese exports taken by the NIEs, ASEAN, and India during the same period only rose slightly, respectively from 16.7% to 19.3%, 12.5% to 13.5%, and 0.5% to 1.3%. Also, the share of Japanese imports taken by the NIEs, ASEAN, and India included a slight rise for ASEAN from 12.6% to 14.3%, but a small decrease for the NIEs and India from 9.8% to 6.9% and 0.9% to 0.8%.
Since it is anticipated that, as has been observed in recent years, the East Asian countries such as China and India will have a higher level of economic growth than the developed countries/regions such as the US and the EU, the fraction of Japanese trade represented by the East Asian countries is expected to expand even further than its current level.1
II-2. The commodity composition of Japanese trade with East Asia: Expansion of production networks
The economic relationship between Japan and East Asia is reflected in the commodity composition of their trade. Therefore, an investigation of the commodity composition of trade between Japan and the East Asian countries follows. From 1990 to 2011, the commodity composition of Japanese exports to the East Asian countries changed very little (Table 1). The largest share at the three points in time of 1990, 2000, and 2011 was held by electrical
1 See OECD (2012) and the like for future predictions of the economies of the East Asian countries, the developed countries, and the like.

Policy Research Institute, Ministry of Finance, Japan, Public Policy Review, Vol.10, No.1, March 2014 7
machinery, general machinery, chemical products, and ferrous and non-ferrous metal products. In particular, electrical machinery and general machinery each contributed a share of over 20% of overall exports at each point in time. For the record, the shares of chemical products and of ferrous and non-ferrous metal products were respectively 10% and 15%. Among other products, transport machinery and precision machinery had a relatively large share, and the remaining categories had a share of only a few percent. The commodity composition observed in exports to East Asia can similarly be observed in exports to China, the NIEs, and the ASEAN countries. The reason why there is a similarity in the Japanese export composition to each of these countries/regions is that since Japan is the most economically developed compared to these countries, the pattern of comparative advantage in the relationship with these countries is also similar. In other words, compared to China, the NIEs, and the ASEAN countries, Japan has a comparative advantage in high-tech products such as electrical machinery and general machinery, which require significant human resources having high-level abilities.

8 S Urata / Public Policy Review
Table 1 Product Composition of Japanese Trade with East Asian Countries
Source: Compiled from RIETI, RIETI-TID 2012
East Asia China NIES ASEAN1990 2000 2011 1990 2000 2011 1990 2000 2011 1990 2000 2011
ExportsFood and related agriculture, forestry and fisheries 1.1 0.8 0.7 0.7 0.6 0.1 1.3 1.1 1.4 0.8 0.4 0.6 Textile products 4.3 3.2 1.5 7.9 8.4 2.2 5.2 2.1 1.0 2.3 1.6 1.0 Pulp, paper and wood products 2.5 1.7 1.7 2.7 1.8 1.8 3.0 1.7 1.3 1.9 1.7 2.0 Chemical products 11.3 12.7 16.5 11.9 14.4 15.3 12.5 14.0 21.6 9.4 9.9 11.2 Petroleum and coal products 0.9 0.5 2.6 0.7 0.6 1.3 1.3 0.6 2.6 0.4 0.3 4.8 Cemaric and cement products 1.6 1.5 2.1 1.4 1.6 1.3 1.9 1.6 3.6 1.2 1.1 1.3 Iron and steel, nonferrous and metal products 11.9 10.2 15.5 17.8 11.2 11.7 10.0 9.2 16.6 13.0 10.9 20.4 General machinery 22.5 22.4 20.6 16.9 19.7 22.6 21.0 23.2 17.4 25.8 23.1 21.6 Electrical machinery 23.7 31.8 22.9 24.8 29.8 24.3 25.5 30.2 22.6 21.0 35.0 20.8 Home electronics, appliances 5.0 3.1 1.4 1.8 2.6 1.5 5.4 3.7 1.5 5.3 2.6 1.2 Transportation equipment 9.8 5.5 7.7 9.7 3.5 9.5 5.6 3.5 3.7 15.4 9.5 10.3 Precision machinery 2.3 4.6 5.1 1.2 3.9 7.1 2.8 6.4 4.3 1.9 2.3 2.9 Toys and sundries 3.2 2.0 1.8 2.5 1.8 1.2 4.5 2.6 2.5 1.6 1.5 1.7 Total 100.0 100.0 100.0 100.0 100.0 100.0 100.0 100.0 100.0 100.0 100.0 100.0 ImprortsFood and related agriculture, forestry and fisheries 13.9 9.0 6.3 16.0 10.6 5.4 16.0 7.1 5.4 11.4 8.7 8.2 Textile products 12.0 13.2 10.5 28.6 30.0 17.7 15.9 4.6 2.4 2.2 3.3 3.8 Pulp, paper and wood products 12.4 6.9 6.7 7.8 7.8 5.8 11.3 3.1 2.4 15.0 8.8 10.1 Chemical products 3.8 4.7 9.4 4.9 4.4 9.7 5.5 6.6 13.7 2.0 3.8 6.9 Petroleum and coal products 28.0 13.3 15.2 24.8 4.0 1.1 2.7 8.7 15.3 49.1 25.2 35.8 Cemaric and cement products 2.7 1.6 1.6 3.2 2.5 1.9 3.6 1.3 1.8 1.8 0.9 0.9 Iron and steel, nonferrous and metal products 9.0 5.5 8.9 5.0 4.2 6.4 12.7 8.2 18.3 7.8 5.0 8.1 General machinery 3.5 14.4 10.9 0.6 6.9 15.1 5.1 23.4 9.4 3.4 15.2 5.5 Electrical machinery 5.2 17.0 15.7 2.3 11.9 16.8 9.6 23.0 22.5 2.9 17.7 10.9 Home electronics, appliances 2.0 5.0 5.6 0.9 4.7 7.7 3.4 4.1 2.4 1.3 6.0 3.9 Transportation equipment 0.8 1.1 2.0 0.1 1.1 2.0 2.1 1.6 2.4 0.1 0.7 1.9 Precision machinery 0.5 2.1 1.9 0.1 1.8 2.1 0.9 3.4 2.1 0.4 1.6 1.6 Toys and sundries 6.2 6.1 5.2 5.7 10.1 8.1 11.2 4.8 2.0 2.6 3.3 2.5 Total 100.0 100.0 100.0 100.0 100.0 100.0 100.0 100.0 100.0 100.0 100.0 100.0
The Japanese import commodity composition from the East Asian countries changed from 1990 to 2011. While the share represented by products using natural resources in the form of food products, wood pulp, petroleum/coal products decreased, the share of machine products such as general machinery and electrical machinery rose greatly. These changes reflect the fact that industrialization has made progress in East Asia. Among such changes, textile products, which are a labor-intensive commodity, are maintaining a relatively high share. In contrast to the composition of Japanese export commodities, the Japanese import commodity composition contains large differences between imports from China, the NIEs, and ASEAN. Among import commodities from China, the share represented by food products, textile products, and petroleum/coal products fell significantly, while the share represented by electrical machinery, general machinery, and chemical products, expanded greatly. The largest share in 2011 was held by textile products, electrical machinery, and general machinery.

Policy Research Institute, Ministry of Finance, Japan, Public Policy Review, Vol.10, No.1, March 2014 9
In the import commodity composition from the NIEs, similar changes to those of the import commodity composition from China can be observed. Nevertheless, the import commodity composition in 2011 was very different from that from China. While electrical machinery had the highest share, intermediate goods such as ferrous and non-ferrous metal products, petroleum/coal products, chemical products, and the like also accounted for high shares. These differences in commodity composition result from the fact that the level of economic development of the NIE countries is higher than that of China. The number one import from ASEAN is petroleum/coal products. This is because imports of petroleum and coal products from Indonesia are large. Also, although the share accounted for by food products, wood pulp, and the like did decrease from 1990, they still stood at a relatively high value in 2011. In the backdrop to this import commodity composition from the ASEAN countries lies the fact that those countries have abundant natural resources.
Examining Japanese trade with the Asian countries paying attention to the attributes of the commodities, an interesting relationship between the two appears. Figure 2A and Figure 2B indicates the state of Japanese exports to and imports from East Asia, having classified commodities into raw materials (primary commodities), intermediate goods, and final goods. From these figures, it can be seen that intermediate goods hold a significant position among Japanese exports to East Asia. In fact, the intermediate good share of Japanese exports to East Asia rose from 61.5% to 69.1% from 1990 to 2011. Meanwhile, the share held by final goods decreased from 37.8% to 28.7% during the same period. The intermediate good share has been rising within Japanese imports from East Asia, but is not as high as that of Japanese exports to East Asia, final goods having the greatest share. The intermediate good share of Japanese imports from East Asia rose from 41.8% to 48.2% from 1990 to 2011, while the share of final goods rose from 37.0% to 44.0%. Another characteristic change in Japanese imports from East Asia is the large decrease in the raw material share from 21.2% to 7.8%. This change is not due to a decrease in Japanese imports of raw materials from East Asia, but is due to a great expansion in intermediate goods and final goods. In fact, Japanese imports of raw materials from East Asia during this period more than doubled, but the raw material share decreased due to an even greater increase in the import of intermediate goods and final goods. Specifically, the intermediate good share of trade among the East Asian countries during this time period rose from 54.2% to 64.4%, whereas the share of raw materials and final goods respectively dropped from 8.7% and 37.2% to 5.9% and 29.6%.

10 S Urata / Public Policy Review
Figure 2A Japanese Exports to Asia by Product
Source: compiled from RIETI, RIETI-TID 2012
Figure 2B Japanese Imports from Asia by Product
Source: compiled from RIETI, RIETI-TID 2012
Thus, the great rise of intermediate goods in the trade of East Asia and Japan has been observed, and in the backdrop to this lies the formation of production networks in East Asia.2 The production networks involve a system of production in which industries and corporations requiring a variety of processes and components in the production of a single product such as textiles or machine products divide the overall production process into steps, distribute these steps to the countries or regions where they can be most efficiently carried out through FDI, 2 See, for example, Kimura (2006) regarding the production network in East Asia.
Policy Research Institute, Ministry of Finance, Japan, Public Policy Review, Vol.10, No.1, March 2014 11
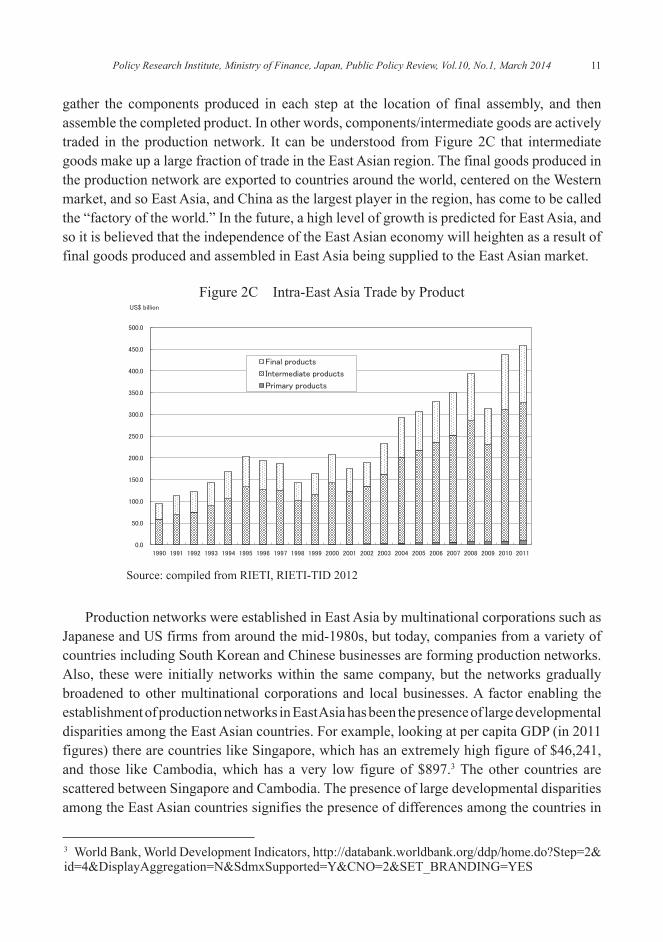
gather the components produced in each step at the location of final assembly, and then assemble the completed product. In other words, components/intermediate goods are actively traded in the production network. It can be understood from Figure 2C that intermediate goods make up a large fraction of trade in the East Asian region. The final goods produced in the production network are exported to countries around the world, centered on the Western market, and so East Asia, and China as the largest player in the region, has come to be called the “factory of the world.” In the future, a high level of growth is predicted for East Asia, and so it is believed that the independence of the East Asian economy will heighten as a result of final goods produced and assembled in East Asia being supplied to the East Asian market.
Figure 2C Intra-East Asia Trade by Product
Source: compiled from RIETI, RIETI-TID 2012
Production networks were established in East Asia by multinational corporations such as Japanese and US firms from around the mid-1980s, but today, companies from a variety of countries including South Korean and Chinese businesses are forming production networks. Also, these were initially networks within the same company, but the networks gradually broadened to other multinational corporations and local businesses. A factor enabling the establishment of production networks in East Asia has been the presence of large developmental disparities among the East Asian countries. For example, looking at per capita GDP (in 2011 figures) there are countries like Singapore, which has an extremely high figure of $46,241, and those like Cambodia, which has a very low figure of $897.3 The other countries are scattered between Singapore and Cambodia. The presence of large developmental disparities among the East Asian countries signifies the presence of differences among the countries in
3 World Bank, World Development Indicators, http://databank.worldbank.org/ddp/home.do?Step=2&id=4&DisplayAggregation=N&SdmxSupported=Y&CNO=2&SET_BRANDING=YES

12 S Urata / Public Policy Review
the abilities and wages of workers. The multinational corporations established production networks through FDI by distributing processes to countries/regions having an abundance of the human resources needed for each production step.
The establishment and expansion of production networks in East Asia greatly contributed to economic growth in the East Asian countries. By participating in production networks, the East Asian countries not only achieved an expansion in production and employment through increased trade and investment activity, but also realized greater production efficiency by importing superior technical and management knowhow through trade and FDI. Meanwhile, by taking advantage of the production networks in East Asia, Japanese corporations were also able to adopt an efficient division of labor system between the Japanese headquarters and the East Asian affiliates and became able to increase efficiency as entire companies.
Returning to trade between Japan and East Asia, it was observed that while intermediate goods account for an extremely high fraction of Japanese exports to East Asia, final goods make up a relatively high fraction of imports from East Asia. In this trade pattern between Japan and East Asia, Japan serves the role of supplying intermediate goods to East Asia and importing the final goods assembled there using those intermediate goods. It is expected that the developmental disparity between Japan and East Asia will gradually shrink, but since significant time will be required to eliminate that disparity, it is thought that Japan’s role in its relationship with East Asia as discussed above will not change over the long term. However, due to the high likelihood that the high level of growth in the East Asian countries will continue, rising incomes among the people of those countries resulting from the high growth is expected to increase demand for high-price final goods produced in Japan, and as a result, there is a high probability that the final good share of Japanese exports to East Asia will grow.
II-3. Japanese foreign direct investment in East Asia
In the previous section, it was observed that one of the characteristics of trade in East Asia in recent years is a large expansion in the trade in intermediate goods within production networks. Also, it was noted that foreign direct investment (FDI) by multinational corporations played a major role in the establishment of the production networks. Thus, this section examines the movement of FDI by Japanese corporations to Asia in recent years.
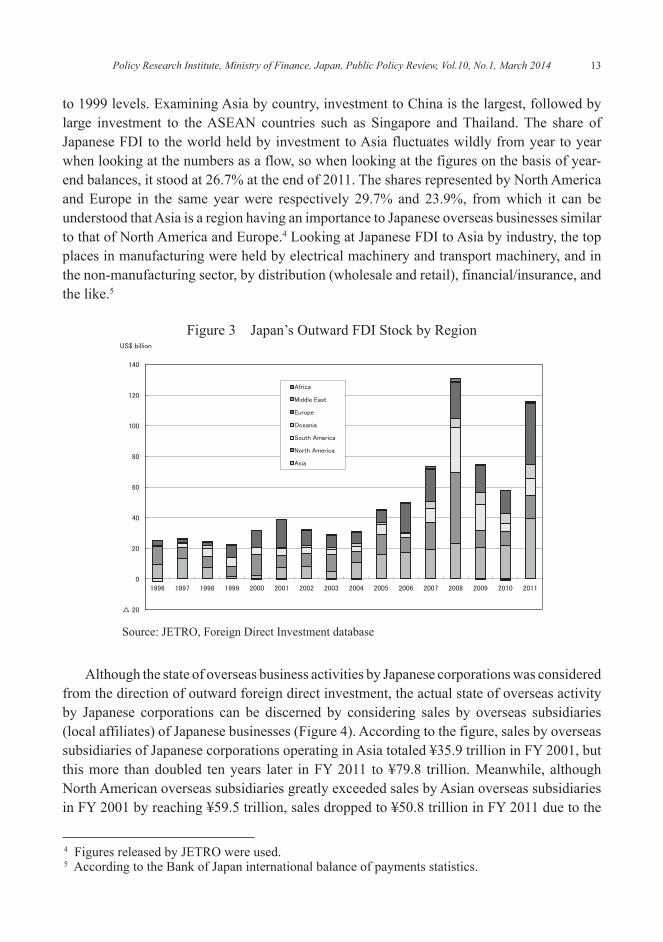
Japanese FDI in East Asia fell significantly due to the effect of the Asian currency crisis in the late 1990s, but it then recovered, expanding greatly into the 21st century (Figure 3). Specific numbers will thus be examined from 1996 onwards, during which period statistics are available by region for Japanese FDI (on an international balance of payments basis, as a flow). Japanese FDI to Asia stood at $9.8 billion in 1996, but it dropped after peaking at $13.1 billion when the Asian currency crisis occurred in 1997. Although dropping to $1.8 billion in 1999, it rapidly recovered, rising to $23.3 billion in 2008 when the global financial crisis arose. Although it fell in 2009, it recovered in 2010, and the rising trend continued to 2011 as well, reaching $39.5 billion that year. This was actually a 22-fold increase compared
Policy Research Institute, Ministry of Finance, Japan, Public Policy Review, Vol.10, No.1, March 2014 13
to 1999 levels. Examining Asia by country, investment to China is the largest, followed by large investment to the ASEAN countries such as Singapore and Thailand. The share of Japanese FDI to the world held by investment to Asia fluctuates wildly from year to year when looking at the numbers as a flow, so when looking at the figures on the basis of year-end balances, it stood at 26.7% at the end of 2011. The shares represented by North America and Europe in the same year were respectively 29.7% and 23.9%, from which it can be understood that Asia is a region having an importance to Japanese overseas businesses similar to that of North America and Europe.4 Looking at Japanese FDI to Asia by industry, the top places in manufacturing were held by electrical machinery and transport machinery, and in the non-manufacturing sector, by distribution (wholesale and retail), financial/insurance, and the like.5
Figure 3 Japan’s Outward FDI Stock by Region
Source: JETRO, Foreign Direct Investment database
Although the state of overseas business activities by Japanese corporations was considered from the direction of outward foreign direct investment, the actual state of overseas activity by Japanese corporations can be discerned by considering sales by overseas subsidiaries (local affiliates) of Japanese businesses (Figure 4). According to the figure, sales by overseas subsidiaries of Japanese corporations operating in Asia totaled ¥35.9 trillion in FY 2001, but this more than doubled ten years later in FY 2011 to ¥79.8 trillion. Meanwhile, although North American overseas subsidiaries greatly exceeded sales by Asian overseas subsidiaries in FY 2001 by reaching ¥59.5 trillion, sales dropped to ¥50.8 trillion in FY 2011 due to the
4 Figures released by JETRO were used. 5 According to the Bank of Japan international balance of payments statistics.

14 S Urata / Public Policy Review
effects of the global financial crisis. Sales by European overseas subsidiaries increased somewhat from ¥26.8 trillion to ¥31.3 trillion from FY 2001 to FY 2011. For the record, FY 2011 sales by overseas subsidiaries in China, the ASEAN 4 (Indonesia, Malaysia, the Philippines, and Thailand), and the NIEs (South Korea, Taiwan, and Singapore) were respectively ¥27.4 trillion, ¥22.9 trillion, and ¥18.1 trillion. Entering the 21st century, the large rise in sales by Asian overseas subsidiaries resulted in the share held by Asian subsidiaries of sales to the entire world by overseas subsidiaries of Japanese companies skyrocketing from 22.6% to 43.8% from FY 2001 to FY 2011. These figures indicate the increasing importance of Asia to Japanese businesses.
Figure 4 Sales of Overseas Affiliates of Japanese Companies by Region
Source: Ministry of Economy, Trade and Industry, Kaigai Jigyo Katsudo Kihon Chosa, various issues
From the 1960s to the mid-1980s, when the countries in Asia were promoting a strategy of import substitution to foster domestic industries by restricting imports, FDI by Japan in Asia often had the objective of making sales in the local market, but from the mid-1980s when the value of the yen jumped rapidly, there was a great expansion in investment aiming to form production networks, as already discussed.
II-3. Liberalization of trade and FDI policies in the countries of Asia
The importance of Asia in Japanese trade and FDI increased. There were a variety of factors behind that increase. The first factor was the fact that the East Asian countries have been achieving a high level of economic growth, as discussed earlier. Although within a particular country or region, trade and economic growth have a mutually influencing relationship, the export of industrial products contributed greatly to the high growth of the

Policy Research Institute, Ministry of Finance, Japan, Public Policy Review, Vol.10, No.1, March 2014 15
Asian countries. Meanwhile, the production of industrial products by the Asian countries required intermediate goods from countries such as Japan, and so Japanese exports to Asia expanded. On the other hand, the expansion of Japanese imports from the countries of Asia largely resulted from increased production capability in both quality and quantity of the Asian countries. Japan’s large-scale FDI to East Asia greatly contributed to the expansion of the trade relationship between Japan and Asia, as was made clear in the explanation of the production networks in the previous section.
The second factor, which relates to the first factor, was the improvement of the trade and investment environment in East Asia. Specifically, the liberalization of trade and direct investment policies and an improvement in transport infrastructure and the like can be cited. South Korea, Taiwan, Hong Kong, and Singapore, which were later to be called the East Asian Newly Industrializing Economies (NIEs), switched in the 1960s from import substituting policies designed to foster domestic industry by restricting imports, to export promoting policies aiming to achieve economic growth by expanding exports. From the 1970s to the 1980s, the countries called the ASEAN 4 (Thailand, Malaysia, Indonesia, and the Philippines) underwent the same policy turnaround. Also, China went forward with “reform and openness” in 1979, and Vietnam implemented the Doi Moi policy in 1986. Furthermore, in the latter half of the 1990s, the new ASEAN members of Laos, Cambodia, and Myanmar followed suit. The turnaround from import substitution policies to export promotion policies can be observed through tariff rate decreases (Table 2).
Table 2 Tariff Rates for East Asian Countries (%)
Sources:World Bank, World Development Indicators on line for all the countries except for Taiwan.APEC, StatsAPEC for Taiwan.
All products Manufacturedproducts
Primaryproducts All products Manufactured
productsPrimaryproducts
Brunei1992 2.72 3.19 0.83
Thailand1989 36.95 37.86 29.52
2010 3.77 4.42 0.23 2009 11.22 10.47 15.86
Cambodia2001 16.74 16.54 18.26
Vietnam1994 14.5 13.68 21.77
2008 12.36 12.17 13.77 2010 7.13 6.9 8.57
Indonesia1989 18.74 18.91 17.66
China1992 39.71 40.75 34.67
2010 4.79 5.03 3.21 2010 7.74 7.69 8.11
Lao PDR2000 9.28 8.62 15.15
Hong Kong1988 0 0 0
2008 9.25 8.42 16.03 2010 0 0 0
Malaysia1988 14.07 14.67 10.28
Korea1989 18.61 18.56 19.02
2009 6.75 6.07 10.14 2010 10.33 7.35 26.31
Myanmar2001 4.63 4.3 7.59
Taiwan2006 6.4 4.7 17.5
2008 4.03 3.9 5.1 2011 6.1 4.5 16.6
Philippines1988 28.25 27.96 29.75
India1990 81.56 82.96 71.56
2010 5.31 5.07 6.77 2009 11.5 10.25 20.13
Singapore1989 0.4 0.44 0.162010 0 0 0
It is difficult to verify changes in FDI policy as there is no indicator for FDI the way tariffs are for trade. The Organization for Economic Co-operation and Development (OECD)

16 S Urata / Public Policy Review
estimates an FDI Restrictiveness Index for the OECD members and a number of other countries, and according to this, it can be understood that FDI policy liberalization has been progressing in many East Asian countries.6 This index is constructed based on the regulatory situation in the four areas of foreign equity limitations, the screening process when receiving FDI, employment of foreign executives, and restrictions on the operation of profit transfers and is a figure such that a 0 indicates the most liberalized condition and a 1 indicates the most restricted situation. For the countries in East Asia that were the subject of this OECD survey from 1997 to 2012, values are reported for Malaysia (0.510 → 0.214), Indonesia (0.490 → 0.329), India (0.484 → 0.273), China (0.633 → 0.407), and South Korea (0.532 → 0.143).
Although liberalization of trade policy and FDI policy progressed in the East Asian countries, trade and investment barriers still remain in many countries. In order to achieve further economic growth through expanding trade and FDI, it is necessary to reduce and eliminate those barriers. Also, although this is not normally included in trade policy or FDI policy in the narrow sense, to many East Asian countries, the improvement of so-called trade facilitation measures such as customs procedures and distribution/trade infrastructure, which have a large influence on trade and investment, is an important task for increasing trade and investment. As indicated in Table 3, while there are countries that have extremely efficient international distribution such as Singapore and Hong Kong, there are also extremely inefficient countries such as Myanmar, Laos, and Cambodia. Furthermore, developing human resources, establishing and managing highly transparent and stable economic institutions, and fostering supporting industries, are important for expanding FDI.7 If the promotion of trade and FDI liberalization and an improvement in facilitation measures move forward, an expansion of Japanese trade and investment in Asia would result. To overcome these issues, it is necessary to effectively utilize technical support from foreign countries and international organizations in the areas such as customs procedures and animal and plant health inspection.
6 OECD, FDI Regulatory Restrictiveness Index, website, http://www.oecd.org/investment/fdiindex.htm accessed 4/20/2013.7 See Japan Bank for International Cooperation (2012) and JETRO (2012b), regarding operating problems for Japanese corporations operating in Asian countries.

Policy Research Institute, Ministry of Finance, Japan, Public Policy Review, Vol.10, No.1, March 2014 17
Table 3 Efficiency of International Logistics: 2012
Source:World Bank, Logistics Performance Index
Ranking (out of 155 countries)
Score(1~5) Customs Infrastrucure
Ease of arranging shipments
Quality of logistics
and servicesTracking
and tracing Timeliness
Brunei na na na na na na na naCambodia 101 2.56 2.30 2.20 2.61 2.50 2.77 2.95 Indonesia 59 2.94 2.53 2.54 2.97 2.85 3.12 3.61 Lao PDR 109 2.50 2.38 2.40 2.40 2.49 2.49 2.82 Malaysia 29 3.49 3.28 3.43 3.40 3.45 3.54 3.86 Myanmar 129 2.37 2.24 2.10 2.47 2.42 2.34 2.59 Philippines 52 3.02 2.62 2.80 2.97 3.14 3.30 3.30 Singapore 1 4.13 4.10 4.15 3.99 4.07 4.07 4.39 Thailand 38 3.18 2.96 3.08 3.21 2.98 3.18 3.63 Vietnam 53 3.00 2.65 2.68 3.14 2.68 3.16 3.64 China 26 3.52 3.25 3.61 3.46 3.47 3.52 3.80 Hong Kong 2 4.12 3.97 4.12 4.18 4.08 4.09 4.28 Korea 21 3.70 3.42 3.74 3.67 3.65 3.68 4.02 Taiwan 19 3.71 3.42 3.77 3.58 3.68 3.72 4.10 India 46 3.08 2.77 2.87 2.98 3.14 3.09 3.58
III. Japan’s FTA strategy with East Asia
Until the end of the 1990s, Japan’s trade policy was basically implemented in accordance with the principle of nondiscrimination under GATT/the WTO, which indicates refraining from discriminating against a GATT/WTO member. However, from the 1950s to the 1990s, there are also cases that when a trade friction problem arose with the US or Europe due to rising exports from Japan of products such as textiles, steel products, electrical products, and automobiles these were resolved by concluding a bilateral trade arrangement. Amidst such circumstances, at the end of the 1990s, Japan came to have an interest in free trade agreements (FTAs), which are trade arrangements eliminating trade barriers between particular countries. Thereafter, in the 21st century, Japan began actively concluding FTAs, focusing on the ASEAN countries. This section analyzes Japan’s FTA strategy in East Asia.
III-1. Rapidly progressing establishment of FTAs with East Asian countries
Japan’s first FTA was with Singapore, and it came into effect in November 2002 (Table 4). FTAs basically are arrangements for liberalizing trade in goods, but the arrangement executed between Japan and Singapore included not only liberalization of trade in goods, but also comprehensive contents such as liberalization of trade in services and investment, facilitation of trade in goods and services, intellectual property rights, competition policy, government procurement, cooperation, and others, and so it was called an Economic

18 S Urata / Public Policy Review
Partnership Agreement (EPA).8 Behind the establishment of the EPA was a recognition that a wide-ranging and comprehensive arrangement would be necessary in order to bring about large economic benefits in an international economic environment in which goods, people, capital, and information have come to freely and actively move across national boundaries.
Table 4 Japan’s FTAs
Source: Ministry of Foreign Affairs, Japanese Government
FTA Partners Start of negotiation Signing of FTA Enactment of FTAIn effect Singapore January 2001 January 2002 November 2002
Mexico November 2002 September 2004 March 2005Malaysia January 2004 December 2005 July 2006Chile February 2006 March 2007 September 2007Thailand February 2004 April 2007 November 2007Indonesia July 2005 August 2007 July 2008Brunei June 2006 June 2007 July 2008ASEAN April 2005 April 2008 December 2008Philippines February 2004 September 2006 December 2008Switzerland May 2007 February 2009 September 2009Vietnam Janary 2007 December 2008 October 2009India January 2007 February 2011 August 2011Peru May 2009 May 2011 March 2012
Under Korea* Decemer 2003negotiation GCC September 2006
Australia April 2007Mongolia June 2012Canada November 2012Colombia December 2012Japan-China-Korea March 2013EU April 2013RCEP May 2013TPP 2013年 7月
Notes: *FTA negotiations with Korea has been suspended since November 2004.RCEP is Regional Comprehensive Economic Patnership, in which ASEAN countries, Japan, China, Korea, Australia, New Zealand, and India are negotiating members.
After that, FTA negotiations were held focusing on ASEAN countries, and as of June 2013, a regional FTA with ASEAN and 12 bilateral FTAs (in order of establishment) with Singapore, Mexico, Malaysia, Chile, Thailand, Indonesia, Brunei, the Philippines, Switzerland, Vietnam, India, and Peru have come into effect (Table 4). Currently, negotiations are underway for FTAs with South Korea, Australia, the Gulf Cooperation Council (GCC) countries, Mongolia, Canada, Colombia and the EU, for a Japan-China-South Korea FTA, and for a Regional Comprehensive Economic Partnership (RCEP). However, although FTA negotiations with South Korea began in December 2003, they were broken off in November
8 However, this paper uses the general term FTA instead of EPA.

Policy Research Institute, Ministry of Finance, Japan, Public Policy Review, Vol.10, No.1, March 2014 19
2004 as there were opposing opinions on the negotiation framework, and have not restarted since. The RCEP is an FTA having the ASEAN countries, Japan, China, South Korea, India, Australia, and New Zealand as members, and negotiations began in May 2013 aiming for an agreement by the end of 2015. Regarding the Trans-Pacific Partnership (TPP), Japan announced its intention to participate in negotiations in March 2013, and currently is waiting for approval from the 11 countries that have joined the negotiations.
The fraction (FTA coverage rate) of Japanese trade that is with countries having an FTA in effect is currently 18.6%, which is lower than that for South Korea (33.9%), the US (37.8%), the EU (26.9%), and China (23.9%).9 The reason for Japan’s low FTA coverage rate is that an FTA has not been concluded with Japan’s major trade partner countries of China, the US, the EU, and South Korea. Currently, if the FTAs under negotiation and the TPP, for which negotiation participation has been announced, are concluded and come into effect, Japan’s FTA coverage rate would leap to over 80%.10
III-2. The significance of FTAs to Japan
As discussed above, Japan did not have an interest in FTAs, which are discriminatory arrangements, due to deploying a trade policy under GATT and the WTO, which has nondiscrimination as a fundamental principle. In fact, Japan did not approach partner countries to enter into such agreements due to taking a critical stance towards FTAs, which go against the multilateral framework of GATT/the WTO. Mexico, Singapore, South Korea, and other countries proposed FTAs with Japan.11 Mexico at the time already had FTAs with many countries concluded and in effect in order to become an FTA hub to promote economic growth through trade expansion, and as part of that effort approached Japan as an economic powerhouse in East Asia. Singapore also approached Japan for a similar motivation as Mexico, but in addition, recognized the importance of regional cooperation in order for the East Asian countries, which had been met with the Asian currency crisis, to avoid future crises, and came to consider FTAs as an important means for regional cooperation. This motivation also lay in the backdrop to the approach to Japan by South Korea, which suffered a large blow from the Asian currency crisis. There are a number of reasons why Japan came to respond to FTA proposals despite being initially reluctant.
The first reason was that the Japanese government attempted to secure export markets for Japanese businesses and to prepare a free and open business environment overseas through FTAs. At the end of the 1990s, regional trade agreements such as FTAs and customs unions proliferated around the world, and since Japan did not participate in them, Japanese businesses
9 Ministry of Economy, Trade and Industry (2012b)10 Ministry of Economy, Trade and Industry (2012b)11 See Urata and JCER (2002), Urata (2006), and the like.

20 S Urata / Public Policy Review
began to sense damage arising due to receiving discriminatory treatment in export markets.12,13 One specific example is the FTA with Mexico. US corporations in the Mexican market had enjoyed import duty exemptions due to the North American Free Trade Agreement (NAFTA), which was established in 1994, and EU corporations also were subject to an import duty exemption measure due to the EU-Mexico FTA. On the other hand, Japan had not concluded an FTA with Mexico, and so Japanese corporations faced high tariff barriers when exporting to Mexico, and were forced into disadvantageous conditions for competition compared to US and EU companies. Also, Mexico had only opened the government procurement market to FTA signatory countries, which also robbed Japanese firms of business opportunities. In order to overcome the disadvantageous conditions for competition in the Mexican market, Japanese corporations strongly appealed to the Japanese government for the conclusion of an FTA with Mexico. As is evident from the discussion thus far, FTAs involve the so-called domino effect as they become more numerous. The functioning of this effect caused a rapid rise in FTAs worldwide. After starting FTA negotiations with Mexico, Japan proceeded with FTAs with countries such as the ASEAN countries and India, and one of the factors behind FTAs with these countries was the pursuit of securing and expanding export markets by decreasing and eliminating barriers to trade.
Japanese corporations, especially in developing countries, are limited from acting freely in a variety of ways such as limits on capital participation in subsidiaries, limits on transferring employees from the headquarters, and rules requiring technology transfers as a condition of establishing an affiliate (performance requirement). Even the governments of many developing countries recognize that these measures discourage FDI by foreign companies and so have a negative effect on achieving economic growth, and yet the protection of domestic corporations and industries was prioritized resulting in the adoption of investment restricting policies. Also, Japanese corporations are being forced to act under a variety of limitations such as insufficient protection of intellectual property rights, which are extremely important as the wellspring of competitive strength to companies, and non-competitive market environments in which there is strong market power held by government-linked companies. In order to cause Japanese companies facing such obstacles to be able to operate in a stable business environment that is more free and transparent, many of Japan’s FTAs include an investment chapter. Japan is responding to these problems in countries with which an FTA has not been concluded by entering into bilateral investment treaties (BITs). Of the countries in Asia with which an FTA has not been signed, Japan has a BIT in effect with
12 GATT and the WTO recognize free trade agreements (FTAs), which eliminate trade barriers among member states in the form of regional integration, and customs unions, which eliminate trade barriers among member states and use a common trade policy towards non-member states, and these are collectively referred to as Regional Trade Agreements (RTAs). RTAs are recognized subject to a number of conditions in GATT Article 24, and the main conditions are the following three: trade barriers against non-member states shall not be raised higher than those existing prior to the regional integration, trade barriers among member states shall be eliminated with respect to substantially all trade, and the regional integration shall be completed within a reasonable length of time.13 See Urata (2013) regarding the conditions and factors surrounding the global RTA increase.

Policy Research Institute, Ministry of Finance, Japan, Public Policy Review, Vol.10, No.1, March 2014 21
China, Hong Kong, Mongolia, and South Korea.14 Establishing and developing market rules through FTAs and BITs not only imparts a favorable effect on foreign-capitalized firms such as Japanese companies in the countries with which such agreements have been concluded, but also invigorates the market as a whole by improving the business environment for local businesses as well, thus furthering economic growth in those countries.
In order to promote FDI, it is effective to conclude not only FTAs and BITs, but also tax treaties and social security agreements in order to correct double taxation and double insurance fees. There are many East Asian countries that have concluded tax treaties with Japan, namely the 11 countries (as of April 2012) of Indonesia, South Korea, Malaysia, Singapore, Thailand, China, the Philippines, Vietnam, Brunei, Hong Kong, and India.15 However, a social security agreement has only been signed with South Korea (as of December 28, 2012).16
Japan’s second reason for promoting FTAs has been to further domestic structural reforms. Since the collapse of the bubble in the beginning of the 1990s, the Japanese economy has fallen into a long-term period of low growth. In order to escape from low growth and achieve a recovery, it is necessary to arrange an economic environment in which labor and capital, as the factors of production, can function efficiently. To achieve this, it is necessary to reduce or eliminate restrictions obstructing the movement of labor and capital through implementing structural reforms.17 However, in many cases domestic pressure and impetus arising from within are insufficient to promote structural reforms, and “outside pressure” from abroad calling for market opening in Japan plays an effective role. In the past, commitments in trade liberalization negotiations under GATT and the WTO as well as calls for market opening from the US have been effective examples of outside pressure. However, the current situation is that the Doha Round, which started in 2001 under the WTO, has run aground and pressure for market opening from the US has waned, and so FTAs are the sole form of outside pressure. At present, agricultural reform is a form of structural reform that is garnering attention in relation to FTAs in Japan. Those who support the promotion of FTAs assert that generous protection over the long term caused the low competitiveness of agriculture, and that if the agricultural sector is opened and structural reforms proceed due to FTAs, the competitiveness of agriculture will increase and could become an exporting industry. However, the agricultural sector has a strong influence over politics, and so many agricultural products are exempted from trade liberalization in the FTAs signed by Japan.18
The third reason, which is in particular a reason to further FTAs with the countries of Asia, is to support the economic development of developing East Asian countries through
14 Ministry of Economy, Trade and Industry (2012a).15 Ministry of Economy, Trade and Industry (2012a).16 Japan Pension Service website http://www.nenkin.go.jp/n/www/agreement/detail.jsp?id=5068 accessed 4/21/2013. 17 The necessity of structural reforms to revitalize the Japanese economy is being advocated, Fukao (2012) uses the results of a detailed empirical analysis to develop a convincing argument. 18 See Honma (2013), and Yamashita (2012), regarding the problem of agriculture in Japanese FTAs, particularly the TPP.

22 S Urata / Public Policy Review
FTA frameworks. The FTAs that Japan has concluded have comprehensive contents including not only trade liberalization but also trade facilitation, investment liberalization and facilitation, and economic cooperation. As noted in the discussion over the first reason for Japan to promote FTAs, if a desirable investment environment is established by means of FTAs in the markets of FTA partner countries, investment from Japan would expand, and there would not only be benefits for Japanese corporations but the boon of economic growth can also be expected for the countries receiving investment. Also, it is important for Japan to support the economic development of FTA partner countries using programs relating to economic cooperation such as development of human resources and supporting small and medium enterprises, as included in FTAs. If economic development moves forward in Japan’s FTA partner countries through the FTAs, the benefit can be expected that opportunities for expanding exports and investment would be granted to Japanese businesses as well. Furthermore, the promotion of economic development in Asia is highly likely to bring about social and political stability, and as a result, yet more economic development would arise.
Thus far, the significance of FTAs to Japan has been discussed focusing the discussion on economics. But in actuality, the conclusion of FTAs takes into consideration not only economic reasons, but also international relations reasons such as politics and security. For example, a major catalyst for Japan’s FTA with ASEAN is thought to be the rivalry between Japan and China over leadership in East Asia. As observed in the previous section, Japan proceeded with its policy towards the ASEAN counties by establishing bilateral FTAs with Singapore, Malaysia, and Thailand. However, when it was revealed that China would proceed with an FTA with ASEAN as a whole, Japan also moved to conclude such an FTA. Thus, non-economic factors are also important elements regarding FTAs, but this paper focuses on the economic aspects in the discussion.
III-3. Evaluation of and problems regarding Japan’s FTAs
The previous section discussed that one objective for Japan’s promotion of FTAs has been to further the opening of FTA partner country markets. As a result, it is important when evaluating FTAs to consider to what degree that objective was attained. Table 5 indicates the tariff elimination rate for the FTAs (ASEAN+1 FTA) in effect between ASEAN and six countries. Here, tariff elimination rate indicates the percentage of the number of products for which tariff elimination was agreed to in the FTA among the products listed in the tariff tables. According to this table, the average tariff elimination rate of the ASEAN-Japan FTA on the ASEAN side is 92.9%, the next lowest after that with India at 79.7%. The tariff elimination rates of ASEAN’s FTAs with Australia/New Zealand, China, and South Korea are respectively 94.8%, 94.7%, and 94.9%. Compared with companies from Australia, New Zealand, China, and South Korea, Japanese corporations are limited, albeit slightly, in free trade opportunities in the ASEAN market. One factor behind this situation is the fact that Japan did not open its market to ASEAN. In fact, the liberalization rate on the Japanese side in the FTA with ASEAN is 91.9%, which is lower than that on the ASEAN side. Like other

Policy Research Institute, Ministry of Finance, Japan, Public Policy Review, Vol.10, No.1, March 2014 23
types of negotiations, the ASEAN+1 FTA negotiations were conducted in a reciprocating manner, and so if the liberalization proposal of one party is limited, that of FTA partner country would also be limited.
Table 5 Tariff Elimination Ratios in ASEAN+1FTA (%)
Source:Kuno(2012)
ASEANAus-NZ China India Japan Korea Averages
Brunei 99.2 98.3 85.3 97.7 99.2 95.9 Cambodia 89.1 89.9 88.4 85.7 97.1 90.0 Indonesia 93.7 92.3 48.7 91.2 91.2 83.4 Lao PDR 91.9 97.6 80.1 86.9 90.0 89.3 Malaysia 97.4 93.4 79.8 94.1 95.5 92.0 Myanmar 88.1 94.5 76.6 85.2 92.2 87.3 Philippines 95.1 93.0 80.9 97.4 99.0 93.1 Singapore 100 100 100 100 100 100 Thailand 98.9 93.5 78.1 96.8 95.6 92.6 Vietnam 94.8 n.a. 79.5 94.4 89.4 89.5
94.8 94.7 79.7 92.9 94.9 91.3 Australia 100New Zealand 100China 94.1India 78.8Japan 91.9Korea 90.5Averages 95.7 94.7 79.6 92.8 94.5
Note: Tariff elimination ratio is the proportion of tariff lines that are committed to be eliminated in total number of tariff line.
Although the promotion of domestic structural reforms was discussed as a reason for Japan to promote FTAs, the low FTA liberalization rate signifies a low contribution towards the promotion of structural reforms. Evaluating Japan’s FTAs from this viewpoint, the result is lower than those of other countries. Although it was already confirmed that the FTA liberalization rate on the Japanese side is lower in the ASEAN-Japan FTA, the FTA liberalization rates in other FTAs that Japan has brought into effect are also low. For example, the FTA liberalization rates in the FTAs with Mexico, Chile, and Switzerland are respectively 86.0%, 86.5%, and 85.6%.19 The reason why the FTA liberalization rates are low on the Japanese side is that the abolishment of tariffs has not taken place with respect to agricultural, forestry, and fishery products. There are 940 products for which Japan has never completely abolished tariffs in the FTAs in effect thus far, and 845, or about 90% of those are agricultural, forestry, and fishery products. Many such products including rice, wheat, and barley are
19 Ministry of Foreign Affairs, “Nihon to EPA to Bei-EU nado no FTA no Jiyukaritsu Hikaku.” Hokatsuteki Keizai Renkei ni kansuru Kihon Hoshin. http://www.mofa.go.jp/mofaj/gaiko/fta/pdfs/siryou20101106.pdf

24 S Urata / Public Policy Review
excluded from liberalization, or protection is continuing in the form of re-deliberation and standstills. To increase the benefits of liberalization resulting from FTAs, the liberalization rate of existing FTAs must be re-examined and raised through re-negotiation.
Increasing the FTA utilization rate is an issue regarding Japanese FTAs. Despite going through the trouble to spend significant time and energy to conclude FTAs, if corporations cannot expand trade by taking advantage of those FTAs, they would not enjoy the benefits of entering into an FTA. As a result, not only would it not be possible to increase corporate profits, but it would also be impossible to achieve a positive effect on the Japanese economy.
Although it is difficult to obtain accurate information regarding the FTA utilization rate by Japanese companies, it is increasing yearly according to a questionnaire survey conducted by JETRO.20 The fractions of companies using FTAs for exports from Japan or imports to Japan in FY 2009, 2010, and 2011 were respectively 36.2%, 36.8%, and 40.1%. Also, the fraction of use by companies during importing is greater than the fraction of use by companies during exporting, respectively at 40.1% and 34.0% in the FY 2011 survey. The FTA utilization rate by Japanese companies greatly differs between the FTAs with the ASEAN countries and with India (Figure 5). The FTA with the highest utilization rate for both exports and imports is that with Thailand, at 26.3% for exports and 35.2% for imports. On the other hand, those with the lowest utilization rate are with the other ASEAN countries of Brunei, Cambodia, Laos, Myanmar, and Singapore, at 10.0% for exports and 20.0% for imports. These figures have room to grow, and consequently illustrate that there is a need to increase the FTA utilization rate. The FTA utilization rate is 47.2% among large corporations and 30.1% among small and medium enterprises, from which it can be understood that increasing it is an issue among the latter.
Figure 5 FTA Utilization Ratios of Japanese Firms for Japan’s FTAs with Asian Countries
Source: JETRO (2012a)
20 JETRO (2012a)

Policy Research Institute, Ministry of Finance, Japan, Public Policy Review, Vol.10, No.1, March 2014 25
As the reason why a Japanese corporation did not utilize FTAs, the fraction of companies that responded that they did not know the FTA system was the highest, at 25%.21 In particular, the level of awareness among small and medium enterprises regarding FTAs was low, 29.9% responding in the survey that they were not aware of FTAs. On the other hand, large businesses had a high level of awareness regarding FTAs, 7.2% responding that they were not aware of FTAs. The other reasons for not using FTAs were: there being no necessity for using FTAs due to the general tariff to the export destination being zero (19.8%), there being no advantage to using FTAs due to there being little difference between the general tariff and the FTA tariff in the export destination (18.2%), there being no necessity for using FTAs due to being exempted from import tariffs as a result of trade policy measures other than FTAs, such as export processing zones and various bond systems at the export destination (13.8%), and not meeting the criteria for rules of origin (8.8%), Taking into consideration the fact that there was a relatively large percentage of companies that responded that there was no benefit to using FTAs, there is the high likelihood that the actual utilization rate is higher than that obtained through the responses. However, even taking this into account, it is valid to note that raising the FTA utilization rate is necessary.
III-4. Japan’s East Asian FTA strategy
Japan already has in effect a regional-level FTA with ASEAN as a whole, as well as bilateral FTAs with seven countries within ASEAN. Furthermore, there is a bilateral FTA with India. The major countries and regions in the East Asian region with which Japan does not have an FTA in effect are China, South Korea, Taiwan, and Hong Kong. Amidst such circumstances, FTA negotiations began with China and South Korea in the form of a Japan-China-South Korea FTA. Also, under the Regional Comprehensive Economic Partnership (RCEP), FTA negotiations started in May 2013 with the members being the 10 ASEAN countries, Japan, China, South Korea, India, Australia, and New Zealand. If a comprehensive FTA encompassing East Asia is formed, goods, services, and investment would come to move actively within the region, resulting in the promotion of economic growth in the East Asian countries including Japan. Taking the above into consideration, the highest priority in Japan’s East Asian FTA strategy is in promoting negotiations for the Japan-China-South Korea FTA and the RCEP, but thereafter it is considered important to pave the way towards the inclusion of Taiwan and Hong Kong in the RCEP.
Table 6 indicates the results of a simulation exercise by the CEPEA Study Group (2009) regarding the economic effects of establishing an ASEAN+6 (Japan, China, South Korea, India, Australia, and New Zealand) FTA (RCEP). According to this analysis, if the RCEP includes not only trade liberalization (tariff abolishment) but also trade facilitation and economic cooperation, the GDP of the RCEP member states would rise significantly (shaded
21 In this analysis of the reasons for not using FTAs, the questionnaire results regarding the utilization rate for exporting are used.
26 S Urata / Public Policy Review
portion).22 There is variation among the countries in the amount of GDP increase, the highest being Vietnam at 11.04%, and the lowest being Japan at 0.64%. The reasons for the small rise in the Japanese GDP are that it has relatively low tariffs compared to other countries, and that the fraction of the economy made up by trade is small. However, taking into consideration that this simulation does not include important items in RCEP such as liberalization and facilitation of investment and trade in services, there is the high likelihood that the simulation results listed in the figure are an underestimation. In fact, a simulation by Petri et al. (2012) regarding an FTA of Japan, China, South Korea, and the ASEAN 10 countries obtained the result of a 1.4% rise resulting from the FTA in the Japanese GDP in 2020 in the case that the FTA comes into effect in 2016. On the other hand, even with the 0.64% GDP rise figure from the CEPEA Study Group, if the potential growth rate of the Japanese economy is taken to be around 2%, a 0.64% GDP rise can be interpreted to be a very large figure. This section considers Japan’s future East Asian FTA strategy by discussing the issues in the formation of the RECP and the role Japan should play for it.
22 CEPEA (Comprehensive Economic Partnership in East Asia) was proposed as an FTA among the (then) members of the East Asia Summit, and the CEPEA Study Group of private scholars was organized in order to study the possibility of realizing such an FTA. The group had its first meeting in June 2007, and submitted a Phase I Report in June 2008 and a Phase II Report in July 2009 to the East Asia Summit Consultation of Economic Ministers before disbanding.

Policy Research Institute, Ministry of Finance, Japan, Public Policy Review, Vol.10, No.1, March 2014 27
Table 6 Impacts of RCEP(ASEAN+6FTA) on GDP:Simulation Analysis using CGE Model
Case 1 Case 2 Case 3Japan 0.04 0.64 0.56 China -0.03 4.65 4.64 Korea 0.38 2.67 2.28 Indonesia 0.13 4.35 4.13 Malaysia 0.62 9.53 8.95 Philippines 0.12 5.95 5.51 Singapore -0.02 3.83 3.65 Thailand 0.59 7.46 7.17 Vietnam 1.61 11.04 10.17 Cambodia 0.38 8.59 7.17 Myanmar 0.07 6.15 5.36 Lao PDR 0.40 5.99 4.69 Brunei-Timor 1.86 6.98 6.14 Australia 0.11 1.27 1.20 New Zealand 0.08 1.94 1.77 India 0.45 3.40 2.70 Hong Kong 0.00 0.02 0.02 Taiwan -0.10 -0.18 -0.15 NAFTA 0.00 -0.02 -0.02 EU25 -0.03 -0.09 -0.09 South America -0.02 -0.05 -0.05 Other areas -0.03 -0.08 -0.09
Notes: Case 1 is tariff elimination, Case 2 adds trade facilitation, economic cooperation, Case 3 removes agriculture from tariff eliminationSource: CEPEA (2009)
The 2009 report by the CEPEA Study Group is considered instructive regarding the contents of the RCEP. In the report, CEPEA (RCEP) consists of the three pillars of economic cooperation, facilitation, and liberalization, among which the reduction of developmental disparities among member countries is recognized as a very important issue. The contents of the three pillars are indicated next. Economic cooperation includes: development of human resources, improving statistics, technology transfers, IT infrastructure, transport infrastructure and logistics, environment/energy, regional development, fostering small and medium enterprises, and others. Facilitation includes: rules of origin, customs procedures, standards, and national regulations. Liberalization includes the liberalization of trade and investment, and a specific measure for trade liberalization is the abolishment of tariff and non-tariff barriers. The liberalization of the international movement of labor is also touched on.
The RCEP is to be a comprehensive FTA including, as stated above, liberalization and facilitation of trade and investment, as well as economic cooperation. In fact, it is highly likely that it will become so in light of the CEPEA discussions thus far. These contents are similar to those of the FTAs and EPAs that Japan has in effect thus far, and so Japan should

28 S Urata / Public Policy Review
actively promote the RCEP. Although there is the view that forming an FTA among the ASEAN+6 under the RCEP framework will be relatively easily carried out by bundling the existing five ASEAN+1 FTAs, but this is not correct. As seen in Table 5, the degree of tariff abolishment in the five ASEAN+1 FTAs differs greatly. In other words, there are not so many products for which tariffs have been abolished in one ASEAN+1 FTA as well as another ASEAN+1 FTA.
Most of the RCEP member countries have non-competitive industries and it is often the case that these have strong political power, and so there is often strong opposition to trade and investment liberalization. As a result, trade and investment liberalization do not make progress. In Japan, as noted already, opposition from the agricultural sector is causing difficulties in liberalization. Amidst such circumstances, Japan, which is the most economically developed country in the East Asia region, must become the role model for the other countries with respect to liberalization. The fact that proceeding with the liberalization of the agricultural sector would have a favorable effect on the Japanese economy can be inferred from the simulation results indicated in Table 6. By Japan taking the lead and carrying out liberalization that is difficult for itself, liberalization in other countries would be induced.
It was stated above that the target completion for RCEP negotiations is 2015. In other words, an agreement must be reached in two years from the start of negotiations. Negotiating time is limited. Japan should play an active promoting role in expeditiously proceeding with negotiations. Specifically, Japan should leverage FTA negotiations with the EU, in the Japan-China-South Korea FTA, and in the Trans-Pacific Partnership (TPP), to apply pressure on the RCEP negotiations, enabling a contribution to an early agreement. It is also important to conversely leverage the RCEP negotiations to put pressure on FTA negotiations with the EU and the TPP. Japan, which is participating in all these negotiations, is the only player that can fulfill such a role.
In order for Japan to liberalize sectors such as agriculture that are considered to not be competitive, it is necessary to lead with (or simultaneously proceed with) domestic structural reforms, and to provide support (a safety net) in the form of temporary income supplementation and technical training for finding new work for those who would be negatively affected by increased imports resulting from liberalization. Also, as is being implemented in the EU, it is important to switch the means of agricultural protection from import restrictions to direct payments. To build such institutions and to play a leading role in the RCEP negotiations, political leadership in pursuit of a prosperous future Japanese economy is indispensable.
In building the RCEP, it is important to allow new members. Specifically, it is important to provide a clause pertaining to new membership in the RCEP agreement, and to specifically indicate conditions for new members. The TPP recognizes new members, and despite launching initially with four member countries, negotiations have now expanded to 11 countries. The RCEP should expand its membership by recognizing new members, and ultimately aim to integrate with the TPP. In fact, at the Asia-Pacific Economic Cooperation (APEC) summit meeting held in Yokohama in 2010, there was an agreement that the TPP, ASEAN+3 FTA, and ASEAN+6 FTA was the path towards building the Free Trade Area of

Policy Research Institute, Ministry of Finance, Japan, Public Policy Review, Vol.10, No.1, March 2014 29
the Asia Pacific (FTAAP), which is the regional integration of APEC. Thereafter, since the ASEAN+3 FTA and the ASEAN+6 FTA merged to form RCEP, establishing the FTAAP by integrating the RCEP and the TPP is a valid roadmap.
IV. A new area in trade strategy with Asia: Promoting infrastructure export
To the Japanese economy, where there is a rapidly decreasing birthrate and aging population and that is late in its response to globalization, it is important to open the Japanese market and to build close relationships with the countries of East Asia, for which high growth is anticipated. As a means for realizing that objective, it was argued above that it would be effective to promote RCEP as an FTA that encompasses East Asia, and the Japan-China-South Korea FTA as the core thereof. Finally, although not explicitly touched upon thus far, there will be a discussion of infrastructure export, which has been growing in importance in recent years in trade policy in a broader sense.
In order to promote economic development and growth, transportation infrastructure such as roads, railways, and ports, energy-related infrastructure such as power generation and distribution, information and communication infrastructure such as the spread of the Internet, and other forms of infrastructure supporting economic activities must be constructed and established, and furthermore must be managed and maintained. According to estimates from the Asian Development Bank, there is an infrastructure demand in Asia of approximately $8 trillion in the 11-year period from 2010-2020.23 It goes without saying that this is a large business opportunity for Japanese companies and municipalities concerned with the infrastructure business. Still, as emphasized above already, since economic development and growth in the Asian countries would be promoted by improving the infrastructure in Asia, further export and investment expansion opportunities would arise for Japanese corporations.24 If Japanese businesses can seize those opportunities, it would lead to growth in the Japanese economy.
The rising demand for infrastructure in Asia does give opportunities to Japanese businesses to export infrastructure, but they have not thus far been very successful in doing so. According to a survey by the Japan Machinery Center for Trade and Investment, overseas infrastructure orders for Japanese businesses from 2005 to 2010 trended at around $20.0 billion each year, while the value of orders for South Korean firms and Chinese firms expanded tremendously, respectively from $13.8 billion to $64.5 billion and $29.6 billion to $134.4 billion.25 It is said that the strength of South Korean and Chinese companies was their low cost, and so for Japanese businesses to counter, cost reductions are necessary. However, providing high-quality infrastructure (not only in the hard aspect of facilities, but also the soft
23 Asian Development Bank and Asian Development Bank Institute (2009)24 Kimura and Todo (2006) found that Japanese Official Development Assistance for infrastructure has the effect of inducing Japanese direct investment. 25 Ministry of Economy Trade and Industry, Industrial Structure Council, Trade and Economic Cooperation Sectional Committee, Infrastructure Systems Export Subcommittee, April 2012 handout.

30 S Urata / Public Policy Review
aspect of management, maintenance, and other) is even more important. Infrastructure construction requires massive funding, and the use of infrastructure is of a pubic nature, and so partnership and cooperation between governments and the private sector are important. The government and businesses of Japan must promote the export of infrastructure by building constructive relationships with the governments and businesses of the countries of Asia, as well as with international organizations such as the Asian Development Bank.
References
Asian Development Bank and Asian Development Bank Institute (2009) Infrastructure for a Seamless Asia.
CEPEA Study Group (2009) Phase II Report of the Track Two Study Group on Comprehensive Economic Partnership in East Asia(CEPEA) http://www.dfat.gov.au/asean/eas/cepea-phase-2-report.pdf
Fukao, Kyoji (2013) “TPP Sanka to Nihon no Nogyo Saisei,” Koichi Ishikawa, Keiichi Umada, Fukunari Kimura, Yorizumi Watanabe (eds.) TPP to Nihon no Ketsudan, Bunshindo.
Japan Bank for International Cooperation (2012) Wagakuni Seizogyo Kigyo no Kaigai Jigyo Tenkai ni kansuru Chosa Hokoku–2012 Nendo Kaigai Chokusetsu Toshi Anke-to Kekka (Dai 24 Kai).
JETRO (2012a) Heisei 23 Nendo Nihon Kigyo no Kaigai Jigyo Tenkai ni kansuru Anke-to Chosa (Kaigai Bijinesu Chosa) http://www.jetro.go.jp/news/releases/20120301775-news/outline.pdf
JETRO (2012b) Zai Ajia Oseania Nikkei Kigyo Katsudo Jittai Chosa (2012 Nendo Chosa) http://www.jetro.go.jp/jfile/report/07001149/asia_oceania2012_honbun.pdf
Kimura, Fukunari (2006) “International Production and Distribution Networks in East Asia: Eighteen Facts, Mechanics, and Policy Implications,” Asian Economic Policy Review, Volume 1, Issue 2, December 2006, Pages: 326–344.
Kimura, Hidemi and Yasuyuki Todo (2006) “Kaihatsu Enjo ha Chokusetsu Toshi no Senpei ka: Juryoku Moderu ni yoru Suikei,” RIETI, RIETI Discussion Paper Series 07-J-003.
Kuno, Arata (2012) “Revealing Tariff Structures under the ASEAN+1 FTAs and ATIGA: Implications for a Possible ASEAN++ FTA”, in Chang Jae Lee, Shujiro Urata and Ikumo Isono (eds.) Comprehensive Mapping of FTAs in ASEAN and East Asia Phase II. ERIA (to be posted at http://www.eria.org).
Ministry of Economy, Trade and Industry (2012a) Fukosei Boeki Hakusho (2012-nen ban).Ministry of Economy, Trade and Industry (2012b) Tsusho Hakusho (2012-nen ban).OECD (2012) Looking to 2060: Long-term Global Growth Prospects: A Going for Growth
Report http://www.oecd-ilibrary.org/docserver/download/5k8zxpjsggf0.pd f?expires=1367028
124&id=id&accname=guest&checksum=AA565B54FA83A87D525DBFC7CA966BFE

Policy Research Institute, Ministry of Finance, Japan, Public Policy Review, Vol.10, No.1, March 2014 31
Petri, Peter A., Michael G. Plummer and Fan Zhai (2012) The Trans-Pacific Partnership and Asia-Pacific Integration: A Quantitative Assessment, Peterson Institute for International Economics, Washington, D.C.
Urata, Shujiro (2006) “Nihon no FTA Senryaku,” Finansharu Rebyu, No. 81.Urata, Shujiro (2013) “Nihon no Ajia Taiheiyo Keizai Senryaku: TPP he no Taio,” Seijo
Daigaku Gakkaishi.Urata, Shujiro and JCER (eds.) (2002) Nihon no FTA Senryaku, Nikkei Shimbun.Yamashita, Kazuhito (2012) “TPP to Nogyo/Shoku no Anzen,” Nihon no TPP Senryaku:
Kadai to Tenbo, Keiichi Umada, Shujiro Urata, Fukunari Kimura (eds.) Bunshindo.