sick building syndrome - internet archive
TRANSCRIPT


Sick Building Syndrome


Sabah A. Abdul-WahabEditor
Sick Building Syndrome
in Public Buildings and Workplaces
123

EditorSabah A. Abdul-WahabSultan Qaboos UniversityP.O. Box 33123 [email protected]
ISBN 978-3-642-17918-1 e-ISBN 978-3-642-17919-8DOI 10.1007/978-3-642-17919-8Springer Heidelberg Dordrecht London New York
Library of Congress Control Number: 2011923659
© Springer-Verlag Berlin Heidelberg 2011This work is subject to copyright. All rights are reserved, whether the whole or part of the material isconcerned, specifically the rights of translation, reprinting, reuse of illustrations, recitation, broadcasting,reproduction on microfilm or in any other way, and storage in data banks. Duplication of this publicationor parts thereof is permitted only under the provisions of the German Copyright Law of September 9,1965, in its current version, and permission for use must always be obtained from Springer. Violationsare liable to prosecution under the German Copyright Law.The use of general descriptive names, registered names, trademarks, etc. in this publication does notimply, even in the absence of a specific statement, that such names are exempt from the relevantprotective laws and regulations and therefore free for general use.
Cover design: eStudio Calamar S.L., Heidelberg
Printed on acid-free paper
Springer is part of Springer Science+Business Media (www.springer.com)

Foreword
H.E. Dr. Ali Soud Al-Bemani, Vice-Chancellor, Sultan Qaboos University (SQU), Sultanate ofOman
I had the pleasure of looking at this valuable effort by a group of internationalexperts from 16 countries on the topic of Sick Building Syndrome (SBS). Livingin an arid region which has witnessed an unprecedented rates of development andchanges in all aspects of everyday life, including design of buildings and the intro-duction of air conditioning, chemicals and synthetic materials into our homes, it isimportant for us to fully assess the quality of our indoor environments and life styles,with a view to ensure that our homes are health and pleasant to live in. The chap-ters of this book have elaborated in a clear style, yet scientifically solid, the causes,diagnostic tools, health impacts and mitigation approaches that may be applied toexisting and planned buildings. I would like to congratulate the authors and theeditor for this excellent effort.
We at SQU are proud of our policy to encourage scientific research that is relevantto health and well being of our community as well as the regional and global envi-ronments. Our staff are encouraged to excel both in teaching as well as in carrying
v

vi Foreword
research that address issues of concern to our community. We will always providethe support needed for such serious and relevant research programs. I would liketo see this line of research is continued and further developed both at SQU level aswell jointly with other research teams in our sister universities.

Introduction
Editor of the book, Prof. Dr. Sabah A. Abdul-Wahab, Sultan Qaboos University (SQU), Sultanateof Oman
Having worked on air pollution monitoring, assessment and modelling for manyyears, I felt intrigued when one of my bright students walked into my office to saythat she should not submit her project because every time she went to the library towork on the literature she would get a headache and feel sleepy. I took my papersand went to the section where she was looking for papers and sat for about 20 minbefore I experienced the symptoms my student described. I went to the maintenancedepartment and obtained a drawing of the building. I examined the design, size ofthe reading hall, light distribution and air conditioning. I read as many publishedstudies on the subject of sick buildings syndrome (SBS) as I could get my hands on.I took the opportunity of participating in a project at the Sultan Qaboos University(SQU) at Sultanate of Oman to design an Eco-House. The SQU Eco-House Projectis an initiative taken to demonstrate designs that are energy and water efficient andwhich can run on renewable energy sources. My role was to work on the indoorand outdoor environments. I started to apply theory and test some of the conceptson sick building syndrome. This was not easy, since it was not possible to totallyisolate the indoor environment from the outdoor environment. The lesson learned isthat one needs to have a holistic look, taking into account the fact that all factors arerelated including environmental factors outside, available building materials, typesof furniture as well as design of kitchens and cooking practices and other socialhabits of the community. As a result of gaining this understanding I thought it would
vii

viii Introduction
be a good idea to bring experts in the various fields together and try to bring to thecommunity a comprehensive overview of sick building syndrome and obtain someideas of how to mitigate the effects of exposure by building occupants experiencingsuch conditions.
I am very proud of the product at your hands. This book has been written by col-leagues who are knowledgeable in their subjects and dedicated to their profession.We hope that you will find the chapters in this book compressive, realistic and easyto read.

Contents
1 Introduction to Sick Building Syndrome . . . . . . . . . . . . . . . 1Janis Jansz
2 Theories and Knowledge About Sick Building Syndrome . . . . . . 25Janis Jansz
3 Indoor Air Quality . . . . . . . . . . . . . . . . . . . . . . . . . . . 59S. Müjdem Vural
4 Perceived IEQ Conditions: Why the Actual Percentage
of Dissatisfied Persons is Higher than Standards Indicate? . . . . . 75Risto Kosonen, Mervi Ahola, Kirsi Villberg, and Tarja Takki
5 Sick Building Syndrome from the Perspective
of Occupational and Public Health . . . . . . . . . . . . . . . . . . 89Hülya Gül
6 Psychosocial Factors that Aggravate the Symptoms of Sick
Building Syndrome and a Cure for Them . . . . . . . . . . . . . . 105Nami Imai and Yoshiharu Imai
7 Building Biology and Examination Models for Buildings . . . . . . 113Ayse Balanlı
8 The Influence of School Environment on the SBS Symptoms
and the Development of Asthma and Allergy . . . . . . . . . . . . . 135Motoko Takaoka and Dan Norbäck
9 Microbial Ecology of Indoor Environments: The Ecological
and Applied Aspects of Microbial Contamination
in Archives, Libraries and Conservation Environments . . . . . . . 153Flavia Pinzari
10 Indoor Air Quality: Monitoring and Modeling Protocol
for Urban School Buildings . . . . . . . . . . . . . . . . . . . . . . 179Radha Goyal and Mukesh Khare
ix

x Contents
11 Mould Growth on Library Materials Stored
in Compactus-Type Shelving Units . . . . . . . . . . . . . . . . . . 193Flavia Pinzari and Mariasanta Montanari
12 Is Your Library Building Sick? A Case Study from the Main
Library of Sultan Qaboos University at Sultanate of Oman . . . . 207Sabah A. Abdul-Wahab and Nahed Mohamed Bassiouni Salem
13 The Interaction Between the Physical Environment and People . . 239Derek J. Clements-Croome
14 Necessity of Counseling Institutions for Sick Building
Syndrome Patients . . . . . . . . . . . . . . . . . . . . . . . . . . . 261Nami Imai and Yoshiharu Imai
15 Investigation of Air Pollution in Large Public Buildings
in Japan and of Employees’ Personal Exposure Levels . . . . . . . 269Naoki Kunugita, Keiichi Arashidani, and Takahiko Katoh
16 Assessment of Chemical Hazards in Sick Building
Syndrome Situations: Determination of Concentrations
and Origin of VOCs in Indoor Air Environments
by Dynamic Sampling and TD-GC/MS Analysis . . . . . . . . . . . 289Eva Gallego, Francisco Javier Roca, José Franciso Perales,and Xavier Guardino
17 Is it Safe Enough to Depend on Ventilation?
Recommendation of Radical Measures for Addressing Sick
Building Syndrome . . . . . . . . . . . . . . . . . . . . . . . . . . . 335Yoshiharu Imai and Nami Imai
18 Building Related Illnesses . . . . . . . . . . . . . . . . . . . . . . . 341Gustavo Silveira Graudenz
19 A Continuous and Proactive Process to Enhance
Well-being Indoors . . . . . . . . . . . . . . . . . . . . . . . . . . . 353Tarja Takki, Kirsi Villberg, Valtteri Hongisto, Risto Kosonen,and Anne Korpi
20 Sick Building Syndrome from an Architectural Perspective . . . . 371S. Müjdem Vural and Ayse Balanlı
21 The Role of Demographic and Psychosocial Factors
in Predicting SBS Symptoms in Workplaces . . . . . . . . . . . . . 393Gail Kinman and Andrew Clements
22 Epidemiologic Investigation Methods for Sick Building
Syndrome . . . . . . . . . . . . . . . . . . . . . . . . . . . . . . . . 405Omur Cinar Elci, Shelly Rodrigo, and Muge Akpinar-Elci

Contents xi
23 Noninvasive Health Assessment Methods in Sick Building
Syndrome . . . . . . . . . . . . . . . . . . . . . . . . . . . . . . . . 423Muge Akpinar-Elci and Omur Cinar Elci
24 Solving Indoor Environmental Problems: What Can Be
Found Out through Individual Measurements? . . . . . . . . . . . 439Anne Korpi, Tarja Takki, Maija Virta, Risto Kosonen,and Kirsi Villberg
25 Sick Building Syndrome from a Medical
Perspective-Symptoms and Signs . . . . . . . . . . . . . . . . . . . 453Berndt Stenberg
26 Improvement of the Illumination Levels Combined
with Energy Savings for a Residential Building . . . . . . . . . . . 463Sabah A. Abdul-Wahab and Syed Uzair Ahmed
27 Passive Methods to Address the Sick Building Syndrome
in Public Buildings . . . . . . . . . . . . . . . . . . . . . . . . . . . 481José A. Orosa and Armando C. Oliveira
28 Ventilation and the Air Ion Effect in the Indoor Building
Environments: Impact on Human Health and Wellbeing . . . . . . 493Milos Nedved
29 Sick Building Syndrome and Indoor Environmental
Quality in China – A Review . . . . . . . . . . . . . . . . . . . . . . 509Yufeng Zhang and Xiuling Ji
30 Sick Building Syndrome Identification and Risk Control
Measures . . . . . . . . . . . . . . . . . . . . . . . . . . . . . . . . 533Janis Jansz
31 The Way Forward . . . . . . . . . . . . . . . . . . . . . . . . . . . 589Mahmoud Yousef Abdulraheem

This is Blank Page Integra xii

Contributors
Mahmoud Yousef Abdulraheem Research Directorate, Kuwait Fund for theAdvancement of Sciences (KFAS), Kuwait, [email protected]
Syed Uzair Ahmed Department of Mechanical Engineering, NED Universityof Engineering & Technology Karachi, Karachi 75950, Pakistan,[email protected]
Mervi Ahola Finnish Association of Mechanical Building Services Industries,Helsinki, Finland, [email protected]
Muge Akpinar-Elci Department of Public Health and Preventive Medicine,St. George’s University School of Medicine, Grenada, The Caribbean,[email protected]
Sabah A. Abdul-Wahab Mechanical & Industrial Engineering Department,College of Engineering, Sultan Qaboos University, Sultanate of Oman,[email protected]
Keiichi Arashidani School of Health Sciences, University of Occupational andEnvironmental Health, Kitakyushu, Japan, [email protected]
Ayse Balanlı Department of Architecture, Faculty of Architecture, YildizTechnical University, 34349, Istanbul, Turkey, [email protected]
Andrew Clements Department of Psychology, University of Bedfordshire,Luton, Bedfordshire, England, UK, [email protected]
Derek J. Clements-Croome School of Construction Management andEngineering, University of Reading, Reading RG6 6AW, UK,[email protected]
Omur Cinar Elci Department of Public Health and Preventive Medicine,St. George’s University School of Medicine, Grenada, The Caribbean,[email protected]
Eva Gallego Laboratori del Centre de Medi Ambient, Universitat Politècnica deCatalunya (LCMA-UPC), 08028 Barcelona, España, [email protected]
xiii

xiv Contributors
Radha Goyal Delhi Zonal Laboratory, National Environmental EngineeringResearch Institute (NEERI), Delhi 110028, India, [email protected]
Gustavo Silveira Graudenz Department of Microbiology and Immunology,School of Medicine, Nove de Julho University, Sao Paulo, Brazil,[email protected]
Xavier Guardino Instituto Nacional de Seguridad e Higiene en el Trabajo(INSHT), Centro Nacional de Condiciones de Trabajo, 08028 Barcelona, España,[email protected]
Hülya Gül Istanbul Medical Faculty, Public Health Department, IstanbulUniversity, 34093 Capa-Istanbul, Turkey, [email protected]
Valtteri Hongisto Finnish Institute of Occupational Health, Turku, Finland,[email protected]
Yoshiharu Imai Division of Information Engineering, Graduate School ofEngineering, Mie University, Tsu City, Mie, Japan, [email protected]
Nami Imai Faculty of Medicine, School of Nursing, Mie University, Tsu City,Mie, Japan, [email protected]
Janis Jansz Department of Health & Safety Environmental Health, CurtinUniversity, Perth, WA 6845, Australia; School of Communications and Arts, EdithCowan University, Perth, WA 6845, Australia; Curtin Health Innovation ResearchCentre, Perth, WA 6845, Australia, [email protected]
Xiuling Ji School of Mechatronical Engineering, Beijing Institute of Technology,Beijing 100081, China, [email protected]
Takahiko Katoh Department of Public Health, Graduate School of MedicalSciences, Kumamoto University, Kumamoto, Japan, [email protected]
Mukesh Khare Department of Civil Engineering, Indian Institute of TechnologyDelhi, Delhi 110016, India, [email protected]
Gail Kinman Department of Psychology, University of Bedfordshire, Luton,Bedfordshire, LU1 3JU, UK, [email protected]
Anne Korpi Department of Environmental Science, University of EasternFinland, Kuopio, Finland; Oy Halton Group Ltd., Helsinki, Finland,[email protected]
Risto Kosonen Oy Halton Group Ltd, Helsinki, Finland,[email protected]
Naoki Kunugita Department of Environmental Health, National Institute ofPublic Health, Wako City, Saitama, Japan, [email protected]
Mariasanta Montanari Istituto Centrale per il Restauro e la Conservazione delPatrimonio Archivistico e Librario Ministero per i Beni e le Attività Culturali,00184 Rome, [email protected]
Contributors xv
Milos Nedved Occupational Safety and Hygiene Consultancy and TrainingServices, Willetton, WA 6155, Australia; School of Management, Edith CowanUniversity, Joondalup, WA 6027, Australia, [email protected]
Dan Norbäck Department of Medical Sciences, Uppsala University andUniversity Hospital, SE-751 85 Uppsala, Sweden, [email protected]
Armando C. Oliveira New Energy Technologies Unit, Faculty of Engineering ofPorto, University of Porto, Porto, Portugal, [email protected]
José A. Orosa Department of Energy and M.P., University of A Coruña.E.T.S.N.yM., Coruña, 15011, Spain, [email protected]
José Franciso Perales Laboratori del Centre de Medi Ambient, UniversitatPolitècnica de Catalunya (LCMA-UPC), 08028 Barcelona, España,[email protected]
Flavia Pinzari Istituto Centrale per il Restauro e la Conservazione del PatrimonioArchivistico e Librario. Ministero per i Beni e le Attività Culturali, 00184 Rome,Italy, [email protected]
Francisco Javier Roca Laboratori del Centre de Medi Ambient, UniversitatPolitècnica de Catalunya (LCMA-UPC), 08028 Barcelona, España,[email protected]
Shelly Rodrigo Department of Public Health and Preventive Medicine,St. George’s University School of Medicine, Grenada, The Caribbean,[email protected]
Nahed Mohamed Bassiouni Salem Librarianship and Information Department,Faculty of Arts, Sultan Qaboos University, Muscat, Sultanate of Oman,[email protected]
Berndt Stenberg Department of Public Health and Clinical Medicine,Dermatology and Venereology, Umeå University, SE-901 85 Umeå, Sweden,[email protected]
Motoko Takaoka Department of Biosphere Sciences, School of Human Sciences,Kobe College, Nishinomiya, Hyogo, Japan, [email protected]
Tarja Takki Oy Halton Group Ltd., Helsinki, Finland, [email protected]
Kirsi Villberg Oy Halton Group Ltd., Helsinki, Finland,[email protected]
Maija Virta Green Building Council Finland, Helsinki, Finland,[email protected]
S. Müjdem Vural Department of Architecture, Faculty of Architecture, YildizTechnical University, 34349 Istanbul, Turkey, [email protected]
Yufeng Zhang Department of Architecture, State Key Laboratory of SubtropicalBuilding Science, South China University of Technology, Guangzhou 510640,China, [email protected]

This is Blank Page Integra xvi

Biographies of Author
Dr. Mahmoud Yousef Abdulraheem, Author of Chapter 31
Mahmoud Yousef Abdulraheem is Director of the Research Directorate (RD) atKuwait Fund for the Advancement of Sciences (KFAS). RD is dedicated to providefunding opportunities to Kuwaiti scientists, research institutions, universities as wellas government and private institutions and companies in the areas of environment,water, human health, education and petroleum-related topics.
After serving over 27 years as in the Environment Protection Department andthe Environment Protection Council Kuwait, Dr. Abdulraheem became TechnicalCoordinator of the Regional Organization for the Protection of the MarineEnvironment (ROPME) in 1995. He then served as the Regional Director of UNEPRegional Office for the West Asia (ROWA) until 2004 and then as an advisor to theSecretary General of the Abu Dhabi Environmental Agency, before moving back toKuwait in 2008.
Dr. Abdulraheem provides consultancy to the Central Committee for the Follow-up of the Environmental Rehabilitation Program established by the Council ofMinisters, to coordinate the efforts of remediation of war related environmental
xvii

xviii Biographies of Author
damage. He also provides consultancy services to UN organization and environ-mental agencies in the region. He has written several reports for the EnvironmentProtect ion Council on health related issues, including indoor air quality, healthrisks associated with air contaminants and developing guidelines for health indoorand work environments.
Syed Uzair Ahmed, Co-author of Chapter 26
Syed Uzair Ahmed is currently a MSc. Student and Research Assistant at theDepartment of Naval Architecture and Ocean Engineering, University of Ulsan,South Korea. He is a Mechanical engineer having worked with energy and envi-ronmental projects. He did his graduation from NED University of Engineering& Technology, Karachi, Pakistan. He also served the university as a Lecturer fora year. His teaching experience is in Fluid Mechanics and Engineering Drawing.He has been very actively involved in the energy related activities. He has alsoworked on the project of Green Building designs during his studies. He alsoworked for a short time at Sultan Qaboos University in the project related to GreenBuilding design. Also, he has been a very active member of American Society ofMechanical Engineers (ASME), American society of Heating, Refrigeration andAir-Conditioning Engineers (ASHRAE) and Pakistan Heating, Ventilation, Air-conditioning and Refrigeration (Pakistan HVACR). He was also awarded fromAMSE-NED Chapter for his work. His research interests are energy systems, renew-able energy, sustainable development and green building, building controls forenergy management function and statistical analysis.

Biographies of Author xix
Mervi Ahola, Co-author of Chapter 4
M.Sc. Mervi Ahola is currently working as an Advisor at Finnish Associationof Mechanical Building Services Industries (FAMBSI). Her current responsibil-ities include project management and project work related to indoor air quality,thermal comfort and energy efficiency issues. She worked previously as an IndoorEnvironmental Specialist at Halton Group in Finland. She has also worked as aresearcher at Helsinki University of Technology and as a consultant.
Dr. Muge Akpinar-Elci, Co-author of Chapter 22 and author of Chapter 23
Dr. Muge Akpinar-Elci received her M.D. in 1991 from Dokuz Eylul University,School of Medicine in Izmir, Turkey. She completed a Pulmonology internship in1992 at the Budapest Postgraduate Medical School, Institute of Pulmonology in

xx Biographies of Author
Budapest, Hungary. In 1994 she completed a Certificate of occupational healthpractice from the Turkish Medical Association in Izmir, Turkey. Her residence inPulmonology and Tuberculosis was completed in 1997 at the Chest Diseases andSurgery Training Research Hospital, in Izmir, Turkey. In 2004 Dr. Akpinar-Elcireceived a Master of Public Health from Tulane University School of Public Healthand Tropical Medicine in New Orleans, LA.
Dr. Akpinar-Elci has clinical and field research experience in occupational healthand continues to conduct research in her current position at St. George’s University.Her areas of expertise include Occupational Health, Public Health, Epidemiology,Occupational Respiratory Diseases, and Respiratory Research Methods.
She has been the recipient of several awards including: Centers for DiseaseControl and Prevention, Bullard-Sherwood Research to Practice award, 2008; EastCarolina University Division of Health Sciences, Author Recognition Award 2006;On-the-Spot-Award of Department of Health and Human Services, Public HealthService for commitment, initiative, and hard work under difficult circumstances in2002 and 2006.
Dr. Akpinar-Elci is currently an Associate Professor at St George’s UniversitySchool of Medicine, in the Department of Public Health and Preventive Medicineand Track Director of Environmental and Occupational Health.
Prof. Dr. Sabah A. Abdul-Wahab, Editor of the book and author of Chapters 12 and 26
Sabah A. Abdul-Wahab is currently a Full Professor in the Department ofMechanical and Industrial Engineering, College of Engineering, Sultan QaboosUniversity in Oman. She is a Chemical Engineer experienced in environmental engi-neering, with an emphasis on environmental protection. She received her doctoratefrom Bath University, UK in 1999. Her teaching experience is in the areas of unitoperations, mass transfer, transport phenomena, reactor design, thermodynamics,heat transfer, computer programming, numerical methods, wastewater treatment,landfills and environmental engineering. She has been actively involved in envi-ronmental chemical engineering research. Prof. Abdul-Wahab has published more

Biographies of Author xxi
than 100 referred international journal articles and around 10 chapters in books.The publications covered chemical and environmental engineering topics as wellas various academic and educational issues. She has served as the Editor of aSpecial Issue on the “The International Journal of Environmental Studies” enti-tled “Women’s Environmental Activities in the Middle East and North Africa”(in 2009). She has also served as the Editor of a Special issue of the “AmericanJournal of Environmental Sciences”, 2 volumes (in 2006–2008). Also, she has beeninvited to be a member of editorial boards of many international environmentaland engineering journals. Prof. Abdul-Wahab has received several research awardsrecognitions, the latest of which were First Prize of the Saudi Arabia EnvironmentalManagement Award (Arab Administrative Development Organization, ARADO,League of Arab States, December 2008), Distinguished Teaching Excellence Award(College of Engineering, Sultan Qaboos University, 2 May 2007), EnvironmentalAdvocacy Award from the Arab Towns Organization Award (30 April 2007),and Distinguished Researcher Award (College of Engineering, Sultan QaboosUniversity, 2 May 2005). Her research interests are liquid desiccant air dehumid-ifier studies, monitoring of pollutants in the atmosphere, modelling and assessment,outdoor air quality, indoor air quality, air pollution control, modelling and chem-istry of ozone formation, modelling of the dispersion of air pollution in theatmosphere, thermal inversion, particulate pollutants characteristics, environmen-tal impact assessment studies, atmospheric corrosion of metals, neural network andstatistical analysis, water desalination, solar and renewable energy.
Emeritus Prof. Dr. Keiichi Arashidani, Co-author of Chapter 15
Dr Keiichi Arashidani is currently an Emeritus Professor in the Department ofEnvironmental measurement and Control, School of Health Sciences, Universityof Occupational and Environmental Health, Japan. He received the Doctor Degreeof Science at Tokyo University Science, Japan in 1976. In 2006, he was presented

xxii Biographies of Author
with the scientific award from Japan Society for Atmospheric Environment. He is aDirector of the Japan Society for Atmospheric Environment.
During his educational activities at the university education for 30 years, hehas been teaching subjects in the field of working environmental control, indus-trial health, environmental science, atmosphere environment. His research topicswere monitoring of pollutants including the polycyclic aromatic hydrocarbons inthe atmosphere, outdoor and indoor air quality, chemical sensitivity, nanomaterialcharacterization in factory, nanomaterial toxicology, human health estimation ofenvironmental tobacco smoke, estimation of the health effect at toluene exposure,and so on. He is interested in the wide area pollutions as such yellow sand and hehas been energetically investigating it recently.
Prof. Dr. Ayse Balanlı, Author of Chapter 7 and co-author of Chapter 20
Prof. Dr. Ayse Balanlı is currently a fulltime Professor in Department ofArchitecture, Faculty of Architecture, Yildiz Technical University, Istanbul, Turkey.She studied in I.D.G.S.A (Istanbul State Academy of Fine Arts) Departmentof Architecture, got her bachelor and master’s degree in the same universityin 1973. She started her academic career in 1975 as a research assistant atI.D.M.M.A. (Istanbul State Academy of Engineering and Architecture), Departmentof Architecture. She has concluded her PhD studies in 1981 in the same university.In 2006 she was appointed Professor at Yildiz Technical University. She has devel-oped and taught a course for postgraduate and doctoral students about BuildingBiology for first time in Turkey in 1983 and also she has taught a number ofother graduate and post graduate courses including “Architectural Design Studio 2”,“Application Project 1”, “Building Elements 1”, “Building Elements 2”, “ProductSelection Methods 1”, “Product Selection Methods 2”, “Seminar”, “Methodology”.She has been and is advisor of many master and doctoral students. She has also beenon the juries of many master and doctoral thesis. She has many articles and papersin international and national journals, conferences, seminars about building biol-ogy, product selection methods, building materials, building components, indoor airquality and architectural education and she has written two books: Yapı Biyolojisi –Yaklasımlar (Building Biology – Approaches) and Yapıda Ürün Seçimi (Product

Biographies of Author xxiii
Selection in Buildings). She has held many administrative titles during her academiclife and currently she is the head of Building Science Unit and Building Elementsand Materials Division in Yildiz Technical University Architecture Department.
Andrew Clements, Co-author of Chapter 21
Andrew Clements is a PhD student at the University of Bedfordshire, UK. Hisresearch programme focuses on issues relating to the commitment of students train-ing for vocations such as nursing and social work. Other research interests includewellbeing, and organizational and professional cultures. He is also a member ofthe UK Psychology Postgraduate Affairs Group (PSYPAG) committee as a SectionRepresentative.

xxiv Biographies of Author
Prof. Derek Clements-Croome, Author of Chapter 13
Professor Derek Clements-Croome is founder of the MSc Intelligent BuildingsCourse at the University of Reading originally funded by EPSRC. The second edi-tion of the book Creating the Productive Workplace (Clements-Croome 2000) waspublished by Routledge in 2005. The book Intelligent Buildings (Clements-Croome2004) became available in 2004 and is also available in Chinese since 2006.
He has a portfolio of many projects including sustainability, building facades,system reliability, building rating methodology (recently with the University ofDundee and Hilson Moran) and design quality (including ventilation) in schools andthe effects of design on students learning. All these projects were funded by EPSRC/former DTI. He works in China, Sudan, Hungary, Finland and other countries.
He was Vice-President of CIBSE in 2005–2007 and chairs CIBSE committeeson Intelligent Buildings that has over 3,000 members from over 118 countries,and Natural Ventilation of a similar size. He is a member of the College forEngineering and Physical Sciences Research Council ( EPSRC) and also has servedon the Dynamics of Ageing Panel for the Economics and Social Sciences ResearchCouncil.
He was President of National Conference of University Professors in UK in2006–2008. He is founder and Editor of the peer reviewed journal Intelligent
Buildings International published by Earthscan since 2009. He is also a memberof the UK Green Building Council and sits on the Board for the British Council forOffices.
He is an amateur violinist and violist.
Biographies of Author xxv
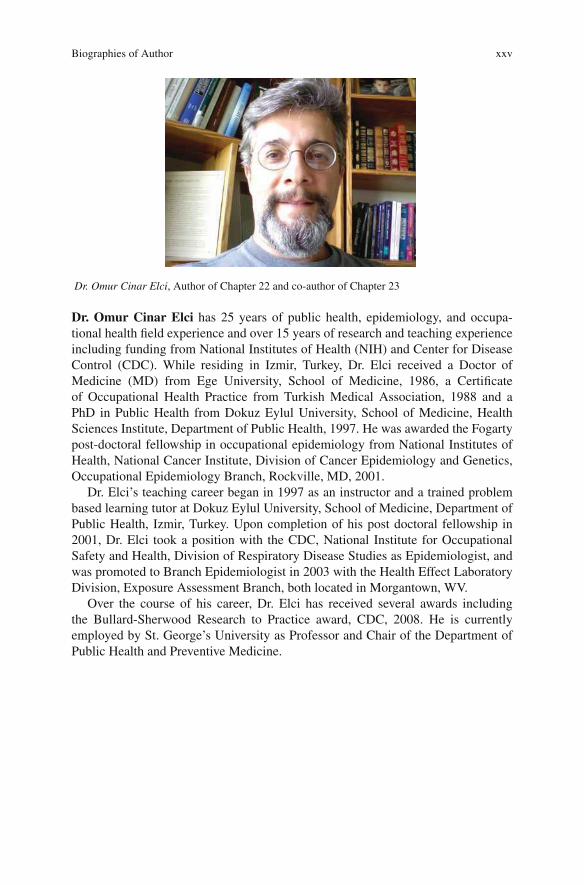
Dr. Omur Cinar Elci, Author of Chapter 22 and co-author of Chapter 23
Dr. Omur Cinar Elci has 25 years of public health, epidemiology, and occupa-tional health field experience and over 15 years of research and teaching experienceincluding funding from National Institutes of Health (NIH) and Center for DiseaseControl (CDC). While residing in Izmir, Turkey, Dr. Elci received a Doctor ofMedicine (MD) from Ege University, School of Medicine, 1986, a Certificateof Occupational Health Practice from Turkish Medical Association, 1988 and aPhD in Public Health from Dokuz Eylul University, School of Medicine, HealthSciences Institute, Department of Public Health, 1997. He was awarded the Fogartypost-doctoral fellowship in occupational epidemiology from National Institutes ofHealth, National Cancer Institute, Division of Cancer Epidemiology and Genetics,Occupational Epidemiology Branch, Rockville, MD, 2001.
Dr. Elci’s teaching career began in 1997 as an instructor and a trained problembased learning tutor at Dokuz Eylul University, School of Medicine, Department ofPublic Health, Izmir, Turkey. Upon completion of his post doctoral fellowship in2001, Dr. Elci took a position with the CDC, National Institute for OccupationalSafety and Health, Division of Respiratory Disease Studies as Epidemiologist, andwas promoted to Branch Epidemiologist in 2003 with the Health Effect LaboratoryDivision, Exposure Assessment Branch, both located in Morgantown, WV.
Over the course of his career, Dr. Elci has received several awards includingthe Bullard-Sherwood Research to Practice award, CDC, 2008. He is currentlyemployed by St. George’s University as Professor and Chair of the Department ofPublic Health and Preventive Medicine.

xxvi Biographies of Author
Dr. Eva Gallego, Author of Chapter 16
Eva Gallego, Environmental Sciences, Graduated and PhD by the UniversitatAutònoma de Barcelona (UAB). She developed her PhD research in the ConsejoSuperior de Investigaciones Científicas (CSIC), Spain, in the distribution and theprocesses that experience natural and anthropogenic pollutants in the ecosystems.Since 2006 Eva has been working in the Laboratori del Centre de Medi Ambient(LCMA), of the Universitat Politècnica de Catalunya (UPC), specializing in chem-ical air quality research. She also develops different educational activities in theUPC in the areas of chromatography and chemical detection of odours. She has apermanent collaboration with the National Centre for Working Conditions (CNCT)from Barcelona, of the National Institute of Safety and Health (INSHT, Ministryof Labour of Spain), within the program of Environmental and Biologic Analysisfor the development of scientific work in the atmospheric environmental area.Dr. Gallego has published 9 referred international journal articles and 4 chaptersin books. The publications covered both indoor and outdoor air quality as well asmethodologies to determine the origin of odours and chemical pollutants throughchemical analysis of pollutants, social participation and numerical modelling. Shehas worked in 10 research projects, both European and National, and has also partic-ipated in 14 projects with special relevance with companies and/or private or publicfunding bodies. Her research interests are the assessment of pollutants in the atmo-sphere through chemical control and a posterior modelling of air quality in urban,industrial and rural zones. Indoor air quality, sick building syndrome and multiplechemical sensitivity are also topics of her concern.

Biographies of Author xxvii
Dr. Radha Goyal, Author of Chapter 10
Radha Goyal is currently employed as Fellow Scientist at Delhi Zonal Laboratoryof National Environmental Engineering Research Institute (NEERI), one of the pres-tigious laboratories under Council of Scientific and Industrial Research (CSIR),India. She is an Environmental Scientist having experience in air pollution andhealth with special emphasis on indoor air quality and exposure assessment. Shereceived her doctoral degree from Department of Civil Engineering, Indian Instituteof Technology Delhi in year 2009 and master’s degree from G.G.S. IndraprasthaUniversity, Delhi in year 2001. Dr. Radha has published more than 7 articles in inter-national journals of repute and 3 chapters in books. She has presented more than 10papers in various international and national conferences, seminars and workshops.Her publications are on various environmental issues such as biological treatmenttechnologies for industrial wastewaters, rainwater harvesting, studying propertiesof fly ash for its reuse as a land filling material, indoor air pollution, health etc.Her research interests are mainly in area of air pollution monitoring, modeling andexposure assessment, climate change and sustainable development.

xxviii Biographies of Author
Dr. Gustavo Silveira Graudenz, Author of Chapter 18
Gustavo Silveira Graudenz Graduated in medicine in 1991, finished medical spe-cialization in allergy and immunology in 1998. Gets the PhD degree from theUniversity of Sao Paulo, Brazil in 2002, in indoor pollution exposure in office build-ings. Finishes post-doc in the University of Sao Paulo in a multidisciplinary workon temperature changes exposure to allergic groups in 2006. Clinical AssociateProfessor of Medicine (immunology and microbiology division), Nove de JulhoUniversity in Sao Paulo since 2010.
Dr. Xavier Guardino-Solà, Co-author of Chapter 16
Xavier Guardino-Solà, Chemical Engineer, Graduated and PhD by the Universitatde Barcelona (UB), Master in Engineering and Environmental Management by theUniversitat Politècnica de Catalunya (UPC), Barcelona, Technical Auditor fromENAC and Specialist on Working Risk Assessment, is currently the Head ofDepartment of Information and Documentation of the National Centre for Working

Biographies of Author xxix
Conditions (CNCT) from Barcelona, of the National Institute of Safety and Health(INSHT, Ministry of Labour of Spain). From 1972 to 1977 he worked at theCentre for Research and Development (CID) of the National Council for ScientificResearch (CSIC) at Barcelona. From 1977 until 2008 he worked as a Chief ofLaboratory of Gas Chromatography, as Chief of Hygiene and Chemical AnalysisUnit and, since 2008, as a Head of Department of the INSHT. He develops differ-ent educational activities in the INSHT and also at several universities: IQS-URL,UB, Pompeu Fabra, Autonomous University of Barcelona, UPC, Rovira i Virgili(Tarragona), Vic (Barcelona), Oviedo, and Tenerife (Canary Islands, Spain). He wasthe Editor of the Chapter Indoor Air Quality of the Encyclopaedia of OccupationalHealth and Safety (4th edition) of the International Labour Office and author ofsome chapters of books and papers and scientific communications on AnalyticalChemistry (mainly Chromatography), Environmental Quality, Safety and Health,Indoor Air Quality and Prevention of Health at Work. He has participated indifferent activities of de UE (i.e., SAIL Group and at RiskofDerm Project (QLK4-CT-1999-01107)). He is author or co-author of 63 papers and 117 oral and posterspresentations in a national and international meetings and conferences.
Dr. Hülya Gül, Author of Chapter 5
Hülya Gül has been working in the Department of Public Health in Medical Faculty,Istanbul University. She got her PhD degrees in preventive oncology and publichealth from Istanbul University Medical Faculty in 1995 and 2002, respectively. Shestudied at the Occupational Studies Section of National Cancer Institute in NationalInstitute of Health in USA for a term in 1992. She has been actively involving inresearch on environmental and occupational health. She is the author of about morethan 80 papers in national and international journals and conference proceedings.She has taken 20 projects from the Research Fund of the University of Istanbul and
xxx Biographies of Author
other sources. She has five scientific awards. She is a member of national and inter-national commissions and working groups on industrial safety and environmentalhealth. Her major areas of interest are the chemical and psychological risks in thework environment, risk assessment and management, environmental epidemiology,indoor and outdoor air quality, occupational cancer epidemiology etc.
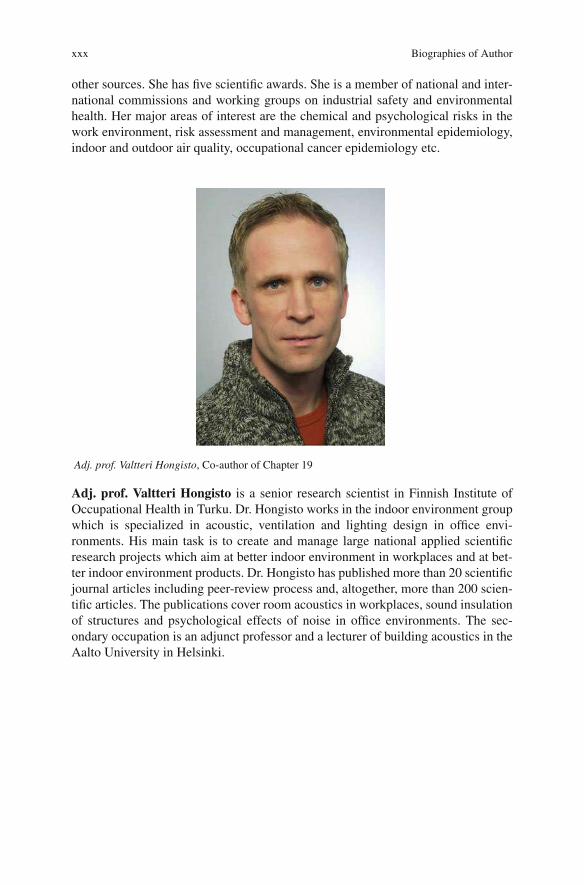
Adj. prof. Valtteri Hongisto, Co-author of Chapter 19
Adj. prof. Valtteri Hongisto is a senior research scientist in Finnish Institute ofOccupational Health in Turku. Dr. Hongisto works in the indoor environment groupwhich is specialized in acoustic, ventilation and lighting design in office envi-ronments. His main task is to create and manage large national applied scientificresearch projects which aim at better indoor environment in workplaces and at bet-ter indoor environment products. Dr. Hongisto has published more than 20 scientificjournal articles including peer-review process and, altogether, more than 200 scien-tific articles. The publications cover room acoustics in workplaces, sound insulationof structures and psychological effects of noise in office environments. The sec-ondary occupation is an adjunct professor and a lecturer of building acoustics in theAalto University in Helsinki.
Biographies of Author xxxi
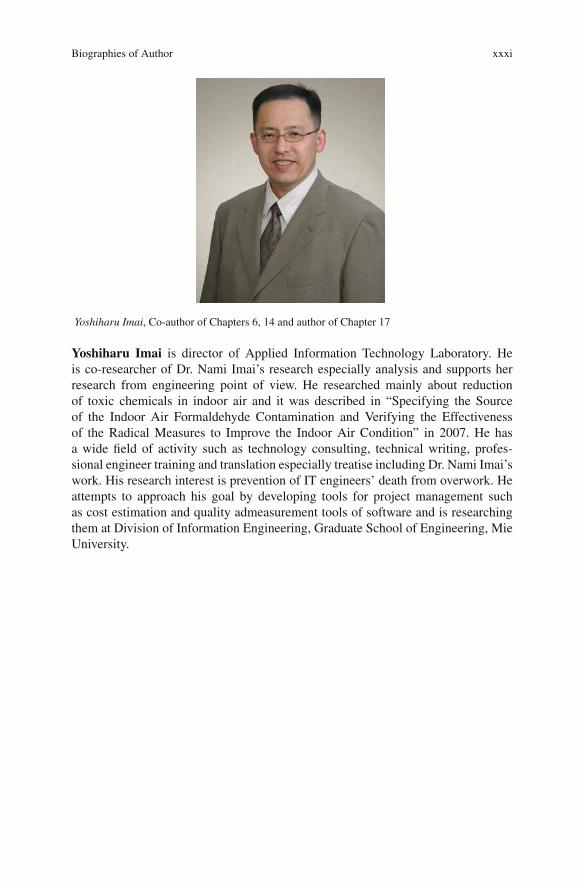
Yoshiharu Imai, Co-author of Chapters 6, 14 and author of Chapter 17
Yoshiharu Imai is director of Applied Information Technology Laboratory. Heis co-researcher of Dr. Nami Imai’s research especially analysis and supports herresearch from engineering point of view. He researched mainly about reductionof toxic chemicals in indoor air and it was described in “Specifying the Sourceof the Indoor Air Formaldehyde Contamination and Verifying the Effectivenessof the Radical Measures to Improve the Indoor Air Condition” in 2007. He hasa wide field of activity such as technology consulting, technical writing, profes-sional engineer training and translation especially treatise including Dr. Nami Imai’swork. His research interest is prevention of IT engineers’ death from overwork. Heattempts to approach his goal by developing tools for project management suchas cost estimation and quality admeasurement tools of software and is researchingthem at Division of Information Engineering, Graduate School of Engineering, MieUniversity.

xxxii Biographies of Author
Dr Nami Imai, Author of Chapters 6, 14 and co-author of Chapter 17
Nami Imai is currently an Associate Professor in the School of Nursing Facultyof Medicine, Mie University in Japan. She was a registered nurse experienced insurgical unit and emergency unit at Mie University Hospital in Japan. She receivedher doctorate from Osaka University, Japan in 2005. Her teaching experience is inthe areas of human anatomy and structure, basic nursing concepts, nursing theoryand nursing process, science and art in nursing and clinical ecology nursing. Sheis an active researcher in a field of human actions related the environment, and shetalked about her researches at IPP-SHR interview at 2008 (listen to the web-site;IPP-SHR, podcast #52). Dr. Imai is managing to the Nursing Counseling Room(NCR) in the city of Tsu, Mie, Japan from 2006. Her research interest are pattern ofbehavior of sick building syndrome (SBS) and multiple chemical sensitivity (MCS)patients, expansion of nursing with SBS and MCS, establish the clinical ecologynursing. She became a mother of a baby boy at October 2009, and she becameincreasingly active for the future and health of human beings and also for her son.

Biographies of Author xxxiii
Dr Janis Jansz, Author of Chapters 1, 2 and 30
Dr Janis Jansz, RN., Dip.Tch., BSc, Grad.Dip. OHS, MPH, PhD, FSIA isemployed as a Senior Lecturer in Occupational Health and Safety EnvironmentalHealth at Curtin University and has an Adjunct Senior Lecturer appointment atEdith Cowan University in the School of Management. Since 1996 Janis hasbeen the Director of the International Labour Organisation (ILO) Communications,Information, Safety (CIS) Centre in Western Australia. She has been a member ofthe Executive Committee of the Safety Institute of (Western) Australia Inc. from1990 and was the first female President from 1997 to 2000. Janis was Editor of theAustralian National Safety Journal from 1994 to 2000. She was awarded the “SafetyInstitute of (Western) Australia Inc. Member of the Year” in 1994 and in 1999 forher professional work in improving occupational safety. Dr Jansz is a Member ofthe Curtin Health Innovation Research Institute, the World Health OrganisationCollaborating Centre for Environmental Health Impact Assessment, Centre forResearch in Entertainment, Arts, Technology, Education and Communications anda Member of the Curtin – Monash Accident Research Centre. Since 1988 Janis hasbeen a Member of the Occupational Health Society and is currently an ExecutiveCommittee Member of this organisation. Since 1997 Janis has been Director, WorldSafety Organisation National Office for Australia, Member of the Board of Directorsfor World Safety Organisation and Editor of the World Safety Journal from 2002.She continues to hold all of these positions. In 2005 Dr Jansz was awarded theWorld Safety Education Award for her contribution internationally to providingoccupational safety and health education. In recognition of her professional workimproving occupational safety and health world-wide through her teaching, researchand professional work in improving occupational safety and health Dr Janis Janszwas presented with the award of ’World Safety Person of the Year at the WorldSafety Conference in the United States of America in 2001.

xxxiv Biographies of Author
Dr Jansz began her career working as a registered nurse where she cared forpeople who were ill, injured and people who died. She enjoys working as anoccupational safety and health professional because she has the opportunity toimprove people’s health, the work environment, work processes, management andbusiness profitability while preventing people from becoming ill, injured or dyingdue to work related causes. Dr Jansz appreciates being able to share occupa-tional safety and health knowledge with other people through teaching, researchand writing activities. Author of over 100 journal articles, textbook chapters andconference papers she has written the distance education material for 18 units ofoccupational safety and health study for two universities. Research and teachingactivities are centred on Occupational Safety and Health Management, Ergonomics,Communicable Disease Control, Health Promotion, Safety Inspections, Audits andRisk Management, Accident Prevention and on developing Safety ManagementPlans, Occupational Safety and Health Policies, Procedures and Programs.
Dr Xiuling Ji, Co-author of Chapter 29
Dr Xiuling Ji is currently an Assistant Professor in the School of MechatronicsEngineering at Beijing Institute of Technology in China. She received her doc-torate from Chinese Academy of Preventive Medicine in 2003. She has beenactively involved in built environment research and her research interests are humanresponses to indoor and outdoor thermal environment, CFD simulation of indoorflow fields, heat and mass transfer modelling and environmental impact assessment.

Biographies of Author xxxv
Prof. Dr. Takahiko Katoh, Co-author of Chapter 15
Takahiko Katoh is currently a Chief Professor in the Department of Public Health,Graduate School of Life Sciences, Kumamoto University in Japan. He graduatedfrom School of Medicine, University of Occupational and Environmental Health(UOEH) in 1984 and received his doctorate from UOEH, Japan in 1992. His teach-ing experience is in the areas of environmental health, occupational medicine, andcancer epidemiology. He also has been actively involved in environmental andmolecular epidemiology. Dr. Katoh has published more than 100 referred interna-tional journal articles and around 10 chapters in books. The publications coveredenvironmental and occupational Helath. He has served as the member of EditorialBoard of “Environmental Health and Preventive Medicine (2003–2006)”and“Japanese Journal of Clinical Oncology (2005-present)”. Dr. Katoh has receivedseveral research awards recognitions, the latest of which were the Academic Awardof Japan Society for Occupational Health in 2010.
xxxvi Biographies of Author
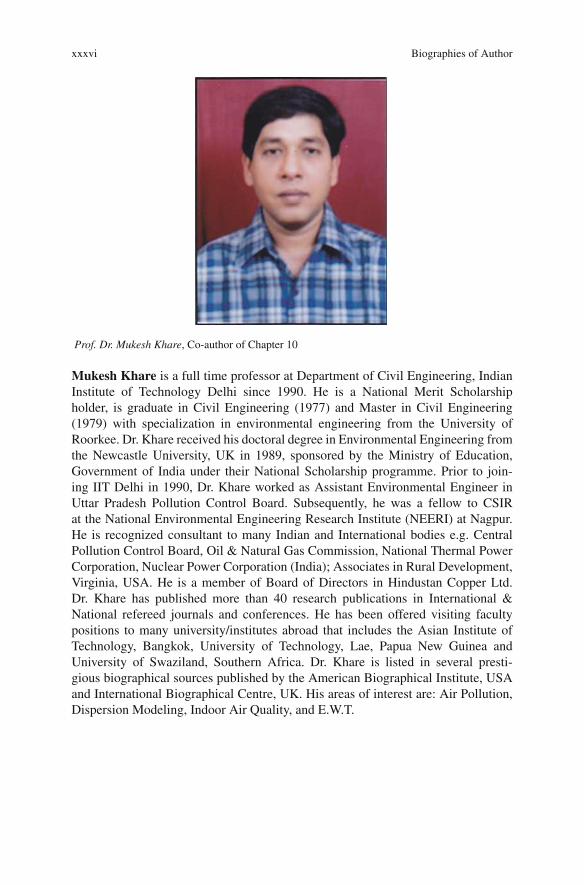
Prof. Dr. Mukesh Khare, Co-author of Chapter 10
Mukesh Khare is a full time professor at Department of Civil Engineering, IndianInstitute of Technology Delhi since 1990. He is a National Merit Scholarshipholder, is graduate in Civil Engineering (1977) and Master in Civil Engineering(1979) with specialization in environmental engineering from the University ofRoorkee. Dr. Khare received his doctoral degree in Environmental Engineering fromthe Newcastle University, UK in 1989, sponsored by the Ministry of Education,Government of India under their National Scholarship programme. Prior to join-ing IIT Delhi in 1990, Dr. Khare worked as Assistant Environmental Engineer inUttar Pradesh Pollution Control Board. Subsequently, he was a fellow to CSIRat the National Environmental Engineering Research Institute (NEERI) at Nagpur.He is recognized consultant to many Indian and International bodies e.g. CentralPollution Control Board, Oil & Natural Gas Commission, National Thermal PowerCorporation, Nuclear Power Corporation (India); Associates in Rural Development,Virginia, USA. He is a member of Board of Directors in Hindustan Copper Ltd.Dr. Khare has published more than 40 research publications in International &National refereed journals and conferences. He has been offered visiting facultypositions to many university/institutes abroad that includes the Asian Institute ofTechnology, Bangkok, University of Technology, Lae, Papua New Guinea andUniversity of Swaziland, Southern Africa. Dr. Khare is listed in several presti-gious biographical sources published by the American Biographical Institute, USAand International Biographical Centre, UK. His areas of interest are: Air Pollution,Dispersion Modeling, Indoor Air Quality, and E.W.T.

Biographies of Author xxxvii
Prof. Dr. Gail Kinman, Author of Chapter 21
Dr Gail Kinman is Professor of Occupational Health Psychology at the Universityof Bedfordshire, UK. She is a Chartered Psychologist with the British PsychologicalSociety, a Chartered Scientist, a member of the American Psychological Associationand a Fellow of the Higher Education Academy. Dr. Kinman received her doc-torate from the University of Hertfordshire, UK for a dissertation that examinedwell-being and work-life balance in academic employees working in UK universi-ties. Her primary research interests focus on work-related stress, work-life balance,emotional labour and emotional intelligence and how they relate to the wellbeingof employees. Dr. Kinman is currently working with groups of health and socialcare professionals with a view to enhancing their resilience and wellbeing. Otherresearch interests include lay theories of health and illness and aspects of psycho-oncology, including the role played by health-related cognitions in the wellbeingof cancer patients, and how people with cancer might be best supported in theirreturn to work. She has published numerous journal articles and written several bookchapters on these topics. Dr. Kinman’s work is regularly presented at national andinternational conferences. She is a member of the BPS Press and Media Committeewhich aims to promote psychology to the lay public and speak regularly on behalfof the Society to radio, newspaper and magazine journalists.

xxxviii Biographies of Author
Dr. Anne Korpi, Co-author of Chapter 19 and author of Chapter 24
Dr. Anne Korpi, Ph.D., Docent, is a Research Specialist at University of EasternFinland, Kuopio, and currently holds an Indoor Environmental Specialist position atHalton New Ventures Business Area in Helsinki, Finland. Her research interest hasaddressed exposure and health risk assessment of indoor air contaminants, partic-ularly microorganisms, allergens, MVOC, and SVOC. She has published about 30peer reviewed articles in international scientific journals and conference proceedingsand about 60 other publications.
Dr. Sc. Risto Kosonen, Author of Chapter 4 and co-author of Chapters 19 and 24
Dr. Sc. Risto Kosonen, is currently Director of Technology Center at Halton Groupin Finland. His research experience is in the areas of air distribution, ventilationefficiency, perceived air quality and thermal comfort, energy efficiency, automation

Biographies of Author xxxix
and HVAC systems. Dr. Kosonen has published more than 110 referred internationaljournal/conference articles and over 20 research publications/chapters of books. Thepublications covered indoor conditions and energy efficiency topics as well as var-ious academic and state-of-the art of technology issues. Dr. Kosonen is a memberof REHVA Technical Committee, a member of ASHRAE and a member of edito-rial advisory board of international journals (Energy and Buildings, Building andEnvironment, Experiment Thermal and Fluid Science and Open Construction andBuilding Technology). In previous jobs, Dr. Kosonen has worked over 8 years as aresearcher at Technical Research Center of Finland and about 5 years as a consul-ter. He has also previously worked as an Associate Professor (deputy) at HelsinkiUniversity of Technology.
Dr. Naoki Kunugita, Author of Chapter 15
Naoki Kunugita is currently a Director in the Department of Environmental Health,National Institute of Public Health in Japan. He graduated from School of Medicine,University of Occupational and Environmental Health (UOEH) in 1985 and receivedhis doctorate from UOEH, Japan in 1991. He is studying and teaching in the areasof environmental health, occupational medicine, public health and radiation biology.Recently he and his colleagues have published many papers about not only chemicalanalysis of indoor air quality but also biological effects in animals exposed to lowdose of volatile organic compounds. He has served as a member of the board ofdirectors of “Society of Indoor Environment, Japan” and “Japan Society of RiskManagement for Preventive Medicine”
xl Biographies of Author
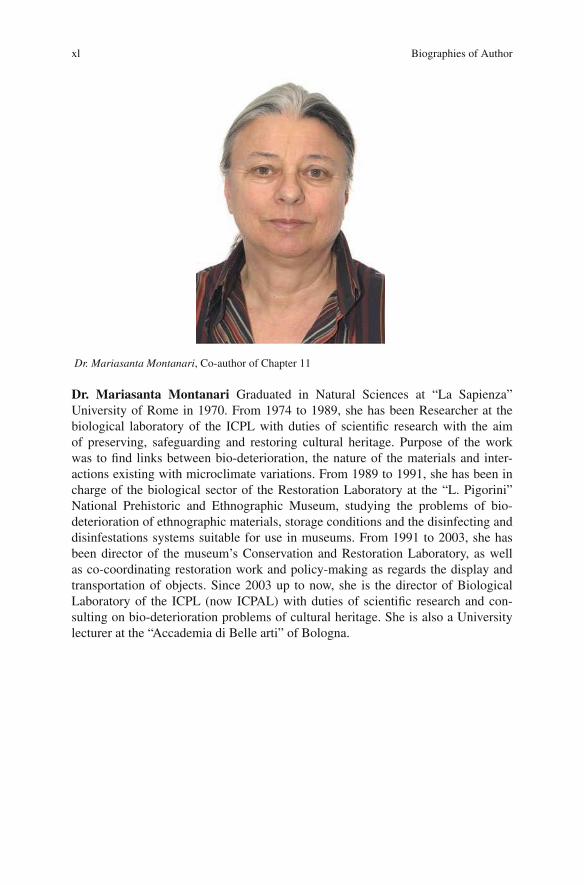
Dr. Mariasanta Montanari, Co-author of Chapter 11
Dr. Mariasanta Montanari Graduated in Natural Sciences at “La Sapienza”University of Rome in 1970. From 1974 to 1989, she has been Researcher at thebiological laboratory of the ICPL with duties of scientific research with the aimof preserving, safeguarding and restoring cultural heritage. Purpose of the workwas to find links between bio-deterioration, the nature of the materials and inter-actions existing with microclimate variations. From 1989 to 1991, she has been incharge of the biological sector of the Restoration Laboratory at the “L. Pigorini”National Prehistoric and Ethnographic Museum, studying the problems of bio-deterioration of ethnographic materials, storage conditions and the disinfecting anddisinfestations systems suitable for use in museums. From 1991 to 2003, she hasbeen director of the museum’s Conservation and Restoration Laboratory, as wellas co-coordinating restoration work and policy-making as regards the display andtransportation of objects. Since 2003 up to now, she is the director of BiologicalLaboratory of the ICPL (now ICPAL) with duties of scientific research and con-sulting on bio-deterioration problems of cultural heritage. She is also a Universitylecturer at the “Accademia di Belle arti” of Bologna.

Biographies of Author xli
Dr. Milos Nedved, Author of Chapter 28
Dr. Milos Nedved is now a full time safety consultant, whilst holding an adjunctassoc. Professor appointment at the School of Management, Edith Cowan Universityin Western Australia. Previously he held several senior academic appointmentincluding two professorial positions at European universities. He has also worked asa United Nations Expert in occupational safety and health, attaining the highest pro-fessional level in the United Nations system, that of Chief Technical Advisor. He isthe author of over 150 journal articles, conference papers and a number of textbookchapters. In the early part of his career, he spent 15 years in the chemical industriesof several European countries. He has been widely lecturing overseas, and deliveredconference papers and/or run training courses in the USA, Czechoslovakia, England,Federal Republic of Germany, Philippines, Thailand, Indonesia, Hong Kong, Japan,China, Singapore and Malaysia.

xlii Biographies of Author
Dr. Dan Norbäck, Co-author of Chapter 8
Dan Norbäck is currently an Associate Professor in Occupational andEnvironmental Medicine, at Department of Medical Sciences, Uppsala University.It is combined with employment at the University Hospital in Uppsala, Sweden.His main research field is environmental epidemiology and indoor exposure assess-ment. The focus has been on associations between indoor environmental exposureand health in children and adults, especially asthma, respiratory health, allergy,and sick building syndrome (SBS). The exposures have included various chemi-cals, VOC, microbial compounds, moulds, bacteria, allergens, particles, buildingventilation and indoor climate. Various indoor environments have been studied, e.g.dwellings, schools, day care centres, offices, hospitals, hotels, and the cabin environ-ment in aircraft. Some studies have covered respiratory health in relation to outdoorair pollution and dietary factors, as well as early life exposure. Comparative epi-demiological school environment studies have been performed in many countries inEurope and Asia. He has a basic university education in chemistry, especially ana-lytical chemistry, biology, and environmental science at Uppsala University, and agovernmental education in safety engineering at the Swedish Labour Inspectorate.He has been teacher at the course in occupational and environmental medicine formedical doctors at Uppsala University. He received his doctorate in 1990 from theMedical Faculty at Uppsala University with the title “Environmental exposures andpersonal factors related to sick building syndrome”. He has published more than200 original articles in international journals with peer review and around 30 sci-entific book chapters or review articles. He has been main tutor for seven doctoraltheses, and co-tutor for three doctoral thesis, and chairperson at various workshopsand international scientific conferences. Member of several international scientificco-operation projects within the European Union, including the European HealthRespiratory Survey (ECRHSII), aircraft environment (CABINAIR), indoor environ-ment in nursing homes for elderly (GERIE), and three school environment projects(HESE, HESEINT and SINPHONIE). Bilateral co-operation with researchers inNorway, Iceland, Slovenia, Iran, China, Korea, Malaysia and Japan, mainly onepidemiological studies in relation to the school and the home environment.

Biographies of Author xliii
Dr. Armando C. Oliveira, Co-author of Chapter 27
Armando C. Oliveira is Head of the New Energy Technologies Research Unit,which exists within the Institute of Mechanical Engineering – FEUP (Faculty ofEngineering of the University of Porto). He has coordinated and participated in13 European research and development projects related to the development of newand sustainable energy systems, especially solar thermal systems (heating, cool-ing and CHP systems). Nowadays, he is Secretary-General of the World Society ofSustainable Energy Technologies and co-responsible for the conference series onSustainable Energy Technologies, with several editions held in Europe, Asia andAmerica.
He is Executive Editor of the Int. Journal of Low Carbon Technologies (OxfordUniversity Press, UK) and member of the Editorial Board of the Int. Journal ofAmbient Energy (Ambient Press Ltd, UK). He is a Member of the Engineering andPhysical Sciences Research Council Peer Review College (UK).

xliv Biographies of Author
Prof. Dr. Jose Antonio Orosa Garcia, Author of Chapter 27
Jose Antonio Orosa Garcia is a PhD in Marine Engineering and graduated inMarine Engineering and Naval Architecture from the University of A Coruña. Hisresearch is related to indoor ambiences and energy saving. In the recent past, he hasparticipated in the International Energy Agency Annex 41 and collaborated withthe University of Porto in research on energy saving and work risk prevention inindoor ambiences. Presently, he is Professor of HVAC and Head of the Departmentof Energy and Marine Propulsion of the University of A Coruña (Spain). He is amember of the Society of Naval Architects and Marine Engineers (SNAME) andASHRAE.
Dr. José-Francisco Perales Lorente, Co-author of Chapter 16
José-Francisco Perales Lorente, PhD., an Industrial Engineer, has been associateprofessor at the Polytechnic University of Catalonia (UPC) and is accredited as lec-tor professor in engineering for all Catalan Universities. He is currently developing

Biographies of Author xlv
its research activity at the Laboratory of Environmental Centre (LCMA/www.upc.edu/lcma/) in air quality mathematical modelling. Dr. J-F Perales is also a memberof a consolidated research group at the Science and Technology Ministry of Spain.He is currently studying the incidence of odour episodes caused by volatile organiccompounds (VOC) under a very complete prospective that includes: the characteri-zation of VOC emissions (chemical characterization), the transport of the pollutantsthrough air dispersion, and the study of VOC immission levels throughout the vali-dation of the modelling results using field work and social participation. Dr. Peraleshas managed several European projects on environmental topics and in renew-able energy areas (pyrolysis and gasification of coal, biomass and waste materials)with international partnership, and national and regional projects under the stateand autonomic governments. He has also developed technologies and modellingin fluidization (fast and bubbling fluidization) for multi-size particle distributionapplied to pyrolysis and gasification reactors, and in kinetics and thermal studies ofcombustible materials.
Dr. Flavia Pinzari, Author of Chapters 9 and 11
Dr. Flavia Pinzari is a biologist specialised in mycology and applied microbiology.Is Researcher at the Laboratory of Biology at the Central Institute for Restorationand Conservation of Archival and Documental Cultural Heritage (ICPAL, Ministryof Cultural Heritage, Italy), and Contract Professor of Microbiology at theUniversity of Tor Vergata in Rome. She received her doctorate in EcologicalSciences from the University “Sapienza” of Rome and she specialized in PlantBiotechnologies at the University of Pisa (Italy) and in Chemistry of the OrganicNatural Products in Rome. Her teaching experience is in the areas of ecology,microbiology, biodeterioration of cultural heritage, applied mycology, and statisticsapplied to biological sciences. Dr F.Pinzari has extensively published internationaljournal articles on mycology and biodeterioration and biodegradation of organic

xlvi Biographies of Author
materials, as well as several educational and technical issues. Her research interestsare currently focused on early detection of fungal and microbial contamination inthe indoor environment, indoor air quality, scanning electron microscopy techniquesapplied to the study of biodeterioration phenomena, microbial ecology in manmadeenvironments.
Dr. Francisco-Javier Roca, Co-author of Chapter 16
Francisco-Javier Roca is currently a Research Promoter in the Department ofChemical Engineering at the faculty of Industrial Engineering of Barcelona,Polytechnic University of Catalonia (UPC). He is a Chemical Engineer (UPC)and a Qualified Person in Industrial Environment (Ministry of Industry, Spain).His doctorate (UPC) research was based in the investigation and application ofsocial participation in air quality studies. He has teaching experience in the areas ofchemical analysis, environmental engineering, control of industrial pollutants andevaluation processes of air quality in urban areas, and he has also been activelyinvolved in research based on air quality control in urban, industrial and rural areas.Dr. Francisco-Javier Roca has been the Director of the Governmental EnvironmentalAgency (Spain) specialized in control of industrial air emissions and technical eval-uation of air cleaning processes. His publications in international journals, chaptersof books and international conference papers cover chemical speciation applied towater pollutants treatment, identification of the origin and compounds that produceodour annoyance and bad-air quality episodes, and new methodologies applied tothe measurement of air pollutants. He has also managed more than 100 projectsand studies in the fields of air quality evaluation, prediction and minimization ofimpacts derived form industrial activities, and elaboration of Local Governmentsodour laws. Besides, Dr. Roca has developed an air pollution (odour-VOC) monitor

Biographies of Author xlvii
patent (2007). His research interests are monitoring pollutants in the atmosphere,modelling and assessment of both outdoor and indoor air quality, air pollutioncontrol, modelling the dispersion of air pollution in the atmosphere, particulate pol-lutants characteristics, environmental impact assessment studies, statistical analysis,sick building syndrome, and multiple chemical intolerance syndromes.
Dr. Shelly Rodrigo, Co-author of Chapter 22
Dr. Shelly Rodrigo, BSc, MSc, M.Phil., PhD is employed as an Assistant Professorin the Department of Public Health and Preventive Medicine at St. GeorgesUniversity, Grenada. She has written material for Epidemiology and PopulationHealth for Medical and Biomedical students. She has over 8 years teaching atthe College and University levels and in 2009 was recognized by the Medical stu-dents with the receipt of a Teaching Excellence Nomination (Monash University).Dr Rodrigo specializes is Environmental and Infectious Disease Epidemiology.She is the author of several journal articles and conference papers specializing inpublic health risk of zoonotic pathogens, waterborne illness and emerging infec-tious diseases. Her research and teaching activities include Epidemiology, EmergingInfectious Diseases, and Data Management and Analysis. She is a member ofthe Australasian Epidemiological Association and the American Public HealthAssociation.

xlviii Biographies of Author
Dr. Nahed Mohamed Bassiouni Salem, Co-author of Chapter 12
Nahed Mohamed Bassiouny Salem is currently an Assistant Professor in theDepartment of Library and Information, College of Arts and Social Sciences,Sultan Qaboos University in Oman. She received her doctorate from Universityof Alexandria, Egypt in 1999. She is a member of the Egyptian Society forInformation, Libraries and Archives. Her teaching experience is in the areas ofclassification, comparative classification, bibliography, and history of books andlibraries.
Dr. Berndt Stenberg, Author of Chapter 25
Berndt Stenberg, MD, PhD, is currently Professor in the Department of PublicHealth and Clinical Medicine, Umeå University, Sweden. He is an occupational der-matologist with special interest in health problems associated with indoor air quality.

Biographies of Author xlix
He presented his thesis “Office Illness – the Worker, the Work and the Workplace” in1994 and has a PhD in epidemiology. Besides indoor air quality research, he is con-ducting studies in the fields of contact dermatitis and quality of life in skin disease.He is a senior lecturer at the medical faculty of Umeå University teaching medicalstudents, nurses, occupational therapists, dental medical students and environmentalinspectors. Within the Swedish Dermato-Epidemiology Network (SweDEN) he isgiving courses in epidemiology and biostatistics for dermatologists. He is a mem-ber of the Swedish Contact Dermatitis Research Group since more than 20 years.Dr. Stenberg has published about 60 peer-reviewed papers in international journalsand around 12 chapters in books. He is a member of the Editorial Board of INDOORAIR, International Journal of Indoor Environment and Health since 2005 and he hasserved as guest editor of a special issue of INDOOR AIR in 2004.
Dr. Moroko Takaoka, Author of Chapter 8
Motoko Takaoka is currently an associate professor in the Department of BiosphereSciences, School of Human Sciences, Kobe College in Japan. She is a biochem-ical experienced in food sciences fields. She received her doctorate from KobeUniversity, Japan in 1992. The main aim of her research is to study the associa-tion between environmental factors and asthma/allergy among the young generation.There has been a global increase of asthma and allergies, especially in the youngergenerations in industrialized countries. There is little information on associationbetween school and home environmental factors and asthma/allergy in Japan. Herresearch objectives are to clarify the school environmental risk and protective fac-tors for asthma, airway infections, pollen allergy, furry pet allergy, food allergy andmold allergy among school students.
l Biographies of Author
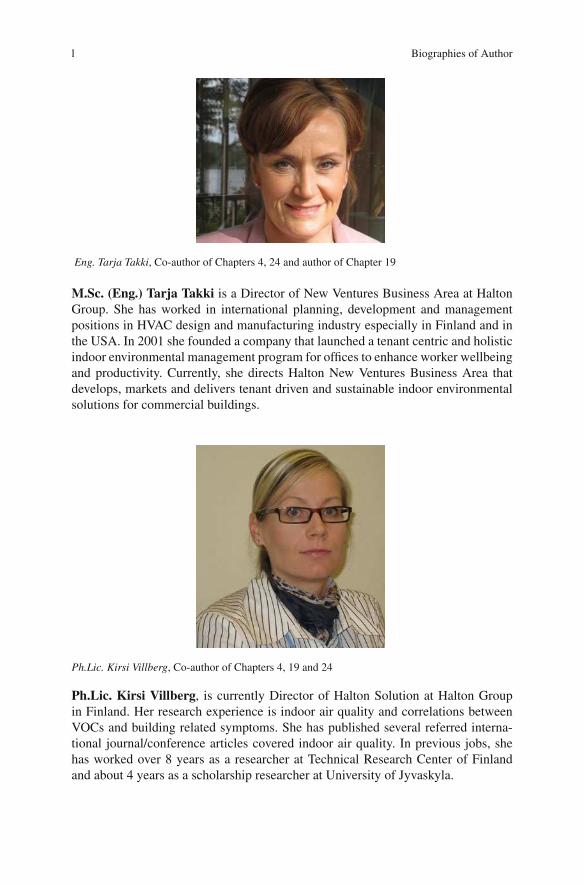
Eng. Tarja Takki, Co-author of Chapters 4, 24 and author of Chapter 19
M.Sc. (Eng.) Tarja Takki is a Director of New Ventures Business Area at HaltonGroup. She has worked in international planning, development and managementpositions in HVAC design and manufacturing industry especially in Finland and inthe USA. In 2001 she founded a company that launched a tenant centric and holisticindoor environmental management program for offices to enhance worker wellbeingand productivity. Currently, she directs Halton New Ventures Business Area thatdevelops, markets and delivers tenant driven and sustainable indoor environmentalsolutions for commercial buildings.
Ph.Lic. Kirsi Villberg, Co-author of Chapters 4, 19 and 24
Ph.Lic. Kirsi Villberg, is currently Director of Halton Solution at Halton Groupin Finland. Her research experience is indoor air quality and correlations betweenVOCs and building related symptoms. She has published several referred interna-tional journal/conference articles covered indoor air quality. In previous jobs, shehas worked over 8 years as a researcher at Technical Research Center of Finlandand about 4 years as a scholarship researcher at University of Jyvaskyla.

Biographies of Author li
Maija Virta, Co-author of Chapter 24
M.Sc. Maija Virta works currently as CEO at Green Building Council Finland. Hermain responsibilities are HVAC-systems for green buildings and also innovative andenergy efficient indoor environment solutions. Maija Virta is a vice-president of theFederation of European Heating and Air-conditioning Associations (REHVA). Sheis also the president of the Finnish HVAC-association (SULVI) and a member ofASHRAE. Maija Virta has contributed to the development of chilled beam tech-nology and applications over two decades. She was the main author of REHVA’sChilled Beam Application Guidebook No. 5. Maija Virta has been a lecturer inmany international workshops and she has presented technical papers in severalconferences covered wide area of HVAC-technology, energy efficiency and indoorenvironmental quality. She is also an author of many technical articles in variousinternational HVAC-magazines.

lii Biographies of Author
Dr. S. Müjdem Vural, Author of Chapters 3 and 20
Assist. Prof. Dr. S. Müjdem Vural is currently a fulltime lecturer in Departmentof Architecture, Faculty of Architecture, Yildiz Technical University, Istanbul,Turkey. She was born in Istanbul (Turkey) in 1972; she studied in Yildiz TechnicalUniversity Faculty of Architecture, and started her academic career as a ResearchAssistant at Yildiz Technical University, Department of Architecture. She has con-cluded her master’s studies in 1997 and got her PhD Degree in 2004 with thesisentitled “Risk Assessment in Indoor Air Quality” from the same university. In 2006she was appointed Assistant Professor at Yildiz Technical University. She was avisiting scholar in Virginia University, School of Architecture during 2005 for asemester. She was the advisor of the graduate and last year student project EcoMod,Ecological Modular House for low-income people. She has taught a number ofgraduate and post graduate courses including “Architectural Design Studio 2”,“Application Project 1”, “Building Elements 1”, “Building Elements 2”, “BuildingBiology”, “Indoor Air Quality” and she has been and is on the jury of number ofmaster and doctorate students. She was in the design group of the Building for theYTU Faculty of Civil Engineering at Davutpasa Campus. She was the advisor for theEcoMod project (held in University of Virginia), which was awarded in the USA.She was also the advisor for the student team in the Competition for EcologicalHotel in Ilgaz, Turkey and the design was awarded for the second prize. She hasserved as a jury member for national architectural competitions. She has manypapers in international conferences and journals about building biology, indoorair quality, LCA models and architectural education. She has been in UPV-Spain,TU/e – Netherlands, School of Architecture, Amsterdam – Netherlands, ESA-France, Brno Technology University-Czech Republic, Ecole Nationale Superieured’ Architecture de Lyon-France, on behalf of LLP-Erasmus Teaching Staff Mobility

Biographies of Author liii
program to give lectures and as the Erasmus Coordinator for the Department ofArchitecture had some meetings. Currently she is holding the titles Vice Head of theArchitecture Department and Erasmus Coordinator of the Architecture Department.She is a Member of the CIB task group WorldWide Healthy buildings (TG77).
Dr. Yufeng Zhang, Author of Chapter 29
Dr. Yufeng Zhang is currently an Associate Professor in the Department ofArchitecture at South China University of Technology in China and the director ofBuilding Environment and Energy Efficiency Laboratory at State Key Laboratory ofSubtropical Building Science. He received his doctorate from Tsinghua Universityin 2006. He has been actively involved in built environment research and hisresearch interests are human responses to indoor and outdoor thermal environment,building energy efficient technologies, heat and mass transfer experiment and mod-elling and building & urban simulation. In 2008 he achieved the Best Paper Awardof Journal of Building and Environment.

Chapter 1
Introduction to Sick Building Syndrome
Janis Jansz
1.1 Introduction
I’ve been experiencing frequent headaches since I started working in an office again – andit very well could be a combination of factors – ergonomics/eyeglasses/different stressorsworking with home/school/work schedules (!). . . but given that we live in a ‘drafty’ houseand spend quite a bit of time outdoors normally, am not usually exposed to concentra-tions of emissions from electronic equipment/chemicals, from carpets/ furniture/perfumes(!) etc. I’ve had my suspicions and would be interested in what our building/room concen-trations would be. . .. Is our building a ‘sick building’? Am I suffering from Sick BuildingSyndrome? Jane.
The above request was sent from an employee. Jane asked a question that other
people have asked. Like many people Jane has heard of Sick Building Syndrome,
but was not sure if her ill health effects were due to factors in the building that she
works in, or not. What triggered Jane asking this question was that she had just read
the following article sent by email to her by a work colleague.
May 18, 2010 (The Straits Times). Indoor polluted air kills 2 m Chinese youths
yearly. Half are below age five; threat from harmful chemicals in furniture flooring.
BEIJING: More than two million Chinese youths die each year from health problems relatedto indoor air pollution, with nearly half of them under five years of age, state media cited agovernment study as saying. The study released by the China Centre for Disease Control andPrevention (CCDCP) said indoor pollution levels can often be five to ten times higher thanthose measured in the nation’s notoriously bad outdoor air, reported the China News Service(CNS). This indoor pollution causes respiratory and other conditions, said the study releasedon Sunday. According to the study, dangerous indoor pollutants include formaldehyde,benzene, ammonia and radon, reported the Agence France-Presse news agency. Amongthe pollutants, formaldehyde posed the biggest threat, the study said, adding that the chem-ical is often found in building materials and new furniture in China and can be releasedslowly into indoor environments over the course of several years. The study said long-term
J. Jansz (B)Department of Health & Safety Environmental Health, Curtin University, Perth, WA 6845,Australia; School of Management, Edith Cowan University, Perth, WA 6845, Australia; CurtinHealth Innovation Research Centre, Perth, WA 6845, Australiae-mail: [email protected]
1S.A. Abdul-Wahab (ed.), Sick Building Syndrome,DOI 10.1007/978-3-642-17919-8_1, C© Springer-Verlag Berlin Heidelberg 2011

2 J. Jansz
exposure to such substances can cause a range of health problems including respiratory dis-eases, mental impairment and cancer, including leukaemia, with young children, foetuses,pregnant women and the elderly at most risk.
China’s Ministry of Science and Technology has listed the management of indoor air pol-lution problems as one of the priority areas on which it would devote intensive research,reported the CNS. The ministry also announced in the study that households could now usea purifier developed by the CCDCP for removing formaldehyde from indoor air as it hasbeen proven to produce results. The environmental bureau of Shijiazhuang, capital of north-ern China’s Hebei province, recently advised its residents to be careful of materials used todesign their houses as these might be the cause of their daily discomforts such as dizzinessand fatigue. Construction materials, such as granite and marble, could be radioactive, orcontain formaldehyde like in the case of laminate flooring and particle board, reported theYanzhou Evening News, quoting the city government’s notice.
China’s massive economic expansion of the past three decades has made it one of theworld’s most polluted countries as environmental and health concerns are trampled on,amid an overriding focus on industrial growth. Countless cities are smothered in smog whilehundreds of millions of citizens lack access to clean drinking water. In a separate study byChina’s Interior Designers Association, more than 11 million Chinese are killed every yearby diseases related to indoor pollution, which translates to 340 people per day, reported theBeijing News last week. ‘Lung disease cases are growing by about 27 per cent a year inChina because of deterioration in indoor environment, while about 80 per cent of leukaemiacases are related to air problems,’ said the newspaper.
Partly to make indoor air cleaner, China will ban smoking in all indoor public places start-ing next year, including offices and public transport, in accordance with a World HealthOrganisation convention. According to health ministry statistics, China now has 350 mil-lion smokers, mostly men. But smoking has also become a trend for young women. A 2007World Bank report said 750,000 Chinese die prematurely each year due to air and waterpollution - a figure edited out of final versions of the report, reportedly after China warnedit could cause social unrest.
On the following day the China Centre for Disease Control and Prevention sent an
email confirming that the above information was wrong and that the above report
could no longer be found on the internet. This email stated:
The Global Times newspaper reported that the ‘misinformation’ had been released by themanufacturer of an air filter developed by a CDC agency. A news conference was held onSunday to publicize the filter. ‘We didn’t announce any survey results on Sunday. Someworker made the mistake on a news release,’ Mr He Jiukun, an official from the envi-ronment department of the CDC, told the Global Times. A worker at the StandardizationAdministration told the newspaper the health guidance centre does not exist.
However, reading this article had triggered Jane’s question “Am I suffering from
Sick Building Syndrome?” What information would you need to answer Jane’s
question? How would you obtain the knowledge to answer this question?
This book is about Sick Building Syndrome. It provides information about how
the term Sick Building Syndrome originated, many factors that have been asso-
ciated with Sick Building Syndrome including causes and risk control measures.
The Editor of this Book is Prof. Dr. Sabah Ahmed Abdul-Wahab. She conducted
a research study to identify if a library building was a “Sick Building” and found
that there was a need to publish a book for people worldwide to read that pro-
vides information, in a language that is easy to understand, about Sick Building

1 Introduction to Sick Building Syndrome 3
Syndrome. Prof. Sabah Ahmed Abdul-Wahab contacted experts in the field of SickBuilding Syndrome from around the world to write individual chapters in their areaof expertise for this book. To be able to answer Jane’s question there is a need to
have a definition of Sick Building Syndrome.
1.2 Definitions of Sick Building Syndrome
A syndrome is a collection of signs or symptoms of ill health. A building is a con-
structed enclosure with walls, a roof, doors and windows. A building is constructed
to protect people and/ or objects from the outdoor climate. Many people work,
or have a home, in a building. A person with ill health is sick. Buildings cannot
really have ill health, but the indoor environment enclosed space can have airborne
contaminants that do cause ill health in the people who work, or live, in the building.
Sick Building Syndrome has been defined by World Health Organisation (Hedge
and Ericson 1996, p. 3) as “a collection of nonspecific symptoms including eye,
nose and throat irritation, mental fatigue, headaches, nausea, dizziness and skin
irritations, which seem to be linked with occupancy of certain workplaces.”
Greer (2007, p. 23) states that “Sick Building Syndrome refers to a group of
non-specific symptoms with a temporal connection to a particular building, but with
no specific or obvious cause.” Murphy (2006, p. 79) adds that the symptoms of
Sick Building Syndrome are mostly minor, can vary with each episode of expo-
sure and that there is no objective proof (such as would be shown in a blood test
or by the finding of a particular substance on monitoring the air) available for Sick
Building Syndrome. Sick Building Syndrome is defined by “the density of worker
complaints.” According to Murphy (2006) World Health Organization has defined
this density as 20% of the building occupants presenting with the symptoms of Sick
Building Syndrome. If the cause of Sick Building Syndrome is located in one office,
or only by one machine that is used by only a few of the building occupants, defin-
ing Sick Building Syndrome affecting 20% of the building occupants may not be
appropriate.
TSSA (2010, p. 1) records that Sick Building Syndrome is “a generic term used to
describe common symptoms which, for no obvious reason, are associated with par-
ticular buildings.” Similarly Milica (2009. p. 80) describes Sick Building Syndrome
as “an environmentally related condition with increased prevalence of non-specific
symptoms among the population of certain buildings, often without clinical signs
and objective measures of symptoms.”
The Environmental Illness Resource (2010, p. 1) quotes the Environmental
Protection Agency (EPA) as identifying Sick Building Syndrome being present if:
• Symptoms are temporally related to time spent in a particular building, or part of
a building
• Symptoms resolve when the individual is not in the building
• Symptoms recur seasonally (heating, cooling)
• Co-workers, peers have noted similar complaints.

4 J. Jansz
The Environmental Protection Agency (2010) states that the symptom complaintsmay come from employees throughout the whole building, one department, oneroom or one location. The cause of Sick Building Syndrome is thought to be thebuilding and/or its services and/or equipment and/or products used in the building.The symptoms of sick building syndrome are relieved within in minutes to hours ofleaving the building.
On the Google internet site there are 37,000 definitions of Sick BuildingSyndrome. A common theme that comes from these definitions of Sick BuildingSyndrome is that people develop ill health effects due to being in a specific building,or part of a building. If a cause of the health effects is identified, such as happenedwith Legionnaires’ disease [1st documented case occurred in 1947 (Chin 2000)] that
is caused by the gram negative bacilli Legionellae which can live in air conditioning
system cooling towers, evaporative condensers and in water from hot and cold water
taps, then it is no longer Sick Building Syndrome, but is called an illness caused by
a specific microorganism, chemical, or other known factor.
This is similar to when only Hepatitis A (in which the infection to people is
transferred from contaminated food, water and other people via the faecal oral route)
and B (in which the infection to people is transferred from other people’s infected
blood, other body fluids or other body tissues) were identified as being caused by
a specific microorganism. Any other forms of Hepatitis were called non A non B
Hepatitis as the microorganism causing other forms of hepatitis was unknown, even
though people were becoming sick due to infection by these microorganisms. As an
identified microorganism caused Hepatitis A and caused Hepatitis B a vaccine was
able to be developed for Hepatitis A and for Hepatitis B. The next form of Hepatitis
microorganism identified was Hepatitis C. This blood borne form of Hepatitis is
now the most commonly known form of Hepatitis transmitted by intravenous drug
users (Carruthers 2010). The cause of this infection was only diagnosed in the late
1990s (Chin 2000). Hepatitis D (which is caused by infected blood and other body
fluids and only coexists with Hepatitis B as the Hepatitis D virus is unable to infect
the human cell by itself) and Hepatitis E (which has a similar cause to Hepatitis
A) have now both been identified. The term non A non B Hepatitis is no longer used
as the other forms of hepatitis are now known to be caused by the Hepatitis C, D
and E virus. The same may happen with Sick Building Syndrome as the causes of
building related ill health are gradually identified.
Many thousands of currently manufactured chemicals have not had their health
effects tested and no effects of exposure studies exist for these chemicals. Odle
(2010) records that, in 2010, there were more than 700,000 chemicals in common
use in the world. Some of these chemicals may be a cause of what is currently
called Sick Building Syndrome. Once the causes of the health effects related to Sick
Building Syndrome are known, risk control measures can be implemented as has
been done through occupational safety and health legislation related to preventing
Legionnaire disease. As there is a different virus that causes each form of Hepatitis
there may be a variety of causes of Sick Building Syndrome.
The methodology used to locate the above definitions and to obtain the infor-
mation included in Chaps. 1, 2 and the last chapter of this book is described
below.

1 Introduction to Sick Building Syndrome 5
1.3 Research Methodology
In 2010 a flyer was emailed out to Members of the Occupational Safety Professionwho belonged to the Safety Institute of (Western) Australia Inc., to Members of theOccupational Health Society of Australia, to the Industrial Foundation for AccidentPrevention Safety Practitioners’ Club Members, to students attending the Technical
and Further Education Institutions in Western Australia and to Curtin University
Students to ask these people to send the author any stories that they had that were
related to Sick Building Syndrome. About 700 people were contacted. This resulted
in the author receiving 10 stories about sick building syndrome. Of these stories 6
were related to workplace buildings, 2 stories were related to employees’ houses,
one story was related to a barge on which employees worked and lived while the
other story received documented some risk control measures to be used to prevent
sick building syndrome. All of these stories have been included in either Chap. 2 or
in the last chapter.
A review of literature related to sick building syndrome was conducted using
OSH UPDATE. Eight hundred and fifty eight published literature works were iden-
tified. Included literature was limited to English language and literature published up
to, and including, July 2010. This search was conducted using the key words “Sick
Building Syndrome”. Sixty two of the 858 publications identified and reviewed
are cited in Chaps. 1, 2 and in the last chapter. The key words “Sick Building
Syndrome” was typed into the search function on the legal web site www.austlii.
edu.au. Twelve publications were obtained from this web site. Six of these publi-
cations are cited. A seminar on Sick Building Syndrome that was presented by the
Australian Institute of Occupational Hygienist was attended. Information obtained
at this seminar is included. The Curtin University library collection of books was
searched for publications related to sick building syndrome with nine books, one
Code of Practice and four Australian Standards being suitable to be included in
the literature review. One of these books, Sick Building Syndrome and the Problem
of Uncertainty: Environmental Politics, Techno-science, and Women Workers by
Murphy (2006), was found to have a comprehensive description of the history of
Sick Building Syndrome.
1.4 History of Sick Building Syndrome
1.4.1 Introduction
One of the earliest descriptions of unhealthy buildings and the risk control measures
to be used is included in Chap. 14, verses 34–57 of the book of Leviticus in the Bible
which was written in about 3,000 BC (Before Christ). In these verses the Israelites
are told that if they think that there is the plague of leprosy in their house they are to
report this to their priests. A priest then asks everyone to leave the house and checks
the house walls. If the walls are greenish or reddish then the priest shuts the door and
no one is allowed to enter the house for 7 days. The description of the greenish or

6 J. Jansz
reddish growths on the house walls is suggestive of mould. When the priest checksthe house 7 days later, if the greenish or reddish growths on the walls has spreadthen the house is pulled down and the stones put in an unclean place outside thecity. The house owners were then instructed to rebuild the house using new stonesand to plaster the house walls to seal these walls.
If the people living in this rebuilt house also developed the plague of leprosythen the rebuilt house was to be pulled down and the building materials disposedof outside the city in an unclean place. The people who lived in this building werethen instructed to wash their clothes and another house was not to be built on thispiece of land. If the occupants of the rebuilt house did not develop leprosy, then thepriest pronounced the house clean and the occupants could continue to live in thishouse after sprinkling the house 7 times with bird blood, running water, cedar wood,hyssop and scarlet.
The treatment for leprosy today is different. Today it is known that Leprosy iscaused by the bacilli bacteria Mycobacterium leprae. This disease can be mani-fested as lepromatous leprosy or as tuberculoid leprosy. With untreated lepromatousmillions of the microorganisms are spread through nasal discharge and they can livein dried nasal secretions for at least 7 days. The skin ulcers of people with leprosyshed a large amount of Mycobacterium leprae. The treatment today for leprosy isnot to pull the building down and safely dispose of the building materials, but totreat the person with leprosy. Leprosy today is made non infectious within 3 daysof treatment of the person with the drug Rifampin. If a person with leprosy hasdeveloped a lesion then a single dose of multidrug therapy using the drugs 600 mgrifampin, 400 mg ofloxacin and 100 mg minocyclon is sufficient to cure the diseaseif it is caught early. If the disease is more advanced then the treatment with thesedrugs is continued over a longer period of time (Chin 2000).
In 1863 employees working in the Ohio State Capital building in Columbus,Ohio, became sick with a “mysterious disease.” The source of the employeesbecoming sick was “traced to basement air passages that were clogged with debris,and to raw sewage flowing from water closets into an air duct, instead of into thesanitary sewage system” (Jennings 2007). Jennings (2007, p. 1041) states that thiswas the first documented case of sick building syndrome. While the story from thebook of Leviticus is more about building related disease as the cause of the illnesswas related to an identified micro organism, the Ohio story is a sick building syn-drome story because the cause of the employees’ illness symptoms were unknown.
However, upon investigation, the cause of the Ohio employees’ illness was sus-
pected to be due to poor sanitation. The symptoms that these employees reported
were similar to the symptoms reported today for sick building syndrome.
According to Murphy (2006, p. 83) “The term sick building syndrome was
first used in 1984 by a Danish – born Yale biophysicist in a Swedish publication
and quickly proliferated in the English language medical literature and in media
accounts of problem office buildings” (Stolwijk 1984).
However, the Health & Safety Executive (1996) states that Sick Building
Syndrome, as a medical condition, was recognised by World Health Organisation
in 1982 (WHO 1982).

1 Introduction to Sick Building Syndrome 7
Kreiss et al. (2006) record that in the 1970s many public health agencies wererequested to investigate complaints by office workers about their indoor environ-ment that some employees thought was making them sick. By the 1990s, SickBuilding Syndrome was one of the most commonly investigated occupational healthproblems. Why these investigations relating to perceived “Sick Building Syndrome”were requested was partly due to the technological advancements of the twentiethcentury which resulted in changes to office and other building designs, new types ofmaterials available and used to build buildings, new equipment and products used inoffice and other work buildings and new climate control measures used in buildings,all of which changed the indoor air quality.
1.4.2 Building Comfort to Improve Employee Productivity
Electricity has been recorded as being identified in nature by Thales of Miletusin 600 BC (Buzzle.com 2010) but at this time electricity was not used to powermachinery and to produce light to enable people to work for long hours in buildings.In 1831 Michael Faraday built the first electric motor which enabled equipment,driven by an electric motor, to be invented. Faraday was also the first person to buildan electric generator and an electric transformer (National Electrical ManufacturersAssociation 1946). On 31st December 1839 Thomas Edison provided the first pub-lic demonstration of his incandescent light bulb. He found that by using a carbonisedbamboo filament his light globe could provide light for over 1,200 h. In 1880Thomas Edison patented a system for delivering electricity and over his life timeestablished 121 Edison power stations in the United States of America (Wikipedia2010). Having a reliable source of electricity and having continuous light that couldbe delivered to buildings enabled buildings to be used for work 24 h a day. Havingelectricity available for public and private use, and having electric driven motorsinvented, enabled people to invent new ways for climate control in buildings.
Prior to the twentieth century, building ventilation was simply opening a win-dow to let fresh air into the building. In summer, in some countries, this air couldbe very hot, while in winter the air could be very cold. In the 1919 members ofthe American Society for Heating and Ventilation Engineers (ASHVE), led by theresearcher Wallis Carrier (who has been called the “Father of Air conditioning”)worked in research laboratories to determine a comfortable indoor air temperaturefor work, particularly in an office environment. To gain this comfortable temper-ature they researched temperature, humidity and air flow factors by conductingexperiments in environmental chambers on mainly young, white male engineeringstudents. The ideal climate for these people, while pedaling a stationary bike, wasdetermined as being the best climate for office and other workers. In the 1930s therewas a problem with human body odour in buildings. Further experiments were thenconducted using people of all ages and classes to determine the minimum ventila-tion required in a building to remove these body odours. The researchers did notlook at the micro organisms that could grow in the air in this human comfort zone,or at the health effects that their invention could cause. Instead they marketed and
8 J. Jansz
sold comfort through science to owners of public and private buildings to create abusiness for themselves that generated high profits (Murphy 2006).
Many office buildings constructed today are made for climate control and usuallyinclude an air conditioner to keep the building temperature at about 22C, havebetween 40 and 60% humidity and to have a minimum air flow rate of 15 cubic feetper minute (cfm). This temperature, humidity and airflow rate was determined bythe ASHVE researchers to be an optimal standard. To keep this even temperaturemany office and other buildings were designed and built with glass windows that didnot open. This meant that these buildings were sealed environments that relied onthe air that was circulated by the building air conditioners for air quality. Buildingsbecame confided spaces.
Joshi (2008) reported that in the 1970s building designers were making buildingsmore airtight to improve energy efficient as a result of an oil embargo by ArabNations. Ventilation rates were reduced from 15 to 5 cfm per person to save fueland to be more cost efficient. In order for developers to make higher profits in the1970 office buildings became open plan for most employees as this eliminated thecost of walls and doors in the internal part of the building and more people couldbe fitted into smaller spaces in the building. Open plan buildings were marketed asimproving interaction between employees. Managers still kept closed offices so thatthey had status and privacy for their work.
Murphy (2006) wrote that these new buildings were made of new kinds of build-ing materials that included concrete, particle board, solvents, adhesives, plastics,tiles, synthetic carpets and other man made building products. These office buildingswere fitted with new office equipment that included first typewriters then computers,printers and fax machines. Late in the nineteenth century the employment of womento operate office machinery began.
1.4.3 The Role of Women in Raising Awareness of the Existence
of Sick Building Syndrome
By 1930 95% of office work employees in the United States of America wereEuropean American women (Murphy 2006). In 1911 Fredrick Taylor wrote a bookcalled The Principles of Scientific Management. To make a business profitableTaylor recommended breaking work tasks down to discrete elements so that employ-ees performed a small number of short cycle repetitive tasks (Pheasant 1994). Thework of these women was managed by male office managers using the principles ofTaylor’s scientific management. Women employees were mainly confined to their
work desk during working hours and could often work on a single task on a single
machine all day. The work desks were arranged in rows facing the area, which could
be a raised platform, where their supervisor sat to keep watch over their work.
In the 1950s the women office workers became two classes. The highest class was
the women who became the personal secretary to a manager. The lower class was the
women who operated the office machines. Liquid paper to white out mistakes began

1 Introduction to Sick Building Syndrome 9
to be used in offices in 1956. In 1959 Xerox started to sell photocopiers to busi-nesses. By 1965 computers were replacing typewriters in offices and by the 1980smost office workers used a desk top computer to type documents and carbonlesspaper was used. The use of computers enabled electronic surveillance by managersof employees’ work efficiency as their managers “created statistics on error, speed,
idle time, and seconds per customer” (Murphy 2006, p. 55). Working for hours sit-
ting in front of a computer caused employees to report having headaches, eyestrain,
sore muscles, repetitive strain injury and these women worried about the low level
radiation from the computer causing reproductive problems or miscarriages. Like
sick building syndrome, when women computer operators first began complaining
of repetitive strain injury they were considered by employers, medical practition-
ers and others to be “psychogenic, hysterical or frank malingering” (Pheasant 1994,
p. 80).
Pheasant (1994) wrote about an Australian epidemic of repetitive strain injury
cases in office workers that began in 1980 with the introduction of computer use
in Australian workplace offices. This epidemic peaked in 1986. In 1985 Leon
Straker, a physiotherapist who was employed at Curtin University, ran a support
group for repetitive strain injury victims in Australia. This support group looked
for ways to minimise the incidences of repetitive strain injuries in office workers.
When typing on typewriter a reasonable amount of force was required to press each
key. With the event of computers only a light amount of force was required for
each key stroke. This enabled employees to type faster. Faster typing resulted in
more repetitive use of muscles. In Australian offices work was reorganised so that
computer typist were allowed to take 5 min break each hour to allow for muscle
rest and the build up of lactic acid in these muscles to be reduced. Identifying
the cause of repetitive strain injury enabled the incidences of this illness to be
reduced.
In 1968 Eberhard and Wolfgang Schnelle began designing and selling open plan
offices to improve office workers’ communication. Executive and high level man-
agers still had their private office. Open plan offices were popular with company
owners in America as they allowed the employer to squeeze more workers into
a smaller space. Typically a manager was allowed 154 square feet of work space
while a typist was allowed 41 square feet. Low level partitions were sometimes
put between desks to allow typist to have their own work space. In the 1970s the
average salary of clerical workers was below that of all types of laboring work-
ers in America; outsourcing of office tasks was beginning to occur and continuing
employment for officer workers was becoming more insecure. “In 1970, office work
in the United States employed 13.7 million clerical workers; 74.6% of whom were
women” (Murphy 2006, p. 65). By the 1980s 36% of white and 29% of black
American women worked in an office.
In the 1960s new synthetic building materials that included polyurethane,
fiberglass and formica were used in buildings. Much of the office furniture of the
1970s was made from plastic, steel, particle board, laminate or plywood. Hard sur-
face floors were replaced with carpeted floors. Walls were painted cheerful colours.
Potted plants were included in offices to improve the environment. Many of the

10 J. Jansz
companies in America were now owned by stockholders who did not work in thebuilding (Murphy 2006). Identification of health problems of employees in the officebuilding environment was not made by company owners originally but was made bythe women who worked in these buildings.
1.4.4 Gaining Evidence
In the 1910s a group of women office workers organised membership of theWomen’s Trade Union League but this union had few members so was not very
effective in improving women office workers’ working conditions. The women’s
liberation movement began in the 1970s in America. A variety of small women’s
organisations were formed in a variety of cities and in a variety of large compa-
nies to deal with inequalities in their workplace. One of these organisations that
were formed was called 9to5. This group was formed in 1972 by Ellen Cassedy
and Karen Nussbaum, who were both Secretaries at Harvard University School of
Education (Murphy 2006). The group’s name was based on the film 9to5 which
was about a group of disgruntled women office workers (staring Dolly Parton, Jane
Fonda and Lily Tomlin) who, in the film, formed a group to exchange experiences
by conscious raising after smoking marijuana. In this film these women office work-
ers all found that they had similar work related problems and did something to solve
their problems.
Women’s groups used the film 9to5 technique (without the smoking of marijuana
before), called conscious raising to share work related problems and by the end of
the 1970s every major city in America had conscious raising women’s groups. The
term conscious raising was first used by Kathie Sarachild who was a member of the
New York Radical Women group (Murphy 2006). A conscious raising group was
composed of small groups of women who met regularly to share their work related
experiences and to analyse these experiences. Today these would be called research
focus groups. In New York an organisation called WOW (Women Office Workers)
advertised in its Newsletters that members of this organisation were willing to come
to women’s homes, or workplaces, to talk to groups to exchange experiences and
ideas. The home meetings were like Tupper Ware parties, except that nothing was
sold but ideas were exchanged. The WOW members helped the women that they
talked to form their own groups of women office workers to exchange ideas on
improving work in their own workplace. Each group began with 2 or more women
exchanging ideas and discussing work related grievances.
Conscious raising was considered by these women’s groups to be truth telling
rather than to be generating scientific knowledge which, in the 1970s, was
considered to be something that men did. The women’s shared personal office
experiences began to form a common body of knowledge which did not rely on
medical authorities. The women considered their experiential knowledge to be more
authentic than “Expert” knowledge. They stated that their knowledge was gained by
experiencing oppression in the seemingly trivial experiences of their day to day
work, which was something that male managers, sociologist and scientists would
1 Introduction to Sick Building Syndrome 11
not understand. This was a problem. Most men did not understand and consideredthe office problems to be just women’s complaints.
In 1977 Jeanne Stellman wrote a book called Women’s Work, Women’s Health:
Myths and Realities that was published by Pantheon in New York. The follow-
ing year Jeanne Stellman, an occupational health researcher, founded the Women’s
Occupational Health Resource Centre in New York. This Centre became a clearing
house, a centre for information on women’s occupational health issues, it pub-
lished a newsletter, produced fact sheets, conducted occupational health research
and held occupational health training sessions. On a fact sheet that was pub-
lished in 1980 Jeanne listed ozone and organic solvents in the atmosphere as
office hazards. She wrote that there had not been any epidemiological or other
research studies to determine the health effects of these chemicals on office work-
ers. In this fact sheet Jeanne highlighted problems that could occur with indoor air
quality.
In 1977 many of the small groups amalgamated together to become the national
group called 9to5, the head office of which was based in Cleveland, in America.
On reading Jeanne’s fact sheet on indoor air quality the 9to5 group discussed office
work, technology and identified that office workers were surrounded by many prod-
ucts that could potentially contain toxic substances. For many of the identified
chemicals there was just a small quantity found in the indoor air, but the cumu-
lative effects of these chemicals had not been investigated. For the 9to5 group,
after reading this fact sheet in 1980, occupational health became a core research
issue and the organisation founded a research group called Project Health and
Safety.
Project Health and Safety researchers conducted research on office chemicals
and the building materials. They identified a case of a successful workers compen-
sation claim for an employee’s ill health being due to inhaling photocopier exhaust
fumes, formaldehyde poisoning of office workers and the fact that a teenager died
from inhaling correction fluid, but they did not find that any specific chemical or
technology was the cause of common illnesses associated with office work. What
they did find was that possible toxic exposures were everywhere in office buildings.
The following is a story from Nussbaum (1983) recorded by Murphy (2006, p. 69)
that describes office work in 1983. Possible toxic exposure is shown in the details
of the work performed by this office worker.
Let me give you a guided tour of the hazards in sending out one letter:
Alice prepares to type a letter for Mr Big. The carbonless typing paper she uses is made withabietic acid to fill the pores, and PCB’s – polychlorinated by-phenyls. Abietic acid has beenfound to cause dermatitis and PCB’s are extremely toxic, causing irritation to eyes, skinnose and throat, can cause severe liver damage, and are suspected carcinogens. The typingribbon she uses contains PCB’s. To correct an error she uses correction fluid containingtrichloroethylene – TCE. In high doses, TCE can have a depressing effect on the centralnervous system and can cause liver damage and lung dysfunction.
Alice goes on to make a copy of the letter on the photocopy machine, which may omitozone, a deadly substance. In poorly ventilated areas it is not hard to raise ozone to atleast twice the federal standard. The black powder in the machine – the toner – may have

12 J. Jansz
nitropyrene or TNF, trinitroflourenone – suspected mutagens. While in the copying room,Alice breathes methanol from the duplicating machine, which can cause liver damage. Sheends her hazardous journey by filing Mr. Big’s copy of the letter in a plastic file containingpolyvinyl chloride, which can cause skin lesions and dermatitis.
The 9to5 women’s efforts to provide evidence of possible toxic exposure of office
workers to air borne contaminants were made difficult by the National Institute of
Occupational Safety and Health (NIOSH) which was founded in 1971. The NIOSH
occupational hygienists were used to measuring high levels of chemical exposures
in the atmosphere of manufacturing and other industrial workplaces. They detected
only low levels of chemicals in office air and often their equipment was not able to
detect any chemicals in the atmosphere. As NIOSH investigators did not detect high
levels of acute chemical exposure in offices, which is what they considered was
required to fit the toxicology model of chemical exposure and effect, the NIOSH
investigators labeled the office workers’ symptoms of illness as being due to “gen-
der psychological responses to life stresses” or due to “mass hysteria” or to “mass
psychogenic illnesses” (Murphy 2006, p. 71).
1.4.5 Survey Results
As the women’s conscious raising body of knowledge was not accepted by govern-
ments, media and employers as being a sound body of knowledge, and as NIOSH
was not supporting the Project Health and Safety indoor air quality research consid-
erations, the 9to5 members decided to use surveys (a social science research tool)
to ask workers questions about their work surroundings, work processes and health
effects that occurred when women were working in their office. As a survey was a
recognised form of research it was considered that the survey results could be given
to the media, governments and experts, like NIOSH to demonstrate that working
in some offices did cause recognised health effects and to raise awareness of the
office work environment air quality. It was considered that the results of surveys
would change experience into quantitative evidence. The survey tool was used by
9to5 members as a tool to identify non specific health events that occurred to office
workers.
In 1981 the first large survey was conducted by the 9to5 Project Health and Safety
Researchers. The survey was distributed to 8,000 office workers who lived in the
Cleveland or in the Boston area. 1,300 office workers completed this questionnaire.
This research survey included questions about office air quality, office machines,
employee stress level and on the office environment. This research was sponsored by
Occupational Safety and Health Administration (OSHA). The results of analysing
the data collected from this survey helped to identify the symptoms of occupational
illnesses that occurred in office environments. World Health Organisation used the
results of this survey to help define the symptoms of sick building syndrome.
Survey results were included in books that were published about office occupa-
tional hazards. Each of these books published by members of 9to5 included, as an

1 Introduction to Sick Building Syndrome 13
appendix, a comprehensive survey tools which could be used by office workers toassess their own workplace. Office workers no longer talked in groups about theirwork but now completed surveys about the working conditions and the health effectsof their work and workplace. The results of the surveys could be analysed and pro-vided to their employer as objective data. The survey results were able to identifya “phenomenon that was nonspecific and only discernable in clusters, not in anindividual” (Murphy 2006, p. 74). Sick building syndrome became defined throughsurvey questionnaire answers. Survey results had the benefit of being evidence thatboth women and men could understand.
In 1982 Project Health and Safety used women’s magazines to send out a stress
survey to over 40,000 people. This survey asked questions on 34 possible sources
of stress that could occur when working in an office work environment. There are 3
major causes of stress.
• Psychosocial. These stressors are a function of the complex interaction between
social behaviour and the way a person’s senses and mind interpret this behaviour.
Examples are work overload, deprivation of information or resources required
to perform work tasks effectively, work related frustration, adaption to new
technologies and work situations.
• Bioecological causes. Bioecological stressors are basically biologically related
and arise out of a person’s relationship with their work environment. Examples
include excessive noise, nutrition (for example are employees allowed enough
time to eat to maintain a satisfactory blood glucose level), heat, cold, biorhythms
(hours of work), muscle overload or static position strain and physically or
chemically caused body trauma.
• Personality causes. These reflect the dynamics of an individual’s self-perception,
characteristic attitudes and behaviours which may contribute to excessive stress.
Examples of personality stressors are self-perception, behavioural patterns,
anxiety and control.
Surveys were also included in the 9to5s newsletter and given out at meetings 9to5
members attended or at lectures that members presented as they considered stress
to be part of the computer age of work. These women tried to prove that stress
was a biological reaction to social workplace conditions as they wanted office
work restructured to have better environmental conditions and work management.
Project Health and Safety Researchers aimed to prove that “bodies did not react
only to low level chemical exposure but also to unjust social factors” (Murphy 2006,
p. 78).
By 1983 the organisation called 9to5 had over 10,000 members. Karen
Nussbaum, a founder of this group, was now the Executive Director. 9to5 had a
Board whose members chaired committees and the group had a Staff Director who
hired other staff to work for 9to5. 9to5 became a professional activist group who lob-
bied politicians, testified at American Congressional Hearings and who presented
lecture tours. 9to5 members used the results of their surveys’ findings as powerful

14 J. Jansz
tools for making office workers non specific health problems visible to employees,employers, government agencies, politicians and the media.
1.5 The Role of Tobacco Companies in Promoting
and Publicising the Existence of Sick Building Syndrome
In post war Britain there had been tests on animals to determine if exposure tocigarette smoke caused cancer, but these “tests on animals appeared to rule outa link” (BBC 2004, p. 1). However, the tobacco industry was aware that in 1954Richard Doll and Austin Bradford Hill had published a paper documenting theresults of a research study that used a short questionnaire, administered by socialworkers to 1,400 patients in London, Bristol, Cambridge, Leeds and Newcastlehospitals. The results of analysing the questionnaire responses confirmed the linkbetween smoking and lung cancer (BBC 2004). “Nobody believed us,” said Sir
Richard. “They though there may be other explanations” (BBC 2004, p. 2).After the publication of the 1954 paper in the British Medical Journal Richard
Doll was visited by the Chairman of Imperial Tobacco who disputed Doll’s research
findings. Not deterred Doll went on to conduct further research studies that showed
cigarette smoking also caused cardiovascular diseases, bladder cancer and other can-
cers. In the 1950s 80% of the United Kingdom men smoked cigarettes (Richmond
2010). The tobacco companies did not want to lose their customers so they
looked for another cause of ill health to demonstrate that illnesses were caused by
substances other than tobacco smoke.
The results of the women’s surveys in relation to the existence of sick build-
ing syndrome were read by tobacco company managers. “Beginning in 1986, two
tobacco industry organisations, the Council for Tobacco Research (CTR) and the
Tobacco Institute (TI) quietly supported ACVA Atlantic (later renamed Healthy
Buildings International, HBI) to promote the industry’s message that ‘sick build-
ings,’ not SHS (Second Hand tobacco Smoke), accounted for poor air quality in
workplaces” (Barnes and Glantz 2007, p. 996). For example, the President of Health
Buildings International, Gray Robertson, in 1986, was sent by the Tobacco Institute
on a National Media tour of America to promote the concept of Sick Building
Syndrome on many radio stations, television stations and through newspaper inter-
views. As this media campaign was so successful the Tobacco Institute launched
similar media campaigns to publicise sick building syndrome in Hong Kong, Canada
and in Venezuela. What the tobacco industry liked about Sick Building Syndrome
was that it had a multitude of causes that were difficult to identify. The effects of
tobacco smoke could be hidden in this multitude of causes.
The Tobacco Industry Labor/Management Committee ran a coast to coast road
show from 1988 to 1990 in America for union members on indoor air pollution
to promote sick building syndrome. In this road show there was no mention of
tobacco smoke being a cause of indoor air pollution or sick building syndrome.

1 Introduction to Sick Building Syndrome 15
The tobacco industry sponsored conferences, newsletters and professional associa-tions concerned with indoor air pollution or independent building investigators toensure that as much as possible tobacco smoke was not mentioned as an indoor airpollutant.
In 1988 the Tobacco Institute produced a glossy brochure that was distributedto the general public, regulators, decision makers and government organisationsthat blamed the occurrence of sick building syndrome on poorly designed andmaintained ventilation systems in buildings that had sealed windows to conserveenergy. They also blamed sick building syndrome on contamination of buildingsby fungal and other micro organisms as well as the recirculation of chemical andother air contaminants by building ventilation systems. Sick Building Syndrome,not tobacco smoke, was promoted as the cause of ill health in people who workedin buildings. Hodgson (1989), a researcher who was not connected to the tobaccoindustry, conducted research that showed that cigarette second hand tobacco smokeproduced a dose-related increase in the reports of sick building syndrome symptomsby employees exposed to this smoke.
Murphy (2006) recorded that sick building syndrome achieved the prominencethat it did in the last 2 decades of the twentieth century mainly due to the efforts ofthe tobacco industry who promoted an ecological (management of the micro organ-isms in the building) and systems approach (pre-planning during the building designstage not to include any toxic materials and to have adequate building ventilation,preventative maintenance, walk through inspections, proactive risk assessments andrisk control measures, etc) to prevention indoor air pollution causing sick buildingsyndrome.
Ragnar Rylander, a researcher who worked for the Philip Morris TobaccoCompany, conducted research to prove that the cause of sick building syndromewas endotoxins in the air. An endotoxin is a poisonous substance that is containedin the cell walls of gram negative bacteria and other micro organisms. This toxinis released when the bacterium dies. The release of the endotoxin can cause fever,shock and other symptoms of ill health (Anderson et al. 1998). In 1988 ProfessorRylander presented his findings at a conference in Argentina and in 1989 at a con-ference in Brussels. Rylander’s research publications proposed that tobacco smoke
protected employees and other people from endotoxin caused inflammation of cells.
From 1989 to 1994 Rylander published research findings that demonstrated the sick
building syndrome was caused by exposure to indoor airborne fungal (glucan) and
bacterial (endotoxins). His research work was sponsored and publicised by Philip
Morris. Rylander’s research findings promoted that the building ecology was the
cause of sick building syndrome.
OSHA, in 1991, published a notice of request for information on occupational
exposure to indoor air pollutants so that it could be determined if there was a need
for any regulatory action. Included as indoor air pollutants were endotoxins, which
were thought to be the cause of sick building syndrome, and passive tobacco smoke
exposure. The tobacco industry produced the following response to this OSHA
request.

16 J. Jansz
Four large databases on sick-building syndrome investigations, including data bases fromNIOSH, Health and Welfare Canada, T.D. Stirling and Associates, Ltd. [a long time indus-try consultant], and Healthy Buildings International [another industry consultant], do notreveal significant correlations between IAQ [indoor air quality] complaints and symptomsand specific types of causative agents. In over 50 percent of all sick building cases, symp-toms and complaints are abated by increasing the ventilation to levels comparable to thosespecified in ASHRAE 62-1989 [an engineering standard for indoor air quality]. In addition,the four data bases indicate that complaints and symptoms can be correlated to tobaccosmoking in only two to four percent of all sick-building investigations (Barnes and Glantz2007, p. 997).
What was not recorded in this submission was that the Tobacco Institute had paidGray Robertson, President of Healthy Buildings International, a monthly retainerto work for the Tobacco Institute. Gray Robertson’s business had previously been a
small ventilation cleaning service called ACVA Atlantic. As Robertson was paid
this retainer Healthy Buildings International was able to expand the ventilation
cleaning business to conducting investigations into the causes of sick buildings
and underbid the prices of other companies. Robertson’s company became the
largest sick building syndrome investigating company in America. The company
never identified tobacco smoke as a cause of sick building syndrome. Instead this
company produced and distributed free glossy magazines in many languages that
promoted the cause of sick building syndrome as being due to “the improper oper-
ation and maintenance and faulty design and construction of buildings, causing
the structure to trap polluted air” (Murphy 2006, p. 147). In the submission to
OSHA Robertson said that “virtually every indoor decoration, building material or
piece of furniture sheds some type of gaseous particulate pollutant” (Murphy 2006,
p. 148).
The tobacco industry also sponsored and promoted other sympathetic indoor air
quality experts to tell people about sick building syndrome and to promote sick
building syndrome as being due to a multitude of causes. The Healthy Buildings
International researchers collected published literature that identified substances
(such as fungi, dust, bacteria, formaldehyde, humidity, etc) rather than tobacco
smoke as the causes of sick building syndrome. This is the published literature that
was used in the above submitted response to OSHA.
OSHA did not go ahead with having a proposed indoor air quality standard.
The tobacco industry continued its sick building syndrome publicity campaign in
as many ways as possible to prevent the regulation of smoking in workplaces and
public places. The tobacco industry has now stopped promoting endotoxins as a
cause of sick building syndrome as it has been identified by the researchers Hasday,
Bascom, Costa, Fitzgerald and Dublin that endotoxins are an active component of
cigarette smoke (Barnes and Glantz 2007).
In Western Australian workplaces in 2010 there are very few cases of sick build-
ing syndrome reported. In workplaces and public places cigarette smoking is not
allowed by law. In Western Australia only 4.8% of young people smoke cigarettes.
In the general population less than 15% of Western Australians smoke cigarettes.
It is anticipated that by 2025 there will be practically no one left in Western

1 Introduction to Sick Building Syndrome 17
Australia who smokes cigarettes (O’Leary 2010). However, in some other coun-
tries cigarette smoking is still allowed indoors and could be a contributor to “sick
building syndrome.”
1.6 The Influence of Corporations on Denying the Existence
of Sick Building Syndrome
1.6.1 Introduction
While the tobacco companies promoted the existence of sick building syndrome
most employers did not. Instead some employers and building owners promoted that
Sick Building Syndrome was due to psychological factors, or did not exist. In the
United States of America in the 1970s and 1980s property owners were strongly
supported to hold this point of view by their government.
1.6.2 Government Position on Indoor Air Quality
in the United States of America
In the 1970s Environmental Protection Authority (EPA) was the organisation that
was responsible for establishing regulations and standards for indoor air quality in
America. The scientists who worked for this organisation had difficulty measur-
ing sources of indoor air pollution in office settings because exposure of people to
airborne substance was often transient or of a low level and the EPA hygiene moni-
toring instruments had only been designed to detect high levels of chemical exposure
in factories, rather than chronic or transient exposures. Office workers were affected
by air borne pollutants, even at low levels, as the worker’s length of exposure
could be for long periods of time, or the individual could be hyper-sensitivity to
the pollutant.
An additional problem was that, as government paid scientists, EPA scientists
were “tightly restricted in their ability to communicate findings or design studies by
politically appointed administrators whose ideology often rejected the notion that
the state should regulate capitalism” (Murphy 2006, p. 116). In the 1970s and 1980s
the Environmental Protection Authority developed a reputation as an organisation
that did not tell the truth.
Once Ronald Regan was elected the President of the United States of America
he cut the EPA staff numbers by 40% and the EPA budget by 60%. In 1981 Regan
appointed Ann Gorsuch as EPA Head. She in turn appointed professionals, to upper
management positions, who had previously been engaged by industry to defend
their industry against government regulation. Under Ann Gorsuch’s leadership EPA
career “scientists who resisted pressure to repress damning data or acted as whistle-
blowers could find themselves fired, harassed, or transferred to positions in which
their only tasks would be answering phones or filing paper” (Murphy 2006, p. 117).

18 J. Jansz
Orders were given by Ronald Regan that the EPA was not allowed to collect anyinformation on any chemical unless a cost-benefit analysis had shown that to collectthis information was beneficial for the company and the industry. Economic consid-erations were deemed to be more important than scientific evidence and populationhealth.
Under the leadership of Ann Gorsuch (1981–1983), William Ruckelshaus
(1983–1985) and Lee Thomas (1985–1989), who were all business representatives,
EPA Inspectors fined some organisations that polluted middle class neighborhoods,
but did not fine industries that caused pollution in the poorer neighborhoods.
This was perceived as being unfair by some community environmental activist in
America who began to lobby EPA scientists about the requirement for perceived
environmental justice. Civil rights legislation was used by these activists against
these inequalities. There also arose toxic waste activist who used epidemiology find-
ings to demonstrate chemical exposure and its effects as they distrusted the EPA
scientists.
“Caught between the activists’ criticism and an anti-regulation administration, a
small group of EPS scientist, many with ‘backgrounds in environmental, political
and labor activism,’ took the unusual and impressive step of organising a union of
‘toxicologist, chemists, biologist, attorneys and other environmental professionals’
in the name of scientific ethics” (Murphy 2006, p. 119). This organisation, which
was chartered in 1983, was called the National Federation of Federal Employees
(NFFE).
The NFFE Union was joined by about 1,200 EPA workers who held the view that
the corruption of the EPA was due to the influence of industry sponsored organisa-
tions and large companies. For example, if an EPA scientist had a research finding
that was unfavourable to, or critical of, a large company then the scientist was unable
to go public with the findings. If a scientist did go public with the findings it meant
that this scientist’s career was ruined. As well as ruining the career of the scientist
the EPA administrators were also able to “counter almost any positive findings made
by an EPA scientist by pointing to a nearly identical, corporate sponsored experi-
ment that produced a negative or more ambivalent result” (Murphy 2006, p. 120).
Following a different finings from the subsequent research there would need to be
many other research studies conducted each of which would generate more and
more uncertainty and so make it impossible for the EPA to have a regulation for the
problem identified by the first scientist.
An example of a scientific problem that the EPA did this with was related to the
potential toxicity of new carpet. At the independent Anderson Laboratory scientists
blew air over new carpet on to mice. As a result of inhaling this air some of the
mice developed severe neuromuscular and severe neurological reactions. A mem-
ber of the NFFE Union videotaped this experiment. When the EPA, carpet and
rug industry scientist replicated this study they modified the research procedures
to use bottled air that was bubbled through water to conduct their experiment.
The bottled air had no effect on the mice so the EPA, the rug and the carpet
companies stated that there were no problems with carpets or rugs that needed
regulation.

1 Introduction to Sick Building Syndrome 19
1.6.3 Psychological Issues
An EPA scientist, Lance Wallace, in 1987 conducted research on university stu-dents. His research identified that the time that these students spent indoors, not thestudent’s proximity to industrial sites, was most strongly correlated with accu-
mulated chemical exposures. As a result of the publication of these research
findings the American Congress established an Indoor Air Division at the EPA.
This Division was responsible for the investigation of incidences of indoor air
pollution. Lance Wallace was given the title of the “Father of Indoor Air Quality
Research”.
At the EPA the NFFE Union was concerned with the condition of the building
at Waterside Mall in Washington that was the EPA Headquarters. This building had
originally been apartments. It now housed offices for about 5,000 EPA employees.
The building had windows that did not open. The air was stale as the air vents were
clogged with dirt and fibrous matter. Black powder dropped from the ceiling onto the
occupants and their work stations. Cockroaches and mice infested the offices which
were filthy. In 1987, when the NFFE Union complained about the state of the phys-
ical workplace the building owner, on instructions from the EPA Administration,
installed new carpet to improve the physical work environment. “Immediately, some
EPA staff, including scientists, began to complain of acute symptoms: tearing eyes,
irritated throats, burning lungs, shortness of breath, crippling headaches, and dizzi-
ness. As the carpet installation pushed its way through the building, the trickle of
complaints turned into a torrent” (Murphy 2006, pp. 123–124). When this air was
monitored 68 different chemicals were detected. These employees were told that
this was not a problem as none of the chemicals were present in a high enough con-
centration to affect their health. Some of the employees wore masks to work as they
could not function with the level of indoor pollution.
In 1988 a Committee of Poisoned Employees (COPE) was formed by some of
the sickest employees who asked the NFFE Union and the American Federation of
Government Employees (AFGE) to help them organise a protest about the way that
their indoor air pollution caused illness was dismissed by the EPA Administration.
In May 1988 a protest was held by 60 EPA employees who carried placards stating
“Canaries in a coal mine” or that had the EPA logo upside down, or that recorded
“EPA is a superfund site” or other comments. These employees handed out building
surveys for employees to complete.
The Indoor Air Division of the EPA did not investigate their employees’ com-
plains about the EPA indoor air quality until 2 years after the carpets had been laid.
The investigation of the EPA indoor air quality was conducted by Lance Wallace
due to the lobbying of the NFFE Union Members. As such a long period of time
had passed since the carpets were laid, and as he only had stationary monitoring
equipment, Wallace did not expect to find any physical evidence of air pollution
so, as part of his indoor air quality investigation, Wallace gave out a question-
naire. A response to his questionnaire was received from 3,955 EPA employees.
Most of these employees suffered ill health when in the building, but no single
cause was identified by the questionnaire response data analysis. As an Appendix

20 J. Jansz
to Wallace’s research report the NFFE Union Members added newspaper articles,
internal memos, previous air monitoring reports and the results of independent air
monitoring research on the EPA building’s carpet. The NFFE wanted to show the
world how the political climate at the EPA hid facts.
Six of the sick EPA employees, who had been affected by the air pollution
from the carpet, sued the owner of the EPA Building for damaging their health.
A jury awarded these employees US$948,000 in damages. This was the biggest
indoor air pollution award at the time. As a defense the EPA building owner said
that the illnesses that these employees were suffering were not due to the build-
ing, but to psychological problems brought on by the management conditions
under which these employees worked. In 1995 the District of Columbia Superior
Court over turned the original damages ruling by deciding that the landlord could
not be responsible any psychogenic illnesses. Following this court decision and,
“thanks to industry advocacy groups, sick building syndrome became a means to
disable accountability” (Murphy 2006, p. 149) for landlords when their property
caused tenants ill health effects as property owners are not responsible for tenants
psychological health.
Claiming that employees’ sick building syndrome health effects were due to their
employer’s management provided an opportunity for Marsha Coleman-Adebayo, a
senior policy analyst at the EPA, to sue the EPA on the grounds of racial and gender
discrimination. She won $600,000 in settlement. Mismanagement of employees was
now considered a cause of sick building syndrome. In 1998 the EPA employees
were relocated from the Waterside Mall building to a new building called the Ronald
Regan Building. After relocating to a new building there was no further sick building
syndrome problems at the EPA.
1.6.4 Law Cases
Subsequent to the findings in the EPA employees’ law case it has been very
difficult in a court of law to prove that an employee’s ill health is caused by
sick building syndrome. Of the four sick building syndrome law cases obtained
from the legal web site www.austlii.edu.au one was successful and three were
unsuccessful.
The 1st unsuccessful case was between Duff and Australian Telecommunications
Corporation 1992. In Mrs Duff’s workplace there was a lot of dust, biological
contaminants, the air-conditioning system was poorly maintained, the building tem-
perature was poorly controlled and Mrs Duff said that her workplace caused her to
have 26 respiratory infections with sick leave between 1974 and 1988.
The 2nd unsuccessful case was Milic Milenkovic and Comcare (1993).
Mr Milenkovic stated that he became incapacitated due to a nose and throat allergy
problem due to environmental exposure to toluene (a solvent used in his workplace),
phenol, nitrous dioxide, formaldehyde that was omitted from particle board and
textiles, the components of polyester fabrics, rubber, polyurethane foam and poor
ventilation from the air conditioner at his workplace.

1 Introduction to Sick Building Syndrome 21
The 3rd unsuccessful case was Anderson v Accident Compensation Corporation(2006) in New Zealand. In this case Shona Anderson experienced nausea, apersistent cough, breathing difficulties, a dry mouth and itchy skin when at work.When away from work these symptoms resolved. In court Shona Anderson hadthree medical practitioners who gave evidence that she had sick building syndrome.Many other employees at Mrs Anderson’s workplace complained of experiencing
the same symptoms as Shona Anderson as well as experiencing headaches, gen-
eral malaise and being chronically tired at work. These health effects were relieved
when these employees left work. It was suggested that the cause of their ill health
was volatile organic compounds from the workplace printers and poor workplace
ventilation. Sometime success in a court of law depends on how well a lawyer can
present a case to the Judge.
A successful case was Janice Mary Gordon and Australian and Overseas
Telecommunications Corporation (1992). When at work Janice Gordon suffered
from allergic rhinitis, nausea, flu, sore throat, sore eyes and a general feeling of
being unwell. These symptoms were relieved when she was away from the building.
Janice was awarded workers compensation for her case.
The first successful workers compensation case in Australia related to an
employee experiencing sick building syndrome was the case of the Accident
Compensation Commission (Victoria College) v Bradley (29 May 1989). This case
was reported by Pengilley (1994). Bradley was a librarian employed by a School of
the Victorian Technical and Further Education (TAFE). This librarian claimed to be
suffering from sick building syndrome after being exposed to formaldehyde fumes
from the building materials in the new library building. These fumes were recircu-
lated through the building air conditioning system in the school library. The building
owner said in court that the level of formaldehyde in the atmosphere was within the
acceptable standard range. The applicant was just highly sensitive to this air contam-
ination. “The Judge was satisfied as to the causal connection between the applicant’s
injury and the building’s air conditioning system, and, under the Act liability was
strict.” (Pengilley 1994, p. 22) The librarian was successful in this court case and
was awarded workers compensation under the Accident Compensation Act 1984
(Victoria). Apart from these five cases no other court cases related to sick building
syndrome were found for Australia or New Zealand.
1.7 Occupations Generated by the Recognition of Sick Building
Syndrome
Despite it being very difficult for employees to prove in a court of law that sick
building syndrome is the cause of their ill health many building owners were keen to
have healthy buildings. One motivator for having a healthy building was to prevent
industrial action as had occurred at the EPA building. The emergence of sick build-
ing syndrome has generated a whole new group of industries and occupations that
rely on its existence.

22 J. Jansz
Following publicity about sick building syndrome large buildings began to havea facilities manager to attend to building maintenance. Being a Private BuildingInspector became a profession. Building Doctors to identify and treat the causesof sick building syndrome arose. Building management and building inspectionfirms earned a living from identifying and treating sick building syndrome.Building Ecologist arose to identify, and where necessary eliminate, microorgan-isms, chemicals, etc that are in a building and cause health effects in the buildingoccupants.
Building wellness consultants emerged to promote managing buildings proac-tively through good pre-planning in the design stage of a building, using natural,non-polluting, energy efficient building materials, conducting regular preventativemaintenance for the building and equipment, conducting regular walk throughinspections and risk assessment activities to identify any opportunities for improve-ments. Incidences of sick building syndrome still occur today, so there will be acontinuing need for these occupations.
1.8 Conclusions
The answer to Jane’s question that was asked at the beginning of this chapter is no;
Jane is not suffering from sick building syndrome. While the building in which Jane
is located had its walls painted and new carpets put down in January 2010, there was
no reports in May 2010 of any odors or ill health effects from these. There had been
no recorded reports of building atmosphere pollutants in this building prior to Jane
asking if she had sick building syndrome. No one else in this building reported fre-
quent headaches while working in the building. This was the only symptom that Jane
stated that she had. Without the email being sent to her, Jane would not have con-
sidered that she had sick building syndrome. The cause of sick building syndrome
can be traced to many factors.
This introduction chapter has reported some of the many definitions of sick build-
ing syndrome. It has traced the recorded history of sick building syndrome and
looked at the effects that man made building materials and poor building ventilation
has had on the emergence of sick building syndrome. The role of women in raising
awareness of the existence of sick building syndrome through communication and
research activities and the role of tobacco industry’s publicity in raising the profile
of sick building syndrome was examined. Research conducted by people who the
tobacco companies paid to do the research identified that there was no one cause of
sick building syndrome, but it could have multiple causes. This chapter has docu-
mented that sick building syndrome having multiple causes, including being classed
in the American law courts as a psychogenic illness and being due to poor work
related management practices has allowed some building owners to escape their
responsibilities to maintain a high standard of indoor air quality in their buildings.
The next chapter looks at the health effects that are attributed to sick building
syndrome and current theories and knowledge about sick building syndrome that
can occur in old buildings and in new buildings.

1 Introduction to Sick Building Syndrome 23
Acknowledgement One of the people who responded to the Flyer asking for Sick BuildingSyndrome stories was Rob Winchester. Rob kindly offered to help the author with obtainingpublished literature for the 1st, 2nd and last chapters of this book. Rob accessed, placed thesepublications on sick building syndrome in Endnote and then printed these publications from OSHUPDATE as they were required for reviewed to write these 3 book chapters.
References
Anderson K, Anderson L, Glanze W (1998) Mosby’s Medical, Nursing & Allied Health Dictionary,5th ed. Mosby, St. Louis, MO.
BBC (2004, June 22) Sir Richard Doll: a life’s research. http://news.bbc.co.uk/2/hi/health/3826939.stm. Accessed 10 June 2010
Barnes R, Glantz S (2007) Endotoxins in tobacco smoke: Shifting tobacco industry positions.Nicotine Tob Res 9(10):995–1004.
Buzzle.com (2010) History of electricity –When was electricity invented? http://www.buzle.com/articles/history-of-electricity-when-was-electricity-invented.html. Accessed 8 June 2010
Carruthers S (2010, May) Hepatitis C prevention: Past, present & future. Centre lines, pp. 2–4.Chin J (Ed.) (2000) Control of Communicable Disease Manual, 17th ed. American Public Health
Association, Washington, DC.Duff and Australian Telecommunications Corporation (1992). www.austlii.edu.au. Accessed
26 May 2010Environmental Illness Resource (2010, May 26). Sick building syndrome. http://www.ei-resource.
org/illness-information/related-conditions/sick-building-syndr. Accessed 26 May 2010Environmental Protection Agency (2010) Indoor air facts No. 4 (revised) Sick building syndrome.
http://www.epa.gov/iaq/pubs/sbs.html. Accessed 3 June 2010Greer C (2007) Something in the air: A critical review of literature on the topic of sick building
syndrome. World Saf J 16(1):23–26.Health and Safety Executive (1996) Health & safety executive operational circular. Sick build-
ing syndrome. file://J:\dev\operational\Ocs%20TYP(pdf)300-399\0c311_3r.htm. Accessed18 Nov 2004
Hedge A, Ericson W (1996) Predicting sick building syndrome at the individual and aggregatelevels. Environ Int 22(1):3–19.
Hodgson M (1989) Environmental tobacco smoke and the sick building syndrome. Occup Med4:735–740.
Janice Mary Gordon and Australian and Overseas Telecommunications Corporation (1992). www.austlii.edu.au. Accessed 26 May 2010
Jennings M (2007) Real estate law, 8th ed. Thomson South-west, Mason, OH.Joshi S (2008, August) The sick building syndrome. Indian J Occup Environ Med 12(2):61–64.Kreiss K, Rom W, Markowitz S (Eds.) (2006) Environmental & Occupational Medicine, 4th ed.
Lippincott Williams & Wilkins, Philadelphia, PA.Milenkovic M Comcare (1993) www.austlii.edu.au. Accessed 26 May 2010Milica G (2009) Sick building syndrome. Do we live and work in unhealthy environment? Period
Biol 111(1):79–84.Murphy M (2006) Sick Building Syndrome and the Problem of Uncertainty: Environmental
Politics, Techno-Science, and Women Workers. Duke University Press, Durham, NC.National Electrical Manufacturers Association (1946) A Chronological History of Electrical
Development. Author, New York, NY.Odle T (2010) Sick building syndrome. http://www.answers.com/topic/sick-building-syndrome.
Accessed 3 June 2010O’Leary C (2010, May 26) Smoking is a dying habit in Western Australia. The West Australian.
p. 7.

24 J. Jansz
Pengilley P (1994) The legal implications of substandard air quality. Australian Construction LawNewsletter 38:14–26.
Pheasant S (1994) Ergonomics, work and health. MacMillan, London, UK.Richmond C (2010) Sir richard doll. British Medical Journal 331(7511):295.Stolwijk JAJ (1984). Sick building syndrome. In Berglund B, Linvall T, Sundell J, (Eds.) Indoor
Air. Swedish Council for Building Research, Stockholm, pp. 22–29.TSSA (2010) Sick building syndrome. Accessed 2010, May 26 from http://www.tssa.org.uk/
article-47.php3?id_article=1001Wikipedia. Thomas Edison (2010). http://en.wikipedia.org/wiki/Thomas_Edison. Accessed 8 June
2010World Health Organisation (1982). Indoor Air Pollutants: Exposure and Health Effects, Report on
a WHO Meeting. Nordlingen: WHO Regional Office for Europe

Chapter 2
Theories and Knowledge About Sick BuildingSyndrome
Janis Jansz
2.1 Introduction
In 2005 I commenced work in the offshore oil and gas industry in the South East Asiaregion. The rig allocated was an old tender barge that was built in 1976. The décor hadremained the same for many years until “refurbishment” in 2005. A majority of the upgradewas purely aesthetic without review of ceiling or wall panels. In fact, new wall panels wereplaced directly over the old ones. The installation of a new industrial ducted air-conditioningsystem was well received in the hot and humid region of the equator. However, little thoughtwas given to any other requirements of the incoming air. After all, it was nice to be cool foronce.
In 2009, on the same tender barge, several of the catering and office crew started to con-tract some severe dermatological conditions that presented similar to anything from tineacorporis to eczema. Several crew members contracted severe upper and lower respira-tory infections with two requiring hospitalisation onshore and the remainder retained andtreated onboard. As the frequency of dermatological and respiratory conditions in crewmembers increased over approximately two to three months, I discussed the cases withthe onboard Medic. Through investigation of the medical documents and identifying thespecific personnel involved, it was realised that a majority of the patients were those withoffice/accommodation type appointments such as cleaners, catering staff, and supervisorsto name a few.
Approximately two weeks later the beloved air-conditioning unit failed and required repairfrom a specialist tradesman. It was at this point the specialist identified that UV lighting hadnot been installed with the ducting system. This allowed an extraordinary amount of spores,moulds, and fungus to populate within the ducting system. It was during the inspection ofthe ducting system that several small leaks from piping were found within the ceiling panelswith the water being directed down into the wall panelling. Small bulges had been noticedin the walls but had not been investigated. On removal of the wall panels, “friends” of thoseliving in the air-conditioning duct had made quite a home within the walls.
The identification of these two “fields” prompted the removal, cleaning, and reinstalment ofall wall panels, cleaning, sterilising, and installation of UV lighting in the air-conditioning
J. Jansz (B)Department of Health & Safety Environmental Health, Curtin University, Perth, WA 6845,Australia; School of Management, Edith Cowan University, Perth, WA 6845, Australia; CurtinHealth Innovation Research Centre, Perth, WA 6845, Australiae-mail: [email protected]
25S.A. Abdul-Wahab (ed.), Sick Building Syndrome,DOI 10.1007/978-3-642-17919-8_2, C© Springer-Verlag Berlin Heidelberg 2011

26 J. Jansz
Fig. 2.1 Pictures of the wall panelling onboard one of the rigs
duct and repair of the leaking pipe work. All dermatological & respiratory conditionsdeteriorated quite rapidly after the cleaning took place. The exact type of bacteria, fungus,and mould was not identified/reported back after the episode.
Pictures of the wall panelling onboard one of the rigs are shown in Fig. 2.1. The photos areall of the lower accommodation in which there are approximately 75 personnel accommo-dated. The capacity of the vessel is 112 personnel. Some photos I have highlighted with ared circle just to point out the bulging in the walls as it may be hard to see due to the qualityof the photos. (Lee)
This Occupational Safety Professional’s story is a typical sick building syndrome
story. Sick Building Syndrome has been defined as “a generic term used to describe
common symptoms which, for no obvious reason, are associated with particular
buildings” (TSSA 2010, p. 1). Clayton Utz’s Property Issues (1996, p. 25) records
that sick building syndrome is “a clinical diagnosis without any cause, or causes,
having been specifically identified.” Thorn (1998) reported that the diagnosis of
Sick Building Syndrome is made when all other building related causes of ill health
are eliminated. The Property Council of Australia (2009) states that as air quality
measurement techniques improve and are more widely used, and as knowledge of
the causes of sick building syndrome grows, the term building related illness is being
used more commonly than sick building syndrome.
In the first part of this story from Lee the cause of the employees becoming sick
at work was unknown. In this case the health effects experienced by employees were
respiratory and skin effects. These are typical sick building syndrome health effects.
When the air conditioning system was examined it was found that mould and other
fungus in the duct system and in the building walls was the cause of these employ-
ees’ ill health. These employees were now suffering a building related illness as the

2 Theories and Knowledge About Sick Building Syndrome 27
causes of the employees’ illnesses were determined. It is notable that not all employ-
ees who entered the accommodation became ill. This frequently happens with sick
building syndrome as not all employees may have been exposed to the same level
of the hazard, and because there is an individual difference in people’s susceptibil-
ity to environmental contaminants. In a research study conducted by Hedge et al.
(1995), 4,479 health survey questionnaires were completed and returned from the
occupants of 27 office buildings. The results of analysing the responses identified
that over 76% of the 4,479 respondents reported at least one work-related symptom
of Sick Building Syndrome at least once a month.
The most common theories about the cause of sick building syndrome are that it
can be caused by some of the following factors.
• Building materials (identified in the book of Leviticus in the Bible). The building
materials may allow micro organisms to grow on or in them, or the building
materials may have chemicals or other substances in them or off gassed from
them that may irritate the person’s skin or pollute the building air that people
breathe.
• Poor sanitation (identified in the Ohio State Capital Building investigation).
• Ozone, organic solvents and formaldehyde in the atmosphere (Jeanne Stellman
of the Women’s Occupational Health Resource Centre).
• Office equipment, furnishings and other materials and products located or used
in the building which can produce fumes or contact dermatitis (Jeanne Stellman
of the Women’s Occupational Health Resource Centre).
• Air borne chemical fumes or gasses from anything in the building (these cause
were publicised by Gray Robertson, President of Healthy Buildings International,
and supported by the tobacco industry).
• Building air conditioning, inadequate ventilation (which could cause a buildup
of carbon dioxide, carbon monoxide or other gasses) and pollutants from inside
or outside the building that were circulated by the air conditioning system
(these cause were publicised by Gray Robertson President of Healthy Buildings
International, and supported by the tobacco industry).
• Mould, bacteria, dust mites, other micro organisms; endotoxins and other micro-
bial products (these causes were publicised by Professor Ragnar Rylander of the
University of Geneva, and supported by the tobacco industry).
• Poor building cleaning and maintenance resulting in air borne dust and fibres
(Environmental Protection Authority (EPA) building investigation).
• Inadequate light and /or space for work tasks (EPA building investigation).
• Vermin (particularly mice, rats and cockroaches) infestation (EPA building
investigation).
• Poor indoor air quality (this cause was brought to prominence by the research
work of Lance Wallace of the EPA).
• Other environmental factors that include building temperature, humidity, lack
of negative ions in the workplace atmosphere, building odours, noise, electro-
static charges, electro-magnetic fields and/or vibration in the building (Godish
1995).

28 J. Jansz
• Psycho social issues (identified in an American court decision).• Poor management practices (identified in an American court decision).
The first dot points are factors that affect the air quality and physical environmentin the building. The last two points are people factors. When building occupantsbecome sick due to sick building syndrome causes there can be legal implications.
2.2 Legal Implications
The following information on legal implications refers to Australian and Americanlaws and cases, but other counties in the world have similar laws to protect the healthof the people in their country.
Pengilley (1994) highlighted the legal responsibilities of the building owners andtenants in New South Wales (NSW) in relation to indoor air quality. There is ageneral duty of care for an employer, under the Occupational Health and SafetyAct 1983 of NSW, to provide a safe workplace that does not harm the health ofemployees or anyone else who comes to the workplace. There are Common Lawrequirements and the Occupier’s Liability Act that require the air that people breathe
in a building to be safe.
In Australia there are Australian Standards. Two Standards that are relevant to
the air quality in buildings are AS3666-1989 Air-handling & water systems of
buildings- Microbial control, and AS1668.2-1991. The use of mechanical ventila-
tion and air-conditioning in buildings, Part 2: Mechanical ventilation for acceptable
indoor-air quality AS1668.2-1991 includes looking at the occupancy space and ven-
tilation requirements for people. For example, in a commercial organisation and in
office areas the requirements are 10 meters square (m2) per person occupancy space
with an air flow in the building of 10 litres/person/second. In a library each person
requires 5 m2 of floor space per person with the same air flow rate. In a confer-
ence room the air flow is required to be 15 lps/person. In an Australian court of law
the building owner and the tenant (s) would have been expected to have met the
requirements of these Australian Standards.
In a court of law the person who would be prosecuted for poor indoor air quality
would be the person who had ownership and control of the air conditioning unit.
Pengilley (1994) states that the case of Cunard v Anifyre [1993] 1 KB 551, the case
of Taylor v Liverpool Corporation [1993] 3 ALLER 329 at p. 337 and the case of
Wheat v E. Lacon & Co Ltd (1966) AC 552 provided precedence for this decision.
As an example of a court case related to a building’s air quality, Pengilley (1994)
cites the case of Carey v Australian Telecommunications (1985) 2 AAR 457. In this
case a postal clerk, who had a history of having asthma, claimed that on being
changed to working in an air conditioned office his asthma became worse. He pro-
duced evidence in court that mould and dust found in the building’s air conditioning
system aggravated his respiratory condition.

2 Theories and Knowledge About Sick Building Syndrome 29
Telecom presented evidence that the air-conditioning system had been well maintained andclean. On this point the Tribunal stated:
Irrespective of the state of maintenance and cleanliness, the fact is that certain moulds, fungiand other substances are being circulated by the system and, for whatever reason, they havean adverse effect on the applicant. . . If every component was cleaned daily, if every nutand bolt was tightened regularly, if the system was a paragon of punkahs, he would still beincapacitated. (Pengilley 1994, p. 22)
In this case the employee was awarded Worker’s Compensation for his asthma
becoming worse when in his employer’s air conditioned building.
Clayton Utz’s Property Issues (1996, p. 25) records that in the United States of
America “law suits arising from sick building syndrome causing personal injury
have been brought against manufacturers, distributors, employers, real estate bro-
kers, contractors, lenders, engineers, architects and building owners.” Evans (2008,
p. 39) stated that there were five possible ways that a person with sick building syn-
drome in Western Australia (WA) could find to instigate legal action against building
architects, builders, engineers, employers or product manufacturers.
1. Breach of contract. For building construction the materials used should be of
good quality and fit for purpose. For the building owner to ensure that these
requirements are met there are warranties for most building materials and equip-
ment purchased. If these requirements are not met then there is a breach of
contract.
2. Negligence. The Civil Liability Act 2002 (WA) applies to ill health that occurs
due to products purchased. However, with new and innovative materials, that the
product may cause harm needs to be reasonably foreseeable. For example the
potential health hazards, associated with volatile organic compounds (VOCs)
which can be released from fibreboards and particle boards, has been known
since the 1980s so it is reasonable foreseeable VOCs will be released from these
building materials. VOCs are a cause of sick building syndrome symptoms so
these building materials need to have a warning as to the health effects that they
can cause so that employers, building owners and other people are aware of this.
3. Occupiers’ liability legislation. The Occupiers’ Liability Act 1985 (WA) requires
the building to be safe for everyone who enters the building. This includes the
air that people breathe.
4. Occupational health and safety legislation. The Occupational Safety and Health
Act 1984 (WA) requires the employer to keep a safe workplace for everyone
who comes on to the business premises and to have safe work processes for
employees.
5. Actions against manufacturers and importers under the Trade Practices Act 1974
(Commonwealth). For example, this law could be used to make product man-
ufacturers liable for the health effects caused by formaldehyde-based building
materials, if there is no warning of the effects of formaldehyde provided with the
product as the health effects of formaldehyde (a cause of sick building syndrome)
are well known.

30 J. Jansz
For claims to be successful the person making the claim would have to prove thatthe building owner or employer or others had a duty of care to the building occupant.The person would then have to prove that a breach of this duty had occurred. Theynext must prove the cause of their illness was due to factors in the building and lastlythe occupant would have to demonstrate the company or person to be liable to paydamages for a breach of this duty and that “the breach produced the claimed injuryby a natural and continuous sequence, unbroken by any efficient intervening cause,and they must establish that the claimed injury would not have occurred withoutthe breach” (Air conditioning and indoor air quality 2006, p. 4). Air conditioningand indoor air quality (2006) describes two cases in the United States of Americawhere this proof has been successful in relation to a person, or people, suffering sickbuilding syndrome. In both cases the cause of sick building syndrome was identifiedto be mould in the building.
Case 1. Copper piping leaked water underneath a 22 room mansion in whichMelinda Ballard lived. She suffered adverse health effects from the mouldthat grew in this area. When this case was taken to court a Jury awardedMelinda Ballard US$32 million. This compensation was paid to Melinda byher building insurance company.
Case 2. A mould related ill health case in California was settled forUS$18.5 million.
Air conditioning and indoor air quality (2006) described two other cases that werebefore the American courts. In one case a New York employee had initiated a claimfor US$65 million against his employer for ill health suffered due to exposure tomould in his workplace. In the other case Richard Kramer had brought a complaintfor compensation and punitive damages of US$2 billion against 28 defendants.In the building in which Richard lives he stated “that mould infestation has resultedfrom massive leaks and other water problems throughout the building, which thedefendants knew about for well over a year, but concealed from apartment ownersand failed to remedy.” Not remedying these problems caused Richard Kramar’s 3
year old daughter, Alana, to develop “severe and disabling respiratory and other ill-
nesses attributable to toxic mould exposure as well as affecting Mrs Kramer, who
had developed severe allergic reactions to this toxic mould” (Air conditioning and
indoor air quality 2006, p. 4). In Australia there are also sick building syndrome
stories where the cause of this ill health can be attributed to mould as is documented
in the following story.
2.3 Health Effects Attributed to Sick Building Syndrome
2.3.1 Introduction
As an Agency Registered Nurse I went to work a shift at a nursing home because therewere registered nurses on sick leave due to having respiratory infections. One of the first

2 Theories and Knowledge About Sick Building Syndrome 31
Fig. 2.2 Pictures of theStachybotrys Trichothecenesmould that grow on celluloserich material
things that I noticed in the nurses’ hand over room was that there was water damage on theceiling and the walls. In the water damaged areas there was mould growing. The staff toldme that when it rained the roof leaked and water came through the ceiling and ran downthe walls. All of the windows in this nursing home were made so that they stayed shut tokeep the building at a comfortable air conditioned temperature for the residents. As well asstaff frequently becoming ill some of the residents had respiratory and other symptoms ofill health. I completed a hazard report form on the mould, but did not return to work at thisnursing home to find out if any steps were taken to eliminate this biological hazard.
The picture shown in Fig. 2.2 comes from Google Images. It is of the StachybotrysTrichothecenes mould that grows on cellulose rich material, particularly if there is a moistenvironment and causes health complaints including eye, nose and/or throat irritation,headaches, dry cough, dry itchy skin, difficulty in concentrating, dizziness, nausea, fatigue& sensitivity to odours. This looks like the mould that was on the nursing home ceilingand walls. The ill health effects caused by this mould resemble symptoms that some of thenursing home residents and staff were experiencing (Patricia).
This is a Sick Building Syndrome story because the cause of the employees’ and
of the residents’ ill health was not determined, but seemed to be related to being in
the nursing home building. Many of the symptoms of exposure to the Stachybotrys
Trichothecenes mould are similar to the symptoms of sick building syndrome.
2.3.2 Ill Health Effects
The Environmental Protection Agency (2010), Environmental Illness Resource
(2010), Odle (2010), Kipen (2010), Roy (2010), Unionsafe (2009), Milica (2009),
Property Council of Australia (2009), Gomzi and Bobic (2009), Joshi (2008), Evans
(2008), Tyler (2007), Greer (2007), Marmot et al. (2006), Kreiss et al. (2006),
Shoemaker and House (2005), Burge (2004), Hodgson (2002), Unionsafe (2002),
Mendelson et al. (2000), Workplace Services (2000), Niven et al. (2000), Thorn
(1998), Brinke et al. (1998), Redlich et al. (1997), Bachmann and Myers (1995),

32 J. Jansz
Hedge et al. (1995), the Health and Safety Executive (1992), Stenberg (1989) andFinnegan et al. (1984) state that Sick Building Syndrome can cause the following illhealth effects.
1. Respiratory
• Runny nose• Sneezing• Dry sore throat• Blocked nose• Nose bleeds• Allergic Rhinitis (repetitive sneezing and a runny nose)• Sinus congestion• Colds• Influenza like symptoms• Dry Cough• Throat irritation• Wheezing when breathing• Shortness of breath• Sensation of having dry mucus membranes• Hoarseness of the voice due to inflammation of the throat and larynx• Sensitivity to odours• Increased incidences of building related asthma attacks
2. Eye irritation
• Eye dryness• Itching of the eyes• Watering of the eyes• Gritty eyes• Burning of the eyes• Visual disturbances• Light sensitivity
3. Dermal irritation
• Skin rashes• Itchy skin• Dry skin• Erythema (Redness or inflammation due to congestion in, and dilation of, the
superficial capillaries of the skin.)• Irritation and dryness of the lips• Seborrheic dermatitis• Periorbital eczema• Rosacca• Uritcaria• Itching folliculitis

2 Theories and Knowledge About Sick Building Syndrome 33
4. Cognitive complaints
• Functional headache that affect a person’s performance, but which fail to
reveal evidence of physiological or structural abnormalities
• Migraine headache
• Tension headache
• Sinus headache due to swelling of the mucus membranes
• Mental confusion
5. Lethargy
• Lethargic (The word “lethargy” comes from the Greek word lethargos which
means forgetful.)
• Difficulty in concentrating
• Mental fatigue
• General fatigue that starts within a few hours of coming to work and which
ceases after the person leaves the building
• Unable to think clearly
• Drowsy
6. Gastrointestinal symptoms
• nausea
7. Other
• Dizziness
• Unspecified hypersensitivity reactions
• Personality changes (that may be due to stress or ill health)
• Exacerbation of pre-existing illnesses such as asthma, sinusitis or eczema.
Redlich et al. (1997) found that the duration of time spent working in the building
could affect the occurrence of the symptoms of sick building syndrome. For exam-
ple, clerical staff may spend a longer period of time at their desk than management
staff and so be more likely to be affected by adverse building conditions. Finnegan
et al. (1984) found when studying sick building syndrome symptoms in 9 buildings
that the incidence of the symptoms were much higher in buildings that were air
conditioned than in buildings that were not air conditioned.
The Property Council of Australia (2009) has grouped the symptoms of sick
building syndrome into three groups with each group having a common set of
symptoms and a set of likely causes or sources to be investigated (Table 2.1).
Roy (2010) reported his investigations into causes of sick building syndrome
identified that irritant, or allergic dermatitis is usually due to fibreglass dust or to
formaldehyde particles in the building air. Fibre glass is a skin irritant and is com-
monly found in building insulation. Fibreglass particles can be blown into the air
through the building ventilation system. Roy also identified that a common cause of
hay fever is mould spores in the building.

34 J. Jansz
Tab
le2.1
The
thre
egr
oups
ofth
esy
mpt
oms
ofsi
ckbu
ildi
ngsy
ndro
me
Com
mon
sym
ptom
sL
ikel
yca
uses
orso
urce
s
Gro
up
AH
eada
ches
Let
harg
yN
ause
aD
row
sine
ssD
izzi
ness
Out
door
air
rate
san
ddi
stri
buti
on.
Pos
sibl
eai
rpo
llut
ion.
Car
bon
mon
oxid
em
aybe
ente
ring
from
outd
oor
air
inta
kes.
Oth
erob
viou
spo
llut
ant
gene
rato
rsfr
omne
ighb
ouri
ngor
indu
stri
also
urce
sm
aybe
pres
ent.
Gro
up
BC
onge
stio
nS
wel
ling
Itch
ing
orir
rita
tion
ofey
es,n
ose
orth
roat
Sub
-cli
nica
lsy
mpt
oms
(e.g
.hea
dach
e,fa
tigu
e,na
usea
)
Pol
luta
nts
ente
ring
air
stre
amfr
omlo
cal
poll
utan
tge
nera
tors
;th
eou
tdoo
rai
rqu
alit
y;H
VA
Cre
late
dpr
oble
ms;
buil
ding
mat
eria
ls.
Be
awar
eof
hype
rsen
siti
viti
esan
dot
her
pre-
exis
ting
med
ical
cond
itio
nsin
indi
vidu
als.
Lig
htin
gpr
oble
ms,
e.g.
flic
ker
caus
edby
mag
neti
cba
llas
tsan
dco
mpu
ter
glar
e,w
hich
cont
ribu
teto
eye
irri
tati
on.
Erg
onom
icpr
oble
ms
e.g.
mus
cle
stra
in,e
yest
rain
and
fati
gue.
Gro
up
CC
ough
Sho
rtne
ssof
brea
thF
ever
,chi
lls
and/
orfa
tigu
eaf
ter
retu
rnto
the
buil
ding
Dia
gnos
edin
fect
ion
Dis
com
fort
and/
orhe
alth
com
plai
nts
that
cann
otbe
read
ily
ascr
ibed
toai
rco
ntam
inan
tsor
clim
atic
cond
itio
ns
Sti
mul
ated
byth
erm
aldi
scom
fort
fact
ors
incl
udin
gte
mpe
ratu
rean
dhu
mid
ity
sett
ings
,out
door
air
rate
san
ddi
stri
buti
on.
Par
ticu
late
poll
utan
tssu
chas
dust
are
ofte
nir
rita
nts.
Mor
ese
riou
sfe
ver/
chil
lpr
oble
ms
can
poin
tto
mic
robi
alco
ntam
inat
ion
inth
ebu
ildi
ng.
Mic
robi
alpr
oble
ms
–A
cute
case
scen
ario
sre
late
toL
egio
nn
aire
s’dis
ease
and
acu
teas
thm
a.C
hro
nic
case
so
fas
thm
a,in
fect
ion
and
irri
tati
on
are
more
wid
esp
read
.E
xam
ine
cooli
ng
tow
ers,
HV
AC
syst
em[i
ncl
udin
gduct
ing]
or
outd
oor
air.
May
be
rela
ted
top
rob
lem
sw
ith
env
iro
nm
enta
l,er
go
no
mic
or
oth
erjo
bre
late
dpsy
cho
soci
alfa
cto
rs.
HV
AC
inth
ista
ble
isan
abb
revia
tio
nfo
rH
eati
ng
,V
enti
lati
on
and
Air
Co
nd
itio
nin
gsy
stem
.

2 Theories and Knowledge About Sick Building Syndrome 35
According to the World Health Organisation (1993), definition of sick buildingsyndrome and the Environmental Protection Agency (2010) the symptoms of sickbuilding syndrome fade away after the person leaves the building. The cause ofthese signs and symptoms are unknown but they can reduce work efficiency, causeemployees to take sick leave and to resign their employment position. Stenberg in aChap. 25 in this book writes comprehensively about the symptoms of sick buildingsyndrome but disagrees with the statement that the symptoms of sick building syn-
drome fade away after the person leaves the building. Stenberg’s research (Chap. 25,
this volume) has found that sick building syndrome can have a gradual onset and
long duration of the symptoms, even when the person has left the building. This
author found no research based studies that demonstrated that the person’s symp-
toms resolved immediately on leaving the building; rather the studies examined by
Stenberg (Chap. 25, this volume) identified that many of the symptoms remained
for years after the person had left the building.
Diagnosis of Sick Building Syndrome is usually made by a Medical Practitioner
based on the employee’s self reported history of symptoms and of the Medical
Practitioner’s physical and clinical examination findings. The Medical Practitioner’s
diagnosis needs to be corroborated with an examination of the building in which the
employee works.
To do this a trained occupational safety and health professional is required to
perform a walk through survey of the building to identify if any other occupants of
the building have the same symptoms, to check building factors (such as building
ventilation, cleaning, maintenance, work station layout, if the employee works in
an open plan offices with more than 10 work stations, if there are large areas of
soft furnishing and open shelves, new furniture, carpets, painted surfaces, air con-
ditioning, lighting levels, particularly if there is glare or flicker that the employee
is exposed to when working), environmental factors (such as high temperature or
excessive temperature variation, very low or high humidity, noise) and for pollutants
(such as tobacco smoke, ozone, volatile organic compounds, dust particles, chem-
icals or fibres in the atmosphere, microbiological or fungal contaminants), work
related factors (such as variety and interest in the work performed by this employee,
employee’s ability to control particular aspects of their work or work environment),
personal factors (such as job satisfaction) and to conduct environmental monitoring
to identify any pollutants in the air.
Most office workers spend 70–90% of their work time indoors so are affected
by any indoor air pollution. Roy (2010) reports on a NIOSH (National Institute of
Occupational Safety and Health) survey of 100 office buildings. This survey found
that 23% of the occupants of these 100 buildings reported recurrent Sick Building
Syndrome symptoms that included ear, nose and throat irritations and asthma.
2.3.3 Building Related Illnesses
Although Sick Building Syndrome is the popular term used in published literature
and common language, building related illness may be a more accurate term because

36 J. Jansz
a building cannot get sick as it is not alive. However, building related illness is a termthat is used to describe illnesses that occurs in a person in a particular building forwhich a cause is known. According to Passarelli (2009) some common buildingrelated illnesses include Mass Psychogenic Illness where a large number of peo-ple believe that they are affected by a particular set of symptoms where no knownmicroorganism is identified as causing this illness. The difference between MassPsychogenic Illness and Sick Building Syndrome is that Mass Psychogenic Illnessis spread through social networks and the symptoms do not fade away when theperson leaves the building. Mass Psychogenic Illness usually occurs in workplaceswhere there is a lot of tension and employees feel stressed.
Passarelli (2009) states that Neurotoxic Disorder is a building related illness thatis caused by the presence of heavy metals and other neurotoxic substances in thebuilding in which employees work. The list of building related illnesses is addedto by Kreiss et al. (2006) who include rhinosinusitis, hypersensitivity pneumonitis,inhalation fever and other infectious disease as building related illnesses.
Roy (2010) states that building related illnesses are more serious than sick build-ing syndrome as they do not subside when the person leaves the workplace. Roylists building related illnesses as including the following.
• Building-related asthma. This is a hypersensitivity illness that has the symptomsof wheezing, coughing, shortness of breath and a tight chest. The symptoms maynot appear until up to 12 h after exposure to the allergens in the building (TheProperty Council of Australia 2009).
• Irritant or allergic dermatitis. Skin rashes are most commonly caused byfibreglass or formaldehyde.
• Humidity fever. This can occur if a humidifier is used with the air conditionerand bacteria or fungi are aerosolized in the air through the humidifier. HumidityFever is a flu-like illness the symptoms of which are fever, chills, muscle aches,cough, dyspnoea and fatigue. The symptoms usually occur 4–8 h after exposure.
The symptoms usually subside once the person leaves the building but, in severe
cases, can last 2–3 days.
• Hypersensitivity Pneumonitis. This is usually due to high fungal exposure in the
building. It may also be due to regular dust exposure. It can be acute or chronic.
• Pontiac Fever. This is caused by inhaling the antigen of the gram negative bacilli
Legionellae. Symptoms of Pontiac Fever are a rapidly rising fever alternating
with chills. The infected person usually has anorexia, abdominal pain, malaise,
myalgia, headaches, a non productive cough and diarrhoea is common. Pontiac
Fever usually affects healthy young people and they recover spontaneously in
2–3 days with no treatment (Chin 2000).
• Legionnaire’s Disease. This is a more severe form of Pontiac Fever and is caused
by the same micro organism. The gram negative bacilli Legionellae (of which
there are 35 species and at least 45 serogroups) lives in hot water systems, air
conditioning cooling towers, evaporative air conditioners, hot and cold water taps,
showers and anything in the building that has running water as the transmission
of this micro organism from the water to humans is via the air that the person

2 Theories and Knowledge About Sick Building Syndrome 37
breaths. Legionnaire’s Disease occurs more commonly in people who are over
50 years old. As well as causing a severe form of pneumonia with Legionnaire’s
Disease there may also be brain, bowel and liver damage and kidney failure (Chin
2000; The Property Council of Australia 2009).
• Aspergillosis. Aspergillus fumigates causes allergic bronchopulmonary
aspergillosis in the lungs if a person is immune compromised or has a
pre-existing illness that lowers the effectiveness of the person’s immune system.
This micro organism can cause lung abscess, emphysema or fungus balls to grow
in the person’s lungs (Chin 2000).
• Other opportunistic fungal infections.
Research by Greer (2007) and by Chester and Levine (1997) identified that sick
building syndrome can cause Chronic Fatigue Syndrome with the suffers of this
Syndrome having health improvements when no longer working in the building that
was causing their illness. Another building related disease is Multiple Chemical
Sensitivity.
2.3.4 Multiple Chemical Sensitivity
Nakazawa et al. (2005) wrote a case study analysis of a woman clerical worker in
Japan who developed sick building syndrome due to exposure to formaldehyde and
other volatile organic compounds in her building workplace. This clerk’s symptoms
began when she was shifted to work in a new building that was being refurbished.
Like her work colleagues she was aware of strong odours in the refurbished rooms.
In May this employee developed nausea and had headaches at work. In June she
developed a nettle rash, fever and pharyngeal pain. In July she developed a severe
cough and nausea. This employee then took holidays as she felt that she was too
sick to continue working. Her symptoms improved to some extent, but then she
started reacting to chemicals outside the company building. She reported her med-
ical condition and was diagnosed by a Medical Practitioner as having Multiple
Chemical Sensitivity. She was awarded Workers Compensation for her illness and
treated with Tachion 150 mg a day. Her symptoms then resolved and she was able
to return to work. Not everyone with Multiple Chemical Sensitivity recovers as
quickly.
Multiple chemical sensitivity is a building related illness that affects people who
are highly sensitive, or allergic, to substances in the environment. Odle (2010,
p. 2) states that Multiple Chemical Sensitivity was “recognised by World Health
Organisation (WHO) as a medical condition in 1992.” Multiple chemical sensitivity
has proven difficult to diagnose as the symptoms seem to vary between one person
and another as different people are sensitive to different chemicals.
Cullen (2002, p. 6), states that for a person to be diagnosed with Multiple
Chemical Sensitivity this person should meet the following case definition
requirements.

38 J. Jansz
1. The syndrome is acquired, usually after the occurrence of a more clearly evi-dent (although not necessarily serious) health event caused by environmentalexposure, such as solvent intoxication, respiratory tract irritation, pesticidepoisoning, or non-specific building related illness.
2. The patient experiences multiple symptoms referable to several organ systems,almost always including the central nervous system.
3. Although there may be persistent complaints between exposures, the symptomsare characteristically and predictably precipitated by a perceived environmentalexposure.
4. The agents that may precipitate the symptoms are multiple and chemicallydiverse.
5. The doses of these agents that precipitate the symptoms are at least two ordersof magnitude lower than the established thresholds for acute effects.
6. No test of physiologic function can explain the symptoms. Although there maybe clinical abnormalities, such as mild bronchospasm or neuropsychologic dys-function, these are typically non-specific and insufficient to explain the full scopeof the illness pattern.
7. No other organic disorder is present that can better explain the pattern ofsymptoms.
Murphy (2006) states that some of the symptoms of multiple chemical sensitivityinclude shortness of breath, memory loss, dizziness, fainting, fatigue, depression,moodiness, nausea and skin rashes. A problem with multiple chemical sensitivity isthat the person with this illness finds it difficult to leave a safe space without chem-icals that they react to and to go to a workplace or any other building as they mayhave hypersensitivity reactions to the chemicals in the buildings and any productsthat are made from the chemicals that they are sensitive to. The American Academyof Environmental Medicine claims to have treated over 30,000 patients with multi-ple chemical sensitivity. Multiple chemical sensitivity is more likely to have affectedpeople who worked in new or refurbished buildings.
2.4 New and Refurbished Buildings
Building emissions concerns. This account is based on observations at the time of the inci-dent. There is much more information, documented evidence, e-mails and explanationsavailable on file about the incident that could be argued might change the views indicatedhere.
Late in the year part of a building was refurbished. The refurbishment included new furni-ture laminates, carpets and painting. Staff were moved into the newly refurbished area andalmost immediately started to complain of various health difficulties including (as writtenin an e-mail by a staff member in the area):
• Headaches/migraines over multiple days;• Itchy eyes;• Nose bleeds;

2 Theories and Knowledge About Sick Building Syndrome 39
• Running nose; and• Difficulty breathing – Pain in chest, wheezing, cough, blocked sinuses, heavy feeling
in your lungs.
Subsequent checks in the building did detect some odours that could have been the causeof the staff health complaints. An occupational Hygienist was engaged to look into theconcerns of the staff. Air monitoring was carried out to measure for Volatile OrganicCompounds (VOC’s) including formaldehyde, a known by product of the manufacturingprocess of chipboards and foam furniture. The results of the air monitoring did not find anyhigh levels of any VOC’s including formaldehyde.
Advice from the hygienist was that “off gassing”∗∗ of the materials and glues that make upsome types of new chipboard can produce low level emissions. If the timeframe betweenmanufacture and delivery is short, emissions from the manufacturing process could stillbe occurring. If furniture is then left in an un-ventilated area, the emissions could buildup to a point where the smell could be sufficient to effect individuals depending on theirsusceptibility and tolerance of those emissions.
Other observations by the Hygienist were that the air conditioning intake and out take ventsin this location of the building were positioned so close together that fresh air was beingimmediately removed from the building without first circulating through the building.In conclusion:
• Generally speaking the conclusions of the investigation were that due to the use ofglues to stick laminates and carpet/vinyl, newly painted surfaces, foams that had beenused to manufacture new chairs and fresh air circulation in this part of the building,that the building following the refurbishment did have a strong smell, something thatcould be described as a “new building smell”.
• A chip board that had been used to manufacture office furniture and the “off gassing”of new chairs were identified as the two main sources of the odours that wereapparent in this part of the building.
• There is evidence that some staff in the area did suffer from the ailments that theyclaimed they were suffering from.
• One person’s tolerance to emissions and vapours may differ from another so for thosepeople the odours in the building may have been enough to set off the health effectsthat they experienced.
• There was some allegation that the staff in the area did not want to move into thebuilding and that the claims that were being made were exaggerated.
• Air monitoring did not detect high levels of any VOC’s.
The staff in the area were moved out of the building, the building air conditioning wasturned up to 100%, doors and drawers were left open and the building odours were reducedto such an extent that staff returned to work in the building approx 2 weeks later.
∗∗“Off gassing” is a term to describe the process that when foam and chipboard is man-ufactured, the glues and processes that are used continue to release odours for some timeafter their manufacture. (Malcolm)
This Occupational Safety Professional’s story explains some of the effects that
building products can have on the health of building occupants. There were two
main causes of employees experiencing these health effects. The first cause was
that many of the building’s new furniture and fittings produced air borne chemi-
cals that contaminated the atmosphere. Brinke et al. (1998) identified that often the

40 J. Jansz
fumes from volatile organic compounds (VOCs) in a building, when measured withhygiene monitoring equipment, are below the threshold level that is supposed tocause health effects when each VOC is measured individually. This is what wasreported in the above case study. When Brinke et al. (1998) conducted research in22 office areas in 12 buildings these researchers identified that the combined effectof 39 VOCs when measured together produced irritant symptoms and other sickbuilding syndrome symptoms in the building occupants that each substance on itsown did not when present in the building at low levels. The combination of VOCstogether produced a synergistic effect that caused the symptoms of sick buildingsyndrome in the building occupants. This seems to be a similar situation to whatrespondents report in this case study.
A second problem in this case study was that the building ventilation was inade-quate as the intake and outlet vent for the building’s air conditioner were located so
close together that air that as air entered the building it was immediately sucked out
without circulating throughout the building. For the building odours to disperse the
building doors had to be left open for 2 weeks as the windows did not open and the
air conditioner was ineffective in dispersing the chemical pollutants.
2.5 Chemical, Gas and Fibre Pollutants
In the 1980s new buildings in Australia started to have chip board, and then particle
board, used as a building material instead of real wood. The fibres in chip board are
held together by formaldehyde. Out gassing of this formaldehyde occurs for months
after manufacture. Formaldehyde is one of the most common indoor air pollutants.
Roy (2010) records that common indoor contaminants that can cause sick build-
ing syndrome include volatile organic compounds (VOCs) including formaldehyde
from building furnishings, coatings and adhesives, building materials and equip-
ment and airborne particulates that include dust and synthetic mineral fibres (SMF)
– fibreglass, asbestos, etc.
The Property Council of Australia (2009) identified the indoor air pollution
shown in Table 2.2 as causes of sick building syndrome symptoms.
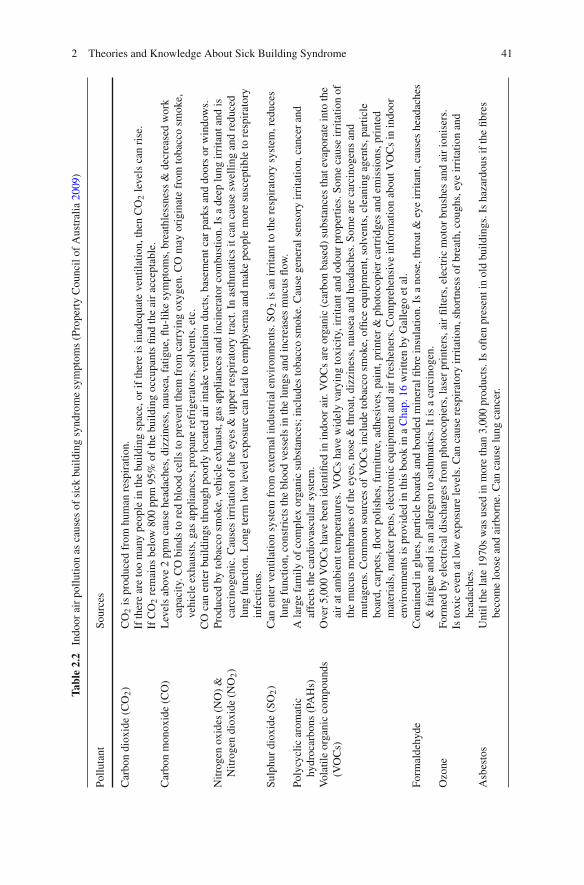
2 Theories and Knowledge About Sick Building Syndrome 41
Tab
le2.2
Indo
orai
rpo
llut
ion
asca
uses
ofsi
ckbu
ildi
ngsy
ndro
me
sym
ptom
s(P
rope
rty
Cou
ncil
ofA
ustr
alia
2009
)
Pol
luta
ntS
ourc
es
Car
bon
diox
ide
(CO
2)
CO
2is
prod
uced
from
hum
anre
spir
atio
n.If
ther
ear
eto
om
any
peop
lein
the
buil
ding
spac
e,or
ifth
ere
isin
adeq
uate
vent
ilat
ion,
then
CO
2le
vels
can
rise
.If
CO
2re
mai
nsbe
low
800
ppm
95%
ofth
ebu
ildi
ngoc
cupa
nts
find
the
air
acce
ptab
le.
Car
bon
mon
oxid
e(C
O)
Lev
els
abov
e2
ppm
caus
ehe
adac
hes,
dizz
ines
s,na
usea
,fat
igue
,flu-
like
sym
ptom
s,br
eath
less
ness
&de
crea
sed
wor
kca
paci
ty.C
Obi
nds
tore
dbl
ood
cell
sto
prev
ent
them
from
carr
ying
oxyg
en.C
Om
ayor
igin
ate
from
toba
cco
smok
e,ve
hicl
eex
haus
ts,g
asap
plia
nces
,pro
pane
refr
iger
ator
s,so
lven
ts,e
tc.
CO
can
ente
rbu
ildi
ngs
thro
ugh
poor
lylo
cate
dai
rin
take
vent
ilat
ion
duct
s,ba
sem
ent
car
park
san
ddo
ors
orw
indo
ws.
Nit
roge
nox
ides
(NO
)&
Nit
roge
ndi
oxid
e(N
O2)
Pro
duce
dby
toba
cco
smok
e,ve
hicl
eex
haus
t,ga
sap
plia
nces
and
inci
nera
tor
com
bust
ion.
Isa
deep
lung
irri
tant
and
isca
rcin
ogen
ic.C
ause
sir
rita
tion
ofth
eey
es&
uppe
rre
spir
ator
ytr
act.
Inas
thm
atic
sit
can
caus
esw
elli
ngan
dre
duce
dlu
ngfu
ncti
on.L
ong
term
low
leve
lex
posu
reca
nle
adto
emph
ysem
aan
dm
ake
peop
lem
ore
susc
epti
ble
tore
spir
ator
yin
fect
ions
.S
ulph
urdi
oxid
e(S
O2)
Can
ente
rve
ntil
atio
nsy
stem
from
exte
rnal
indu
stri
alen
viro
nmen
ts.S
O2
isan
irri
tant
toth
ere
spir
ator
ysy
stem
,red
uces
lung
func
tion
,con
stri
cts
the
bloo
dve
ssel
sin
the
lung
san
din
crea
ses
muc
usfl
ow.
Pol
ycyc
lic
arom
atic
hydr
ocar
bons
(PA
Hs)
Ala
rge
fam
ily
ofco
mpl
exor
gani
csu
bsta
nces
;in
clud
esto
bacc
osm
oke.
Cau
sege
nera
lse
nsor
yir
rita
tion
,can
cer
and
affe
cts
the
card
iova
scul
arsy
stem
.V
olat
ile
orga
nic
com
poun
ds(V
OC
s)O
ver
5,00
0V
OC
sha
vebe
enid
enti
fied
inin
door
air.
VO
Cs
are
orga
nic
(car
bon
base
d)su
bsta
nces
that
evap
orat
ein
toth
eai
rat
ambi
ent
tem
pera
ture
s.V
OC
sha
vew
idel
yva
ryin
gto
xici
ty,i
rrit
ant
and
odou
rpr
oper
ties
.Som
eca
use
irri
tati
onof
the
muc
usm
embr
anes
ofth
eey
es,n
ose
&th
roat
,diz
zine
ss,n
ause
aan
dhe
adac
hes.
Som
ear
eca
rcin
ogen
san
dm
utag
ens.
Com
mon
sour
ces
ofV
OC
sin
clud
eto
bacc
osm
oke,
offi
ceeq
uipm
ent,
solv
ents
,cle
anin
gag
ents
,par
ticl
ebo
ard,
carp
ets,
floo
rpo
lish
es,f
urni
ture
,adh
esiv
es,p
aint
,pri
nter
&ph
otoc
opie
rca
rtri
dges
and
emis
sion
s,pr
inte
dm
ater
ials
,mar
ker
pens
,ele
ctro
nic
equi
pmen
tan
dai
rfr
eshe
ners
.Com
preh
ensi
vein
form
atio
nab
out
VO
Cs
inin
door
envi
ronm
ents
ispr
ovid
edin
this
book
ina
Cha
p.16
wri
tten
byG
alle
goet
al.
For
mal
dehy
deC
onta
ined
ingl
ues,
part
icle
boar
dsan
dbo
nded
min
eral
fibr
ein
sula
tion
.Is
ano
se,t
hroa
t&
eye
irri
tant
,cau
ses
head
ache
s&
fati
gue
and
isan
alle
rgen
toas
thm
atic
s.It
isa
carc
inog
en.
Ozo
neF
orm
edby
elec
tric
aldi
scha
rges
from
phot
ocop
iers
,las
erpr
inte
rs,a
irfi
lter
s,el
ectr
icm
otor
brus
hes
and
air
ioni
sers
.Is
toxi
cev
enat
low
expo
sure
leve
ls.C
anca
use
resp
irat
ory
irri
tati
on,s
hort
ness
ofbr
eath
,cou
ghs,
eye
irri
tati
onan
dhe
adac
hes.
Asb
esto
sU
ntil
the
late
1970
sw
asus
edin
mor
eth
an3,
000
prod
ucts
.Is
ofte
npr
esen
tin
old
buil
ding
s.Is
haza
rdou
sif
the
fibr
esbe
com
elo
ose
and
airb
orne
.Can
caus
elu
ngca
ncer
.

42 J. Jansz
Tab
le2.2
(con
tinu
ed)
Pol
luta
ntS
ourc
es
Syn
thet
icfi
bres
Syn
thet
icm
iner
alfi
bres
incl
ude
fibr
egla
ss,s
lag
fibr
ein
sula
tion
,roc
k/m
iner
alw
ool
all
ofw
hich
can
beus
edas
buil
ding
insu
lati
on.T
here
are
othe
rsy
nthe
tic
fibr
esth
atca
nbe
foun
din
ceil
ing
tile
s.A
irbo
rne
fibr
esca
use
skin
irri
tati
on,e
yeir
rita
tion
and
aggr
avat
eas
thm
asy
mpt
oms.
Dus
tG
ener
aldu
st,c
onst
ruct
ion
dust
,pap
erdu
st,s
oil
part
icle
s.A
irbo
rne
dust
caus
esir
rita
tion
ofth
eth
roat
,lun
gsan
dey
es.
Pes
tici
des
&bi
ocid
esT
hese
are
used
inso
me
buil
ding
air
cond
itio
ning
syst
ems.
The
effe
cts
ofth
ese
chem
ical
sha
veno
tbe
enst
udie
din
rela
tion
tobe
ing
aca
use
ofsi
ckbu
ildi
ngsy
ndro
me
sym
ptom
s.O
dour
sO
dour
sdo
not
usua
lly
caus
ehe
alth
effe
cts
but
can
caus
edi
scom
fort
and
may
bea
sign
ofai
rbo
rne
cont
amin
ants
.C
omm
onbu
ildi
ngod
ours
can
incl
ude
off
gass
ing
from
buil
ding
mat
eria
lsan
dfu
rnis
hing
s,ch
emic
alcl
eani
ngre
sidu
esan
dm
ould
odou
rs.

2 Theories and Knowledge About Sick Building Syndrome 43
This is a brief summary of common indoor air pollutants that can affect air qual-ity. As well as being found in new buildings these indoor air pollutants can be foundin old buildings.
2.6 Old Buildings
I have a number of proven instances of sick building syndrome with police buildings. A clas-sic example is the situation at a Capital City Central Police Station and Watch House. Thisis a facility that was built in 1965 and has been in continuous 24× 7 use ever since. Thebuilding has concrete cancer. The faults in concrete pillars, walls and floors is caused by thereinforcing rusting through the plaster walls and a general break down of the concrete aggre-gate leaking through the plaster into toilets, change rooms and other areas where dampnessis present. The risks associated with health are undetermined regarding silica dust in theatmosphere. Mould spores and bacteria problems are clearly present in the following areas.
1. Spaces between concrete floors and metal ceiling panels. The panels have small holeswhere the dust debris is able to filter through into the internal areas of the building.
2. Door vents where there has been a gradual build up and blockage of the vents. Dustand bacteria is blown out by the air conditioning air flow.
3. Floor tiles that have asbestos content. Asbestos particles have become loose throughrubbing by ill fitting doors and are free to float around the atmosphere.
4. All areas where taps and sink drains have not been cleaned thoroughly, causingmould and bacteria to build up.
5. Build up of mould and bacteria in areas that have been very difficult to clean.
An extensive occupational hygienist report recorded numerous other associated health risks.The situation is not helped by the constant flow of customers who bring with them individualhealth problems that can spread throughout the complex via the air conditioning; it too is44 years old, or by lack of complete and thorough hygiene and cleaning practices, whichshould match those that exist in a hospitals, but fall well short. This is a particular problem inthe kitchen facilities that attract slack habits. Fresh air cannot be released into the building.Security considerations demand that the windows are barred and closed.
Another example is the older part of a suburban Police Station built in 1897 from construc-tion methods that did not include damp courses or cavity walls. The building, including theextensions built in 1980, has numerous sick building syndrome issues.
1. Mould spores are emitted through the plaster walls and ceilings in wet areas.2. Old fire doors have asbestos sheeting.3. Floor joists, floor boards, skirting boards and doors are constantly attacked by white
ants causing collapse.4. Lead paint is exposed to the environment.5. False ceiling spaces harbour all sorts of debris and mould that has dropped from the
original ceiling (Probably horse hair and fibrous) material. This is exposed to theatmosphere through ceiling vents and manholes.
6. The concrete extensions has an asbestos roof, currently unsealed and presenting dif-ficulties for sealing under the exposed eaves on the third floor. Movement betweenthe asbestos sheets can cause the fibres contained in the sheets to break free and floataround the atmosphere.

44 J. Jansz
Although there has been no official comparison research conducted, working in the affectedplaces exposes employees to increased health risks for general illness compared to workingin modern facilities that can cope with the hectic nature of contemporary 24×7 policing.(David)
These two stories, told by the same Occupational Safety Professional, highlightproblems with the police officers working in old buildings that can cause employ-ees to take sick leave related to experiencing sick building syndrome symptoms.The documented problems in these two stories include police officers inhaling dustdebris, asbestos fibres, lead (in Australia both lead and mercury were used in paintprior to 1990 and both can be toxic to humans), mould and other micro organisms.
2.7 Biological Hazards
There are biological contaminants in many buildings. Biological contaminants caninclude bacteria, fungi and animal products. Air Conditioning and Indoor AirQuality (2006, p. 2) reports that “there are over 200,000 species of fungi andmicrobes known, of which approximately 60–100 are a cause of concern in the
indoor environment.” A common contaminant that causes sick building syndrome
is mould. Excess humidity with poor ventilation in a building allows mould to grow.
The presence of mould is usually associated with water leakage, condensation or a
relative humidity in the building of above 70%.
My sick building story involves a former home in Midland. The house was built aroundFederation (1900). I moved in and noted that the walls were continually damp, so Iresearched methods that would be cost effective to combat rising damp. I chose reverseosmosis, not knowing the residual health problems this would cause me. For months I hada terrible cough, so bad in fact that on one occasion the cough was so severe I knockedmy head on the floor and I was out cold. I recall the ambulance drivers taking me to SwanDistricts Hospital. On my return home I decided to investigate what was going on (by nowI had been referred to a specialist at Royal Perth Hospital.) I lifted the skirting boards and itwas infested with mould. You could actually see the spores in the air. I was so sick. I put thehouse on the market and moved out straight away. I recovered within days of leaving theplace. There is no doubt that this house was sick and made me very unwell. It still standstoday, however it is now used as a psychologist’s suite. (Jeremy)
This story, provided by an Occupational Safety Professional, illustrates the health
effects that can occur from having mould in a building. This private home would
have required extensive renovations to make it safe and healthy to be used as a
workplace for a group of psychologist to see and treat patients in the building rooms.
When investigating causes of sick building syndrome in Western Australia Peter
Roy (2010, p. 2) identified that a common cause of sick building syndrome in the
buildings that he investigated was poor ventilation and mould in the buildings. He
provided the following three stories to illustrate these causes.
Pilbara – two Australian energy companies managing large holdings of housing and accom-modation units had significant problems with widespread and reoccurring mould growththat contributed to adverse health risks for workers and their families. Although muchtime and effort had been spent on mould remediation, the major root cause of mould

2 Theories and Knowledge About Sick Building Syndrome 45
growth – inadequately designed HVAC equipment – had not been identified or adequatelyaddressed.
South Western Australia – a Public Primary School had wide spread worker com-plaints and one severely affected staff member in newly refurbished offices. The inves-tigation uncovered problems with lack of effective ventilation, reoccurring moistureleakage and condensation, and presence of an apparently toxigenic form of the mouldFusarium sp.
Perth – a large religious organisation had problems with wide staff complaints linkedto deficiencies in building ventilation systems (split units) and poor humidity control.Localised moisture infiltration also lead to mould growth in one area of the facil-ity. Corrective actions included mould remediation, interim humidity control measures,building modifications to masonry walls and planned installation of modified HVACsystems.
In these three stories by Roy (2010) it is clear that having inadequate ventilation
and excessive moisture can lead to mould growth in buildings. It is also clear that
building occupants can have allergic reactions to mould toxins.
The Property Council of Australia (2009) divides biological building pollutants
into those that are living and those that are non living. Living biological pollutants
are viruses, bacteria, moulds and other fungi. These are capable of causing infec-
tions. Viruses are usually introduced into the building by humans, but the stability,
concentration and distribution of the viruses may be influenced by the building’s
ventilation rate and relative humidity level. Bacteria and fungi become established
and proliferate in humid conditions and on wet surfaces, particularly if there is dust
present or if the building has been water damaged. Components of the air condition-
ing system, particularly if poorly designed or maintained, may be a site of bacterial,
fungal or protozoan growth and may spread these micro organisms throughout the
building atmosphere. People can have allergic reactions to micro organism myco-
toxins, endotoxins or antigens (Shoemaker and House 2005). Protozoans and dust
mites can be present in building air and these usually cause allergic conditions such
as asthma. There are two chapters in this book, one by Pinzari (Chap. 9, this volume)
and the other by Pinzari and Montanari (Chap. 11, this volume) that provide further
detail about biological hazards, particularly mould, that can grow in buildings and
cause sick building syndrome.
Bholah and Subratty (2002) conducted research in 23 buildings with offices in
Mauritius to identify if there was any relationship between bio-contaminants in
these buildings and the incidences of sick building syndrome symptoms. These
researchers collected viable colonies of micro organisms from the researched build-
ings using a Casella slit sampler and gave a self report health questionnaire to the
occupants of these buildings. The researchers identified that there was a strong asso-
ciation between offices that had moderate to heavy microbial contamination and
the symptoms of sick building syndrome as the occupants of these offices experi-
enced headaches, excessive mental fatigue, loss of concentration and forgetfulness,
particularly if there was high fungal spore counts in the building atmosphere.
Cooley et al. (1998) conducted a 22 months research study in 48 schools in the
United States of America in which there were complaints of sick building syndrome

46 J. Jansz
symptoms by the building occupants. The indoor air quality of these buildings wastested. In all cases it was identified that the cause of the occupants experiencingthe symptoms of sick building syndrome were either fungal contamination withStachybotrys species or Penicillium species of mould. In all cases it was determinedthat the initial microbial growth commenced after a water leak occurred and wettedthe building materials. Following this the HVAC system had become contaminatedwith the microbial growth. Based on the findings of this research it was determinedin these 48 schools the cause of sick building syndrome symptoms in the buildingoccupants was due to the Stachybotrys or Penicillium species of mould. Remedialaction was under taken to remove the mould in these schools building materials andair conditioning systems.
Non living biological pollutants can also cause sick building syndrome symp-toms as they are associated with allergic conditions in susceptible people. Thesepollutants can originate from both inside and outside the building. If the outdoor airfiltration system is inadequate or damaged then outside air contaminants, such aspollen, can enter the building. Inside the building dead skin cells, animal excreta,insect body parts (such as parts of a dead cockroach that are an allergen for somepeople) and dander may be circulated, particularly where the filtration of recycledair is inadequate. These factors do not just affect old buildings they can affect theoccupants of all buildings.
2.8 All Buildings
2.8.1 Introduction
In all buildings the indoor building environment is affected by the air quality, light-ing, building windows, acoustic comfort, radiation, layout of the building rooms andequipment and by ergonomic factors. Indoor air quality is important to the occupantsof all buildings. Hedge et al. (1995), when analysing health survey results from4,479 respondents from 27 air conditioned office buildings, reported that claimsof sick building syndrome symptoms increased when employees perceived that theindoor air quality was poor. Indoor air quality is affected by the environmental fac-tors of temperature, humidity, amount of carbon dioxide in the air, air contaminants,air circulation and the ratio of outdoor air to recirculated air. All of these can affectthe building occupants’ health, comfort and productivity. For all indoor areas hav-
ing adequate ventilation is important in preventing the occurrence of sick building
syndrome symptoms.
2.8.2 Ventilation
An experienced medical practitioner commenced work in a new building. This building had4 air conditioners. Each air conditioner was used for a group of rooms. A problem with thissharing arrangement was that some rooms were too hot for the occupants while other rooms

2 Theories and Knowledge About Sick Building Syndrome 47
were too cold. The medical practitioner’s room shared that air conditioning with the patientwaiting room. Some of the people came to see the medical practitioner because they hadrespiratory infections. While sharing the same air conditioner as the patients the medicalpractitioner constantly had viral infections. As a risk control measure this medical practi-tioner first blocked the air conditioner with cardboard. His health improved immediately.He then organised for his room to have a sky light and a separate air conditioner. He hashad good health ever since. (Andrew)
This story, provided by a Medical Practitioner, illustrates problems that can occur
when a ventilation system is shared in a building and micro organisms are recir-
culated throughout the building by the air conditioning system. It also highlights
that not all building occupants are comfortable working in the same indoor air
temperature.
Roy (2010) provided two stories about the effects of having inadequate
ventilation in a building. His first story, which was reported in the Lewiston
Morning Tribune, concerned the students and teachers at Pomeroy High School
in Washington where 12 of the 21 staff members reported experiencing sore eyes,
dry throats, coughing and other symptoms of sick building syndrome. An investiga-
tion determined that the school’s ventilation system was not operating properly and
that this was the cause of the building occupants’ symptoms. The second incident,
which was documented in the Boston Globe Newspaper, occurred at the University
of Massachusetts in Boston. In two incidents at this University that occurred a few
days apart first 8 people, then 27 people, from this university were treated for burn-
ing lips, nausea and tight throats. The Boston Health Department closed the entire
campus so that indoor air quality investigations could be conducted. The prob-
lem was identified as buildings in this University having an inadequate ventilation
system.
From these stories it can be seen that having adequate ventilation in a building
is important. Roy (2010) states that in the United States of America between 1978
and 2005, when NIOSH investigated the causes of sick building syndrome in more
than 700 problem buildings, in 53% of the cases the root cause, or the contributing
root cause, was inadequate ventilation in the building. For best practice Roy (2010)
recommends that the fresh air ventilation flow rate should be 15 litres per second
(lps) per person for an office or for other building rooms that are occupied by people
who are performing work tasks.
In Australia, New Zealand, the United Kingdom and the USA the minimum
acceptable air flow rate is 10 litres of fresh air per second (lps) per person for
each person working in an office. Research by Roy (2010) identified buildings with
higher than the minimum fresh air ventilation rates have lower employee absen-
teeism and fewer complaints of employees experiencing adverse health effects while
working in the building. For each increase of 0.5 lps/person in fresh air employee
absenteeism was decreased by up to 2%. It was found that there was a decrease in
sick building syndrome symptoms of 33% when the ventilation rate was increased
from 8.5 to 25 lps/person. Conversely, when the fresh air flow rate was decreased
from 8.5 to 5 lps/person there was a 15% increase in employee reports of sick
building syndrome symptoms.
48 J. Jansz
Roy (2010) reported that research work conducted by Seppanen (2006) demon-strated that with a ventilation rate of 15 lps/person workers performance in typing,maths problem solving and in proof reading was much higher than when this workwas performed with the minimum ventilation air flow rate, but a flow rate of above17 lps/person made little additional improvements in employees’ work productivity.
This knowledge is important to have when designing building ventilation systems
and when maintaining ventilation systems.
Roy (2010, p. 9) had been told by some employers that “More fresh air and
greater capacity HVAC systems are just too expensive to operate!” His answer
to this was that employee salary, staff turnover costs, recruitment and retraining
costs are much higher than the cost of having adequate ventilation in a building.
Roy’s calculations demonstrated to employers that staff costs are 100 times the total
building energy costs to provide adequate ventilation. He demonstrated that even
a 1% increase in employee productivity would offset a 50% increase in building
energy costs. Dingle (2010) supported Roy’s comments and provided the following
information. On average employees’ salaries are $100–$200 per ft2 of a building.
Energy costs are $1–$2 per ft2 of a building. For increasing employee productivity
and comfort, as well as having adequate ventilation, it is important to also consider
the building’s indoor air temperature and humidity as complaints of being either
too hot or too cold can be associated with mucosal irritation, headaches and fatigue
(Hodgson 2002).
2.8.3 Thermal Comfort and Humidity
The most comfortable temperature inside a building is between 20 and 23 degrees
Centigrade (C) in winter and 20–25C in summer with relative humidity of
40–60%. An indoor building temperature above 25C can cause headaches and
fatigue while indoor temperature below 18C is likely to cause chills and influenza
like symptoms. In Australia the building temperature of an air conditioned build-
ing is usually set at 22C. Indoor air comfort can also be affected by radiant heat
from the sun coming through windows on the west or north side of the building
in the afternoon. Comfort of building occupants is also subjective as some people
like a warmer room temperature while others prefer the temperature to be cooler.
Individuals have different metabolic rates; some people are over-weight and some
are under-weight, some employees are very active performing physically demanding
work while other employees perform sedentary work, but in many air conditioned
public buildings all people are subjected to the same building temperature. The
higher the humidity in the building air the warmer the air feels.
Humidity is the amount of water in the air. The humidity ratio in the air is the
mass of water in each kg of dry air. Relative humidity is “the percentage of water
vapour in a gaseous mix of air and water vapour, compared to the vapour pressure
of water within the mix when saturated at the same temperature” (The Property
Council of Australia 2009, p. 17). At 20% relative humidity the air would readily
take up water. It would be considered dry air. At 50% relative humidity the air would

2 Theories and Knowledge About Sick Building Syndrome 49
hold about half as much water vapour as it can hold. At 100% relative humidity theair could no longer absorb any more water vapour as it would be saturated and theair would feel heavy and oppressive. Indoor building air humidity outside the rangeof 35–65% can cause adverse health effects.
The Property Council of Australia (2009, p. 18) identifies that excess indoor air
humidity can cause the following problems.
• Fatigue, reports of “stuffiness”, headaches and dizziness (particularly when
relative humidity exceeds 80% and temperatures are also high);
• Favourable conditions for the growth of micro-organisms, especially when
condensation is present; and
• Increased rate of “off-gassing” from building materials, especially in the case of
formaldehyde and other volatile organic compounds.
The following problems may occur where humidity levels are too low:
• Dryness of the eyes, nose and throat;
• Increased frequency of static electricity shocks;
• Increased rates of ozone formation;
• Stabilisation of certain viruses, such as influenza; and
• Allergic responses by asthmatics.
As can be seen from these two lists building humidity can very much affect the
health of the building occupants. For most of these environmental effects, once
the person leaves the building, they should no longer be affected by the build-
ing humidity and their ill health symptoms should resolve. Building occupants are
also affected by noise (acoustic comfort) in the building. The health effects due to
building noise may also resolve when the person leaves the building.
2.8.4 Acoustic Comfort
When building occupants have individual offices or work areas that are enclosed and
sound proof the noise that occurs in a normal building is not a problem. However,
particularly in open plan offices and reception areas with telephones ringing and
with increasing volume of people and the conversations that these people hold, noise
(unwanted sound) can become difficult and even irritating to people who are trying
to think and concentrate on completing their own work. Too much distracting noise
interferes with short term memory processes, can cause headaches and even person-
ality changes as the building occupant becomes increasingly frustrated and irritated
with their inability to concentrate.
In a research study by Niven et al. (2000), the researchers conducted signif-
icant environmental monitoring, that included building air monitoring and noise
monitoring in 5 different buildings. These researchers gave a self report health ques-
tionnaire to the occupants of these buildings. Completed questionnaire responses

50 J. Jansz
were received from 1,131 people. Analysis of these questionnaire responses identi-fied that that low frequency noise in these buildings was a significant cause of sickbuilding syndrome symptoms. As well as noise levels lighting levels can affect thehealth of building occupants.
2.8.5 Lighting
Where ever possible there should be natural lighting in a building as this improvesoccupants’ comfort and health while reducing energy costs. Due to the design of
some buildings natural lighting alone is insufficient for work tasks to be performed
effectively so artificial lighting is also required, particularly if the building is to be
used outside of day light hours. When considering building indoor lighting there are
two Australian Standards that should be followed. The first is AS/NZS 1680:2006
Interior lighting, Part 1: General principles and recommendations. The other is
AS/NZS 1680.2.2:2008 Interior and workplace lighting – Specific applications –
Office and screen-based tasks. Both of these Standards provide appropriate recom-
mendations on the illuminances required for various types of work tasks, activities
and building interiors. Passarelli (2009) identified that a significant lack of natural
day light, flickering mechanical lights or lights that are too bright or too dull for the
work that needs to be performed can contribute to causing sick building syndrome
symptoms.
According to the Property Council of Australia (2009, p. 24) common problems
that can occur with artificial lighting can include the following:
• inadequate lighting design or intensity leading to widespread or localised dark
areas;
• inappropriate lighting for specialised tasks;
• flicker arising from the oscillation of fluorescent lights typically associated with
using magnetic rather than electronic ballasts;
• the colour of the lamp source;
• poor configuration of lights; and
• unsympathetic colour schemes can contribute to lighting discomfort.
Inadequate lighting can cause headaches, eye strain and other symptoms of sick
building syndrome. Most of the health effects due to poor lighting should cease
when the person leaves the building, but continued eye strain may contribute to long
term vision problems More details about how lighting can affect the occurrences
of sick building syndrome symptoms occurring in building occupants and ways to
prevent this occurring are included in the chapter in this book written by Abdul-
Wahab and Ahmed (2011) titled “Improvement of the illumination levels combined
with energy savings for a residential building.”
When looking at the occurrence of sick building syndrome symptoms and build-
ing related illnesses a group of people that the Property Council of Australia (2009)

2 Theories and Knowledge About Sick Building Syndrome 51
recommends considering are the building maintenance workers. The following storywas supplied by a building maintenance worker when asked if he had a story aboutsick building syndrome.
2.9 Building Maintenance
I have worked in a major metropolitan hospital in Australia as the maintenance fitter withresponsibilities for the general upkeep and maintenance of the HVAC air conditioning sys-tem. I can say with certainty these systems don’t get better with age. The upkeep/serviceand maintenance to wearing equipment for an ever growing system that must function effi-ciently on a tight streamline budget have consequence. I will cite a couple of examples Iexperienced at the hospital.The hospital was built in the 1980s. The four chillers (one large and three small) operatein sequence as the need arises, that is to say the large Chiller due to its capacity to coola greater volume of water and push it out and around the hospital plus the nursing homeis the main operating system and functions alone, on its own. They are expensive to run,more so during start and warm up prior to going into service, The second chiller is basicallythere to “take up slack” and supplement the larger to supply additional cooling water tothe system when the core temperature of the hospital rises. This is most noticeable in thewarmer months. When the desired temperature of 23C is achieved the second chiller dropsout. For this second chiller to start up and drop out many times during the day is costprohibitive. The three smaller chillers are all electronically attached to the larger and arecontrolled automatically.
Power consumption in the hospital runs into tens of thousands of dollars per month and asa cost saving measure the three smaller chillers are removed from the system, placed intomanual mode to remain in the off position. During the cooler months this is not problematicto the extent that it requires constant vigilance and is left to the monitoring system.
The hospital expanded and renovation work was undertaken in its second decade of opera-tion increasing the patient capacity from approximately 180 to 260 beds in addition to theprivate practice located north of the building and a significant user of the ventilation system.The problem is the existing large chiller was not upgraded to cope with the extra work loadand went from 70% running capacity to nearly 90% and for a machine that is being pushedto its limit.
In the warm months as soon as the outside temperature reached 25C it became problematicin that the system was unable to keep with demand. This is due to the new larger areasdrawing more cooling water at a faster rate, the cooling chiller unable to produce any morefluid into the system, therefore the rate of flow to area’s further away have a slower rate(trickle) of water insufficient to fill the coolers and in some instance not at all.
An example of this is one of the operating theatres that was used by Dr X has the coolingsystem at the end of two larger theatres and when the draw on the system occurred therewas no water left in the system for his operating theatre. In a normal situation his theatretemperature is steady at 18C with the air taken directly from outside, filtered and cooled.On a hot day when a draw occurs and zero water flows through the cooler the temperaturecan rise equivalent to the outside and on occasion it was 36–40 degrees Centigrade and thetemperature rose inside of ten seconds while the doctor was in the middle of a procedure.I know of two occasions where the doctor moved out of the theatre and into another furtherdown the hall that was on a different cooling line while the patient was still on the table.
As areas become cooler the system draws less cold water and the flow to the hot areas slowlyreturns. The time period for this is usually between 30 minutes and 1.5 hours. The quick
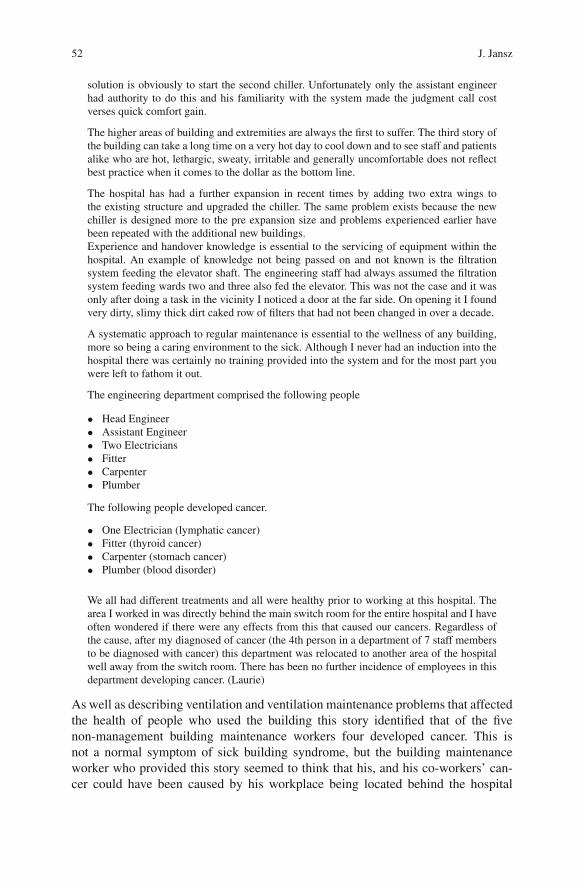
52 J. Jansz
solution is obviously to start the second chiller. Unfortunately only the assistant engineerhad authority to do this and his familiarity with the system made the judgment call costverses quick comfort gain.
The higher areas of building and extremities are always the first to suffer. The third story ofthe building can take a long time on a very hot day to cool down and to see staff and patientsalike who are hot, lethargic, sweaty, irritable and generally uncomfortable does not reflectbest practice when it comes to the dollar as the bottom line.
The hospital has had a further expansion in recent times by adding two extra wings tothe existing structure and upgraded the chiller. The same problem exists because the newchiller is designed more to the pre expansion size and problems experienced earlier havebeen repeated with the additional new buildings.Experience and handover knowledge is essential to the servicing of equipment within thehospital. An example of knowledge not being passed on and not known is the filtrationsystem feeding the elevator shaft. The engineering staff had always assumed the filtrationsystem feeding wards two and three also fed the elevator. This was not the case and it wasonly after doing a task in the vicinity I noticed a door at the far side. On opening it I foundvery dirty, slimy thick dirt caked row of filters that had not been changed in over a decade.
A systematic approach to regular maintenance is essential to the wellness of any building,more so being a caring environment to the sick. Although I never had an induction into thehospital there was certainly no training provided into the system and for the most part youwere left to fathom it out.
The engineering department comprised the following people
• Head Engineer• Assistant Engineer• Two Electricians• Fitter• Carpenter• Plumber
The following people developed cancer.
• One Electrician (lymphatic cancer)• Fitter (thyroid cancer)• Carpenter (stomach cancer)• Plumber (blood disorder)
We all had different treatments and all were healthy prior to working at this hospital. Thearea I worked in was directly behind the main switch room for the entire hospital and I haveoften wondered if there were any effects from this that caused our cancers. Regardless ofthe cause, after my diagnosed of cancer (the 4th person in a department of 7 staff membersto be diagnosed with cancer) this department was relocated to another area of the hospitalwell away from the switch room. There has been no further incidence of employees in thisdepartment developing cancer. (Laurie)
As well as describing ventilation and ventilation maintenance problems that affectedthe health of people who used the building this story identified that of the fivenon-management building maintenance workers four developed cancer. This isnot a normal symptom of sick building syndrome, but the building maintenanceworker who provided this story seemed to think that his, and his co-workers’ can-
cer could have been caused by his workplace being located behind the hospital

2 Theories and Knowledge About Sick Building Syndrome 53
switchboard which may have been responsible for electromagnetic radiation fromthe communication equipment entering the maintenance workshop. Even low levelsof electromagnetic radiation, when employees are exposed to these on an ongoingbasis, have been known to cause cancer (The Property Council of Australia 2009).It is important to note that once the maintenance workshop was relocated away frombehind the hospital switchboard there were no more cases of cancer that developedin these maintenance workers.
Another cause that has been considered as causing sick building syndromesymptoms in building occupants is office work.
2.10 Office Work
Office workers have been the most researched occupational group in relations to theoccurrence of sick building syndrome symptoms. Office workers spend most of theirworking hours in an enclosed building so are very much affected by the indoor airquality and other factors inside their building. Office workers can be affected by theequipment and products that they use as part of their work. This section describessome of these factors that have been documented in research study findings to causesymptoms of sick building syndrome in office workers.
Godish (1995) identified that carbonless copy paper contains many chemi-cal including hydrogen terphenyls, aliphatic hydrocarbons, diaryl ethanes, alkylnapthalenes, chlorinated parapffins and alkyl benzenes. Colour developers for pho-tocopy paper contain phenolic resins, salts of aromatic carboxylic acids, phenolicresins and many other chemical compounds. In research studies, Godish (1995,p. 95) identified that office workers who handled a large number of papers reportedthe following symptoms of ill health that they perceived were related to their work.“Itchy rashes on the hands, swollen eyelids, headaches, burning throat and tongue,fatigue, excessive thirst, burning sensation on the face and forehead, backache, nau-sea, eye irritation, sore and dry burning lips, facial rash and dry throat.” It wasbelieved that the rupture of the capsules on the paper containing the colour formingchemicals and the solvents used in the paper were the causes of these health effects.The office employees reported that their ill health effects occurred 2–3 h after com-
mencing work and resolved at night and over the weekends when they were not
working in their office.
Hedge et al. (1995) in a research study that included the occupants of 27
buildings, identified employees who used their computers full time reported more
symptoms of sick building syndrome than employees who used computers occa-
sionally or not at all. These researchers theorised that this might be because
the electrostatic field generated by the VDT screen attracted more particulate
contaminants into employees’ breathing zone.
Other office equipment that was identified as causing the symptoms of sick build-
ing syndrome in office workers by Godish (1995) included photocopy machines
whose toner emits VOCs, electrostatic photocopy machines that omit ozone and

54 J. Jansz
laser printers that can produce elevated levels of Freon and Acetone in the breathingzone of the operator. Another cause that has been considered for sick building syn-drome in office workers is psychosocial factors as traditionally office workers havehad poor control over their work tasks and work environment.
2.11 Psychosocial Factors
Roy (2010), when investigating cases of sick building syndrome only foundpsychosocial factors present when there had been long standing indoor air qualityissues and the people in the workplace had not had their incidences of ill health, usu-ally due to the poor air quality in the building, dealt with effectively. Greer (2007)agrees with these findings stating that her review of published literature identifiedthat psychosocial factors were a symptom of sick building syndrome, not the cause,with the effects of exposure to some toxins causing anxiety, changes in mood and inbehaviour due to ill health being experienced by the building occupants.
The Property Council of Australia (2009) identified that work related stress cancause people to become sick, but, this is not something that is in the control of thebuilding owner, unless the building owner is also the person’s employer.
In the case study under “New and Refurbished Buildings” the Safety Professional
wrote that There was some allegation that the staff in the area did not want to
move into the building and that the claims that were being made were exagger-
ated. This would be a psychosocial factor that could increase complaints about the
symptoms that these employees were experiencing as they were dissatisfied with
their new accommodation. When people are dissatisfied, or angry, they are more
likely to make complaints about factors that, if they were satisfied with their work
and workplace, they would have ignored.
Workplace Services (2000) agrees with this and documents that poor manage-
ment practices and other factors that cause employees to have low morale, while
not causing sick building syndrome symptoms, do affect the way that the symptoms
of sick building syndrome are perceived and affect the building occupants’ level of
tolerance of their ill health. Particularly important was the level of control that the
person could exert over their work and over their work environment and the response
of management staff to their ill health complaints.
Marmot et al. (2006) agreed with this as their research findings from the
Whitehall 2 study, which analysed the questionnaire results from 4,052 participants
from 44 buildings in which occupants of the building reported sick building syn-
drome symptoms, identified that respondents who had high work load demands,
low work related support, low control over their work and low control over their
work environment reported more symptoms of sick building syndrome than those
with control. The research study by Hedge et al. (1995) identified that employees
with low job satisfaction reported more symptoms of sick building syndrome than
employees with high job satisfaction.
A research study was conducted by Mendelson et al. (2000) in 5 hospitals in
Canada. Hospitals 2 and 5 were not defined by their Occupational Health and Safety

2 Theories and Knowledge About Sick Building Syndrome 55
Committee as being sick building sites. Hospitals 1, 3 and 4 were and these hos-pitals all had employees on long term sick leave with symptoms of sick buildingsyndrome. Hospital 3 had over 200 employees on extended sick leave with sickbuilding syndrome symptoms. In hospital 3 there had been problems with the airquality in the hospital building in that sulphuric acid, hydrochloric acid and sodiumhydroxide had entered the building through the air intakes causing adverse healtheffects in employees. Cleaning fluids used in this hospital contained phenol andformaldehyde. Exposure to these substances also affected employees’ health.
At these 5 hospitals 1,853 union members were surveyed in relation to factors
that affected their health when at work. It was found that symptoms of sick building
syndrome were more likely to be reported by employees who worked in an area in
which renovations had taken place in the last 2 years. There was also a positive rela-
tionship between employee work overload and reports of adverse health effects. This
was similar to the findings of Marmot et al. (2006). It was identified by Mendelson
et al. (2000) the less that the management staffs in the organisation were seen as
supportive of employees’ health concerns the more the employees were likely to
perceive that their adverse health effects were caused by their place of work. This
psychosocial effect was similar to that identified by Roy (2010).
Bachmann and Myers (1995) when analysing the results of an office workers’
health survey completed by 624 respondents from three buildings were unsure
if psychosocial factors caused the symptoms of sick building syndrome because
employees were dissatisfied with their work or workplace, or if the symptoms of
sick building syndrome, such as fatigue, caused psychosocial factors to occur. Both
causes seemed to produce psychosocial symptoms in their research findings.
The chapter in this book written by Kinman and Clements (2011) titled “The
role of demographic and psychosocial factors in predicting SBS symptoms in work-
places” provides a comprehensive description of psychosocial factors that have been
considered to contribute to the occurrence of sick building syndrome symptoms.
As well as psychosocial factors there are also personal factors that can cause sick
building syndrome.
2.12 Conclusions
This chapter has identified that people are individuals and can react differently to
different environmental conditions and airborne toxins, particularly if they have pre
existing asthma or another medical condition or if they are just sensitive to an indoor
pollutant. The most commonly reported symptoms of sick building syndrome are
related to skin irritation, eye irritation, respiratory symptoms, cognitive complaints,
nausea, lethargy and the symptoms of exposure to other environmental causes of ill
health. There are a wide variety of symptoms of sick building syndrome as a result
of there being a wide variety of causes for employees experiencing ill health when
in a building.
Factors that have been identified to cause sick building syndrome symptoms
include the environmental factors of temperature, humidity, adequate ventilation,

56 J. Jansz
acoustic comfort and lighting. The symptoms caused by these environmental fac-tors are usually relieved when the occupant leaves the building. Symptoms causedby building related chemical and biological hazards can cause either short-term orlong-term health effects that do not always resolve when the occupant leaves thebuilding.
The major impact of sick building syndrome on employees are often hiddenin increased incidences of sick leave and medical claims, lower productivity ofemployees and in increased employee turnover. Most people in the work force donot complain about their ill health. They just leave the company to find anotherorganisation to work for where they can have better health.
The legal implications of sick building syndrome for product manufacturers,product distributors, employers, insurance companies, real estate agents, contrac-tors, building architects and building owners have been considered. The followingchapters in this book provide research based information about sick building syn-drome that help to explain how to identify incidences of sick building syndrome,causes of sick building syndrome symptoms, the incidences of sick building syn-drome symptoms, ways to prevent further incidences of sick building syndrome andways to enhance people’s well being when they are occupants of a building.
Acknowledgements I would like to acknowledge the help of the following people who sharedtheir case study stories on what they called their experience of sick building syndrome symptomsfor analysis for Chap. 1, this chapter or for the last chapter of this book. Murray Cooper, AndrewDunn, Toni Ekert, Janelle Graham, Lee Hart, Robert Jones, Dave Lampard, Peter Rohan, LaurieSargent and Robert Winchester. In the stories included in these chapters the name of the personmay have been changed to protect the person or their employer.
References
Air Conditioning and Indoor Air Quality (2006, December) www.publicliability.net.au/.../AIR%20CONDITIONING%20&%20INDOOR%20AIR%20QUALITY.pdf. Accessed 1 July 2009
Bachmann M, Myers J (1995) Influences on sick building syndrome symptoms in three buildings.Soc Sci Med 40(2):245–251.
Bholah R, Subratty A (2002) Indoor biological contaminants and symptoms of sick buildingsyndrome in office buildings in Mauritius. Int J Environ Health Res 12:93–98.
Brinke J, Selvin S, Hodgson A, Fisk W, Mendell M, Koshland C, Daisey J (1998) Developmentof new volatile organic compound (VOC) exposure metrics and their relationship to “SickBuilding Syndrome” symptoms. Indoor Air 8:140–152.
Burge P (2004) Sick building syndrome. Occup Environ Med 61:185–190.Chester A, Levine P (1997) The natural history of concurrent Sick Building Syndrome and Chronic
Fatigue Syndrome. J Psychiatr Res 31(1):51–57.Chin J (Ed.) (2000) Control of Communicable Disease Manual. (17th ed.) American Public Health
Association, Washington, DC.Clayton Utz’s Property Issues (1996) Indoor air pollution – The potential for litigation. Australian
Construction Law Newsletter 50:24–26.Cooley J, Wong W, Jumper C, Straus D (1998) Correlation between the prevalence of certain fungi
and sick building syndrome. Occup Environ Med 55:579–584.Cullen M (2002) Low-level environmental exposures and multiple chemical sensitivity. Aust Natl
Saf J 10(1):3–9.
2 Theories and Knowledge About Sick Building Syndrome 57
Dingle P (2010) Managing indoor air quality. http://www.dingbird.com.au/factsheets/managing_IAQ.pdf. Accessed 25 May 2010
Environmental Illness Resource (2010, May 26) Sick Building Syndrome. http://www.ei-resource.org/illness-information/related-conditions/sick-building-syndr. Accessed 26 May 2010
Environmental Protection Agency (2010) Indoor Air Facts No. 4 (revised) Sick building syndrome.http://www.epa.gov/iaq/pubs/sbs.html. Accessed 3 June 2010
Evans P (2008) Innovative building materials and sick building syndrome: Liabilities of manufac-turers and importers of defective materials. Innovat Technol 10:37–46.
Finnegan M, Pickering C, Burge P (1984) The sick building syndrome: prevalence studies. Br Med
J 289:1573–1575.
Godish T (1995) Sick Buildings: Definition, Diagnosis and Mitigation. Lewis Publishers, Boca
Raton, FL.
Gomzi M, Bobic J (2009) Sick building syndrome. Do we live and work in unhealthy environment?
Period Biol 111(1):79–84.
Greer C (2007) Something in the air: A critical review of literature on the topic of sick building
syndrome. World Saf J 16(1):23–26.
Health and Safety Executive (1992) Sick Building Syndrome. Guidance for Specialist Inspectors.
file://J:\dev\operational\Ocs%20TPY(pdf)\300-339\oc311_2.htm. Accessed 18 Nov 2004
Hedge A, Erickson W, Rubin G (1995) Predicting sick building syndrome at the individual and
aggregate levels. Environ Int 22(1):3–19.
Hodgson M (2002) Indoor environmental exposures and symptoms. Environ Health Perspect
110(4):663–667.
Joshi S (2008) The sick building syndrome. Indian J Occup Environ Med 12(2):61–64.
Kipen H (2010) Sick building syndrome. http://www.answers.com/topic/sick-building-syndrome.
Accessed 3 June 2010
Kreiss K, Rom W, Markowitz S (Eds.) (2006) Environmental & Occupational Medicine. (4th ed.)
Lippincott Williams & Wilkins, Philadelphia, PA.
Marmot A, Eley J, Stafford S, Warwick E, Marmot M (2006) Building Health: An Epidemiological
Study of “Sick Building Syndrome” in the Whitehall 11 study. www.occenvmed.com. Accessed
3 June 2010
Mendelson M, Catano V, Kelloway K (2000) The role of stress and social support in sick building
syndrome. Work Stress 14(2):137–155.
Milica G (2009) Sick building syndrome. Do we live and work in unhealthy environment? Period
Biol 111(1):79–84.
Murphy M (2006) Sick Building Syndrome and the Problem of Uncertainty: Environmental
Politics, Techno-science, and Women Workers. Duke University Press, Durham, NC.
Nakazawa H, Ikeda H, Yamashita T, Hara I, Kumai Y, Endo G, Endo Y (2005) A case of sick
building syndrome in a Japanese office worker. Ind Health 43:341–345.
Niven R, Fletcher A, Pickering C, Faragher E, Potter I, Booth W, Jones T, Potter P (2000) Building
sickness syndrome in healthy and unhealthy buildings: An epidemiological and environmental
assessment with cluster analysis. Occup Environ Med 57:627–634.
Odle T (2010) Sick Building Syndrome. http://www.answers.com/topic/sick-building-syndrome.
Accessed 3 June 2010
Passarelli G (2009) Sick building syndrome: An overview to raise awareness. J Build Appraisal
5(1):55–66.
Pengilley P (1994) The legal implications of substandard air quality. Aust Construct Law
Newsletter 38:14–26.
Property Council of Australia (2009) Managing Indoor Environment Quality. Property Council of
Australia, Sydney, NSW.
Redlich C, Sparer J, Cullen M (1997) Sick building syndrome. The Lancet 349:1013–1016.
Roy P (2010) Sick? Sick, or Real Sick? Presented at the AIOH June Sundowner. Chemistry Centre.
Curtin University, Bentley, WA.

58 J. Jansz
Shoemaker R, House D (2005) A time-series study of sick building syndrome: chronic, bio-toxin-associated illness from exposure to water damaged buildings. Neurotoxicol Teratol 27:29–46.
Standards Australia (1989) AS3666-1989 Air-Handling & Water Systems of Buildings – MicrobialControl. Standards Australia, Homebush, NSW.
Standards Australia (1991) AS1668.2-1991 The Use of Mechanical Ventilation and Air-Conditioning in Buildings. Part 2: Mechanical Ventilation for Acceptable Indoor-Air Quality.Standards Australia, Homebush, NSW.
Standards Australia (2006) AS/NZS 1680:2006 Interior Lighting, Part 1: General Principles andRecommendations. Standards Australia, Homebush, NSW.
Standards Australia (2008) AS/NZS 1680.2.2:2008 Interior and Workplace Lighting – SpecificApplications – Office and Screen-Based Tasks. Standards Australia, Homebush, NSW.
Stenberg B (1989) Skin complaints in buildings with indoor climate problems. EnvironInt 15:81–84.
TSSA (2010) Sick building syndrome. http://www.tssa.org.uk/article-47.php3?id_article=1001.Accessed 26 May 2010
Thorn A (1998) The sick building syndrome: A diagnostic dilemma. Soc Sci Med47(9):1307–1312.
Tyler M (2007) Legal ramifications of sick building syndrome. Prop Manag 9(4):317–322.Unionsafe (2002) Sick building syndrome. http://unionsafe.labor.net.au/hazards/
104787226026344.html. Accessed 10 Nov 2009Unionsafe (2009) Sick building syndrome. http://unionsafe.labor.net.au/hazards/
104787226026344.html. Accessed 10 Nov 2009Workplace Services (2000) Safeguards. South Australian Government Department for
Administrative and Information Services, Adelaide, South Australia.World Health Organisation (1993) Indoor Air Pollutants: Exposure and Health Effects. WHO
Regional Office for Europe, Copenhagen.

Chapter 3
Indoor Air Quality
S. Müjdem Vural
3.1 Introduction
The most basic need of all humans is to lead a healthy life. Since people spent mostof their time indoors, indoor air quality plays an important role in forming a healthyenvironment.
Natural and artificial agents pollute the indoor air. These pollutants are particlesas well as gas and vapors. Gas and vapors include;
• combustion products (carbon monoxide, oxides of nitrogen, sulfur dioxide etc.),• volatile organic compounds (benzene, toluene, formaldehyde etc.), and• toxic natural gases (ozone, radon).
Particles include
• aerosols (asbestos, pollen, dust, ect.)• organisms (bacteria, fungi, virus).
Sources of these pollutants include outside environment of the building, usage ofthe building (user and user’s activities) and building products.
Pollutants from the sources given above may harm indoor air quality and this pol-luted air may cause biological and psychological health problems. Health problemsmay vary from headaches to cancer and from fatigue to high levels of stress.
All pollutants have different structures. Hence, adverse health effects they causeon humans and the necessary preventive measures also vary. Different pollutantscause different risks in different people (Spengler et al. 2000). The potential effectsof a given pollutant on humans constitute the risk. Risks caused by different pollu-tants occur differently depending on the biological and psychological condition of
S.M. Vural (B)Faculty of Architecture, Department of Architecture, Yildiz Technical University, 34349 Istanbul,Turkeye-mail: [email protected]
59S.A. Abdul-Wahab (ed.), Sick Building Syndrome,DOI 10.1007/978-3-642-17919-8_3, C© Springer-Verlag Berlin Heidelberg 2011

60 S.M. Vural
the user. The dose of the pollutant in the air as well as exposure times is amongstother factors that determine the severity of the health effect. Acceptable exposurelevels, sources and adverse health effects of indoor air pollutants must be knownfor determination and evaluation of risks. The human health risk assessment givenby a NRC (U.S. National Research Council 1983) report is used in risk studies ofindoor air quality. This human health risk assessment contains four steps; hazardidentification, dose-response assessment, exposure assessment and risk characteri-zation (Anderson and Albert 1999). To evaluate the indoor air quality of a building,these four steps are not sufficient. A more detailed risk analysis model must be con-structed by architects. Such a model the purpose of which is to identify potentialindoor air pollutants is deemed important because it can reduce the duration andcost during risk analyses.
In this chapter, first indoor air quality, indoor air pollutants, sources and healtheffects of indoor air pollutants, risk and risk analysis and then the relationshipbetween indoor air quality and risk analysis will be discussed. The steps of indoorair quality risk assessment especially the pre-assessment step suggested in the studytitled “Evaluation of an Indoor Air Quality Risk Analysis Model” (Vural 2004) willbe given.
3.2 Indoor Air Pollution
Atmosphere contains nitrogen, oxygen, argon, carbon dioxide and trace amount ofother gases. When the ratio of these components (Table 3.1) changes the air qualitychanges called as air pollution. Indoor air quality is also changes as the ratio ofindoor atmosphere components changes.
The first indoor air pollution that mankind met was in Stone Age. For heatingand cooking, people started fire in their caves. This activity of fire was the source ofpollutants. They improved the indoor air quality by starting the fire at the mouth ofthe cave.
Table 3.1 Components ofatmosphere (Tünay and Alp1996)
Components Volume (%) Concentration, ppm
Nitrogen 78.084 ±0.004 780,900Oxygen 20.946 ±0.00 209,400Argon 0.934 ±0.001 9,300Carbon dioxide 0.033 ±0.001 315Neon 18Helium 5.2Metan 1.5Krypton 0.5Hydrogen 0.5Xenon 0.08Nitrogen dioxide 0.02Ozone 0.01–0.04
3 Indoor Air Quality 61
In 1970s the first intense studies about indoor air quality began in the northEuropean countries especially in Scandinavian countries. One of the main reasonsfor these intense studies was the oil shock in 1973. Air conditioning systems weredecreased and new building details were designed for saving energy through out theoil shock. This new construction system caused the indoor air pollutants increasein buildings. Such increase in indoor air pollutants was observed in 100 preschoolclasses in Sweden (Lee 2000).
In the Unites States the first and large scale study was Harvard Six City Studies.The death rates due to the exposure to airborne particulates were increased on thedays which levels of particle air pollution were high (EPA 2009).
Since then many more studies have been initiated and completed. For the renewalof indoor air quality standards PRD 62-R, ASHRAE, the American Society ofHeating, Refrigerating and Air-Conditioning Engineers, initiated a study in 1996and the results were published in 1999 (Kerrigan 1996; ASHRAE 1999).
Approximately with 300 researchers from 40 countries pilot studies of NATO,North Atlantic Treaty Organization, were concluded between 1989 and 1996. As aresult of these studies, for decreasing the dose of pollutants, a product label of eachproduct companies produce was proposed (Maroni and Lundgren 1998).
3.3 Indoor Air Pollutants, Sources and Health Effects
Indoor air pollutants can be classified in different ways. The classifications of indoorpollutants are given below (Wadden and Scheff 1982; Pearson 1989; Yocom andMcCarthy 1991; Holdsworth and Sealey 1992; Patrick 1994; Griffin 1994; Godish1995; Meckler 1996; Brennan and Turner 1999; Spengler et al. 2000).
• According to the physical properties• Gas and vapors• Particles
• According to the chemical properties• Organic• Inorganic
• According to the adverse health effects• Toxic pollutants• Harmful and irritant pollutants• Carcinogenic pollutants• Mutagenic pollutants• Allergens
• According to their sources• Outside environment of the building• Usage of the building (user and user’s activities)• Building products

62 S.M. Vural
In this chapter, pollutants will be classified according to the physical properties.Each indoor air pollutant has a different structure coming from different sources.Single pollutant will have different health effects with in different levels on users.Many institutions in different countries set the acceptable levels (threshold values)of indoor air pollutants. Some of the main pollutants and their acceptable levelsfrom different institutes are given in Table 3.2.
Table 3.2 Acceptable levels of indoor air pollutants
Pollutant Acceptable level Reference – standard
Carbonmonoxide
60 mg/m3 (50 ppm) for 30 min Air quality guidelines forEurope-WHO (World HealthOrganization) 1987
40 mg/m3 (35 ppm) for 1 h NAAQS (US National ambientair quality standards) 1990
10 mg/m3 (10 ppm) for 8 h TS (Turkish standards) 12281Carbon dioxide 500 ppm for 8 h ASHRAE 1982
<1,800 mg/m3 WHO 1987<800 ppm TS 12281
Nitrogen dioxide 150 µg/m3 (0.08 ppm) for 1 h Air quality guidelines forEurope-WHO-1987
400 µg/m3 (0.21 ppm) for 24 h100 ppb for 1 h NAAQS 1990<0.05 ppm TS 12281
Sulfur dioxide <0.5 mg/m3 for short term exposure WHO 198475 ppb for 1 h NAAQS 19900.14 ppm for 24 h
Benzene No safe level WHO 1987<0.01 mg/cm3 TS 12281
Formaldehyde 0.1 mg/m3 (0.08 ppm) for 30 min WHO 1987120 µg/m3 continuous ASHRAE 62 – 19990.75 ppm for 8 h OSHA (U.S. Occupational Safety
and Health Administration)0.016 ppm NIOSH (National Institute for
Occupational Safety andHealth)
<0.065 ppm TS 12281Ozone 150–200 µg/m3
(0.076–0.1 ppm) for 1 hWHO 1987
100–120 µg/m3
(0.05–0.06 ppm) for 8 h0.05 ppm ASHRAE 62 – 19990.12 ppm for 1 h NAAQS 19900.075 ppm (2008 std) for 8 h<0.12 mg/cm3 TS 12281
Radon 100 Bq/m3 for 1 year WHO 19872 pCi/L ASHRAE 62 – 1999148 Bq/m3 EPA (US Environmental
protection agency)400 Bq/m3 TAEK (Turkish atomic energy
institution)

3 Indoor Air Quality 63
Table 3.2 (continued)
Pollutant Acceptable level Reference – standard
Asbestos No safe level WHO 19870.6 fiber/cm3/8 h chrysotile TS 115970.3 fiber/cm3/8 h other than chrysotile0.21 fiber/cc/8 h OSHA
Particles PM10 – 150 µg/m3 for 24 h NAAQS 1990PM2.5 – 35 µg/m3 for 24 h
Bacteria &viruses
No reference No reference
The health effect on users of each pollutant is forming a risk. As pollutants andacceptable levels change, as the risks also change. These variation is also differswith the users biological and medical background. For example radon has a severeadverse health effect on a smoker than a non-smoker. The nature of pollutants andtheir risks on users must be examined for indoor air quality assessment.
Table 3.3 Combustion gases, sources and health effects
Pollutant Sources of pollutant Health effects
Gas and vaporsCarbon
monoxideVehicle exhaustsChimneyIncomplete combustionTobacco smokeHousehold chemicals
HeadacheFatigueLack of coordination and
performance BreathlessnessWeaknessDizzinessDimness of visionVomitingChanges in pulse rateConfusionChanges in personalityComa
Carbon dioxide Biological activitiesof people
ChimneyIncomplete combustionTobacco smoke
DrowsinessDizzinessHeadacheNauseaBreathlessness
Nitrogenoxides
Vehicle exhaustsChimneyIncomplete combustionTobacco smoke
Burning and stinging of eyes,nose and throat
CoughingRespiratory complaints
Sulfur oxides Fuel and coal combustion Burning and stinging of eyes,nose and throat
SuffocationCoughingIncreasing of respiratory
complaints

64 S.M. Vural
The pollutants according to their physical properties, sources of pollutant andhealth effects will be given in Tables 3.3, 3.4, 3.5 and 3.6 (Wagner 1991; Milletteand Hays 1994; Patrick 1994; Fink 1998; Governo and Kavanagh 1999; Spengleret al. 2000; Provey 2001; Balanlı et al. 2004, 2005, 2006, 2008; EBN 1993, 1995a-b,1996; EHC 1998a-k; EPA 1998, 2009; EPA; Shen and Schmidt 1993).
Table 3.4 VOCs, sources and health effects
Pollutant Sources of pollutant Health effects
Gas and vaporsBenzene Vehicle exhausts
Incomplete combustionTobacco smokeProcessed composite
wood productsFinishingPaints
Burning of eyes andlacrimation
CancerAnemia
Toluene Vehicle exhaustsIncomplete combustionAdhesivesFloor materials (carpet,
vinyl)Tobacco smokeProcessed composite
wood productsFinishingPaintsThinnersInk
FatigueLack of coordinationDisturbed sleepEye irritation
Formaldehyde Processed compositewood products
AdhesivesInsulation productsCarpetsTextilesWall papersPaintsThinners
Uncomfortable of odorBurning of eyes and
lacrimationUpper respiratory irritationSneezeHeadacheNauseaVomitDiarrheaAsthma exacerbationsAllergen triggerCoughingIncreasing in the pulmonary
functionWater retentionFatigueInquietudeDisturbed sleepDeath (50–100 ppm)

3 Indoor Air Quality 65
Table 3.5 Natural gases, sources and health effects
Pollutant Sources of pollutant Health effects
Gas and vaporsOzone Electronic air cleaners
Copying machinesDimness of visionChest painCoughingHeadacheEye, nose, throat and lung
complaintsLack of concentrationSymptomatic chestAsthmaUpper respiratory effects
Radon RocksSoilWaterBuilding products
In long term exposurelung cancer
Table 3.6 Particles, sources and health effects
Pollutant Sources of pollutant Health effects
ParticlesAsbestos Soil
Insulation productsFinishing
Pleural neoplasmAsbestosisLung cancerMesothelioma
Pollen Graminaceae family AllergyDust Ash
CoalCement dustSawdustSoil
AllergyEye diseasesUpper respiratory effectsCoughing
Bacteria & viruses Ventilation systemsHumidifiersRefrigeratorsToiletsUnhealthy areas
AchFeverSinus infectionLegionnaire’ s disease
3.4 Risk and Risk Analysis
Risk is generally defined as the potential for an unwanted negative consequence orevent (Anderson and Albert 1999). Risk may be considered as the probability of anadverse effect, or an assessed threat to persons, the environment, and/or property,due to some hazardous situation (Asante-Duah 1993).

66 S.M. Vural
Risk or “expected loss” can also be defined quantitatively as the product ofthe consequences of a specific incident and the probability over a time period orfrequency of its occurrence. Risk analysis refers to a systematic framework forunderstanding and managing diverse risks (Andrews and Moss 2002).
Risk analysis framework includes;
• Risk assessment• Risk managemnet• Risk communication (Williams 2000).
Risk assessment entails quantifying and characterizing risks to determine how riskya given situation is (Williams 2000; Duru and Besbelli 1997). This step relies onassumptions made by scientists based on results from scientific data (Graham 1995).
Risk management is the policy for use of science in risk assessment (Andersonand Albert 1999). Risk management involves decisions about risks considering reg-ulatory, political, social, physical and economical points of view. In this step riskmanager answers questions such as “what is acceptable?” and “what can be doneabout these risks?” (Duru and Besbelli 1997).
Risk communication involves conveying information about a risk or risk man-agement decision to different groups of stakeholders (Spengler et al. 2000).
General risk analysis framework can be defined as above. Since the human healthrisk assessment given by NRC (U.S. National Research Council 1983) report is usedin risk studies of indoor air quality, it must also be defined.
In NRC report that was published in 1983, risk assessment is defined as “the useof the factual base to define the health effects of exposure of individuals or popula-tions to hazardous materials and substances” (Williams 2000). The risk assessmentprocess is divided into four steps. These steps include:
• Hazard identification• Exposure assessment• Dose-response assessment• Risk characterization
In NRC report that was published in 1983, risk management is defined as a“decision-making process that entails consideration of political, social, economic,and engineering information with risk-related information to develop, analyze,and compare regulatory options and to select an appropriate regulatory response”(Williams 2000).
Risk communication was defined in NRC 1983 report as any public or privatecommunication that informs individuals about the existence, nature, severity, oracceptability of risks. One of the primary goals of risk communication is to bet-ter inform decision makers, in the context of either public debate or personal action(Williams 2000).

3 Indoor Air Quality 67
3.5 Indoor Air Quality Risk Analysis Model
There are many air pollutants that may adversely impact indoor air quality.Evaluation of every single pollutant for every single building may lead to loss oftime, effort and money. Therefore, during the assessment phase of the indoor airquality risk process, initially a pre-assessment was deemed necessary in order toprovide data for other steps and prevent the losses listed above.
In the study titled “Evaluation of an Indoor Air Quality Risk Process Model”(Vural 2004), an enhanced risk process model was suggested by making thefollowing changes to the risk process:
• A pre-assessment step was added as the initial step• An application step was added after the risk management step• The risk communication step, in addition to providing information to the public,
also provides feedback to architects during the design stage.
The five main steps of this new suggested model for indoor air quality risk analysis(Fig. 3.1) are; pre-assessment, risk assessment, risk management, application andrisk communication.
3.5.1 Pre-assessment Step
The building itself and the occupants are defined in the pre-assessment step ofindoor air quality risk analysis.
Possible indoor air pollutants from the building itself or from the occupants arealso listed in this step.
In the pre-assessment step (Fig. 3.2) pollutants can be classified through;
• Building identification• End user interviews• Potential threat analysis
3.5.1.1 Potential Threat Analysis
Collected information such as tables of building products and the pollutants theycontain, similar to those detailed in the study titled “Indoor Air Pollution Caused ByBuilding Product and Risk Assessment in Preliminary Research Step” by Vural andBalanlı (2005) will be helpful in this step. While analyzing the risks of a building,researchers can determine what pollutants there are by relying on their experience,utilizing their senses or simply by using checklists.

68 S.M. Vural
Fig
.3
.1In
door
air
qual
ity
risk
anal
ysis
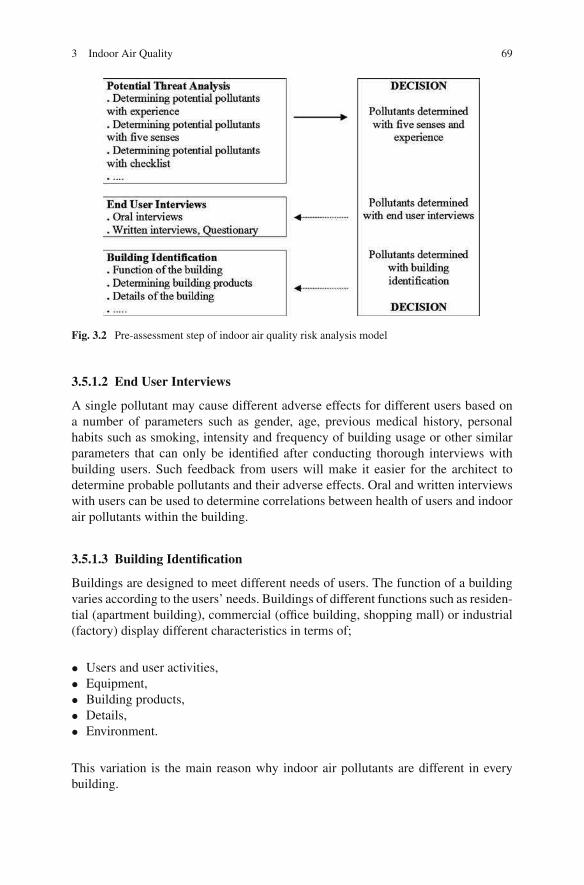
3 Indoor Air Quality 69
Fig. 3.2 Pre-assessment step of indoor air quality risk analysis model
3.5.1.2 End User Interviews
A single pollutant may cause different adverse effects for different users based ona number of parameters such as gender, age, previous medical history, personalhabits such as smoking, intensity and frequency of building usage or other similarparameters that can only be identified after conducting thorough interviews withbuilding users. Such feedback from users will make it easier for the architect todetermine probable pollutants and their adverse effects. Oral and written interviewswith users can be used to determine correlations between health of users and indoorair pollutants within the building.
3.5.1.3 Building Identification
Buildings are designed to meet different needs of users. The function of a buildingvaries according to the users’ needs. Buildings of different functions such as residen-tial (apartment building), commercial (office building, shopping mall) or industrial(factory) display different characteristics in terms of;
• Users and user activities,• Equipment,• Building products,• Details,• Environment.
This variation is the main reason why indoor air pollutants are different in everybuilding.

70 S.M. Vural
In risk assessment studies building identification is crucial for determiningpotential existence of pollutants.
As a result in this pre-assessment step; information provided by the building iden-tification, user interviews and potential threat analysis will be useful in determiningthe existence and intensity of pollutants.
3.5.2 Risk Assessment Step
In the risk assessment step, NRC report is used (U.S. National Research Council1983). This human health risk assessment contains four steps; hazard identification,dose-response assessment, exposure assessment and risk characterization (Andersonand Albert 1999). The steps of this report were not changed but redefined. As a resultin the risk assessment step, adverse health effects of indoor air pollutants regard-less of pollutant concentration or severity of effect, are determined. Existences ofindoor air pollutants are then investigated by measuring. Risk factors are calculatedby taking into consideration predetermined health effects and the relevant cause-effect relationships. According to the total risk, risk of the building is determined(Fig. 3.3).
3.5.3 Risk Management Step
In the risk management step, level of risk previously determined is designated asacceptable or unacceptable in the light of indoor air quality standards and thresholdvalues (acceptable levels).
3.5.4 Application Step
According to the decision, the next step, application, is put into practice (Fig. 3.4).If risks are decided to be at an unacceptable level, either the building is improved,
Fig. 3.3 Risk assessment step of indoor air quality risk analysis model

3 Indoor Air Quality 71
Fig. 3.4 Application step of indoor air quality risk analysis model
or evacuated or demolished. If risks are deemed to be at an acceptable level, noapplication is done on the building.
3.5.5 Risk Communication Step
The risk communication step provides feedback to every step of the model and tothe design stage (Vural 2004).
3.6 Conclusion
A risk process model can be developed by adding a pre-assessment step to therisk assessment, risk management and risk communication step of the risk analysisframework used to prevent indoor air quality risks.
If this model is utilized;
• The pre-assessment step will eliminate the need to conduct a wide range analysisby revealing only those building products that are present in the building and posea risk. This will save time, effort and money.
• The architect will play a necessary lead role in the risk assessment.• Indoor air quality of existing buildings can be improved while indoor air quality
of new buildings can be taken into consideration during the design stage, elimi-nating the need to make corrections or improvements at a later time, which againsaves time, effort and money.
Indoor air quality risk analysis is conducted by architects and experts from otherdisciplines. The intended outcome of this interdisciplinary study is to determine if abuilding is indeed a healthy building or not.
72 S.M. Vural
References
Anderson EL, Albert RE (1999) Risk Assessment and Indoor Air Quality. Lewis Publishers,New York, NY.
Andrews JD, Moss TR (2002) Reliability and Risk Assessment. Professional EngineeringPublishing, London.
Asante-Duah DK (1993) Hazardous Waste Risk Assessment. Lewis Publishers, Boca Raton, FL.ASHRAE (1982) The American Society of Heating, Refrigerating and Air-Conditioning
Engineers, Annual Report. ASHRAE 92-629, Atlanta, GA.ASHRAE (1999) The American Society of Heating, Refrigerating and Air-conditioning Engineers,
Ventilation for Acceptable Indoor Air Quality. ANSI/ASHRAE 62-1999, Atlanta, GA.Balanlı A, Tuna Taygun G (2005) Yapı Biyolojisi ve Asbest. Mimar.ist 16:107–110.Balanlı A, Vural SM, Tuna Taygun G (2004) Yapı Ürünlerindeki Radonun Yapı Biyolojisi
Açısından Irdelenmesi. 2. Ulusal Yapı Malzemesi ve Kongresi ve Sergisi; 378–386, Istanbul.Balanlı A, Vural SM, Tuna Taygun G (2006) Yapı Ürünlerindeki Formaldehitin Yapı Biyolojisi
Açısından Irdelenmesi. 3. Ulusal Yapı Malzemesi ve Kongresi ve Sergisi; 430–438, IstanbulBalanlı A, Vural SM, Tuna Taygun G (2008) Yapı Ürünlerindeki Liflerin Yapı Biyolojisi Açısından
Irdelenmesi. 4. Ulusal Yapı Malzemesi ve Kongresi ve Sergisi; 294–302, Istanbul.Brennan TM, Turner W (1999) Indoor air quality primer: what factors and conditions cause indoor
air quality problems and what can you do to stop them? Heat Piping Air Cond 71i5:5Duru S, Besbelli N (1997) Risk Degerlendirilmesi, Uluslararası Katılımlı 1. Ulusal Çevre
Hekimligi Kongresi, Ankara.EBN (1993) Environmental building news. Cement and concrete: Environmental considerations.
EBN2 (2) http://www.buildinggreen.com/features/cem/cementconc.htmlEBN (1995) Environmental building news. Concrete as a CO2 Sink. EBN4(5) http://www.
buildinggreen.com/news/concreteco2sink.htmlEBN (1995) Environmental building news. Insulation materials: Environmental comparisons.
EBN4(1) http://www.buildinggreen.com/features/ins/insulation.htmlEBN (1996) Environmental building news. Lead and asbestos – the encapsulation option. EBN5(6)
http://www.buildinggreen.com/products/leadasbestos.htmlEHC (1998a) Environmental health center. Air quality problems caused by floods. http://www.nsc.
org/EHC/indoor/floods.htmEHC (1998b) Environmental health center. Alternatives to household chemicals. http://www.nsc.
org/EHC/indoor/altchems.htmEHC (1998c) Environmental health center. Asbestos. http://www.nsc.org/EHC/indoor/asbestos.
htmEHC (1998d) Environmental health center. Asthma. http://www.nsc.org/EHC/indoor/asthma.htmEHC (1998e) Environmental health center. Biological contaminants. http://www.nsc.org/EHC/
indoor/bio_cont.htmEHC (1998f) Environmental health center. Carbon monoxide. http://www.nsc.org/EHC/indoor/
carb_mon.htmEHC (1998g) Environmental health center. Environmental tobacco smoke. http://www.nsc.org/
EHC/indoor/ets.htmEHC (1998h) Environmental health center. Formaldehyde. http://www.nsc.org/EHC/indoor/
formald.htmEHC (1998i) Environmental health center. Indoor air quality in the home. http://www.nsc.org/
EHC/indoor/iaqfaqs.htmEHC (1998j) Environmental health center. Pesticides. http://www.nsc.org/EHC/indoor/pesticid.
htmEHC (1998k) Environmental health center. Sick building syndrome. http://www.nsc.org/EHC/
indoor/sbs.htmEPA (1998) United States Environmental Protection Agency. Understanding IAQ Problems. http://
www.epa.gov/iaq/schools/tfs/guide05.html

3 Indoor Air Quality 73
EPA (2009) Proposal to designate an emission control area for nitrogen oxides, sulfur oxides andparticulate matter, technical support document. 4; quantified health impacts analysis EPA-420-R09-007. http://www.epa.gov/otaq/regs/nonroad/marine/ci/420r09007-chap4.pdf
EPA United states environmental protection agency. About combustion pollutants. http://www.epa.gov/iaq/asthma/triggers/combust.html
EPA United states environmental protection agency. Asbestos in your home. http://www.epa.gov/leaweb00/pubs/asbestos.html
EPA United states environmental protection agency. Indoor air facts No4 (revised), Sick buildingsyndrome (SBS). http://www.epa.gov/iedweb00/pubs/sbs.html
EPA United states environmental protection agency. IAQ, Asbestos. http://www.epa.gov/iaq/asbestos.html
EPA United states environmental protection agency. IAQ, Formaldehyde. http://www.epa.gov/iaq/formalde.html
Fink JN (1998) Fungal allergy: from asthma to alveolitis. Indoor Air Int J Indoor Air Qual Clim4:50–55
Godish T (1995) Sick Buildings; Definition, Diagnosis and Mitigation. Lewis Publishers, BocaRaton, FL.
Governo DM, Kavanagh EP (1999) Beyond sick building syndrome. Risk & insurance 28.Graham JD (1995) Historical perspektive on risk assessment in the Federal Government.
Toxicology 102:29–52Griffin RD (1994) Principles of Air Quality Management. Lewis Publishers, Boca Raton, FL.Holdsworth B, Sealey A (1992) Healthy Buildings: A Desing Primer for a Living Environment.
Longman, England.Kerrigan K (1996) Indoor air quality examined. South Florida Bus J 11(18):editorial.Lee J (2000) Controlling your environment. Buildings 94(6):84–94.Maroni M, Lundgren B (1998) Assessment of the health and comfort effects of chemical emissions
from building materials: the state of the art in the European Union. Indoor Air Int J Indoor AirQual Clim 4:26–31
Meckler M (1996) Improving Indoor Air Quality Through Design, Operation and Maintenance.The Fairmont Press, Inc, Lilburn, GA.
Millette JR, Hays SM (1994) Settled Asbestos Dust Sampling and Analysis. Lewis Publishers,Boca Raton, FL.
NAAQS (1990) National ambient air quality standards. http://www.epa.gov/air/criteria.htmlNIOSH (2005) National institute for occupational safety and health, guide to chemical hazards.
http://www.cdc.gov/niosh/npg/npgd0293.htmlNRC (1983) U.S. National Research Council. Risk Assessment in the Federal Government:
Managing the Process. National Academy Press, Washington, DC.OSHA 1910.1001 Occupational safety & health administration. Regulations (Standards-29 CFR)
http://www.osha.gov/pls/oshaweb/owadisp.show_document?p_table=STANDARDS&p_id=9995
Patrick DR (1994) Toxic Air Pollution Handbook. Van Nostrand Reinhold, New York, NY.Pearson D (1989) The Natural House Book. Simon and Schuster, Fireside, New York, NY.Provey J (2001) Fresh Air. Popular Mechanics 178(9):84–88.Shen TT, Schmidt CE (1993) Assessment and Control of VOC Emissions from Waste Treatment
and Disposal Facilities. Van Nostrand Reinhold, New York, NY.Spengler JD, Samet JM, McCartht JF (2000) Indoor Air Quality Handbook. McGraw-Hill, New
York, NY.TS 11597 (1995) Hava Kalitesi-Asbeste Maruz Kalınan Is Yerlerinde Alınacak Güvenlik ve Saglık
Tedbirleri. Türk Standartları Enstitüsü, Ankara.TS 12281 (1997) Çevre Saglıgı-Kapalı Ortam Havası ile Ilgili Tedbirler. Türk Standartları
Enstitüsü, Ankara.Tünay O, Alp K (1996) Hava Kirlenmesi Kontrolü. Mega Ajans, Istanbul.

74 S.M. Vural
Vural SM (2004) Yapi Ici Hava Niteligi Risk Sureci Modeli Belirlenmesi. Doktora Tezi. YTU FBE,Istanbul.
Vural SM, Balanlı A (2005) Yapı Ürünü Kaynaklı IçHava Kirliligi ve Risk Degerlendirmede ÖnArastırma. MEGARON Planlama-Tasarım-Yapım. YTÜ Mim. Fak. E-Dergisi, Cilt 1, Sayı 1:28–39.
Wadden RA, Scheff PA (1982) Indoor Air Pollution: Characterization, Prediction, and Control.Wiley, New York, NY.
Wagner A (1991) Flor Covering & IAQ: Heallth Impacts, Prevention, Mitigation & Litigation.Cutter Information Corp., Arlington, TX.
WHO (1984) Indoor Air Quality Research. World Health Organization Regional Office for Europe,Copenhagen.
WHO (1987) Air quality guidelines for Europe. WHO regional publications, European series 23,Denmark.
Williams PRD (2000) The risk analysis framework: Risk assessment, risk management, and riskcommunication. In Spengler JD, Samet JM, McCarthy JF (Ed.) Indoor Air Quality Handbook.McGraw-Hill, New York, NY.
Yocom JE, McCarthy SM (1991) Measuring Indoor Air Quality; A Practical Guide. Wiley,England.

Chapter 4
Perceived IEQ Conditions: Why the ActualPercentage of Dissatisfied Persons is Higherthan Standards Indicate?
Risto Kosonen, Mervi Ahola, Kirsi Villberg, and Tarja Takki
4.1 The Meaning and Targets of IEQ
4.1.1 Profitable Investment
The indoor environment is where people spend 90% of their time. It is well knownthat the indoor environment is an important factor not only for occupants’ comfort as
a whole, but also for their health and productivity. This is incorporated in the human
right to a healthy indoor environment as formulated in the WHO Constitution (WHO
1985). Indoor environment comprises several factors (acoustics, lighting, thermal
environment, air quality). The individual performance is significantly affected by
the conditions of the working environment.
The latest studies have proved that the investment on improved IEQ (thermal
comfort, IAQ, acoustics and lighting) is very cost-effective (Fisk and Seppänen
2007; Wargocki and Wyon 2006; Wargocki et al. 2002; Hongisto 2005; Juslen
2007). Wood (1989) has indicated that the salaries of workers in the US office
buildings have exceeded the costs of building energy, maintenance, annualized
construction and rental by a factor of 100.
In offices all these factors have an impact on workers, but the most significant
two are thermal environment and air quality.
According to a study of BOMA (BOMA 1999) 90% or more of the respondents
give the following six features a rating of very important: comfortable temperature,
indoor air quality, quality of building maintenance work, building management’s
responsiveness, building management’s ability to meet the tenant’s needs and
acoustics.
R. Kosonen (B)Oy Halton Group Ltd, Helsinki, Finlande-mail: [email protected]
75S.A. Abdul-Wahab (ed.), Sick Building Syndrome,DOI 10.1007/978-3-642-17919-8_4, C© Springer-Verlag Berlin Heidelberg 2011

76 R. Kosonen et al.
4.1.2 Standards Specify Targets
There are several international and local standards and guidelines that give recom-mendations and propose design criteria for achieving good indoor environment (ISO2005; EN 2007; ASHRAE 2004; CEN CR 1999). Recommended values for themean air velocity, air temperature, relative humidity, vertical temperature gradientand mean radiant temperature both for winter and summer conditions are listed inthese documents.
Also the minimum outdoor air flow rates to be supplied into the space by the ven-tilation system in order to assure good air quality for the occupants in the room aredefined (EN 15251 (2007)). Outdoor air flow rate of 7–10 l/s per person is namely
required in office buildings.
The thermal sensation of the body as a whole (general thermal comfort) can
be predicted by calculating the predicted mean vote (PMV) index introduced in
ISO (2005). The predicted percentage dissatisfied (PPD) index, obtained from the
PMV index, provides information on thermal discomfort (thermal dissatisfaction)
by predicting the percentage of people likely to feel too hot or too cool in the given
thermal environment.
The criteria for the excellent level of PPD – index is 6% (EN 15251 2007).
Criteria for the good and basic levels are set to 10 and 15%, respectively. A model
for local discomfort that predicts the percentage of dissatisfied due to draught was
introduced by Fanger et al. (1988). An index called draught rating (DR) index was
derived as a function of mean air velocity, air temperature and turbulence intensity.
A draught rating (DR) lower than 15% is recommended in the standards. CEN
CR (1999) specifies different limits on DR for three categories of thermal environ-
ment in rooms. The set categories for the predicted thermal state of the whole body
(EN 2007) and local discomfort (CEN CR 1999) are shown in Table 4.1.
The above mentioned overall thermal sensation levels are confirmed as guide-
lines in recently approved standard EN 15251, which highlights the importance of
Table 4.1 Recommended criteria and categories for the thermal environment
Thermal state of the body as awhole Local discomfort
Perceived airquality
Category
Predictedpercentage ofdissatisfiedPPD [%]
Predicted meanvote PMV
Percentage ofdissatisfied dueto draughtDR [%]
Percentage ofdissatisfiedPD [%]
Requiredventilationrate foroccupantsa
[l/s/person]
I <6 –0.2<PMV<+0.2 <15 <15 10II <10 –0.5<PMV<+0.5 <20 <20 7
III <15 –0.7<PMV<+0.7 <25 <30 4
aTotal ventilation for a room is calculated based on diluting emissions from people and the buildingemissions (Category II: 0.35–1.4 l/s per m2)

4 Perceived IEQ Conditions 77
maintenance of good thermal conditions, when energy performance of building isdesigned to fulfill the Energy Performance of Buildings Directive (EPBD).
During the design process, the desired thermal conditions for a space may beselected based on the defined international or national indoor climate classifications(e.g. CEN CR 1999; FISIAQ 2001). In the selected indoor climate class the targetvalues are set for both maximum percentage of dissatisfied for the body as a whole(PPD) and for the local discomfort (DR). In addition, the relevant targets for indoorair quality, outdoor air flow rates and acoustics conditions are set during the designprocess.
4.1.3 What About the Actual Perception?
Even though numerical physical measures define accurately different factors of theindoor environment, only the perceived quality determines the total performance ofthe building from user’s point of view. The occupant IEQ survey is a tool that helps
to assess how well a building is performing from the viewpoint of its occupants
(Zagreus et al. 2004).
Further, a holistic approach of IEQ development and maintenance is required for
an effective process to improve the perception of indoor climate conditions. A sys-
tematic method for the assessment and improvement of IEQ has been proposed by
Takki and Virta (2007).
The subjective response is a useful too to analyze the occupant perception on
indoor environment quality.
4.2 Occupants Underutilized Source of Information
Historically, building occupants have been underutilized as a source of information
on building performance. However, an occupant satisfaction survey is a powerful
tool to analyze the perception for the actual indoor environment quality.
4.2.1 Assessment Process
The questions assess satisfaction with the following IEQ areas: office layout,
office furnishing, thermal comfort, indoor air quality, lighting, acoustics, safety and
security, and building cleanliness and maintenance. Basic demographics are also
collected from respondents and information about their workplace.
The survey questions elicit whether the workspace is in the internal or perimeter
zone, near a window, and also the orientation and the layout type of the office are
linked with the collected information.
A web-based survey has been utilized as a diagnosis tool to identify specific prob-
lems and their sources in a cost-effective manner. Whatever a respondent indicates

78 R. Kosonen et al.
dissatisfaction with an aspect of building performance, a branching page followswith more detailed questions about the nature of the specific problem.
The approach of the Web – based survey gives two main benefits: (1) it can
inexpensively be administered to many buildings and (2) its interactive branching
questions allow it to “drill down “into areas that occupants rate poorly.
Thus in many cases, the survey diagnoses the root of the problems. The
approximate time required to complete the survey is 5–12 min.
4.2.2 Rating of Satisfaction
Upon starting the survey, participants click through a series of questions asking them
to evaluate their satisfaction with different aspects of their working environment.
In Fig. 4.1, there is shown a thermal comfort sample of the survey.
Satisfaction is rated ranging from “very satisfied” to “very dissatisfied”, with a
neutral midpoint. The question related to whole body and local thermal sensation
in 7-point scale, acceptability of thermal environment, air movement, lighting, air
quality and acoustics.
The respondents who indicate dissatisfaction (the lowest three points on the
scale) are branched to a follow-up screen probing them for more information about
the nature of their dissatisfaction.
Respondents who indicate neutrality or satisfaction move directly to the next
survey topic. As a rule of thumb is that a 50% response rate is required to reduce
non-response bias to an acceptable rate (Hill et al. 1999). In the conducted surveys,
the response rate have ranged from 45 to 97%, with the majority of response rates
between 50 and 75% and the mean at just over 68% (Kosonen et al. 2008).
4.3 How Well We Can Reach the Set Targets?
The occupant satisfaction survey has been used to evaluate the performance of
29 office buildings in Finland (Kosonen et al. 2008). Survey clients include both
government and private organizations locating in Helsinki metropolis area. All
Ver
y
Dis
sati
sfie
d
Dis
sati
sfie
d
Par
tial
ly
dis
sati
sfie
d
Not
Dis
sati
sfie
d o
r
Par
tial
ly
Sat
isfi
ed
Sat
isfi
ed
Ver
y S
atis
fied
−3 −2 −1 0 +1 +2 +3
How satisfied are you with
the temperature in your
workspace?
THERMAL COMFORT
Fig. 4.1 A thermal comfort sample of the occupant IEQ survey scale
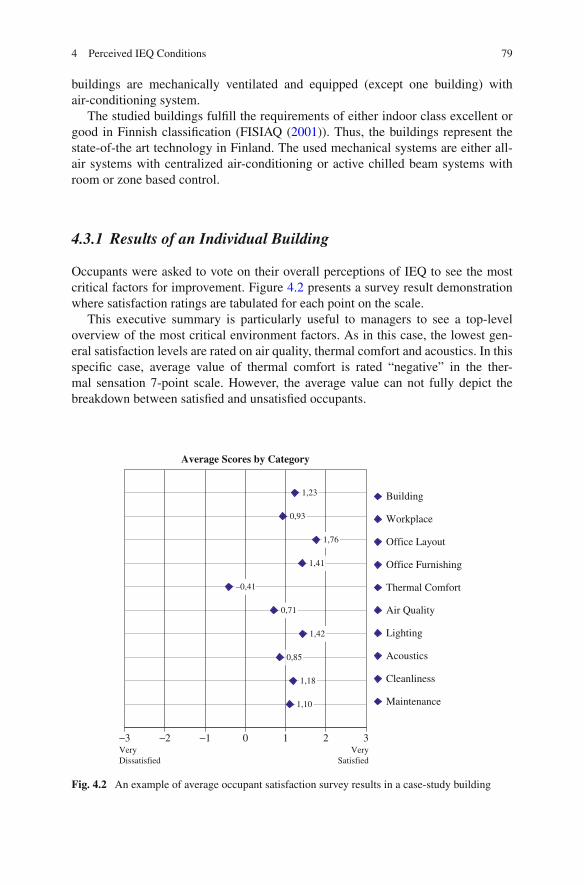
4 Perceived IEQ Conditions 79
buildings are mechanically ventilated and equipped (except one building) withair-conditioning system.
The studied buildings fulfill the requirements of either indoor class excellent orgood in Finnish classification (FISIAQ (2001)). Thus, the buildings represent thestate-of-the art technology in Finland. The used mechanical systems are either all-air systems with centralized air-conditioning or active chilled beam systems withroom or zone based control.
4.3.1 Results of an Individual Building
Occupants were asked to vote on their overall perceptions of IEQ to see the mostcritical factors for improvement. Figure 4.2 presents a survey result demonstrationwhere satisfaction ratings are tabulated for each point on the scale.
This executive summary is particularly useful to managers to see a top-leveloverview of the most critical environment factors. As in this case, the lowest gen-eral satisfaction levels are rated on air quality, thermal comfort and acoustics. In thisspecific case, average value of thermal comfort is rated “negative” in the ther-mal sensation 7-point scale. However, the average value can not fully depict thebreakdown between satisfied and unsatisfied occupants.
Average Scores by Category
1,23
0,93
1,76
1,41
–0,41
0,71
1,42
0,85
1,18
1,10
−3 −2 −1 0 1 2 3
Building
Workplace
Office Layout
Office Furnishing
Thermal Comfort
Air Quality
Lighting
Acoustics
Cleanliness
Maintenance
Very
Dissatisfied
Very
Satisfied
Fig. 4.2 An example of average occupant satisfaction survey results in a case-study building

80 R. Kosonen et al.
However, even if average satisfaction rating is quite often used to categorizebuildings (Zagreus et al. 2004; Euleb 2007), it cannot define the actual number ofpersons who are dissatisfied with the conditions
It should be noted that the average satisfaction score could be reasonably goodbut eventually there might be zones where the percentage of the dissatisfied couldbe even 30–60%.
An occupation perception map is a tool for analyzing more closely the location
and actual number of dissatisfied persons. In the map in question, the percent-
age of the dissatisfied with environmental factors are exhibited in different zones.
Afterwards this information can also be exploited for focus field audits on the
problem areas and workplaces.
For example in a case-study building, there are one problem area for air quality
and four for thermal comfort (Table 4.2). In this case, acoustic privacy is rated very
low in all zones, respectively.
The breakdown of the sensation ratings (7-point scale) give a generic view how
serious the problem is. As an example, the breakdown of thermal sensation rating
is shown in Fig. 4.3. In this case-building, altogether 36% of occupants are voted
either cool or cold. This result indicates that thermal comfort has been perceived a
serious problem.
Cold sensation could be results of the whole body thermal sensation (too low
air temperature) or local thermal problem (draught caused by air movement). That
possible to further analyze by asking questions on preference for more, less or
unchanged air movement and air temperature.
In Fig. 4.4, there is an example where major part of occupants are preferred
higher air temperature and no change in air movement. This confirms that in this
case the thermal sensation problem is too low air temperature.
Sometimes, the dissatisfaction on thermal sensation varies in summer and win-
ter times and at different floor level. To find-out the reason for cold sensation,
thermal sensation on air temperature and draught should analyzed at the same time.
Table 4.2 An example of occupation perception map in a case-study building
All (%)2nd floor(%)
3rd floor(%)
4th floor(%)
5th floor(%)
6th floor(%)
7th floor(%)
8th floor(%)
Building 3 3 0 0 13 7 1 0Workplace 5 3 6 0 23 0 0 5Furniture (comfort) 10 15 12 8 6 6 7 7Furniture
(adjustment)10 9 15 9 0 13 10 14
Thermal comfort 53 80 35 63 54 53 32 55Air quality 22 10 11 27 22 42 33 9Lighting (quantity) 9 15 6 25 0 0 3 15Lighting (quality) 12 12 12 17 13 12 16 0Sound level 16 15 21 33 13 6 10 15Acoustic privacy 32 21 36 58 25 35 16 29

4 Perceived IEQ Conditions 81
Average − 0,9
Thermal sensation
15%
21% 20%
33%
7%
3%0%
Cold
(−
3)
Cool
(−2)
Sli
ghtl
yco
ol
(−1)
Neu
tral
(0)
Sli
ghtl
yw
arm
(+
1)
War
m (
+2)
Hot
(+3)
% o
f all
res
pon
den
ts
Fig. 4.3 The breakdown ofthermal sensation ratings ina case-study building
Desired change inworkstation air temperature
Desired change inworkstation air movement
No change
41 %
Lower
6 %
Higher
53 %
Higher
21 %
Lower
21 %
No change
58 %
Fig. 4.4 Desired changes in workstation air temperature and air movement in a case-study building
As an example in Fig. 4.5, occupant can generally perceive draught problem duringsummer and too cold air temperature during winter.
4.3.2 Results in Building Stock
Occupants’ overall perceptions on the studied 29 buildings are shown in Fig. 4.6
(Kosonen et al. 2008). From the point view of the occupants, thermal comfort, IAQ
and acoustics (noise level and acoustic privacy) have got the lowest average ratings.
Almost in all buildings, those factors are the main concern for improvements.
4.3.2.1 Average Dissatisfaction Rating
In this survey, there are buildings where the average ratings on thermal comfort,
air quality and acoustics are negative (average all dissatisfied). Still, in most of the
cases average ratings on survey categories are positive indicating at least partial
satisfaction on the system performance.

82 R. Kosonen et al.
0%
20%
40%
60%
80%
100%
All
2nd f
loor
3rd
flo
or
4th
flo
or
5th
flo
or
6th
flo
or
7th
flo
or
8th
flo
or
Temperature too low on summertime
Draught from air-conditioning on summertime
Temperature too low on wintertime
Draught from air-conditioning on wintertime
Fig. 4.5 Comparison of perceived air temperatures and draught during summer and winterconditions at different floors in a case-study building
−3
−2
−1
0
1
2
3
Buil
din
g
Work
spac
e
Off
ice
layout
Off
ice
furn
ishin
g
Ther
mal
com
fort
Indoor
Air
Qual
ity
Lig
hti
ng
Aco
ust
ics
Cle
anin
g
Tec
hic
al m
ainte
nan
ce
Average of all buildings
Fig. 4.6 Benchmarkcomparison of averagesatisfaction ratings and theirvariations by survey category(n = 3,796 persons in 29buildings)
4.3.2.2 Number of Dissatisfied Persons
When the total numbers of the dissatisfied are computed (negative rates of –1, –2
and –3 together), the number of the dissatisfied persons is very high (Fig. 4.7).
The percentage of dissatisfied on thermal comfort and air quality is over 20%
in many buildings. To further confirm that the level of dissatisfied is indeed
anomalously high, only 6 buildings of 29 cover ASHRAE’s demand of less than

4 Perceived IEQ Conditions 83
0%
10%
20%
30%
40%
50%
60%
70%
80%
90%
Case buildings (29)
Dis
sati
sfie
d (
%)
Thermal comfort Indoor Air Quality Acoustic Privacy
Fig. 4.7 The percentage of the dissatisfied on thermal comfort, air quality and acoustic privacy in29 buildings. Case buildings are binned in the ascending order of dissatisfied on thermal comfort
20% dissatisfied on general thermal comfort (ASHRAE 2004). The results are evenworse in acoustics privacy: the percentage of dissatisfied is typically 30–60%.
All this depicts that actual perception on IEQ is much lower than during the
design phase set requirement level. In practice, it seems that even the requirements
of the lowest indoor class (15–25% of dissatisfied) is difficult to be met when the
metric is satisfaction rating on IEQ.
To recast respondents on thermal comfort, indoor and acoustics who indicate
dissatisfaction, the breakdown of the lowest three points on the scale is shown in
Figs. 4.8, 4.9, and 4.10. This indicates that in many building the number of dis-
satisfied (–2) and very dissatisfied (–3) occupants is high. Perception on indoor air
quality is rated better than on thermal comfort and acoustics and the number of
just partial dissatisfied (–1) on indoor air quality is higher than on thermal comfort
and acoustics. Respectively, the number of very dissatisfied (–3) on acoustics is the
highest.
4.4 Set Targets and Perception on IEQ: Not Really Match
4.4.1 Acceptability as a Starting Point
Parameters to characterize ventilation may include ventilation rates, contaminant
levels and physical characterization of the indoor environment. These factors affect
human responses through each other but also independently.

84 R. Kosonen et al.
Thermal Comfort
0%
10%
20%
30%
40%
50%
60%
70%
Very Dissatisfied [−3] Dissatisfied [−2] Partially dissatisfied [–1]
Fig. 4.8 The breakdown of the respondents on thermal comfort who indicate dissatisfaction (thelowest three points on the scale)
Indoor Air Quality
0%
10%
20%
30%
40%
50%
60%
70%
Very Dissatisfied [−3] Dissatisfied [−2] Partially dissatisfied [–1]
Fig. 4.9 The breakdown of the respondents on indoor air quality who indicate dissatisfaction (thelowest three points on the scale)
Outdoor air flow rate of 7–10 l/s per person is namely requested in international
standards. However, the latest studies have proved that the air flow rate of 20–30 l/s
per person is required to enhance perceived air quality (Fisk and Seppänen 2007).
Criteria for an acceptable thermal climate can be specified as requirements
for general (the overall sensation of the body) or local thermal discomfort. Such
requirements can be found in existing standards and guidelines.
Despite the excellent control over environmental conditions in climate chambers,
it has not been possible to assess how dissatisfaction due to multiple sources is
defined. For example, people may be dissatisfied due to general thermal comfort
and/or dissatisfied due to local discomfort parameters, but at the present there is no
method for combining the total number of people finding environment unacceptable.

4 Perceived IEQ Conditions 85
Acoustic Privacy
0%
10%
20%
30%
40%
50%
70%
60%
80%
90%
Very Dissatisfied [−3] Dissatisfied [−2] Partially dissatisfied [–1]
Fig. 4.10 The breakdown of the respondents on acoustic privacy who indicate dissatisfaction (thelowest three points on the scale)
4.4.2 Not Easy to Meet the Set Targets
In many commercial buildings, thermal conditions are not well-controlled due toinsufficient of cooling or heating capacity, high internal or external loads, largethermal zones, improper control system design or operation, and other factors.
For example, in a large US study, 50% of the subjects preferred a change intheir thermal state, 38% of subjects in winter were dissatisfied with thermal con-ditions, and almost 50% of the thermal conditions during summer were outside ofthe thermal comfort zone (Schiller et al. 1988). Thermal conditions inside buildingsvary considerably with time, e.g., as outdoor conditions change, and spatially withinbuildings.
The percentages of the dissatisfied on thermal comfort and air quality are (sepa-rately or together) often over 30% (Kosonen et al. 2008). To further confirm that thelevels of dissatisfied are indeed anomalously high, only 6 of the 29 buildings coverASHRAE’s requirement of less than 20% dissatisfied on general thermal comfort
(ASHRAE 2004). The results are even worse in acoustics privacy: the percentage
of dissatisfied is typically 30–60%. In other field studies, the actual percentage of
the dissatisfied is also much higher than in standards e.g. 12% (Hwang and Cheng
2007), 12% (Schiller 1990) and 48% (Melikov et al. 2005).
The quality of the indoor climate in schools has been found to be poor in a num-
ber of surveys (Daisey et al. 2003; Mendell and Heath 2005). Together with the high
internal and external load variations, it makes challenging to fulfill the requirements
for sufficiently low local discomfort level predicting the percentage of dissatisfied
due to draft (ISO 2005).
Poor indoor air quality causes an increase in symptoms and illness, and it short-
ens attention span, whereas good air quality can enhance children’s concentration
and also teachers’ productivity (Wargocki et al. 2005).
The commonest indoor climate problems are inadequate ventilation and ther-
mal comfort. To achieve a good indoor climate, an adequate airflow should be

86 R. Kosonen et al.
used and the functionality of air distribution should be analyzed to guarantee theperformance.
All this confirms that in practice, it is not easy to meet targets for occupantperceptions on IEQ.
4.4.3 Why the Actual Percentage is So High?
In investigating perceived IEQ, it is essential to note that existing standards are basedon laboratory research on college-aged subjects and not people working in the officeenvironment.
This study of office buildings shows that the percentage of dissatisfied accordingto the surveys is much higher than the set target values in the international standards.
It is essential to note that subjects are asked what the thermal conditions usuallyare like in the occupied building. In this kind of retrospective approach, subjectsmay exaggerate how often and to which extent they are dissatisfied on IEQ, in orderto ensure that something will be done about it.
Another source of variation in surveys is that in the survey it is not possible toknow how bad the conditions have been in the past in all the places the subjectshave been occupied. There could be only limited time period that the occupants arereferring to when they complain.
In the office occupation satisfaction survey, systematic physical field measure-ments were not carried out to explain the difference. However, the executed auditsdemonstrated that different technical problems might exist.
Generally, the main reasons for the high number of the dissatisfied persons arethe faults in commissioning and maintenance process. Also nowadays, the designprocess is mainly focusing on the peak load conditions and the performance of thesystem is not sufficiently analyzed during mid-season.
In addition, organizational changes are continuous and require changes not onlyin the workplace layouts but also in the mechanical systems. Without adjustments,layout changes might create e.g. draught, lighting and air quality problems.
4.5 Conclusions
The results depict that even if the average satisfaction in IEQ survey shows highscores major problem areas may exist in some parts of buildings. Also in manybuildings, the actual percentage of dissatisfied persons is higher than 30% especiallywith thermal comfort, indoor air quality and acoustics.
In the building stock, commissioning and maintenance process are oftenneglected. Also, the required system adjustments are not executed after layoutchanges of workplaces. Using the perception map as a tool to find out the problemsareas, it is possible to focus improvements cost-effectively to critical workplacesand simultaneously improve significantly perception on IEQ operation with buildingdesigners.

4 Perceived IEQ Conditions 87
References
ASHRAE (2004) Thermal Environmental Conditions for Human Occupancy. ASHRAE stan-dard 55 american society of heating, Refrigerating and Air-Conditioning Engineers Inc,Atlanta, GA.
BOMA (1999) What Tenants Want: Building Features, Amenities and Services. Building Ownersand Managers Association and Urban Land Institute, Washington DC.
CEN CR 1752 (1999) Ventilation for Buildings: Design Criteria for the Indoor Environment.European Committee for Standardization, Brussels.
Daisey JM, Angell WJ, Apte MG (2003) Indoor air qaulity, ventilation and health symptoms: ananalysis of existing information. Indoor Air 13(1):53–64.
EN 15251 (2007) Indoor environmental input parameters for design and assessment of energy
performance of buildings addressing indoor air quality, thermal environment, lighting and
acoustics.
Euleb (2007) European High Quality Low Energy Buildings, EC-supported project. http://www.
learn.londonmet.ac.uk/packages/euleb/en/home/index.html
Fanger PO, Melikov AK, Hanzawa H, Ring J (1988) Air turbulence and sensation of draught.
Energy and Buildings 12(1):21–39.
FISIAQ (2001) Classification of Indoor Climate. FISIAQ Publications, Espoo (in Finnish).
Fisk W, Seppänen O (2007) Providing better indoor environment quality brings economic benefits.
WellBeing Indoors Clima 2007 10–14 June Helsinki Finland. Proceedings of Clima 2007.
Hill N, Brierley J, MacDougall R (1999) How to Measure Customer Satisfaction? Gower
Publishing Ltd, Hampshire
Hongisto V (2005) A model predicting the effect of speech of varying intelligibility on work
performance. Indoor Air 15(6):458–468.
Hwang RL, Cheng M-J (2007) Field survey on human thermal comfort reports in air-conditioned
offices in Taiwan. Open Constr Build Technol J I: 8–13.
ISO 7730 (2005) Ergonomics of the thermal environment – Analytical determination and inter-
pretation of thermal comfort using calculation of the PMV and PPD indices and local thermal
comfort criteria. ISO Standard 7730.
Juslen H (2007) Lighting, productivity and preferred illuminances – field studies in industrial
environment. Dissertation Helsinki University of Technology. Department of Electrical and
Communication Engineering Lighting Laboratory. Report 42.
Kosonen R, Kajaala M (2008) Perceived IEQ conditions. Indoor Air 2008, Copenhagen.
Melikov A, Pitchurov G, Naydenov K, Langkilde G (2005) Field study on occupant comfort and
the office thermal environment in rooms with displacement ventilation. Indoor Air 2005.
Mendell MJ, Heath GA (2005) Do indoor pollutants and thermal conditions in school influence
student performance? A critical review of the literature. Indoor Air 15(1):27–52.
Schiller G (1990) A comparison of measured and predicted comfort in office buildings. ASHRAE
Trans 96:609–622.
Schiller G, Arens E, Bauman F, Benton C (1988) A field study of thermal environments and com-
fort in office buildings. ASHRAE Trans 1988 94(2):280–308. American Society of Heating
Refrigerating and Air Conditioning Engineers.
Takki T, Virta M (2007) A systematic method for improving indoor environment quality through
occupant satisfaction survey. WellBeing Indoors Clima 2007 10–14 June Helsinki Finland.
Proceedings of Clima 2007.
Wargocki P, Bakó-Biró Z, Clausen G, Fanger PO (2002) Air quality in a simulated office envi-
ronment as a result of reducing pollution sources and increasing ventilation. Energy Build
34(8):775–783.
Wargocki P, Wyon P (2006) Research report on effects of HVAC on student performance.
ASHRAE J 2006(48):22–28.

88 R. Kosonen et al.
Wargocki P, Wyon DP, Matysiak B, Irgens S (2005) The effects of classroom air temperature andoutdoor air supply rate on the performance of school work by children. Indoor Air Beijing the10th international conference on indoor air and climate, vol. I (1):368–372.
WHO (1985) Adopted by the international health conference, New York, 19 June–22 July 1946,with amendments adopted by the 20th, 26th and 29th World Health Assemblies, 1975, 1977and 1984. World Health Organization Geneva.
Wood JE (1989) Cost avoidance and productivity in owning and operating buildings. Occup Med,State Art Rev 4(4):753–770.
Zagreus L, Huizenga C, Arens E, Lehrer D (2004) Listening to the occupants: a web–based indoorenvironmental quality survey. Indoor Air Suppl 14(8):65–74.

Chapter 5
Sick Building Syndrome from the Perspectiveof Occupational and Public Health
Hülya Gül
5.1 Introduction
Sick building syndrome (SBS) is a term used for a constellation of findings causeddue to indoor air quality (Burge 2004; Joshi 2008). In developed countries, indoorair quality attracts attention as a public problem of importance for a long time.Considering the fact that too many people are potentially under risk, SBS is amongthe issues of first priority to be dealt with. Indoor air is regarded as more reliablethan the outdoor environment for a long time due to the air contamination of out-door environment and unsuitable climatic conditions. Yet indoor concentration ofcontaminants could be more than those of outdoor environment. Especially, operat-ing building ventilation and air conditioning systems at half capacity due to energyconservation after the energy crisis occurred in 1970s facilitated the health prob-lems caused by on ambient air to emerge. During this period, deviation from naturalproducts started and slat, synthetic fibbers and plastics replaced wood, marble andnatural fibbers. These new products are the end products of petroleum and mostof these could disperse in the indoor air and accumulate. Only through the stud-ies conducted in 1980s, the negative effects of indoor air on human health due toconstruction and cleaning materials, paint materials and residues appearing by heat-ing were noticed (WHO 1984; WHO 1989). WHO indicated in published reportsthat people today spent most of their time in indoor environments and sick build-ing syndrome was recorded in 30% of the newly constructed or restored buildingsin average (Bruce et al., 2002). In 1990s, the problem became more complex dueto the increase in prefabricated house construction and construction material usageand the fact that computers became widespread. Applying energy conservation forvarious reasons caused that infrastructure and frame of the buildings became cold.Thus, a series of dependent factors affect the quality of inhaled indoor air. Today,both employed and non-employed persons spend almost two thirds of their lifetime
H. Gül (B)Istanbul Medical Faculty, Public Health Department, Istanbul University, 34093 Capa-Istanbul,Turkeye-mail: [email protected]
89S.A. Abdul-Wahab (ed.), Sick Building Syndrome,DOI 10.1007/978-3-642-17919-8_5, C© Springer-Verlag Berlin Heidelberg 2011

90 H. Gül
indoors such as workplaces, schools, official buildings, shopping centres and vehi-cles. One of the important environments where artificial atmospheric conditions areprovided is the workplace.
Ramazzini known as the founder of occupational diseases had defined the fac-tors affecting the quality of air in the workplace inhaled by the employees and thefindings regarding contaminants and dangerous dusts in eighteenth century for thefirst time (Gochfeld 2005). Constantly changing living conditions allowed build-ing technologies to improve. While the needs remained limited in the past such ashaving shelter, being protected and ensuring privacy, it gained importance todayto construct indoor buildings to meet the demands of physical and psychologi-cal comfort increasing in parallel with the opportunities provided by technologicaldevelopments. One exposes to various biological and chemical contaminants in allthese environments due to the structure of the buildings, production or living habitsand similar reasons. While people spend 16–24 h/day in advance in indoor environ-ments, they spend approximately 2 h/day in outside environments. Thus, most of theexposure with dangerous gases and particles occur in indoor environment. In numer-ous studies carried out, it has been recorded that the level of the indoor contaminantsare higher than the contaminants found in outside environment. The measurementsaccomplished by the American Environmental Protection Agency (EPA) show thatthe poor indoor air quality in modern buildings isolated from the outside environ-ment is more dangerous when compared with outside air quality, which is thoughtto be contaminated. However, the reason for this effect not being cared sufficientlyis that the effects regarding indoor air contamination take time to emerge and do notendanger life directly or in short term.
Problems regarding indoor air quality are met ever-increasingly in parallel withthe increase of the environmental pollution caused by the developing industrial-ization (Özyaral et al., 2006, Gül et al., 2009). Indoor air is regarded as the airfound in housing, unindustrialized workplaces and public buildings (school, hospi-tal, etc). According to ASHRAE (American Society of Heating, Refrigerating andAir-Conditioning Engineers) standard, acceptable indoor air quality is explained asfollows: Air where no known contaminants in dangerous concentration levels spec-ified by public authorities are found and 80% or more of the people living withinthis air feel not dissatisfied with the air quality (ASHRAE 1989; 2001). Indoor envi-ronments should meet the primary needs of the people regarding the health care,protect the people within from excessive cold and heat and receive adequate sun-light. The indoor air should be always clean. If the quantity/amount and diversityof tools, devices and other equipments found in office work environment are notin a certain condition, the indoor atmosphere could be contaminated easily. Moreapplication of synthetic materials when constructing a building, the increase in thenumber of people working in the offices and presence of more competition and stressin the work environment contribute to the increase of SBS. Indoor air in buildingsused continuously or in deterministic periods, which we define as indoor atmo-sphere, could be contaminated by very variable cross effecting independent factors.As well as these atmosphere contaminants could be originated from atmosphere ofthe outside environment, they could also be originated directly in the building itself.

5 Sick Building Syndrome from the Perspective of Occupational and Public Health 91
To observe dangerous biological, physical and chemical factors affecting the humanlife negatively in housings and other indoor buildings such as carbon monoxide,sulphur dioxide, nitrogen oxides, formaldehyde, cigarette smoke, radon, asbestos,lead, volatile organic molecules, various microorganisms and allergens is definedas indoor contamination (Chao et al., 2003; Akpınar-Elci 2008). The prevalence ofthese contaminants in indoor air depends on the building properties, material usedwhen constructing the building, heating system, ventilation condition, work car-ried out inside the building and the ways of behaviour of the people living inside.Though it has been asserted that being exposed to low-level chemical agents gen-erates a strong neurological inflammatory response, it has been put emphasis onparticles and physical factors as well. Considering all of these factors, insufficientventilation seems to be the most important factor.
Public buildings in which the people live or use as a school with the purpose ofsport, cultural and social activities and most of the offices at which the people workare exposed to mould invasion causing severe risk for the human health as a resultof mould contamination emerged depending on environmental moisture and relativehumidity (Gelincik et al., 2005; Issever et al. 2002). The relationship between build-ings with moisture and developing symptoms is indefinite. Bacteria, viruses, fungiand fungal spores, insects and insect faces, animal wastes and pollens originatingfrom the plants, which are found in indoor environment, may have pathogenic,toxicogenic and allergic effects. The building getting sick affecting rapidly byhumidity/heat/pressure/ventilation factors provides a basis for any microorganismsto settle carried from the outside environment inside the building. Microorganism(s) getting a chance to live in a suitable environment grow at the places, where theyare localized. Especially ground floors, dark and airless storerooms, places underthe stairs, roof and attic; water, electricity and other sanitary fitting canals; placeswith high humidity such as bathrooms, showers and kitchens, moist or wet floorsand rooms are very suitable environments for microorganisms to grow, especiallymould, yeast and some other bacteria.
Depending on inadequacy of indoor air quality due to aforementioned and simi-lar factors, sick building syndrome with unknown cause may emerge, which coulddevelop in more than one person sharing the same environment. As the result ofmany studies conducted, it has been reported that the indoor air quality has accel-erated diseases observed, even if not the only cause, and aggravated these (Gület al., 2007). This disease especially affects upper respiratory tract and developswith symptoms resembling those of seen in some allergies and flu such as eye red-ness, burning or itchy eyes, nasal congestion or rhinorhea, sore throat, headache,concentration difficulty, fatigue and dry skin. Another disease emerged dependingon exposure to indoor contaminants is Building-Related Illness (BRI), of whichcause is known (Fischman 2007). The most important difference separating the BRIfrom SBS is that their symptoms could be identified clinically and their causes areexplicit. Complaints included in the group of BRI, in contrast to SBS diseases doalso continue after the person has left the building. It is like the clinically diag-nosable, identifiable diseases with known causes that could be treated (infection,immunological or allergic) such as Asbestosis, Legionnaires’disease, Pontiac Fever

92 H. Gül
and chemical allergies. One could complain from both SBS and BRI at the sametime. Multiple chemical sensitivity (MCS) is another syndrome, which is similar toSBS (Arnold et al. 2006). The people with MCS are allergic people showing highsensitivity against the chemicals in the environment. Scent sensitivity is one of theprecise causes of the condition associated with MCS.
Considering that employees working in modern office buildings make up 50%of the total labour force in industrialized countries and that 20–30% of this grouphave reported symptoms similar to SBS, it could not be denied that SBS should beevaluated as an important issue of occupational medicine. Regarding public health,SBS is of importance due to the fact that it has effects on labour productivity as wellas causing health problems. Epidemiologic studies, though asserting some factorsrelated to SBS, it is generally evaluated as a multi-factored health problem and amedical, psychological and social case.
5.2 Etiology of SBS
No single environmental factor or a group of factors is defined for the cause ofSBS; however there are numerous theories presented regarding this issue. It isthe best to consider SBS as multifactorial in the absence of any basic theory.Studies conducted put emphasis on the fact that combination of the contaminantsin inhaled air of indoor atmosphere has effects on symptoms or on combinationof symptoms (Ezzati 2005). Indoor air contamination may depend on the internalcondition of the building and also occur due to the effect of outdoor conditions(Myers and Maynard 2005). Possible reasons for SBS are physical (for ex. ven-tilation rate, illumination, sound, noise), chemical (for ex. smoking, hanging orstable dust, carbon dioxide, carbon monoxide, nitrogen oxides, sulphur dioxide,volatile organic compounds, pesticides), biological (e.g., bacteria, mould), personaland psychosocial factors (e.g., gender, age, allergies, stress, dissatisfaction withwork, place lived in, genetic predisposition, environmental smoking) (ASHRAE2003c, Kubo et al., 2006; Mahmoudi and Gershwin 2003). Mostly, volatile organiccompounds, radioactive elements, non-persistent gases and formaldehyde found inmany environments affect the air quality inhaled. Apart from that some factors arerelated to the symptoms emerging, for instance, being exposed to activities suchas constantly photocopying with copy paper including carbon in an unchangingenvironment (Jaakkola et al., 2007). The effect of psychological factors on build-ing related illnesses could not be disregarded (Magnavita et al., 2007). There areresearchers reporting that SBS emerges as a result of a reaction against the work-place rather than being simply a disease (Marmot et al., 2006; Mendell and Fisk2007). Psychosocial atmosphere in the workplace partially affects the prevalenceof SBS and resolution of related problems (Gomzi et al., 2007, Hansen et al.,2008).
One of the psychosocial factors that are thought to be effective in the develop-ment of Sick Building Syndrome is monotonous work environment. Monotonous

5 Sick Building Syndrome from the Perspective of Occupational and Public Health 93
work means being overloaded psychologically due to constantly repeating activi-ties or tasks. Employees could not be satisfied also mentally due to psychologicalmonotony. At present day, more than 700,000 chemical agents are in daily use.Chemical contaminants in indoor air could be originated from the outdoor or indoorenvironment. Moderate amount, even very low amount, of these contaminants maycause health problems in some people having certain sensitivities. Dust is associ-ated with SBS as well. Dust irritates mucous membranes. Biological contaminantssuch as pollens, bacteria, viruses and moulds may pass through ventilation systems(Straus 2009).
5.2.1 Air Quality Parameters
It is of great importance that the employees work in healthy standards in theirworkplaces, where they spend at least 8 h/day. Accordingly, some factors that havebeen held responsible for the development of SBS are as follows (ASHRAE 2003a,Soysal and Demiral 2007).
Formaldehyde (HCHO): Formaldehyde is an organic compound found in mostindoor environments. Usually urea-formaldehyde adhesives are used in floor cov-ering and in pressed wood products for walls and ceilings. In low concentrations,it causes lacrimation and upper respiratory tract irritation, whereas in high concen-trations, it leads to lower respiratory tract irritation and pulmonary edema. It maytrigger asthma attack in people with asthma. Another effect of formaldehyde ison the central nervous system. It may cause short-term memory loss and anxiety.Indoor environment value for formaldehyde should not exceed 0.065 ppm. Whenreached 0.1–0.5 ppm, it leads to earache, nasal mucosa irritation, difficulty in breath-ing, complaints of cough and asthma, cardiac complaints, dizziness and difficultyin memorizing. International Agency for Research on Cancer (IARC) classifiedformaldehyde as group 2A carcinogen.
Carbon monoxide (CO): For carbon monoxide, air standard of outdoor envi-ronment should guide indoor environment. Maximum carbon monoxide dose to bereceived in outdoor environment in 1 h should not exceed 25 ppm. Main source ofcarbon monoxide inside the building is the exhaust smoke diffusing through into thebuilding and smoke spreading from the ovens with poor ventilation system. WHOand EPA recommend 9 ppm as the highest value for carbon monoxide to be allowedin indoor air.
Carbon dioxide (CO2): Usually, indoor carbon dioxide levels are higher thanoutside due to the fact that every living thing give off carbon dioxide into the air byrespiration. Carbon dioxide concentration above 1,000 ppm is indicative of insuf-ficient ventilation and this causes complaints of headache, nausea, eye and throatirritations in the employees. WHO and EPA recommend 1,000 ppm as the highestvalue for carbon dioxide to be allowed in indoor air.
Ozone (O3): Devices in the office are the most important factor for ozone gas tospread into the environment and when the amount of ozone is above this standard
94 H. Gül
limit, symptoms of sick building syndrome such as eye and throat pain, headache,etc. are observed in the employees. British Allergy Foundation (BAF) has demon-strated that the prevalence of diseases such as fatigue, insomnia, eye and throatpain, allergy and asthma is 94% due to the spread of ozone through photocopiers,fax machines and printers. Standard value for ozone should not exceed 0.06 ppm(0.12 mg/m).
Oxygen (O2): All living things regularly require oxygen to survive. Living thingsmeet their need for oxygen through atmospheric air. Human beings must inhale4.76 m3 atmospheric air for 1 m3 oxygen due to the fact that oxygen is foundin approximately 21% of atmosphere. If the oxygen level falls below 21% in theinhaled air, respiration and blood circulation accelerates, blood pressure increasesand symptoms regarding headache and fatigue begin to emerge in a short time periodin people working in such places.
Nitrogen dioxide (NO2): It includes gases such as nitrogen monoxide and nitro-gen dioxide emerging due to the combustion. If nitrogen dioxide is present in anyplace, probably, other nitrogen oxides (such as NO, N2O3) are available as well.It causes irritation in mucous membranes, chronic pulmonary disease, asthma andleads to death in the concentrations above 150 ppm.
Volatile Organic Compounds (VOCs): These chemical agents are commonlyused in numerous construction materials such as paint, polish, carpeting, artifi-cial wooden panels, some insulating materials, and various decoration materials,in home products industry, furniture and in some cosmetic cleaning products aswell. Volatile organic compounds being colourless but odorous spread out into theenvironment during the application of the products and could accumulate in theenvironment in certain amounts. Therefore, it is reported that, especially in smalland not sufficiently ventilated places, the level of volatile organic compounds ishigh. In the studies conducted by Environmental Protection Agency (EPA), it hasbeen determined that people could face very high levels of contamination whenusing these kind of products with organic content and this contamination could lastfor a very long period. Yet as the result of studies of similar characteristics, it hasbeen reported that in some cases, such kinds of organic compounds could be found2.5 times more in indoor environments than in outdoor environments. Discharge ofvolatile organic compounds (VOCs) is high especially due to the new material, highindoor temperature and humidity; however it could be possible to reduce concen-tration by sufficient ventilation. Volatile organic compounds (VOCs) have effectson human health depending on their level in indoor environment (Glas et al., 2008).In persons coming into contact with 2–3 ppm or less amount of volatile organic com-pounds, allergic reactions such as irritation in eye, nose and throat may develop.When exposed to 4–5 ppm, more severe reactions may emerge and loss of mem-ory, sneeze and rushes may also develop. When exposed to 10–20 ppm, breathingdifficulties and burning in eyes, nose and throat could develop. Especially peoplesuffering diseases like asthma are more sensitive to these compounds and such com-pounds could initiate asthma attacks in these kinds of patients. Because they alsohave carcinogenic effects, it should be laid further emphasis on these compounds.
Particulate Matter (PM2.5): Particulate matters could be in particulates and also inliquid droplets. Usually, they emerge as combustion products. They trigger asthma

5 Sick Building Syndrome from the Perspective of Occupational and Public Health 95
attack in people suffering asthma and may cause nasal and upper respiratory tractirritation. Though no internationally accepted standards for PM2.5 have been speci-fied by WHO and EPA yet, the recommended value is 35 µg/m3 and 50% more forindoor air.
Humidity: In compliance with ASHRAE standards, it is estimated that the rel-ative humidity in indoor air should be between 30 and 60%, and better around45% regarding the health. Humidity level that is below 35% in work environmentcauses dry eye, problems related to respiratory system and an increase in tendencyto infections. Moreover, low humidity levels leads to a higher prevalence of nasalsymptoms. In the studies conducted, it has been determined that dermal symptomsare increased more in low humidity levels. People are not very sensitive to thehumidity level between 40 and 70%. This level of humidity could be tolerated bypeople. On the other hand, high levels of humidity provide a basis for the develop-ment of pathogenic and allergic organisms like fungi. Furthermore, as the humiditylevel increases, the felt temperature increases as well. According to ASHRAE, whenat least 80% of the building employees complain about thermal discomfort, a prob-lem regarding indoor environment should come to mind. It is known that this factcauses some severe symptoms considering the health. In the environments with arelative humidity more than 65%, it gets harder to control the human body temper-ature and this high level of humidity encourages the reproduction of bacteria, fungiand production of allergenic dusts in the home (mites). As for low level of relativehumidity, it causes mucous membranes to dry and an increase in dermal diseases.
Temperature: When other indoor conditions are suitable, the indoor tempera-ture should be between 18 and 24C for healthy people. If employees present inthe room feel that air temperature, humidity, air velocity and the temperature ofthe surfaces surrounding the room are most suitable, then, the thermal comfort isestablished. Though studies on Sick Building Syndrome could not present a preciseresult, the best performance from the employees is acquired between 19 and 20C(ASHRAE 2003b). National Institute for Occupational Safety and Health (NIOSH)recommends that the temperature should not exceed 26C for men and 24C forwomen. In some sources, the suitable temperatures recommended are 20–24Cfor winter and 22–26C for summer. In the report of European Commission, it isindicated that the temperature between 20 and 26C provides a suitable work envi-ronment. Again in the same source, it is implied that in a study carried out, theprevalence of SBS symptoms increases significantly above 22C. Besides, evidencesupporting this fact is the increase of gas discharge from building materials in hightemperatures.
5.3 Symptoms of SBS
To diagnose SBS is more difficult when compared with other diseases (Niemeläet al., 2006, Norbäck 2009). Though their health worsen, the people having SBSsymptoms continue to work due to the fact that no definitive diagnosis for thisdisease is established; however their efficiency in private and business life fallsdown. This creates an important public health problem. When a patient applies to
96 H. Gül
a physician due to typical SBS symptoms (headache, fatigue, dizziness, nausea,nasal congestion or flow, dry cough, dry skin, itchy skin, itchy eyes, lacrimationand concentration difficulty, etc.), it is of critical importance to take a complete andproper anamnesis (Rios et al., 2009, Runeson et al., 2006). If no medical diagnosisis available to define these emerging symptoms, the physician should ask the properquestions to establish a SBS diagnosis. The most important question is the relation-ship between the time spent in the workplace and these symptoms. For instance, ifan office employee has not suffered this syndrome until changing his/her place inthe building or office, than the new office place is to blame. To define Sick BuildingSyndrome, we do not have any diagnostic or clinical tests and analysis methods atour disposal regarding the issue. Medical authorities still discuss the issue whetherSBS is a genuine diagnoses of a medical case. That is because most of the symp-toms are subjective reports and could not be measured easily. Even in some casesreported, some professionals deny its existence due to the fact that results of mea-surements of suspicious chemical agents and others in sick buildings are below thelimits.
Additionally, as no symptoms are recorded for other people in the building, onlypeople excessively sensitive to very low level of VOCs report disease. For this andsimilar reasons, SBS usually could not be defined and a false diagnosis is estab-lished. Diagnosis is established depending on patients’ history, physical and clinicalfindings at first. Rarely, laboratory and imaging methods confirm the complaints.Later, the building should be examined completely with the personal complaintsof its inhabitants. A person suspecting he/she has had SBS may ask whether thebuilding has been investigated regarding possible contaminants. Occupational healthspecialists specially trained in this subject should perform a walkthrough by exam-ining the existence of common SBS symptoms and problematic areas among thepeople living in the building with an intention to check the buildings suspicion forbeing sick. If some of the inhabitants of the building complain about symptomssimilar to SBS and the building has problems such as overpopulation, contamina-tion, insufficient ventilation or humidity, the researcher should make suggestions toimprove the indoor air quality of the building. To determine the level of exposure tothe factors dangerous for health in indoor environment is a hard job to do (Haliosand Helmis 2007). The possible interaction between these compounds makes thistask more difficult. If the individual affected could not leave the building or theoriginating cause for the disease could not be eliminated, to treat SBS symptomsindividually may help to overcome this disease.
Similar tests conducted to determine the origins of allergic sensitivity of somepatients with MCS may also help patients with SBS symptoms, of which exactsource is not known. Attempting to reduce stress may also help to decrease andcope with SBS symptoms. If the environmental problems could not be amended,the individual should decide how to prevent SBS in its main source at best. Whengot suspicious of SBS once, the building should be assessed as a possible sourceof problem and necessary improvements should be accomplished. In the reportedprevalence of SBS, there may be gender differences because women tend to reportsymptoms much more than men (Brasche et al., 2001).
5 Sick Building Syndrome from the Perspective of Occupational and Public Health 97
Besides, there are studies concerning that women have a more sensitive immunesystem, that they are much more concerned about their health and are more prone todevelop dry mucosa and facial erythema. At the same time, it could be claimed thatwomen are exposed to indoor environmental factors much more due to the fact thatthey are more inclined to work at office jobs, where office equipments and materialsmuch intensely used. When risks causing diseases in developing countries are listedas a result of the studies conducted, it is recorded that indoor air contaminants takethe 8th place in the list. In the case that indoor air quality exceeds the specifiedlimits, it affects especially the sensitive people negatively. It is estimated that indoorair contaminants cause globally 1.6 million death and 2.7% DALYs (Disability –Adjusted Life Years) (WHO 2005, Smith and Mehta 2000).
Not everyone working in a sick building has to develop a disease. This caseaffects especially the people more negatively, who are under risk regarding cardiacand respiratory tract diseases. Physical conditions of people in the place where theylive are extremely important for sick building syndrome to emerge. This syndrome isa clinical case characterized with multiple symptoms. Though everybody is affectedby the factors effective in the same conditions, the emerging symptoms will not besame. Among reported symptoms, there are headache, eye irritation, nasal bleed-ing, nasal and sinus congestion, cough, cold and flu-like symptoms, several diseasesincluding gastrointestinal complaints and generally developing complaints regard-ing respiratory system. Course of disease occurs depending on a series of extremelycomplex factors. Quality of workplace makes sense when occupational characteris-tics, environmental conditions, stress and sensitivity of the individual come together.If the symptoms disappear when the person, in whom the syndrome develops, leavesthe building, this fact is a direct indication of the relationship between the personand building (Takigawa et al., 2009). It is very useful to keep a daily symptom login every 2 h for every day spent at work in a table divided into 7 days, includingthe weekends, the time period when it is not worked. Multiple symptoms couldbe observed in this syndrome (Bobic et al., 2009, Eriksson and Stenberg 2006).Symptoms can be divided into the following categories:
• Mucous membrane irritation: Eye irritation, throat irritation, cough, dry skin, dryeyes, dry nose and/or dry throat.
• Neurotoxic effects: Headache, fatigue, loss of concentration, feeling constantlytired, headache or general appearance/condition proposing ailment/malaise.
• Respiratory symptoms: Allergic symptoms such as difficulty in breathing, cough,wheezing, lacrimation or nasal flow, symptoms like feelings of chest constriction,chest congestion and chest compression.
• Dermal symptoms: Rash, itchiness, dryness.• Chemical-sensory changes: Increased or abnormal scent perception, visual
disorders.
From the viewpoint of healthy life and life quality, opinions about the building andthe emerging problem could be divided into two main sections.
98 H. Gül
• Building Related Symptoms (SBS)• Building Related Illnesses (BRIs)
Building related symptoms are some non-specific annoying/discomforting problemsmostly effecting eyes, nose and throat (Allermann et al., 2007, Murphy 2006).Clinical diagnosis of symptoms established by physicians is to define buildingrelated illnesses (BRIs) (Muhic and Butala 2004). A very long hidden or asymp-tomatic period is required to last until BRIs emerge. For instance, like the latentperiod of time passing for the lung cancer to emerge in a person exposed to radon,which is found in indoor atmosphere. Legionnaires’ disease – one of the BRIs –appears among building inhabitants as the result of the contamination of coolingtowers with legionella bacteria. Legionella is responsible for Pontiac Fever as well.The disease is not contagious in nature. Patients show flu-like symptoms. Apartfrom all of these, building related illnesses could be grouped only after the symp-toms related to the disease has revealed. The treatment of BRIs and the recoveryperiod cover a long time period. Usually, emerging problems become chronic inthe person living in sick building exposed to these kinds of diseases. Even if thebuilding is left or the environmental conditions are organized or bettered, symptomsdepending on problems do/could not immediately vanish (Brightman et al., 2008).Accordingly, BRIs could be divided into three main groups.
• Toxic diseases (Ex.: Carbon monoxide poisoning)• Infectious diseases (Ex.: Legionnaires’ disease)• Allergic diseases (Ex.: Asthma, hay fever or delayed type hypersensitivity
pneumonitis)
5.4 Precautions of SBS
There is no effective and specific proven treatment to eliminate SBS. Many special-ists come to agreement about the fact that the best treatment for SBS is to avoid it byabolishing contaminants asserted to be the cause of SBS and other identified sources(Edvardsson et al., 2008, Lahtinen et al., 2009). The people with SBS should beencouraged about protecting themselves from the building related factors that makethem sick. However, this is not always possible because it could lead to insulationand job loss. It is difficult to investigate and evaluate the aforementioned problemsobserved in indoor air quality due to the issue is comprised of many aspects. Mostlyreported symptoms and health complaints are different and they are not that muchcharacteristic so as to be attributed to any specific medical diagnosis or causal fac-tor easily. Considering these factors and their results, air quality of the workplaceenvironment should be maintained as high as possible to ensure the sustainability ofpsychological and physiological health of the employees as well as to provide jobsatisfaction and efficiency. Existing problems should be resolved by determiningpossible sources of contamination. Due to the fact that high prevalence is indicative

5 Sick Building Syndrome from the Perspective of Occupational and Public Health 99
of potential building related problems, to calculate the prevalence of building relatedsymptoms with an intention of characterizing indoor air quality in the offices is afrequently applied method. Sick building syndrome questionnaire frequently usedwhen resolving problems related to indoor environment that require a systematicstudy is the most important element of the detailed process carried out by occupa-tional health specialists to explain and evaluate risks (Lahtinen et al., 2004, Reijulaand Sundman-Digert 2004).
The questionnaire to be applied is a convenient tool for the investigation of airquality problems inside the building to be carried out by occupational health person-nel and quality of data acquired from the investigation could be taken as a referencewhen analyzing the health problems emerging at work. To be able to attain a resultperforming a successful treatment in this case, which is quite complex to understand,it is reported in the studies conducted that analysis for determining the environ-mental air quality and that the living spaces being asked in detail besides takinganamnesis when examining the underlying reason of emerging diseases, are a must.Preventing SBS starts with an appropriate design and building maintenance. Specialattention must be given to heating, ventilation and air conditioning (HVAC) systems(Fisk et al., 2009, Mendell et al., 2008). WHO has specified rules regarding regularinspection and maintenance for proper management of building ventilation systemsas well as rules preventing the penetration of biological contaminants inside thebuilding. Moreover, to design the buildings appropriately for minimizing the accessof the contaminants, to inspect older buildings for possible VOCs and to betterpotential problems may prevent SBS observed among the inhabitants of the build-ing. Education and communication are basic for effective air quality managementof any building.
Questions concerning hygiene and maintenance principles that should beanswered to prevent the buildings from being sick could be listed as follows: Is thebuilding being cleaned sufficiently? Are the properties, materials and shelves beingconstructed in compliance with humid/wet hygienic principles to minimize the dustin living spaces? Are there personnel responsible for the cleaning and maintenanceof ventilation systems of the building? Is a regular method being applied for mainte-nance? Are all necessary sections such as cooling towers, evaporation based coolingsystems, drop collection tables/sections, air canals, filters, humidifiers, etc. beingcleaned regularly and are leaking, cracked, burst, hollow parts checked? If we couldanswer yes to the questions asked above, problems are minimized. If our answersinclude no, some problems await us regarding building sickness. We require makingadjustments in shortest time so as to correct our answers as yes. To provide the nec-essary ventilation in indoor environments is determined as the task of the employer.For this, it will be to the point to perform following suggestions.
An effective protection method that could be used especially in multi-storeybuildings is cleaning central system devices and indoor air, which is an expensiveprotection method compared to other methods. Air intakes of the building should beconstructed far away from the road and other sources of contamination. Filters withhigh effectiveness should be used in ventilation systems. Behavioural education isan important protection method as well. Ergonomic precautions should be taken.

100 H. Gül
Noise is also perceived to be an important problem by the employees. It should bepaid attention to the insulation problem. More importance should be attached to thehygiene of general environment. Ventilation is the leading precaution to be takenin order to prevent indoor air contamination. The easiest way to maintain the oxy-gen level in enclosed volumes in natural conditions at the required level regardingthe health aspect is to perform natural ventilation. The air, which is contaminated(carpet pile and clothing fluff, smell of perfume and sweat, etc.) and of which oxy-gen level is reduced due to the usage, is expelled out into the atmosphere and freshuncontaminated (passing through the necessary filter systems) air with high oxy-gen level is taken in. This is one of the most important conditions of human healthand efficiency. To ensure the necessary ventilation in indoor environments of theworkplaces and to set up a warning system to become activated in the case thatthe ventilation system does not operate are defined in the laws as the task of theemployer.
Furthermore, it should be considered that following and similar risk factorsrelated to SBS could pose problems:
1. That the employees use computer more than 5 h daily, up to 8–10 h. Commonusage of computers increases heating and electromagnetic radiation load ofthe buildings. At the same time, this temperature causes the relative humidityinside the building to decrease. Hence, precautions such as arranging shift hoursof the personnel that are constantly working on computers may be effective.It is recommended that the cleaning of the computers is carried out at frequentintervals.
2. Too much employees working together at the same department create a problemas well. There are at least 10–15 people in 100 m2 in advance working togetherat the same department in the buildings in generally. In fact, at most seven peopleshould be present in an area of 100 m2.
3. Presence of problems regarding building maintenance (air conditioning devicesand fans should be cleaned once every 3 months or more frequently, gen-eral maintenance should be performed and air circulation capacities should bechecked constantly).
4. Insufficient ventilation (in a non-smoking environment, ventilation should bebetween 7 and 12 Litter per individual in an hour).
5. Use of materials made up of compounds with high evaporation and toxicity (newcarpets and soft floor coverings should be cleaned off volatile substances beforeinstalled in the building).
6. Presence of open shelves in voluminous areas or leaving papers exposed(Materials such as files, books, papers, newspaper, etc. found in office environ-ments should be kept in enclosed cabinets).
7. To prevent dust, solvent and ozone discharge from devices such as printersor photocopiers, all operating stages of these devices should be completedwithin the device itself. If possible, building a separate enclosed room, it shouldbe ensured that photocopying and similar procedures are carried out in thatroom.
5 Sick Building Syndrome from the Perspective of Occupational and Public Health 101
5.5 Conclusions
Today numbers of people living in big cities are increasing every day and majority ofthese people spend most of their time working in indoor environments. Occupationalhealth includes studies to maintain and improve well-being of people working in allkinds of professions in terms of physical, mental and social aspects. It is possi-ble to talk about mainly two groups of factors determining the health status of aworking individual. These are avoidable environmental factors found in workplaceenvironment and personal characteristics of an individual.
We are confronted with indoor air contamination and its effects on human healthas a problem threatening public health more and more. Though the sick buildingsyndrome does not threaten life, it is uncomfortable. It causes loss of labour forceand efficiency and may cause serious health concerns. In the whole world, the impor-tance attached to the indoor air quality is increasing day by day. Indoor air qualityhas gradually become the basic criterion for healthy comfort and standards havebeen developed regarding this issue. Especially in this period of time, when resi-dences like skyscraper have increased, it should be given priority to instructionalprograms such as aiming at maintaining indoor air quality, applying smoking pro-hibition in indoor environments without making any concessions and ensuring theproper choice of heating systems, ventilation systems and construction materialsand legal regulations should be made. To ensure the sustainability of the healthof the employees and at the same time job satisfaction and efficiency of them, itshould be tried to keep the air quality of the workplace environment as high aspossible.
Indoor air problems in the workplaces are among the issues that should be consid-ered frequently by occupational health specialists when evaluating the health risksin a work environment. A good quality of indoor air has an important effect onthe health of the employees and on ensuring positive social atmosphere in the work-place and an increase in production in the offices. Education and communication areimportant elements in therapeutic and preventive management programs regardingindoor air quality. If the people present in the building, workplace physicians, man-agers and engineers completely know and understand the causes and importance ofindoor air quality problems, they could collaborate more effectively in resolving andpreventing the problem at source. If the sources are known and possible to control,then eliminating or changing the source of contamination is an effective approachto be taken in indoor air quality problems.
Because there are no special methods available yet implying a relationshipbetween SBS and possible risks, the precautions to be taken are not known inthe same way. Standard epidemiology and industrial hygiene evaluation techniquessometimes could not help as well. It is also an important public health concernrequiring the collaboration of the people from the various fields of study such asphysicians, epidemiology specialists and engineers. This awareness is also of impor-tance regarding its influence on the effectiveness at work in the workplaces besidesattaching importance to the human health, comfort and satisfaction of the individualwith the building he/she is present. As well as higher efficiency and less job loss

102 H. Gül
could be provided by the improvement of the indoor air quality, economic lossesemerging due to medical treatments could be also prevented. New living conditionsand new environmental conditions created will continue to cause the development ofthis problem and other similar problems. However, it is possible to avoid this diseaseby means of good adjustment and proper planning and by taking our environmentunder control on a regular basis.
References
Akpinar-Elci M, Siegel PD, Cox-Ganser JM, Stemple KJ, White SK, Hilsbos K, Weissman DN(2008) Respiratory inflammatory responses among occupants of a water-damaged officebuilding. Indoor Air 18(2):125–130.
Allermann L, Pejtersen J, Gunnarsen L, Poulsen OM (2007) Building-related symptoms andinflammatory potency of dust from office buildings. Indoor Air 17(6):458–467.
Arnold Liamosas PA, Arrizabalaga Clemente P, Bonet Agusti M, de la Fuente Brull X (2006)Multiple chemical sensitivity in sick-building syndrome. Med Clin (Barc) 126(20):774–778.
ASHRAE (1989) Standard 62- 1989- Ventilation for Acceptable Indoor Air Quality. Americansociety of heating, refrigerating and air-conditioning engineers, Atlanta, GA.
ASHRAE (2001) Standard 62- 1989- Ventilation for Acceptable Indoor Air Quality. Americansociety of heating, refrigerating and air-conditioning engineers, Atlanta, GA.
ASHRAE (2003a) ASHRAE handbook CD, 2001 fundamentals, chapter 12: Air contaminants,Atlanta, GA.
ASHRAE (2003b) ASHRAE handbook CD, 2001 fundamentals, chapter 8: Thermal comfort,Atlanta, GA.
ASHRAE (2003c) ASHRAE handbook CD, 2001 fundamentals, chapter 9: Indoor environmentalhealth, Atlanta, GA.
Bobic J, Gomzi M, Radosevic-Vidacek B, Kanceljak-Macan B (2009) Association of neuroticismwith sick building syndrome, quality of life and psychomotor performance. Coll Antropol33(2):567–572.
Brasche S, Bullinger M, Morfeld M, et al (2001) Why do women suffer from sick building syn-drome more often than men? Subjective higher sensitivity versus objective causes. Indoor Air11:217–222.
Brightman HS, Milton DK, Wypij D, Burge HA, Spengler JD (2008) Evaluating building-relatedsymptoms using the US EPA BASE study results. Indoor Air 18(4):335–345.
Bruce N, Perez-Padilla R, Albalak R (2002) The health effects of indoor air pollution exposure indeveloping countries, World Health Organization.
Burge P (2004) Sick building syndrome. Occup Environ Med 61(2):185–190.Chao HJ, Joel Schwartz J, Milton DK, Burge HA (2003) The work environment and workers’
health in four large office buildings. Environ Health Perspect 111(9):1242–1248.Edvardsson B, Stenberg B, Bergdahl J, Eriksson N, Lindén G, Widman L (2008) Medical and social
prognoses of non-specific building-related symptoms (sick building syndrome): a follow-upstudy of patients previously referred to hospital. Int Arch Occup Environ Health 81:805–812.
Eriksson NM, Stenberg BGT (2006) Baseline prevalance of symptoms related to indoor environ-ment. Scand J Public Health 34:387–396.
Ezzati M (2005) Indoor air pollution and health in developing countries. The Lancet366(9480):104–106.
Fischman ML (2007) Building associated illness. In LaDou J (Ed) Current Occupational &Environmental Medicine, 4th ed. McGraw- Hill, New York, NY.
Fisk WJ, Mirer AG, Mendell MJ (2009) Quantitative relationship of sick building syndromesymptoms with ventilation rates. Indoor Air 19(2):159–165.

5 Sick Building Syndrome from the Perspective of Occupational and Public Health 103
Gelincik A, Büyüköztürk S, Gül H, Güngör G, Issever H, Çagatay A (2005) The effect ofindoor fungi on the symptoms of patients with allergic rhinitis in istanbul. Indoor and BuiltEnvironment 14:427–432.
Glas B, Stenberg B, Stenlund H, Sunesson AL (2008) A novel approach to evaluation of adsorbentsfor sampling indoor volatile organic compounds associated with symptom reports. J EnvironMonit 10(11):1297–1303.
Gochfeld M (2005) Chronologic history of occupational medicine. J Occup and Environ Med47(2):96–114.
Gomzi M, Bobic J, Radosevic-Vidacek B, Macan J, Varnai VM, Milkovic-Kraus S, Kanceljak-Macan B (2007) Sick building syndrome: Psychological, somatic, and environmental determi-nants. Arch Environ Occup Health 62(3):147–155.
Gül H, Can G, Yurtsever E, Güngör G (2009) The health complaints of white collar workers andindoor air quality in non-industrial workplaces. Nobel Medicus 5(Suppl 1):67–73.
Gül H, Issever H, Güngör G (2007) Occupational and environmental risk factors for the sickbuilding syndrome in modern offices in istanbul: A cross-sectional study. Indoor Built Environ16:47–54.
Halios CH, Helmis CG (2007) On the estimation of characteristic indoor air quality parametersusing analytical and numerical methods. Sci Total Environ 381:222–232.
Hansen AM, Meyer HW, Gyntelberg F (2008) Building-related symptoms and stress indicators.Indoor Air 18(6):440–446.
Issever H, Gül H, Erelel M, Erkan F, Güngör G (2002) Health problems of garbage collectors inistanbul. Indoor Built Environ 11:293–301.
Jaakkola MS, Yang L, Ieromnimon A, Jaakkola JK (2007) Office work exposures and respiratoryand sick building syndrome symptoms. Occup Environ Med 64(3):178–184.
Joshi SM (2008) The sick building syndrome. Indian J Occup Environ Med 12(2):61–64.Kubo T, Mızoue T, Die R, Tokuı N (2006) Visual display terminal work and sick building
syndrome- the role of psychosocial distress in the relationship. J Occup Health 48:107–112.Lahtinen M, Salonen H, Lappalainen S, Huttunen J, Reijula K (2009) Renovation of a “sick
building”: the challenge of attaining the confidence of occupants. Am J Ind Med.52(5):438–445.
Lahtinen M, Sundman-Digert C, Reijula K (2004) Psychosocial work environment and indoorair problems: A questionnaire as a means of problem diagnosis. Occup Environ Med61(2):143–149.
Magnavita N, Ferraro P, Vincenti F (2007) Influence of work climate on the sick buildingsyndrome. G Ital Med Lav Ergon 29(3):658–660.
Mahmoudi M, Gershwin ME (2003) Sick building syndrome. III. Stachybotrys chartarıum.J Asthma 37:191–198.
Marmot AF, Eley J, Stafford M, Stansfeld SA, Warwick E, Marmot MG (2006) Building health:An epidemiological study of “sick building syndrome” in the whitehall II study. Occup EnvironMed 63(4):283–289.
Mendell MJ, Fisk WJ (2007) Is health in office buildings related only to psychosocial factors?Occup Environ Med 64(1):69–70.
Mendell MJ, Lei-Gomez Q, Mirer AG, Seppänen O, Brunner G (2008) Risk factors in heating,ventilating, and air-conditioning systems for occupant symptoms in US office buildings: TheUS EPA BASE study. Indoor Air 18(4):301–316.
Muhic S, Butala V (2004) The influence of indoor environment in office buildings on theiroccupants: Expected – unexpected. Building Environ 39:289–296.
Murphy M (2006) Sick Building Syndrome and the Problem of Uncertainty: EnvironmentalPolitics, Techno Science, and Women Workers. Duke University Press, Durham, NC.
Myers I, Maynard RL (2005) Polluted air-outdoors and indoors. Occup Med 55:432–438.Niemelä R, Seppänen O, Korhonen P, Reijula K (2006) Prevalence of building-related symptoms
as an indicator of health and productivity. Am J Ind Med 49(10):819–825.
104 H. Gül
Norbäck D (2009) An update on sick building syndrome. Curr Opin Allergy Clin Immunol9(1):55–59.
Özyaral O, Keskin Y, Erkan F, Hayran O (2006) Sick building syndrome cases behind the unknownsymptoms. TAF Prev Med Bull 5(5):352–363.
Reijula K, Sundman-Digert C (2004) Assessment of indoor air problems at work with aquestionnaire. Occup Environ Med 61(1):33–38.
Rios JL, Boechat JL, Gioda A, dos Santos CY, de Aquino Neto FR, Lapa e Silva JR (2009)Symptoms prevalence among office workers of a sealed versus a non-sealed building:Associations to indoor air quality. Environ Int 35(8):1136–1141.
Runeson R, Wahlstedt K, Wieslander G, Norback D (2006) Personal and psychosocial factorsand symptoms compatible with sick building syndrome in the swedish workforce. Indoor Air16:445–453.
Smith KR, Mehta S (2000) The burden of disease from indoor air pollution in developing countries:Comparison of estimates. WHO/USAID.
Soysal A, Demiral Y (2007) Indoor air pollution. TAF Prev Med Bull 6(3):221–226.Straus DC (2009) Molds, mycotoxins, and sick building syndrome. Toxicol Ind Health
25(9–10):617–635.Takigawa T, Wang BL, Sakano N, Wang DH, Ogino K, Kishi R (2009) A longitudinal study of
environmental risk factors for subjective symptoms associated with sick building syndrome innew dwellings. Sci Total Environ 407(19):5223–5228.
World Health Organization (1984) Indoor Air Quality Research: EURO Reports and Studies 103.WHO Regional Office for Europe, Copenhagen.
World Health Organization (1989) Indoor Air Quality Quality: Organic Pollutants. EURO Reportsand Studies 111, WHO Regional Office for Europe, Copenhagen.
World Health Organization (2005) Indoor air pollution and health. Fact sheet no: 292. http://www.who.int/mediacentre/factsheets/fs292/en/index.html.

Chapter 6
Psychosocial Factors that Aggravatethe Symptoms of Sick Building Syndromeand a Cure for Them
Nami Imai and Yoshiharu Imai
6.1 A Lack of Recognition of Sick Building Syndrome
Human beings breathe unconsciously. This means that people take oxygen into theirbody and expel carbon dioxide continuously. Therefore, they hardly recognize theexistence of air and are unconcerned about air pollution in their daily life, eventhough they may worry about water or food pollution. In fact, the mass of air thata person takes in each day is larger than the mass of food or water that they con-sume, and so poor air quality can cause many health problems. However, people donot recognize this fact. Moreover, people do not consider that they may have sickbuilding syndrome, even though they know of its existence, so they do not botherto make themselves aware of its symptoms. This is due to the fact that sick buildingsyndrome was only recently defined.
Many people have no sense how danger when they smell a toxic chemical, evenif they recognize it. People may forget that the air in their living environment isnot always safe and do not think that it may harm their health if it smells a littlestrange. For example, many kinds of antibacterial, anti-flammable, etc, chemicalsare used on the carpets in public buildings such as hotels or city halls, and some ofthese chemicals may volatilize and harm human health. The smells of these chemi-cals are peculiar but people just associate them with public buildings and so acceptthem as normal. Therefore, the first and most fundamental problem of sick buildingsyndrome is that people do not consider that the air surrounding them could harmthem.
Sick building syndrome patients get worse when they enter a building containingtoxic air and get better or become free from symptoms when they leave the building.Thus, patients begin to think that they have a problem with their constitution or achronic disease. For example, if a patient gets a headache every time they enter
N. Imai (B)Faculty of Medicine, School of Nursing, Mie University, Tsu City, Mie, Japane-mail: [email protected]
105S.A. Abdul-Wahab (ed.), Sick Building Syndrome,DOI 10.1007/978-3-642-17919-8_6, C© Springer-Verlag Berlin Heidelberg 2011

106 N. Imai and Y. Imai
a building, they think that it is because they have a chronic headache. This phaseconfuses patients. In this phase, patients wish to be cured spontaneously withoutgoing to hospital or to be cured by taking over-the-counter medicine because theydo not know that toxic chemicals in the air of their house or office or public buildingsthat they visit such as libraries or city halls harm their health and assume that theorigins of their symptoms are internal. As they suspect that their condition resultsfrom a hereditary disease or virus or is due to their lifestyle such as a lack of sleep orfatigue, they search for solutions in the wrong places and continue to breathe in toxicair and aggravate their symptoms. In other words, wrong self-diagnosis prolongs thelength of time that they take in toxic chemicals from the air.
The fact that such patients already have sick building syndrome and continueto consume toxic chemicals from the air makes them at high risk of developingchemical sensitivity (Imai et al., 2008). Some researchers have argued that afterconsuming a high density of toxic air in a short period or low density of toxic airover a long period, people develop chemical sensitivity when they encounter thesmall amount of toxic chemicals again (Cullen 1987). In addition, if sick buildingsyndrome patients aggravate their symptoms, they can escalate to multiple chemicalsensitivity. Different from chemical sensitivity in which the patients show symp-toms only when they encounter a particular chemical, multiple chemical sensitivitypatients react to many kinds of chemicals without any relation to their past exposurehistory. Patients with this condition cannot live in the community because they mayreact against the smell of cosmetics or synthetic detergents or volatilized air frommothballs. In conclusion, misdiagnosing sick building syndrome increases the riskof multiple chemical sensitivity developing.
6.2 Difficulty of Establishing Diagnosis
The content of this section is based on Imai et al. (2004). Sick building syndromeaggravation is not only caused by patients’ lack of recognition of sick buildingsyndrome but also a lack of knowledge about the condition within the medical pro-fession. Many medical staffs are unconcerned about the use of chemicals becausethey are commonly used in hospitals. Sick building syndrome and chemical sen-sitivity are new concepts, and they are not treated as priorities in medical andnursing education. Therefore, many medical staffs do not know that toxic chem-icals in the air can be a cause of significant health problems, and so they oftenmake wrong diagnoses when sick building syndrome patients complain about theircondition.
The author has found that sick building syndrome patients usually visit at leastone hospital where they do not get medical treatment for sick building syndrome butrather receive treatment for their symptoms, such as headache, nasal catarrh, der-matitis, etc. In this situation, their symptoms temporarily disappear, but then recurwhen the patient returns to the place filled with toxic air. Therefore, the patient hasto visit hospital again. After a few visits, some patients start doubting their doctor’s

6 Psychosocial Factors that Aggravate the Symptoms of Sick Building Syndrome 107
diagnosis and visit other hospitals. Consequently, sick building syndrome patientsoften have to visit many hospitals to obtain a correct diagnosis and treatment. Thisphenomenon is known as “doctor shopping”.
While sick building syndrome patients and medical staff treat the patient’s symp-toms, the patients are continuously consuming the toxic air and aggravating theirsymptoms. The ignorance of medical staff’ about sick building syndrome is there-fore doubly bad because they not only make a wrong diagnosis but also aggravatethe patient’s symptoms.
On the other hand, patients who have jobs in society or are busy caring for familymembers do not go to hospital even though they have sick building syndrome ormultiple chemical sensitivity symptoms. Some of them may just forget to care aboutthemselves or forget how important their health is because they are too busy to thinkabout such matters. However, many sick building syndrome patients who do not goto hospital expect to be healed spontaneously because they think that their symptomsare due to fatigue.
In addition, even when patients realize that their symptoms are caused by sickbuilding syndrome, they often cannot find appropriate medical institutions becausein many countries there are only a few medical institutions that are able to diag-nose and treat sick building syndrome. Even if they find a medical institution forsick building syndrome, many patients hesitate to visit it because they feel that themedical institution is too far from their home, they cannot make time to go there,or transportation expenses are too high. For example, in Japan, the only suitablemedical institutions are in Tokyo. Therefore, sick building syndrome patients wholive in rural areas must use the bullet train or fly to reach to these institutions andso have to spend large amounts of money on transportation and accommodation ontop of their medical fees. As many patients suffering from sick building syndromeare unemployed, such costs are too high. On the other hand, even if they can affordthe expenses, some patients choose not to visit such institutions because they haveto wait more than 3 months. Patients who decide to have a medical examination at aspecial medical institution for sick building syndrome are eager to obtain a correctdiagnosis and to alleviate their symptoms quickly (Fig. 6.1).
Specialized Hospitalfor SHS, CS
General Hospital
MCS
SHS
CS
• A lack of knowledge illness
• Role in the society and family
Be late for diagnosis
Can not treat
Can not go
Can not go
• Poor stamina
• Restricted movement
• Economic crisis
Fig. 6.1 Psychosocialaggravating factors of MCSin Japan (Imai and Imai2009)

108 N. Imai and Y. Imai
6.3 Difficulty of Taking Radical Measures to Improve
the Environment
When patients’ symptoms are correctly diagnosed as sick building syndrome andthere is little difficulty in visiting appropriate medical facilities, will patients’treatment progress smoothly? Unfortunately, probably not because they must findthe exact origin of the toxic chemicals in order for the treatment to succeed.Specifying the origin of toxic chemical volatilization is a really difficult taskbecause toxic chemicals can be volatilized from building materials, furniture, elec-trical appliances, or other personal belongings, all of which may be in the samespace.
Let’s explain about a case from the author’s research. The patient had no chronicillness but, 1 day, he suddenly became to develop a headache and feel dizzy whenhe smelt the air volatilized from copying machines.
He complained that he felt bad, especially when copying machines were work-ing and producing a strange smell. Thus, he thought that a copying machine inhis office was the cause of his sickness. He asked his boss to move the copyingmachine to another room, and his boss arranged to do so. However, his symptomsdid not recover because, according to him, something remained in the office afterthe copying machine had been removed and had stuck to other item such as papersor wallpaper. The author does not know whether his complaint is true or not. No onecan accurately determine what harmed his health because lots of things were usedin his office, and there were many staff and visitors.
On the other hand, if patients and medical staff can specify the origin, can theproblem be solved easily? Unfortunately, countermeasures to reduce the levels oftoxic chemicals in the air of an office often take a long time or cannot be imple-mented. For example, if the glue used on wallpaper is the origin of sick buildingsyndrome, can you imagine how much it would cost to remove the glue? Some peo-ple do not show any symptoms even though they spend long periods in toxic air.Of course, breathing in toxic air harms everyone but people who do not show anysymptoms are happy to remain there in the short term. Would those people agree toremove the wallpaper if the cost of doing so would reduce their income? In particu-lar, if the head of the office does not show any symptoms, does he/she want to incursuch a high cost?
Let’s move on to another example, a teacher of a nursing school visited theauthor and underwent a consultation in the Nursing Counseling Room. At thattime, many students and staff working in the newly built schoolhouse had devel-oped sick building syndrome. After an investigation, we found that the cause oftheir sickness was formaldehyde volatilized from building materials used on thewalls and floors. However, the schoolmistress of the school did not want to take anycountermeasures because she did not have any symptoms and could not understandwhat toxic chemicals in the air were causing the health problems of the students andstaff. She considered the removal of building materials to be unnecessary and thatopening windows and changing the air would solve the problem. She also thoughtthat the quantity of formaldehyde would decrease over time. This is wrong. The

6 Psychosocial Factors that Aggravate the Symptoms of Sick Building Syndrome 109
density of formaldehyde in the air of a building made of building materials contain-ing formaldehyde does not decrease. It decreases during winter and increases againin summer. This cycle is repeated every year until the materials are broken down bywear and tear.
Accordingly, the only effective measures are radical measures; i.e., removing alltoxic materials from the interior of the building. Attempting to reduce the densityof toxic chemicals in indoor air by ventilation, using adsorbents, or covering themwith sealing paint is not sufficient in many cases. The reduction in the density oftoxic chemicals achieved by opening windows is lost about 1 h after they had beenclosed. If we want to achieve a sufficient reduction in toxic chemical density froman adsorbent, we need to use a huge quantity and continuously replace it to main-tain the effect. Toxic chemicals that are covered by sealing paint will leak frompoints that are not painted (Imai and Imai 2006). Therefore, we cannot prevent theeffects of toxic chemicals using these methods. Please note that radical measuresare the only way to solve problems associated with toxic chemicals (Imai et al.2007).
Let’s move back to the nursing school example, the schoolmistress did not wantthe fact that her nursing school had a health problem to be known publicly as shewas afraid that if it became public, the number of students would decrease, and itmight cause the school financial difficulties. This is not a simple problem. From amanager’s point of view, trying to run their organization successfully is one of theirmain tasks, and therefore, they cannot consider action that is detrimental to theirorganization’s existence even if they also want to respect human health. In this case,even though she was the schoolmistress of a nursing school that educates medi-cal staff, she put her organization’s profit before caring for human health. In othercompanies, we can assume that the situation is just as bad.
We can find a clear example in the food industry. Many foods that are sold inshops contain chemicals such as preservatives, coloring agents, and artificial col-oring agents. Of course, most of these are not good for human health. Indicatingthe quantity of these chemicals is required by law because a person’s health will beharmed if they consume a large amount of such chemicals. However, from a foodcompany’s point of view, they need to keep their product fresh as long as possibleand also need to decorate their product to suit consumers’ tastes. Therefore, com-pany profit is considered more important than customers’ health. As a result, the lackof understanding by management about sick building syndrome and their concernsabout financial problems or bad publicity caused by the exposure of a health prob-lem are obstacles to radical measures being taken against sick building syndrome(Fig. 6.2).
As mentioned above, the lack of knowledge about sick building syndrome; dif-ficulty in finding the origin of toxic chemicals; and the obstacles to taking radicalmeasures to improve the environment such as economic, physical and psychologicalbarriers aggravate sick building syndrome. These factors prolong patients’ exposureto toxic chemicals, which may cause sick building syndrome to escalate to multiplechemical sensitivity. Therefore, we must remove these factors in order to solve theproblems of sick building syndrome.

110 N. Imai and Y. Imai
Misunderstanding aboutthe dispersion of chemicals
Overconfidence in ventilation measures
Overconfidence inmakeshift measures
Difficulty of identifying thecause
Sense of security associated withthe perception that the disorder
is not serious
Sense of vagueness of symptoms
Fig. 6.2 Psychological barriers against taking measures to improve the living environment (Imaiet al., 2008)
To solve such problems, all of us must be concerned about sick building syn-drome. People need opportunities to learn about sick building syndrome and mustunderstand what measures to take against the problems it causes; i.e., there is noeffective measure except removing all toxic materials from the environment. Sick
Prolongation of exposure to toxic chemicals
Lack of knowledgeabout the disorder
Difficulties ofestablishinga diagnosis
Lack of knowledgeabout the disorder
Moving into the house Diagnosis Taking
Time axis
Fig. 6.3 A Flow of symptoms’ aggravation by prolongation of getting right diagnosis (Imai et al.,2008)
6 Psychosocial Factors that Aggravate the Symptoms of Sick Building Syndrome 111
building syndrome can be categorized as a pollution-related illness. Therefore,national governments must also attempt to solve these problems by making lawsthat prevent the use of toxic materials in living environments with strict penal regu-lations and/or provide financial support for sick building syndrome patients to takeradical measures to solve their problems.
Moreover, we, as individuals, must understand that these tragedies are happeningon a global scale and how difficult solving such problems is.
We must also understand that we will suffer from large-scale economic, physical,and psychological problems if sick building syndrome is left untreated. We mustrealize that the symptoms will develop into intractable disease if we do not takeradical measures. In other words, we must recognize the importance of safe air toour existence (Fig. 6.3).
References
Cullen MR (1987) Multiple chemical sensitivities: Summary and directions for future investigators.Occup Med: State Art Rev 2(4):801–805.
Imai N, Honda I, Egawa T, Kido Y (2004) The Experience of patients with sick house syndromeor chemical sensitivity syndrome in new houses: The process of establishing a diagnosis. J JpnInt Illness Nurs Soc 9(2):120–129.
Imai Y, Imai N (2006) Attempt to mitigate indoor air pollution of whole apartment by sealer paints.Society of Indoor Environment Japan 2006, paper ID B-15.
Imai N, Imai Y (2009) Demand and nursing intervention of people who related to chemicalsensitivity. QHR 2008 Conference Abstracts. Int J Qualitat Methods 8(3):10–14, Oct. 2009.
Imai Y, Imai N, Imai Y (2007) Specifying the source of the indoor air formaldehyde contaminationand verifying the effectiveness of the radical measures to improve the indoor air condition.Society of Indoor Environment Japan 2007, paper ID B-10.
Imai N, Imai Y, Kido Y (2008) Psychosocial factors that aggravate the symptoms of sick housesyndrome in Japan. Nurs Health Sci 10(2):101–109.

Chapter 7
Building Biology and Examination Modelsfor Buildings
Ayse Balanlı
7.1 Introduction
People have attempted to fulfill their needs, which they couldn’t satisfy within theirnatural environment, by constructing shelters called “buildings”; so building is a“man-made” environment designed and constructed in the natural environment thatcontributes positively to users’ life in order to fulfill the user’s biological, psycho-logical and sociological needs. In other words, the function of a building is to meetthe users’ needs at the most basic level: to survive in healthy conditions (Öztürk andBalanlı 1995).
Previously, buildings were constructed in the natural environment, using natu-ral materials and methods in accordance with the limited functions that the usersexpected. But today, the environment, people and buildings are exposed to fun-damental changes due to the evolution in living conditions, society, science andtechnology.
Today’s building is constructed in a polluted outdoor environment with materialsproduced as a result of an artificial process with multi-faceted and complex relation-ships, involving many users with diverse expectations of new functionalities. Thiscomplex relationship between the human, the building and the environment has dis-rupted the most basic function of the building: to present a healthy environment toits users for a healthy life (Balanlı and Öztürk 2006).
The need of constructing healthy buildings necessitates a scientific study thatcovers the building, its environment and its users and identifying the relationsbetween them. The studies about this discipline called “building biology” startedin some Western European Countries many years ago (Balanlı and Öztürk 2006).
In this chapter, building biology will be defined as a subject of environ-ment; the relations between the building and its user will be established; and“Building Biology Examination Methods” developed for helping researchers willbe explained.
A. Balanlı (B)Department of Architecture, Faculty of Architecture, Yildiz Technical University,34349, Istanbul, Turkeye-mail: [email protected]
113S.A. Abdul-Wahab (ed.), Sick Building Syndrome,DOI 10.1007/978-3-642-17919-8_7, C© Springer-Verlag Berlin Heidelberg 2011

114 A. Balanlı
7.2 Building Biology
7.2.1 Definition of Building Biology
The buildings that gain negative features as a result of different factors derived fromits indoor and outdoor environment will fail to fulfill its users’ needs and accordinglywill be responsible for the psychological and biological heath problems of its users.
“Building biology”, which works on the relationship between the building, itsenvironment, and its users’ health, aims to help construct healthier man-madeenvironments.
Building biology is defined as “a scientific field which attempts to prevent thenegative effects on people’s lives by identifying the relationships between the build-ing, its environment and its users, while setting and controlling the rules to direct thedesign, construction and usage of building in terms of its users’ health” (Öztürk andBalanlı 1995). This scientific field is not only interested in benefiting its user, butalso examines the living and non-living environments as a whole. As it is clear in thedescription, it benefits from all sciences and academic branches related to building,human and environment. Besides from the architecture and engineering fields thatrelate to the building, it also interacts with medicine, biology, sociology, psychol-ogy, ergonomics, ecology, physical sciences, chemistry, geology and meteorologyamong others.
7.2.2 Building Biology as a Subject of Environment
While the building and its user compose an environment together, they also maintaintheir survival in other environments on their own.
Environment can be described as “a surrounding which enclose an entity whilehaving a correlative relationship and interaction with it and can be variable, complexand multidimensional in some situations” (Balanlı and Öztürk 2006).
Environment can also be classified according to the structures of the entities, therelationships and the surrounding.
“Living environment” is the surrounding that includes all relationships of allthe organisms in their lives. Organisms include plants, humans, animals andmicroorganisms.
Surroundings composed of non-living entities but that host living things can beidentified as “non-living environments”.
“Natural environment” is the entire environment of all living and non-livingentities that exist by itself (Hançerlioglu 2000) moving and changing continuously(Ozankaya 1995).
“Man-made environment” is a new and artificial surrounding of nature or a partof nature that is selected and created specifically for the actual conditions, in orderto fulfill the desired functions (Izgi 1999). This artificial environment is a living areafor the organisms.

7 Building Biology and Examination Models for Buildings 115
“Social environment” is a cluster of people that live together on a common land,have a common culture and interact with each other in order to survive and worktowards common interests (Ozankaya 1995).
“Physical environment” is a natural or a man-made surrounding made of non-living elements that include the living beings or social environment (Balanlı andÖztürk 2006).
The space inside a shell, which separates a part of the natural environment apartand surrounds it, is called “indoor environment”. The rest of the space with all it’ssurrounding is called “outdoor environment” (Balanlı and Öztürk 1995a).
So, both building biology and all the relationships between the building andhuman can be explained as the relationship between living and non-living areasthroughout the environment (Balanlı and Öztürk 1995b).
7.2.2.1 Living Environment: Human
Humans carry biological characteristics due to their physical existence and psy-chological characteristics due to their own unique behaviors. As a necessity of thesebiological and psychological characteristics, they interact with other humans in theirenvironment. These relationships shape their sociological characteristics. The soci-ological, biological and psychological characteristics of humans cannot be entirelyindependent from each other and every human being can be described by these threecharacteristics (Öztürk and Balanlı 1995). Buildings are designed and constructedto satisfy specific needs of humans evaluated by these characteristics.
• Social needs of humanSociology deals with the structure of society, its powers and social processeswhile determining its objective rules. People cannot survive by themselves.Survival forces people to live as a group. Group defines more than one personcoexisting and interacting with each other, and it is one of the basic concepts ofsociology (Ozankaya 1995).
The behavior standards called “norms” are the common values and rules sanc-tified by the people in the group. People feel the need to make up these normsand obey them. For the integrity and the continuity of the groups, norms shouldbe set in religion; ethics, customs and traditions, law and fashion and they shouldbe obeyed. This is a social need of the people.
People learn to obey these norms as a result of the socialization process. Thesocialization process is effective in forming the personality and ego and it teachesthe role of the individual in society. Therefore, related to his/her sociologicalfeatures, the individual can be said to have the following needs:
• Living in a group (social environment),• Obeying to norms (social rules),• Passing through the socialization process (Öztürk and Balanlı 1995).
The mission of the designer is to create environments that satisfy these definedneeds. So the designer should produce man-made environments

116 A. Balanlı
• That integrate the groups,• That gather the compatible groups together,• That organize the relationships between the groups,• Where the needs are fulfilled according to the social norms and culture,• Where the people’s interests and attitudes are considered,• That contributes to the socialization process.
When the social needs of the people are not met, negative conditions, attitudes andbehaviors will arise such as: loneliness, alienation, incoherence, assimilation, isola-tion, immature personality, incompatibility and degeneration, which may result inpsychological and biological problems over time.
• Psychological needs of humanPsychology is the science of behavior. Motivation is the factors that cause theindividual to behave in a certain way at a certain time (Plotnik 1999). Behaviorsarise as a result of motivations and it is directed to a purpose. The purpose is gen-erally to fulfill a need and get satisfaction. The needs of the individual related tohis/her psychological features are oriented to the purpose of being happy. Duringhis/her lifetime the individual, at first trying to satisfy his/her biological and after-wards sociological needs, represents an interdependently changing biological andpsychological development. This development modifies the needs as well.
Psychological needs are at different levels in terms of intensity and importanceat each stage of life (childhood, puberty, middle ages, and late ages).
Behaviors change according to hereditary and environmental factors. The psy-chological event always happen related to the environment that they exist in.That is why the environment is always an element of the psychological reality(Kagıtçıbası 1998).
All environments, living, non-living, physical, social, and natural or man-made, affect the psychological events in positive or negative ways.
Buildings are non-living, physical, social, and man-made environments wherethe people spend most of their time. These environments that are capable ofchanging the entire life in all aspects should be designed and created to fulfillits users’ needs. Winston Churchill says “First we shape our buildings, then thebuildings shape us” (Imamoglu 1992). Referring to this approach, the designercreating the building will also be shaping the people living inside (Balanlı andÖztürk 2006).
There are research findings that architectural design may affect the social rela-tionships, human behavior and productivity. Nice and scrupulous environmentsmay lead people to think and feel better, and also provide the growth of lifeforce and pleasure. It is considerably difficult for attentive, elegant, sensitive andpeaceful people to be brought up in careless, messy, ugly and noisy environments(Imamoglu 1992).
The designer, in a position to create places consistent with people’s psy-chological needs and development, has an important duty. If this duty is notperformed properly, the behaviors will be obstructed while stress is created.

7 Building Biology and Examination Models for Buildings 117
As a response to this stress in people, a series of psychological and physiologi-cal defense mechanisms appear. When the stress is too strong or the defense isinsufficient, people can face psychosomatic diseases. “Psychosomatic disease”term can be defined as functional and structural defects of the organs due to theinappropriate stimulation of the autonomous nervous system and the endocrinesystem (Cumhur 2001). The Psychosomatic diseases, described as the physicalmanifestations that originate from psychological impacts such as anxiety, emo-tional conflict and stress, appears almost in all parts of the body but mostly inthe systems which are not possible to control consciously. The following are thepsychosomatic diseases that are most frequently seen:
• Cardiovascular problems• Respiratory system diseases• Digestive system disorders• Skeleton and muscle problems• Reproduction problems• Urinary system diseases• Dermatological problems• Hormone disorders• Nervous system diseases (Fox 1999).
Also, stress can cause some diseases to worsen and some to accelerate.
• Biological needs of the humanBiology is a science that researches the structures, activities and the life processesof an organism or a fossil from all facets (Starr 2000).
The biological structure of the human is studied by anatomy which is one ofthe special research areas of human biology. Anatomy is one of the main branchesof medicine that studies the organs of the body in terms of form, structure,position and function and the relationships between them.
Systematic anatomy studies the systems composed of the organs that functionfor the same goal. These are:
• Skeletal system• Muscular system• Nervous system• Sense organs (sight, hearing, taste, smell, touch)• Respiratory system• Circulation system• Digestive system• Excretory system• Reproductive system• Hormones• Immune system• Protective outer covering (skin, nail, hair) (Fox 1999).

118 A. Balanlı
The foremost task of the designer is to provide the necessary conditions for thepeople -the users- to lead healthy lives. For each system that makes up the biologyof the human, the corresponding function that is expected of the building is listedin Table 7.1.
7.2.2.2 Non-living Environment: Building
Building can be described as:
• An object, since it is a result of a production process.• A non-living, physical and man-made environment that is built by preparing a
part of the nature which is selected to fulfill the aimed functions, in order to itsfunction.
• A system, because it includes conceptual and physical elements that affect andare related to each other and thus forms a functional and an identified whole.
• Building as an objectSelecting and separating a part of nature, thus creating a separate space andtransforming this space into a different environment can only be achieved bydesigning and constructing a shell and its compartments. This shell enables us todefine the building as an object.
The construction of the building as an object starts with producing the nec-essary materials that will make the designed models into an object. The basicpurpose of materials is to form the shape. However in the nature, materials con-venient for all purposes are not to be found and mostly, these materials cannotbe incorporated into a building as it is found in nature. Natural resources, whichare put through artificial processes, are turned into relatively finished “buildingproducts”. These products are ranked as material, piece, component, element andunit, according to their function, production process and finishing (Balanlı 1997).
Building materials are basic mass products and its compounds, alloys andcomposites, having no identifiable geometric shape; that are formed as a resultof both natural and artificial processes. For example natural stone, concrete,paint etc.
Building pieces are each one of the objects produced as a result of shapingthe materials for a specific function and that form a whole when put together. Forexample bricks, cables, pipes, panels etc.
Building components are custom products that are obtained by joining thematerials and pieces together, or giving them special forms; and that have a spe-cific place and function within the building. For example window, flooring, sink,column etc.
Building elements are whole products made-up of materials, pieces and com-ponents put together using several methods, in order to meet one or more of thephysical functions of the building. For example foundation, floor, roof, wall etc.
A unit is a part of a building, formed by combination of building elements thatserve a specific function by themselves. For example room, kitchen, bathroom,classroom etc. (Balanlı 1997; Özkan 1976).

7 Building Biology and Examination Models for Buildings 119
Table 7.1 Required functions that correspond to the biology of the user (Balanlı and Öztürk2006)
Biological systems Needs
Skeletal system Ergonomic conditions necessary for movementProviding security of movementProtecting the system from negative conditions (strike, break etc.)Providing necessary oxygen
Muscular system Ergonomic conditions necessary for movementProviding security for movementProtecting the system from negative conditions (fatigue, stress etc.)Providing necessary oxygen
Nervous system Preventing the existence of conditions causing stressProviding relaxation and necessary sleep
Sense organs(sight, hearing,taste, smell,touch)
Preventing surfaces and air to affect the protective outer coveringnegatively
Providing sufficient hearing and sightProtecting from unpleasant vision, noise, pollution and smell
Respiratory system Providing necessary oxygenHaving no pollutants in the indoor air
Circulation system Providing necessary oxygenGetting away carbon dioxide in the airHaving the indoor dimensions not obstructing the blood circulation
Digestive system Making up appropriate conditions for alimentationProviding necessary oxygen for digestion
Excretory system Providing the proper conditions to perform the excretion activityProviding hygiene
Reproductivesystem
Preventing the existence of conditions affecting the hormonesnegatively
Providing the proper conditions to perform the reproduction activity
Hormones Preventing the existence of conditions obstructing the hormoneproduction
Immune system Preventing the existence of antigen and allergenNot having conditions triggering the allergic reactions
Protective outercovering (skin,nail, hair)
Preventing to have surfaces affecting the skin, nail and hair negativelyProviding to perceive the stimulus accurately

120 A. Balanlı
• Building as an environmentThe space, which surrounds the building and in which the building exists, isdescribed as “outdoor environment” and the space surrounded and bounded bythe shell of the building is described as “indoor environment”. The commonfeature of the indoor and outdoor environments is the existence of the physi-cal and social characteristics. Depending on these characteristics, a building canbe considered to have physical and social environments as well.
The “physical outdoor environment” of the building includes
• Natural (air, water, soil, organisms),• Man-made (buildings, roads, parks etc) environments.
The “social outdoor environment” of the building is identified with
• Forming of the groups outside of the building,• Obeying the norms,• Effects on the socializing process.
The “indoor environment” also shows “physical and social indoor environment”characteristics like the “outdoor environment”.
The characteristics of the “Physical indoor environment” of the building are;
• Dimensional and spatial features,• Visual features,• Auditory features,• Tactile features,• Atmospheric features.
The “social indoor environment” of the building is identified with the
• Group forming,• Obeying to norms of religion, ethics, fashion, customs and traditions,• Effects on the socializing process
The indoor and outdoor features of the building are shown in Fig. 7.1 (Balanlıand Öztürk 2006).
The physical and social features of both indoor and outdoor environments ofthe building affect the building users totally in both negative and positive ways(Fig. 7.2).
• Building as a systemSystem is a gathering of the conceptual and physical elements that affect andrelated to each other, in order to form a functional and identified whole (Balanlıand Öztürk 1995b).

7 Building Biology and Examination Models for Buildings 121
Fig. 7.1 The physical and social indoor and outdoor environmental features of the building
Considering the building as a system, the components of the “buildingsystem” are
• The purpose of the building system: The reason for the production of thebuilding,
• The objectives of the building system: The measurable features of a buildingdesired to be achieved as an object and an environment,
• The sources of the building system: All the necessary physical and conceptualelements for the design and construction of the building,
• The activities of the building system: Any activity performed during thedesign, construction and utilization of the building,
• The output of the building system: The output as an object which is a resultof the design and production processes; the output as an environment which isall the indoor and outdoor features of the building that make it an environment(Balanlı and Öztürk 1997).

122 A. Balanlı
Fig. 7.2 The interaction of the user with the indoor and outdoor environment of the building(Balanlı and Öztürk 1995a)
7.3 Health Relationship Between Building and Human
According to WHO (World Health Organization), health is not only the disease tobe absent or not being sick; but also totally being well physically, psychologicallyand socially. Referring to this description, the effects of the environment and alsothe effects of the building, as an artificial environment, on the conservation and thecontinuity of this well being status are subjects to researches and discussions whiletrying to find the solutions.
Several different groups of people involves in the design, construction and uti-lization processes of a building, such as the users, designers, producers, buildingproduct producers, controllers etc. These people have effects on the buildings, whilethe buildings also affect its users in negative or positive ways through their lifetime.Each negative effect leads the people or the building to loose their health. The neg-ative effects on the building cause its features to fail and results in developing anunhealthy environment. So, an unhealthy building will have negative effect on thepeople’s health (Fig. 7.3).
7.3.1 The Negative Effect of People on the Building – The
Unhealthy Building
The designers, producers, controllers and the users are the factors of a building tobe healthy or unhealthy.

7 Building Biology and Examination Models for Buildings 123
Fig. 7.3 The health relationship between building and human
An unhealthy building is designed when the designers (architects, engineers,product designers etc)
• Do not determine the construction and utilization requirements properly andcompletely, in regard with the environmental factors,
• Do not reflect these factors and requirements to the design,• Take inaccurate design decisions.
An unhealthy building and unhealthy building products are produced when thebuilding and building product producers
• Do not evaluate the production sources sufficiently,• Do not reflect the design to the construction properly,• Take inaccurate construction decisions.
The building turns to be an unhealthy environment when its users
• Do not use the building suitable for its function or make changes in the functions,• Change the physical and social features of the building due to some factors and
necessities,• Do not apply a regular and a satisfactory maintenance to the building.
The controllers may not inspect the design, construction and the utilization of thebuilding properly due to
• Having no or inadequate necessities as the laws, codes, regulations, technicalspecifications, standards, instructions or special contracts,
• Not applying these necessities or having difficulty in application,• Having no sanctions about the requirements of these applications.

124 A. Balanlı
As a result of negative or inadequate acts of these people, an unhealthy building isdesigned (Balanlı and Öztürk 2006).
7.3.2 The Negative Effect of Building on the People – The
Unhealthy People
People spend most of their time inside the buildings. The function of the buildingsis to meet the users’ needs. The unhealthy building users, whose needs are not met,the biological and psychological health of the users are affected. So the primaryrequirement for each building should be to associate a correct relationship betweenthe building and the health of its user.
7.4 Building Biology Examination Models
In order to examine the relationship between the building and the users’ healthin terms of building biology, these models can be followed; since the building isdescribed as
• An object and the environments of that object forms,• A system.
Risk assessment can be followed as an examination model as well (see Chap. 3).
7.4.1 The Examination Model for the Health Problems Due
to Indoor and Outdoor Environment of the Building
Regarding the existence of a negative factor at the indoor and outdoor environmentof building; it should be considered that this factor may cause a problem; in rela-tion with this problem another negative condition risking the health may arouse andfinally a health problem can be seen. This chain of relationships can help to deter-mine the health problems originated from the indoor and outdoor environments ofthe building and to examine which negative environmental feature of the buildingcauses a certain health problem (Fig. 7.4).
Fig. 7.4 The relationship between building and health problems

7 Building Biology and Examination Models for Buildings 125
The steps of the model developed to specify the health problems caused by thebuilding are to determine
• The negative features within the indoor and outdoor environments of the building,• The negative conditions due to those negative features,• Hazardous impacts of those negative conditions on health,• The health problems which might be caused by those hazardous impacts.
The formation of a health problem can be examined from the opposite way as well:
• The health problem arouses,• The hazardous impact risking the health,• The negative conditions occurring as a result of negative features,• Negative features of the indoor and outdoor environment.
So, using this model;
• The existing buildings can be examined in terms of building biology,• The user can be lead according to the information gathered and the existing
buildings can be rehabilitated,• The evaluations may guide the designs of new buildings (Balanlı and Öztürk
1995a).
Table 7.2 shows the health problems, caused by the negative features in the indoorenvironment of the building; while Table 7.3 shows the examples for the steps tospecify the indoor and outdoor environmental factors of building causing a healthproblem.
In studying the health relationship between the human and the building both theusers and the environmental features of the following are needed to be defined:
• a building type with a specified function (education or tourism buildings),• a designed or a certain existing building (Yildiz Technical University or Hilton
Hotel).
In another words, during the examination of some specific buildings in terms ofbuilding biology, the identification of the user and the environment should be addedto the model suggested in Fig. 7.5, along with the detailed features of the indoor andoutdoor environments.
7.4.1.1 The Identification of the User
Users’ sociological, psychological and biological needs, purposes, activities, inter-actions with the building and its environment and utilization time of the buildingare not the same of each other. Because of this reason the negative features of thebuilding which affect the users’ health may not cause the same health problems inevery condition.

126 A. Balanlı
Table 7.2 The health problems caused by the negative features in the indoor environment of thebuilding
Negative features Negative conditions Hazardous effects Health problem
Radon going into thebuilding through soil,water, natural gas, andbuilding products(Balanlı et al. 2004)
Having radon over thelimit value in theindoor air of thebuilding
Breathing radon Lung cancer
Products containingasbestos (Balanlı andTuna Taygun 2005)
Flitting of asbestosfibers in air
Breathing fibers ofChrysotileCrocidoliteAmositeAnthophylliteTremoliteActinolite
AsbestosisLung cancerMesotheliomaPleura tumor
Insufficient soundisolation outside thebuilding and of theexternal walls ofbedroom (Balanlı andÖztürk 2004)
Indoor noise level inbedroom; 62–65 dBA(Çevre ve OrmanBakanlıgı 2002)
Increase in heartbeatduring sleep
Cardiovascularproblems(Berglund andLindvall 1995)
Table 7.3 The indoor and outdoor environmental features of building causing a health problem
Health problem Hazardous effects Negative conditions Negative features
Allergy (Balanlı andÖztürk 2004)
Contact withAllergensBreathingBee bites
Allergens;Dust mitesDomestic animalsPollenBeeFungus
Not preventing thedevelopment of allergensand triggering of theallergic reactions throughdesign, application andusage
Legionnaires disease(Balanlı andÖztürk 2005)
Breathing Legionellabacterium
Development oflivingenvironments forLegionellabacterium inwater, air andhuman
The negative design,construction andutilization of hot and coldwater system heating,ventilation and airconditioning systems,cooling towers, poolsand spa
According to this, to have accurate results in the examination, it is important thatusers’
• Features related to the utilization time of the building (permanent or temporaryusers),
• Features related to their characteristics (sociological, psychological and biologi-cal)

7 Building Biology and Examination Models for Buildings 127
Fig. 7.5 The conceptual model to examine outdoor and indoor characteristics of building in termsof building biology (Balanlı and Öztürk 2004)
are needed to be defined.
• The sociological features of the user:
• The characteristics of the group (the race, country, region; the relations,dependence and the aims of the groups etc.)
• Social norms (religion, ethics, common customs, law etc.)• Socialization processes (the structure of the family; educational background;
the field of practice and position; cultural features etc.)
• The psychological features of the user:
• Behavior (physiologic, the learned and unlearned motivations etc.)• Mental processes (baby, child, teenager, adult and old; the perception of the
building; mental disability etc.)
• The biological features of the user:
• The age group (baby, child, teenager, adult or old); gender, height, weight etc.• The risk group (baby, child, adult or old; pregnant; sick; disabled; recovered
from an illness; addict etc.)• Biological systems (respiratory system, circulation system; skeleton and
muscles systems etc.)

128 A. Balanlı
The influence of building on its user is also depends on the duration of this affec-tion. The users may use the buildings temporarily for a short period of time; orpermanently for a long period of time.
The tourism buildings, schools, hospitals and libraries contain people stayingboth permanently and temporarily. For example, within the university librarieswhere the educational and research activities are held and any kind of document andinformation is provided; the library building is used by the two separate groups –the service receivers and the service providers (Balanlı et al. 2006).
• The service receivers within the university libraries:The students (vocational studies, undergraduate and postgraduate), faculty (lec-turers, assistance), personnel and the researchers are the temporary usersreceiving a service. These users form a group of people who
• Use the building for certain time periods,• Can be young (student, research assistant etc); adult and aged (lecturers,
researchers etc),• Mostly form a large group or groups within the university,• Might be from different races, regions or countries and have different social
norms,• Might have a permanent or a temporary disability,• Intend to get a document or information (Balanlı et al. 2006).
• The service providers within the university libraries:The librarian, manager and clerical staff are the permanent users of a library.These users form a group of people who
• Use the building through the working hours,• Include young people and adults,• Generally have similar social norms,• Are mostly from the same race, region and country,• Have no physiologic disability to work,• Have the purpose to give the identified services and educated accordingly,• Work dependently to each other (Balanlı and Küçükcan 1998).
7.4.1.2 The Identification of the Features of Building and Environment
The indoor and outdoor, the physical and social environmental features present dis-crepancies according to the type of the building. So, during the examination of thecharacteristics of buildings, the type of the building or the specifications of build-ing should be identified. The identification is related with the function and generalfeatures of the building type (office building, tourism buildings, library etc). For thespecific buildings (for example Hilton Hotel), the identification should contain theinformation such as the location, the position, structural features, number of floors,the size and the features of the plan etc.

7 Building Biology and Examination Models for Buildings 129
For a university library, the outdoor environment is mostly the university cam-pus. The buildings, roads, gardens etc. exist within this environment. The socialoutdoor environment consists of the students, lecturers, university staff and thevisitors. If the library is located outside the university campus, then the localcommunity or the institutions at the neighborhood constitute the social outdoorenvironment.
The physical indoor environment of a library can be identified with its dimen-sional and spatial, formal, visual, auditory, tactile and atmospheric features. Thesocial indoor environment covers the social relations of physical indoor environmentusers. The physical and social indoor environmental features can possess negativequalifications; due to being affected by the design, the construction, the use of thebuilding or the outdoor environmental conditions.
To be able to associate a relation between the indoor environment and the healthof its user; the values related with the characteristics of specified building should becompared with values defined by the laws, codes, regulations, technical specifica-tions or standards. Any fact exceeding the limit values is a problem risking the userhealth. But the results of a scientific research may help for the undefined negativefeatures.
7.4.1.3 The Steps of the Examination Model
The building biology examination model (Fig. 7.5) is produced for a special buildingor a building with a certain function. After the determination of the building and itsusers, the steps of this model are as follows:
• The identification of the indoor and outdoor environmental characteristics of thebuilding
• Determination of the negative features of indoor and outdoor environments of thebuilding
• Identification of the negative conditions due to those negative environmentalfeatures
• Identification of the negative characteristics of the user• Determination of the health problem
To determine the reasons of the health problem, the steps to be followed are:
• Identification of the health problem• Identification of the negative characteristics of the user• Determination of the hazardous effects on health• Determination of the negative conditions which result in those hazardous effects• Determination of the negative characteristics of indoor and outdoor environ-
ments of the building which cause those negative conditions (Balanlı andÖztürk 2004).

130 A. Balanlı
7.4.2 Examining the Building Biology Problems Using
the System Approach
The building related problems and their effects on people are complicated and needto be examined using a specific system. That is why the problems related with thebuilding biology should be considered with the system approach which improvesthe conception, determines a system, solves the problem and has a role in decisionmaking.
7.4.2.1 The Conceptual Model of Building Biology System
The main objectives in producing healthy buildings should be first identifying thefactors causing the building biology problems and then preventing the occurrenceof negative conditions causing these negative factors. In a building biology sys-tem, these objectives not only lead the resources and activities, but also determinethe quality of the outputs. The resources of the building biology system affect theactivities of the system, the building itself and its environment. A building andits environment of a required quality can be achieved by associating the systemactivities with the purposes, objectives, targets and resources as the inputs of thesystem (Balanlı and Öztürk 1997). The conceptual model of the objectives, activ-ities, resources and outputs of the building biology system is shown in Fig. 7.6.A building related problem that can result in a negative way in terms of people’shealth can be considered better; a system can be determined in solving the prob-lem; decisions can be generated and these decisions can be examined by using the“Building Biology System Conceptual Model”.
7.4.2.2 The Components of the Building Biology System
When considered as a system, the components of the building biology system are:
• The purposes and objectives• The resources• The activities• The outputs
• The purposes and objectives of the building biology systemThe main purpose of the building biology is to prevent health prob-lems caused by building. The specified objectives of this purpose are try-ing to prevent the occurrence of these negative conditions affecting thepeople’s lives; generating decisions accordingly and inspecting these givendecisions.
• The resources of the building biology systemThe resources of the building biology system are:

7 Building Biology and Examination Models for Buildings 131
Fig. 7.6 The conceptual model of building biology system
• Natural resources (the building site, building products, energy etc.)• Labor force resources (users, designers, contractors, product producers, con-
trollers etc.)• Integrative resources (finance, equipment, etc.)
• The activities of the building biology systemThe activities of the building biology system are:

132 A. Balanlı
• Design activities (the management architectural, engineering and productdesign)
• Production activities (the management, site preparation, the construction ofthe building and the manufacturing of the building products)
• Usage activities (the management, temporary and permanent usage)• Control activities (the management, the inspection of the design, construction
and the usage)
• The outputs of the building biology systemThe building biology system leads to two types of output:
• Building as a healthy object (not having any negative factors in terms ofpeople’s health)
• Building as a healthy environment (a healthy physical indoor and outdoorenvironment and social indoor and outdoor environment)
Applicable examination methods are required to define the problems and developsolutions for the relationship between building and health which is the subject ofbuilding biology. In this Chapter “The Examination Model for the Health ProblemsDue to Indoor and Outdoor Environment of the Buildings” and “Examining theBuilding Biology Problems Using the System Approach” methods, which can bebeneficial for these examinations, are presented.
References
Balanlı A (1997) Yapıda Ürün Seçimi. YÜMFED YTÜ Yayını, Istanbul.Balanlı A, Küçükcan B (1998) Yapı Biyolojisi ve Üniversite Kütüphanesi Kullanıcısı,
21. Yüzyılda Üniversite Kütüphanelerimiz Sempozyumu Bildirileri, Trakya ÜniversitesiRektörlügü Yayınları, No:15, Edirne, 22–24, Ekim:105–115.
Balanlı A, Tuna Taygun G (2005) Yapı biyolojisi ve asbest. Mimar Ist 16:107–110.Balanlı A, Vural SM, Tuna Taygun G (2004) Yapı Ürünlerindeki Radonun Yapı Biyolojisi
Açısından Irdelenmesi, 2. Ulusal Yapı Malzemesi Kongresi ve Sergisi, TMMOB MimarlarOdası Istanbul Büyükkent Subesi, Istanbul, 6–8 Ekim:378–386.
Balanlı A, Öztürk A (1995a) “Yapının Iç ve Dıs Çevresinin Yapı Biyolojisi AçısındanIrdelenmesi”, Saglıklı Kentler ve Insaat Mühendisligi, TMMOB Insaat Mühendisleri OdasıIzmir Subesi, Izmir, 20–21 Ekim:45–55.
Balanlı A, Öztürk A (1995b) Yapı biyolojisi kavramına çevresistemden yaklasım. Yapı 159:37–39.Balanlı A, Öztürk A (1997) A systematic approach to solve building biology related prob-
lems, vol 3, Healthy buildings/IAQ’97 global issues and regional solutions. ASHRAE AnnualConference On Healthy Buildings. Washington, DC. September 27–October 2, pp 147–152.
Balanlı A, Öztürk A (2004) A conceptual model to examine buildings in terms of building biology.Archit Sci Rev 47(2):97–102.
Balanlı A, Öztürk A (2005) Lejyonellosis’in yapı biyolojisi açısından irdelenmesi. MimarlıkDekorasyon 2:20–22.
Balanlı A, Öztürk A (2006) Yapı Biyolojisi – Yaklasımlar. YTÜ Üniversite Yayın No: YTÜ.MF.YK – 06.0759/Mimarlık Fakültesi Yayın No: MF.MIM-06.002, Istanbul.
Balanlı A, Öztürk A, Karabiber Z, Vural SM et al (2006) An examination and evaluation ofYTU library and documentation building in terms of building biology. Building Environ41(8):1079–1098.

7 Building Biology and Examination Models for Buildings 133
Berglund B, Lindvall T (1995) Community Noise. Stockholm University and Karolinska Institute,Stockholm.
ÇEVRE ve ORMAN BAKANLIGI (2002) Çevresel Gürültünün Degerlendirilmesi ve YönetimiYönetmeligi, Ankara.
Cumhur M (2001) Genel Anatomi. METU Press, Ankara.Fox SI (1999) Human Psysiology. WCB/McGraw-Hill Company, Boston, MA.Hançerlioglu O (2000) Felsefe Ansiklopedisi-Kavramlar ve Akımlar. Remzi Kitabevi, Istanbul.Imamoglu O (1992) Psikolojik Açıdan Insan Çevre Iliskileri. In: Keles R (ed) Insan çevre toplum.
Imge Kitabevi, Ankara, pp 191–209.Izgi U (1999) Mimarlıkta süreç: kavramlar-iliskiler. YEM Yayınları, Istanbul.Kagıtçıbası Ç (1998) Kültürel psikoloji – kültür baglamında insan ve aile. Yapı Kredi Yayını,
Istanbul.Ozankaya Ö (1995) Temel toplumbilim terimleri sözlügü. Cem Yayınevi, Istanbul.Özkan E (1976) Yapım sistemlerinin seçimi için bir yöntem. Karadeniz Teknik Üniversitesi,
Trabzon.Öztürk A, Balanlı A (1995) Yapı Biyolojisi: Kavram ve Kapsam, Saglıklı Kentler ve Insaat
Mühendisligi, TMMOB Insaat Mühendisleri Odası Izmir Subesi, Izmir, 20–21 Ekim:135–140.Plotnik R (1999) Introduction to Psychology. Wadsworth Publishing Company, USA.Starr C (2000) Biology: Concepts and Applications. Brooks/Cole Thomson Learning,
Stamford, CT.

Chapter 8
The Influence of School Environment on the SBSSymptoms and the Development of Asthma andAllergy
Motoko Takaoka and Dan Norbäck
8.1 Introduction
Human reactions to the indoor environment can be divided into three main cate-gories. The most common effects are complaint reactions due to poor subjectiveindoor air quality, e.g. thermal discomfort, complaints of stuffy air, dry air or mal-odours. Secondly, there are some diseases with known aetiology that may be causedby factors in the indoor environment, e.g. building related asthma. Finally, subjectsmay report certain medical symptoms with unclear aetiology, but with a possiblerelation to the indoor environment. The term “sick building syndrome” (SBS) or“sick house syndrome” (SHS) has been used to describe such symptoms. Theyinclude symptoms from eyes, skin and upper airways as well as headache and fatigue(Norbäck 2009).
In the last few decades, the prevalence of asthma has increased in the indus-trial country, especially among children and young persons (Sennhauser et al.2005). Nowadays, there are indications that the increase of asthma is highest inmiddle-income countries Indoor environment appear to play a substantial role inthe development asthma. Poor indoor environment has been suggested to be relatedto the increase in the prevalence of asthma, especially among young persons andchildren.
Apart from the home, school is the most important indoor environment for chil-dren. Classrooms are densely populated, which can lead to both thermal discomfortand perception of poor indoor air quality. Children spend a large part of their totaltime in schools. Moreover, elementary school-aged children spend a large portionof their time in a fixed single classroom. Children’s patterns of exposure to envi-
ronmental pollutions are very different from those of adults. Children have greater
susceptibility to some environmental pollutants than adults, because they breathe
M. Takaoka (B)Department of Biosphere Sciences, School of Human Sciences, Kobe College, Nishinomiya,Hyogo, Japane-mail: [email protected]
135S.A. Abdul-Wahab (ed.), Sick Building Syndrome,DOI 10.1007/978-3-642-17919-8_8, C© Springer-Verlag Berlin Heidelberg 2011
136 M. Takaoka and D. Norbäck
higher volumes of air relative to their body weights and their tissue and organs areactively growing, developing and differentiating (Faustman et al. 2000; Landrigan1998).
In one review article on school environment it was concluded that formaldehyde,total volatile organic component and bioaerosol exposure in schools were suffi-ciently high to influence the students and has been found to be associated withallergy, asthma, and other respiratory symptoms (Daisey et al. 2003).
Mendell and Heath assessed whether school environments can adversely affectacademic performance. They concluded in their review that poor indoor environ-mental quality (IEQ) in schools may have different negative effects on the students.Microbial and chemical exposures related to indoor sources and building character-istics found in schools, excessive dampness and poor ventilation, have been linkedto reduced school attendance, respiratory infections, asthma and allergy in childrenand adults (Mendell and Heath 2005).
When comparing the some data from similar exposure measurements indwellings and schools in mid-Sweden, the exposure to formaldehyde, VOCs, andhouse dust mite allergens were found to be lower in schools. In contrast, roomtemperature and CO2 levels were higher in schools than in dwellings, and the airconcentration of moulds, bacteria and respirable dust were similar (Norbäck 1997).Measurements in schools have shown that the air exchange rate often is low, result-ing in high concentration of CO2 (Mi et al. 2006; Smedje and Norbäck 2000; Kimet al. 2007b; Zhao et al. 2006; Simoni et al. 2010) and particle exposure (Smedjeet al. 1997a; Simoni et al. 2010).
Moreover the school environment may contain indoor pollutants such as mold,bacteria, air born dust, volatile organic compounds (VOC), VOC of microbial origin(MVOC) and formaldehyde (Meyer et al. 2004; Kim et al. 2007a). Other problemin schools in Scandinavia is high room temperature (Smedje et al. 1997b). In China,room temperature in classrooms is very low in winter because of lack of a heatingsystem (Mi et al. 2006; Zhao et al. 2006).
There is a widespread contamination of cat, dog allergens in school in manycountries (Salo et al. 2009; Tranter 2005). Although pets are not present at school,pet owners carry the pet allergens in their hair and clothes to the classrooms. Somestudies also reported contamination of allergens from horse (Kim et al. 2005) andhouse dust mite (der f 1/p 1) cockroach (bla g1/g2), mouse (Mus ml) in schools(Amr et al. 2003; Sheehan et al. 2009). Sheehan et al. (2009) compared allergenlevel in home versus schools for children with asthma and founded that higher levelof mouse allergen in the schools than that of home. Allergen exposure in school maybe important trigger for asthma in school children.
Health studies in schools have mainly focused on asthma and asthmatic symp-toms in students, or sick building syndrome (SBS) (Norbäck and Torgen 1989;Norbäck et al. 1990) or nasal symptom or nasal inflammation school staff (Wålinderet al. 1998; 1999). There are few experimental or longitudinal studies on healtheffects of the school environment. In one 4 year longitudinal study it was foundthat the school environment had an influence on the development of doctors diag-nosed asthma (Smedje and Norbäck 2001b). Two intervention studies in schools

8 The Influence of School Environment on the SBS Symptoms 137
have shown beneficial effect of increasing the ventilation in schools (Smedje andNorbäck 2000; Norbäck and Nordstrom 2008).
8.2 Exposure Conditions in Schools
8.2.1 Room Temperature
Thermal climate in building may influence environmental perceptions, symptoms,physiological signs, as well as the emission of chemicals from building materials.Room temperature in office environment have been shown to be related to SBS andtemperature above 22C increased mucosal irritation and general symptoms suchas headache and tiredness may occur in temperature climate (Jaakkola et al. 1989).Moreover, a review article has concluded that high room temperature may lead toreduced productivity, a higher risk of accidents, and decreased mental performance(Wyon 1993). Classrooms are densely populated, which can lead increased temper-ature due to heat produced by the pupils, in combination with solar radiation, andlow air exchange rates. Moreover large glass window can increase the thermal prob-lems on the warmer regions or during warmer parts of the year. It has been reportedfrom Sweden that high room temperature in schools is common and could be a pos-sible cause of sick building syndrome (Norbäck et al. 1990; Norbäck and Smedje1997). In some parts of the world, e.g. in China, where there is no heating systemin the classrooms, room temperature is low in the classrooms (Mi et al. 2006; Zhaoet al. 2006). In tropical countries, room temperature is similarly high both insideand outside the schools.
Available school studies have shown that room temperature often exceeds therecommended maximum value of 22C in schools (Table 8.1). The mean room tem-perature was 23.2C in May and 21.4C in December in Swedish Schools (Kimet al. 2005). In contrast it was 13–21 in schools in Shanghai, China (Mi et al. 2006),
and similarly low in schools in north China in winter time (Zhao et al. 2006).
Norbäck and Nordstom (2008) studied the effect of temperature change in com-
puter classroom in a university and reported that ocular (OR1.52 per 1C), nasal
(OR1.6 per 1C) and throat symptom (OR1.53 per 1C), headache (OR1.51 per
1C) and tiredness (OR1.54 per 1C) were significantly associated with tempera-
ture. Mi et al. (2006) showed that indoor temperature in schools in Shanghai was
associated with daytime breathlessness (OR 1.18 for 1C; p < 0.001).
In summary, room temperature is one of the most important factors for the envi-
ronment of classrooms. It is important to control room temperature in classrooms
through air conditioning, sun shield and sufficiently high ventilation flow.
8.2.2 Relative Air Humidity
Low relative humidity (<20–30%) is related to ocular and upper respiratory symp-
toms and dermal symptoms in some indoor environments, with low population

138 M. Takaoka and D. Norbäck
Table 8.1 Indoor climate and exposure levels measured in Sweden and China schools
Swedena Swedenb Swedenc Chinad
1993 2000 2000 2000Exposure factor Mean (max) Mean (max) Mean (max) Mean (max)Room temperature (C) 24(27.5) 23.2(26.6) 23.2(26.6) 17.4(20.7)Relative air humidity (%) 37(61) 41(51) 41(51) 56(82)Carbon dioxide (CO2)
(ppm)550(1,725) 815(1,275) 815(1,275) 1,060(1,910)
Air change rate (per hour) NA 4.5(8.1) 4.5(8.1) 9.1(29.4)Respirable dust (µg/m3) 14(29) 94(544) 94(544) NATotal dust (µg/m3) 66(107) NA NA NAFormaldehide (µg/m3) <5 7.1(16) 7.1(16) 9.4(20)VOC (µg/m3) sample by
pump23(93) NA NA NA
NO2 (µg/m3) 5(9) NA NA 55(86)Viable bacteria (103/m3) 0.3(11) NA 1.77 NATotal bacteria (103/m3) 38(110) NA 17.0 NAViable molds (103/m3) 0.4(4.5) NA 0.36 NATotal molds (103/m3) 33(170) NA 14.8 NA
NA = not analyze.aThirty nine schools (28 in the primary schools and 11 in the secondary schools) (Smedje et al.1997a).bNine schools (six in the primary schools and three in the junior high schools, Kim et al. 2005).cEight primary schools (Kim et al. 2007a).dTen junior high schools (Mi et al. 2006).
density and high ventilation flow, but too low air humidity is rarely a problemin schools. High relative air humidity (>70%) may contribute to water condensa-tion and microbial growth on indoor surfaces, and indirectly cause both SBS andasthmatic symptoms. Moreover, high relative humidity indoors can be an indicatorof poor ventilation. Too high relative air humidity, however, can be a problem inschools in some parts of the world. Mean relative air humidity in Swedish schoolswas 41% in May and 31% in December (Kim et al. 2005). Mi et al. (2006) reportedthat the mean relative air humidity was 36–82% in 30 classrooms in Shanghai,
China. Moreover, current asthma was positively associated with indoor relative
humidity.
In the home environment, there is the relationship between high humidity and
levels of house dust mite allergens. House dust mites grow in the mattress of the bed.
Humidity levels in the ambient and indoor micro- environment play an important
role in the levels of dust mites. Dust mites require indoor absolute humidity levels
above 7 g/kg which corresponds to 45% relative humidity in the room (Dybendal
and Elsayed 1994). Since schools do not contain beds, house dust mites cannot grow
in the school environment, but mite allergens can be transferred from the home
environment by contamination of clothes. In Swedish schools, levels of house dust
in settled dust is low (Smedje et al. 1997a). In Korea, somewhat higher levels of
house dust mites have been detected in school dust (Kim et al. 2007b).

8 The Influence of School Environment on the SBS Symptoms 139
In summary, high levels of air humidity can lead to microbial growth in schools,and the relative air humidity can be lowered by increasing the ventilation. Problemswith too low air humidity are less common in schools because they are denselypopulated and humans emit water vapor.
8.2.3 Ventilation
Sufficient ventilation is crucial to remove indoor-generated pollutants from indoorair or to dilute their concentration to acceptable levels. Moreover, ventilation canreduce the prevalence of airborne infectious diseases (Lee and Chang 2000). Sincehumans emit CO2, and the outdoor concentration of CO2 is relatively constant,measurement of CO2 is commonly used as convenient indicator of the building ven-tilation (Fromme et al. 2008). The closing of windows and doors during lecturehours caused high levels of CO2. As early as 1858, the German pioneer of modernhygiene Pettenkofer (1858) showed that subjective air quality is related to the indoorconcentration of CO2. As a rule of thumb, the air is perceived as unacceptable by nonadapted visitors when the CO2-concentration exceeds 1,000 ppm. At the end of thenineteenth century, Heyman (1880) noted that CO2 levels in Swedish schools oftenexceeded the 1,000 ppm limit, and a maximum concentration of 5,000 ppm CO2
was detected. Most of the current ventilation standards, but nationally and interna-tionally, are based on the old recommendation by Pettenkofer (1858) that the CO2
concentration should be below 1,000 ppm (ASHRAE 1999). In some cases 800 ppmhave been suggested as a limit value (Seppanen and Fisk 2004), which correspondsto a personal outdoor air flow of about 10 l/s.
There have been a number of review articles on the health impact of buildingventilation. Godish and Spengler (1996) reported that there is limited evidence tosuggest that ventilation rate increase up to 10 l/s per person may be effective inreducing symptoms, but higher ventilation rates may not be so. Seppanen and Fisk(2004) reported in their review article that beneficial health effects could be achieveby reducing CO2 concentration down to 800 ppm. The importance of classroomventilation to achieve a healthy indoor environment for students was pointed out inthe review article on school environment by Daisey et al. (2003).
School environment studies have shown that CO2 concentration often exceedsthe recommended maximum value of 1,000 ppm in schools (Table 8.1).Measurements in Swedish schools have shown that as much as 80% of the class-rooms had inadequate ventilation (Smedje et al. 1997a), defined as either a CO2
concentration above current Swedish standard of 1,000 ppm, or a personal outdoorair supply rate less than seven liters per second. These values are used as ventilationstandards in Sweden (National Swedish Board of Occupational Safety and Health1993). The American Society of Heating, Refrigerating and Air–Conditioning
Engineers (ASHRAE 1999) gives guidelines for CO2 as <1,000 ppm and a mini-
mum personal outdoor air flow of 8 l/s (ASHRAE 1999). Another study showed
the mean CO2 exceeded 1,000 ppm in 45% of the classroom in Shanghai, China

140 M. Takaoka and D. Norbäck
(Mi et al. 2006). In a recent study from USA, Michigan school the peak levels ofCO2 reached 2,700 ppm (Godwin and Batterman 2007). Fromme et al. (2008) notedthat the median indoor CO2 concentration in the classroom in German schools wasrange 598–4,172 ppm in winter and 480–1,875 ppm in summer and in 92% of the
classroom the CO2 daily median was above 1,000 ppm.
There are some studies showing health effects of low ventilation flow in schools.
School children exposed to CO2 levels >1,000 ppm showed a significant higher
risk for dry cough (OR 2.99, 95% Cl 1.65–5.44) and rhinitis (OR 2.07, 95% Cl
1.14–3.73) (Simoni et al. 2010). Indoor CO2 in schools in Shanhai was associated
with current asthma (OR 1.18 for 100 ppm; p < 0.01) and asthma medication (OR
1.15 for 100 ppm; p < 0.05) (Mi et al. 2006). Increased indoor CO2 in computer
classrooms was associated with headache (OR 1.19 for 100 ppm CO2) (Norbäck
and Nordstrom 2008). Increasing the personal outdoor air flow rate from 1.3 to
11.5 l/s, through installation in schools of new ventilation systems with displace-
ment ventilations, decreased the risk for asthmatic symptoms in pupils (Smedje and
Norbäck 2000). Moreover, a relation between low air exchange rate in schools and
nasal obstruction and nasal inflammation has been demonstrated (Wålinder et al.
1998).
In many countries, schools have no mechanical ventilation system. The number
of pupils per room volume is high, and the natural ventilation of the building is
not enough to reduce CO2 level to normal level. Since window opening has a lim-
ited capacity to reduce indoor CO2 installation of mechanical ventilation system in
schools is needed if the ventilation standards should be fulfilled. Supply-exhaust
ventilation is the most efficient ventilation system to control ventilation and achieve
good air quality. Moreover, this type of ventilation system can be combined with a
heat exchanger to recover heat from the supply air ducts.
In schools, the new type of displacement ventilation system has been shown
to have beneficial health effects, e.g. less nasal obstruction and inflammation
(Wålinder et al. 1998).
In summary, it is important to keep CO2 levels below current standard
(1,000 ppm), which can be achieved either by reducing the number of students and
increasing the ventilation flow. Use of an efficient ventilation system, e.g. displace-
ment ventilation or other types of efficient ventilation, is needed except in very warm
climate where window ventilation can be used to keep CO2 level below 1,000 ppm.
Inadequate ventilation with high CO2 levels is still a problem in schools in many
parts of the world.
8.2.4 Chemical Indoor Exposure
It has been shown in many studies that the indoor concentration of various volatile
organic compounds (VOC) is higher indoors as compared to outdoor levels. Indoor
sources of volatile organic compounds (VOCs) include building materials, con-
sumer products and human emissions. The chemical compounds found indoors have
8 The Influence of School Environment on the SBS Symptoms 141
very different biological properties, and formaldehyde is one of the more irritativecompounds. Formaldehyde, acetone, xylene, limonene, and TVOC have been shownto be significantly related to SBS symptoms in dwellings (Takeda et al. 2009).Another author concludes that exposure to VOCs and formaldehyde can be a majorcause of SBS (Jones 1999).
The term volatile organic compounds (VOC), is used to describe the sum oforganic chemicals within a defined boiling range, usually 50–260C. The term
very volatile organic compounds (VVOC) has sometimes been used for organic
compounds of lower boiling range (<0–100C), and the term semivolatile organic
compounds (SVOC) has been used to describe compounds of a higher boiling range
(240–400C). The concentration of VOC can be different in different parts of the
school. Schools with swimming pool, computer rooms, science and art rooms, can
have higher concentration of certain VOCs.
A wide variety of chemical derived from plastic products, electric apparatus,
interior construction materials, and fabrics can be found in classrooms. One study
found that the most prevalent VOCs in schools were benzene, ethylbenzene, toluene,
xylene, α-pinene and limonene and indoor concentration were usually higher than
outdoor levels (Godwin and Batterman 2007). Shendell et al. (2004) reported higher
concentrations of benzene, toluene, and xylene in classrooms but lower levels
of α-pinene and limonene. On the other hand, Norbäck (1995) reported higher
toluene and limonene concentrations. Godwin and Batterman (2007) measured the
air VOCs concentration in 64 elementary and middle school classrooms in Michigan
and reported the most VOCs had low concentration (mean <4.5 µg/m3). Fromme
et al. (2008) reported the level of TVOC in German classrooms ranged between
110–1,000 (µg/m3) and formaldehyde concentration was 3.1–46.1 (µg/m3). Science
rooms showed the highest concentration of naphthalene (10 µg/m3) and another sci-
ence room had high levels of alpha-pinene (35 µg/m3), a component used in many
cleaning products (Godwin and Batterman 2007).
In some parts of world, for example, in Asia, formaldehyde emission is major
indoor problem in different indoor environments, including schools. Sources include
chip board containing phenol formaldehyde resin and paints and lacquers. In the 96
classroom of school in Saga Prefecture, in Japan, 40% of classrooms, formaldehyde
level were higher than that of the standard of Japanese Ministry of Education (100
µg/m3) and relatively high levels of formaldehyde were found in some music class-
rooms (40–70 ppb) (Ichiba et al. 2009). In a new computer classroom in Japan more
formaldehyde (50 ppb) was detected 1 month after the completion of construction
work, when computers and furniture were carried in, as compared to concentra-
tions immediately after completion of the building (Yura et al. 2005). The origins of
formaldehyde were through to be computer, musical instruments and furniture.
When remodeling old schools without mechanical ventilation, it is crucial to use
low emitting materials. Current asthma was more frequent among pupils exposed to
higher levels of formaldehyde or total level of VOC in schools (Smedje et al. 1997b).
In another Swedish study of primary school personnel, a relation between SBS and
indoor exposure to VOCs was demonstrated (Norbäck et al. 1990). Among semi-
volatile compounds, phthalates in door dust in homes have been related to asthma

142 M. Takaoka and D. Norbäck
and allergy in children (Bornehag et al. 2004). We found no study on health effectsof phthalates or other semi-volatile compounds in schools.
In summary, VOCs from different sources are detected in schools, and the con-centrations can be different in different parts of the school. There are few studies onhealth associations for specific VOC in schools.
8.2.5 Aerosols
Particle levels are often higher in schools than in hospitals or offices, because of lowair exchange rate, inadequate cleaning, and the physical activity of the children. TheWHO air quality guideline for PM10 is 50 µg/m3 (24-h mean). Significant short-term exposures to particles (350–1,320 µg/m3) have been measured when chalk is
applied to the blackboard, or when the board is cleaned (Neuberger et al. 1991).
Norbäck and Nordstrom (2008) reported that the mean PM10 was 15 µg/m3 (range
6–24) at higher air exchange and 20 µg/m3 (range 16–23) at lower air exchange rate
in university computer classrooms. This is well below the WHO air quality guide-
line, but in ordinary classrooms higher levels of <PM10 have been reported. In one
study on European primary schools on five countries, PM10 values in classrooms
were in the range of 50–150 µg/m3 (Simoni et al. 2010). Kim et al. (2007a) reported
that there were considerable variations of indoor PM10 (12–544 µg/m3), with a
mean value of 94 µg/m3 in Swedish classrooms. In five classrooms in Hong Kong
(HK), the average of PM10 concentration were higher than the HK standards and
maximum indoor level PM10 level exceeded 1,000 µg/m3 (Lee and Chang 2000).
Stranger et al. (2008) measured that the indoor air quality of 27 primary schools in
Belgium and reported on indoor concentration of particles < 2.5 microns diameter
(PM2.5) and elemental composition. They detected K, Ca, Ti, V, Cr, Mn, Fe, Ni, Cu,
Zn, Br, Pb, Al, Si, S and Cl, and black smoke and analysis of the elemental compo-
sition of PM2.5s (particle less than 2.5 µm) indicated a considerable contribution of
soil dust to indoor PM2.5 mass.
In the study by Kim et al. (2007a) there were no association between PM10 con-
centration and asthmatic symptoms. In two other Swedish school studies, a relation
between respirable dust and eye irritation in school personnel has been demon-
strated (Norbäck et al. 1990), as well as relation between respirable particles and
asthmatic symptoms in pupils (Smedje et al. 1997a). Simoni et al. (2010) reported
an association between PM10 and nasal obstruction.
In summary, PM10 is often above the recommended limit value of 50 µg/m3 in
ordinary classrooms, and some studies have found health effects of PM10 schools.
8.2.6 Bioaerosols and Building Dampness
There is evidence from many studies that exposure to damp buildings is related to
an increase of asthma bronchiale, and SBS symptoms (Bornehag et al. 2001; WHO

8 The Influence of School Environment on the SBS Symptoms 143
2009). Most of these studies have been dealing with health effects of dampnessin the home environment, there are fewer studies on building dampness in schoolbuildings.
There are various exposures related to building dampness, including house dustmite allergens, moulds and bacteria. In addition, building dampness may causedegradation of phthalate esters in PVC materials or water based floor glue, caus-ing an emission of 2-ethyl-1-hexanol (Wieslander et al. 1999). There are varioussources of indoor moulds and bacteria, including contaminated building materials,contaminated air filters, humidifiers, settled dust stirred up when the students aremoving, and the outdoor environment.
Bacteria and moulds may grow in building material when the moisture contentis high. Microbial growth within the building structure seems to be more commonin colder climates, while microbial growth at exposed surfaces is more common inhotter climates. In some cases, negative pressure in buildings may cause vents frombelow the floor void or sump to become air intakes. This is a known cause of radoningress from the sub foundation soil, but it may also lead to microbial contaminationof incoming air (Thorne 1993). In schools with sign of dampness, the levels of dustand dust mite allergens were slightly higher than in school without sign (Zock andBrunekreef 1995).
Godwin and Batterman (2007) reported that the variability of bioaerosol con-centrations within schools exceeded the variability between schools and five moldgenera were detected in schools, of which Aspergillus/Penicillium was most com-mon and was found in all classrooms and outdoor samples. Kim et al. (2007a)identified viable microbial species in indoor and outdoor air. Most common wasCladosporium sp. (indoor prevalence; 87%, outdoor prevalence; 100%), Sterile
mycelia (indoor prevalence; 48%, outdoor prevalence; 100%) and the gram-negative bacteria Pseudomonas sp. (indoor prevalence 57%, outdoor prevalence;75%). In another Swedish school stud, the most common micro-organisms wereCladosporium, and penicillium which were found 68 and 54% of the classrooms.
Usually, microbiological investigators of indoor air measure only viable organ-isms, and mainly microfungi. This may, however, lead to falsely low levels, sincenormally only about 1% of airborne microorganisms are viable (Table 8.1). Becauseof this, we recommended that non viable organisms, both bacteria and moulds,should be included in the measurements. There are various methods to assess totallevels of moulds and total bacteria, e.g. the CAMNEA method (Palmgren et al.1986). This method determine total number of airborne fungi and bacteria collectedon Nucleopore filter by acridine orange staining and epifluorescence microscopy.Other methods include measurement of fungal DNA (Cai et al. 2009), ergosterol andbeta-1-3 glucan as indicators of fungi, and chemical markers such as muramic acid,endotoxin, and 3-hydroxy fatty acids from endotoxin (Zhao et al. 2008). At higherconcentrations of viable bacteria or molds in school where more pupils reportedcurrent asthma (Smedje et al. 1997b). In a Danish school study, the concentrationof colony forming units of molds in floor dust was positively associated with eyeirritation throat irritation headache, concentration problem, and dizziness in pupils(Meyer et al. 2004).

144 M. Takaoka and D. Norbäck
Moulds and bacteria emit specific VOC, microbial VOC (MVOC) (Wessen andSchoeps 1996). One Swedish school study reported that the concentration of most ofthe MVOC were 3–5 times higher indoors as compared to outdoor levels. Moreover
at higher indoor concentrations of total MVOC, nocturnal breathlessness and doctor-
diagnosed asthma were significantly more common (Kim et al. 2007b). Moreover, it
was reported from another school study that there are positive associations between
indoor MVOC and asthma in school personnel (Smedje et al. 1996). In summary,
there can be a significant exposure to bacteria and moulds in some school environ-
ments, and mould exposure in schools can be related to both SBS and asthmatic
symptoms.
8.2.7 Settle Dust
Aerosols may rapidly be removed from the air by sedimentation and impaction.
Settled dust might be released again to the air due to certain activities especially
from fleecy material. The tracking in of dust, in combination with poor cleaning,
has resulted in widespread contamination of schools by cat and dog allergens (Munir
et al. 1993; Smedje et al. 1997a; Tranter 2005). Settled dust may also contain vari-
ous other types of pollutants, including microorganisms, pesticides, polychlorinated
biphenyls, lead, and polycyclic aromatic hydrocarbons (PAH). In a large Danish
Town Hall study, settled macromolecular organic dust (MOD) was shown to be one
important exposure indicator related to sick building syndrome in office workers
(Skov and Valbjorn 1990). The average exposure to MOD in Danish schools was
found to be 2.3 mg/g of dust (Thorstensen et al. 1990), somewhat higher levels than
the average of 1.5 mg/g of MOD measured in the Town Hall Study. The total amount
of dust, vacuumed from 12 m2 of floor surface, was also somewhat higher in schools
than in offices (4.5 and 3.7 g, respectively). New floors (= less than 10 years old)
contained less dust than old floors (Zock and Brunekreef 1995).
8.2.8 Allergens in Settle Dust
While the majority of exposure to indoor allergens occurs in home, children spend
a large portion time of their day at school. The school environment can be an
important site of exposure to cat and dog allergens, house dust mite allergens and
cockroach allergens. Despite the lack of direct animal contact, schools in the tem-
perate climate zones are frequently contaminated by cat and dog allergens, and in
some countries even horse allergen. Although pets are not supposed to be present
at school, pet owners carry the pet allergens in their hair and clothes. Pet allergens
are easily transported to school environment. Tranter showed in the review, research
has paid special attention to school environment as a second source, besides the
home environment for exposure to allergens (Tranter 2005). Allergens are fre-
quently found in settle dust in the classrooms. Allergen measurements in settled dust

8 The Influence of School Environment on the SBS Symptoms 145
Table 8.2 Cat, Dog, Horse, Cockroach, house dust mite and mouse allergen concentrations insettled schools dust
Swedena Swedenb Chinac Koread
Medianmin–max
Medianmin–max
Medianmin–max
Medianmin–max
Cat allergen: 860 131 <100 <200Fel d 1 (ng/g dust) <200–4,700 <16–391 <100–177 <200–1,360Dog allergen: 750 921 <200 670Can f 1 (ng/g dust) <200–6,200 <60–3,990 <200–527 <200–4,685Horse allergen: 945 NA <200 <200Equ cx (U/g dust) <200–31,000 <200–<200 <200–650Cockroach allergen: NA NA NA <200Bla g 1 (U/g dust) <200House dust mite allergen: NA NA NA 250Der f 1 (ng/g dust) <200–850
NA = not analyze.aNine schools (six in the primary schools and three in the junior high schools) (Kim et al. 2005).bThirty nine schools (28 in the primary schools and 11 in the secondary schools) (Smedje et al.1997a).cTen junior high school (39 classroom) (Zhao et al. 2006).dTwenteen elementary schools (Kim et al. 2007b).
in classrooms are commonly used as a proxy-variable for indoor allergen exposure
in school (Tranter 2005).
Several European countries have reported wide spread contamination of cat and
dog allergens in schools (Almqvist et al. 2001). The reported concentrations were
shown in Table 8.2. Cat allergens (Fel d 1) median values range from < 100 ng/g
dust in Chinese schools (Zhao et al. 2006) to 860 ng/g dust in Sweden schools
(Kim et al. 2005). Dog allergen (Can f 1) median values range from <200 ng/g
dust in Chinese schools (Zhao et al. 2006) to 920 ng/g dust in Swedish schools
(Smedje et al. 1997a). Most median values of dog allergens were higher than the
values of cat allergens. The number of pet owners correlated strongly the concen-
tration of pets allrgens (r2 = 0.93) (Patchett et al. 1997). The levels of dust mite
allergen (Der f 1, Der p 1) were relatively low in schools of USA (Amr et al. 2003;
Sheehan et al. 2009) and Sweden (Kim et al. 2005). Cockroach allergens (Bla 1 or
2) were the least frequently measured allergen. The higher cockroach and mouse
allergen levels were detected in areas of school where food is present (Amr et al.
2003). Table 8.3 shows the geometric means of each of six allergens in school com-
pared to home and there were significant higher levels of mouse allergen in schools
versus homes but the relative absence of dust mite allergens in schools (Sheehan
et al. 2009).
Among building factors influencing allergen levels, dust mite concentration dif-
ferences between ground and upper floor attributed to dampness in the ground
floors (Einarsson et al. 1995; Munir et al. 1993). Higher exchange rates were
weakly associated with lower cat allergens (r = –0.316), but continuous operation
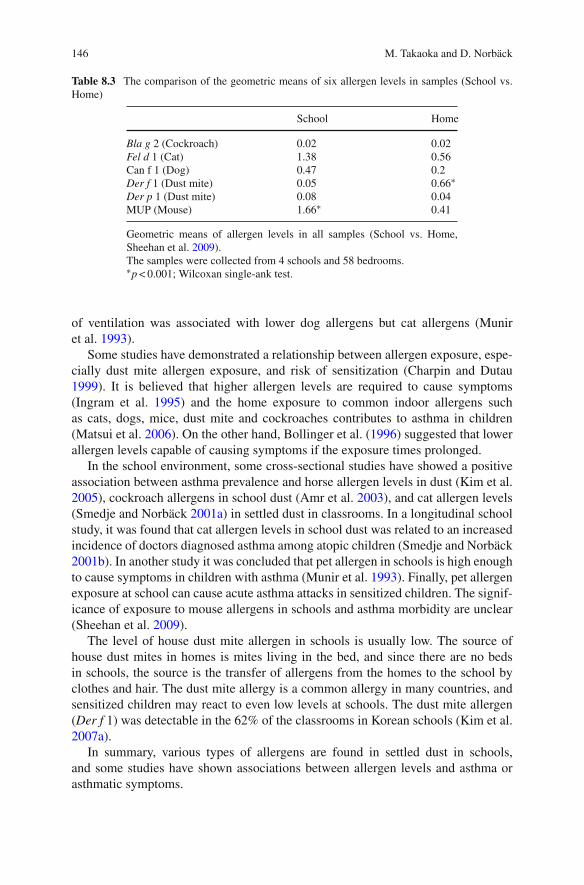
146 M. Takaoka and D. Norbäck
Table 8.3 The comparison of the geometric means of six allergen levels in samples (School vs.Home)
School Home
Bla g 2 (Cockroach) 0.02 0.02Fel d 1 (Cat) 1.38 0.56Can f 1 (Dog) 0.47 0.2Der f 1 (Dust mite) 0.05 0.66∗
Der p 1 (Dust mite) 0.08 0.04MUP (Mouse) 1.66∗ 0.41
Geometric means of allergen levels in all samples (School vs. Home,Sheehan et al. 2009).The samples were collected from 4 schools and 58 bedrooms.∗p < 0.001; Wilcoxan single-ank test.
of ventilation was associated with lower dog allergens but cat allergens (Muniret al. 1993).
Some studies have demonstrated a relationship between allergen exposure, espe-cially dust mite allergen exposure, and risk of sensitization (Charpin and Dutau1999). It is believed that higher allergen levels are required to cause symptoms(Ingram et al. 1995) and the home exposure to common indoor allergens suchas cats, dogs, mice, dust mite and cockroaches contributes to asthma in children(Matsui et al. 2006). On the other hand, Bollinger et al. (1996) suggested that lowerallergen levels capable of causing symptoms if the exposure times prolonged.
In the school environment, some cross-sectional studies have showed a positiveassociation between asthma prevalence and horse allergen levels in dust (Kim et al.2005), cockroach allergens in school dust (Amr et al. 2003), and cat allergen levels(Smedje and Norbäck 2001a) in settled dust in classrooms. In a longitudinal schoolstudy, it was found that cat allergen levels in school dust was related to an increasedincidence of doctors diagnosed asthma among atopic children (Smedje and Norbäck2001b). In another study it was concluded that pet allergen in schools is high enoughto cause symptoms in children with asthma (Munir et al. 1993). Finally, pet allergenexposure at school can cause acute asthma attacks in sensitized children. The signif-icance of exposure to mouse allergens in schools and asthma morbidity are unclear(Sheehan et al. 2009).
The level of house dust mite allergen in schools is usually low. The source ofhouse dust mites in homes is mites living in the bed, and since there are no bedsin schools, the source is the transfer of allergens from the homes to the school byclothes and hair. The dust mite allergy is a common allergy in many countries, andsensitized children may react to even low levels at schools. The dust mite allergen(Der f 1) was detectable in the 62% of the classrooms in Korean schools (Kim et al.2007a).
In summary, various types of allergens are found in settled dust in schools,and some studies have shown associations between allergen levels and asthma orasthmatic symptoms.
8 The Influence of School Environment on the SBS Symptoms 147
8.3 Other Factores
8.3.1 Carpeting and Textile Surface
If the classrooms contain carpets, e.g. wall-to-wall carpets, dust may be accumu-lated in the school. Wall-to-wall carpeting in schools has been shown to be relatedto SBS, and symptoms are reduced if the carpets are removed (Ibsen et al. 1981;Norbäck and Torgen 1989). Moreover, it has been demonstrated that dust from car-peted schools is more prone to induce basophilic reactions in cell cultures (Dybendaland Elsayed 1994), and that school carpets are more contaminated with moulds andbacteria than hard floors, or office carpets (Gravesen et al. 1986). Schools with car-peting was found to have higher concentrations of cat, dog and dust mite allergensin settled dust than schools with hard floors (Amr et al. 2003; Zock and Brunekreef1995). Carpet and/or rugs are the effective reservoirs for collecting dust. Bioaerosollevels in the air have been shown to be positively associated with the presence ofcarpeting, suggesting that carpeting may be a source of bioaerosols in the in schools(Godwin and Batterman 2007).
There is a decrease in the use of wall-to-wall carpeting in schools, but in centralEurope and USA, carpeting in schools may still be a problem. In schools withoutcarpeting, major reservoirs of cat and dog allergens are chairs, school desks, and tex-tiles. Typically, the allergen content is 100 times greater in dust from school desks,as compared to dust from hard floors. Amr et al. (2003) reported the highest level ofDer f 1/p 1 was found in school, where most of the classrooms were carpeted and insome case even had additional rugs on top of carpeting. The presence of carpetingwas associated with Aspergillus concentrations and total bioaerosol concentrations(Godwin and Batterman 2007).
In summary, carpeting and other textile surfaces in schools may accumulatevarious particle pollutants, such as allergens and microbial compounds, and theincreased exposure may lead to higher risk for SBS and other health problems.
8.3.2 Illumination
Adequate illumination is important in schools, and natural daylight seems to havebeneficial health effects. There are few studies on the health significance of illumi-nation in schools. In one study, health and behavior of children in classrooms withand without windows were compared. The results indicated that children in win-dowless classrooms had impaired levels of stress hormones, which influenced bothbody growth and ability to concentrate and co-operate (Kuller and Lindsten 1992).
8.3.3 Noise
The mains source of noise in schools is human voice and human activities, but insome schools traffic from nearby roads may contribute to the noise level in the

148 M. Takaoka and D. Norbäck
classroom. One Swedish study has demonstrated an association between cortisolin saliva, a marker of stress in the pupils, and the pupil’s exposure to noise at school
(Wålinder et al. 2007).
8.4 Conclusion and Recommendation
Concerning the physical environment, there is evidence that the schools environ-
ment can affect the prevalence of asthma, sick building syndrome, and subjective
air quality. Since there is a large increase of asthma and allergic disorders in the
population, exposure to allergens, microorganisms, and volatile organic compounds
should be minimized. This is particularly important for young subjects with known
hereditary disposition for allergy. Complaints on poor air quality in schools, should
be considered as an early indication of disturbances in the indoor environment.
If measures are taken to reduce the complaint rate at an early stage, the develop-
ment of more severe conditions like SBS or asthma and allergy can be prevented.
Moreover, there are indications that impaired indoor environment in school may
impair learning and mental ability.
Control of room temperature and effective cleaning routines are simple means to
reduce the prevalence of SBS-symptoms. Cleaning should be applied, not only to
the floors but also to other horizontal surfaces. Exposure to microorganisms, which
may grow in damp buildings, or be spread by air-conditioning systems, should also
be minimized. Chemical emissions from building materials should be reduced, by
selection of low emitting materials and products. This is particularly important when
old schools, with natural ventilation only, are remodeled. Moreover, carpeting and
other textile materials should be removed, unless it can be clearly demonstrated that
they are properly cleaned.
Adequate maintenance of the school building is an important issue. The rooms
in school should be monitored for the signs of dampness and moisture damages.
Immediate action are warranted in schools to prevent dampness problem, higher
room temperature, inadequate ventilation, excess indoor exposures chemical sub-
stance such as formaldehyde and VOC, and contamination of some allergens of
dust for the health of students.
Personal outdoor air supply rate in buildings should be kept at current venti-
lation standards. Installation of mechanical ventilation is a way to ensure that the
ventilation requirements are fulfilled. There is evidence that installation of displace-
ment ventilation system gives beneficial effects health effects and reduced indoor
exposure in classrooms. Return air ventilation systems should be avoided since it
enhances the indoor level of volatile organic compounds and other indoor pollutants.
Schools are public buildings which should be expected to meet high standards of
environmental quality. More effort is needed in the future to create healthy school
environments in the future.

8 The Influence of School Environment on the SBS Symptoms 149
References
Almqvist C, Wickman M, Perfetti L, Berglind N, Renström A, Hedrén M, Larsson K, Hedlin G,Malmberg P (2001) Worsening of asthma in children allergic to cats, after indirect exposure tocat at school. Am J Respir Crit Care Med 163:694–698.
Amr S, Bollinger ME, Myers M, Hamilton RG, Weiss SR, Rossman M, Osborne L, Timmins
S, Kimes DS, Levine ER, Blaisdell CJ (2003) Environmental allergens and asthma in urban
elementary schools. Ann Allergy Asthma Immunol 90(1):34–40.
ASHRAE (1999) ASHRAE standard 62-1999: Ventilation for acceptable indoor air quality.
American Society of Heating, Refrigeration and Air conditioning Engineers Incorporation,
Atlanta.
Bollinger ME, Eggleston PA, Flanagan E, Wood RA (1996) Cat antigen in homes with and without
cats May induce allergic symptoms. J Allergy Clin Immunol 97(4):907–914.
Bornehag CG, Blomquist G, Gyntelberg F, Järvholm B, Malmberg P, Nordvall L, Nielsen A,
Pershagen G, Sundell J (2001) Dampness in buildings and health: Nordic interdisciplinary
review of the scientific evidence on associations between exposure to “dampness” in buildings
and health effects. Indoor Air 11:72–86.
Bornehag CG, Sundell J, Weschler CJ (2004) The association between asthma and allergic symp-
toms in children and phthalates in house-dust: A nested case-control study. Environ Health
Perspect 112:1393–1397.
Cai GH, Bröms K, Mälarstig B, Zhao ZH, Kim JL, Svärdsudd K, Janson C, Norbäck D (2009).
Quantitative PCR analysis of fungal DNA in swedish day care centers and comparison with
building characteristics and allergen levels. Indoor Air 19:392–400.
Charpin D, Dutau H (1999) Role of allergens in the natural history of childhood asthma. Pediatr
Pulmonol Suppl 18:34–36.
Daisey JM, Angell WJ, Apte MG (2003) Indoor air quality, ventilation and health symptoms in
schools: An analysis of existing information. Indoor Air 13(1):53–64.
Dybendal T, Elsayed S (1994) Dust from carpeted and smooth floors: V. Cat (fel d I) and mite (der
p I and der f I) allergen levels in school dust. Demonstration of the basophil histamine release
induced by dust from classrooms. Clin Exp Allergy 22:1100–1106.
Einarsson R, Munir AK, Dreborg SKJ (1995) Major mite (der p I, der f I) allergens in dust from
swedish schools. Allergy Clin Immunol 95:1049–1053.
Faustman EM, Silbernagel SM, Fenske RA, Burbacher TM, Ponce RA (2000) Allergens in school
dust: II. Mechanisms underlying children’s susceptibility to environmental toxicants. Environ
Health Perspect 108 Suppl 1(1):13–21.
Fromme H, Heitmann D, Dietrich S, Schierl R, Körner W, Kiranoglu M, Zapf A, Twardella D
(2008) Air quality in schools – classroom levels of carbon dioxide (CO2), volatile organic
compounds (VOC), aldehydes, endotoxins and cat allergen. Gesundheitswesen 70(2):88–97.
Godish T, Spengler JD (1996) Relationships between ventilation and indoor air quality: A review.
Indoor Air 6:135–145.
Godwin C, Batterman S (2007) Indoor air quality in michigan schools. Indoor Air 17(2):109–121.
Gravesen S, Larsen L, Gyntelberg F, Skov P (1986) Demonstration of microorganisms and
dust in schools and offices-an observational study of non-industrial buildings. Allergy 41:
520–525.
Heyman E (1880) Contribution to the knowledge on the air quality in schools. Nordiskt Medicinskt
Arkiv XII(2):1–47 (in Swedish with summary in French).
Ibsen KK, Valbjorn O, Nielsen A (1981) The indoor environment and symptoms of disease.
Assessment of the conditions in schools in copenhagen. Ugeskr Laeger 143:1919–1923
(in Danish with abstract in English).

150 M. Takaoka and D. Norbäck
Ichiba M, Takahashi T, Yamashita Z, Takaishi K, Nishimura K, Kamachi M, Kondoh T, MatsumotoA, Ueno D, Miyajima T (2009) Approach to sick building problem in schools: A workshop“saga forum on environment” project. Nippon Eiseigaku Zasshi 64(1):26–31 (In Japanese).
Ingram JM, Sporik R, Rose G, Honsinger R, Chapman MD, Platts-Mills TA (1995) J quantitative
assessment of exposure to dog (canf 1) and cat (feld 1) allergens: Relation to sensitiza-
tion and asthma among children living in los alamos, new mexico. Allergy Clin Immunol
96(4):449–456.
Jaakkola JJK, Heinonen OP, Seppänen O (1989) Sick building syndrome, sensation of dryness
and thermal comfort in relation to room temperature in an office building: Need for individual
control of temperature. Environ Int 15:163–168.
Jones AP (1999) Indoor air quality and health. Atmos Environ 33:4535–4564.
Kim JL, Elfman L, Mi Y, Johansson M, Smedje G, Norbäck D (2005) Current asthma and res-
piratory symptoms among pupils in relation to dietary factors and allergens in the school
environment. Indoor Air 15:170–182.
Kim JL, Elfman L, Wieslander G, Smedje G, Norbäck D (2007a) Indoor moulds, bacteria, micro-
bial volatile organic compounds (MVOC) and plasticizers in school: Associations with asthma
and respiratory symptoms in pupils. Indoor Air 17:153–163.
Kim JL, Elfman L, Norbäck D (2007b) Asthma and respiratory symptoms, and allergen levels in
schools – comparison between korea and sweden. Indoor Air 17:122–129.
Kuller R, Lindsten C (1992) Health and behaviour of children in classrooms with and without
windows. J Environ Psychol 12:305–317.
Landrigan PJ (1998) Environmental hazards for children in USA. Int J Occup Med Environ Health
11(2):189–194.
Lee SC, Chang M (2000) Indoor and outdoor air quality investigation at schools in hong kong.
Chemosphere 41(1–2):109–113.
Matsui EC, Eggleston PA, Buckley TJ, Krishnan JA, Breysse PN, Rand CS, Diette GB (2006)
Household mouse allergen exposure and asthma morbidity in inner-city preschool children.
Ann Allergy Asthma Immunol 97(4):514–520.
Mendell MJ, Heath GA (2005) Erratum in: Do indoor pollutants and thermal conditions in schools
influence student performance? A critical review of the literature. Indoor Air 15(1):27–52.
Meyer HW, Würtz H, Suadicani P, Valbjørn O, Sigsgaard T, Gyntelberg F (2004) Members of a
working group under the danish mould in buildings program (DAMIB): Molds in floor dust and
building-related symptoms in adolescent school children. Indoor Air 14(1):65–72.
Mi YH, Norbäck D, Tao J, Mi YL, Ferm M (2006) Current asthma and respiratory symptoms
among pupils in shanghai, china: Influence of building ventilation, nitrogen dioxide, ozone,
and formaldehyde in classrooms. Indoor Air 16(6):454–464.
Munir AKM, Einarsson R, Schou C (1993) Allergens in school dust: I. The amount of the major
cat (fel d I) and dog (can f I) allergens in dust from swedish schools is high enough to probably
cause perennial symptoms in most children with asthma who are sensitized to cat and dog.
J Allergy Clin Immunol 91:1067–1074.
National Swedish Board of Occupational Safety and Health (1993) Ventilation and Quality of Air.
AFS, Stockholm (in Swedish).
Neuberger JS, Darrel D, Newkirk D, Cotter J, Thorpe A, Wood C, Irwin JCD (1991) Diminished
air quality and health problems in a kansas city, kansas, elementary school. J School Health
61:439–442.
Norbäck D (1995) Subjective indoor air quality in schools – the influence of high room tem-
perature, carpeting, fleecy wall materials and volatile organic compounds (VOC). Indoor Air
5:237–246.
Norbäck D (1997) The teacher, the pupil and the school. In Brune D, Gerhardsson G, Crockford G,
and Norbäck D (Eds.) The Workplace, vol. 2. Major industries and occupations: International
occupational safety and health information centre (CIS) international labour office (ILO),
geneva, scandinavian science publisher, oslo.

8 The Influence of School Environment on the SBS Symptoms 151
Norbäck D (2009) An update on sick building syndrome. Curr Opin Allergy Clin Immunol9:55–59.
Norbäck D, Nordström K (2008) Sick building syndrome in relation to air exchange rate, CO(2),
room temperature and relative air humidity in university computer classrooms: An experimental
study. Int Arch Occup Environ Health 82(1):21–30.
Norbäck D, Smedje G (1997) Aerosols, subjective indoor air quality and asthma in schools. Ann
Occup Hyg 41; (Suppl 1):689–694.
Norbäck D, Torgen M (1989) A longitudinal study relating carpeting with sick building syndrome.
Environ Int 15:129–135.
Norbäck D, Torgen M, Edling C (1990) Volatile organic compounds, respirable dust and personal
factors related to prevalence and incidence of sick building syndrome in primary schools. Br J
Ind Med 47:733–741.
Palmgren U, Ström G, Blomqvist G, Malmberg P (1986) Collection of airborne micro-organisms
on nucleopore filters, estimation and analysis – CAMNEA method. J Appl Bacteriol 61:
401–406.
Patchett K, Lewis S, Crane J, Fitzharris P (1997) Cat allergen (fel d 1) levels on school children’s
clothing and in primary school classrooms in wellington, new zealand. J Allergy Clin Immunol
100:755–759.
Pettenkofer M (1858) Uber den Luftwechsel in Wohngebäuden, Cotta’schen Buchhandlung,
Munchen.
Salo PM, Sever ML, Zeldin DC (2009). Indoor allergens in school and day care environments.
J Allergy Clin Immunol 124(2):185–192.
Sennhauser FH, Braun-Fahrländer C, Wildhaber JH (2005) The burden of asthma in children: A
european perspective. Paediatr Respir Rev 6(1):2–7.
Seppanen OA, Fisk WJ (2004) Summary of human responses to ventilation. Indoor Air 14:102–118
Sheehan WJ, Rangsithienchai PA, Muilenberg ML, Rogers CA, Lane JP, Ghaemghami J, Rivard
DV, Otsu K, Hoffman EB, Israel E, Gold DR, Phipatanakul W (2009) Mouse allergens in
urban elementary schools and homes of children with asthma. Ann Allergy Asthma Immunol
102(2):125–130.
Shendell DG, Prill R, Fisk WJ, Apte MG, Blake D, Faulkner D (2004) Associations between
classroom CO2 concentrations and student attendance in washington and idaho. Indoor Air
14(5):333–341.
Simoni M, Annesi-Maesano I, Sigsgaard T, Norbäck D, Wieslander G, Nystad W, Canciani M,
Sestini P, Viegi G (2010) School air quality related to dry cough, rhinitis, and nasal patency in
children. Eur Respir J 35(4):742–749.
Skov P, Valbjörn O (1990) Influence of indoor climate on the sick building syndrome in an office
environment. Scand J Work Environ Health 16:363–371.
Smedje G, Norbäck D (2000) New ventilation systems at selected schools in sweden-effects on
asthma and exposure. Arch Environ Health 55:18–25.
Smedje G, Norbäck D (2001a) Irritants and allergens at school in relation to furnishings and
cleaning. Indoor Air 11:127–133.
Smedje G, Norbäck D (2001b) Incidence of asthma diagnosis and self-reported allergy in relation
to the school environment – a four-year follow-up study in schoolchildren. Int J Tubercl Lung
Dis 5:1059–1066.
Smedje G, Norbäck D, Edling C (1997a) Subjective indoor air quality in schools in relation to
exposure. Indoor Air 7:143–150.
Smedje G, Norbäck D, Edling C (1997b) Asthma among secondary school pupils in relation to the
school environment. Clin Exp Allergy 27:1270–1278.
Smedje G, Norbäck D, Wessen B, Edling C (1996) Asthma among school employees in relation
to the school environment. Indoor Air’ 96: Proceedings of the 7th international conference on
indoor air quality and climate, July 21–26, 1996, Nagoya.
Stranger M, Potgieter-Vermaak SS, Van Grieken R (2008) Characterization of indoor air quality in
primary schools in Antwerp, Belgium. Indoor Air 18(6):454–463.

152 M. Takaoka and D. Norbäck
Takeda M, Saijo Y, Yuasa M, Kanazawa A, Araki A, Kishi R (2009) Relationship betweensick building syndrome and indoor environmental factors in newly built Japanese dwellings.Int Arch Occup Environ Health 82(5):583–593.
Thorne PS (1993) Sump additives as a source of bioaerosols in a school building. Vet Hum Toxicol35:141–143.
Thorstensen E, Hansen C, Pejtersen J, Clausen GH, Fanger PO (1990) Air pollution sources andindoor air quality in schools. Indoor Air’ 90 Proceedings of the 5th international conference onindoor air and climate, July 29–August 3, 1990, Toronto.
Tranter DC (2005) Review: Indoor allergens in settled school dust – A review of findings andsignificant factors. Clin Exp Allergy 35(2):126–136.
Wålinder R, Gunnarsson K, Runeson R, Smedje G (2007) Physiological and psychological stressreactions in relation to classroom noise. Scand J Work Environ Health 33(4):260–266.
Wålinder R, Norbäck D, Wieslander G, Smedje G, Erwall C, Venge P (1998) Nasal patency andbiomarkers in nasal lavage – the significance of air exchange rate and type of ventilation inschools. Int Arch Occup Environ Health 71:479–486.
Wålinder R, Norbäck D, Wieslander G, Smedje G, Erwall C, Venge P (1999) Nasal patency andlavage biomarkers in relation to settled dust and cleaning routines in schools. Scand J WorkEnviron Health 25:137–143.
Wessen B, Schoeps KO (1996) Microbial volatile organic compounds-what substances can befound in sick buildings? Analyst 121:1203–1205.
Wieslander G, Norbäck D, Nordström K, Wålinder R, Venge P (1999) Nasal and ocular symptoms,tear film stability and biomarkers in nasal lavage, in relation to building design in hospitals.Int Arch Occup Environ Health 72:451–461.
World Health Organisation (WHO), Regional Office for Europe (2009) WHO Air QualityGuidelines for Indoor Air Quality: Dampness and Mould. WHO, Copenhagen.
Wyon DP (1993) Healthy buildings and their impact on productivity. In: Seppänen O, Jaakola JJK,Ilmarinen R, Kukkonen E, Sateri J, Vuorelma H. (Eds.) Indoor air ‘93 proceeding of the 6thinternational conference on indoor air quality and climate, July 4–8, 1993, Helsinki.
Yura A, Iki M, Shimizu T (2005) Japanese: Indoor air pollution in newly built or reno-vated elementary schools and its effects on health in children. Nippon Koshu Eisei Zasshi52(8):715–726.
Zhao ZH, Elfman L, Wang ZH, Zhang Z, Norbäck D (2006) A comparative study of asthma,pollen cat and dog allergy among pupils and allergen levels in schools in taiyuan city, chinaand uppsala, sweden. Indoor Air 16:404–413
Zhao Z, Sebastian A, Larsson L, Wang Z, Zhang Z, Norbäck DS (2008) Asthmatic symptomsamong pupils in relation to microbial dust exposure in schools in taiyuan, china. Pediatr AllergyImmunol 19:455–465.
Zock JP, Brunekreef B (1995) House dust mite allergen levels in dust from schools with smoothand carpeted classroom floors. Clin Exp Allergy 25(6):549–553.

Chapter 9
Microbial Ecology of Indoor Environments: TheEcological and Applied Aspects of MicrobialContamination in Archives, Librariesand Conservation Environments
Flavia Pinzari
9.1 Variability and Sources of Fungal Presence in Interior
Environments
Fungal and bacterial spores and propagules found in the dust of indoor environmentscan be regarded as active inhabitants of dust, or as elements passively introducedby other sources (Davies 1960). If the concentration of viable fungal or bacterialspores belonging to the same strain exceeds 2–300 CFU/mg (Hunter et al. 1988;
Bronswijk et al. 1986; Kalliokoski et al. 1996), they cannot be considered as being
casually introduced, and must therefore be supposed to have been generated within
the indoor environment.
In manmade habitats common sources of fungal or bacterial spores and propag-
ules are so-called “amplification sites” which can produce characteristic patterns of
species distribution in indoor dust. In fact, when active growth of fungal mycelia or
bacterial biofilm takes place in a closed environment the biological composition of
the dust can differ considerably from that found in outdoor environments, since it
becomes dominated by a single abundant species (Miller 1992; Miller et al. 1988).
Typical “amplification sites” are damp walls presenting mould growth and bacterial
proliferation, or ventilation systems containing contaminated filters (Bouilly et al.
2005).
Additionally, the contribution to indoor microflora made by outdoor fungal and
bacterial sources can vary widely. The introduction of spores to indoor air from the
outside is usually related to weather conditions, such as wind speed, precipitation
and daily temperature fluctuations, which play a role in defining the mechanisms by
means of which spores and propagules are dispersed in natural environments (Ingold
1965; Li and Kendrick 1994, 1995; Gallo et al. 1999). The fungal component of dust
biodiversity is greatly underestimated, either because only a few studies (to date)
have provided thorough mycological characterizations of indoor dust (Samson et al.
F. Pinzari (B)Istituto Centrale per il Restauro e la Conservazione del Patrimonio Archivistico e LibrarioMinistero per i Beni e le Attività Culturali, 00184 Rome, Italye-mail: [email protected]
153S.A. Abdul-Wahab (ed.), Sick Building Syndrome,DOI 10.1007/978-3-642-17919-8_9, C© Springer-Verlag Berlin Heidelberg 2011

154 F. Pinzari
2002), or because some of the fungal species that colonise indoor environments areeasily overlooked due to their peculiar growth requirements.
Apart from the natural variability in the number of different fungal and bacterialspecies that can be found in indoor environments, there is also variability in thestatistics representing their numbers, depending on the sampling methods employed(Fig. 9.1) and the peculiarities of the environments investigated. In a survey carriedout by Hoekstra et al. (1994) in 60 households in Northern Europe regarding thepresence of fungal spores found in domestic dust, 108 fungal species belonging to54 genera were detected. However, in most of the studies conducted a great variationin the species found in samples taken a few weeks apart or using different isolationmedia was observed.
A small number of surveys that can be used for reference when defining overallquality of indoor air are currently available (Verhoeff et al. 1990; Van Reenen-Hoekstra et al. 1991; Reponen et al. 1994; Li and Kendrick 1994; Pirhonen et al.1996; Wu et al. 2000; Su et al. 2001; Shelton et al. 2002; Mendrela-Kuder 2003;Strauss 2004; Kalogerakis et al. 2005). Guidelines have been proposed in somecountries based on different standards and sampling methods. For example, accord-ing to the Italian Official Document for Conservation of Indoor Cultural Heritage
Fig. 9.1 Volumetric sampling of air using a Surface Air System (SAS) instrument in the storagearea of a public library. Within the sampler a Petri contact plate coated with nutrient agar is exposedto a flow of air for a pre-defined sampling period

9 Microbial Ecology of Indoor Environments 155
(“Atto di indirizzo sui criteri tecnico-scientifici e sugli standard di funzionamento
e sviluppo dei musei”), the fixed limit for fungal contamination of museum envi-ronments is 150 colony forming units (CFUs) per m3 (CFU/m3). Several limitsas regards colony forming units for each m3 of indoor air have been proposedby international and national health organisations, such as the Commission ofEuropean Committees (Luxembourg), which in 1993 established different thresh-olds for domestic spaces and non-industrial indoor environments ranging from 25to 10,000 CFU/m3, and the World Health Organization (1988), which fixed a limitof 500 CFU/m3, above which it is possible to hypothesise an indoor air quality prob-lem (i.e. biological contamination). In addition, in 2008 at the pan-European level,international standards regarding sampling methods used for the detection and enu-meration of moulds in the indoor environments were officially proposed as an ISOStandard (ISO/TC 146/DIS 16000-17/18/19).
Aerobiological surveys in indoor environments such as public offices, hospitals,schools and museums are usually based on lists of species of fungi and/or bacte-ria; details of the relationship between the findings and the “ecology” of the closedenvironment where the species were sampled is frequently lacking. Given the natu-ral variability in the presence of fungal spores in the air (Jones and Harrison 2004;Liao et al. 2004), biological “air quality” in an indoor environment can be bet-ter defined by using bioindicators rather than by using a fixed number of CFUs.According to some authors (Samson et al. 1994), fungi which have as a growthrequirement water activity (aw) above 0.85 can be regarded as indicator organismsfor the presence of damp problems in indoor environments. A survey carried outby Salonen et al. (2007) during winter on 77 office buildings located in a subarcticclimate zone using an impactor demonstrated that Cladosporium isolates were thecommonest fungi detected in the samples collected from indoor air and in settleddust, in both mould-afflicted and “healthy”control buildings. According to Salonenet al. (2007), the airborne concentrations of Penicillium, Aspergillus versicolor
and yeasts can be considered good indicators of mould-related problems in indoorenvironments.
Basilico et al. (2007) analysed the concentration and types of airborne fungalspores present in samples of indoor air collected in 49 houses situated in SantaFe City (Argentina) during a survey which lasted for 1 year. The zone that wasstudied is characterized by a warm climate with an annual mean temperature of18.6C and relative humidity of 74.6%. The study has the merit of highlighting therelationship between airborne fungal concentrations and environmental factors suchas area, season and presence/absence of a convection-type gas-fired heating sys-tem during winter. Indoor results showed the presence of thirteen dominant genera,among which Cladosporium and Alternaria were the most abundant (Penicillium
and Aspergillus species were found at levels of 1.25 and 1.14%, respectively).In addition, Basilico et al. (2007) applied Multivariate Analyses of Variance to studythe influence of environmental factors on concentrations of fungal flora, arriving inthis way at a significant correlation of fungal concentrations in relation to season,area (urban, suburban etc.) and the presence of a convection-type gas-fired heatingsystem during winter.
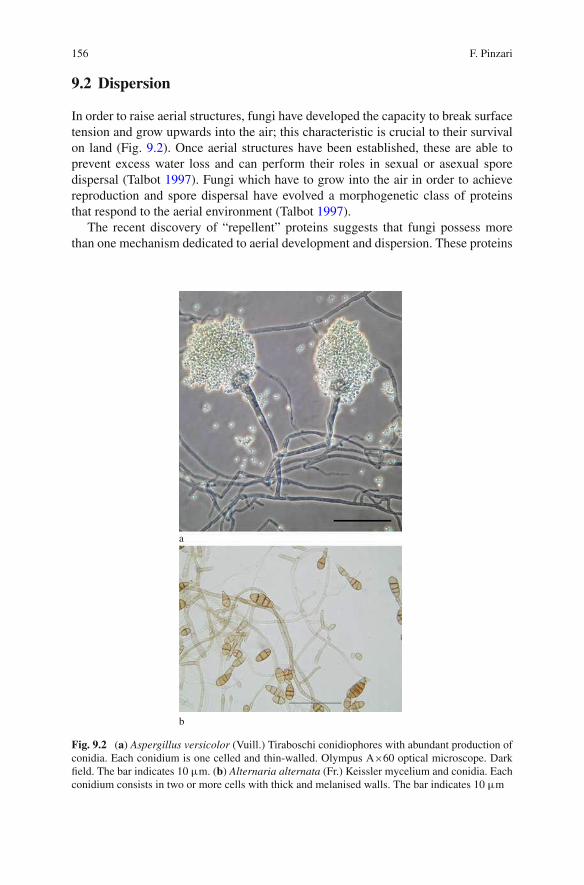
156 F. Pinzari
9.2 Dispersion
In order to raise aerial structures, fungi have developed the capacity to break surfacetension and grow upwards into the air; this characteristic is crucial to their survivalon land (Fig. 9.2). Once aerial structures have been established, these are able toprevent excess water loss and can perform their roles in sexual or asexual sporedispersal (Talbot 1997). Fungi which have to grow into the air in order to achievereproduction and spore dispersal have evolved a morphogenetic class of proteinsthat respond to the aerial environment (Talbot 1997).
The recent discovery of “repellent” proteins suggests that fungi possess morethan one mechanism dedicated to aerial development and dispersion. These proteins
a
b
Fig. 9.2 (a) Aspergillus versicolor (Vuill.) Tiraboschi conidiophores with abundant production ofconidia. Each conidium is one celled and thin-walled. Olympus A×60 optical microscope. Darkfield. The bar indicates 10 µm. (b) Alternaria alternata (Fr.) Keissler mycelium and conidia. Eachconidium consists in two or more cells with thick and melanised walls. The bar indicates 10 µm

9 Microbial Ecology of Indoor Environments 157
are called hydrophobins and are able to react as interfaces between water and air,thus providing a hydrophobic coating for aerial fungal structures (Talbot 1997). Theairborne fungal spores’ concentration depends on the way in which they are released
from the mycelium at the air-substratum interface. The quantity of spores deriving
from a contaminated material which can be aerosolized can vary considerably in
relation to the biology and ecology of an individual fungal species, and also in rela-
tion to chance events. According to Górny et al. (2001), the release of fungal spores
from their source is driven by energy originating from external sources and may be
significantly affected by environmental factors, such as air velocity. Gregory (1973)
stated that the prevalent mechanism governing spore release in the case of indoor
fungi is aerosolization caused by air currents. This may be true for some fungal
species: for example, spore detachment from the mature mycelia of most Aspergillus
and Penicillium species is caused principally by physical factors (Sivasubramani
et al. 2004). Górny et al. (2001) found that fungal spore release from surfaces in
indoor environments can be affected by a combination of factors, including the
specific fungal species concerned. According to Górny et al. (2001), the release
of Aspergillus versicolor, Cladosporium cladosporioides, and Penicillium melinii
spores from agar and ceiling tile surfaces was affected in different ways by various
parameters, such as air current velocity sweeping over surfaces, the texture of the
surface, and vibration of contaminated material.
MacArthur and Wilson (1967) conceived the theory of island biogeography. This
theory attempted to predict the number of species that could exist on a newly created
island. Nowadays the theory is used to refer to any ecosystem surrounded by dis-
similar ecosystems (Lomolino 2000). In this broadened definition an “island” is any
area of suitable habitat surrounded by an expanse of unsuitable habitat. The term can
also be applied to manmade “islands”, such as expanses of grassland surrounded by
highways or housing tracts.
A further extension of the “island” definition can be applied to the heterogeneous
pattern of “microbial niches” that is present in indoor environments. The theory
of island biogeography proposes that the number of species found on an undis-
turbed island is determined by immigration, emigration and extinction (Simberloff
and Wilson 1969). Immigration and emigration are affected by the distance of an
island from a source of colonists (“distance effect”). Islands that are more isolated
are less likely to receive immigrants than islands that are less isolated. The rate
of extinction, once a species manages to colonise an island, is affected by island
size (“area effect” or the “species-area curve”). Habitat heterogeneity increases the
number of species that will be successful following their immigration.
Throughout its history most of Earth’s life forms have inhabited aquatic envi-
ronments. Here, in the past, bacteria have ruled the two most important organic
matter cycling processes, namely primary production (autotrophy) and decompo-
sition. Because of their ability to translocate nutrients, fungal hyphae are better
adapted than bacteria to cross nutrient-poor zones when searching for hetero-
geneously distributed nutrient resources in substrates (Ritz 1995). Just as there
are variations found in the three-dimensional spaces located between soils and
aquatic environments, indoor environments present a high degree of discontinuity

158 F. Pinzari
between substrates, which are usually separated by large spaces filled with air. Thecolonisation of new patches of an indoor environment, where water and nutrientsare available, can only be achieved by crossing or circumnavigating these “empty”spaces. Specific dispersion mechanisms can therefore determine the success of afungal species and its diffusion in indoor “ecosystems”. Air dispersion is the chiefmechanism (Reponen 1995), but fungal spores and conidia can move through theair by adopting very different strategies (Ingold 1965). Active and passive dispersalmechanisms can produce very different results in indoor environments.
Ventilation is a very important variable in closed systems. Air circulation canpromote spore dispersion, but at the same time it can desiccate fungal myceliumby preventing the establishment of microclimates and surface-driven humiditygradients. Some fungal species produce spores that in natural environments aremainly dispersed by insects and mites (Deacon 1997, 2005). Insects and fungiare closely associated in most environments, and many types of interaction thathave arisen repeatedly have been observed among diverse taxa of these groups oforganisms (Deacon 2005). These fungi are necrotrophic and biotrophic parasites,endosymbionts, insect-dispersed forms, and other obligate associates which providenourishment for insects (Deacon 2005). The interactions in question are sometimeshighly complex and may involve other organisms in addition to fungi and insects.The same mechanisms can occur in indoor environments. Moulds affecting archivaland library materials (Zyska 1997) can display different types of interactions withthe insects that eat the component materials of the heritage. Some of the pests thatattack organic materials like wood, paper, leather and parchment can feed on mouldspores, or represent the dispersive means for most of the fungal spores.
Not all fungal spores have evolved for air dispersion; there are several mech-anisms which, in fungi, favour the colonisation of new areas or food patches.Insect-mediated fungal dispersion is well documented in natural environments(Ingold 1965), but it also occurs in indoor environments. Some “heritage eaters”,such as Psocoptera and mites (Fig. 9.3), are often directly associable to the pres-ence of moulds (Gallo et al. 1999; Green 2008). Conversely, insect infestations inlibraries and archives can frequently be associated with fungally infected materials.Metabolic water, fragmented debris and the droppings produced by insects representa perfect medium for fungal germination and growth. Some fungi produce sporesthat can pass through the intestinal tracts of insects and mites with no ill effects, andsome insects and mites can feed directly on fungal structures (Green 2008).
9.3 Ecological Theories Applied to the Indoor Environment
The term “niche” in the ecological context refers to the way in which an organism orpopulation utilises its immediate environment. An ecological niche is defined by dif-ferent biotic and abiotic variables. According to the competitive exclusion principle,no two species can occupy the same niche in the same environment for very long.Ecological niches have been described by G.E. Hutchinson as “hypervolumes”, that

9 Microbial Ecology of Indoor Environments 159
Fig. 9.3 Scanning Electron Microscope (SEM) image, showing fungal spores and mycelium andthe exuvia of a mite (sampled from the cover of a book using adhesive tape). SEM ZEISS EVO50,Variable Pressure, observation of a non-metallised sample
is to say multi-dimensional resource spaces exploited by organisms. Indoor environ-ments are composed of artificial niches in which manmade materials are stored andassembled to form simplified “ecosystems”, where only a few “ruderal” species cangrow and reproduce (Nielsen 2003). In these extreme circumstances scarce waterand limited nutrients mean that only a few microbial and fungal species are able todominate (Nielsen 2003). The chief limiting factor that determines fungal develop-ment in indoor environments is water. Spore germination only occurs when somewater is available; for some fungal species a very small amount of water is suffi-cient to trigger the growth of a new mycelium (Chang et al. 1995; Grant et al. 1989;Nielsen 2002; Pasanen et al. 1992; Rowan et al. 1999).
The microbial species that can damage materials in indoor environments arechiefly primary colonisers capable of rapid growth even when water activity is low(i.e. aw <0.8). When a substrate is attacked by a fungus, its water activity changessufficiently to support the growth of other species (fungal and bacterial), as in natu-ral successions (Pitt and Hocking 1985, 1997). Secondary colonisers are species thathave a high resistance to stress; these species develop thanks to unstable microen-vironments whose existences are linked to many variables, like small changes in airtemperature or humidity due to night/day alternation. Such species often form resis-tant spores resembling dark, thick conidia. Poor ventilation and surface temperaturedishomogeneity can produce water condensation points and local micro-climateswith higher water availability than in the rest of an indoor environment. Thesecircumstances are favourable to some fungal species; as a result these are able to

160 F. Pinzari
Fig. 9.4 Black moulds (Chaetomium sp.) flourishing on a water saturated volume following anepisode of flooding
proliferate in places where the overall environmental conditions would otherwiseappear to be hostile to microbial life.
A very different succession must be expected in indoor environments when watersuddenly becomes available, such as in floods or when a water pipe bursts. Suchsituations are familiar to archivists and librarians who are well aware of the factthat when papers become saturated with water, moulds can subsequently developvery rapidly on them (Fig. 9.4). The moulds associated with water-damage (“waterdamage” moulds, Nielsen 2003) consist of fungal species that need a high wateractivity. These species can produce strong odours (Trichoderma spp), colouredstains (Chaetomium spp and Epicoccum spp) or toxic compounds (Stachybotrys
spp) (Fig. 9.5). The relationship between water and the various substrates presentin an archive or a library can be very complex and will determine the nature of the“microbial community” that develops in the “ecosystem”. Small differences in sub-strate composition – i.e. the percentage of easily degradable carbon sources such as
sugars and starch, or the presence of chemicals potentially sought by some species,
like metals and lignin – can be a decisive factor for the formation of mycelia and the
production of fruiting bodies by the fungi. Competition between fungal species in
very narrow environmental “indoor niches” has been documented by several authors
(Nielsen 2002; Moriyama et al. 1992; Wells and Boddy 2002).
The competition between fungal mycelia for water, nutrients and space in indoor
environments also accounts for another variable, namely the time needed by the fun-
gus to germinate or grow when a favourable situation arises. Indoor environments
characterised by transient high humidity (such as bathrooms) typically support the
growth of phylloplane fungi represented by species capable of re-starting their
growth from the dry hyphal tips within 1 h following a rewetting event; this is

9 Microbial Ecology of Indoor Environments 161
Fig. 9.5 Conidiophora andconidia of the fungusStachybotrys chartarum(Ehrenb.) Hughes. OlympusA×60 optical microscope,bright field. The bar indicates10 µm
the case with Alternaria, Aureobasidium, Cladosporium, Phoma, and Ulocladium
genera (Nielsen 2003; Moriyama et al. 1992; Samson et al. 2002).The mycelium of most of the moulds that require high water activity typically
need longer time-lapses (1–2 days) before recommencing its growth following a
sudden re-wetting event.
In unstable or unpredictable environments, “r-selection” predominates because
the ability to reproduce quickly is crucial. The growth of “r-selected” fungi is
favoured in fluctuating environments and is characterised by rapid development,
small conidia, high fecundity, early maturity onset, etc. (Cooke and Rayner 1984;
Rayner and Boddy 1988; Boddy 2000). These fungi are defined as “r-selected”; “r”
represents “the intrinsic rate of growth”. They are fast-growing, have a high repro-
ductive facility and high dispersal capacity, but a short life span. Zygomycota, yeasts
and fastgrowing ascomycetous fungi are considered “r-selected” and according to
Frisvad et al. (2008) these are rather poor producers of secondary metabolites; they
do, however, produce hormone-like compounds and carotenoids. The “k-selected”
fungi are adaptive in more stable environments; “k” represents the “carrying capac-
ity” of a specific habitat. In stable or predictable environments the ability to compete
successfully for limited resources is fundamental and “k-strategist” fungi are typi-
cally very consistent in the way they use their niche. K-selected fungi are quite rare
in the indoor environment and are mainly represented by endophtytic fungi and a
few basidiomycetes. Some authors (for example, Boddy 2000) define further eco-
logical groups of fungi: the “stress-tolerant” or “s-selected” fungi, which conversely
are common in indoor environments. These fungi are specialised in occupying
specific niches and their competitiveness is not really directed against other fungal
species, but rather towards surviving in a very hostile environment. The “s-selected”

162 F. Pinzari
fungal species that inhabit indoor environments can tolerate desiccation and growin restrictive conditions.
Another ecological group of fungi is composed of the “competitive fungi”(“c-selected”). These are represented by fungal species that are strong producersof a wide range of bioactive secondary metabolites, which play a very importantrole in ecological chemical interactions (Penicillium, Fusarium, Aspergillus species)(Frisvad et al. 2008). This partitioning of fungal “behaviours” in the environment isnot sharply circumscribed. The characteristics of the fungal species concerned canfall into one or more of the above-mentioned groups. This categorisation, althoughessentially artificial, can help us to understand some of the mechanisms at play inindoor environments. The abundance of species belonging to one of the groups –
i.e. “stress-tolerant” or “r-strategist” fungi – can tell us something about the
“ecosystem” that supports their growth and diffusion.
9.4 An Ecological Perspective
In natural environments the microbial communities that act to decompose organic
matter have been closely studied and some authors have provided models that help
to predict nutrient cycling (Boddy 2000). A fluctuating environment may facili-
tate the co-existence of species (Ylva et al. 2006; Naeem and Li 1997; Petchey
et al. 1999; Chesson 2000) and high species diversity is important for maintaining
ecosystem processes under changing environmental conditions (Yachi and Loreau
1999; Mulder et al. 2001). When applying these rules to indoor environments it
becomes clear that “high species diversity” coincides with a high concentration of
airborne microbial and fungal spores and propagules deposited on materials. A dust-
rich indoor area offers greater diversity than a clean surface. Even more than a
constantly humid environment in an indoor “ecosystem”, fluctuating temperature
and humidity can promote the presence of a large number of fungal species. The
notion that a fluctuating environment permits co-existence of competing species in
simple environments was first proposed as a mechanism to explain planktonic algal
diversity (Hutchinson 1961).
In the natural environment the overall low number of species that persist in con-
stant temperature and humidity conditions, regardless of the initial species diversity,
agrees well with the view that intense competition is considered the most important
interaction among fungi (Boddy 2000). Pair-wise interactions among fungi regu-
larly result in the combative physical exclusion of one of the competitors (Holmer
and Stenlid 1993). In contrast, the significantly greater number of species persisting
in fluctuating temperature and water availability conditions suggests that fierce com-
petition becomes less intense in a fluctuating environment. Niche complementarity
was shown by Tiunov and Scheu (2005) to occur when sugar fungi and cellulolytic
fungal species were combined on a cellulose substrate. Stabilising mechanisms
are essential for species co-existence and can be fluctuation-independent, as with

9 Microbial Ecology of Indoor Environments 163
Fig. 9.6 Scanning Electron Microscope (SEM) image. The surface of a piece of adhesive tape usedfor sampling the parchment cover of a book. Various fungal and bacterial flora can be observedcoexisting on a small area of the substrate. SEM ZEISS EVO50, Variable Pressure, observation ofa metallised sample
resource partitioning, or dependent on fluctuations due to different responses to theenvironment (Chesson 2000; Wohl et al. 2004).
These mechanisms also occur in indoor environments, with the difference thatthe main variable is water availability, and that species occurrence is limited by theirdispersal strategies. Studies conducted on deposited dust are rather few in number(Rao et al. 2005), but the biological characteristics of dust are highly dependent onthe particular outdoor aerobiological situation, by seasonality of spore release bysome phylloplane and soil fungi, and by overall atmospheric conditions (Halwagy1989; Mendrela-Kuder 2003). In addition, substrata can support different fungalcommunities, depending on their specific water activity, carbon to nitrogen ratio,and the presence of small nutritive molecules such as sugars and peptides, whichcan assist in a spore’s reactivation (Fig. 9.6).
9.5 The Substrate Factor
When mould spores land on a damp surface, they may start to grow and digest
the material they are developing on, or alternatively they can survive in a dor-
mant state. Biodegradation of materials by moulds can affect the integrity of the
same because the fungus’s hyphae penetrate the substrate. Damage can also occur

164 F. Pinzari
as a result of enzymatic action. Moulds can produce a wide range of enzymes(proteinases, gelatinase, and cellulases) which are able to destroy the componentmaterials of items included in collections (Fig. 9.7). Cellulose is the most abundantorganic compound found on Earth (30–50% of plant dry weight) and, in natural
a
b
Fig. 9.7 (a) Scanning Electron Microscope (SEM) image. Paper attacked by a cellulolytic speciesof Cladosporium. SEM ZEISS EVO50, High Vacuum, observation of a non-metallised sample. (b)Books on metal shelving; their covers have been damaged by mould

9 Microbial Ecology of Indoor Environments 165
environments, represents a major source of energy for microorganisms (Markhamand Bazin 1991). The storage of books and archival materials inside buildingsdevoted to their preservation has created unique environments for cellulolytic fungaland microbial species to inhabit (Abdel-Mallek 1994). Microbial decomposition ofcellulose can take place under both aerobic and anaerobic conditions. The ability todegrade cellulose aerobically is common among fungi and is especially well repre-sented among the Ascomycota and Basidiomycota (and Deuteromycota). Aerobiccellulose degradation is also documented in several soil-dwelling bacterial speciesin both filamentous (e.g. Streptomyces, Micromonospora) and non-filamentous(e.g. Bacillus, Cellulomonas, Cytophaga) genera (Markham and Bazin 1991).Cellulolytic microbial and fungal species require available water in order to bemetabolically active.
Although knowledge of the functional diversity and metabolic characteristicsof moulds is important for both the prevention and treatment of biodeteriorationin cultural heritage, very few studies have been performed in this area until now.In Pinzari et al. (2010) and Pinzari et al. (2008), a study based on the use of BiologFF microplates was performed to obtain the metabolic fingerprint (Dobranic andZak 1999) of the filamentous fungi responsible for degradation in library materials.During a survey carried out the historical library of S. Anselmo monastery in Rome,several samples of moulds were collected from the bindings of volumes damaged byfungi. Fungal strains were also isolated from the surrounding air using an impactionsampler (SAS), and from the library’s walls, where colonies were clearly visible.
The fungal strains collected were purified of bacterial contaminants, separated and
identified. Each strain was then inoculated on to Biolog FF microplates following
the Biolog Manual’s protocol (Solit 2001). The plates were then read using a Biolog
MicroLog microplate spectrophotometer at 490 nm (Fig. 9.8). Raw data (optical
densities) were transferred to an Excel (MicrosoftTM) sheet according to sample
(fungal strain), replicate (3 replicates each), and reading time (10 reading points,
one every 24 h).
Following a background correction, average values for seven categories of sub-
strates were calculated (polymers, carbohydrates, carboxylic acids, amines and
amides, amino acids, and miscellaneous) in accordance with Buyer et al. (2001).
Discriminant Analysis was employed to investigate any differences between the
metabolic fingerprints of the fungi according to two classifying categories: sam-
pled material (leather, fabric, air, plaster), and the sampled area of the library (upper
level, first floor, ancient books section).
When using polymers, carbohydrates and carboxylic acids as variables in the
analysis, the fungal strains were found to be significantly grouped in clusters
(Fig. 9.9a). The results showed that the fungal strains that were detected in the
air and on plaster surfaces were functionally similar to those which attacked the
volumes with bindings made of fabric, while the fungal strains that developed on
bindings made of leather consisted in a particular group of fungi with a metabolic
profile that set them apart from the rest. A statistically significant separation of
fungal strains was also attained for the sampled areas, indicating that different
zones of the conservation environment under examination were colonised by fungal

166 F. Pinzari
Fig. 9.8 A Biolog FF plate after inoculation with an airborne fungal species, and incubation at26C. The pink wells correspond to the substrate use. The dark wells are those where the fungusproduced fruiting bodies or pigmented mycelium. The white wells in the plate indicate that thefungus was not able to degrade that particular substrate
communities with a different functional profile. The use of amines, amides andamino acids as variables resulted in a less distinct classification of the strains inthe discriminant analysis (Fig. 9.9b), indicating that the potential activity of all thefungal strains was similar for the compounds containing nitrogen. It can thereforebe hypothesised that the chief focus of competition between fungi that grow in theindoor environment of a library is represented by nitrogen uptake, or more generallyby substrates that contain a source of nitrogen.
9.6 Dust as a Niche
In indoor environments, dust-borne and airborne biological agents may representdifferent ecological niches, and according to Rao et al. (2005) surface dust sam-pling can serve as a possible historical marker for cumulative exposures. Microbialcommunities in indoor environments are largely structured based on water avail-ability and the supply of growth-limiting substrates that can enter the ecosystem bymeans of dust deposition (Hicks et al. 2005). The availability of growth-limitingresources restricts the diversity of biotic communities (Tilman et al. 1996), there-fore higher levels of dust deposition should increase the supply of limiting resources(i.e. organic and inorganic substrates) (Lai 2002). According to a very precise studyby Chudnovsky and Ben-Dor (2008), outdoor settled dust exhibits a higher min-eral content compared with indoor dust. Dust deposition in indoor environmentsis quantitatively influenced by green areas and the total area of vegetation in the

9 Microbial Ecology of Indoor Environments 167
a
b
Fig. 9.9 (a) DiscriminantAnalysis that shows thegrouping of fungalassemblages according tosubstrata and based on carbonsources; (b) DA DiscriminantAnalysis that shows thegrouping of fungalassemblages according tosubstrata and based onnitrogen sources
vicinity of the sampled location. For office environments, the number of peopleworking in the office and the “opening” of the office during the experiment was,according to the authors, the chief factors that affected dust precipitation. In 2008 amethod was developed by Pinzari and Montanari (2008) to be applied when evaluat-ing risk for stored library materials in relation to the metabolic diversity of the fungalcommunities inhabiting dust deposits on storage space surfaces (i.e. shelving).
Functional data relating to fungal spores can be useful when seeking to dis-tinguish dust samples based on a different capacity of the active species todegrade clusters of compounds. This approach yields an evaluation of the biological

168 F. Pinzari
harmfulness of dust to different classes of materials. The procedure consists in thedirect inoculation of dust samples on to commercial microtiter plates (BiologTM)and involves colour formation through reduction with a tetrazolium dye (Bochner1989) to assess utilization of 95 separate sole carbon sources during a 4–10 day
incubation period. The fungal and/or bacterial species that induce colour formation
in the wells are the fast-growing ones. The single time-point results are indicative
of heterotrophic fungal population density and total potential heterotrophic activ-
ity, while the multiple time-point data identify differences between communities in
terms of metabolic potential on various classes of substrates. The method is far less
time-consuming and technically much simpler than either isolate identification or
phylogenetic analysis. The study by Pinzari et al. (2010), based on the sampling
of settled dust in accordance with Pinzari and Montanari (2008), was specifically
developed to analyse and compare the metabolic diversity of fungal communities
present on the surfaces of three different storage “environments” in an Italian public
library.
The results obtained showed that the three samples of dust, corresponding to the
same number of storage “environments”, were successfully differentiated based on
the “substrate utilisation patterns” of the fungal communities inhabiting the shelves
where samples were collected (Figs. 9.10 and 9.11). The study showed how a
recently deposited dust can possess higher catabolic potentiality when compared
with an “old dust”. The substrata that were most distinctive and which significantly
Fig. 9.10 Standardised swabsampling of dust from books’surface using a 5×5 cmframe

9 Microbial Ecology of Indoor Environments 169
Fig. 9.11 (a) DiscriminantAnalysis (DA) that shows thegrouping of fungalcommunities according to theage of the dust (3, 9 and 24months of settlement) andbased on polymers andcellobiose, plot of variables;(b) plot of observations andcentroids of the groups
differentiated dust samples were all found among cellobiose and cyclodextrine,which form part of the microbial catabolic pathway of starch and cellulose degrada-tion processes. These results suggested that the structure of the fungal communityinhabiting an indoor environment can be influenced by the predominant substrate.
9.7 Odour Patterns
Microbial volatile organic compounds (MVOCs) are produced as metabolic by-products of bacteria and fungi when they start colonising nutrient-rich substrates,even before any visible sign of microbial growth appears. Spoilage fungi produce

170 F. Pinzari
volatiles which are characteristic and different from those produced by bacteriaor the substrates themselves (Kaminski et al. 1974). The most frequently pro-duced volatile compounds include 3-methyl-1-butanol, 1-hexanol, 1-octen-3-ol,2-heptanone, and 3-octanone, as identified by gas chromatography and mass spec-trometry (Kaminski et al. 1974; Larsen and Frisvad 1995; Linton and Wright 1993).Production of a volatile compound can serve to remove inhibitory intermediatesfrom the metabolism under unfavourable conditions, or may have inhibitory effectson other fungi and act as a self-regulatory growth and development mechanism(Linton and Wright 1993). In some cases these odorous compounds are fruity orflowery in nature. They are the product of a coevolution with micro and mesofaunaand function to attract arthropod dispersers (e.g. insects transferring mould coni-dia to new growth sites). Alternatively, a musty or earthy odour can be used todeter grazing and feeding by invertebrates, or at least to lend a distinctly “inedible”odour to mould colonies and their underlying nutritional substrates (Lin and Phelan1992; Humphris et al. 2002). A few such volatiles have been found to be irritatingto vertebrates (Nikulin et al. 1997). In indoor environments organic volatiles havebeen related to some types of sick building syndrome (Li and Yang 2004). Eachmicrobial species has a defined MVOC profile which can be subject to considerablemodification in response to external factors, such as cultivation on different substrata(Wheatley et al. 1997), growth phase (Magan and Evans 2000; Bruce et al. 1996),temperature, pH, light and CO2 or O2 levels. Although many variables influence theproduction of microbial volatile compounds, some MVOCs can be considered com-mon to the majority of detrimental species and spoiling situations; they can be usedas early indicators of biocontamination (Pinzari et al. 2004; Canhoto et al. 2004;Olsson et al. 2000; Di Natale et al. 1997; Magan and Evans 2000).
In the study carried out by Renda et al. (2008), an electronic nose was usedto evaluate the relationship between different paper grades and mycelium age onMVOCs production by indoor fungi typically found in libraries. An electronicnose is a portable device consisting in an array of electronic chemical sensorswith partial specificity and an appropriate pattern-recognition system capable ofrecognising simple or complex odours (Gardner and Bartlett 1994). An electronicnose is equipped with three elements that replicate the three phases of the humanolfactory system: (1) detection by the sensor array which is exposed to the volatiles,(2) signal processing by conversion of the sensor signals into a readable format,and (3) recognition of odours by means of software analysis of the data whichallows us to transpose the information contained in the odour into a “volatile pat-tern”. An electronic nose does not supply detailed chemical information on thevolatile compounds produced by active fungi, but provides a qualitative picture(“volatile pattern”) of the mixture of compounds present in the sample (Turner andMagan 2004). Renda et al. (2008) studied the odorous patterns produced by somefilamentous fungi frequently associated with the biodeterioration of library materialsby employing different sensor arrays. In order to evaluate which variables can influ-ence the production of volatile compounds by fungi when paper spoilage occurs,several factors were taken into account, such as the quality of the substrate (i.e. dif-ferent grades of paper), the metabolic state of the fungi (germination, active growth,

9 Microbial Ecology of Indoor Environments 171
Fig. 9.12 DiscriminantAnalysis showing the abilityof the electronic nose todistinguish between odoroussignals emitted from fungalmycelium of different ages.Kt and Ct are two differentstrains of the same fungalspecies (Chaetomiumglobosum Kunze), 1 and 2 arethe odorous signalsrespectively after 7 and 21days of incubation
starvation), the fungal inter-intra specific variability in relation to volatile produc-tion (different strains of the same species, and different species) and the differenttype of sensors used to detect the “odorous fingerprint”.
Odorous patterns presented significant differences in relation to the age of themycelia (i.e. the different incubation times undergone by the paper samples) asshown in Fig. 9.12 where discriminant analysis (DA) was conducted on the e-NOSE
signals produced by Chaetomium globosum over different incubation times.Additionally, there are significant differences in the volatile emissions of fungal
strains belonging to the same species that grow on different paper grades, and dif-ferences in the amount of volatiles emissions from pure fungal cultures on paperand mixed cultures. In conclusion, fungi produce odorous signals when paperspoilage occurs. The amount and quality of the volatiles produced by fungi can varygreatly, depending on the species concerned, the substrate’s characteristics, and the
co-occurrence of different strains on the same substrate, and the age and quantity of
the mycelia.
9.8 Conclusions
Information on the relationship between exposure to fungal spores and their effects
is necessary in order to be able to understand and manage the diseases they can
cause in humans, animals and plants. In most of the environmental studies carried
out in the last 20 years or so the experimental approach consisted in examining
the quantitative associations between airborne fungi and respiratory problems, anal-
yses of the compositions of microbes in air samples, and the calculation of the
relevant concentrations according to species or higher taxa groupings. The bulk

172 F. Pinzari
of aerobiological studies published up to now have involved volumetric samplingperformed using several different systems (Strauss 2004; Parat et al. 1997; VanReenen-Hoekstra et al. 1991; Reponen et al. 1994; Pirhonen et al. 1996; Mendrela-Kuder 2003; Li and Kendrick 1994; Wu et al. 2000; Picco and Rodolfi 2000; Su et al.2001; Shelton et al. 2002; Nielsen 2003; Li and Yang 2004; Kalogerakis et al. 2005).Only a few studies have investigated deposited dust in order to identify the types andconcentrations of biological agents and the particles to which the occupants of build-ings may be exposed (Kanaani et al. 2008). Isolation by culture of fungi and bacteriais an established method that is widely accepted for the quantification and identi-fication of microorganisms present in environmental samples. Many factors werefound to influence the results obtained from indoor biological surveys; these factorsinclude: the method of sample collection, the ways in which dust was prepared forinoculation on to growth media, and the culture media chosen for specific categoriesof agents (Nielsen 2002). The concentration of mesothermic and thermophilic bac-teria, hydrophilic and xerophilic fungi, and specific genera and species depends onthe nutritive selective mean used in isolation procedures. The natural variability offungal and bacterial assemblages in air and dust in indoor environments rendersquantitative estimates almost useless for the definition of indoor air quality. Sickbuilding symptoms cannot properly be correlated to a mere number of CFUs (Singh1994). Qualitative analysis of the aerodiffused fungal spores seems to be more validas a source of information. In fact, measurement of merely the quantity of the micro-bial charge is of little value if the species present and their pathogenic potential forhumans and deteriogenic activity in artefacts are not known (Nugari and Roccardi2001). Biological “air quality” in indoor environments can be better defined by usingbioindicators rather than referring to a fixed number of CFUs. The characterisationof microbial communities in organic dust samples by means of chemical markerssuch as 3-hydroxy fatty acids (markers of endotoxin), ergosterol (marker for fungalbiomass), and muramic acid (marker for peptidoglycan/bacterial biomass) has beenapplied by some authors (Szponar and Larsson 2001 and literature therein) withinteresting results. This method made it possible to distinguish quite well betweendust samples collected from different environments.
The presence of “indicator species” that suggest the presence of specific envi-ronmental niches which act as amplification sites for moulds could be of great valuewhen conducting indoor environmental quality studies. Conventional methods fordetecting airborne fungal spores rely on either optical identification or culturingand can be time-consuming and/or unreliable. The detection and identification ofmarker-species or groups of species can be very difficult and subject to culturinglimits, namely the culturability of strains and the production, in vitro, of diagnosticcharacters. To overcome such drawbacks, molecular techniques have recently beenintroduced for the detection and identification of microorganisms in indoor dust, airsamples and manmade matrices (Michaelsen et al. 2006; 2009). Purification of DNAfrom conventional spore samplers and detection of bacterial and fungal diversity andidentity was performed in some studies using polymerase chain reaction (PCR)-based methods. Some authors proved that the detection limit was about 10 sporesor less in the PCR (Calderon et al. 2002). The selection of indicator species and

9 Microbial Ecology of Indoor Environments 173
physiological groups of organisms that can be used as markers of unsuitable indoorconditions should be carried out by studying the ecology of the “indoor microbialcommunities”. Both the partitioning of fungal “behaviours” in the environment andthe characteristics of the fungal species can help in the understanding of some of themechanisms that produce indoor environments. The abundance of species belong-ing to one of the “ecological” groups such as the stress-tolerant or the “r-strategist”fungi can tell us something about the “ecosystem” that supports their growth anddiffusion. A better understanding of the natural mechanisms that support the estab-lishment of different species assemblages in indoor environments could be of help indefining a new approach to assuring environmental quality for humans and culturalassets. Indoor environments, although manmade and artificial, represent niches formicrobes and fungi to inhabit. In these places materials are stored and assembledto form simplified “ecosystems” where microbial species can grow and reproduce.Ecological insight into materials spoilage and indoor niche colonisation by bacteria,insects and fungi could represent a successful approach for modelling and predictingmicrobial dynamics in manmade environments.
Acknowledgements The author is grateful to Mark Livesey for the language revision of the text,and to Dr. Mariasanta Montanari for her advice and suggestions.
References
Abdel-Mallek AY (1994) Isolation of cellulose decomposing fungi from damaged manuscripts anddocuments. Microbiol Res 149:163–165.
Basilico MLZ, Chiericatti C, Aringoli EE, Althaus RL, Basilico JC (2007) Influence of envi-ronmental factors on airborne fungi in houses of Santa Fe City. Argentina Sci Total Environ376:143–150.
Bochner B (1989) Breathprints at the microbial level. ASM News 55:536–539.Boddy L (2000) Interspecific combative interactions between wood decaying basidiomycetes.
FEMS Microbiol Ecol 31:185–194.Bouilly J, Limam K, Béghein C, Allard F (2005) Effect of ventilation strategies on particle decay
rates indoors: An experimental and modelling study. Atmos Environ 39:4885–4892.Bronswijk JEMH, Rijckaert G, Van de Lustgraff B (1986) Indoor fungi distribution and allergenic-
ity. Acta Bot Neerl 35:329–345.Bruce A, Kundzewicz A, Wheatley RE (1996) Influence of culture age on the volatile organic
compounds produced by trichoderma aureoviride and associated inhibitory effects on selectedwood decay fungi. Mat Organismen 30(2):79–94.
Buyer JS, Roberts DP, Millner P, Russek-Cohen E (2001) Analysis of fungal communities by solecarbon source utilization profiles. Elsevier J Microbiol Methods 45:53–60.
Calderon C, Ward E, Freeman J, McCartney A (2002) Detection of airborne fungal spores sampledby rotating-arm and hirst-type spore traps using polymerase chain reaction assays. Aerosol Sci33:283–296.
Canhoto O, Pinzari F, Fanelli C, Magan N (2004) Application of electronic nose technology forthe detection of fungal contamination in library paper. Int Biodeterior Biodegrad 54:303–309.
Chang JCS, Foarde KK, Vanosdell DW (1995) Growth evaluation of fungi (Penicillium spp. andAspergillus spp.) On ceiling tiles. Atmos Environ 29:2331–2337.
Chesson P (2000) Mechanisms of maintenance of species diversity. Annu Rev Syst Ecol31:343–366.

174 F. Pinzari
Chudnovsky A, Ben-Dor E (2008) Application of visible, near-infrared, and short-wave infrared(400–2500 nm) reflectance spectroscopy in quantitatively assessing settled dust in the indoor
environment. Case study in dwellings and office environments. Sci Total Environ 393:198–213.
Cooke RC, Rayner ADM (1984) Ecology of Saprotrophic Fungi. Longmans, London.
Davies RR (1960) Viable moulds in house dust. Trans Brit Mycol Soc 43:617–630.
Deacon JW (1997) Modern Mycology, 3rd ed. Blackwell Science, Cambridge.
Deacon JW (2005) Fungal Biology. Blackwell Publishers, Cambridge, MA.
Di Natale C, Macagnano A, Davide F, D’Amico A, Paolesse R, Boschi T, Faccio M, Ferri G (1997)
An electronic nose for food analysis. Sens Actuators B 44:521–526.
Dobranic JK, Zak JC (1999) A microtiter plate procedure for evaluating fungal functional diversity.
Mycologia 91:756–765.
Frisvad JC, Andersen B, Thrane U (2008) The use of secondary metabolite profiling in chemotax-
onomy of filamentous fungi. Mycol Res 112:231–240.
Gallo F, Valenti P, Coalizzi P, Pasquariello G, Scorrano M, Sclocchi MC, Maggi O, Persiani AM
(1999) Research on the viability of fungal spores in relation to different microclimates and
different materials. In: Federici C, Munafò PF (Eds.) International Conference on Conservation
and Restoration of Archival and Library Materials. Erice, 22nd–29th April 1996. G.P Palumbo,
Palermo, pp. 213–230.
Gardner JW, Bartlett PN (1994) A brief history of electronic noses. Sens Actuators 18:211–220.
Górny RL, Reponen T, Grinshpun SA, Willeke K (2001) Source strength of fungal spore
aerosolization from moldy building material. Atmos Environ 35:4853–4862.
Grant C, Hunter CA, Flannigan B, Bravery AF (1989) The moisture requirements of moulds
isolated from domestic dwelling. Int Biodeterior 25:259–284.
Green PWC (2008) Fungal isolates involved in biodeterioration of book-paper and their effects
on substrate selection by Liposcelis bostrychophila (Badonnel) (psocoptera: Liposcelididae).
J Stored Prod Res 44:258–263.
Gregory PH (1973) Microbiology of the atmosphere. Plant and Science Monographs. 2nd Edition.
Leonard Hill Books. Aylesbury, England, UK, 377pp.
Halwagy M (1989) Seasonal air spore at three cities in kuwait 1977–1982. Mycol Res 93:208–213.
Hicks J, Lu ET, De Guzman R, Weingart M (2005) Fungal types and concentrations from settled
dust in normal residences. J Occup Environ Hyg 2:481–492.
Hoekstra ES, Samson RA, Verhoef AP (1994) Fungal propagules in house dust: A qualitative
assessment. In: Samson RA, Flannigan B, Flannigan ME, Verhoeff AP, Adan OCG, Hoekstra
ES (Eds.) Health Implications of Fungi in Indoor Environments. Air Quality Monographs
2. Elsevier, Amsterdam, pp. 169–177.
Holmer L, Stenlid J (1993) The importance of inoculum size for the competitive ability of wood
decomposing fungi. FEMS Microbiol Ecol 12:169–176.
Humphris SN, Bruce A, Buultjens E, Wheatley RE (2002) The effects of volatile microbial
secondary metabolites on protein synthesis in serpula lacrymans. FEMS Microbiol Lett
210:215–219.
Hunter CA, Grant C, Flannigan B, Bravery AF (1988) Mould in building: The air spore of domestic
dwellings. Int Biodeterior 24:81–101.
Hutchinson GE (1961) The paradox of the plankton. Am Nat 95:137–145.
Ingold CT (1965) Spore Liberation. Clarendon Press, Oxford.
ISO/DIS 16000-17. ISO TC 146/SC 6 (2008) (International Organization for Standardization)
Indoor air – Part 17: Detection and enumeration of moulds, Culture-based method.
ISO/DIS 16000-18. ISO TC 146/SC 6 (2008) (International Organization for Standardization)
Indoor air – Part 18: Detection and enumeration of moulds, Sampling by impaction.
ISO/DIS 16000-19. ISO TC 146/SC 6 (2008) (International Organization for Standardization)
Indoor air – Part 19: Sampling strategy for moulds, Sampling by filtration.
Jones AM, Harrison RM (2004) The effects of meteorological factors on atmospheric bioaerosol
concentrations – a review. Sci Total Environ 326(1–3):151–180.

9 Microbial Ecology of Indoor Environments 175
Kalliokoski P, Pasanen AL, Korpi A, Pasanen P (1996) House dust as a growth medium formicroorganisms, pp. 131–135. In: Proceedings of Indoor Air’ 96, vol. 3. Seec Ishibashi Inc,
Tokyo.
Kalogerakis N, Paschali D, Lekaditis V, Pantidou A, Eleftheriadis K, Lazaridis M (2005)
Indoor air quality: Bioaerosol measurements in domestic and office premises. J Aerosol Sci
36(5–6):751–761.
Kaminski E, Stawicki S, Wasowicz E (1974) Volatile flavour compounds produced by moulds of
Aspergillus, Penicillium and fungi imperfecti. Appl Microbiol 27:1001–1004.
Kanaani H, Hargreaves M, Ristovski Z, Morawska L (2008) Deposition rates of fungal spores
in indoor environments, factors effecting them and comparison with non-biological aerosols.
Atmos Environ 42:7141–7154.
Lai ACK (2002) Particle deposition indoors: A review. Indoor Air 12:211–214.
Larsen TO, Frisvad JC (1995) Comparison of different methods for collection of volatile chimica
markers from fungi. J Microbiol Methods 24:135–144.
Li D-W, Kendrick WB (1994) Functional relations between airborne fungal spores and envi-
ronmental factors in: Kichener-waterloo, ontario, as detected by canonical correspondence
analysis. Grana 33:166–176.
Li D-W, Kendrick WB (1995) A year-round study on functional relationships of airborne fungi
with meteorological factors. Int J Biometeorol 39:74–80.
Li D-W, Yang CS (2004) Fungal contamination as a major contributor to sick building syndrome.
In: Strauss DC (Ed.) Sick Building Syndrome. Adv in appl microbiol 55. Elsevier Academic
Press, Burlington, MA, pp. 31–112.
Liao C-M, Luo W-C, Chen S-C, Chen J-W, Liang H-M (2004) Temporal/seasonal variations
of size-dependent airborne fungi indoor/outdoor relationships for a wind-induced naturally
ventilated airspace. Atmos Environ 38(26):4415–4419.
Lin H, Phelan PL (1992) Comparison of volatiles from beetle-transmitted Ceratocystis fagacearum
and four non-insect-dependent fungi. J Chem Ecol 18(9):1623–1632.
Linton C, Wright S (1993) Volatile organic compounds: Microbiological aspects and some
technological implications. Lett Appl Bacteriol 75:1–12.
Lomolino MV (2000) A call for a new paradigm of island biogeography. Global Ecol Biogeogr
9:1–6.
MacArthur RH, Wilson EO (1967) The Theory of Island Biogeography. Princeton University Press,
Princeton, NJ.
Magan N, Evans P (2000) Volatiles as an indicator of fungal activity and differentiation between
species, and the potential use of electronic nose technology for early detection of grain spoilage.
J Stored Prod Res 36:319–340.
Markham P, Bazin MJ (1991) Decomposition of cellulose by fungi, pp. 379–424. In: Arora DK,
Rai B, Mukerji KG, Knudsen GR (Eds.) Handbook of Applied Mycology, vol. 1: Soil and
Plants, Part III Fungal Degradation Processes. Marcel Dekker, New York, NY, pp. 379–389.
Mendrela-Kuder E (2003) Seasonal variations in the occurrence of culturable airborne fungi in
outdoor and indoor air in Craców. Int Biodeterior Biodegrad 52:203–205.
Michaelsen A, Pinzari F, Ripka K, Lubitz W, Pinar G (2006) Application of molecular techniques
for identification of fungal communities colonising paper material. Int Biodeterior Biodegrad
58:133–141.
Michaelsen A, Piñar G, Montanari M, Pinzari F (2009) Biodeterioration and restoration of a 16th-
century book using a combination of conventional and molecular techniques: A case-study.
Int Biodeterior Biodegrad 63:161–168.
Miller JD (1992) Fungi as contaminants in indoor air. Atm Environ 26A:2163–2172.
Miller JD, La Flamme AM, Sobel Y, Lafontaine P, Greenblagh R (1988) Fungi and fungal products
in canadian homes. Int J Biodeterior 74:1115–1123.
Moriyama Y, Nawata WC, Tsuda T, Nitta M (1992) Occurrence of moulds in japanese bathrooms.
Int Biodeterior Biodegrad 30:47–55.

176 F. Pinzari
Mulder CPH, Uliassi DD, Doak DM (2001) Physical stress and diversity-productivity relation-ships: The role of positive interactions. Proc Natl Acad Sci USA 98:6704–6708.
Naeem S, Li SB (1997) Biodiversity enhances ecosystem reliability. Nature 390:507–509.
Nielsen KF (2002) Mould growth on building materials. Secondary metabolites, mycotoxins and
biomarkers. PhD Thesis. BioCentrum-DTU, Technical University of Denmark. http://www.
biocentrum.dtu.dk/mycology/publications/phd-kfn.pdf.
Nielsen KF (2003) Review: Mycotoxin production by indoor molds. Fungal Genet Biol
39:103–117.
Nikulin M, Reijula K, Jarvis BB, Veijalaninen P, Hintikka E-L (1997) Effects of intranasal
exposure to spores of Stachybotrys atra in mice. Fund Appl Toxicol 35:182–188.
Nugari MP, Roccardi A (2001) Aerobiological investigations applied to the conservation of cultural
heritage. Aerobiologia 17:215–223.
Olsson J, Borjesson T, Lundstedt T, Schnurer J (2000) Volatiles for mycological quality grading
of barley grains: Determination using gas chromatography-mass spectrometry and electronic
nose. Int J Food Microbiol 59:167–178.
Parat S, Perdrix A, Fricker-Hidalgo H, Saude I, Grillot R, Baconnier P (1997) Multivariate analysis
comparing microbial air content of an airconditioned building and naturally ventilated building
over one year. Atmos Environ 31:441–449.
Pasanen A-L, Juutinen T, Jantunen MJ, Kalliokoski P (1992) Occurrence and moisture require-
ments of microbial growth in building materials. Int Biodeterior Biodegrad 30:273–283.
Petchey OL, McPhearsson PT, Casey TM, Morin PJ (1999) Environmental warming alters food-
web structure and ecosystem function. Nature 402:69–72.
Picco AM, Rodolfi M (2000) Airborne fungi as biocontaminants at two milan underground stations.
Int Biodeterior Biodegrad 45:43–47.
Pinzari F, Canhoto O, Fanelli C, Magan N (2004) Electronic nose for the early detection of moulds
in libraries and archives. Indoor Built Environ 13:387–395.
Pinzari F, Cialei V, Barbabietola N (2008) Measurement of the micro-aeroflora deteriorating poten-
tialities in the indoor environments. Proceedings of the 8th Indoor Air Quality 2008 Meeting
(IAQ2008), 17–19 April 2008, Vienna, Austria.
Pinzari F, Cialei V, Barbabietola N (2010) Measurement of the micro-aeroflora deteriorating
potential in the indoor environments. e-Preservation Science 7:29–33.
Pinzari F, Montanari M (2008) A substrate utilisation pattern (SUP) method for evaluating the
biodeterioration potential of micro-flora affecting libraries and archival materials. In: Joice H,
Townsend L, Toniolo F, Cappitelli F (Eds.) Conservation Science. Archetype Publications,
London, pp. 236–241.
Pinzari F, Pasquariello G, De Mico A (2006) Biodeterioration of paper: A SEM study of fungal
spoilage reproduced under controlled conditions. Macromol Symp 238:57–66.
Pirhonen I, Nevalainen A, Husman T, Pekkanen J (1996) Home dampness, moulds and their influ-
ence on respiratory infections and symptoms in adults in Finland. Eur Respir J 9:2618–2622.
Pitt J, Hocking AD (1985) The ecology of fungal food spoilage. In: Pitt J, Hocking AD (Eds.) Fungi
and Food Spoilage. CSIRO-Division of Food Research-Sydney. Academic Press, Australia,
pp. 5–18.
Pitt JI, Hocking AD (1997) Fungi and Food Spoilage (2nd ed.). Blackie Academic and
Professional, London.
Rao CY, Cox-Ganser JM, Chew GL, White DS (2005) Use of surrogate markers of biologi-
cal agents in air and settled dust samples to evaluate a water-damaged hospital. Indoor Air
15(9):89–97.
Rayner ADM, Boddy L (1988) Fungal Decomposition of Wood: Its Biology and Ecology. Wiley,
Chichester.
Renda I, Lonero F, Fanelli C, Scarpa A, Pinzari F (2008) Fungal volatiles as early markers of
paper spoilage: The electronic nose technology. In: Proceedings of the 1th international meet-
ing: Youth in the conservation of cultural heritage. Centro Stampa De Vittoria srl: Rome.
pp. 140–148.

9 Microbial Ecology of Indoor Environments 177
Reponen T (1995) Aerodynamic diameters and respiratory deposition estimates of viable fungalparticles in mold problem dwellings. Aerosol Sci Tech 22:11–23.
Reponen T, Hyvärinen A, Ruuskanen J, Raunemaa T, Nevalainen A (1994) Comparison of concen-
trations and size distributions of fungal spores in building with and without mould problems.
J Aerosol Sci 25:1595–1603.
Ritz K (1995) Growth responses of some soil fungi to spatially heterogeneous nutrients. FEMS
Microbiol Ecol 16:269–280.
Rowan NJ, Johnstone CM, McLean RC, Anderson JG, Clarke JA (1999) Prediction of toxi-
genic fungal growth in buildings by using a novel modelling system. Appl Environ Microbiol
65:4814–4821.
Salonen H, Lappalainen S, Lindroos O, Harju R, Reijula K (2007) Fungi and bacteria in
mould-damaged and non-damaged office environments in a subarctic climate. Atmos Environ
41:6797–6807.
Samson RA, Flannigan B, Flannigan ME, Verhoeff AP, Adan OCG, Hoekstra ES (Eds.) (1994)
Recommendations in Health Implications of Fungi in Indoor Environments. Air Quality
Monographs 2. Elsevier, Amsterdam, pp. 531–538.
Samson RA, Hoekstra ES, Frisvad JC, Filtenborg O (Eds.) (2002) Introduction to Food- and Air
Borne Fungi (6th ed.). Centraal bureau voor Schimmelcultures, Utrecht.
Shelton BG, Kirkland KH, Flanders WD, Morris GK (2002) Profiles of airborne fungi in buildings
and outdoor environments in united states. Appl Environ Microbiol 68:1743–1753.
Simberloff D, Wilson EO (1969) Experimental zoogeography of islands – colonization of empty
islands. Ecology 50:278–296.
Singh J (Ed.) (1994) Building Mycology: Management of Decay and Health in Buildings.
Chapman and Hall, London.
Sivasubramani SK, Niemeier RT, Reponen T, Grinshpun SA (2004) Assessment of the aerosoliza-
tion potential for fungal spores in moldy homes. Indoor Air 14:405–412.
Solit R (2001) MicroLog System Release 42, User Guide 4.
Strauss DC (Ed.) (2004) Sick Building Syndrome. Advances in Applied Microbiology 55. Elsevier
Academic Press, Burlington, MA.
Su HJ, Wu PC, Chen HL, Lee FC, Lin LL (2001) Exposure assessment of indoor allergens,
endotoxin, and airborne fungi for homes in southern taiwan. Environ Res 85(A):135–144.
Szponar B, Larsson L (2001) Use of mass spectrometry for characterising microbial communities
in bioaerosols. Ann Agric Environ Med 8:111–117.
Talbot NJ (1997) Fungal biology: Growing into the air. Curr Biol 7:R78–R80. Electronic identifier:
0960-9822-007-R0078.
Tilman D, Wedin D, Knops D (1996) Productivity and sustainability influenced by biodiversity in
grassland ecosystems. Nature 379:718–720.
Tiunov AV, Scheu S (2005) Facilitative interactions rather than resource partitioning drive
diversity-functioning relationships in laboratory fungal communities. Ecol Lett 8:618–625.
Turner APF, Magan N (2004) Electronic noses and disease diagnostics. Nat Rev Microbiol 2:1–6.
Van Reenen-Hoekstra ES, Samson RA, Verhoeff AP, Van Wijnen JH, Brunekreef B (1991)
Detection and identification of moulds in dutch houses and non-industrial working environ-
ments. Grana 30:418–423.
Verhoeff AP, Van Wijnen JH, Boleij JSM, Brunekreef B, Van Reenen-Hoekstra ES, Samson RA
(1990) Enumeration and identification of airborne viable mould propagules in houses. Allergy
45:275–284.
Wardle DA (2002) Communities and Ecosystems: Linking the Aboveground and Belowground
Components. Princeton University Press, Princeton, PA.
Wells JM, Boddy L (2002) Interspecific carbon exchange and cost of interactions between
basidiomycete mycelia in soil and wood. Funct Ecol 16:153–161.
Wheatley RE, Hackett C, Bruce A, Kundzewicz A (1997) Effect of substrate composition on pro-
duction of volatile organic compounds from Trichoderma spp. Inhibitory to wood decay fungi.
Mat Organismen 30:79–94.

178 F. Pinzari
Wohl DL, Arora S, Gladstone JR (2004) Functional redundancy supports biodiversity andecosystem function in a closed and constant environment. Ecology 85:1534–1540.
World Health Organization (1988) Indoor Air Quality: Biological Contaminants. European Series,n. 31. World Health Organization, Copenhagen.
Wu PC, Su HJ, Lin CY (2000) Characteristics of indoor and outdoor airborne fungi at suburbanand urban homes in two seasons. Sci Total Environ 253:111–118.
Yachi S, Loreau M (1999) Biodiversity and ecosystem productivity in a fluctuating environment:The insurance hypothesis. Proc Natl Acad Sci USA 96:1463–1468.
Ylva K, Toljander YK, Lindahl BD, Holmer L, Högberg NOS (2006) Environmental fluctuationsfacilitate species co-existence and increase decomposition in communities of wood decay fungi.Oecologia 148:625–631.
Zyska B (1997) Fungi isolated from library materials: A review of the literature. Int BiodeteriorBiodegrad 40:43–51.

Chapter 10
Indoor Air Quality: Monitoring and ModelingProtocol for Urban School Buildings
Radha Goyal and Mukesh Khare
10.1 Introduction
Indoor air quality (IAQ) refers to the quality of the air inside buildings as represented
by concentrations of pollutants and thermal (temperature and relative humidity) con-
ditions that affect the health, comfort, and performance of occupants. The growing
proliferation of chemical pollutants in consumer and commercial products, the ten-
dency toward tighter building envelopes and reduced ventilation to save energy,
and pressures to defer maintenance and other building services to reduce costs
have fostered indoor air quality problems in most of the buildings. As a result,
occupant’s complaints of odors, stale and stuffy air, and symptoms of illness or
discomfort breed undesirable conflicts among occupants/owners/tenants/building
managers. The U. S. Environmental Protection Agency and its Science Advisory
Board have consistently ranked indoor air pollution among the top four environmen-
tal risks to the public as people spend almost 90% of their time inside the buildings.
Indoor air pollution poses many challenges to the health professional, especially for
infants, the elderly, persons with chronic diseases. The locations of highest concern
are those involving prolonged, continuing exposure – that is, the home, school, and
workplace. Therefore, it has become one of the most important issues of environ-
ment and health worldwide considering the principle of human rights to health that
every one has the right to breathe healthy air.
The schools have complex indoor environments influenced by many factors, such
as, the number and age of occupants, their activities, building design, sources of pol-
lution inside the building; outdoor pollutant concentration and ventilation conditions
(Goyal and Khare 2009; Goyal 2009; Clements-Croome et al. 2008; Hanssen 1993;
Hanssen and Mathisen 1987; Lee and Chang 2000; Daisey et al. 2003).
M. Khare (B)
Department of Civil Engineering, Indian Institute of Technology Delhi, Delhi 110016, India
e-mail: [email protected]
179S.A. Abdul-Wahab (ed.), Sick Building Syndrome,
DOI 10.1007/978-3-642-17919-8_10, C© Springer-Verlag Berlin Heidelberg 2011

180 R. Goyal and M. Khare
• Inadequate ventilation – increases indoor pollutant levels by not bringing in
enough outdoor air to dilute emissions from indoor sources and by not carrying
indoor air pollutants out of the classrooms.
• High temperature and humidity levels – increase concentrations of some
pollutants.
• There are many sources of indoor air pollution in schools. These include combus-
tion sources such as oil, gas, kerosene, coal; building materials and furnishings
as diverse as deteriorated, asbestos-containing insulation, cabinetry or furniture
made of certain pressed wood products; products for cleaning and maintenance,
personal care, or hobbies; cooling systems and humidification devices; and
outdoor sources such as radon, pesticides, and outdoor air pollution.
• Outdoor air enters and leaves the building by infiltration, natural ventilation, and
mechanical ventilation. In a process known as infiltration, outdoor air flows into
the house through openings, joints, and cracks in walls, floors, and ceilings, and
around windows and doors. In natural ventilation, air moves through opened win-
dows and doors. Air movement associated with infiltration and natural ventilation
is caused by air temperature differences between indoors and outdoors and also
by the indoor/outdoor wind pressure difference.
• High pollutant concentrations can remain in the indoor air for long periods after
some of these activities.
Urban schools, in particular, are located in close proximity to high-density road-
ways and may experience significant concentrations of outdoor pollutants. They
present a much higher occupancy than any other building (four times as many occu-
pants per unit of area than in office buildings). Many recent studies have shown that
schools have significant indoor environmental problems, while ventilation levels
are below the recommended rates (Daisey et al. 2003; Myhrvold et al. 1996; ISIAQ
2000; Wargocki et al. 2005; Clements-Croome et al. 2008). Inadequate ventilation
may lead to unacceptable IAQ conditions in schools, and are cause of sick building
syndrome, increased complaints by the students, and increase rate of absenteeism.
It may also results in high indoor pollutant concentration, which has a potential
adverse impact on the health and learning capacity of students as they are more sus-
ceptible to indoor air pollution due to their higher breathing and metabolic rate and
spend almost 8–10 h of a day inside classrooms, which is more than in any other
building environment except their home (American Lung Association 2005). In the
recent past, studies estimate that more than 50% of school children have some kind
of allergy or asthma (Mendall and Heath 2005; Annesi-Maesano et al. 2007).
However, monitoring/measurement of IAQ parameters in schools pose many
challenges to the environmental engineers and scientists as they are resource
intensive. A solution oriented approach requires a steering committee of experts
to provide their opinions on the design, planning and implementation of IAQ
monitoring/measurement and control programs. The experts need to identify the
key parameters that are to be measured/monitored in indoor school environment.
In the past, many such measurements are performed by researchers to test the

10 Indoor Air Quality: Monitoring and Modeling Protocol 181
postulated hypothesis about the effects between the complaints and the sources
(ISIAQ 2000). The causes of the complaints may be manifold that may include
technical, chemical, physical, medical, psychological, sociological and economical
factors. Correspondingly, the investigation strategies in such buildings are multi-
interdisciplinary (Molhave 1986). The successful investigation depends upon the
efficient coordination between various experts in such multi-factorial relations.
In order to coordinate such co-operation a protocol covering sampling/monitoring,
analyses, prediction and evaluation becomes an essential tool. However, this proto-
col must also define the specific goals and specify as to how they are achieved in
such multi-factorial environment. The multi-factorial team may consists of experts
like, building managers, heating, ventilation and air conditioning (HVAC) engineers,
those performing the sampling and analyses (e.g. analyst), those making predic-
tions of IAQ (e.g. the IAQ modelers) and lastly those making the evaluation of the
building and taking decisions (e.g. the controlling authorities). Besides, the protocol
must further ensure proper collection and recording of all information needed for
the specific goals.
10.2 Steps Involved in IAQ Monitoring and Modeling Protocol
for School Buildings
i. Selection of the school building type i.e. naturally ventilated and/or mechani-
cally ventilated (HVAC)
ii. Conducting an IAQ building audit;
iii. Diagnosing IAQ related health problems;
iv. Selection of pollutants of concern;
v. Designing the monitoring programme of selected pollutants of concern;
vi. Setting up of IAQ guideline values for selected pollutants
vii. Establishing an IAQ management and maintenance program to reduce IAQ
risks;
viii. Protecting occupants from exposures to construction/renovation contami-
nants; and
ix. Calculating the cost, revenue, and productivity impacts of planned IAQ
activities.
10.3 Major Areas of Investigation
IAQ monitoring and modeling protocol needs to incorporate three major areas of
investigation: Environmental measurements, building and ventilation parameters,
and an occupant questionnaire. Framework for understanding how indoor and out-
door sources of pollution together with the ventilation affect the IAQ in buildings is
one of the essential requirements. The monitoring protocol also include the schedule

182 R. Goyal and M. Khare
of measurements, the specifications of the measurement equipments, how to select
the representative space(s), and how to select the sampling sites in each space. Data
collection programs allow entry of majority of data and its findings in an accessible
database so that it can be used by any interested party for a number of applications
i.e. developing the distribution of IAQ/building/ventilation characteristics, predict-
ing IAQ (modeling), developing new hypothesis, establishing standard protocols,
examining the relationship of symptoms to building and ventilation characteris-
tics, exposure assessment/modeling, developing guidelines for building design and
orientation, construction, operation and maintenance and so on and so forth.
10.4 Components of IAQ
The first step in the preparation of an IAQ protocol is the definition of the sampling
objectives. These objectives are generally problem oriented and so need “mapping”
or documentation of complaints in the school building, control of compliance with
standard or exposure limits and identification of the sources. Other objectives are
the evaluation of the methods for measurements of pollutants, individual exposures
of the receptors within the building, the identification of the effects of the variations
in ventilations on IAQ. Each of these objectives call for different protocols and a
detailed description of the aim is essentially the first step in any planning of the pro-
tocol. Once the sampling/monitoring objectives have been defined, the second step
is to establish a list of all relevant sampling/monitoring variables and their varia-
tion range. The components involved in IAQ monitoring and modeling protocol for
school buildings is as given below:
1. Identification of relevant measuring parameters
2. Sampling locations
3. Time of sampling/monitoring
4. Duration of sampling/monitoring
5. Number of samples/monitored data
6. Instrumentation
7. Calibration
8. Building and ventilation characterization
9. Occupant questionnaire
10. Sampling/monitoring administration
11. IAQ prediction models
10.4.1 Identification of Relevant Measuring Parameters
10.4.1.1 Environmental Parameters
Biological contaminants – allergens or microbiological, bioaerosols; chemical con-
taminants – Respirable suspended particulate matters (RSPM) i.e. PM10, PM2.5 and

10 Indoor Air Quality: Monitoring and Modeling Protocol 183
PM1.0, settled dust, gases (CO2, CO, SOx, NOx, O3) and volatile organic com-
pounds (VOC’s) including formaldehyde; and physical environment – Humidity,
air movement (air flow, i.e. air change per hour, ACH), ambient indoor temperature.
The biological contaminant measurements firstly include capturing of
bioaerosols from the air. Different air sampling techniques can be used to real-
ize the goal of capturing indoor bioaerosols. The major bioaerosol sampler types
are impactors and sieve samplers, impingers, centrifugal samplers and filter cas-
sette. The possible subsequent analysis involves cultivation, microscopic analysis,
biochemical analysis and immunoassays.
The chemical contaminants measurements include measuring carbon dioxide
(CO2) and other possible indoor contaminants. CO2 measurements are done by
using sorbent tubes, which are readily available and are inexpensive. However they
are with accuracy of only 25% and are not of much value for indoor air quality diag-
nostics. Digital infrared spectrometry though more expensive is mostly used with
more accurate and appropriate measurements. Indoor CO2 should be measured at
peak values. However, if measurements in the occupied space are above 1,000 ppm,
one has to then check for improperly vented combustion appliances, which could
also be producing carbon monoxide (CO). The CO2 levels outdoors are also required
to be investigated simultaneously to estimate the indoor-outdoor (I/O) values and
compare with thresholds values specified as 15 and 20 cfm per occupant (ASHRAE
1989). If these conditions fail to explain the exceedances in the CO2 levels (i.e.
>1,000 PPM), it may be then a valid presumption that the outdoor air ventilation
rate is too low. Real-time measurements of CO2 with data-logging equipment can
be also be used to see how CO2 values rise and fall in an occupied space during
the day, reflecting the pattern of changing occupancy, or changing outdoor air ven-
tilation rates. This can provide clues as to what is happening in the building and
this information can help in the diagnostic process. Most of the IAQ problems can
be solved with investigation of CO2 and ventilation indoors without measuring spe-
cific contaminants. However, their measurements are sometimes helpful to clearly
identify the sources and target contaminants to measure specific contaminants that
have no acute affects but which could cause serious long term illness. This would
help in taking mitigation measures to control the contaminant. When measurements
are taken, qualified, experienced persons should take them and adhere to protocols
and quality assurance procedures. Other essential parameters for IAQ measurement
may include RSPM (PM1.0 may be considered under desirable category); volatile
organic carbons (VOC) including formaldehyde; O3 and CO.
The Physical environment includes the measurement of temperature and relative
humidity. Generally, independent measurements of temperature and relative humid-
ity will be sufficient. However, some instruments will integrate these and other
measurements and provide a read out of thermal comfort consistent with ASHRAE
standard 55.2. 2007. For temperature and humidity measurements, instruments can
be a simple thermometer and humidity gauge, a sling psychrometer, or an electronic
thermo hygrometer. Such meters integrate several thermal comfort parameters and
will provide a direct indication as to whether thermal comfort is in the acceptable
range according to ASHRAE standard 55.2. 2007.

184 R. Goyal and M. Khare
10.4.1.2 Building and Ventilation Parameters
Emission controlling variables: it includes the building site (near to road, away
from road) and type (single/double/multistoried with its height), orientation
of exits (doors, windows, ventilators), the construction material used, ventila-
tion type (natural, mechanical, HVAC), outdoor pollution (traffic, industry, resi-
dences etc.) emission rates, elimination rates (sinks, e.g. plantation, carpets, wall
papers etc).
10.4.1.3 Observational Data
Co-variables for human reactions: number of occupants (children and staff) in
the classrooms, age group, genetic factors, personal co-factors, activities of occu-
pants social environment, work environment, exposure times. Human Reactions –
symptoms from eyes, nose and upper airways, throat, mouth, lower airways,
stomach, heart, ear, hyper-reactivity, skin reactions, heat balance, neurological
effects, psychological effects, changes in human activity patterns. Non human
reactions – from animals and plants and effects of buildings and other properties.
10.4.2 Identification of Sampling Locations
The optimal sampling site depends on the sampling objectives. If the sampling is
planned for a specific environments (offices, residential dwellings etc.), the loca-
tions are preferred inside these environments. However, if the sampling/monitoring
are representative of a given type of residences, commercial buildings, schools, hos-
pitals, the investigators must first ensure the representatives in the selected sampling
sites. After selecting proper sampling/monitoring sites, the sampling/monitoring
locations inside the environment or building must be considered. This is impor-
tant as the air inside the environment is not uniformly distributed. One strategy is to
locate and investigate the areas of highest concentrations of contaminants. Woods
et al. (1985) and Maldonado and Woods (1983) have suggested a procedure for
choosing the sampling locations indoors using four concepts:
i. Location of the problem or contaminant source.
ii. The relative exposure index (REI) or
iii. The ventilation effectiveness (VE) and
iv. Occurrence of complaints
REI and VE methods use tracer gas technique for identifications of problem areas
within the building. Later, for mathematical analysis and predictions, each sam-
pling/monitoring location may represent a homogeneous microenvironment which

10 Indoor Air Quality: Monitoring and Modeling Protocol 185
means that variance of variables under consideration in each microenvironment
will be smaller than variance among the averages for different microenvironments
(Moschandreas 1981). Therefore different microenvironments constitute together
the entire non-homogeneous sampling/monitoring microenvironments while each
sampling/monitoring location is representing a homogeneous microenvironment.
Each of this microenvironment must be decided prior to sampling/monitoring and
separate sampling/monitoring protocol may be fixed for each of them. The size of
the microenvironment depends upon the variations in space and time of the selected
variable.
10.4.3 Time of Sampling/Monitoring
The contaminants concentrations indoors are related with cofactors such as humid-
ity, human activity and air temperature. The time of sampling/monitoring must then
be chosen accordingly so as to minimize the influence of the cofactors e.g. when
the potential cofactors are expected to be constant and at average level. Such choice
of time may not be acceptable or achievable all the time in relation to the over-
all aims of the investigations. Hence the sampling/monitoring programme must
always allow estimate of the range of variations of relevant cofactors. In one of
the recently conducted IAQ investigations for naturally ventilated school buildings
in tropical climatic conditions, the monitoring/sampling timing protocols used is
given in Table 10.1.
Similarly, for other types of dwellings, the proposed sampling/monitoring proto-
col is suggested as below (industrial establishments are not covered):
• Residential (morning and evening, 1 h in each case)
• Offices (Any two working hours)
• Health care units (morning and evening, 1 h in each case)
• Restaurants (any 2 h in the evening)
Table 10.1 Monitoring/sampling timing protocol (Goyal 2009)
Temporal
variations
Hourly variations Every half an hour (class periods change after every half an hour)
Daily variations From 8.0 am to 2.0 pm continuous (School hours)
Weekly variations Weekdays (Monday, Wednesday and Friday) and weekends (Saturday and
Sunday)
Seasonal variations Non winter months (August, September, October, March, and April) and
winter months (November, December, January and February). For restof the months schools are closed

186 R. Goyal and M. Khare
10.4.4 Duration of Sampling/Monitoring
The sampling duration must represent “peak” exposure and “average” exposure
indoors. Both long term and short term sampling/monitoring may be required to
reflect the desired time resolution of the sampling/monitoring programme. The
greatest time resolution obtainable is the shortest sampling/monitoring duration and
interval. In addition, the sampling/monitoring efficiency together with the sensitiv-
ity of the analytical method also determine the sampling/monitoring duration. Short
time sampling/monitoring (<15 min) is chosen for investigating acute effects; inves-
tigation of chronic effects are evaluated by carrying out sampling/monitoring for
longer duration of several hours or even days. For the school building, the suggested
duration of sampling/monitoring is for hours of the school running as significant
variations in air pollutant concentrations (especially particulates and CO2) occur
every half an hour with change in class hour and activities of occupants.
10.4.5 Number of Samples/Monitored Data
The number of samples or data points must be planned prior to start of sam-
pling/monitoring. It is needed so that the results are within the desired confidence
limits. To accomplish this, pilot studies are conducted. Corn (1985) has described
thumb rule to find out the number of samples/data points in the desired confidence
interval. In any event, minimum three samples/monitored data should be collected
before any statement is made. If the range of these exceed 25% of their average,
additional samples/monitored data points should be obtained. NIOSH (1984) has
described the procedure for maintaining the quality control of the analysis report.
The number of samples may be based on the following criterion:
• By means of random numbers
• All corners, central place at all floors
• Building/house orientations
• Pre-dominant wind direction (up-wind and down wind)
• Depending of the fuel usage
• Income group
In schools the number of samples depends upon its location (proximity to the road),
type of school buildings and activities inside the classrooms and school premises.
School samples should be taken before and after the school hours and according
to the variations in the activities inside the classrooms. Generally schools are run-
ning for 6–8 h and classroom activities changes after every half an hour period to
an hour period. Accordingly number of samples should be decided to get the data
incorporating all variations.

10 Indoor Air Quality: Monitoring and Modeling Protocol 187
10.4.6 Instrumentation
For each of the relevant variables, separate sampling/monitoring instructions accom-
pany the analytical protocol. The preparation of sampling/monitoring instructions
must ensure that the finally selected sampling/monitoring and analytical method
meet the objectives of investigations. That requires consultations with laboratory
prior to the selection of the analytical methods. Table 10.2 describes a few com-
mon sampling/monitoring and analytical methods for measurement and analysis of
the ambient indoor air pollutants and corresponding exposure factors. Optical laser
aerosol spectrometer (LAS), IR based IAQ monitors, are most common and user
friendly instrument used for continuous monitoring of RSPM, CO and CO2, respec-
tively (Blondeau et al. 2005; Branis et al. 2005; Fromme et al. 2007; Goyal and
Khare 2009).
Direct airflow rate measurements, especially in naturally ventilated schools
are difficult though various techniques are available in literature. Therefore CO2
measurements are used to estimate the airflow (ventilation) rate using ASHRAE
formulations as indoor CO2 concentration is considered as surrogate index of
ventilation rate (Persily 1993; Scheff et al. 2000; Goyal and Khare 2009).
10.4.7 Calibration
The sampling/monitoring instruments must be calibrated against a secondary stan-
dard prior to and immediately following sampling/monitoring. Besides, instruments
should be regularly checked for its calibration against primary standards.
10.4.8 Building and Ventilation Characterization
Characterization of building parameters, i.e. type, size, age, location, building
fabric, its furnishing and equipment, its occupants and their activities need to incor-
porate in IAQ protocol. The elements of ventilation, i.e. airflow rate, air volume and
air velocity from openings in natural systems or from heating ventilation and air
conditioning (HVAC) system are important to IAQ. Its information is important to
develop the protocols for the operating set points and schedules consistent with good
IAQ performance. Measurement instruments and techniques, which are generally
available to building personnel, can be extremely useful in assessing the perfor-
mance of the right ventilation system for both exhausting and diluting pollutants.
Useful measuring tools include: Smoke tube and hot wire anemometer to measure
airflow rate (Mueller and Vogel 1994; Karimpanah and Sandberg 1996), pressuriza-
tion test method and Flow hood to measure volumetric airflow (Schijndel 1991),
Velocity meter (particle – streak velocimetry technique) to measure air velocity

188 R. Goyal and M. Khare
Tab
le10.2
Sam
pli
ng
and
mea
suri
ng
pro
cedure
/inst
rum
enta
tion
for
IAQ
study
Conta
min
ant
Sam
pli
ng
pro
cedure
/inst
rum
ent
Anal
yti
cal
pro
cedure
Ref
eren
ce
VO
CD
ual
sect
ion,ch
arco
altu
be,
poly
mer
abso
rber
Solv
ent
eluti
on
and
GC
MS
;S
KC
low
flow
sam
ple
rsw
ith
ten
axor
char
coal
SK
Cpas
sive
VO
Csa
mp
ler
PM
10,P
M2
.5,
PM
1.0
Fil
ters
,lo
wvo
lum
epar
ticu
late
sam
ple
rs,par
ticl
esi
zean
aly
ser,
bet
aat
ten
uat
ion
Gra
vim
etri
c,in
fra
red
bas
ed
monit
ors
GR
IMM
Aer
oso
lD
ust
Monit
or
1.1
08
( 2003)
CO
2R
eal
tim
eIR
bas
edIA
Qm
on
ito
rsA
CG
IH(1
978)
CO
Rea
lti
me
IRb
ased
IAQ
mo
nit
ors
O3
Rea
lti
me
IRbas
edO
3m
onit
ors
Form
aldeh
yde
(CH
2O
)R
eal
tim
eor
liq
uid
sin
imp
ing
erIR
bas
edF
orm
ald
ehy
de
mo
nit
ors
or
chro
motr
opic
/ace
tyl
acet
one
met
hod
Goddis
h1985;
Bis
gaa
rdet
al.1983
Mic
robio
logic
alco
nta
min
ants
Modifi
edA
nder
son
sam
ple
rsL
ight
scat
teri
ng
dev
ice
Dim
mic
kan
dW
olo
chow
1979
Air
chan
ge
per
hour
(AC
H)
CO
2M
easu
rem
ents
/Air
flow
met
erE
stim
atio
nS
chef
fet
al.2000;
Wad
den
and
Sch
eff
1983
Volu
me
of
buil
din
gU
ltra
sonic
rule
rU
ltra
vio
let
rays
Zir
con
DM
S40
Sonic
mea
sure
(Zir
con
Corp
ora
tion,
Cam
pbel
l,
CA
)
Per
sonal
com
pute
rW
indow
7.0
US
Bport
and
TR
AC
KP
RO
ver
sion
3.4
for
dow
nlo
adin
g
and
mat
hem
atic
also
ftw
are

10 Indoor Air Quality: Monitoring and Modeling Protocol 189
(Zhao et al. 1996), CO2 measurement technique to estimate the percentage of out-
door air or to generally evaluate outdoor air ventilation (Persily 1993; Scheff et al.
2000; Goyal and Khare 2009). It acts as surrogate index for analyzing the ventila-
tion and so the IAQ. Besides, air flow grids can also be used to measure differential
pressure and air flows in the buildings.
10.4.9 Occupant Questionnaire
The sampling methods for biological effects are numerous. Therefore to simplify
the measurement protocol for biological effects of indoor pollutants, the “ques-
tionnaire” tool is generally used. The questionnaire will collect information on
various factors, i.e. general information on building (as mentioned in building char-
acteristics), its environmental and ventilation condition, occupants and their work
responsibilities, SBS symptoms and occupant’s perception on their health. However,
there are “gaps” in this tool such as, the questionnaire is neither able to prove causal-
ity, nor document whether the complaints are caused by “hypersensitivity” or high
level of indoor pollutants. Inspite of these shortcomings, the questionnaire tool is
invariably used in analyzing the IAQ problems (Gupta et al. 2007).
10.4.10 Sampling/Monitoring Administration
The protocol must include proper numbering of all samples/monitored data, data
sheets for each variable or co-variable. Strict storage norms and routine for the col-
lected data must be established to secure the validity of the samples/data. Active
information plan must be distributed to the occupants of the building before any
study is started as the success of the IAQ study depends upon the cooperation of the
individual occupant, building manager, the producer of the building material, the
authorities, the resident welfare associations etc. The information activities should
not be biased to any individual stakeholder of the site being investigated.
10.4.11 IAQ Prediction Models
Predictions of IAQ for different types of buildings are essential in order to avoid
repeated IAQ monitoring which involves money and manpower. Various modelling
techniques are used to develop the IAQ models that includes the most used and
simple technique based on mass balance approach. For many studies in IAQ, wind
tunnel simulations can also be used which may provide coefficients controlling the
air change rate (Hall et al. 1999), resuspension and/or re-entrainment of the set-
tled particulates etc (Gomes et al. 2007). Such studies would help in eliminating
uncertainties affecting the predictive efficiency of the IAQ models for RSPM (Goyal
and Khare 2010). In nutshell, Fig. 10.1 describes the proposed IAQ monitoring and
modeling protocol for urban schools.

190 R. Goyal and M. Khare
Natural + Mechanically
Ventilated Buildings
Indoor Air Quality
Urban School Buildings
Naturally Ventilated
Buildings
HVAC buildings
Ventilation
Characterization + measurement of ventilation
Identification of contaminants/their sources
Monitoring of contaminant levels at various locations (at
least 3 locations in each building type)
Record of occupant’s health complains
(questionnaire study)
Identification of Control
measures
Laying down the standards/
limits for various contaminants
and ventilation parameters
for different building
types by Govt. Bodies
Data interpretation/
analysis (exploratory/
statistical)
Prediction of
IAQ
Fig. 10.1 An IAQ monitoring and modeling protocol for urban schools
References
ACGIH (1978) Airsampling Instruments for Evaluation of Atmospheric Contaminants, 5th ed.
ACGIH, Cincinnati, OH.
American Lung Association (2005) IAQ basics for schools. http://www.lungusa.Org/site/pp.asp?
c=dvLUK9O0E&b=36007.
Annesi M, Isabella M, David C, Denis L, Francois M, Yvon LT, Andre PG, Charpin D (2007)
Residential proximity fine particles related to allergic sensitisation and asthma in primary
school children. Respir Med 101(8):1721–1729.

10 Indoor Air Quality: Monitoring and Modeling Protocol 191
ASHRAE Standard 62-1989 (1989) Ventilation for Acceptable Indoor Air Quality. ASHRAE,
Atlanta, GA.
ASHRAE Standard 52.2-2007 – Method of Testing General Ventilation Air-Cleaning Devices
for Removal Efficiency by Particle Size (ANSI/ASHRAE Approved). American Society of
Heating, Refrigerating and Air-Conditioning Engineers, 2007, 44pp.
Bisgaard P, Molhave L, Rietz B, Wilhardt P (1983) Quantitative determination of formaldehyde in
air using acetyl acetone method. Anal Lett 16:1457–1468.
Blondeau P, Lordache V, Popuard O, Genin D, Allard F (2005) Relationship between outdoor and
indoor air quality in eight French Schools. Indoor Air 15:2–12.
Branis M, Rezacova P, Domasova M (2005) The effect of outdoor air and indoor human activity
on mass concentration of PM10, PM2.5, and PM1.0 in a classroom. Environ Res 99:143–149.
Clements-Croome DJ, Awbi HB, Bako-Biro ZS, Kochhar N, Williams M (2008) Ventilation rates
in schools. Build Environ 43:362–367.
Corn M (1985) Strategies of air sampling. Scandevian J Work Environ Health 11:173–180.
Daisey JM, Angell WJ, Apte MG (2003) Indoor air quality, ventilation and health symptom in
schools: Analysis of existing information. Indoor Air 13(1):53–64.
Dimmick RL, Wolochow H (1979) Studies of effects of energy conservation measures on
air hygiene in public buildings. LBL Report, LBID-045, Lawrence Berkeley Laboratory,
University of California, Los Angeles.
Fromme H, Twardella D, Dietrich S, Heitmann D, Schierl R, Liebl B, Ruden H (2007) Particulate
matter in the indoor air of classrooms-exploratory results from munich and surrounding area.
Atmos Environ 41:854–866.
Godish T (1985) Residential formaldehyde sampling current and recommended practices. Am Ind
Hyg Ass J 46:105–110.
Gomes C, Freihaut J, Bahnfleth W (2007) Resuspension of allergen-containing particles
under mechanical and aerodynamic disturbances from human walking. Atmos Environ
41:5257–5270.
Goyal R (2009) Indoor Air Quality in Naturally Ventilated Classrooms of a School Building Near
an Urban Roadway. Ph.D. dissertation, Department of Civil Engineering, IIT Delhi.
Goyal R, Khare M (2009) Indoor–outdoor concentrations of RSPM in classroom of a naturally
ventilated school building near an urban traffic roadway. Atmos Environ 43:6026–6038.
Goyal R, Khare M. (2010) Indoor air quality modeling for PM10, PM2.5, and PM1.0 in natu-
rally ventilated classrooms of an urban Indian school building. Environ Monit Assess. DOI
10.1007/s10661-010-1600.
GRIMM Aerosol Technik, GmbH, Co. Germany (2003) Environmental dust monitor, model 107
and weather housing, model 165.
Gupta S, Khare M, Goyal R (2007) Sick building syndrome – A case study in a multistory centrally
air-conditioned building in the delhi city. Build Environ 42:2797–2809.
Hall DJ, Walker SC, Spanton AM, Kukadia V (1999) Pressure and concentration patterns on
building forms in urban arrays. BRE Client Report CR 125/99.
Hanssen SO (1993) Increased ventilation reduces general symptoms but not sensory reactions.
Proceedings of 6th international conference on indoor air quality and climate, vol. 5, Finland,
Helsinki (paper no. 6968):pp. 33–38.
Hanssen SO, Mathisen HM (1987) Sick building – a ventilation problem. Indoor air, proceedings
of 4th international conference on indoor air quality and climate, vol. 3, Berlin (west) (paper
no. 2820):pp. 357–361.
ISIAQ (2000) Creation of Healthy Indoor Environment in Schools: Task Force on Schools – A
Nordic Approach. National Institute of Public Health, Stockholm.
Karimpanah MT, Sandberg M (1996) Maximum velocity of return flow Close To the floor in a ven-
tilated room – experimental and numerical results. In: Proceedings of 17th AIVC conference,
“optimum ventilationn and airflow control in buildings”, vol. 1. Air Infiltration and Ventilation
Centre (AIVC), Gothenburg, pp. 263–271.

192 R. Goyal and M. Khare
Lee SC, Chang M (2000) Indoor and outdoor air quality investigation at schools in hong kong.
Chemospehere 41(1):109–113.
Maldonado EAB, Woods JE (1983) A method to select locations for indoor air quality sampling.
Build Environ 18:171–180.
Mendall MJ, Heath GA (2005) Do indoor pollutants and thermal conditions in schools influence
student performance? A critical review of the literature. Indoor Air 15(1):27–52.
Molhave L (1986) Indoor air quality in relation to sensory irritation due to volatile organic
compounds. ASHRAE Trans (Dec.) Paper No. 2954.
Moschandreas DJ (1981) Exposure to pollutants and daily time budgets of people. Bull NY Acad
Med 57:845–859.
Mueller H, Vogel P (1994) Methods for investigating indoor air conditions of ventilated rooms,
vol. 1. Air Conference, held Buxton, pp. 101–108.
Myhrvold AN, Olsen E, Lauridsen O (1996) Indoor environment in schools- pupils health and
performance in regard to CO2 concentration. Indoor Air 4:369–374.
NIOSH (1984) Manual of analytical methods (3rd ed., vol. 1). pp. 15–28. (2005) Quality and
climate, vol. 1, pp. 368–372.
Persily AK (1993) Ventilation Carbon dioxide and ASHRAE standard 62-1989. ASHRAE J
35:40–44.
Scheff PA, Paulius VK, Huang SW, Conroy LM (2000) Indoor air quality in a middle school, part
I: Use of CO2 as a tracer for effective ventilation. Appl Occup Environ Hyg 15(11):824–834.
Schijndel LLL (1991) Air tightness in the schools in the Netherlands. BIBINF Netherlands, TNO-
BOUW, report D–91–0567.
Wadden RA, Scheff PA (1983) Indoor Air Pollution: Characterization, Prediction, Control. Wiley,
New York, NY.
Wargocki P, Wyon DP, Matysiak B, Irgens S (2005) The effects of classroom air temperature and
outdoor air supply rate on the performance of school work by children. In: Proceedings of the
10th international conference on indoor air, vol. 1, Beijing.
Woods JE, Krafthefer BC, Janssen JE (1985) Solutions to Indoor Air Quality Problems in Light
Housing. Conference on Energy’ 85, Washington DC.
Zhao L, Zhang Y, Wang X, Riskowski GL, Christianson LL (1996) Development of Particle Image
Velocimetry Techniques for Measurement of Room Airflow Patterns in Ventilated Airspaces.
Illinois Council for Food and Agricultural Research, Champaign, IL.

Chapter 11
Mould Growth on Library Materials Storedin Compactus-Type Shelving Units
Flavia Pinzari and Mariasanta Montanari
11.1 Introduction
Compactus-type shelving is one of the systems of choice used for the conservationof materials in libraries, archives and museums (Fig. 11.1). These high-density stor-age systems are also referred to as “movable shelving” and are employed by manyinstitutions suffering from limited space. These systems minimize the amount ofspace required for storage by compacting blocks of shelves (or cabinets of draw-ers) tightly together. The blocks slide along tracks and can therefore be moved apart(opened) for the retrieval of items positioned on a particular block and then movedback together again (closed). Compactus shelving can also guarantee protectionagainst dust deposition (Gallo and Regni 1998). These characteristics are advan-tageous for the preservation and storage of materials, but they can also becomeproblematical when used in conservation environments lacking climate controlsystems. Compactus shelving can be considered ideal equipment for preventiveconservation when the overall climatic situation is ideal. Resistance to heat andhumidity exchange between the micro-environment within the compactus units andthe outer environment can represent a severe peril to stored objects, especially whenthese are composed of hygroscopic materials. Recommended standards for preserv-ing documents of all kinds are now well understood (18–20C and 50/55% RH for
books and periodicals, and 5C and 35% RH for colour print photographs). The real-
ity is that in most cases it is difficult to maintain a stable temperature and/or relative
humidity level, even with the benefit of air conditioning. Specific climatic and eco-
nomic conditions play an important role, and these should not be underestimated.
In some conservation environments compactus-type shelving systems have caused,
indirectly, serious degradation phenomena to occur. The problems caused by mov-
able shelving systems were found to be more at the micro-environmental level rather
than at a macro-level. During the course of several investigations in libraries and
F. Pinzari (B)Istituto Centrale per il Restauro e la Conservazione del Patrimonio Archivistico e LibrarioMinistero per i Beni e le Attività Culturali, 00184 Rome, Italye-mail: [email protected]
193S.A. Abdul-Wahab (ed.), Sick Building Syndrome,DOI 10.1007/978-3-642-17919-8_11, C© Springer-Verlag Berlin Heidelberg 2011

194 F. Pinzari and M. Montanari
F i g. 11. 1 A detail of thedepository at the EstensePublic Library equipped withcompactus-type shelving
archives, a range of causes led to the same results, namely the development, withincompactus shelving blocks, of moulds on volumes’ bindings, especially when made
of leather, parchment or cotton fibres.
Due to the frequency of occurrence of mould on library and archival materi-
als stored within compactus shelving and the similarity in the appearance of such
“infections”, a study was undertaken which was aimed at pinpointing any common
factors, above and beyond the mere presence of compactus shelving that provoked
the development of such degradation phenomena.
In this chapter the results obtained from six different diagnostic surveys con-
ducted in depositories located in Italy (all containing compactus shelving) are
described; additionally, the solutions applied to combat deterioration phenomena
are discussed. Four depositories are located in Rome, one in Genoa, and the sixth
in Modena (Table 11.1). The volumes stored in the depositories of these libraries
T able 11.1 Depositories investigated in the present study (ND not defined)
Library or depository Location Size of collection
Berio Civic Library Genoa (Italy) 150,000 volumesEstense Public Library Modena (Italy) NDSt Apollinare Universitary Library, French Academy Rome (Italy) NDHistorical Library of Finance Rome (Italy) 100,000 volumesAngelica State Library Rome (Italy) 200,000 volumesLibrary of the Belgium Academy Rome (Italy) 80,000 volumes

11 Mould Growth on Library Materials Stored in Compactus-Type Shelving Units 195
Fig. 11.2 Volumes stored in compactus-type shelving units and affected by moulds at the EstensePublic Library. Only books with bindings made of leather, parchment or canvas presented withmould growth
were all found to be in an overall good state of preservation. In addition, environ-mental parameters are well-monitored and stable, and a good prevention policy withperiodic dusting of stored materials is in place.
Nevertheless, some volumes stored within the compactus shelving presentedwith mould growth on their covers, as documented in Figs. 11.2 and 11.3. Thefungal mycelia, in all the observed materials, were consistently characterised bytheir scattered appearance, with the colonies taking the form of light coloured spotsmeasuring 0.5–1 cm in diameter.
The Biblioteca Angelica has been a State Library since 1873. It is one of the
world’s great collections of rare books and manuscripts. It is named after Angelo
Rocca (1546–1620), an Augustinian Bishop, who headed the Vatican’s Printing
House during the time of Pope Sixtus V.
The Library’s 200,000 volumes include the Ancient Book Collection, an out-
standing set of works published between the fifteenth and eighteenth centuries. The
Angelica houses more than 1,100 incunabula, including an edition of Cicero’s De
Oratore (1465, the first book printed in Italy) and one of the earliest known copies
of Dante’s Divine Comedy.
The Library of the Belgium Academy houses about 80,000 volumes, includ-
ing those belonging to the Belgium Historical Institute in Rome and the National
Princess Marie-José Foundation. Seventy percent of the volumes are on topics such
as history, the arts and archaeology, and the history of sciences and religions.
The Berio Civic Library was built by the abbot Giuseppe Vespasiano Berio in the
second half of the sixteenth century. Today the building (which has been completely
restored) is also a cultural centre which is open to the public. The Berio Library
collected a great wealth of precious books and documents between the fifteenth and

196 F. Pinzari and M. Montanari
Fig. 11.3 Volumes stored incompactus-type shelvingunits and affected by mouldat the Historical Library ofFinance. Damage was verylocalised and limited(as anticipated in theintroduction) to only a fewportions of the bindings
eighteenth centuries; these include parchments, coats-of-arms, manuscripts, illumi-nated codices, maps, autographed letters and the collections of some of Genoa’s old
and important families.
The G. Apollinaire Library is part of the French-Italian Studies Centre; it was
founded as the “Bibliothèque française de Rome”, being the library of the French
Embassy in Rome. Today it is a University Library (the fund was donated to the
capital’s Roma Tre University in 1999), but also functions as the hub of the “Centre
culturel français”. It is housed in the Palazzo Capizucchi, which dates from the
sixteenth century.
The Historical Library of Finance is the oldest of the libraries located in the
Palace of Finance in Rome. Heir to the Library of the Ministry of Finance of the
Kingdom of Sardinia (1857), it also houses the collections of other pre-unification
States. From the Unification of Italy to date, this library collection has gradually
been enriched with government publications, periodicals and monographs address-
ing primarily, but not exclusively, legal, financial, and historical subjects. Currently,
there are about 100,000 items in the catalogue; these are mainly printed books
produced between the late eighteenth and mid-twentieth century.
The Estense Public Library in Modena was originally the Estense dukes’ library,
which was subsequently moved from Ferrara to the Ducal Palace in Modena, and

11 Mould Growth on Library Materials Stored in Compactus-Type Shelving Units 197
was opened to the public in 1764 (indeed, it was one of the first to be opened tothe public) and has been located in the present-day building, the Museum’s Palace,
since 1833. The collection originates from the ancient Este dukes’ library, which
was created in fourteenth century, and was later enriched with precious volumes
under Niccolò III, Borso and Ercole I. Among the most valuable volumes in the
collection is the famous Borso d’Este Bible, a masterpiece of Ferrarese manuscript
illumination. A description of a survey carried out on the compactus shelving system
in this Library is reported in Montanari et al. (2007).
11.2 Materials and Methods
The study consisted in an environmental and biological assessment of both the
hygienic conditions and state of conservation of structures and materials.
Climatic and water content data – Climatic measurements were performed by
using a number of hygro-thermometer probes positioned vertically along the inside
of compactus shelving units (ranging from 15 cm above the floor to the uppermost
shelf). Climatic measurements were collected throughout the depositories contem-
poraneously. The instruments used for the collection of climatic data were digital
hygro-thermometers (Hygrolog-D Rotronic AY – Switzerland). Data relating to the
water content of books were acquired by means of Aqua-Boy devices (ENERCORP
Instruments Ltd, Toronto, Canada); these are water content meters which are based
on the measurement of the electrical conductivity of materials. All changes in resis-
tance within the relevant measuring ranges are sufficiently pronounced to ensure a
high degree of accuracy for the readings. The electrical (reading value) accuracy of
the Aqua-Boy is ±0.1%, while reproducibility is ±0.2% in relation to the absolute
readings on the meter.
Swab sampling – As part of the investigation, sampling of fungal structures on
damaged library materials was carried out. Sterile cotton swabs were used to obtain
samples suitable for fungal and bacterial culturing and identification. To collect a
sample, a swab was wiped across the entire area showing visible damage.
Adhesive tape sampling – Removable adhesive tape was used to collect samples
of fungal mycelia and sporulating structures from the parts of the bindings hosting
fungal structures. The colonies were brought into contact with the adhesive side of
the tape by applying very light pressure. Next, the sample tape was transferred to a
glass slide using a drop of mounting fluid so as to facilitate microscopic examination
(Samson et al. 2002), or alternatively to a metal stub for SEM (Scanning Electron
Microscope) observation.
Agar/broth cultures – Fungal structures sampled with cotton swabs were inoc-
ulated directly on to agar plates coated with different types of nutritive media; the
swabs were then immersed in sterile Czapek broth (Samson et al. 2002). The Petri
dishes employed for culturing the fungal and bacterial strains were prepared with
the following substrates: PDA (Potato Dextrose Agar), MEA (Malt Extract Agar),
M40Y (Malt Yeast Agar with 40% of saccharose), DG18 (Dichloran Glycerol
198 F. Pinzari and M. Montanari
Agar), all in accordance with Samson et al. (2002). The last two substrates are usedas a medium to promote the growth of xerophilic and osmophilic species.
Optical microscope observations – Illuminated microscopic examination of
mounted slides with applied adhesive tape samples and fungal structures was carried
out using an Olympus AX60 microscope fitted with a digital camera.
Scanning Electron Microscope observations – SEM images of adhesive tapes
bearing captured fungal structures were made using an EVO 50 Scanning Electron
Microscope produced by the Carl-Zeiss Electron Microscopy Group (Oxford, UK).
The SEM instrument used for this study is a Variable Pressure model that can be
used with non-conductive specimens without the need for metallization (Goldstein
et al. 2003). Tape fragments measuring 5–10 mm in diameter bearing the fungal
structures were cut and mounted on to a 12 mm metal stub using double-sided
carbon adhesive tape. The sample areas were examined using a 20 kV electron
beam, and both a variable pressure secondary electrons (VPSE) detector and an
electron backscattered diffraction (BSD) detector were used to acquire SEM images
of samples at various levels of magnification.
Aerobiological investigations – Atmospheric aerosol sampling was carried out
using the gravitational deposition method: i.e. collection by means of gravity-driven
settling of particles on Petri dishes coated with a suitable culture medium. Culture
dishes with a diameter of 9 cm containing MEA and DG18 media were used. The
plates were placed on the shelves within and outside the compactus units, in the
same places where the digital hygro-thermometers were positioned. The sampling
period duration was 1 h. Following exposure to air, the plates were placed in a incu-
bator at 27C for 7 days and checked daily: Colony Forming Units (CFU) counts
were performed.
Statistical analysis – Principal Components Analysis was applied to several sets
of environmental data so as to assess the overall variability of the water content val-
ues and, at the same time, to identify the main components (eigenvectors), which
consist in factor scores, with increased variability of the cumulative data. Analysis
of variance (ANOVA) was also applied in order to effect multiple comparisons;
Fisher’s LSD test (LSD: Least Significant Difference) was used for this purpose –
this is a sort of Student test which assumes that all the averages for the various
categories are the same, with the aim of highlighting significant differences at
95% confidence intervals. Calculations were performed using XLSTAT Addinsoft
software (Fahmy 2003).
11.3 Results and Discussion
All the six study cases examined disclosed moulds that had grown on books (espe-
cially on their spines) stored in compactus shelving units. Conversely, the volumes
stored on open metal shelving in the same environments where the compactus units
are located proved to be free of mould. Significantly, damage was very localised
and limited – as anticipated in the introduction – to only some parts of the bindings.

11 Mould Growth on Library Materials Stored in Compactus-Type Shelving Units 199
Air contamination inside and outside compactus shelves
(Colony Forming Units, settlement on agar plates)
0
5
10
15
20
25
30
35
40
45
Compactus (RF7) Compactus (RCI) Outside 4
CF
Us (
ho
ur/
dm
2 a
ga
r)Compactus (RF7)
Compactus (RCI)
Outside 4
Fig. 11.4 The prevailing situation at the Library of the Belgium Academy: a significantlylower charge of vital aero-diffused microflora within the compactus shelving units was found incomparison to the surrounding “open” environment
Moreover, only books with bindings made of leather, parchment or canvas presentedwith fungal efflorescence (Fig. 11.2), while bound volumes and bindings made fromcardboard and paperbound volumes were found to be free of mould. These obser-vations are equally valid for all the cases investigated. The analysis of air qualitycarried out by means of gravity-driven collection of CFUs disclosed the presence ofa significantly lower charge of vital aero-diffused microflora within the compactusshelving units compared with the environment outside the units. This situation wasfound in most of the depositories investigated, although any differences were moresignificant in those spaces where a higher overall environmental spore charge waspresent. Figure 11.4 reports, as a mid-range example, the situation recorded at theLibrary of the Belgium Academy. The air outside the enclosed compactus envi-ronment showed a significantly higher number of CFUs, when compared with theair within two different enclosed compactus environments. The air quality in thedepository was determined to be within acceptable limits, in relation to ISO/DIS16000-18, ISO TC 146/SC 6 (2008).
The measurements reported in the bar chart shown in Fig. 11.4 were collected bymeans of spore settlement on agar coated plates; the air inside compactus units wasmeasured with the shelves kept closed, while the air outside the units was measuredtaking care not to introduce misleading variables (i.e. ventilation, air movementcaused by human motion, or open windows). From the qualitative point of view,airborne communities within and outside compactus shelving units were composedof fungal spores and propagules (mainly Aspergillus, Penicillium, Cladosporium,
Alternaria, Geotrichum, Gliocladium genera), various yeasts and bacterial cells.Sampling of fungal material performed directly on library materials using swabsand adhesive tape showed that the efflorescence was actually composed of fungal

200 F. Pinzari and M. Montanari
Fig. 11.5 A fragment of adhesive tape directly observed through an optical microscope (OlympusA×60, light field) reveals the presence of mature Aspergillus fruiting structures (conidiophora),with chains of conidia
Fig. 11.6 A fragment of adhesive tape used for sampling the mould efflorescence present on vol-umes in the Angelica Library. The mould appeared whitish in colour when observed on materialsand green-dull grey when sampled using transparent tape
mycelia and that the actively growing strains belonged to species different fromthose found in air samples (Figs. 11.5 and 11.6).
This discrepancy between the composition of the microbial and fungal assem-blage in samples taken from the air and those collected directly from mould-affectedmaterials was conspicuous in all the depositories analysed.
The illuminated microscope observation of adhesive tape samples revealed fruit-ing structures with spores belonging mainly to species of xerophilic or osmophilicfungi, genera that are known to be capable of growing in conditions characterisedby low water activity, such as Eurotium species, and xerophilic Aspergillus species(Aspergillus restrictus, Aspergillus penicilloides, etc.). It was possible to attributesome of the fungal structures sampled from the volumes affected by moulds to theAspergillus genus (Figs. 11.6 and 11.7), but not to any particular species because thediagnostic features were too far from those described in the systematic keys. In fact,fungi can display very different appearances depending on the substrate upon whichthey develop (Samson et al. 2002), and most of the descriptions and measurements

11 Mould Growth on Library Materials Stored in Compactus-Type Shelving Units 201
Fig. 11.7 Scanning electron micrograph of the adhesive tape supporting the fungal structures thatdeveloped on books. The image was obtained by applying the environmental mode and usingatmospheric pressure to prevent shrinkage of biological structures. The sample was not metallised.The features of the conidia resembled those of some Aspergillus species belonging to the Glaucusgroup (i.e. Eurotium amstelodami), but no positive identification could be arrived at since it hasnot yet been possible to produce living cultures of the fungus
of fruiting bodies and spores relate to the strains cultured on standard nutritive agar.Additionally, several attempts to grow cultures of fungal isolates from the xerophilicspecies that developed within the compactus shelving units were unsuccessful, prob-ably because of the very peculiar nutritional attitudes of these fungi and to an overallscant viability of the same.
Conservators and librarians working in all the depositories investigated and fre-quenting the environments where mould-affected compactus shelving is presentreported typical symptoms of so-called “sick building syndrome”; the said per-sonnel suffered from a number of health problems that can be attributed to thepresence of fungal and bacterial spores and volatile organic compounds producedby actively growing micro-organisms. The results of the environmental monitoringactivity indicated that apart from the generally consistent maintenance of standardclimatic conditions in all the evaluated situations (the average relative humidityvalue ranged from 50 to 60%, and temperature from 20 to 22C), a humidity gradientwas present inside most of the compactus shelving units housing books affected bymould, and a higher water content was observed (mainly) close to the floor, althoughthe gradient was fairly similar between the upper and lower shelves (Fig. 11.8aand b). In addition, the relative humidity level within the compactus units wasslightly but constantly higher than that on the outside, as shown by the bar chart seenin Fig. 11.9. The microclimatic differences disclosed in all the analysed situations

202 F. Pinzari and M. Montanari
Fig. 11.8 (a) A clustering dendrogram showing the results of a comparative analysis performed atthe Angelica Library and based on the water content of all the volumes contained in a compactusshelving unit. The data obtained from volumes placed on different shelves of the same stack werecompared through the application of Principal Component Analysis and the correlation matrixvisualised as an agglomerative dendrogram; (b) The stack where the measurements were taken,with the relevant numbering of the shelves as reported in the dendrogram
Fig. 11.9 A diagram showing the differences between environmental relative humidity (RH%)and Temperature (TC) both within and on the outside a compactus shelving unit (data from thesurvey performed at the St Apollinare University Library). In the diagram, labels C190, C80 andC50 relate to shelves at different heights from the floor (190, 80 and 50 cm), while “Env” indicatesthe average values obtained outside the compactus shelving units. The shelf closest to the floor wasfound to have a higher value of RH and a lower value of TC

11 Mould Growth on Library Materials Stored in Compactus-Type Shelving Units 203
result in a variation of water content in some volumes. A slight difference in watercontent between the covers and inner parts of volumes (i.e. text block) can triggerthe growth of mould. This hypothesis is supported by data gathered in a number ofdifferent depositories.
Measurements of water content in volumes both affected and unaffected bymoulds, all stored in the same stack, revealed two interesting points. In the firstplace, a difference, albeit small, between the values of water content of the cover andthe inner parts of volumes is associated with the presence of moulds (Fig. 11.10).A second important point is related to the different capacities of materials to adsorbenvironmental/ambient water: Fig. 11.11 shows how a greater difference betweenthe text block and the cover of a volume was found in items characterised by aleather binding.
In order to avoid the necessity of mass disinfection of materials using toxicgases, the problem of mould efflorescence in most of the depositories has beentackled by applying a combination of low-impact/toxicity treatments aimed at halt-ing damage to materials and leaving premises safe and healthy for staff to workin. The operations carried out were as follows: (i) the HVAC was checked forefficacy, and ventilation grilles were cleaned and checked to verify their correctfunctioning; (ii) HVAC filters were changed more frequently; (iii) the side panelsof the compactus units were removed so as to facilitate ventilation; (iv) books weremechanically dusted within a safety cabinet, (v) fungal efflorescence was removedmanually by specialised personnel using soft brushes and a vacuum cleaner within asafety cabinet fitted with HEPA filters and the appropriate health and safety devices.In Fig. 11.12, the impact on mould growth by simply removing the side panels fromthe compactus units is shown.
Water Content in volumes
−2.0
0.0
2.0
4.0
6.0
8.0
10.0
12.0
Cover Inside book Difference
Water %
no moulds
mouldsA A A
A B
B
Fig. 11.10 The water content difference in volumes with and without mould at the Library of theBelgium Academy. ANOVA statistical analysis and the Fisher test were used to group observationsbased on their environmental parameters: a different letter (A, B, C) indicates a statistically signif-icant difference between the averages. When two letters are present, it signifies that the particularsample simultaneously belongs to two different groups

204 F. Pinzari and M. Montanari
Water content in volumes
−2.0
0.0
2.0
4.0
6.0
8.0
10.0
Cover Inside Difference
Water %
Fabric
Half fabric
Leather
Fig. 11.11 The water content difference in volumes with different types of binding at the Libraryof the Belgium Academy
Following the volumes’ reclamation/rehabilitation and the adoption of most of
the recommended steps, a further investigation at some of the depositories was
conducted after an interval of approximately 20 months. Visual inspections and
photographic comparisons of the state of conservation of the books and the devel-
opment of mould were performed. Almost everywhere biodeterioration phenomena
Fig. 11.12 A volume from the Estense Public Library before (left) and after (right) a few weeksfollowing the removal of the side panels from the compactus units to facilitate ventilation. Clearand evident regression of mycelia was observed

11 Mould Growth on Library Materials Stored in Compactus-Type Shelving Units 205
appeared to be substantially reduced, and all the volumes that were previouslyaffected by mould efflorescence appeared to be in the same condition as they werefollowing their cleaning 20 months prior.
11.4 Conclusions
The hypothesis formulated to explain the occurrence of damage in compactus-stored volumes is composed of a sum of microclimatic events including: (i) a lackof ventilation within compactus units; (ii) resistance to climatic changes withinthe compactus units in relation to the macroclimate in the depository; (iii) thehygroscopic behaviour of binding materials used in the volumes; (iv) a higher sus-ceptibility to humidity of the exposed parts of the books (i.e. spine, upper edgeand fore edge); (v) the fact that Heating, Ventilation and Air-Conditioning sys-tems (HVAC) had to be switched off during the night and on weekends in somedepositories due to outdated safety rules, thereby causing fluctuations in climaticparameters and eventually causing condensation to develop on enclosed shelvesand materials; (vi) seasonal changes. Among the broad range of situations exam-ined over a roughly 10-year period of surveying activity, the causes of moulddevelopment in compactus-type shelving units varied according to the differentsituations encountered: (a) small libraries with no funds or poor knowledge usedcompactus shelving simply to save space and lacked air conditioning; (b) librarieswith an apparently perfectly functioning air conditioning system positioned air vent-ing modules inappropriately in relation to the compactus shelving units, thus causingincorrect air circulation/currents and the occurrence of non-uniform climatic param-eters along and among the shelves; (c) libraries with efficient air conditioning unitsbut affected by structural problems such as rising damp in the floors and along thewalls. Frequent visual inspection of materials stored within compactus shelvingunits is highly recommended, notwithstanding the presence of a well-functioningHVAC and maintenance of optimal standard climatic values. Micro-environmentalanomalies and localised deterioration phenomena, if promptly detected can be eas-ily contained and resolved, while invasive reclamation/rehabilitation of materialsshould, as far as possible, be avoided and implemented only as a last resort.
References
Fahmy T (2003) XLSTAT-pro 7.0 (XLSTAT). Addinsoft, Paris.Gallo F, Regni M (1998) Conditions microclimatiques dans les bibliothèques italiennes. La clima-
tologie dans les archives et les bibliothèques. Actes des Troisièmes Journées sur la ConservationPréventive. Arles, 2–3 décembre 1998, Centre de Conservation du Livre, Arles, pp. 69–83.
Goldstein J, Newbury D, Joy D, Lyman C, Echlin P, Lifshin E, Sawyer L, Michael J (2003)Scanning Electron Microscopy and X-ray Microanalysis, 3rd ed. Springer Science+BusinessMedia, Inc., New York, NY, 689 pp.
ISO/DIS 16000-18, ISO TC 146/SC 6 (2008) International Organization for Standardization,Indoor air -Part 18: Detection and enumeration of moulds, Sampling by impaction.

206 F. Pinzari and M. Montanari
Montanari M, Pinzari F, Ricci M (2007) Moulds on book stored on “compactus shelves”: Acase study. In: Padfield T, Borchersen K (Eds.) Proceedings Conference Copenhagen MuseumMicroclimates. The National Museum of Denmark, Copenhagen.
Samson RA, Hoekstra ES, Frisvad JC, Filtenborg O (Eds.) (2002) Introduction to Food-andAirborne Fungi, 6th ed. Centraalbureau Voor Schimmelculture, Utrecht.

Chapter 12
Is Your Library Building Sick? A Case Studyfrom the Main Library of Sultan QaboosUniversity at Sultanate of Oman
Sabah A. Abdul-Wahab and Nahed Mohamed Bassiouni Salem
12.1 Introduction
Library buildings were exposed over time to great developments in accordancewith their needs, the needs of the users, and the change of their objectives. Thesedevelopments came in parallel to the constant scientific and technical progress.This development clearly influenced the library buildings and the activities thatare conducted within these buildings as well as their architectural design. Hence,most studies produced dealt with the implications of such developments on librariesand the services they offer. Many researchers focused their attention on describ-ing the architectural elements of libraries and their development. Some researchersfocused upon the stages of development that library buildings went through, andstudying the impact of modern technical developments on their functions (AlSareehiand Hambeshi 2001). Other researchers described the safety and security systems(AlSareehi 2005), while yet others focused upon the architectural design of libraries(Hassan 2005). At the same time, the absence of studies that focus on the envi-ronmental dimention of library buildings and introducing Sick Building Syndrome(SBS) was noticed.
Internationally, light was not thrown upon the pollution inside buildings untilthe late 1970s, when complaints increased in some advanced countries of vari-ous pathological symptoms which occurred in air-conditioned, air-tight buildings.These came to be known as the Sick Building Syndrome, including library build-ings (Apter et al. 1994; Fisk 2000). One of the signs of this disease is that the personsuffers from a set of symptoms closely related to his/her presence in the building,without the identification of any clear causes, and his/her relief of these symptomswhen he/she are out of the building (Cando 1999; WHO 2005). Medical sourcesindicate that over 50 symptoms, some or all of which may appear on those whosuffer from this condition. Since these symptoms are varied and diverse, with noobvious link between them, the pathological condition which collectively describes
S.A. Abdul-Wahab (B)Mechanical & Industrial Engineering Department, College of Engineering,Sultan Qaboos University, Muscat, Sultanate of Omane-mail: [email protected]
207S.A. Abdul-Wahab (ed.), Sick Building Syndrome,DOI 10.1007/978-3-642-17919-8_12, C© Springer-Verlag Berlin Heidelberg 2011

208 S.A. Abdul-Wahab and N.M.B. Salem
these symptoms is medically known as a “syndrome”. The most important symp-toms include: headache, dizziness, faintness, rashes, nose inflammation, difficultybreathing, difficult concentrating, laziness, rapid exhaustion and fatigue (WHO2005).
Reviewing the foreign intellectual output, we find only a limited number of stud-ies dealing with this topic. The researchers of this study did not find any studiesproduced in the Arab intellectual output, focusing adequately on this topic. This iswhat drew the researchers attention to the environmental dimension to the issue,and the necessity to examine the interior environment of library buildings, to deter-mine the extent to which the personnel are exposed to SBS. This was achieved byselecting the building of the SQU Library as a case study.
12.2 Literature Review
The issue of SBS in library buildings has not received much attention despite itsimportance and its impact on the quality of the performance of the information spe-cialist. Hence, the relevant studies published internationally remain limited, whileArab studies related to the topic are a rarity. What the researchers could find inthe Arab intellectual output dealt only with the description of lighting and airing interms of definitions included in studies of library buildings. However, no light wasshed on the extent to which the interior environment impacts upon the health of thelibrarians, and the extent to which this is reflected in their performance.
In the early nineties, the Library of Congress (1991) undertook a study to assessthe nature of pathological symptoms the personnel of the Madison Building ofthe Library in Washington suffer from. The results of the study indicated a closecorrelation between the symptoms and between the sense of comfort with the tem-perature and the perception of smells. The study did not observe any environmentalpollutants exceeding permissible limits, with the exception of one site, where ahigh concentration of mould was recorded. Moreover some problems relating tothe work-place were observed, such as: uncomfortable seats, long working-hoursat computer screens, and insufficient lighting. The conclusion of the study pro-posed some recommendations for improving the maintenance and ventilation of thebuilding, as well as reducing work pressure.
Concerning SBS in Hong Kong, a questionnaire was distributed in one of thelibrary buildings in Hong Kong as a case study to identify the environmental condi-tions of the library building, the quality of ventilation in it, and the bacteria spreadingin it. Interviews were held with the personnel at the library to identify their truefeeling towards the interior environment, and the SBS of the environment in thebuilding. The correlation between three factors was analyzed: the feelings of thestaff, the interior environment of the library, and the symptoms perceived by thestaff in the library. There was a discrepancy between the views voiced by the librarystaff, which resulted in the inability to reach definitive conclusions from the study(Au Yeung et al. 1991).

12 Is Your Library Building Sick? 209
In Britain, a study was conducted on SBS. A questionnaire was prepared forthis purpose and sent to all academic libraries in Britain, and a sample of publiclibraries, to identify the causes leading to SBS in libraries. Through the analysisof the questionnaire outcome, evidence was derived to prove the existence of SBSin the libraries that were included in the study. The results also showed that air-conditioned library buildings are more harmful than library buildings that rely uponnatural ventilation (Morris and Dennison 1995).
In Italy, 16 libraries were included in a study aiming at identifying the extent ofexposure to collective dust and volatile organic compounds such as Formaldehyde.To this end, data on the temperature, the relative humidity, and ventilation ratesinside the libraries were collected, as well as samples of the air inside and outsidethe buildings of these libraries. The results showed the existence of Formaldehydeconcentrations in 10 libraries out of 16. Volative organic compounds were alsoobserved in all the libraries included in the study. There was no correlation betweenthe volatile organic compounds, the formaldehyde and the collective dust (Fantuzziet al. 1996).
In Northern Italy four libraries were studied to identify the concentration ofsome pollutants such as dust, formaldehyde and other volative organic compounds,such as benzin, tolouine, and axiline, to assess the environmental condition of theselibraries and the extent to which this affects the library users. This study was con-ducted due to the increase in SBS symptoms which were observed on the peoplewho spend most of their time in various indoor environments. The findings of thestudy indicated that the library users were uncomfortable. The main reason for thiswas the bad ventilation. The findings also indicated that the most important symp-toms suffered by library users included: feeling hot, eye-inflammations, dry throat,and difficulty breathing (Righi et al. 2002).
For the construction of a healthy library with quality air, an approach hasbeen designed that can be successfully adopted in many cases (Pereira 2004).This approach not only aimed at reducing emissions resulting from construction-materials used in libraries, but also to remove them. This approach consisted of anumber of steps: the assessment of the specifications and characteristics of build-ing materials; interviewing the construction workers and the supervisors; analyzingthe samples used in construction; the examination of construction materials; and theverification of air quality.
In Egypt, Morshidi (2004) studied the public library of the neighborhood,tackling the criteria for designing library buildings, reviewing the necessary pre-requisites in construction materials and interior décor to realize thermal and vocalbehavior ideal for such buildings in accordance with international criteria. The studyalso discussed the technical equipment of the library buildings, including the naturaland artificial lighting of various spaces of the building, protecting the building andits holdings from the adverse impact of fluctuating humidity rates, and the prerequi-sites essential in the case of relying upon the natural ventilation of library buildings.The study also discussed the means for the maintenance and preservation of thelibrary holdings, adequate means of protecting the building against fire-hazards, and

210 S.A. Abdul-Wahab and N.M.B. Salem
safeguarding the building against robbery. However, the study did not touch uponthe SBS in library buildings.
In Turkey, a study was conducted on the various environmental aspects of uni-versity library buildings, taking the main library of the Yildiz Technical Universityin Turkey as a case study (Balanli et al. 2007). The survey study started with thedistribution of a questionnaire to 22 main libraries affiliated to various Turkish uni-versities. The results of the questionnaire showed that 70% of these libraries havefewer users than expected. To explain the poor number of users, the study focusedon environmental aspects of the Yildiz Technical University library building as acase study, aiming to discover the negative effects of the environmental features ofthe building upon library use.
These previous studies have provided ample evidence and significant lessons onthe necessity of paying attention to SBS in library buildings. In this context, thesestudies reiterated the necessity that SBS in library buildings studies should startby relying upon questionnaires, taking these into consideration to ascertain thatlibrary staff suffer from pathological symptoms related to SBS. Hence the currentstudy relies upon a questionnaire to monitor such symptoms. It deals with the envi-ronment of the Main Library at SQU, highlighting the symptoms accompanyingSBS. In addition to this general objective, the study has a number of more specificobjectives, as follows:
1. To throw light upon SBS in library buildings, focusing on the necessity to studyand research the issue, in particular in the light of the absence of any relevantArab studies of the issue.
2. To find out the extent to which the new building of the SQU Library enjoys abetter interior environment, in comparison to the interior environment of the oldbuilding.
3. To reveal the extent to which the personnel of the SQU Main Library sufferfrom SBS.
4. To reveal the extent to which the personnel of the SQU Main Library areenvironmentally aware, and their knowledge of SBS.
5. To set a number of recommendations and solutions that are intended to amelio-rate SBS.
6. To enrich the Arab intellectual output specializing on the issue of the interiorenvironment of library buildings.
12.3 Methodology
To realize the goals of this study, it relied on three approaches: a descriptive surveyapproach to determine the extent to which environmental dimensions have beenobserved in the building of the SQU Main Library. This is done through a setof tools, most important of which are questionnaires and interviews. The secondapproach is a case study, which is limited to the study of the SQU Library in boththe old and the new buildings. Finally, the comparative approach, to demonstrate

12 Is Your Library Building Sick? 211
the extent to which the interior environment of the SQU new library building hasimproved in comparison to the old building. The timeframe for conducting theapplied aspect of the study extended from January to June 2009. The data for thestudy was collected via a questionnaire distributed to the library staff. The question-naire was divided into six sections, the first of which collected personal informationon the employee, such as the employee’s gender, age, blood-type, academic degree,job-title, smoking habits, work-place inside the library and the number of hours theyspend in the building. The second section deals with the evaluation of the work envi-ronment by collecting information on the ventilation, the lighting, and the quietnessin the building. The third section aims to identify the SBS symptoms suffered by thestaff inside the library building. The fourth section seeks to collect data on the degreeto which the work environment inside the library building is under control in termsof temperature, ventilation, humidity, lighting, and noise. On the other hand, Sect.5 collects various information on the internal environment of the library building,whereas Sect. 6 aims to determine the extent to which the study community is awareof SBS in library buildings, as well as to record their comments and observationsconcerning the main topics covered by the questionnaire. It is worth mentioning thatthis questionnaire was evaluated by three referees. Their observations were takeninto account, and the necessary changes were made.
The total study community consisted of 59 employees, who represent the totalnumber of employees at the SQU Main Library and who received the questionnaire.The total number of questionnaires retrieved was 48, with a loss of 11 question-naires. Thus the number of retrieved questionnaires was the final total number ofthe study community.
12.4 Description of the Old and the New Buildings
of the Main Library
The old library building of the Main Library was constructed together with thebuildings of the Sultan Qaboos University in 1986. It was located amidst the fac-ulty buildings facing the Faculty of Engineering, covering an area of 7,800 m2. Thebuilding consisted of three floors: the ground floor held the technical operations andperiodicals sections. The first floor provided the two main entrances to the Library,and held the lending and references sections. There were also two reading halls,one for ladies and one for men. The second floor held the administrative offices,the office of the director of the library, the office for public services and the OmanRoom. There were also the book-shelves, where the books were logically arrangedon open shelves in accordance with the Library of Congress classification system.In addition there were two large reading halls, one for the ladies and one for themen, as well as two medium-size halls for lectures and meetings.
The new library building was inaugurated in March 2009, and is located amonstthe buildings of the Cultural Premises of the University. It faces the UniversityDome, and is at a distance from the Faculty buildings, unlike the location of the

212 S.A. Abdul-Wahab and N.M.B. Salem
old building, which lay at the heart of the Faculty buildings. It covers an area of17,600 m2, and consists of seven floors:
The Basement: It is an underground floor, holding the technical operationssection (acquisitions, indexing, classification, and library systems).
The Ground Floor: It starts with the library entrance, and holds the lending andreference service sections. In addition, there are two large reading halls, one forthe ladies and one for the men. Immediately behind the lending desk there are theshelves holding the reference sources and academic dissertations. It was observedthat the ceiling above the reference shelves was lower than the Ground Floor ceil-ing. The receptionists and the lending officer share a desk facing the main door tothe library. As a result, the personnel are exposed to the direct sunlight flooding inthrough the huge windows above the main door to the library. This leads to its directreflection into the eyes of the librarians, and sometimes causes blurred vision.
The Mezzanine Floor: It is located between the Ground Floor and the First Floor,and holds the book shelves, which begin with the code (A-JZ).
The First Floor: It holds the shelves which begin with the code (K-QA706).The Second Floor: It holds the shelves which begin with the code (Q706-Z). It is
noticed that the ceiling in the area designated for book shelves is much lower, whichcauses severe headaches for the users of these shelves.
The Third Floor: It holds the shelves with back-issues of foreign-languageperiodicals. To the right there is the office of the library director and his coordi-nator, and the office of the deputy director for public services and her coordinator.Facing these offices is a small waiting-area to receive visitors. To the left of thefloor are the offices of the administrative director and the administrative staff. Nextto them are the offices of the periodicals director and the staff of the periodicalssection. The floor also includes two reading halls, one for the ladies and one for themen. It is observed that artificial lighting on the floor is poor, and there are only fewsmall windows, which do not allow the passage of sufficient natural light.
The Fourth Floor: It holds the Arabic-language periodicals and recent issues offoreign-language periodicals. This floor is not fully equipped. It includes two largereading halls, one for the ladies and one for the men.
It is worth mentioning here that the Oman Room was moved to another building,and is no longer part of the library sections in the new building. There are alsoparking areas on a slope to the rear of the library. The disadvantage of this locationis the absence of drainage systems, which causes pools of rainwater on the lowerwalls of the building (the Basement) in the case of heavy rainfall, which occasionallyoccur in the Sultanate. The accumulation of the water is assisted by the fact that theparking area is on a slope, as mentioned above.
12.5 Results
Table 12.1 shows the personal data and the description of the study community.It illustrates the size of the study community in accordance with the variables of gen-der (male/female), age, blood type, academic qualification, smoking habits, job-title,

12 Is Your Library Building Sick? 213
Table 12.1 Personal data of study community (total number of study community = 48)
Data NumberPercentage(%)
Number of total responses(100%)
Number ofunresponsivecases
GenderMaleFemale
3711
77.122.9
48 100% 0
Age20–3031–4041–5050-
83042
18.268.2
9.14.5
44 100% 4
Blood typeOABAB
241174
52.223.015.2
8.7
46 100% 2
Academic qualificationSecondaryUniversityMAPhD
1020142
21.743.530.4
4.3
46 100% 2
Smoking habitNon-smokerConstantRarely
4411
96.62.22.2
46 100% 2
Occupation employeeHead of DepartmentDeputy DirectorDirector
3783
77.116.7
6.3
48 100% 0
Work place within thelibrary
Director’s officeAdministrationTechnical operationsPeriodicalsLibrary systemsPublic servicesReference hallInterlibrary loan
departmentFiling and archiving
14
1751279
2
2.18.3
35.410.4
2.14.2
14.618.8
4.2
48 100% 0
Study community 48 100%

214 S.A. Abdul-Wahab and N.M.B. Salem
and work-place within the library. The table illustrates the recurrences and the per-centages for the members of the study community in terms of the seven variablesshown in the table.
It becomes clear from Table 12.1 that the percentage of males amounted toaround three quarters of the study community. This is not in agreement with theusual expectation of an increased percentage of females in the field of librarianshipand information sciences (el Areeni 1994). The reason may be that males had agreater chance at receiving an education in comparison to their female peers in theearly phases of education in the Omani society. Table 12.1 shows that the age groupfor most members of the study community was between 31 and 40 years (68.2%).This was followed by the age group between 21 and 30 years (18.2%). This is indica-tive of the fact that the greater majority of the study community is young people,who have a higher resistance to diseases. The data revealed that more than half thestudy community belonged to the blood-type O (52.2%), followed by blood-typeA (23.9%), B (15.2%), and AB (8.7%). The table also indicated that more thanthree quarters of the study community were holders of university degrees (43.5%),MA holders (30.4%), and PhD holders (4.3%) versus a percentage of 21.7% ofhigh-school graduates. This is indicative of a high degree of academic knowledgeamongst the study community, which realizes the required authenticity for the find-ings of the research. It is also clear from the data in the table that the majority ofthe study community were non-smokers (95.6%). Hence it is possible to excludethe health impact of the smoking variable from the findings sought in the currentstudy.
Table 12.1 also illustrates that about a quarter of the study community occupythe post of head of department (16.7%), and deputy head (6.3%), in contrast to77.1% of the personnel working in the different library departments. The dataalso revealed that more than a third of the study community work in the technicaloperations section (35.4%), the second third work in the lending (18.8%) and ref-erences (14.6%) sections, whereas the last third is distributed across the remainingdepartments of the library.
Table 12.2 illustrates the interior environment in both the old and the new librarybuildings, through a description of a set of variables inside the buildings: ventilation,lighting, noise, and smells. These are the usual variables taken into considerationwhen studying the causes of SBS (Wyon 1992; Spengler and Samet 2003). Thedata reported in Table 12.2 indicate the recurrence and the percentage of thesevariables.
The data reported in Table 12.2 also indicate the clear discrepancy in the per-centages of these variables between the old and the new buildings. It is obviousthat the air is more sufficient in the new building (71.1%) in comparison to the oldbuilding (47.8%). The data also indicate that the air in the new building is drier(45.2%) than the air in the old building (34.9). In comparison, the percentage ofhumidity in the new building decreased to 22.2% in comparison to the old building(36.4%), while the percentage of dust in the air of the new building (12.8%) wasless than that in the old building (22.2%). On the other hand, the new building is

12 Is Your Library Building Sick? 215
Table 12.2 Evaluation of the work environment (total number of study community = 48)
The old building The new building
Yes No Total Yes No Total
Variables within the building % % 100% % % 100%
Does the building have sufficientventilation?
2247.8
2452.2
46100%
3271.1
1328.9
45100%
Is the air in the building dry? 1534.9
2865.1
43100%
1945.2
2354.8
42100%
Is the air in the building humid? 1636.4
2863.6
44100%
1022.2
3577.8
45100%
Is the air in the building very hot? 613.3
3986.7
45100%
817.4
3882.6
46100%
Is the air in the building very cold? 1226.7
3373.3
45100%
2453.3
2146.7
45100%
Is the lighting adequate? 3884.4
715.6
45100%
3068.2
1431.8
44100%
Is the place dark? 613.0
4087.0
46100%
1430.4
3269.6
46100%
Is the level of noise in the buildingreasonable?
2657.8
1942.2
45100%
3882.6
817.4
46100%
Does the library have sufficientventilation?
1838.3
2961.7
47100%
3473.9
1226.1
46100%
Are there any undesirable smells? 1431.1
3168.9
45100%
48.7
4291.3
46100%
Is the air in the building dusty? 1022.2
3577.8
45100%
612.8
4187.2
47100%
very cold (53.3%) in comparison with the old building (26.7%). Hence it is pos-sible to conclude that there is a slight improvement in the interior environment ofthe new building as compared with the old building in terms of sufficient ventilation,humidity, and dust percentage. In this context, the researchers refer to previous stud-ies that discussed the symptoms of SBS in library buildings and their relationshipto the changes in environmental variables inside the building, such as temperature(Wyon 1992; Reinikainen and Jaakkola 2001), relative humidity (Reinikainen et al.1991; Reinikainen and Jaakkola 2001), and ventilation (Godish and Spengler 1996;Wargocki et al. 2002).
On the contrary, it was observed that the percentage of lighting in the new build-ing (68.2%) was less than that in the old building (84.4%). This may be due to thelesser area of windows allowing natural light in on most floors of the new build-ing, in particular the basement and the upper floors, in addition to the poor artificiallighting in most parts of the building. The findings showed that the new buildingwas calmer than the old one, where the percentage of quietness in the new buildingwas 73.9% while it was only 38.3% in the old building. On the other hand, the dataillustrated the high percentage of undesirable smells in the old building (31.1%) incomparison to the new building (8.7%).

216 S.A. Abdul-Wahab and N.M.B. Salem
Table 12.3 Pathological symptoms in the building (total number of study community = 48)
The old building The new building
Serial Symptoms Number % Number %
1. Dry throat 13 27.1 15 31.32. Headache 16 33.3 9 18.83. General weakness accompanied by
Dizziness12 25.0 6 12.5
4. Fainting 3 6.3 0 0.05. Insomnia or difficulty in sleeping 5 10.4 4 8.36. Nose congestion 13 27.1 17 35.47. Problems with sinuses 17 35.4 11 22.98. Dryness of the nose 5 10.4 3 6.39. Irritation of the eyes 16 33.3 10 20.8
10. Dryness of the eyes 7 14.6 5 10.411. Difficulty breathing 4 8.3 7 14.612. Chronic cough 4 8.3 3 6.313. Bronchitis 6 12.5 6 12.514. Laryngitis 6 12.5 9 18.815. Blurred vision 9 18.8 7 14.616. Skin diseases (Eczema, rash, itching) 7 14.6 3 6.317. Fatigue and lethargy 12 25.0 8 16.718. Easily tired and worn-out 15 31.3 9 18.819. Difficulty in concentration 9 18.8 6 12.520. Nausea and vertigo 2 4.2 5 10.421. Drowsiness 9 18.8 8 16.722. Mood swings 11 22.9 11 22.923. Other symptoms (specify) 2 4.2 1 2.1
Table 12.3 indicates the most prominent SBS symptoms suffered by the librarypersonnel in both the old and the new buildings. It can be seen that some symp-toms may vary, while others are constant symptoms particular to each building.The findings showed that the most prominent symptoms of SBS in the old buildingare: sinusitis (35.4%), eye inflammation (33.3%), headache (33.3%), rapid feelingsof exhaustion and fatigue (31.3%), throat dryness (27.1%), weariness and lazi-ness (25.0%), and general weakness and dizziness (25.0%). The most prominentsymptoms of SBS in the new building are: nasal congestion (35.4%), throat dry-ness (31.3%), sinusitis (22.9%), eye inflammation (20.8%), mood swings (22.9%),laryngitis (18.8%), and headache (18.8%). These findings are indicative of the factthat the study community members suffer from some pathological symptoms in thenew building despite its newness.
In the same context, Table 12.3 illustrates the extent to which SBS symptoms inlibrary buildings have been reduced after the transfer of the library personnel fromthe old to the new building. Comparing the data in Table 12.3, it becomes clear thatthese symptoms did not vanish in the new building nor were they even reduced innumber. The difference was only a variation in their percentage. There is no doubtthat there was a decrease in the percentage of some of the pathological symptoms

12 Is Your Library Building Sick? 217
particular to the old building when the personnel were moved to the new building,such as headaches which reduced from 33.3 to 18.8%, sinusitis from 35.4 to 22.9%,and eye inflammation from 33.3 to 20.8%.
However, this did not prevent the increase in the percentages of pathologicalsymptoms particular to the new building, in comparison to the old building, such asnasal congestion from 27.1 to 35.4%, throat dryness from 27.1 to 31.3%, laryngitisfrom 12.5 to 18.8%, and breathing difficulties from 8.3 to 14.6%. This comes inagreement with what Righi et al. (2002) reported in their study, which stated that themost important symptoms suffered by the library users were dryness of the throat,eye inflammation and breathing difficulties.
Table 12.4 is an extension of Table 12.3 which ascertain the extent to which theold and the new buildings suffer from SBS, by attaining evidence that proves thatthe symptoms suffered by the personnel in Table 12.3 are merely symptoms cor-related with their presence inside the building, and that these symptoms decreaseor disappear when they leave the building. The results of Table 12.4 indicate thatthe SBS symptoms are experienced by the library personnel only inside the build-ing at a percentage of 62.5% in the old building, and 44.8% in the new building.Accordingly it is possible to claim that both the old and the new library buildingssuffer from SBS. This is supported by the employees who pointed out that they didnot experience these symptoms once they left the old building (69.6%) and the newbuilding (80.8%). It is also supported by the fact that they do not experience thesesymptoms on their holidays (79.2%) in the old building and at a higher percentage(92.3%) in the new building.
Table 12.4 Further questions about the symptoms (total number of study community = 48)
The old building The new building
Yes No Total Yes No Total
The questions % % 100% % % 100%
Do you only suffer from thesesymptoms inside the building?
2062.5
1237.5
32100%
1344.8
1655.2
29100%
Do you suffer from these symptomsin a particular area of the building?
945.0
1155.0
20100%
830.8
1869.2
26100%
Do these symptoms affect your workcapacity and cause an increasein your absenteeism?
1040.0
1560.0
25100%
1244.4
1555.6
27100%
Do you suffer from these symptomsafter you have left the building?
730.4
1669.6
23100%
319.2
2180.8
26100%
Do you suffer from these symptomson your days-off?
520.8
1979.2
24100%
27.7
2492.3
26100%
Do the symptoms abate if the windowsof the building are open?
1466.7
733.3
24100%
1565.2
834.8
23100%
Do the symptoms abate if plantsare put in the workplace?
838.1
1361.9
21100%
1040.0
1560.0
25100%

218 S.A. Abdul-Wahab and N.M.B. Salem
Table 12.4 also provides the extent to which SBS in library buildings impactthe decrease in work-efficiency and the increase in absentism. The data in the tableshow that these symptoms influence the work efficiency of 40.0% of the study com-munity in the old building, and leads to an increase of absentism. The percentageis very similar to that of the new building (44.4%). Hence the impact of SBS onthe performance of the staff in the library, whether in the old or the new building,is illustrated. This result is in agreement with the findings of previous studies (Raw1994; Seppanen 1999; Fisk 2000; Balanli et al. 2007). Table 12.4 also highlightsthat the suffering of the personnel from these symptoms decreases when windowsare opened in both the old and the new buildings. The table indicates a percent-age of 66.7% of the study community in the old building and 65.2% in the newbuilding. These figures are rather high and close in both buildings, emphasizing theimportance of ventilation and its positive impact on the improvement of the interiorenvironment of the library building. This was reiterated in previous studies (Morrisand Dennison 1995; Wargocki et al. 2002). It is important to remember that if openwindows are essential for ventilation, the open windows should be covered withscreens to prevent insects and dust. These screens should also be removable, soas to be washed regularly. The symptoms also decrease when plants are placed inthe work area. The percentage of personnel in agreement reached 38.1% in the oldbuilding and 40.0% in the new building. These are some of the measures recom-mended by previous studies, in particular using certain plants such as daisies andtaro plants. These plants absorb the gases emitted by the furniture, the paint and themould (Niemelä et al. 2006).
Table 12.5 illustrates the possibility of controlling the interior climate of both theold and the new buildings. The data in the table indicate the decrease in the pos-sibility of controlling the temperature in the new building (34.5%) in comparisonto the old building (87.5). This explains the complaints put forth by the employees
Table 12.5 The degree of control over the work environment (total number of studycommunity = 48)
The old building The new building
Yes No Total Yes No Total
Variables within the building % % 100% % % 100%
Can the degree of heat in the building becontrolled?
4087.0
613.0
46100%
1634.0
3166.0
47100%
Can the ventilation in the building becontrolled?
2554.3
2145.7
46100%
1736.2
3063.8
47100%
Can the humidity in the building becontrolled?
1532.6
3167.4
46100%
1124.4
3475.6
45100%
Can the lighting in the building becontrolled?
3475.6
1124.4
45100%
2554.3
2145.7
46100%
Can the level of noise in the building becontrolled?
1839.1
2860.9
46100%
2453.3
2146.7
45100%

12 Is Your Library Building Sick? 219
in the new building concerning the excessive coldness they suffer from, as shownin Table 12.2. Ideally speaking, the temperature should be controllable to rangebetween 20 and 21C. This temperature range is indicated as being bearable byboth the library staff and users, and being adequate for most library holdings (Niso2001). It is important to take into account that it is sometimes difficult to attain thistemperature range in the Sultanate of Oman, in particular in the Capital, Muscat,due to the high humidity. This is applicable to the decrease in the possibility of con-trolling the temperature in the new building and the possibility of controlling theventilation. The percentage of controlling ventilation in the new building is 36.2%while it is 54.3% in the old building. This is due to the fixed windows in the newbuilding, designed to be kept closed. The percentage of controlling humidity in thenew building is 24.4% in comparison to 32.6% in the old building. It is worth men-tioning that some employees pointed to the high rate of humidity in the corners ofsome of the rooms in the new building.
In terms of the possibility to control lighting, Table 12.5 shows that it decreases inthe new building (54.3%) in comparison to the old building (75.6%), in accordancewith Table 12.2. The table illustrates that the percentage of controlling the degreeof noise in the new building (53.3%) is higher than that in the old building (39.1%).This explains the results of Table 12.2 stating that the new building is quieter thanthe old building.
Table 12.6 disusses further relevant aspects that should be examined when study-ing the interior environment of buildings (Bass et al. 2003; Norbäck and Nordström2008). The results reported by Table 12.6 can be summarized in the followingpoints:
• Higher condensation of humidity on the walls and windows of the old build-ing (34.8%) in comparison to the new building (14.9%). The condensation ofhumidity on the walls and windows can be reduced by lowering the humidityrate inside the library building. For this purpose the recommended rate of humid-ity falls between 30 and 50% (Niso 2001). Also, reduced regular ventilation at37.0% was observed in the old building, a percentage very close to that of the newbuilding (34.1%). Higher mildew and mould were observed in the old building(34.8%) than in the new building (20.5%). A high percentage of the study com-munity indicated that windows and doors were not opened in the new building(85.1%) and the old building (70.2%). A higher percentage of the study commu-nity reported that the old building (93.3%) and the new building (91.5%) did notcontain a separate ventilation system particular for the photocopying machines.This is predicted to contribute to a heightened concentration of emissions fromthese machines, which is not ameliorated directly and rapidly. It is also worthindicating that mildew mainly form as a result of high humidity and the lack offresh air flow in the area. Mildew forms on humid surfaces, including materialssuch as paper and book-covers, causing their damage. The cleanliness of storageareas and keeping the materials in good condition is of great importance, sincedust and dirt damage the materials and provide a rich environment for mildewformation (Niso 2001).

220 S.A. Abdul-Wahab and N.M.B. Salem
Table 12.6 Diverse questions (total number of study community = 48)
The old building The new building
Yes No Total Yes No Total
The Questions % % 100% % % 100%
Are there any indication in thebuilding such as condensation ofhumidity on the walls and windows?
1634.8
3065.2
46100%
714.9
4085.1
47100%
Are there smart curtains that self-lockin the case of a fire breaking out toprevent it from spreadingthroughout the building?
510.6
4389.4
47100%
36.8
4193.2
44100%
Is there systematic ventilation? 1737.0
2963.0
46100%
1534.1
2965.9
44100%
Are the windows and doors opened toimprove the flow of air?
1429.8
3370.2
47100%
714.9
4085.1
47100%
Does the building have a separate,ventilation system designated forphotocopying areas?
36.7
4293.3
45100%
48.5
4391.5
47100%
Is the building designed to allownatural light in?
2659.1
1840.9
44100%
3068.2
1431.8
44100%
Is the building designed to allow sunrays in?
3269.6
1430.4
46100%
3271.1
1328.9
45100%
Is the furniture arranged so as to allownatural light in?
2860.9
1839.1
46100%
3583.3
716.7
42100%
Are the ventilation filters that holdback particles regularly cleaned?
2666.7
1333.3
39100%
2666.7
1333.3
39100%
Are the furniture and shelves of thelibrary dusted?
3576.1
1123.9
46100%
3168.9
1431.1
45100%
Have you noticed mildew and mouldin the library?
1634.8
3065.2
46100%
920.5
3579.5
44100%
Are the air conditioners cleaned,maintained and dusted?
3983.0
817.0
47100%
2565.8
1334.2
38100%
Is the carpet in your office cleaned? 3583.3
716.7
42100%
2565.8
1334.2
38100%
Are chemical detergents used by thelibrary?
4090.9
49.1
44100%
3482.9
717.1
41100%
Are pesticides (for insects, ants, rats)used by the library?
2670.3
1129.7
37100%
1963.3
1136.7
30100%
Is the building regularly sprayed? 2360.5
1539.5
38100%
1446.7
1653.3
30100%
Is the area ventilated after sprayingor the use of pesticides?
1846.2
2153.8
39100%
1450.0
1450.0
28100%
Do you suffer from particularsymptoms directly after the placehas been sprayed?
936
1664.0
25100%
522.7
1777.3
22100%

12 Is Your Library Building Sick? 221
• The design of the new building allows a greater percentage of natural lighting(68.2%) than the old building (59.1%). It also allows for more sunlight (71.1%)than the old building (69.6%). It was also observed that the furniture distribu-tion in the new building allows a higher percentage of natural light penetration(83.3%) than the old building (60.9%). However, the researcher observed on theirvisit to the new library building the strong natural lighting and the penetrating sunentering through the large window panes to the front of the building on the groundfloor. On the other hand, the strength of natural lighting decreases on the upperfloors of the building due to the smaller size of the windows, which prevents suf-ficient natural light from entering. It was also observed that the area designatedfor book-shelves in the new building has a low ceiling, and the spaces betweenthe shelves are very narrow, which does not allow for sufficient natural lighting topenetrate. Matters were made worse due to limited artificial lighting. Moreover,the shelves-users soon suffer from headaches due to the bad ventilation.
• An increase in the cleaning and maintenance of air-conditioners, significantlyremoving dust from them in the old building (83.0%), higher than in the newbuilding (65.8%). Previous studies have indicated the existence of a close cor-relation between SBS in library buildings and the lack of maintenance of airconditioning systems in these buildings, as well as neglecting the regular cleaningof carpets (Wargocki et al. 2002).
• A higher percentage of use of detergents in the cleaning of the new building(90.9%) in comparison to the old building (82.9%). The data also indicated thatthe old building was regularly sprayed (60.5%), at a rate higher than in the newbuilding (46.7%). These data showed that the percentage of ventilation of thearea after spraying is relatively higher in the new building (50.0%) than in theold building (46.2%). The symptoms that the employees experienced after thespraying were relatively few reaching 36.0% in the old building and 22.7% in thenew building.Table 12.7 shows the pathological symptoms in both the old and the new build-ings in terms of gender (male/female). Reading the data and percentages in theTable, the following indicators were concluded:
• Males complained of 22 pathological symptoms or signs in the new building andof all pathological symptoms (23 symptoms) in the old building. The number ofthese symptoms decreased with the females to 18 symptoms in the old buildingand 19 symptoms in the new building, i.e. the increase of only one symptom inthe new building.
• Comparing the symptoms affecting the males and the females, it was observedthat there is a great similarity in the most prominent of pathological symptomsaffecting either gender whether in the old or the new building. These symptomsincluded: sinusitis, eye inflammation, headache, rapid fatigue and exhaustion, anddryness of the throat.
• There are pathological symptoms in the old building affecting males at a higherrate than females, namely: dryness of the eyes, blurred vision, fatigue and lazi-ness. However, it was observed that in the new building the rate of femalescomplaining of the self-same symptoms was higher than that of the males. Other

222 S.A. Abdul-Wahab and N.M.B. Salem
Table 12.7 Pathological symptoms in the building according to gender (total number of studycommunity = 48)
The old building The new building
Male Female Total Male Female Total
Serial Symptoms % % 100% % % 100%
1. Dryness of the throat 1076.9
323.1
13100%
1066.7
533.3
15100%
2. Headache 1275.0
425.0
16100%
666.7
333.3
9100%
3. General weaknessaccompanied by dizziness
975.0
325.0
12100%
583.3
116.7
6100%
4. Fainting 3100.0
00.0
3100%
00.0
00.0
0100%
5. Insomnia or difficulty insleeping
480.0
120.0
5100%
250.0
250.0
4100%
6. Nose congestion 1076.9
323.1
13100%
1588.2
211.8
17100%
7. Problems with sinuses 1376.5
423.5
17100%
872.7
327.3
11100%
8. Dryness of the nose 5100.0
00.0
5100%
266.7
133.3
3100%
9. Irritation of the eyes 1275.0
425.0
16100%
770.0
330.0
10100%
10. Dryness of the eyes 685.7
114.3
7100%
360.0
240.0
5100%
11. Difficulty breathing 375.0
125.0
4100%
685.7
114.3
7100%
12. Chronic cough 4100.0
00.0
4100%
3100.0
00.0
3100%
13. Bronchitis 583.3
116.7
6100%
583.3
116.7
6100%
14. Laryngitis 583.3
116.7
6100%
777.8
222.2
9100%
15. Blurred vision 888.9
111.1
9100%
342.9
457.1
7100%
16. Skin diseases (Eczema,rash, itching)
571.4
228.6
7100%
266.7
133.3
3100%
17. Fatigue and exhaustion 1191.7
18.3
12100%
562.5
337.5
8100%
18. Easily tired and worn-out 1173.3
426.7
15100%
666.7
333.3
9100%
19. Difficulty in concentration 9100.0
00.0
9100%
466.7
233.3
6100%
20. Nausea and dizziness 150.0
150.0
2100%
5100.0
00.0
5100%
21. Drowsiness 666.7
333.3
9100%
562.5
337.5
8100%8
22. Mood swings 872.7
327.3
11100%
654.5
545.5
11100%
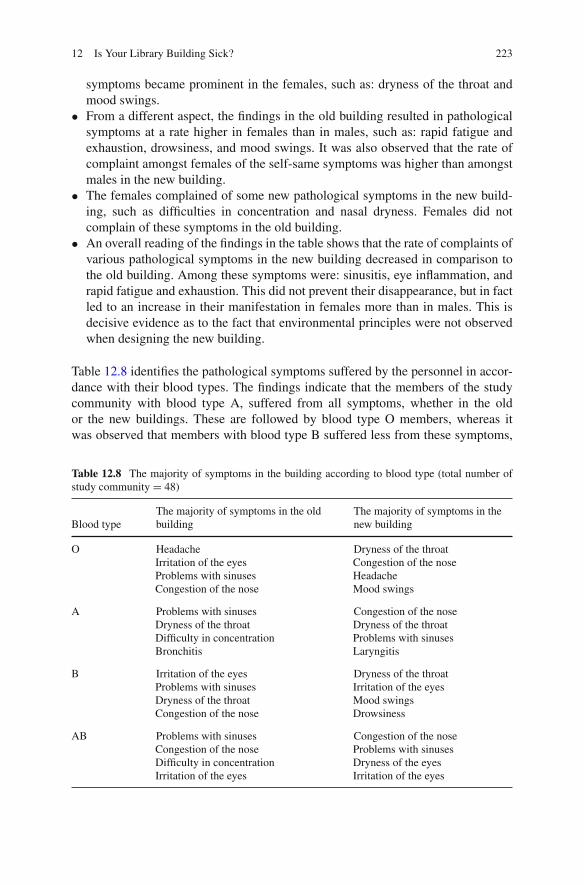
12 Is Your Library Building Sick? 223
symptoms became prominent in the females, such as: dryness of the throat andmood swings.
• From a different aspect, the findings in the old building resulted in pathologicalsymptoms at a rate higher in females than in males, such as: rapid fatigue andexhaustion, drowsiness, and mood swings. It was also observed that the rate ofcomplaint amongst females of the self-same symptoms was higher than amongstmales in the new building.
• The females complained of some new pathological symptoms in the new build-ing, such as difficulties in concentration and nasal dryness. Females did notcomplain of these symptoms in the old building.
• An overall reading of the findings in the table shows that the rate of complaints ofvarious pathological symptoms in the new building decreased in comparison tothe old building. Among these symptoms were: sinusitis, eye inflammation, andrapid fatigue and exhaustion. This did not prevent their disappearance, but in factled to an increase in their manifestation in females more than in males. This isdecisive evidence as to the fact that environmental principles were not observedwhen designing the new building.
Table 12.8 identifies the pathological symptoms suffered by the personnel in accor-dance with their blood types. The findings indicate that the members of the studycommunity with blood type A, suffered from all symptoms, whether in the oldor the new buildings. These are followed by blood type O members, whereas itwas observed that members with blood type B suffered less from these symptoms,
Table 12.8 The majority of symptoms in the building according to blood type (total number ofstudy community = 48)
Blood typeThe majority of symptoms in the oldbuilding
The majority of symptoms in thenew building
O HeadacheIrritation of the eyesProblems with sinusesCongestion of the nose
Dryness of the throatCongestion of the noseHeadacheMood swings
A Problems with sinusesDryness of the throatDifficulty in concentrationBronchitis
Congestion of the noseDryness of the throatProblems with sinusesLaryngitis
B Irritation of the eyesProblems with sinusesDryness of the throatCongestion of the nose
Dryness of the throatIrritation of the eyesMood swingsDrowsiness
AB Problems with sinusesCongestion of the noseDifficulty in concentrationIrritation of the eyes
Congestion of the noseProblems with sinusesDryness of the eyesIrritation of the eyes
224 S.A. Abdul-Wahab and N.M.B. Salem
whether in the old or the new buildings. Table 12.8 illustrates the four most impor-tant pathological symptoms suffered by each blood group. In the light of the givensreported in this table, we conclude the following indicators:
• The complaints of all four blood-type carriers were in agreement in terms ofthe common symptoms suffered in the old building, such as sinusitis, followedby nasal congestion and eye inflammation. At the same time, other symptomsbecome prominent in the new building, such as throat dryness, suffered by bloodtypes O, A, and B, and nasal congestion suffered by blood types AB, A and O.
• Comparing the pathological symptoms of each blood type, the difference in themost prominent symptoms of each blood type is observed in both the old andnew building. In the old building, headache comes at the top of the symptomsparticular to blood type O, whereas sinusitis is the most prominent pathologicalsymptom particular to blood type A and AB, and eye inflammation particular toblood type B.
• In the new building other pathological symptoms particular to each blood typeappeared. Throat dryness is considered one of the most prominent pathologicalsymptoms of the blood types O and B, whereas nasal congestion is particular tothe blood types AB and A.
• It was observed that there were some pathological symptoms suffered by thepersonnel whether in the old or the new building. It was observed that these symp-toms were closely related to the blood type of the carrier. For example, headacheand nasal congestion were complaints of blood-type O carriers. Sinusitis anddryness of the throat were complaints of blood-type AB and A carriers. Blood-type B carriers complained of dryness of the throat and the increase in anotherpathological symptom, namely eye inflammation.
Tables 12.9 and 12.10 identify the most prominent pathological symptoms inaccordance to the workplace in both the old and the new buildings, and whetherthere was a decrease in these symptoms after the transfer to the new building.By reading and comparing the givens in the Tables 12.9 and 12.10, the followingbecomes obvious:
• There are departments in the library where the personnel do not complain of anypathological symptoms, whether in the old or the new buildings. These depart-ments are: the director’s office, the administration and the library systems. Thisis due to the vast spaces enjoyed by these departments and the constant care fortheir cleanliness and ventilation. This is in agreement with the findings of previ-ous studies (Eriksson and Stenberg 2006). It was also observed that there wereno complaints of any symptoms suffered by the employees of the Public ServicesSection in the new building. It is worth mentioning that the workers in thesedepartments occupy the posts of deputy managers and heads of departments.
• There are departments in the old building where the complaints of the person-nel of most symptoms increase. Foremost is the lending section (20 pathological

12 Is Your Library Building Sick? 225T
ab
le12.9
Pat
holo
gica
lsy
mpt
oms
inth
eol
dbu
ildi
ngac
cord
ing
toth
ew
orkp
lace
(tot
alnu
mbe
rof
stud
yco
mm
unit
y=
48)
Sym
ptom
sD
irec
tor’
sof
fice
Adm
inis
trat
ion
Tec
hnic
alop
erat
ions
Per
iodi
cals
Lib
rary
syst
ems
Pub
lic
serv
ices
Ref
eren
ceha
llIn
terl
ibra
rylo
ande
p.F
ilin
gan
dar
chiv
ing
Tot
al
Dry
ness
ofth
eth
roat
6 (46.
2)3 (2
3.1)
4 (30.
8)13 (1
00%
)H
eada
che
5 (31.
3)1 (6
.3)
3 (18.
8)5 (3
1.3)
2 (12.
5)16 (1
00%
)G
ener
alw
eakn
ess
acco
mpa
nied
bydi
zzin
ess
4 (33.
3)1 (8
.3)
1 (8.3
)3 (2
5)3 (2
5)12 (1
00%
)
Fai
ntin
g1 (3
3.3)
2 (66.
7)3 (1
00%
)In
som
nia
ordi
fficu
lty
insl
eepi
ng1 (2
0.0)
1 (20.
0)1 (2
0.0)
2 (40.
0)5 (1
00%
)N
ose
cong
esti
on7 (5
3.8)
2 (15.
4)1 (7
.7)
1 (7.7
)2 (1
5.4)
13 (100
%)
Pro
blem
sw
ith
sinu
ses
9 (52.
9)1 (5
.9)
1 (5.9
)3 (1
7.6)
3 (17.
6)17 (1
00%
)D
ryne
ssof
the
nose
1 (20.
0)1 (2
0.0)
3 (60.
0)5 (1
00%
)Ir
rita
tion
ofth
eey
es8 (5
0.0)
1 (6.3
)1 (6
.3)
2 (12.
5)4 (2
5.0)
16 (100
%)
Dry
ness
ofth
eey
es3 (4
2.9)
1 (14.
3)1 (1
4.3)
1 (14.
3)1 (1
4.3)
7 (100
%)
Dif
ficu
lty
brea
thin
g3 (7
5.0)
1 (25.
0)4 (1
00%
)C
hron
icco
ugh
1 (25.
0)1 (2
5.0)
1 (25.
0)1 (2
5.0)
4 (100
%)
Bro
nchi
tis
4 (66.
7)2 (3
3.3)
6 (100
%)
Lar
yngi
tis
4 (66.
7)1 (1
6.7)
1 (16.
7)6 (1
00%
)B
lurr
edvi
sion
2 (22.
2)3 (3
3.3)
4 (44.
4)9 (1
00%
)

226 S.A. Abdul-Wahab and N.M.B. Salem
Tab
le12.1
0P
atho
logi
cal
sym
ptom
sin
the
new
buil
ding
acco
rdin
gto
the
wor
kpla
ce(t
otal
num
ber
ofst
udy
com
mun
ity
=48
)
Sym
ptom
sD
irec
tor’
sof
fice
Adm
inis
trat
ion
Tec
hnic
alop
erat
ions
Per
iodi
cals
Lib
rary
syst
ems
Pub
lic
serv
ices
Ref
eren
ceha
llIn
terl
ibra
rylo
ande
p.F
ilin
gan
dar
chiv
ing
Tot
al
Dry
ness
ofth
eth
roat
9 (60.
0)1 (6
.7)
4 (26.
7)1 (6
.7)
15 (100
%)
Hea
dach
e3 (3
3.3)
1 (11.
1)5 (5
5.6)
9 (100
%)
Gen
eral
wea
knes
sac
com
pani
edby
dizz
ines
s
2 (33.
3)1 (1
6.7)
3 (50.
0)6 (1
00%
)
Fai
ntin
gIn
som
nia
ordi
fficu
lty
insl
eepi
ng2 (5
0.0)
2 (50.
0)4 (1
00%
)N
ose
cong
esti
on6 (3
5.3)
1 (5.9
)2 (1
1.8)
6 (35.
3)2 (1
1.8)
17 (100
%)
Pro
blem
sw
ith
sinu
ses
6 (54.
5)1 (9
.1)
2 (18.
2)2 (1
8.2)
11 (100
%)
Dry
ness
ofth
eno
se1 (3
3.3)
1 (33.
3)1 (3
3.3)
3 (100
%)
Irri
tati
onof
the
eyes
5 (50.
0)1 (1
0.0)
3 (30.
0)1 (1
0.0)
10 (100
%)
Dry
ness
ofth
eey
es2 (4
0.0)
1 (20.
0)2 (4
0.0)
5 (100
%)
Dif
ficu
lty
brea
thin
g2 (2
8.6)
1 (14.
3)2 (2
8.6)
2 (28.
6)7 (1
00%
)C
hron
icco
ugh
1 (33.
3)1 (3
3.3)
1 (33.
3)3 (1
00%
)B
ronc
hiti
s3 (5
0.0)
1 (16.
7)1 (1
6.7)
1 (16.
7)6 (1
00%
)

12 Is Your Library Building Sick? 227
Tab
le12.1
0(c
onti
nued
)
Sym
ptom
sD
irec
tor’
sof
fice
Adm
inis
trat
ion
Tec
hnic
alop
erat
ions
Per
iodi
cals
Lib
rary
syst
ems
Pub
lic
serv
ices
Ref
eren
ceha
llIn
terl
ibra
rylo
ande
p.F
ilin
gan
dar
chiv
ing
Tot
al
Lar
yngi
tis
2 (22.
2)1 (1
1.1)
2 (22.
2)3 (3
3.3)
1 (11.
1)9 (1
00%
)B
lurr
edvi
sion
5 (71.
4)1 (1
4.3)
1 (14.
3)7 (1
00%
)S
kin
dise
ases
(Ecz
ema,
rash
,itc
hing
)1 (3
3.3)
1 (33.
3)1 (3
3.3)
3 (100
%)
Fat
igue
and
leth
argy
3 (37.
5)1 (1
2.5)
1 (12.
5)3 (3
7.5)
8 (100
%)
Eas
ily
tire
dan
dw
orn-
out
4 (44.
4)1 (1
1.1)
3 (33.
3)1 (1
1.1)
9 (100
%)
Dif
ficu
lty
inco
ncen
trat
ion
1 (16.
7)1 (1
6.7)
4 (66.
7)6 (1
00%
)N
ause
aan
dve
rtig
o1 (2
0.0)
1 (20.
0)3 (6
0.0)
5 (100
%)
Dro
wsi
ness
4 (50.
0)4 (5
0.0)
8 (100
%)
Moo
dsw
ings
5 (45.
5)1 (9
.1)
1 (9.1
)3 (2
7.3)
1 (9.1
)11 (1
00%
)O
ther
sym
ptom
s(s
peci
fy)
1 (100
.0)
1 (100
%)

228 S.A. Abdul-Wahab and N.M.B. Salem
symptoms), followed by the technical operations (19 symptoms), then the ref-erences section (16 symptoms), and finally the journals section (13 symptoms).On the other hand, the number of symptoms suffered by the personnel of thePublic Services Department (8 symptoms), the Filing and Archiving Department(6 symptoms) would decrease. In comparison with the new building, it becomesobvious that the number of these symptoms did not decrease except by mini-mal rates. The number of symptoms decreased to 18 symptoms in the TechnicalOperations Department, to 15 symptoms in the References Department, whereastheir number increased in the Journals Department to 14 symptoms, and8 symptoms in the Filing and Archiving Department.
• There are other prominent symptoms in each library department in the old build-ing, the percentages of which changed in the new building. In the TechnicalOperations Department in the old building, for instance, there were symptomssuch as bronchitis, breathing difficulties, laryngitis, and nasal congestion, as themost prominent pathological symptoms. In comparison, in the new building adecrease in the percentage of these symptoms was observed, and an increase inthe percentage of other symptoms such as sinusitis, dryness of the throat, andblurred vision. It is worth indicating here the poor location of the TechnicalOperations Department on the ground floor of the old building, which becameworse when this department was moved to the basement in the new building. Thisfloor is characterized by a low ceiling, the limited area of windows, and the lowpercentage of ventilation and natural light. It was observed that the complaintsof the workers in the Lending Department increased in regard to nasal dryness,blurred vision and difficulties in concentration. Conditions did not improve withthe move to the new building. Despite the low percentage of some symptoms suchas nasal dryness, and the absence of complaints of some other symptoms such asbronchitis, and blurred vision. However, there are other symptoms complaintsof which increased, such as headaches, eye dryness, and skin diseases. On theother hand, symptoms of skin diseases, blurred vision, and mood swings as majorpathological symptoms appeared in the References Section. Percentages of thesesymptoms in the new building are less, yet other symptoms such as nasal dryness,chronic coughing, and breathing difficulties appear, whereas complaints of someother symptoms disappeared, such as dryness of the throat and bronchitis. This isdue to the change of the place of the Journals Section in the new building, whereit now occupied the third floor, having previously held the ground floor in the oldbuilding. It was also observed that the workers in the Public Services Departmentdid not complain of any pathological symptoms after their move to the new build-ing. This may be due to the change in their work place in the new building wherethey are now on the third floor, next to the director’s office. They had previouslybeen in the basement (the underground floor) in the old building. The TechnicalOperations Department saw the highest percentage of complaints of the majorityof pathological symptoms, whether in the old or the new buildings.
Tables 12.11 and 12.12 identify the extent of differences between the interiorwork environments in each library department. The two Tables describe the interior

12 Is Your Library Building Sick? 229
Tab
le12.1
1E
valu
atio
nof
the
wor
ken
viro
nmen
tin
the
old
buil
ding
acco
rdin
gto
the
wor
kpla
ce(t
otal
num
ber
ofst
udy
com
mun
ity
=48
)
Var
iabl
esw
ithi
nth
ew
orkp
lace
Dir
ecto
r’s
offi
ceA
dmin
istr
atio
nT
echn
ical
oper
atio
nsP
erio
dica
lsL
ibra
rysy
stem
sP
ubli
cse
rvic
esR
efer
ence
hall
Inte
rlib
rary
loan
dept
.F
ilin
gan
dar
chiv
ing
Tot
al
Doe
sth
ebu
ildi
ngha
vesu
ffici
ent
vent
ilat
ion?
1 (4.5
)10 (4
5.5)
3 (13.
6)1 (4
.5)
2 (9.1
)4 (1
8.2)
1 (4.5
)22 (1
00%
)Is
the
air
inth
ebu
ildi
ngdr
y?1 (6
.7)
5 (33.
3)2 (1
3.3)
2 (13.
3)5 (3
3.3)
15 (100
%)
Isth
eai
rin
the
buil
ding
hum
id?
1 (6.3
)2 (1
2.5)
4 (25.
0)3 (1
8.8)
1 (6.3
)4 (2
5.0)
1 (6.3
)16 (1
00%
)Is
the
air
inth
ebu
ildi
ngve
ryho
t?1 (1
6.7)
1 (16.
7)1 (1
6.7)
2 (33.
3)1 (1
6.7)
6 (100
%)
Isth
eai
rin
the
buil
ding
very
cold
?1 (8
.3)
8 (66.
7)1 (8
.3)
2 (16.
7)12 (1
00%
)Is
the
ligh
ting
adeq
uate
?1 (2
.6)
3 (7.9
)16 (4
2.1)
4 (10.
5)1 (2
.6)
1 (2.6
)5 (1
3.2)
7 (18.
4)38 (1
00%
)Is
the
plac
eda
rk?
2 (33.
3)1 (1
6.7)
1 (16.
7)2 (3
3.3)
6 (100
%)
Isth
ele
vel
ofno
ise
inth
ebu
ildi
ngre
ason
able
?
1 (3.8
)2 (7
.7)
12 (46.
2)4 (1
5.4)
1 (3.8
)2 (7
.7)
2 (7.7
)2 (7
.7)
26 (100
%)
Doe
sth
eli
brar
yha
vesu
ffici
ent
vent
ilat
ion?
1 (5.6
)9 (5
0.0)
1 (5.6
)1 (5
.6)
2 (11.
1)2 (1
1.1)
2 (11.
1)18 (1
00%
)A
reth
ere
any
unde
sira
ble
smel
ls?
2 (14.
3)4 (2
8.6)
1 (7.1
)2 (1
4.3)
2 (14.
3)2 (1
4.3)
1 (7.1
)14 (1
00%
)Is
the
air
inth
ebu
ildi
ngdu
sty?
4 (40.
0)2 (2
0.0)
1 (10.
0)2 (2
0.0)
1 (10.
0)10 (1
00%
)

230 S.A. Abdul-Wahab and N.M.B. Salem
Tab
le12.1
2E
valu
atio
nof
the
wor
ken
viro
nmen
tin
the
new
buil
ding
acco
rdin
gto
the
wor
kpla
ce(t
otal
num
ber
ofst
udy
com
mun
ity
=48
)
Var
iabl
esw
ithi
nth
ew
orkp
lace
Dir
ecto
r’s
offi
ceA
dmin
istr
atio
nT
echn
ical
oper
atio
nsP
erio
dica
lsL
ibra
rysy
stem
sP
ubli
cse
rvic
esR
efer
ence
hall
Inte
rlib
rary
loan
dep.
Fil
ing
and
arch
ivin
gT
otal
Doe
sth
ebu
ildi
ngha
vesu
ffici
ent
vent
ilat
ion?
1 (3.1
)4 (1
2.5)
6 (18.
8)5 (1
5.6)
1 (3.1
)2 (6
.3)
6 (18.
8)6 (1
8.8)
1 (3.1
)32 (1
00%
)Is
the
air
inth
ebu
ildi
ngdr
y?2 (1
0.5)
6 (31.
6)2 (1
0.5)
1 (5.3
)3 (1
5.8)
5 (26.
3)19 (1
00%
)Is
the
air
inth
ebu
ildi
nghu
mid
?1 (1
0.0)
2 (20.
0)2 (2
0.0)
1 (10.
0)3 (3
0.0)
1 (10.
0)10 (1
00%
)Is
the
air
inth
ebu
ildi
ngve
ryho
t?7 (8
7.5)
1 (12.
5)8 (1
00%
)Is
the
air
inth
ebu
ildi
ngve
ryco
ld?
1 (4.2
)7 (2
9.2)
2 (8.3
)7 (2
9.2)
5 (20.
8)2 (8
.3)
24 (100
%)
Isth
eli
ghti
ngad
equa
te?
1 (3.3
)3 (1
0.0)
7 (23.
3)5 (1
6.7)
1 (3.3
)2 (6
.7)
6 (20.
0)4 (1
3.3)
1 (3.3
)30 (1
00%
)Is
the
plac
eda
rk?
1 (7.1
)7 (5
0.0)
1 (7.1
)1 (7
.1)
2 (14.
3)2 (1
4.3)
14 (100
%)
Isth
ele
vel
ofno
ise
inth
ebu
ildi
ngre
ason
able
?
3 (7.9
)15 (3
9.5)
5 (13.
2)1 (2
.6)
2 (5.3
)6 (1
5.8)
5 (13.
2)1 (2
.6)
38 (100
%)
Doe
sth
eli
brar
yha
vesu
ffici
ent
vent
ilat
ion?
1 (2.9
)4 (1
1.8)
11 (32.
4)4 (1
1.8)
1 (2.9
)2 (5
.9)
5 (14.
7)4 (1
1.8)
2 (5.9
)34 (1
00%
)A
reth
ere
any
unde
sira
ble
smel
ls?
4 (100
.0)
4 (100
%)

12 Is Your Library Building Sick? 231
environment of the library departments in both the old and the new buildings interms of ventilation, lights, quietness and smells. Reading and comparing the dataon both the old and the new buildings reported in each table, the following set ofindicators was concluded:
• All departments in the new building stated that there was sufficient air. However,complaints of the coldness of the air increased in six departments in the newbuilding in comparison to only four in the old building. On the other hand, com-plaints of the heat were concentrated in the Technical Operations and the JournalsDepartments in the new building. Meanwhile the percentage of complaint ofhumidity decreased in six departments in the new building, in comparison toseven departments in the old building.
• All the departments in the new building agreed that the lighting was adequate.At the same time complaints of the place being gloomy increased in the TechnicalOperations Department in the new building in comparison to the old one. This isdue to the poor artificial lights distribution in some places of the new building,where lights are abundant in some parts but absent from others.
• The perception of quietness in the new building increased and the highest per-centage came from the Technical Operations Department in the new building.This is considered an advantage since the employees in this department need ahigh level of concentration to perform their tasks.
• The percentage of complaints of undesirable smells increased in the old building,in particular in the Technical Operations Department, followed by the Lendingand References Departments. On the contrary, there are no complaints of unde-sirable smells in all departments of the library in the new building, with theexception of the Technical Operations Department. The employees of the depart-ment explained it in terms of the smells particular to new buildings, namely thepaint vapours, and the glue used for woods or carpet-fixing. These smells are ofextreme danger to human health and the experience of SBS in library buildings.This was pointed out by some studies, maintaining that 30% of the new buildingpopulation in fact does suffer from SBS (Righi et al. 2002). A comprehensivereading of the two tables illustrates some aspects of the interior environment ofsome departments in the new building, in terms of the smells, reduced dust in theair, increased percentage of quietness, whereas complaints increased of the cold-ness of the air, and the experience of heat increased in the Technical Operationsand Journals departments.
The two researchers also attempted to determine the extent to which the libraryemployees are aware of SBS in library building. The analysis of the questionnairedata showed that a great percentage of the study community (91.5%) do not haveany idea or knowledge about this disease. This may be ascribed to the lack of Arabicstudies dealing with this issue, and the fact that architectural designers of librarybuildings disregard the environmental dimension and the healthiness of the inte-rior environment of library buildings, focusing only on the economic dimension.The findings illustrated through the questionnaire that three individuals of the study

232 S.A. Abdul-Wahab and N.M.B. Salem
community have pointed out their personal efforts to understand SBS in librarybuildings. On the other hand, a librarian maintained his knowledge of this issue,having completed a PhD dissertation in a foreign country. He also praised the atten-tion paid by foreign governments to the observation of the soundness of the interiorenvironment of library buildings, paying environmental allowances added to thepay-checks of the librarians.
The last part of the questionnaire contained an open question, through whichthe librarians could express their personal view concerning the items mentioned inthe questionnaire or on their personal impressions of the interior environment ofthe new building. These observations focused upon ventilation, cleanliness, noise,coldness, lighting, and equipment. These observations stress upon the existence ofproblems relating to the design and furnishing of the new building, which reflectupon the soundness of the interior environment which had a direct impact uponthe individuals of the study community who experience the symptoms of SBS inlibrary buildings. This in turn is predicted to affect the efficiency of the librarianin accomplishing his/her tasks. The observations of the study community may besummarized in the following points:
V entilation:
• The importance of paying attention to the renewal of air inside the newbuilding.
• Providing the librarians with the ability to control the opening of windowsaiming at renewing the air inside the offices.
• The importance of ventilation in the toilettes.• The importance of paying attention to ventilation in the Technical Operations
Department since this department is located in the basement (the undergroundfloor).
Cleanliness:
• The importance to pay attention to the constant cleanliness of the new building.• The importance of cleaning the books, journals and references on a daily basis,
to avoid the accumulation of dust.• To use insecticides in the new building.
Noise:
• To reduce the noise inside the library building, aiming at providing quietnessfor the employees and users alike.
• To propose the assignment of a committee, the responsibility of which is topreserve the quietness inside the library.

12 Is Your Library Building Sick? 233
Coldness:
• Complaints of the coldness of the air in the new building, and the inabil-ity to control the temperature inside the building. This necessitates that eachemployee be granted the ability to control the temperature inside the building.
• Switching off the air conditioners after 8:00 pm in the new building.
Lighting:
• Complaints of poor natural lights, in particular in the Technical OperationsDepartment.
• Complaints of poor artificial lights in various areas of the new building, inparticular in the Technical Operations Department and at the book shelves.
Equipments:
• The lowered ceiling in the Technical Operations Department and at the bookshelves prevented natural ventilation and lighting in the new building.
• The seats in the library are uncomfortable and give a feeling of discomfort inthe new building.
• The absence of special furnishings for first aid in the new building.• The absence of an area designated for prayers in the new building, and a
cafeteria for snacks.
Experiencing the symptoms:
Some members of the study community pointed out that they experienced patholog-ical symptoms in specific places within the new building, such as: the book shelves,the photocopying machines, the basement and the upper floor.
12.6 Conclusion and Recommendations
12.6.1 Conclusion
This chapter seeks to identify the extent to which the librarians of the SQU MainLibrary in both the old and the new building are exposed to SBS symptoms in librarybuildings. The data of the study were collected through a questionnaire distributedto the members of the study community. Through the analysis of the data, the studyhas reached various findings that can be summarized in the following points:
• Both the old and the new buildings suffer from SBS in library buildings.• The new building enjoys s relatively better environment than the old building in
some environmental aspects, such as quietness, the scarcity of undesirable smells,

234 S.A. Abdul-Wahab and N.M.B. Salem
and the sufficiency and dryness of the air. On the other hand, the percentage ofthe improvement of the interior environment in the new building in some otherenvironmental aspects, such as lighting and coldness decreased.
• Pathological symptoms such as sinusitis, eye inflammation, dryness of the throatand headaches are some of the most prominent symptoms suffered by thelibrarians in both the old and the new buildings.
• The number of pathological symptoms suffered by the librarians did not decreasewith their move from the old to the new building, but their degree of their experi-ence of some of these symptoms decreased. These symptoms include: headaches,sinusitis and headaches.
• The effect of SBS symptoms in library buildings on the efficacy of the librarianswas observed, as well as the increase of absenteeism in both the old and the newbuildings.
• The degree of control of the temperature, the humidity, ventilation and lightingdecreases in the new building in comparison to the old building. The reverse istrue of the degree of control of the noise, which is greater in the new buildingthan in the old one.
• The condensation of humidity on the walls of the new building was less than inthe old.
• Regular ventilation was low in both the old and the new buildings.• Neither the old nor the new buildings had a separate ventilation system for the
photocopying areas.• The percentage of mildew and mould was less in the new building than it was in
the old.• The new building allows the entrance of natural light and sunshine at a larger rate
than the old building.• The number of pathological symptoms experienced by males was larger than that
experienced by females in both the old and the new buildings.• Both males and females complained of the same pathological symptoms in the
old and the new buildings, namely sinusitis, eye inflammation, headaches, rapidexhaustion and fatigue, and dryness of the throat.
• Females experienced a higher rate of pathological symptoms than males in thenew building.
• Librarians with blood-type A are the most susceptible to all pathological symp-toms, followed by blood-type O. The number of symptoms experienced bylibrarians of blood-type B was lower.
• There is a strong correlation between the carrier of a certain blood type and suffer-ing from certain pathological symptoms whether in the old or the new buildings,such as: the carriers of blood-type O suffer from headaches and nasal conges-tion; the carriers of blood-types A and AB suffer from sinusitis and dryness ofthe throat; the carriers of blood-types B suffer from dryness of the throat and eyeinflammation.
• Librarians working in the director’s office, the administration and the library sys-tems department did not suffer from any symptoms, whether in the old or the newbuildings.
12 Is Your Library Building Sick? 235
• The librarians working in the Lending and Technical Operations Departments arethe most susceptible to all pathological symptoms, whether in the old or the newbuildings.
• Complaints by librarians working in the Journals Section lessened when theywere moved to the new building.
• The complaints by librarians working in the Technical Operations Departmentincreased in comparison to the complaints by other librarians working in the otherdepartments, whether in the old or the new buildings.
• Complaints of the cold air increased in six departments of the new building, incomparison to only four departments in the old one. At the same time, the librar-ians working in the Technical Operations and Journals Departments complainedof the high temperature of the air inside the new building.
• A high rate of complaints of the gloominess of the Technical OperationsDepartment in the new building.
• The rate of complaints of humidity in the air decreased in six departments of thenew building in comparison to seven departments in the old building.
• The experience of quietness in the new building was higher than in the oldbuilding, in particular in the Technical Operations Department.
• There were no complaints of undesirable smells in the new building, with theexception of the Technical Operations Department.
12.7 Recommendations of the Study
In the light of the results concluded by the study, and in addition to the commentsmade by the members of the study community, the study recommends the following:
• Taking the environmental dimensions into consideration when designing alibrary, as well as the expected impact of SBS in library buildings upon librarians.
• The necessity of exchanging the fixed windows in the new library building withmovable windows, which allow the librarians to constantly open and close them,to improve the air-flow and renew the air inside the building.
• To introduce a special ventilation system in the building as a whole, and in thephotocopying areas in particular, to provide the librarians and the users with freshair, and expel accumulating pollutants and humidity.
• Using modern techniques to increase the amount of clean filtered air enteringthe building, in particular in the Technical Operations Department, due to thedepartment’s location in the basement.
• Installing filters to purify the internal air of pollutants. It is recommended to useactivated carbon which absorbs pollutants.
• To find a system that helps the librarians to control the temperature inside theiroffices and in other parts of the building.
• To regulate the humidity rate inside the building to avoid the condensation ofwater on the walls and windows, by installing fans that absorb the bad air andexcessive humidity expelling it outside the building.

236 S.A. Abdul-Wahab and N.M.B. Salem
• To seek to amend the design of the shelf areas aiming at providing higher ceilings,since library users suffer from headaches due to the low ceilings.
• The necessity to increase the areas designated for windows in the basement andon the upper floors of the building to permit the utmost possible amount of naturallight in.
• Artificial lights should be redistributed to and increased in all corners of the newbuilding.
• The necessity of moving the Technical Operations Department from the base-ment to any other floor, due to the high rate of complaints by the workers in thisdepartment of SBS. This department is important in that it provides indirect ser-vices at the library which contribute to the success of the library in its provisionof direct library services.
• It is essential to constantly care for the cleanliness of the building, as well asdusting the desks and the stationary.
• The necessity of regularly spraying the building with insecticides to get rid ofinsects and rodents. It is important to air the building well after the process, andto ascertain that the place is clean of all traces of insecticides before the librariansare allowed to resume their work.
• To promote the environmental awareness of librarians, by organizing variousworkshops that illustrate the ways to handle and communicate with the interiorenvironment of the library building.
• To provide the new building with various services that are bound to help in thepreservation of the library environment, such as a cafeteria, which would bea place for the employees to take a break and have snacks and drinks, awayfrom the library environment. Also, an area designated for prayers, and aninfirmery.
• The necessity to amend the sewage in the parking area, to avoid the accumulationof rain water on the lower walls of the building which may cause serious damageto the building due to the increase in humidity as well as the formation of mildewand mould.
• To conduct this study again after a period of time on the new building to measurethe extent to which the environmental condition inside the building has improvedor deteriorated, and its impact upon the librarians.
• To evaluate the interior environmental condition of the new building scientificallyusing genuine scales on the temperature, the relative humidity, and the rate ofventilation in the various areas inside the new building. Also, to gauge the qualityof the air, taking different samples of air inside the new building to determinethe concentration of some pollutants, specify their possible sources and comparethem to the permitted values.
• To conduct further studies in this field on other libraries to reveal the SBS symp-toms suffered by librarians in library buildings and the extent to which theseimpact upon their performance and efficiency. This study also recommends fur-ther studies in this field to reveal the SBS symptoms suffered by the users insidelibrary buildings and the extent to which these impact upon their visits to thelibrary.

12 Is Your Library Building Sick? 237
R e f e r e n c e s
AlAreeni MA (1994) Professional Development of Workers in Libraries and Information Centers.Al Dar Al Masreya Al Libnaneya, Cairo, 395p.
AlMorshidi MAA (2004) The General District Library in Egypt: An Evaluation Study. Thesis.Helwan University, Helwan.
AlSareehi HA (2005) Library safety and information systems: A case study of King Abdel AzizLibrary Jeddah. King Fahd Natl Lib Mag 8(1):112–154.
AlSareehi HA, Hambeeshi NK (2001) The electronic library building: A theoretical study of theinfluences and variables. King Fahd Natl Lib Mag 6(2):196–224.
Apter A, Bracker A, Hodgson M, Sidman J, Leung WY (1994) Epidemiology of the sick buildingsyndrome. J Allergy Clin Immunol 94:277–288.
Au Yeung YN, Chow WK, Lam VYK (1991) Sick building syndrome – A case study. BuildEnviron 26(4):319–330.
Balanli A, Ozturk A, Vural SM, Kucukcan B (2007) University library building in turkey: A sur-vey and a case study of yildiz technical university main library building. J Acad Librarian33(6):714–718.
Bass B, Economou V, Lee CKK, Perks T, Smith SA, Yip Q (2003) The interaction between phys-ical and social-psychological factors in indoor environmental health. Environ Monit Assess85:199–219.
Cando (1999) Guess Where the Air Pollution is Worse? Toronto Public Health, Toronto, ON.Eriksson NM, Stenberg BGT (2006) Baseline prevalence of symptoms related to indoor environ-
ment. Scand J Public Health 34:387–396.Fantuzzi G, Aggazzotti G, Righi E, Cavazzuti L, Predieri G, Franceschelli A (1996) Indoor air
quality in the university libraries of modena (Italy). Sci Total Environ 193(1):49–56.Fisk WJ (2000) Estimates of potential nationwide productivity and health benefits from better
indoor environments: An update. In: Spengler JD, Samet JM, McCarthy JF (Eds.) Indoor AirQuality Handbook. McGraw-Hill, New York, NY.
Godish T, Spengler JD (1996) Relationships between ventilation and indoor air quality: A review.Indoor Air 6:135–145.
Hassan NM (2005) The digital revolution and library buildings: Activities and design (CentralLibrary, University of King Saud, Riyadh-A Case Study). Sixth International ArchitectureConference: The Digital Revolution and its Effect on Architecture and Construction, pp. 79–93.
Library of Congress (1991) Indoor air quality and work-environment study: Madison building,vol. 3. Association between health and comfort concerns and environmental conditions.
Morris A, Dennison P (1995) Sick building syndrome: Survey findings of libraries in great britain.Lib Manage 16(3):34–42.
Niemelä R, Seppänen O, Korhonen P, Reijula K (2006) Prevalence of building-related symptomsas an indicator of health and productivity. Am J Ind Med 49:819–825.
Niso (2001) Environmental conditions for exhibiting library and archival materials. ANSI/NISOZ39.79-2001, ISSN: 1041–5653.
Norbäck D, Nordström K (2008) Sick building syndrome in related to air exchange rate, CO2,room temperature and relative air humidity in university computer classrooms: An experimentalstudy. Int Arch Environ Health 82:21–30.
Pereira GJF (2004) Outline of a methodology for construction of a healthy building. RevistaPortuguesa De Pneumologia 10(3):227–233.
Raw GJ (1994) Sick Building: A Review of the Evidence on Cause and Solutions. BuildingResearch Establishment, Watford.
Reinikainen LM, Jaakkola JJK (2001) Effects of temperature and humidification in the officeenvironment. Arch Environ Health 56:365–368.
Reinikainen LM, Jaakkola JJK, Heinonen OP (1991) The effect of air humidification on differentsymptoms in office workers: An epidemiological study. Environ Int 17:243–250.

238 S.A. Abdul-Wahab and N.M.B. Salem
Righi E, Aggazzotti G, Fantuzzi G, Ciccarese V, Predieri G (2002) Air quality and well-beingperception in subjects attending university libraries in modena (Italy). Sci Total Environ286:41–50.
Seppanen O (1999) Estimated cost of indoor climate in finish buildings. In: Indoor air 991999,Edinburgh, Construction Research Communications, pp. 13–18.
Spengler JD, Samet JM (2003) Indoor environments and health: Moving into the 21st century. ProcHealthy Build 1:127–135.
Wargocki P, Sundell J, Bischof W, Brundrett G, Fanger PO, Gyntelberg F, Hanssen SO, HarrisonP, Pickering A, Seppänen O, Wouters P (2002) Ventilation and health in non-industrialindoor environments: Report from a european multidisciplinary scientific consensus meeting(euroven). Indoor Air 12(2):113–128.
WHO (2005) Housing: Sick Building Syndrome (Pamphlet No. 2). World Health OrganizationRegional Office for Europe, Copenhagen. http://www.emro.who.int/ceha/publication_Details.asp?ID=46. Accessed May 2010.
Wyon D (1992) Sick buildings and the experimental approach. Environ Technol 3:313–322.

Chapter 13
The Interaction Between the PhysicalEnvironment and People
Derek J. Clements-Croome
13.1 People: Environmental Sensory Design
The work experience of every worker in every office, factory, warehouse, shop or bank isintimately affected by the qualities and organization of the physical work environment. Thebuilding they work in and the way it is laid out will give govern proximity to colleagues,visibility to a supervisor, the degree of acoustic and visual privacy, the levels of temperatureand light they work under, and the quality of the air they breathe. It will very often affecttheir health (Baldry 1999).
As human beings, we live through our primary senses using sight, hearing, touch,smell and taste, with each one stimulated by the environment around us. Intelligentbuildings therefore, should provide a pleasant multi-sensory experience for theoccupant and assist in maximizing productivity of the workforce. Sensory designhowever, is much more than setting temperature levels for thermal comfort, anydesign brief should set specific criteria for daylight (sight), air quality (smell whichis linked to taste), temperature (touch), and sound (hearing). But this alone is notenough to maximize productivity and produce a conducive work environment, aseach sense possess a range of various gradients of sensitivity which combine withother senses to create a holistic environment experience. The specified criteria arejust the starting point for the design team; the main aim is to achieve an environ-ment which is inspiring and conducive to well-being and productivity. Intelligentbuildings should therefore have environments which are delightful to work and live,and require creative thought and sensitivity in there conception. Too often, timeand money limit the time for thinking, but we should at least try to establish whatdefines an organizations motivational environment. Whether designing a new build-ing or refitting an old one the client must describe in words the character of thespaces they need for the building and then the integrated team have to interpretthese requirements in terms of sensory aesthetics, function, sustainability and value.
D.J. Clements-Croome (B)School of Construction Management and Engineering, University of Reading, ReadingRG6 6AW, UKe-mail: [email protected]
239S.A. Abdul-Wahab (ed.), Sick Building Syndrome,DOI 10.1007/978-3-642-17919-8_13, C© Springer-Verlag Berlin Heidelberg 2011
240 D.J. Clements-Croome
Over the past 20 years, it has been empirically assessed that most buildingenvironments possess a direct effect upon an occupants personal well being andperformance, however, it is only through more recent studies that a clearer under-standing of the occupied environment has been discovered. Bako-biro et al. (2008)have shown that learning in primary school children is affected by the CO2 levelsand hence the ventilation. In UK, the Building Schools Exhibition and Conference(CIBSE 1999) asked head teachers if they felt modern buildings affect learning.Around 78% said they felt there was a clear link between the quality of school designand levels of pupil attainment. Williams (2005) reported a similar conclusion for12 primary schools which he had assessed using the Building Quality Assessmentmethod.
Sickness Building Syndrome (SBS) is categorized, when 20% of buildings occu-pant complain of a similar medical condition due to an unknown cause over periodof at least 2 weeks, whilst in the building. However, some research questionswhether the underlying factors of SBS are perhaps biased to those who com-plain more than others, or those who are more sensitive and more susceptible toenvironmental influences. Perhaps the latter group should be used as a sensitive indi-cator? Fisk (1999) showed the impact nationally in the US of having poor indoorenvironmental conditions.
Miller et al. (2009) prove their hypothesis that healthy buildings reduce the num-ber of sick days and increase productivity making and also makes it easier to recruitand retain staff, by surveying over 500 LEED or Energy Star buildings. More evi-dence which supports this argument that sustainable buildings decrease businesscosts, energy running costs, and as society awareness of green buildings deepens thedemand for sustainable buildings increases, so the value of the built asset increasesas described in various studies (Thomson and Jonas 2008; Newell 2009; Clements-Croome 2004). Legislation is forcing the pace. The question is now – can one affordnot to be sustainable? Bernstein and Russo (2010) wrote that US environmentallylabeled buildings rent for 2–3% more and have higher occupancy rates decreasedoperating costs but in 2008 an increased building value of 10%. Newell (2009)quoted evidence showing that LEED rated buildings cost 6% more to build; haveoccupancy rates over 4% higher; command 2–6% higher rents; save 10–50% inenergy consumption.
For existing buildings refurbishment, Newell (2009) considered the Empire StateBuilding. The plan is to reduce energy consumption by 38%; achieve annual savingsof $4.4 m giving a payback of 3 years; reduce carbon emissions by 105,000 metrictons over 15 years; project completion in 2 years.
Intelligent buildings should be a multi-sensory experience. If an environ-ment is to be conducive to health and well-being it must display the followingcharacteristics:
• A fresh thermal environment• Ventilation rates to provide fresh air with good distribution and acceptable levels
of CO2
• Good natural lighting
13 The Interaction Between the Physical Environment and People 241
• Minimal lighting glare from within and external to the space• Spatial settings to suit various types of working• Ergonomic work places so as to minimise muscular-skeletal disorders• Minimum pollution from external sources including noise
Personal control of these factors is important. Central control for items like secu-rity is fine but people prefer to have some degree of control over their immediateenvironment.
Freshness is an under used term in design yet occupants often talk of the needfor a fresh environment. Many factors can contribute such as colour, spatiality andmore often the air quality. The air quality is a combination of CO2 level, tempera-ture, relative humidity and air movement. Work by Clements-Croome (2008) gave arelationship between fresh air requirements FA (l/s per person) and air temperatureTa (deg C) for relative humidity range of 40–60% as:
Ln (FA) = 0.2085Ta − 3.37
For a “moderately” fresh environment as judged by a sample of UK officeworkers requires a fresh air rated 2.2 l/s per person at 20C, 6.3 at 25C and17.9 at 30C. Environments judged as “very fresh” would need higher amounts offresh air.
The location of the building with respect to Nature is important as well. Ulrich(1984) showed how views out from hospital windows on to greenery improvedrecovery rates. Alvarsson et al. (2010) showed that the sounds of Nature aids phys-iological stress recovery. Greenery and still or running water relieve the body andspirit in very hot climates.
Fisk (1999) discussed the correlation between infectious disease transmission,respiratory illness, allergies and asthma and suggests air quality is a major issue inmanaging these issues including the eradication of odours. The direct affects of poorperforming environments can be summarized as follows:
• Lost man hours due to sickness• Inability to reach true operational potential• Reduction in Gross Domestic Product• Unable to maximise organisational profit• A demoralised work force• Increase in operation and maintenance costs• Increased staff turnover
The issue therefore becomes one of economics. If organisational performance isa factor of the individual, then the design of the building should concentrate onuser centered design principles and in satisfying the occupant within the workplace.Evans et al. (1998) concluded that a ratio defined as the Total Cost of Ownership(TCO), or whole life value cost ratio, for a building was 1:5:200 but these valueswill vary but the ratio scales remain similar.

242 D.J. Clements-Croome
1: Design and Construction costs – cheapest is not always the long term solution5: Operating and maintenance costs – driven by the building design.200: Business operating costs – salaries and other organisational costs; produc-
tivity which is influenced by the building design and management as well asthe ethos of the organisation, social and motivational issues.
Hughes et al. (2004), Wu and Clements-Croome (2005) gave other ratios. Howeverthe main conclusion remains that business operating costs dominate and arelong term.
Not only research evidence but several surveys carried out in practice showedthat properly designed, maintained and managed buildings can lead to significantimprovements in productivity (Clements-Croome 2004).
13.2 The Nature of Productivity
For an organisation to be successful and to meet the necessary targets, the perfor-mance expressed by the productivity of its employees is of vital importance. In manyoccupations people work closely with computers within an organisation which isusually housed in a building. Today, technology allows people to work easily whilethey are travelling, or at home, and this goes some way to improving productivity.There are still, however, many people who have a regular workplace which demar-cates the volume of space for private work but is linked to other workplaces as wellas to social and public spaces. People produce less when they are tired; have per-sonal worries; suffer stress from dissatisfaction with the job or the organisation. Thephysical environment can enhance one’s work and put people in a better mood, butan unsatisfactory environment can hinder work output.
Concentration of the mind is vital for good work performance. Absolute alertnessand attention are essential if one is to concentrate. There is some personal disciplineinvolved in attaining and maintaining concentration, but again the environment canbe conducive to this by affecting one’s mood or frame of mind; however, it can alsobe distracting and can contribute to a loss of concentration.
A number of personal factors which depend on the physical and mental health ofan individual, and a number of external factors which depend on the environmentand work-related systems, influence the level of productivity.
Experimental work on comfort often looks at responses of a group as a whole andthis tends to mask individuals’ need for sympathetic surroundings to work and livein. People also need to have a fair degree of personal control about various factorsin their environment. They react to the environment as a whole, not in discrete parts,unless a particular aspect is taxing the sensory system.
Research at Rochester University in New York suggested that the mind canaffect the immune system. Stress can decrease the body’s defences and increasethe likelihood of illness, resulting in a lowering of well-being.
Stresses come from a variety of sources: the organisation, the job, the personand the environment. It is likely that building sickness syndrome is triggered byunfavourable combinations of environmental conditions which stress the mind and

13 The Interaction Between the Physical Environment and People 243
body and lower the immune system, leaving the body more sensitive to environmen-tal conditions. The biological chain seems to be that stress acts on mind and brain,to which the hypothalamus reacts and the hormone ACTH is released, and then thehormone cortisol in the blood increases to a damaging level. This chain of eventsinterferes with human performance and consequently productivity is lowered.
13.3 Multi-sensory Experience
Buildings should provide a multi-sensory experience for people and uplift the spirit.A walk through a forest is invigorating and healing due to the interaction of all sensemodalities; this has been referred to as the polyphony of the senses. One’s sense ofreality is strengthened and articulated by the interaction of the senses. Architectureis an extension of nature into the manmade realm and provides the ground for per-ception, and the horizon to experience from which one can learn to understand theworld. Buildings filter the passage of light, air and sound between the inside andoutdoor environments; they also mark out the passage of time by the views andshadows they offer to the occupants.
Although the five basic senses are often studied as individual systems coveringvisual, auditory, taste, smell, orientation and the haptic sensations, there is interplaybetween the senses. For example, eyes want to collaborate with the other senses.All the senses can be regarded as extensions of the sense of touch, because thesenses as a whole define the interface between the skin and the world. The com-bination of sight and touch allows the person to get a scale of space, distance orsolidity.
Qualitative attributes in building design are often only considered at a superficiallevel. For example, in the case of light, the level of illuminance, the glare index andthe daylight factor are normally taken into account. But in great spaces of architec-ture there is a constant deep breathing of shadow and light; shadow inhales, whereasillumination exhales light. The light in Le Corbusier’s Chapel at Ronchamps, forexample, gives the atmosphere of sanctity and peace. How should we consider hue,saturation and chroma in lighting design, for example?
Buildings provide contrast between interiors and exteriors. The link betweenthem is provided by windows. The need for windows is complex but it includesthe need for an interesting view, contact with the outside world and, at a fundamen-tal level, it provides contrast for people carrying out work in buildings. Much worktoday is done by sitting at computers at close quarters and requires eye muscles tobe constrained to provide the appropriate focal length of vision, whereas when onelooks outside towards the horizon the eyes are focused on infinity and the musclesare relaxed.
There are all kinds of other subtleties, such as the need to recreate the wavelengthprofile of natural light in artificial light sources, which need to be taken into account.Light affects mood. How can this be taken into account in design?
The surfaces of the building set the boundaries for sound. The shape of theinterior spaces and the texture of surfaces determine the pattern of sound rays

244 D.J. Clements-Croome
throughout the space. Every building has its characteristic sound of intimacy ormonumentality, invitation or rejection, hospitality or hostility.
A space is conceived and appreciated through its echo as much as through itsvisual shape, but the acoustic concept usually remains an unconscious backgroundexperience.
It is said that buildings are composed as the architecture of space, whereas musicrepresents the architecture of time. The sense of sound combines the threads of thisnotion. Without people and machines, buildings are silent. Buildings can providesanctuary or peace and isolate people from a noisy, fast-moving world. The ever-increasing speed of change can temporarily be reduced by the atmosphere createdin a building. The opposite is true when working with computers or watching tele-vision, for example. Architecture emancipates us from the embrace of the presentand allows us to experience the slow healing flow of time. Again, buildings providethe contrast between the passing of history and the time-scales of life today.
The most persistent memory of any space is often its odour. “Walking through thegardens of memory, I discover that my recollections are associated with the senses”,wrote the Chilean writer Isabel Allende (The Times, April 1998). Every building hasits individual scent. Our sense of smell is acutely sensitive. Strong emotional andpast experiences are awakened by the olfactory sense. Again think of the varyingolfactory experiences such as in a leather shop, a cheese stall, an Indian restaurant,a cosmetic department or a flower shop; all awaken our memories and give, or do notgive pleasure. Wine and whisky connoisseurs know that flavour is best sensed usingthe nose, whereas texture is sensed in the mouth. Odours can influence cognitiveprocesses which affect creative task performance as well as personal memories.These tasks are influenced by moods, and odours can affect these also (Warren andWarrenburg 1993; Erlichman and Bastone 1991; Baron 1990a). Various parts of thehuman body are particularly sensitive to touch. The hands are not normally clothedand act as our touch sensors. But the skin of the body reads the texture, weight,density and temperature of our surroundings.
Proust gives a poetic description of a space of intimate warmth next to a fireplacesensed by the skin: “it is like an immaterial alcove, a warm cave carved into theroom itself, a zone of hot weather with floating boundaries”.
There is a subtle transference between tactile, taste and temperature experiences.Vision can be transferred to taste or temperature senses; certain odours, for example,may evoke oral or temperature sensations. The remarkable world-famous percus-sionist Evelyn Glennie is deaf but senses sound through her hands and feet andother parts of her body. Marble evokes a cool and fresh sensation. Architecturalexperience brings the world into a most intimate contact with the body.
13.4 Well-Being
Well-being reflects one’s feelings about oneself in relation to one’s world. Warr(1998a, b) proposed a view of well-being which comprises three scales: pleasureto displeasure; comfort to anxiety; enthusiasm to depression. There are job and

13 The Interaction Between the Physical Environment and People 245
outside-work attributes which characterize one’s state of wellbeing at any point intime and these can overlap with one another. Wellbeing is only one aspect of mentalhealth; other factors include personal feelings about one’s competence, aspirationsand degree of personal control. It is a much more comprehensive concept than theover used word comfort. Freshness is an under used word but it has positive nuancesin terms of air quality, colours, temperature, daylight and space. A lack of produc-tivity shows up in many ways, such as absenteeism, arriving late and leaving early,over-long lunch breaks, careless mistakes, overwork, boredom, frustration with themanagement and the environment.
Work reported in (Newman 2010) reviewed the impact of well-being on staffand research performance. The Higher Education Funding Council for England isencouraging universities to invest in wellbeing which can reduce absenteeism andstaff turnover. A report by PricewaterhouseCoopers LLP in 2008 on Building the
Case for Wellness stated that for every £1 spent, well-being brings a return of £4.17.Daly (2010) made a similar evidence case for hospitals. Well-being is connectedwith overall satisfaction, happiness and quality of life. It is a more encompassingword than comfort. Well-being depends on the management ethos of the organisa-tion; the social ambience; personal factors but the physical environment also hasa major role to play (Clements-Croome 2004). Anderson and French (2010) at theInstitute of Well-Being at Cambridge University discussed the deeper significanceof well-being. Heschong (1979) reported productivity tends to be increased whenoccupants are satisfied with their environment.
Townsend (1997) said that people in the workplace can be encouraged to useboth halves of their brain. The left-hand part is concerned with logic, whereas theright-hand side is concerned with feeling, intuition and imagination (Ornstein 1973).If logic and imagination work together, problem-solving becomes more enjoyableand more creative. Of course some people thrive on change while others prefer to dorepetitive types of work. There seems to be no doubt that the industrial and commer-cial worlds can play a leading role in increasing the awareness of their workforce ofall of these possibilities. It is also important to start this way of thinking in schoolchildren.
13.5 Indoor Environment and Productivity
Too often buildings are seen as costly static containers rather than an investmentwhich if they are healthy and sustainable can add value. Boyden (1971) distin-guished between needs for survival and those for well-being. Human beings havephysiological, psychological and social needs. Heerwagen (1998) pinpointed thosewell-being needs relevant to building design as:
• Social milieu• Freedom for solitary or group working• Opportunities to develop self-expression
246 D.J. Clements-Croome
• An interesting visual scene• Acceptable acoustic conditions• Contrast and random changes for the senses to react to• Opportunities to exercise or switch over from work to other stimulating activities.
To which one may add the need for clean fresh air. Stokols (1992) believed thatphysical, emotional and social conditions together are a requisite for good health.Buildings have a dynamic interaction with people, and this is the essence of thischapter.
13.6 Well-Being and Productivity
The question of the well – being of the employee is considered by Warr (1998a, b).Defining wellbeing is not easy because there are job specific issues and also peoplehave feelings and concerns which are not related to a particular environment. Warrproposed a two-dimensional view of well – being, placing pleasure and arousalas the two main axes. In terms of measurement Warr also includes an anxietycomfort axis, and another one for depression-enthusiasm. Ten features of jobs aredescribed by Warr (1998a, b) which have been found to be associated with well–being. He believes that stable personality characteristics as well as age and genderare also significant. Environmental determinants of well – being are described as:the opportunity for personal control; the opportunity for using ones skills; externallygenerated goals; variety; the environment; availability of money; physical security;supportive supervision; the opportunity for interpersonal contact and job status insociety. Warr (1998a, b) reviews work that indicates that greater well – being is sig-nificantly associated with better job performance, lower absenteeism and reducedprobability of leaving employee. The organisation as well as personal factors arealso important.
Heerwagen (1998) draws attention to work in organizational psychology whichshows the relationship between buildings and worker performance (P) is interrelatedas shown:
P = Motivation × Ability × Opportunity
An individual has to want to do the task and then has to be capable of doingit; last but not least resources and amenities have to be available so that thetask can be done. The built environment provides physical and social ambiancewhich affects motivation; the provision of individual control and a healthy environ-ment can enable ability to flourish; communications systems, restaurants and otheramenities aid motivation and ability even further by providing opportunity for taskimplementation.
Boyce (1997) shows the relationships between visual stimuli; the visual system;the cognitive, visual and motor components of task performance; the personality,motivation, management and cost factors which underlie output. This model can

13 The Interaction Between the Physical Environment and People 247
be repeated for the other human senses and then there is the complexity of theinteractions between them.
Well-being reflects feelings about oneself in relation to the world. Earlier in thechapter, it was noted that Warr (1998a, b) has proposed a view of well-being whichcomprises three scales: pleasure to displeasure; comfort to anxiety; enthusiasm todepression. There are work and non-work attributes which characterize one’s stateof well-being at any time, and these can overlap with one another. Well-being is onlyone aspect of mental health; other factors include personal feelings about one’s com-petence, aspirations and degree of personal control. Good architecture extends andenhances human capacities. Buildings moderate climates, which help to keep thebody healthy and enhance well-being. Some buildings demand closely controlledenvironments, and various equipments can be installed in order to achieve this butmany buildings can take advantage of the body’s ability to adapt and interact in acompensatory way with other senses.
To understand how we can produce more productive environments means wehave to understand more about the nature of work and how the human system dealswith work. Quality, and hence productive, work means we need good concentration.When we are about to carry out a particular task we need to settle down, get inthe mood and then concentrate. Our attention span usually lasts about 90–120 minand then natural fatigue comes into play and our concentration droops but with acreative break we pick up again, concentrate for another spell of time and this pat-tern repeats itself during the waking day. This is the so called ultradian rhythm.
De Marco and Lister (1987) described this as a concept of flow. Mawson (2002)describes their work which claims that individuals take about 15 min to ramp up totheir concentration level. When an individual is in a state of flow they then maybedistracted or may become naturally tired and the process repeats itself. Mawson(2002) believes that there is a significant loss of productivity from distraction whichhas been identified by the Harvard Business Review, for a well managed officeas being approximately 70 min of lost productivity in a typical 8 h day. The dis-traction is mainly due to general conversation. In other words there is a wasteof energy.
Barriers to effective work performance are distraction, boredom, poor supportsystems, unhelpful organisations, a lack of social ambience and a poor physicalenvironment.
Davidson (2003) led a research study at University of Wisconsin-Madison whichshows positive thinking (good moods, optimism) can promote good health becausethe body’s defences (the immune system) are stronger. This suggests that thebalance between the mind and the body is a sensitive one. So how relevant isthis in the workplace? Various stressors can arise from conflicts in the physi-cal, social organisational environments. People adapt to these in various ways butfor some they will be weakened; if conditions are very stressful many will beaffected.
There is substantial evidence described by Heerwagen (1998) showing that pos-itive moods are associated with the physical environment and everyday events suchas social interactions (Clark and Watson 1988). Even more telling is the research

248 D.J. Clements-Croome
which showed that positive moods aid complex cognitive strategies (Isen 1990)whereas negative moods due to distractions, discomforts, health risks or irritantsarising from the physical or social environments restrict attention and hence affectwork performance. Because positive moods directly affect the brain processes (LeDoux 1996), it can be concluded that many aspects of building environmental designcan aid task performance. Heerwagen (1998) distinguishes between direct effectssuch as overheating, noise or glare and indirect effects arising from mood and/ormotivational factors. Several positive mood inducing factors have already beenmentioned – aesthetics, freshness, daylight, view, colour, personal control, spatialaspects and Nature.
Mood, feelings and emotions affect people’s decision-making. Mood can beinfluenced by several environmental factors such as Monday effect or weather con-ditions. A body of psychological literature shows that temperature is one of theimportant meteorological variables affecting people’s mood, and this in turn influ-ences behaviour. Cao and Wei (2005) stated that research to date has revealed thatstock market returns are associated with nature-related variables such as the amountof sunshine, the daylight-savings time change, the length of the night, and the lunarphases of the moon.
Cao and Wei (2005) described evidence which suggests that low temperaturestend to cause aggression, and high temperatures tend to cause aggression, hysteria,and apathy. The question is then “Is does temperature variations cause investors toalter their investment behaviour?” They hypothesized that lower temperature leadsto higher stock returns due to investors’ aggressive risk-taking, and higher temper-atures can lead to higher or lower stock returns since aggression and apathy havecompeting effects on risk-taking.
Based on an analysis of twenty international markets Cao and Wei (2005) con-cluded that the impact of apathy dominates that of aggression in the summer, leadingto a statistically significant negative correlation across the whole temperature range.The correlation was robust to alternative tests (parametric, semi-parametric, andnonparametric) and remained present after controlling for such known anomalies asthe Monday effect, the tax loss effect, the cloud cover effect, and the seasonal affec-tive disorder syndrome. The difficulty with the word productivity is that in manyplaces it is invisible. Time and motion studies can be used in factory conditionsto some extent. There are measures that can be quite easy to employ for repetitiveoffice work. In general however apart from the basic qualities like speed and accu-racy, it is much more elusive to assess quality, because it involves some objective
measures but it also introduces a high degree of subjective assessment. Table 13.1shows some indicators of productivity.
The impacts of spatial design and sick building syndrome are discussed inChap. 3 of Intelligent Buildings (Clements-Croome 2004).
Herzberg (1966) distinguished hygienic or environmental factors from the socialneeds of giving the worker more responsibility and recognition. The physical envi-ronment was one aspect of job satisfaction. In the Eden and Brown (2000) annualemployment attitude survey of office workers in the UK, the following overall scoreswere achieved for various factors (Tables 13.2 and 13.3).

13 The Interaction Between the Physical Environment and People 249
Table 13.1 Indicators of increased productivity (NEMA 1989)
Performing tasks more accuratelyPerforming faster without loss of accuracyCapability to perform longer without tiringLearning more effectivelyBeing more creativeSustaining stress more effectivelyWorking together more harmoniouslyBeing more able to cope with unforeseen circumstancesFeeling healthier and so spending more time at workAccepting more responsibilityResponding more positively to requests
Table 13.2 Achieving Maslow’s Hierarchy of Needs in the Workplace (CIBSE 1999; Huczynski1991)
Need Achieved by
Physiological Good working conditions, attractive salary, subsidised housing, freecatering.
Safety Private health care, pension, safe working conditions, job security.Social esteem Group relationships, team spirit company sports, office parties, informal
activities, open communication.Regular positive feedback, prestige job titles, write-up in company news
sheet, promotion and reward.Self-actualisation Challenging job, discretion over work activity, promotion opportunities,
encouraging creativity, autonomy and responsibility
Table 13.3 Eden Brown (2000) employment attitude survey
Factor Overall percentage vote
Nice people to work with 85Job security 80Money 77Qualities of opportunity 74Comfortable working condition 73Career opportunities 65Location 64Company contributing to community/environment 63Benefits 54Flexi time 47
In general women scored all these factors higher than men, particularly on theissues of having nice people to work with, comfortable working conditions, quali-ties of opportunity, working for a company that was socially responsible to thosein the community or a company that took sustainability seriously. We see thatenvironmental conditions are rated almost as highly as money and opportunities.

250 D.J. Clements-Croome
To perceive the world around us in a holistic way the word environment has abroad meaning embracing how the organisation works and manages the staff; thephysical factors such as lighting, noise and indoor air quality; space planning andlayout; economic factors; general aesthetics; the amenities, facilities and supportsystems provided by the organisation; social ambience. If any one of these factors isparticularly bad or particularly outstanding this tends to attract the attention of thehuman mind. In general however, the human sensory system is adaptable but peoplelike to feel they have some degree of control over some of the factors. In other wordspeople like to create their own environment to suit their work style. Patterns of work
used to be rigid but are now much more flexible. A review of these factors is givenin CIBSE (1999).
Fisk (2000a and b) reported that in the US respiratory illnesses cause the loss ofabout 176 million workdays and the equivalent of 121 million days of substantiallyrestricted activity. Fisk (1999) and Clements-Croome (2000b) stated that in officebuildings, the salaries of workers exceed the building energy and maintenance costsand the annual construction rental costs by a factor of at least 25. This means thatsmall increases in productivity, of 1% or less, are sufficient to justify additionalcapital expenditure to improve the quality of the building’s services. Ultimately,this will result in healthier working environments as well as reduced energy andmaintenance costs.
Most people spend most of their lives in buildings, so the internal environ-ment has to be designed to limit the possibilities of infectious disease; allergiesand asthma; and building related health symptoms, referred to as sick buildingsyndrome symptoms. Buildings should provide a multi-sensory experience, andtherefore anything in the environment which blocks or disturbs the sensory systemsin an unsatisfactory way will affect health and work performance. Thus, lighting,sound, air quality and thermal climate are all conditions around us that affect ouroverall perception of the environment. Air quality is a major issue because it onlytakes about 4 s for air to be inhaled and for its effect to be transmitted to the blood-stream and hence the brain. Clean, fresh air is vital for clear thinking, but it is notthe only issue to be considered.
Fisk (1999) discussed linkages between infectious disease transmission, respi-ratory illnesses, allergies and asthma, sick building syndrome symptoms, thermalenvironment, lighting and odours. He concludes that in the USA the total annualcost of respiratory infections is about $70 bn, for allergies and asthma $15 bn, andreckons that a 20–50% reduction in sick building syndrome symptoms correspondsto an annual productivity increase of $15–38 bn. The linkage between odour andscents and work performance is less understood, but Fisk (1999) concluded that theliterature provides substantial evidence that some odours can affect some aspects ofcognitive performance. He referred to work by done by various researchers (Rotton1983; Dember et al. 1995; Knasko 1993; Baron 1990b; Ludvigson and Rottman1989). The application of scents has been used by the Kajima Corporation in theirTokyo office building, as reported by Takenoya in Clements-Croome (2000a).
Fisk goes on to consider the direct linkage between human performance andenvironmental conditions and writes that for US office workers there is a poten-tial annual productivity gain of $20–$200 bn. His conclusions are that there is
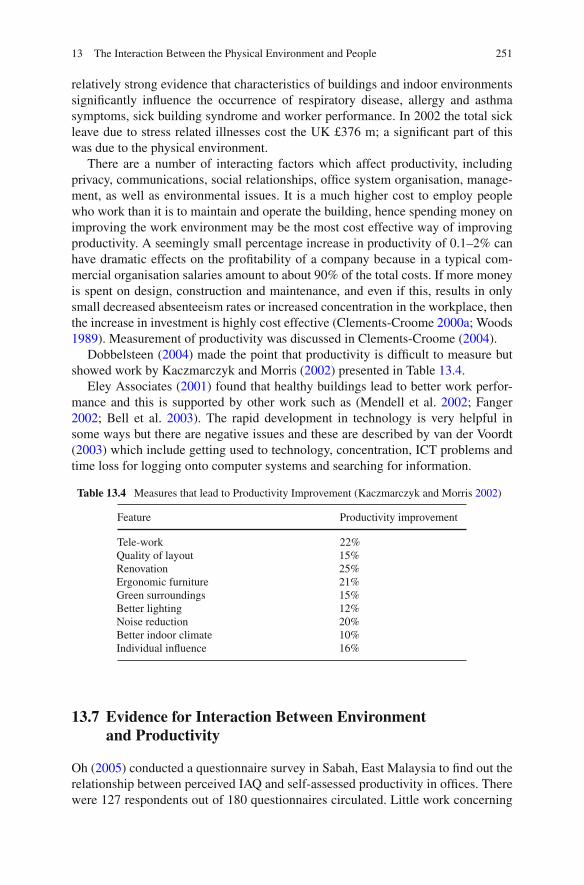
13 The Interaction Between the Physical Environment and People 251
relatively strong evidence that characteristics of buildings and indoor environmentssignificantly influence the occurrence of respiratory disease, allergy and asthmasymptoms, sick building syndrome and worker performance. In 2002 the total sickleave due to stress related illnesses cost the UK £376 m; a significant part of thiswas due to the physical environment.
There are a number of interacting factors which affect productivity, includingprivacy, communications, social relationships, office system organisation, manage-ment, as well as environmental issues. It is a much higher cost to employ peoplewho work than it is to maintain and operate the building, hence spending money onimproving the work environment may be the most cost effective way of improvingproductivity. A seemingly small percentage increase in productivity of 0.1–2% canhave dramatic effects on the profitability of a company because in a typical com-mercial organisation salaries amount to about 90% of the total costs. If more moneyis spent on design, construction and maintenance, and even if this, results in onlysmall decreased absenteeism rates or increased concentration in the workplace, thenthe increase in investment is highly cost effective (Clements-Croome 2000a; Woods1989). Measurement of productivity was discussed in Clements-Croome (2004).
Dobbelsteen (2004) made the point that productivity is difficult to measure butshowed work by Kaczmarczyk and Morris (2002) presented in Table 13.4.
Eley Associates (2001) found that healthy buildings lead to better work perfor-mance and this is supported by other work such as (Mendell et al. 2002; Fanger2002; Bell et al. 2003). The rapid development in technology is very helpful insome ways but there are negative issues and these are described by van der Voordt(2003) which include getting used to technology, concentration, ICT problems andtime loss for logging onto computer systems and searching for information.
Table 13.4 Measures that lead to Productivity Improvement (Kaczmarczyk and Morris 2002)
Feature Productivity improvement
Tele-workQuality of layoutRenovationErgonomic furnitureGreen surroundingsBetter lightingNoise reductionBetter indoor climateIndividual influence
22%15%25%21%15%12%20%10%16%
13.7 Evidence for Interaction Between Environment
and Productivity
Oh (2005) conducted a questionnaire survey in Sabah, East Malaysia to find out therelationship between perceived IAQ and self-assessed productivity in offices. Therewere 127 respondents out of 180 questionnaires circulated. Little work concerning

252 D.J. Clements-Croome
this issue has been carried out in Malaysia, thus the main objective of the surveywas to find out the divergence of perception of IAQ in a hot humid climate whichmay yield different results to at European or American location. The relationshipbetween perceived IAQ and self-assessed productivity was strong (P < 0.001) andsimilar to studies carried out in cooler climates. On the other hand, no correlationbetween temperature and self-assessed productivity was found. This may be becauseMalaysians have become acclimatized to a wider and higher range of temperaturesso they can still perform well in temperatures which are often judged to be adverse.
Kosonen and Tan (2004) have studied the affect of indoor air quality on produc-tivity and concluded that the loss in productivity is significant for thinking tasksthan for typing ones. In general the percentage dissatisfied is a good indicatorof the productivity loss. This is useful because the dissatisfied population can beestimated from pollution loads, fresh air flow-rate and ventilation efficiency; thelatter will vary depending on the type of ventilation system installed. They con-clude that in general the use of minimum air-flow rate design reduces productivityby 5–13%. Further, a l% loss in productivity is equivalent to the annual total costof operating an airconditioning system; it also represents an increase in dissatis-faction of 5%. Kosonen and Tan conclude that a productivity loss difference of0.5–2% between mixing (100% in contaminant removal efficiency) and displace-ment systems (150% ventilation efficiency) could equate to $3–$12b. This showsthe importance of selecting the right ventilation system to achieve high indoor airquality.
Federspiel et al. (2004) in studying worker performance and ventilation in a callcentre made the point that the effect of ventilation is significant but factors such asunderstaffing and long shifts are even more significant. In terms of the environmenttemperatures above 25.4C are detrimental to performance.
Gohara and Iwashita (2001) studied the perceived air quality, sick building syn-drome (SBS) symptoms and performance of subjects in an office room that wasrenovated 1 year before this study. Thirty-one female college age subjects wereexposed to the conditions in the same office with an outdoor airflow of 280 m3/h and45 m3/h. The subjects were unaware of any intervention acoustically and visuallysince the ventilation fan was operated in both conditions. They assessed perceivedair quality and SBS symptoms while performing simulated work. The measurementsof formaldehyde and the volatile organic compounds showed much higher read-ings in the room with low ventilation than those in the room with high ventilation.However no significant difference was observed in the odour intensity, the accept-ability and the SBS symptoms between overall average assessments of all subjectsexposed to the room with either ventilation conditions. The air quality caused only10% to be dissatisfied on entering the office with low ventilation; these dissatisfiedsubjects tended to claim more SBS symptoms than the others. It was found that therewas significant difference in the performance of computer based proofreading taskbetween the two ventilation conditions.
Gohara and Iwashita (2003) studied the influence of self-reported arousalcaused by room temperature and scent on performance. Fifteen subjects performedproof reading work at three different levels of air temperatures and four different

13 The Interaction Between the Physical Environment and People 253
conditions of indoor air quality. Among the three levels of air temperatures, the sub-jects found air temperatures of 26.5–27.5C, very acceptable. However, the highestperformance occurred with cooler air temperatures of 22–24C. For the evaluationtest with pine scent, the subjects were divided into two groups; group A, found thepine scent not acceptable at higher odour intensity levels and group B, who foundthe pine scent acceptable even at high odour intensity levels. The conditions withthe scent had more of an influence on the self-reported arousal and performance forthe subjects of Group B, than for those of Group A.
Morita et al. (2003) used proof reading tasks to study the effect of the indoorthermal environment on task performance. A score of effective processing in theproof reading task was the highest and the low temperature condition (22–24 C)but some subjects had high scores in high temperature conditions (30–32 C) and itis thought that in this case performance was determined more by the arousal levelof the occupants.
13.8 Economic Opportunities for Business
Evans et al. (1998) in a report entitled The Long-term Costs of Owning and Using
Buildings for the Royal Academy of Engineering (RAE) made the point that the costof ownership and maintenance of the building is typically about 3% of the overallcost of people working there. As a guide to the whole life cost of operation of officebuildings the following ratios are proposed:
Design 0.1Construction cost 1Maintenance and building operating costs 5–9Business operating costs 200
Oseland and Willis (2000) quote similar figures. Macmillan (2004) adds in designfees at 10% of total costs hence giving design a ratio of 0.1:1 for design: construc-tion costs. Some buildings show different figures to these but the principal interesthere is that business operating costs (mainly salaries) are much higher than design,construction and operating costs. Quoted from Wu and Clements-Croome (2005):
For a building as a whole, Evans et al. (1998) show a ratio of costs of 1:5:200,where for every one pound spent on construction cost, five are spent on maintenanceand building operating costs and 200 on staffing and business operating costs. ForHVAC systems in a building, Osso et al. (1996) shows that initial building costsaccount for approximately just 2% of the total, while operating and maintenancecosts equal 6%, and personnel costs equal 92%. Modelling on a dataset including20 costs of HVAC systems, Wu and Clements-Croome (2005) show that the ratiosof operating and maintenance costs to initial costs range from 4.75 to 30, and theratios of maintenance costs to initial costs range from 0.45 to 1.8. These results

254 D.J. Clements-Croome
shows that the median of the ratio initial building costs to operating and maintenancecosts is 1:7.77. Considering the medians of the ratios, and assuming that 90% of thetotal cost are on staffing and business operating costs, and 10% are on initial costs,operating and maintenance costs, then ratio of 1:7.77:78.93 results which can beapproximated to 1:8:80.
The RAE report concludes that there is a good deal of evidence that the buildingitself if properly designed and managed can lead to significant improvements inproductivity by as much as 17%.
Hodgett (1993) estimated that the annualized UK building cost including capitalinvestment is about £200 m2 p.a. of which energy and plant costs are about £10 m2
p.a. Staff costs are about £15,000 m2 per year. One can see immediately that anyfactor like increased productivity altering by only 1% can increase the value of thestaff costs considerably for the organization. The USA has taken this relationshipbetween the various costs seriously and examples are given in Clements-Croome(2000a). The conclusions from the work reviewed in CIBSE (1999) is that staff costsare 100–200 times the cost of energy and these costs can be off-set by a 0.5–1%reduction in staff costs. Staff costs are 20–44 times the HVAC running cost whichindicates that an increase in productivity is required to off-set these costs by 2–5%.The costs are some 30 times the HVAC installation costs and any change in thesecosts are justified if the changes produce an increase in productivity of some 31/2.Productivity of gain of just under 10% should off-set the full running and installationcost. Some US cost comparisons are given in Table 13.5.
Table 13.5 Comparison of energy and staff costs for North American Offices (CIBSE 1999)
Costs RosenfeldAbdou andLorsch EPA Woods BOMA
Staff costs ($/ft2/year) 300 218 200 237 130HVAC running costs ($/ft2/year) – 2–10 6 12 2.9Energy costs ($/ft2/year) 1.5 1–2 2 2 1.5Ratio of staff to energy costs 200 114–218 100 118 87Productivity offset of energy (%) 0.5 0.5–0.9 1.0 0.9 1.2
Productivity offset (min/day perperson)
21/4 2–33/4 41/3 5
13.9 Endnote
Productivity depends on four cardinal factors: personal, social, organisational andenvironmental. There are preferred environmental settings which decrease dissatis-faction and absenteeism, thus indirectly enhancing productivity. The assessment ofproblems at the workplace based on numbers of complaints is unreliable, becausethere is little mention of positive aspects and because complaints may be attributableto other, entirely different factors.

13 The Interaction Between the Physical Environment and People 255
Kline (1999) believes it is important to design thinking environments. The mostimportant aspect is to have places for work where people feel that they matter. Whenthat becomes a guideline for architectural interior design she argues a very differentplace emerges, than when some abstract standard of opulence and furnishing forpure functionality is adopted as a guideline. Building regulations and codes to prac-tice are only a basic foundation for providing health and safety in the workplace;they do not guarantee producing an environment which is conducive to well-beingand this includes feelings and emotions. Froggatt (2001) enunciates eight principlesfor workplace design:
• the initiative to explore remote and mobile work strategies• trust employers to work out of sight of management• encourage joy in the workplace (Cabanac 2000)• value individuality• emphasise equality more than hierarchy• engage in open honest dialogue• epitomise cognitivity between all the stakeholders in the business• provide access to a wide range of workplace options
Duffy (1997) and Worthington (1998) are two of several leading exponents onworkplace design and they show many examples of diverse but successful inter-nal environments. Offices of the future will be thought of as organisms which aredeveloping in response to changes in technology and ways of working. It is impor-tant that office spaces allow people to work in teams, when necessary, but at thesame time bond to individual needs for motivation and hence stimulate productivity.
Good environments can enrich the work experience. Stimulating environmentscan help people to think creatively and buildings have a role here because spaceshave an emotional content (Farshchi and Fisher 2000). It is important that the builtenvironment is designed to respect feelings of people as well as the functionalaspects.
In response to the question about the principal shortcomings in the conventionalpublic sector approach to design Hilary Cottam, nominee for UK Designer of theYear 2005, wrote:
Despite rhetoric to the contrary the public sector continues to be driven byshort term calculations of cost. The failure to compute the emotional, social andtherefore economic benefits that accrue from good design has led to procurementprocesses which exclude the real experiences and needs of the people who will usethe buildings, objects and experiences that are designed.
For example, we are happy to continue building cheap, sub-standard housingto warehouse a population in need, while failing to connect the huge personal andsocial costs that result. Those responsible for commissioning design in the publicsector largely fail to appreciate its potential. Briefs are issued which ask the wrongquestions and thereby fail to capitalise on the wealth of design talent within the UK.
She gave the following solutions to how these problems could be addressed.Three things seem key. Firstly within my approach all briefs are developed in

256 D.J. Clements-Croome
partnership with those who will work with and use whatever is to be the final prod-uct. This is not simply a consultation exercise or populism, but a rigorous designprocess whereby a range of professionals work with users to develop a solution.Secondly all projects develop practical, workable solutions for the users while alsodeveloping policy guidelines – a set of principles which could help to change theframework within which future designs will be commissioned. Thirdly we have anunderlying principle of smart spending. All my projects are developed within thesame budgets as traditional approaches. We do not need to spend more; we justneed to spend differently. Sometimes this results in solutions which turn out to becheaper than those developed through more traditional approaches. Hilary Cottam(Designer of the Year 2005)
References
Allende I (1998) Aphrodite: A Memoir of the Senses. Flamingo, London.Alvarsson JJ, Weins S, Nilsson ME (2010) Stress recovery during exposure to nature sound and
environmental noise. Int J Environ Res Public Health 7(3):1036–1046.Anderson J, French M (2010) Sustainability as Promoting Well-being: Psychological Dimensions
of Thermal Comfort, Personal Communication. Institute of Well-Being at the University ofCambridge, Cambridge.
Bakó-Biró ZS, Kochhar N, Clements-Croome DJ, Awbi HB, Williams M (2008) Ventilationrates in schools and pupil’s performance using computerised assessment tests. Proceedingsof the 11th International Conference on Indoor Air Quality and Climate, August 17–22, 2008,Copenhagen, Denmark.
Baldry C (1999) Space: The final frontier. Sociology 33(3):1–29.Baron RA (1990a) Environmentally induced positive effect: Its impacts on self-efficacy, task
performance, negotiation and conflict. J Appl Soc Sociol 20(5):368–384.Baron R (1990b) Environmentally induced positive effect: Its impact on self efficacy, task
performance, negotiation and conflict. J Appl Soc Psychol 16:16–28.Bell J, Mabb J, Garcia-Hansen V, Bergman B, Morawska L (2003) Occupant health and produc-
tivity: An australian perspective. In: Yang J, Brandon PS, Sidwell AC (Eds.) Proceedings ofthe CIB 2003 International Conference on Smart and Sustainable Built Environment (SASBE2003). Brisbane, pp. 687–694.
Bernstein H, Russo M (2010) Personal Communication. McGraw-Hill Construction.Boyce PB (1997) Illumination, Chapter 26. In: Salvendy G (Ed.) Handbook of Human Factors and
Ergonomics. Wiley Interscience, New York, NY, pp. 858–890.Boyden S (1971) Biological determinants of optimal health. In: Vorster DJM (Ed.) The Human
Biology of Environmental Change. Proceedings of a conference held in Blantyre Malawi, April5–12. International Biology Programme, London.
Brown E 2000 Article on Recruitment, Building Design, July 7, p. 23.Cabanac M (2000) Pleasure and joy, and their role in human life. In: Clements-Croome D (Ed.)
Creating the Productive Workplace. E and FN Spon, London, pp. 40–50.Cao M, Wei J (2005) Stock market returns: A note on temperature anomaly. J Bank Fin
29:1559–1573.CIBSE (1999) Technical memorandum 24: Environmental factors affecting office worker perfor-
mance; a review of the evidence, ISBN: 0900953950.Clark LA, Watson D (1988) Mood and the mundane: Relationships between daily events and self-
reported mood. J Pers Soc Psychol 54:296–308.Clements-Croome DJ (2000a) Computers and health in the work place. In: Proceeding of Healthy
Buildings, vol. 1 (August 6–10). University of Technology, Helsinki, pp. 119–124.Clements-Croome DJ (2000b) Creating the Productive Workplace. Spon-Routledge, London.
13 The Interaction Between the Physical Environment and People 257
Clements-Croome DJ (2004) Intelligent Buildings: Design, Management & Operation. ThomasTelford Ltd, London.
Clements-Croome DJ (2008) Work performance, productivity and indoor air. Scand J WorkEnviron Health Suppl 34(4):69–78.
Daly S (2010) Ecobuild Conference at Earls Court London and Personal Communication (HeathAvery).
Davidson R (2003) Report by M. Henderson, The Times 2, p. 4, September 2nd.De Marco T, Lister T (1987) People Ware: Productive Projects and Teams. Dorset House
Publishing, New York, NY.Dember WN, Warm JS, Parasuraman R (1995) Olfactory stimulation and sustained attention.
In: Gilbert A (Ed.) Compendium of Olfactory Research. Kendall Hunt Pub, Dubuque, IA,pp. 39–46.
Dobbelsteen A (2004) The Sustainable Office. Technische Universiteit Delft, Delft.Duffy F (1997) The New Office. Conran Octopus, London.Eley Associates (2001) The Collaborative for High Performance Schools, Best Practices Manual.
Eley Associates, San Francisco, CA.Erlichman H, Bastone L (1991) Odour Experience as an Effective State: Effects of
Odor Pleasantness on Cognition, Working paper. The International Fragance Foundation,New York, NY.
Evans R, Haryott R, Haste N, Jones A (1998) The Long Term Costs of Owning and UsingBuildings. The Royal Academy of Engineering, London.
Fanger PO (2002) Human requirements in future air-conditioned environments. In: Anson M, KoJM, Lam ESS (Eds.) Advances in Building Technology. vol. 1:pp. 29–38.
Farshchi MA, Fisher N (2000) Emotion and the environment: The forgotten dimension. In:Clements-Croome DJ (Ed.) Creating the Productive Workplace. Spon, London, Routledge,Taylor and Francis Group, UK, pp. 51–70.
Federspiel CC, Fisk WJ, Price PN, Liu G, Faulkner D, Dibartolemeo DL, Sullivan DP, Lahiff M(2004) Worker performance and ventilation in a call center: Analyses of work performance datafor registered nurses. Indoor Air J 14(8):41–50.
Fisk WJ (1999) Estimates of potential nationwide productivity and health benefits from betterindoor environments: An update, Chapter 4. In: Spengler JD, Samet JM, McCarthy JF (Eds.)Indoor Air Quality Handbook. McGraw-Hill, New York, NY.
Fisk WJ (2000a) Health and productivity gains from better indoor environments and theirrelationship with building energy efficiency. Ann Rev Energy Environ 25(1):537–566.
Fisk WJ (2000b) Review of health and productivity gains from better IEQ. Proc Healthy Build(Helsinki) 4:24–33.
Froggatt CC (2001) Work Naked – Eight Essential Principles for Peak Performance in the VirtualWorkplace. Jossey-Bass, San Francisco, CA.
Gohara T, Iwashita G (2001) Perceived air quality and performance of subjects in room with dif-ferent air pollution Levels. Proceedings of 7th REHVA World Congress, Clima 2000, Naples15–18 September.
Gohara T, Iwashita G (2003) Discussion of relationship between indoor environmental comfortand performance in simple task. J Environ Eng 572:75–80.
Heerwagen JH (1998) Productivity and well-being: What are the Links? American Institute ofArchitects Conference on Highly Effective Facilities (March 12–14), Cincinnati, OH.
Herzberg F (1966) Work and the Nature of Man. World Publishing Company, Cleveland, OH.Heschong L (1979) Thermal Delight in Architecture. MIT Press, Cambridge, MA.Hodgett D (1993) Environment and Efficiency. Proceedings of profit from thin air. EA Technology,
Capenhurst, pp. 1–11.Huczynski AA (1991) Organisational Behaviour (2nd ed.). Prentice-Hall International, Hemel
Hempstead.Hughes W, Ancell D, Gruneberg S, Hirst L (2004) Exposing the myth of the 1:5:200 ratio relating
initial cost, maintenance and staffing costs of office buildings. In: Khosrowshahi F (Ed.) 20th

258 D.J. Clements-Croome
Annual ARCOM Conference, 1–3 September 2004. Association of Researchers in ConstructionManagement1. Heriot Watt University, Edinburgh, pp. 373–381.
Isen AM (1990) The influence of positive and negative effect on cognitive organisation: Someimplications for development. In: Stein N, Leventhal B, Trabasso B (Eds.) Psychological andBiological Approaches to Emotion. Erlbaum, Hillsdale, NJ.
Kaczmarczyk S, Morris S (2002) Balanced scorecard for government: The workplace dimension.W4 working paper, GSA, Washington, DC, USA.
Kline N (1999) Time to Think: Listening to Ignite the Human Mind. Ward Lock Wellington House,London, England.
Knasko SC (1993) Performance mood and health during exposure to intermittent odours. ArchEnviron Health 48(5):305–308.
Kosonen R, Tan F (2004) The effect of perceived indoor air quality on productivity loss. EnergyBuild 36(10):981–986.
Le Doux J (1996) The Emotional Brain. New York, NY, Simon and Schuster.Ludvigson HW, Rottman TR (1989) Effects of odours of lavender and cloves on cognition,
memory, affect, and mood. Chem Sens 14(4):525–536.Macmillan S (2004) Designing Better Buildings. Spon Press, London.Mawson A (2002) The Workplace and its Impact on Productivity, Chapter 4. Advanced Workplace
Associates Ltd, London.Mendell M, Fisk WJ, Kreiss K, Levin H, Alexander D et al (2002) Improving the health of workers
in indoor environments: Priority research needs for a national occupational research agenda.Am J Public Health 92(9):1430–1440.
Miller NG, Pogue D, Gough QD, Davis SM (2009) Green buildings and productivity. J SustainableReal Estate 1(1):65.
Morita T, Iwashita G, Gohara T (2003) Effect of indoor thermal environment on psychologi-cal evaluations and performance of proofreading task. In: Proceedings of 7th InternationalSymposium on Ventilation for Contaminant Control, August 5–8. Hokkaido University,Sapporo.
NEMA (1989) A report sponsored by the lighting equipment division of the National ElectricalManufacturers Association, Washington DC, and the Lighting Research Institute, New York,NY.
Newell G (2009) Developing a socially responsible property investment index for UK propertycompanies. J Prop Invest Fin 27(5):511–521.
Newman M (2010) Get happy, and get on with it. Times High Edu 34–36.Oh SYJ (2005) Indoor air quality and productivity in offices in Malaysia. Dissertation for bache-
lor degree, School of Construction Management and Engineering, The University of Reading,Reading.
Ornstein RE (1973) The Nature of Consciousness. Viking, London.Oseland N, Willis S (2000) Property performance and productivity. In: Nutt B, McLennan P (Eds.)
Facility Management: Risks and Opportunities. Blackwell Science, Maiden, MA, pp. 157–163.Osso A, Gottfried DA, Walsh T, Simon LN et al (1996) Sustainable Building technical manual,
Technical report, US Green Building Council.Rotton J (1983) Affected and cognitive consequences of malodorous pollution. Basic Appl Psychol
4(2):171–191.Stokols D (1992) Establishing and maintaining healthy environments: Toward a social ecology of
health promotion. Am Psychol 47(1):6–22.Thompson B, Jonas D (2008) Workplace design and productivity: Are they inextricably inter-
linked? Property in the Economy Report, RICS, pp. 4–41.Townsend J (1997) How to draw out all the talents, The Independent, tabloid section. p. 17.Ulrich RS (1984) View through a window May influence recovery from surgery. Science
224:420–421.van der Voordt DJM (2003) Kosten en baten van werkplekinnovatie (in dutch) – een definitie en –
programmeringsstudie. Center for People and Buildings, Delft.

13 The Interaction Between the Physical Environment and People 259
Warr P (1998a) What is our current understanding of the relationships between well-being andwork. J Occ Psychol 63:193–210.
Warr P (1998b) Well-being and the workplace. In: Kahneman D, El Diener X, Schwarz N (Eds.)Foundations of hedonic Psychology: Scientific Perspectives on Enjoyment and Suffering.Russell-Sage, New York, NY.
Warren C, Warrenburg S (1993) Mood benefits of fragrance. Perfumer Flavorist 18:9–16.Williams B (2005) Building performance: The value management approach, Chapter 27. In:
Clements-Croome DJ (Ed.) Creating the Productive Workplace. Routledge.Woods JE (1989) Cost avoidance and productivity in owning and operating buildings. In: Cone
JE, Hodgson MJ (Eds.) Problem Buildings: Buildings Associated Illness and the Sick BuildingSyndrome, vol. 4, pp. 753–770. Med State of Art Rev.
Worthington J (1998) Reinventing the Workplace. Architectural Press, Oxford.Wu S, Clements-Croome DJ (2005) Critical reliability issues for building services systems. In:
The proceeding of the fourth international conference on quality and reliability, Beijing, pp.559–566.

Chapter 14
Necessity of Counseling Institutions for SickBuilding Syndrome Patients
Nami Imai and Yoshiharu Imai
14.1 Difficulty of Treating Sick Building Syndrome at General
Hospitals
When we think about the prerequisites for hospitals that can treat sick buildingsyndrome patients, the first is that there should be no toxic building materials thatmay volatilize toxic chemicals into the hospital because patients’ conditions areinfluenced by indoor air quality. However, sick building syndrome patients cannotbe treated in general hospitals where many patients with other illness visit even ifthere are no toxic materials in the building because modern people depend on manykinds of chemicals, and patients with other illness will bring these chemicals intohospitals by applying them to their clothing and body. Such chemicals are found inshampoo, hair conditioner, hair treatments, shaving cream, and the lingering scentof mothballs. Ordinary people may use all of these chemicals, but for sick buildingsyndrome patients they can cause agony. It goes without saying that hospitals thatare constructed with great care with regard to the toxic chemicals that they containare necessary for sick building syndrome patients.
14.2 Reasons for the Insufficient Number of Special Hospitals
for Sick Building Syndrome Patients
Unfortunately, even most medical staff is ignorant about the symptoms and treat-ment of sick building syndrome at the present time. Even worldwide, the number ofmedical staff and hospitals that can treat sick building syndrome patients is verysmall. In addition, there are few doctors who are clinically capable of treatingsick building syndrome because the nature of the pathophysiology of sick buildingsyndrome is still under investigation.
N. Imai (B)Faculty of Medicine, School of Nursing, Mie University, Tsu City, Mie, Japane-mail: [email protected]
261S.A. Abdul-Wahab (ed.), Sick Building Syndrome,DOI 10.1007/978-3-642-17919-8_14, C© Springer-Verlag Berlin Heidelberg 2011

262 N. Imai and Y. Imai
For example, we heard of a doctor who was the head of the Department ofOtorhinolaryngology at one of best hospitals in Japan. One day, a sick buildingsyndrome patient suggested that his symptoms were due to sick building syndromeand showed him a measurement of the high formaldehyde density in his room, andthe doctor replied “Sick building syndrome? What is that?” His attitude greatly dis-appointed the patient. At that time, WHO had already declared guideline values fortoxic chemical densities in indoor air, and many newspapers and TV news programswere covering the sick building syndrome issue in Japan. Why did the doctor saywhat he did? It was not because he was lacking in ability or had a defect in his per-sonality. Many patients respected the doctor, and his clinical skill was good. Rather,as a doctor of a private hospital, it was because he had never heard of sick buildingsyndrome and could not write it on a medical chart before the term “sick buildingsyndrome” was included on the list of illnesses eligible for governmental medicalservice fees from the governmental health insurance scheme.
Moreover, building a special hospital for sick building syndrome patients costsmuch more than a general hospital because such hospitals require special materialsthat do not emit toxic chemicals. Furthermore, they need special furniture madeof steel or ceramic because normal furniture such as chairs, tables, and beds emittoxic chemicals. Interestingly, while there is a law that regulates the quantity oftoxic chemicals emitted from building materials (especially formaldehyde) in Japan,there is no law that regulates the quantity of toxic chemicals emitted from furniture.Therefore, most furniture on the market is made from medium density fiberboardor plywood and emits lots of toxic chemicals because medium density fiberboardis made by mixing sawdust and glue, and plywood is made by pasting thin sheetsof wood with glue. Thus, special hospitals require custom made furniture, which isvery expensive. As a result, such expenses are a barrier to the number of specialhospitals increasing.
14.3 Who Should Get Aid?
On a global scale, it is considered that the Environmental Health Center Dallas(EHCD) in the US and the Institute for Environmental Diseases in Germany arethe best institutions at diagnosing and treating sick building syndrome and mul-tiple chemical sensitivity. There also are a few special hospitals for sick buildingsyndrome in Japan, where the author lives. Patients who can reach these hospi-tals are happy because they can stop seeking a correct diagnosis, learn appropriatecountermeasures for their condition, and receive treatment. In fact, the true victimsare the patients who cannot visit special hospitals. Maybe this is as same as the sit-uation for cancer, autoimmune diseases, and other refractory conditions, and mostpatients who visited the author’s office did not know of the existence of such specialhospitals. Some of them did know about them but worried whether their condi-tion warranted treatment at such a hospital. The author runs a Nursing CounselingRoom in Mie University. Some patients who visited the Nursing Counseling Room

14 Necessity of Counseling Institutions for Sick Building Syndrome Patients 263
and underwent a screening test for sick building syndrome and multiple chemicalsensitivity were instructed to go to a special hospital in Tokyo in order to preventthe aggravation of their symptoms and alleviate their agony (Imai and Imai 2009).
As described in Chap. 6, sick building syndrome and multiple chemical sensi-tivity patients should have a medical examination as soon as possible because theirsymptoms become worse with prolonged exposure. Therefore, counseling institu-tions that can refer such patients to special hospitals or doctors are necessary forpatients who worried about whether their sickness requires treatment at a specialhospital.
As mentioned above, the difference between sick building syndrome and multiplechemical sensitivity and other illness is that poor quality air can prevent patientsfrom visiting hospitals. Seriously ill sick building syndrome or multiple chemicalsensitivity patients cannot go to general hospitals safely because they could suffer areaction to chemicals in the air on public transport or in stations or to exhaust fumeson the road. There are no relief measures for such patients, even though they needimmediate medical support. In the author’s opinion, we must make the solving ofthese problems a priority.
14.4 Who Should Help the Patients?
Who can give patients who are unsure whether they have sick building syndrome ormultiple chemicals sensitivity appropriate advice? In the author’s opinion, nurses arethe best for this because they can assess a patient comprehensively and individuallyand can give them advice on how to improve their health by changing their lifestyle.In addition, the cost of building nursing counseling institutions for sick buildingsyndrome patients is much lower than the cost of building special hospitals for sickbuilding syndrome patients.
From 2006 to 2009, I interviewed 70 sick building syndrome patients and theirfamilies who visited my office in order to find out what sick building syndromepatients want nurses to do for them. According to the result, 46% of sick buildingsyndrome patients and their families wanted information about their condition andhow to treat it, 22% of them wanted information about how to make their daily lifesafe, 21% of them wanted mental support, and 11% wanted nurses to enlighten thepublic about sick building syndrome and multiple chemical sensitivity (Table 14.1).Therefore, the author hopes that many nurses will try to help sick building syndromepatients, but, unfortunately, few nurses have researched the subject and are able tohelp such patients. The reason why few nurses have studied the treatment of sickbuilding syndrome is that they would have to stop or reduce as much as possibletheir use of chemicals in order to help these patients (Imai 2008).
People who are immersed in the use of chemicals in daily life associate themwith convenience. They feel that treating sick building syndrome patients wouldmean throwing convenient life away and would cause them great stress becausethey would have no idea what they should eat, wear, and do. However, reducing the

264 N. Imai and Y. Imai
Table 14.1 Users’ demands to nurse (User: 70, code: 179)
Contents of demand to nursing in NCR %
Information on the condition and treatment 46Information that could improve the safety of daily living 22Mental support 21Action to promote social understanding of their situation 11
use of chemicals in daily life as much as possible is not only good and necessary forsick building syndrome or multiple chemical sensitivity patients but also for medicalstaff in order to live a healthy life.
Unfortunately, younger nurses in particular are displeased when they are told thatthey should reduce the amount of chemicals that they use in their daily life becausethey would not want to work without makeup. The author feels that support forsick building syndrome and multiple chemical sensitivity patients is not improvingbecause of such trifling reasons. Younger nurses’ desire to be beautiful should notbe frowned upon, but the fact that cosmetics, which they feel forced to buy, containmany chemicals is a serious problem.
14.5 Effects of Nursing Intervention in the Nursing Counseling
Room for Chemical Sensitivity
The author calls our support activities for sick building syndrome patients NCR-CS: Nursing Counseling Room for Chemical Sensitivity or just NCR. The effectsof NCR-CS have already reported at scientific conferences (Imai and Imai 2009).Some examples of the NCR-CS’s activities are given below.
Patient A was 29 years old and worked as a beautician. She got sick buildingsyndrome when she moved to a new apartment after getting married. Her mainsymptoms were dyspnea and a feeling of worthlessness. She heard that her symp-toms might be caused by sick building syndrome at an allergy clinic 2 months aftershe moved into her apartment. She heard about the NCR-CS accidentally, got advicefrom a nurse there, and her condition improved. Her worries at the time of her visit toNCR-CS were “No one understood her symptoms”, “Which chemicals caused hersymptoms?”, and “She had no idea how to improve her symptoms”. In response,a nurse at NCR-CS gave her counseling treatment, explained about sick buildingsyndrome and how it is aggravated, and gave her advice on how to improve hersymptoms. As a result, her condition improved dramatically with 5 months supportfrom NCR-CS (Fig. 14.1). The NCR-CS support activities that she valued most werethe peer counseling and advice about how to use a low-temperature sauna.
Patient B was 31 years old and was a vocational college student. She had symp-toms suggestive of sick building syndrome. The origins of her symptoms werestressful childhood experiences involving repeated moves to newly refitted apart-ments. Her worries at the time of her visit to NCR-CS were “No one understood her

14 Necessity of Counseling Institutions for Sick Building Syndrome Patients 265
Fig. 14.1 Outcome ofQEESI© symptom star andmain intervention (Female,29 years old, beautician,support method: peercounselling and sauna)
symptoms”, “She could not find appropriate hospitals for her symptoms”, and “Shehad no idea how to improve her symptoms”.
It should be noted that QEESI© (Quick Environment Exposure SensitivityInventory) was developed by Miller and Prihoda (1999) and was designed to assistresearchers and clinicians in evaluating patients for multiple chemical sensitivity.Symptom star is one of charts of QEESI© and it measures symptom severity scaleby 10 items such as head-related (HEAD), cognitive (COG), affective (AFF), neu-romuscular (NM), musculoskeletal (MS), skin (SKIN), genitourinary (GU), gastrointernal (GI), heart/chest-related (COR) and airway or mucous membrane-related(ARI/MM). Each item uses 0–10 rating.
In response, a nurse at NCR-CS gave her counseling treatment, explained aboutsick building syndrome and how it is aggravated, told her about the special hospi-tals for the condition, explained how to use those hospitals (it is necessary to makea reservation at the hospital first, and patients must have accommodation near thehospital for the night before their treatment because the treatment starts at 8:00 am),and gave her advice about how to improve her symptoms by changing her dailylife. After NCR-CS’s advice, she went to a special hospital and got a correct diag-nosis, and as a result, was able to dramatically improve her symptoms within 2months (Fig. 14.2). The NCR-CS support activities that she valued most were thepeer counseling, introduction to special hospitals, and advice about safe foods andsafe water.
Patients C and D were a married couple. C was a 51-year-old housewife, and herhusband D was a 55-year-old office worker. They had symptoms suggestive of sickbuilding syndrome caused by disinfectants, which were used in a septic tank in frontof their apartment. C was also a retired nurse, and she could not walk straight dueto dizziness when she visited NCR-CS. Meanwhile, D had symptoms on his skin.They were at a loss because they had no information about sick building syndrome,ways to improve their condition, or any special hospitals for their disease. A nurseat NCR-CS gave them counseling treatment and introduced them to the special hos-pitals after explaining about sick building syndrome and how it is aggravated. Rightafter their visit to NCR-CS, they went a special hospital and got a correct diagnosis.

266 N. Imai and Y. Imai
Fig. 14.2 Outcome ofQEESI© symptom star andmain intervention (Female,31 years old, student, supportmethod: peer counseling,introducing a special doctorand information of safe waterand foods)
They were very glad because they finally had a name for their symptoms. After that,they visited NCR-CS regularly and learned how to improve their health conditionfrom the nurse. As a result, their condition recovered dramatically with 10 monthssupport from NCR-CS (Figs. 14.3 and 14.4). The NCR-CS support activities thatthey valued most were the peer counseling, introduction to special hospitals, andadvice about safe foods and safe water.
According to these examples, sick building syndrome and multiple chemical sen-sitivity patients who visited NCR-CS were troubled by the fact that no one aroundthem showed any understanding about their symptoms. Indeed, some people, includ-ing members of the patients’ families, thought that the patients’ symptoms were partof a mental disorder, which caused the patients to feel a deep sense of isolation.
Therefore, counseling treatment by nurses at NCR-CS is surely warranted tocounter patients’ feelings of loneliness. In the author’s opinion, we medical staffmust first ease patients’ worries before starting counseling treatment in order toimprove their health condition by fixing the problems with their daily life.
Medical staff must make patients visit special hospitals and get a correct diagno-sis as soon as possible. As mentioned in Chap. 6, repetitively treating the symptoms
Fig. 14.3 Outcome ofQEESI© symptom star andmain intervention (Female, 51years old, house wife, supportmethod: peer counseling,introducing a special doctorand information of safe waterand foods)

14 Necessity of Counseling Institutions for Sick Building Syndrome Patients 267
Fig. 14.4 Outcome ofQEESI© symptom star andmain intervention (Male, 55years old, office worker,support method: peercounseling, introducing aspecial doctor andinformation of safe water andfoods)
of sick building syndrome or taking useless treatment under a wrong self diagno-sis prolong patients’ exposure to toxic chemicals and aggravate their symptoms.Therefore, the existence of places where patients can talk about their condition suchas NCR-CS and that provide appropriate advice about visiting special hospitals fromeducated medical staff are important for preventing the aggravation of the condition.
As mentioned above, sick building syndrome patients do not only have to payattention to indoor air pollution, but also foods and goods such as soap, sham-poo, cosmetics, and detergent because they may react to many kinds of chemicalsafter developing sick building syndrome. Moreover, their sick building syndromemay be aggravated and escalate to multiple chemical sensitivity, which is untreat-able. Therefore, the staff of the NCR-CS suggest that patients should pay attentionto indoor air quality, as well as the foods they consume and the goods they useand provide a chance for patients and their families to think seriously about theirlifestyle.
Getting sick building syndrome and multiple chemical sensitivity is very unfor-tunate. However, patients’ can recover from their condition if they realize they havesick building syndrome and take appropriate measures in the early stages of the con-dition. We should think about it as a chance to prevent other conditions by noticingchemical dangers and adjusting our lifestyle accordingly.
References
Imai N (2008) Living in a chemical world: Psycho-social factors aggravating the symptoms ofsick house syndrome, IPP-SHR Podcast by International Program of Psycho-Social HealthResearch, CQ University (http://www.ipp-shr.cqu.edu.au/podcasts/?id=52&startPlay).
Imai N, Imai Y (2009) Demand and nursing intervention of people who related to chemicalsensitivity: QHR 2008 conference abstracts. Int J Qualitative Meth 8(3):10–14.
Miller CS, Prihoda TJ (1999) The environmental exposure and sensitivity inventory (EESI): A stan-dardized approach for measuring chemical intolerances for research and clinical applications.Toxicol Ind Health 15:370–385.

Chapter 15
Investigation of Air Pollution in Large PublicBuildings in Japan and of Employees’ PersonalExposure Levels
Naoki Kunugita, Keiichi Arashidani, and Takahiko Katoh
15.1 Introduction
Approximately 80% of our lives are spent in indoor air environments such as homesor work places. The indoor air quality is often worse than that of the outdoor air,also it contains many pollutants. Jarke et al. (1981) identified 118 chemicals in theair inside new buildings and found that indoor pollutants probably arise from manycomponents, such as the carpeting, clothing, and furniture. Many studies on indoorair pollution (Jia et al. 2008; Osawa and Hayashi 2009; Park and Ikeda 2006; Tanejaet al. 2008) and its influence on health (Azuma et al. 2007; Ciencewicki and Jaspers2007; Gomzi et al. 2007; Osman et al. 2007; Takigawa et al. 2010; Zuraimi et al.2007) have been conducted.
In Japan, a major problematic change in indoor air environment has been recentlyrecognized. This new problem is caused by highly air-tight houses incorporating adi-abatic and other new building materials, and can lead to health problems. Residentsin newly built homes complained of discomfort and illness related to this problem inthe 1990s. These symptoms, called the sick house syndrome, have been studied inJapan. The symptoms are irregular and can not be distinguished from the sick build-ing syndrome (SBS); socially, they have become a significant problem. The Ministryof Health, Labor, and Welfare (MHLW) of Japan, in cooperation with the Ministry ofLand, Infrastructure, Transport, and Tourism (MLIT), Ministry of Economy, Trade,and Industry (METI), and Ministry of Agriculture, Forestry, and Fisheries (MAFF),have helped in controlling these sick house problems understanding the source andcharacteristics of indoor air pollution, indicating a concentration index (guideline)as a control policy, and developing methods for diagnosis and treatment. In addi-tion, at the same time, the MLIT investigated pollution mechanisms and methodsof calculating concentrations on the basis of the mechanisms, suggested designs
N. Kunugita (B)Department of Environmental Health, National Institute of Public Health, Wako City, Saitama,Japane-mail: [email protected]
269S.A. Abdul-Wahab (ed.), Sick Building Syndrome,DOI 10.1007/978-3-642-17919-8_15, C© Springer-Verlag Berlin Heidelberg 2011

270 N. Kunugita et al.
Table 15.1 Japanese guidelines for acceptable levels of individual VOCs and aldehydes
Compound Guideline value Year of enforcement
Formaldehyde 100 µg/m3 (80 ppb) June, 1997Toluene 260 µg/m3 (70 ppb) June, 2000Xylene 870 µg/m3 (200 ppb) June, 2000p-Dichlorobenzene 240 µg/m3 (40 ppb) June, 2000Ethylbenzene 3,800 µg/m3 (880 ppb) Dec, 2000Styrene 220 µg/m3 (50 ppb) Dec, 2000Chlorpyrifos 1 µg/m3 (0.07 ppb) Dec, 2000
For children: 0.1 µg/m3 (0.007 ppb)Di-n-butyl phthalate 220 µg/m3 (20 ppb) Dec, 2000Tetradecan 330 µg/m3 (40 ppb) July, 2001Di-(2-ethylhexyl) phthalate 120 µg/m3 (7.6 ppb) July, 2001Diazinone 0.29 µg/m3 (0.02 ppb) July, 2001Acetaldehyde 48 µg/m3 (30 ppb)
(300 µg/m3 (180 ppb), WHO) Jan, 2002Fenobucarb 33 µg/m3 (3.8 ppb) Jan, 2002Total VOC 400 µg/m3, advisable value Dec, 2000
to meet the guidelines, while the developed ventilation control technology, and theMETI and MAFF developed low-emissive materials and effective ventilation equip-ment and legislated standards, greatly contributing to the amendment of the BuildingStandards Law (BSL). The MHLW established the guideline level for formaldehyde(100 µg/m3) in 1997 and then for 12 other chemicals, as shown in Table 15.1.Afterward, indoor air quality at individual houses improved rapidly, as shown inthe discussion below.
On the other hand, air pollution in large buildings open to the public, such asmuseums, university buildings, department stores, and amusement facilities are notexamined properly. However, it is necessary to investigate the indoor air qualityof those buildings because many people visit them for the purpose of education,shopping, and entertainment. This study examined the air environment of variouslarge buildings in Japan and the chemical exposure of employees in these buildings.Consequentially, the Act on Maintenance of Sanitation in Buildings, enforced by theMHLW, prevented the spread of SBS, which surfaced in developed countries due topolicies to save energy by reducing the ventilation rate.
15.2 Methods
15.2.1 Buildings Studied
We investigated indoor and outdoor air quality at schools, book stores, hotels, adepartment store, a city hall, shopping malls, hotels, theaters, museums, and amuse-ment facilities, including a pachinko parlor and a bowling alley in Japan. Brief

15 Investigation of Air Pollution in Large Public Buildings in Japan 271
Table 15.2 Brief information on the buildings studied
Buildings Purpose Location Year built Floor area (m2)
Amusement place A Bowring alley Kitakyushu NA NAAmusement place B Pachinko parlor Miyazaki NA 450Beauty academy School Tokyo 2000 2,122Bookstore A Bookstore Kitakyushu 1995 4,046Bookstore B Bookstore Kitakyushu 1966 3,900Bookstore C Bookstore Kitakyushu NA 160City hall City hall Kitakyushu 1959 4,577Congress center Congress Kitakyushu 1991 8,997Department store Department store Kitakyushu NA 25,000High school High school Kitakyushu NA 15,348Hotel A Hotel Kitakyushu 2002 NAHotel B Hotel Kitakyushu 1991 NAHotel C Hotel Akita 1988 3,287Hotel D Hotel Tokyo 1981 84,774Museum A Art museum Kitakyushu 1976 4,443Museum B Museum Kitakyushu 2003 16,947Shopping mall A Shopping mall Miyazaki 2005 28,631Shopping mall B Shopping mall Kitakyushu 1981 7,000Theater A Art theater Kitakyushu 2003 5,666Theater B Event hall Kitakyushu 1994 3,584University A University Kitakyushu 1978 NAUniversity B University Kitakyushu 1966 67,800
NA: not available.
information on these buildings is provided in Table 15.2. The survey was performedin 2004–2006. Some countermeasures were performed in Japan before SBS becamea concern in developed countries. Administrators of buildings with 3,000 m2 ormore of architectural floor space have been obligated to observe ventilation stan-dards by the Act on Maintenance of Sanitation in Buildings. Amusement place B(a pachinko parlor), a beauty academy, and bookstore C in Table 15.2 are outsidethe scope of this law because their floor space is less than 3,000 m2.
15.2.2 Collection and Analysis of Chemicals
The concentrations of VOCs and aldehydes were measured. The chemicals werecollected by a diffusive sampler in all the cases (personal exposure, indoor air, andoutdoor air). A number of samplers for collecting the chemicals were set up at eachsampling site so that the average indoor air condition of the area could be deter-mined. To evaluate the personal exposure level of workers to chemicals, the personalsampler was attached to a worker’s chest during working and non-working hours.After the collection, the VOC samples were stored in a freezer and the aldehydesamples were stored in a refrigerator until they were analyzed. The VOCs wereanalyzed as follows. An activated charcoal in a sampling tube (VOC-SD, Supelco,

272 N. Kunugita et al.
Sigma-Aldrich Japan) was moved to a test tube; 2 ml of carbon disulphide wasadded, and then VOCs were extracted. The VOCs in the extracted solution wereanalyzed by using a capillary gas chromatograph – mass spectrometer apparatus(Hewlett Packard, USA) with an auto sampler. The capillary column used was a60 mm × 0.25 mm Aquatic (GL Sciences, Japan).
Aldehydes were collected by a diffusive sampler (DSD-DNPH, Supelco, Sigma-Aldrich Japan) silica gel impregnated with 2, 4-dinitrophenyl hydrazine. Thealdehydes absorbed on the silica gel were extracted with 3 ml of acetonitrile.The separation and determination were performed by a high-performance liquidchromatography (HPLC) apparatus (Shimadzu LC-10 AD, Japan) using a columnof Wakosil-II 5C18 HG, 250 mm × 4.0 mm (i.d.) (Wako Pure Chemical, Japan).The NO2 absorbed by a filter (Toyo Roshi, Japan) was extracted in a solution ofsulfanilic acid, phosphoric acid, and 0.1wt% N-(1-naphthyl) ethylenediamine dihy-drochloride. The amount of NO2 in the extracted solution was determined by usinga UV-VIS spectrophotometer (Shimadzu UV-2200A, Japan).
15.2.3 Health Survey by Questionnaire
At the same time, as another indicator of the air quality in many of the buildings, ahealth survey for employees was used to investigate the incidence of multiple chem-ical sensitivity (MCS) and the effectiveness of the Quick Environment Exposure andSensitivity Inventory (QEESI) (Miller and Prihoda 1999a, b) in Japanese workers.The QEESI (Japanese version) and a checklist for evaluation of fatigue were usedto examine 410 workers in specific buildings.
15.3 Results
15.3.1 Indoor and Outdoor Air Quality and Personal Exposure
The characteristics of indoor and outdoor air quality in 22 public facilities aresummarized in Table 15.3. To investigate the relationship between indoor andoutdoor air quality, the ratio of indoor to outdoor concentrations of air pol-lutants were also calculated. Formaldehyde shows the highest concentration of18.7 µg/m3 at geometric mean (GM). Other chemicals, including acetaldehyde,toluene, xylene, ethylbenzene, decane, undecane, and limonene show relativelyhigh concentrations of more than 5 µg/m3 at GM. The maximum values oftoluene, styrene, formaldehyde, and acetaldehyde exceed the guideline values of theMHLW, as shown in Table 15.1. However, only a few sampling points exceededthe guideline values, as shown in Figs. 15.1, 15.2, 15.3, 15.4, 15.5, 15.6, 15.7and 15.8.

15 Investigation of Air Pollution in Large Public Buildings in Japan 273
Tab
le15.3
Typ
ical
conc
entr
atio
nsof
air-
poll
utin
gch
emic
als
a Ind
oor
conc
entr
atio
n(µ
g/m
3)
(n=
759)
bO
utdo
orco
ncen
trat
ion
(µg/
m3)
(n=
30)
Per
sona
lex
posu
re(µ
g/m
3)
(n=
332)
Com
poun
dsm
inim
umm
axim
umG
Mm
inim
umm
axim
umG
Ma/
bm
inim
umm
axim
umG
M
Aro
mat
ichy
droc
arbo
nes
Ben
zene
<1.
4378
.79
1.89
<1.
4313
.43
1.71
1.11
<1.
4371
.58
1.78
Tol
uene
<0.
6473
7.51
8.47
<0.
6433
.50
5.13
1.65
<0.
6452
5.59
9.39
Eth
ylbe
nzen
e<
0.56
124.
165.
10<
0.56
20.1
82.
10∗∗∗
2.43
<0.
5699
.21
4.28
m/p
-Xyl
ene
<0.
9173
.44
3.85
<0.
9118
.36
1.62
∗∗∗
2.38
<0.
9111
9.14
3.83
o-X
ylen
e<
2.69
69.4
93.
07<
2.69
14.3
71.
56∗∗∗
1.97
<2.
6986
.14
3.50
1,2,
3-T
rim
ethy
lben
zene
<4.
1714
2.18
2.58
<4.
17N
DN
D<
4.17
177.
662.
581,
2,4-
Tri
met
hylb
enze
ne<
3.43
1322
.35
3.51
<3.
4314
.94
2.15
1.64
<3.
4313
12.9
43.
681,
3,5-
Tri
met
hylb
enze
ne<
2.74
370.
962.
31<
2.74
16.2
51.
621.
43<
2.74
416.
622.
20S
tyre
ne<
4.25
369.
293.
06<
4.25
ND
ND
<4.
2512
3.91
2.66
∗
Ali
phat
ichy
droc
arbo
nes
Hep
tane
<1.
8061
0.61
2.94
<1.
8020
.14
1.60
1.83
<1.
8019
8.28
2.84
Oct
ane
<1.
6810
5.52
1.86
<1.
6810
.36
1.31
1.42
<1.
6835
3.09
2.40
∗∗
Non
ane
<2.
0929
9.12
3.05
<2.
0922
.49
2.09
1.46
<2.
0926
8.30
2.32
∗∗
Dec
ane
<2.
0310
59.1
98.
31<
2.03
175.
864.
761.
74<
2.03
987.
7813
.56
∗∗∗
Und
ecan
e<
8.03
298.
6710
.43
<8.
0363
.39
9.06
1.15
<8.
0311
06.2
112
.52
2,4-
dim
ethy
lpen
tane
<1.
0254
.12
0.98
<1.
029.
241.
050.
93<
1.02
149.
260.
99T
erpe
nes
Alp
ha-p
inen
e<
5.36
311.
411.
69<
5.36
18.4
41.
321.
27<
5.36
1262
.47
2.40
∗∗
Lim
onen
e<
5.78
270.
405.
64<
5.78
7.00
3.05
∗∗
1.85
<5.
7833
3.36
9.53
∗∗∗
Alc
ohol
s1-
But
anol
<0.
9774
.20
1.77
<0.
9710
.58
1.09
1.62
<0.
9713
7.14
1.73
2-E
thyl
-1-h
exan
ol<
1.33
172.
291.
83<
1.33
7.13
0.78
∗∗
2.34
<1.
3345
0.86
1.83
Ket
ones
Met
hyl
ethy
lke
tone
<1.
2910
3.14
1.94
<1.
297.
921.
341.
45<
1.29
39.5
32.
16

274 N. Kunugita et al.
Tab
le15.3
(con
tinu
ed)
a Ind
oor
conc
entr
atio
n(µ
g/m
3)
(n=
759)
bO
utdo
orco
ncen
trat
ion
(µg/
m3)
(n=
30)
Per
sona
lex
posu
re(µ
g/m
3)
(n=
332)
Com
poun
dsm
inim
umm
axim
umG
Mm
inim
umm
axim
umG
Ma/
bm
inim
umm
axim
umG
M
Met
hyl
isob
utyl
keto
ne<
2.29
44.2
61.
49<
2.29
12.2
71.
291.
16<
2.29
37.4
81.
57C
hlor
inat
edor
gani
cco
mpo
unds
Car
bon
tetr
achl
orid
e<
1.12
232.
991.
01<
1.12
13.0
81.
040.
98<
1.12
83.9
51.
151,
2-D
ichl
oroe
than
e<
0.84
17.1
10.
49<
0.84
14.9
20.
540.
90<
0.84
131.
430.
501,
2-D
ichl
orop
ropa
ne<
0.87
9.54
0.45
<0.
87N
DN
D<
0.87
ND
ND
p-D
ichl
orob
enze
ne<
1.07
223.
492.
96<
1.07
54.2
21.
651.
79<
1.07
600.
637.
01∗∗∗
Tri
chlo
roet
hyle
ne<
1.38
11.1
50.
82<
1.38
3.75
0.87
0.94
<1.
384.
560.
74T
etra
chlo
roet
hyle
ne<
1.47
83.2
51.
13<
1.47
7.11
0.70
1.62
<1.
4778
.32
0.75
1,1,
1-T
rich
loro
etha
n<
2.16
8.52
1.15
<2.
16N
DN
D<
2.16
15.0
11.
14D
ibro
moc
hlor
omet
hane
<0.
8440
.03
0.45
<0.
848.
910.
470.
96<
0.84
158.
000.
48C
hlor
ofor
m<
1.35
50.4
51.
18<
1.35
8.86
1.10
1.08
<1.
3579
.89
1.23
Est
ers
Eth
ylac
etat
e<
2.16
491.
982.
62<
2.16
14.1
41.
461.
80<
2.16
1491
.58
4.08
∗∗∗
But
yles
ter
acet
icac
id<
2.18
281.
772.
40<
2.18
9.68
1.79
1.34
<2.
1846
2.70
4.32
∗∗∗
Ald
ehyd
esF
orm
alde
hyde
<1.
9212
8.24
18.6
7<
1.92
38.1
89.
16∗∗∗
2.04
<1.
9221
8.60
28.8
8∗∗∗
Ace
tald
ehyd
e<
1.42
134.
799.
45<
1.42
12.5
93.
32∗∗∗
2.85
<1.
4212
8.40
15.2
9∗∗∗
Tot
alV
OC
s47
.726
86.4
421
4.43
39.0
730
0.42
101.
19∗∗∗
2.12
54.3
230
87.5
229
3.83
∗∗∗
GM
;G
eom
etri
cm
ean.
∗P
<0.
05,∗
∗P
<0.
01,∗
∗∗
P<
0.00
1co
mpa
red
toIn
door
conc
entr
atio
n.

15 Investigation of Air Pollution in Large Public Buildings in Japan 275
0
20
40
60
80
100
120
140
Fo
rmal
deh
yd
e
Am
use
men
t pla
ce A
Am
use
men
t pla
ce B
Bea
uty
aca
dem
yB
oo
kst
ore
AB
oo
kst
ore
BB
oo
kst
ore
C
Cit
y h
all
Co
ng
ress
cen
ter
Dep
artm
ent
sto
re A
Hig
h s
chool
Hote
l A
Hote
l B
Hote
l C
Hote
l D
Muse
um
AM
use
um
B
Sh
op
pin
g m
all
AS
hoppin
g m
all
BT
hea
ter
AT
hea
ter
BU
niv
ersi
ty A
Univ
ersi
ty B
Fig. 15.1 Distribution of formaldehyde concentrations (µg/m3) in various buildings
0
20
40
60
80
100
120
140
Ace
tald
ehy
de
Am
use
men
t p
lace
A
Am
use
men
t p
lace
BB
eau
ty a
cad
emy
Bo
ok
sto
re A
Bo
ok
sto
re B
Bo
ok
sto
re C
Cit
y h
all
Co
ng
ress
cen
ter
Dep
artm
ent
sto
re A
Hig
h s
cho
ol
Ho
tel
A
Hote
l B
Hote
l C
Ho
tel
DM
use
um
AM
use
um
B
Sh
op
pin
g m
all
AS
ho
pp
ing
mal
l B
Th
eate
r A
Th
eate
r B
Univ
ersi
ty A
Univ
ersi
ty B
Fig. 15.2 Distribution of acetaldehyde concentrations (µg/m3) in various buildings

276 N. Kunugita et al.
0
100
200
300
400
500
600
700
800
To
luen
e
Am
use
men
t pla
ce A
Am
use
men
t p
lace
BB
eau
ty a
cad
emy
Bo
ok
sto
re A
Bo
ok
sto
re B
Bo
ok
sto
re C
Cit
y h
all
Co
ng
ress
cen
ter
Dep
artm
ent
store
AH
igh s
chool
Hote
l A
Hote
l B
Hote
l C
Hote
l D
Mu
seum
AM
use
um
B
Sho
ppin
g m
all
AS
hoppin
g m
all
BT
hea
ter
AT
hea
ter
BU
niv
ersi
ty A
Univ
ersi
ty B
Fig. 15.3 Distribution of toluene concentrations (µg/m3) in various buildings
0
100
200
300
400
500
600
Eth
yl
Ace
tate
Am
use
men
t pla
ce A
Am
use
men
t p
lace
BB
eauty
aca
dem
yB
ookst
ore
AB
oo
kst
ore
BB
oo
kst
ore
C
Cit
y h
all
Co
ng
ress
cen
ter
Dep
artm
ent
sto
re A
Hig
h s
cho
ol
Hote
l A
Hote
l B
Hote
l C
Hote
l D
Muse
um
AM
use
um
B
Shoppin
g m
all
AS
hoppin
g m
all
BT
hea
ter
AT
hea
ter
BU
niv
ersi
ty A
Univ
ersi
ty B
Fig. 15.4 Distribution of ethyl acetate concentrations (µg/m3) in various buildings

15 Investigation of Air Pollution in Large Public Buildings in Japan 277
0
100
200
300
400
500
600
700
Hep
tan
e
Am
use
men
t pla
ce A
Am
use
men
t p
lace
BB
eauty
aca
dem
yB
ookst
ore
AB
oo
kst
ore
BB
oo
kst
ore
C
Cit
y h
all
Co
ng
ress
cen
ter
Dep
artm
ent
store
AH
igh s
cho
ol
Ho
tel
A
Ho
tel
BH
ote
l C
Ho
tel
DM
use
um
AM
use
um
B
Sh
oppin
g m
all
AS
hoppin
g m
all
BT
hea
ter
AT
hea
ter
BU
niv
ersi
ty A
Un
iver
sity
B
Fig. 15.5 Distribution of heptane concentrations (µg/m3) in various buildings
0
20
40
60
80
100
120
140
Eth
ylb
enze
ne
Am
use
men
t pla
ce A
Am
use
men
t pla
ce B
Bea
uty
aca
dem
yB
oo
kst
ore
AB
ookst
ore
BB
ookst
ore
C
Cit
y h
all
Co
ng
ress
cen
ter
Dep
artm
ent
sto
re A
Hig
h s
chool
Hote
l A
Hote
l B
Hote
l C
Hote
l D
Mu
seum
AM
use
um
B
Shoppin
g m
all
AS
hoppin
g m
all
BT
hea
ter
AT
hea
ter
BU
niv
ersi
ty A
Univ
ersi
ty B
Fig. 15.6 Distribution of ethylbenzene concentrations (µg/m3) in various buildings

278 N. Kunugita et al.
0
200
400
600
800
1000
1200
1400
1,2
,4-T
rim
ethylb
enze
ne
Am
use
men
t pla
ce A
Am
use
men
t pla
ce B
Bea
uty
aca
dem
yB
ookst
ore
AB
ookst
ore
BB
ookst
ore
CC
ity h
all
Congre
ss c
ente
rD
epar
tmen
t st
ore
AH
igh s
chool
Hote
l A
Hote
l B
Hote
l C
Hote
l D
Muse
um
AM
use
um
BS
hoppin
g m
all
AS
hoppin
g m
all
BT
hea
ter
AT
hea
ter
BU
niv
ersi
ty A
Univ
ersi
ty B
Fig. 15.7 Distribution of 1,2,4-trimethylbenzene concentrations (µg/m3) in various buildings
Most of the chlorinated organic compounds show very low indoor concentra-tions. Excluding p-dichlorobenzene and tetrachloroethylene, the ratios of indoorto outdoor concentrations were almost all one or lower. On the other hand, otherchemicals, especially aromatic hydrocarbons, showed a high indoor-to-outdoorratio, suggesting indoor emission sources for these compounds.
0
500
1000
1500
2000
2500
3000
TV
OC
s
Am
use
men
t pla
ce A
Am
use
men
t pla
ce B
Bea
uty
aca
dem
yB
ookst
ore
AB
oo
kst
ore
BB
oo
kst
ore
CC
ity h
all
Congre
ss c
ente
rD
epar
tmen
t st
ore
AH
igh s
chool
Hote
l A
Hote
l B
Hote
l C
Hote
l D
Muse
um
AM
use
um
BS
hoppin
g m
all A
Shoppin
g m
all
BT
hea
ter
AT
hea
ter
BU
niv
ersi
ty A
Univ
ersi
ty B
Fig. 15.8 Distribution of total VOC (TVOC) concentrations (µg/m3) in various buildings

15 Investigation of Air Pollution in Large Public Buildings in Japan 279
15.3.2 Characteristics of Air Quality and Specific Chemicals
at Each Public Building
Distributions of the concentrations of specific chemicals and total VOCs (TVOCs)in various buildings are shown in Figs. 15.1, 15.2, 15.3, 15.4, 15.5, 15.6, 15.7 and15.8 by box and whisker charts. The bottom, mid-line, and top of the box indicatethe 25th percentile, median, and 75th percentile, respectively. The whiskers showthe 10th and 90th percentiles.
In Figs. 15.1 and 15.2, amusement facility B showed relatively high indooraldehyde concentrations during work hours, especially acetaldehyde, which wasmuch higher than during non-work hours and in outdoor air (data not shown).Amusement facility B is a pachinko parlor that permitted guests to smoke. Theparlor was 50% full when we investigated (about 150 customers were playing).Cigarette smoke may cause the high concentration of aldehyde in this location.Because this building has less than 3,000 m2 of floor space, it is outside the scopeof the Act on Maintenance of Sanitation in Buildings. Thus, ventilation standardsare not enforced for this building. As shown in Fig. 15.1, few measurements at otherbuildings, including the Congress Center and hotel A, showed high concentrations(over 100 µg/m3) of formaldehyde.
Figure 15.3 shows that the toluene concentration is high in some public build-ings, especially in small bookstore C, which is also outside the scope of the Acton Maintenance of Sanitation in Buildings. The major source of toluene is con-sidered to be printing inks used in books. Compared to other VOCs, toluene andethylbenzene were generally detected in very high concentrations at bookstores.Large bookstores A and B also showed high concentrations of toluene, but thesevalues are significantly less than the value of bookstore C. Because bookstores Aand B have over 3,000 m2 of floor space, ventilation standards are enforced in thesebuildings. In all the other buildings except department store A, hotel C, and museumB, all measurements were below the guideline values.
As shown in Fig. 15.4, ethyl acetate was detected in relatively high concentra-tion in the beauty academy, and the concentration of butyl ester acetic acid wasalso relatively high. These tendencies were observed at the barber shop and beautyparlor in a university hospital, suggesting the influence of hair-dressing and cos-metic materials. At theater A, some sampling points show high concentrations ofheptane (Fig. 15.5), ethylbenzene (Fig. 15.6), butanol, octane, tetrachloroethyleneand methyl isobutyl ketone, these probably arise from many components, such asthe carpeting, wall, and furniture.
The air quality of a bowling alley was measured (amusement place A). Of theVOCs, the concentrations of benzene (data not shown), toluene (Fig. 15.3), andxylene (data not shown) were all low, whereas those of nonane, decane, andundecane were relatively high (data not shown), and trimethylbenzene was found invery high concentration (Fig. 15.7). The personal exposure level showed the sametrend as that of indoor air, and the level during work hours was higher than thatduring non-work hours. The high concentrations of some VOCs may come fromwax on the alley and floor.

280 N. Kunugita et al.
We measured air quality at department store A, a seven-story building with atotal floor area of 25,000 m2. Different VOCs were detected on each floor. Manykinds of VOCs, including toluene, ethyl acetate, ethylbenzene, methylethylketone,p-dichlorobenzene, styrene, limonene, and benzene, showed higher concentrationsduring work hours compared to other buildings. This may be due to the many kindsof merchandise sold at the department store.
The styrene concentration was less than the guideline value in almost all theplaces we investigated. Only two samples in the department store showed higherconcentrations of p-dichlorobenzene than the guideline value. This may be due tothe presence of moth repellents and air fresheners.
The Japanese government established a standard for NO2 in the outdoor environ-ment of 40–60 ppb for 1 day’s average 1-h value. Only a few measurements showeda higher value than the environmental air quality standards. Specifically, NO2 wasobserved at high concentrations in places where combustion tools were used, suchas the restaurant in the department store (data not shown).
We also measured physical parameters (data not shown) such as temperature,relative humidity, noise, wind velocity, illumination, and particulate matter con-centration in the buildings and found that those parameters were generally at anappropriate level except in the pachinko parlor. There, particulate matter exceededthe standard level, probably due to the smoking by customers, and the noise levelwas high, due to the nature of the gaming device.
15.3.3 Comparison of Indoor Air Quality and Personal Exposure
Of the aldehydes, the concentration of formaldehyde was twice as high as that ofacetaldehyde in all measurements. The personal exposure level of about 80–90% forthese aldehydes was parallel to that of indoor air. However, the personal exposurelevel of 10 ∼ 20% for the remainder was obviously higher than the indoor concen-tration (Fig. 15.9). This is thought to reflect the influence of activities of individuals,including smoking, and factors in the working environment, such as working nearemission sources.
Personal exposure to these two aldehydes in non-work hours (mostly spent athome) was higher than that in work hours (at the office), as shown in Fig. 15.10.These results suggest that there are more emission sources at home than at theoffice. Alternatively, the ventilation system required by the Act on Maintenanceof Sanitation in Buildings has decreased the density of aldehyde concentrations inthe office.
15.4 Discussion
15.4.1 Characteristics of Air Quality in Japanese Public Buildings
By using diffusive samplers, we were able to measure 32 kinds of VOCs,formaldehyde, and acetaldehyde. The indoor air quality in the large public buildings

15 Investigation of Air Pollution in Large Public Buildings in Japan 281
0 50 100 150 200 250.01
.1
1
510
2030
50
7080
9095
99
99.9
99.99
Personal exposure at officeIndoor air at office
Formaldehyde (µg/m3)
(%)
0 20 40 60 80 100 120.01
.1
1
510
2030
50
7080
9095
99
99.9
99.99
Personal exposure at officeIndoor air at office
Acetaldehyde (µg/m3)
(%)
Fig. 15.9 Cumulative frequency distribution for formaldehyde (left) and acetaldehyde (right) con-centrations. Open and closed circles show personal exposure during working hours and indoor airconcentration at office, respectively
we investigated was maintained in good condition. This might be due to Japaneselegal requirements that administrators of large buildings meet ventilation standardsand regularly measure the indoor air environment in accordance with the Act onMaintenance of Sanitation in Buildings. Depending on the nature of the buildings,however, the kind and concentration of VOCs varied. Most sampling points in thebuildings did not exceed the guideline values for formaldehyde (100 µg/m3) and
0 50 100 150 200 250.01
.1
1
510
2030
50
7080
9095
99
99.9
99.99
Personal exposure at office
Formaldehyde (µg/m3)
(%)
0 20 40 60 80 100 120.01
.1
1
510
2030
50
7080
9095
99
99.9
99.99
Personal exposure at office
Acetaldehyde (µg/m3)
(%)
Personal exposure at homePersonal exposure at home
Fig. 15.10 Cumulative frequency distribution for formaldehyde (left) and acetaldehyde (right)concentrations. Open and closed circles show personal exposure during working hours (at office)and non-working hours (at home), respectively

282 N. Kunugita et al.
acetaldehyde (48 µg/m3), suggesting that the indoor air quality of all the buildingsis good in terms of pollution by aldehydes.
The total VOCs in some buildings showed high concentrations (Fig. 15.8). Thetoluene in bookstores may come from printing ink used in books. The trimethylben-zne in the bowling alley (amusement place A) was considered to come from wax onthe floor. The managers of these buildings may need to consider better ventilation.
Overall, air quality in various large buildings and employees’ personal exposurelevels were relatively good, especially for chemicals that have guideline levels setby the MHLW. However, we must note that there were some exceptional cases, suchas toluene in bookstores and aldehyde and noise in the pachinko parlor.
15.4.2 Characteristics of Air Quality in Japanese Individual
Houses
On the other hand, what is the indoor air quality in individual houses in Japan?Recently, Osawa and Hayashi reported the status of chemical pollution of indoorair in Japanese houses based on a nationwide field survey from 2000 to 2005(Osawa and Hayashi 2009). A survey in 2000 revealed that the indoor concentra-tions of formaldehyde and toluene exceeded the guidelines shown in Table 15.1 inmore than 27 and 12% of the houses surveyed, respectively. These results led tothe development of various countermeasures for improving the indoor air environ-ment, such as amending the Building Standard Law (BSL) to a performance-basedregulation and enacting the Housing Quality Assurance Act, which provides ahousing performance indication system. These countermeasures decreased the lev-els of indoor chemicals, especially formaldehyde and toluene, year by year, asshown in Fig. 15.11. In addition to improvements in building materials and thenew installation of continuous ventilation systems under the amended BSL, thesesuccesses depend on many efforts for the improvement of indoor air quality by the
0
20
40
60
80
100
120
140
160
2000 2001 2002 2003 2004 2005
formaldehydetoluenexyleneethylbenzenestyleneactaldehyde
Co
nce
ntr
atio
n (
µg
/m3)
Fig. 15.11 Changes in the indoor concentration of VOCs in Japanese houses

15 Investigation of Air Pollution in Large Public Buildings in Japan 283
government, private construction companies, manufacturers of building materials,and various other interested parties.
In addition, the countermeasures are ongoing, expanding the target fromformaldehyde, a major pollutant at the time, to other VOCs and microbial volatileorganic compounds (MVOCs) (Kilburn 2009; Kishi et al. 2009; WHO 2009).
While the changes in severe sick house problems in our country such as rapid airtightening, and heavy use of pollutant-emitting materials are not necessarily sharedin other countries, changes in the residential environment are shared across hot andhumid East Asia. Therefore, understanding and evaluation of housing conditions isexpected to have considerable application in the future.
15.4.3 Questionnaire Survey of Workers by QEESI
Three criteria used in the QEESI (symptom severity, chemical intolerance, and otherintolerance) were evaluated in this study (Hojo et al. 2009). Clinical histories werealso surveyed. Responses were obtained from 368 (89.8%) of 410 workers (Manabeet al. 2008).
The results showed that 132 individuals (35.9%) have been diagnosed as havingallergies. Only two individuals (0.5%) were found to be MCS patients, and nonewere SBS patients. Applying the “high” criteria of the QEESI to the standard ofMiller and Prihoda (1999a, b), we determined that only four individuals (1.1%) metall three criteria, and 17 individuals (4.6%) met two of the three criteria, as shownin Fig. 15.12 . These values are the same as the values in previous Japanese reports(Hojo et al. 2008; Katoh et al. 2007) and less than those reported by Miller andPrihoda (1999a, b).
The QEESI score of allergic persons was higher than that of non-allergic persons(Fig. 15.13). Among non-allergic persons, those who scored high for accumulation
0
2
4
6
8
10
12
14
16
%
2 criteria 3 criteria
Miller et al. (N = 76)
Uchiyama et al. (N = 2851)
Katoh et al.
A Co. (N = 1310)
Katoh et al.
B Co. (N = 894)
Current study (N = 368)
Fig. 15.12 Proportion of subjects who met two or three criteria (symptom score, chemicalintolerance score, and other intolerance score) of the QEESI questionnaire

284 N. Kunugita et al.
Fig. 15.13 Relationship of allergy and work load to QEESI score (chemical intolerance score,symptom score, and other intolerance score). Low, Med and High indicate the workload assessedby a checklist on the accumulation of fatigue developed by the Ministry of Health, Labor, andWelfare, Japan
of fatigue in the checklist showed a high score in the QEESI. These findings indicatethat the QEESI score tends to increase with workload and to be high in individualswith allergies. Therefore, careful consideration is required when QEESI is used toscreen MCS patients in Japan.
15.4.4 Aldehyde Concentration Under Specific Circumstances
in Medical Laboratories
The concentration of formaldehyde is quite high under specific circumstances,including in medical laboratories. Formaldehyde is widely used during disinfec-tion procedures or embalming of bodies in the medical field. Medical studentsare exposed to formaldehyde during their dissection course. First, we evalu-ated formaldehyde exposure that occurred in a gross anatomy laboratory with ageneral ventilation system. Formaldehyde in the air was sampled by an active 2,4-dinitrophenylhydrazine (DNPH)-silica gel cartridge, extracted with acetonitrile, andanalyzed by HPLC. The GM formaldehyde concentration was 20–93 ppb in theanatomy laboratory before dissection began. After dissection began, the highestGM concentrations were 1,011–1,380 ppb (Kunugita et al. 2004). This suggests

15 Investigation of Air Pollution in Large Public Buildings in Japan 285
we should reduce formaldehyde exposure for medical students and lecturers dur-ing gross anatomy dissection courses. Next, we improved the ventilation by using alocal ventilation system that included the existing ventilation assigned to the labo-ratory and a newly developed local ventilation apparatus for each dissection table.After these improvements, the GM concentrations were 100 ppb or less (Yamatoet al. 2005). Significant decreases were also observed in symptoms of thirst, burn-ing eyes, itchy eyes, feeling uncomfortable, and fatigue during exposure comparedwith the symptoms before the ventilation system was improved.
15.4.5 Biological Evaluation in Mice Exposed to Low Dose
of Chemicals
To understand the effect of low dose exposure of VOCs on neuro-immuno-endocrinenetworks, we have studied many kinds of animal experiments (Ahmed et al. 2007a,b; Fujimaki et al. 2004a, b, 2007; Hayashi et al. 2004; Sari et al. 2004, 2005;Tsukahara et al. 2006; Win-Shwe et al. 2010a, b; Yamamoto et al. 2009). Our studyshowed that long-term exposure to low level of formaldehyde and the allergic con-dition induced by OVA sensitization may act to the hypothalamo-pituitary-adrenalgland (HPA)-axis as a stressor (Hayashi et al. 2004; Sari et al. 2004, 2005). Exposureto 80 and 400 ppb formaldehyde significantly increased the brain NGF levels inthe OVA immunized mice (Fujimaki et al. 2004a). We have also demonstrated thatlow-level toluene and formaldehyde exposure affects memory function-related geneexpression in the hippocampus of C3H/HeN mice (Ahmed et al. 2007a, b).
Long term exposure to low levels of VOCs including formaldehyde and toluenecan disturb normal homeostatic response to enhance neural network, and coadminis-tration with immunological stimuli can activate it abnormally, resulting in inductionof neurogenic and immunogenic inflammation in the brain.
15.5 Conclusions
The indoor air quality in large public buildings we investigated was maintained ingood condition. The level of personal exposure generally showed the same ten-dency as the indoor air pollution level. This might be due to the Japanese legalrequirements that administrators of large-scale buildings meet ventilation standardsand regularly measure the indoor air environment in accordance with the Act onMaintenance of Sanitation in Buildings. Although the lifestyle and engineeringmethods used in indoor and outdoor structures are not similar elsewhere, the livingenvironment has changed in similar ways in many countries. Therefore, understand-ing and evaluating these conditions is expected to have considerable application inthe future.
The basis of indoor air quality control is suppressing pollutants at the sourceby regulating materials and eliminating pollutants by securing ventilation. Neitherof these measures alone is sufficient; both must be used in good balance withintechnological and economic restrictions.

286 N. Kunugita et al.
Acknowledgments This work was supported by a Grant of the Ministry of Health, Labour andWelfare of Japan and by Grant-in-Aid for Scientific Research (B) from the Japan Society for thePromotion of Science (JSPS).
References
Ahmed S, Tsukahara S, Win-Shwe TT, Yamamoto S, Kunugita N, Arashidani K, FujimakiH (2007b) Effects of low-level formaldehyde exposure on synaptic plasticity-related geneexpression in the hippocampus of immunized mice. J Neuroimmunol 186:104–111.
Ahmed S, Win-Shwe TT, Yamamoto S, Tsukahara S, Kunugita N, Arashidani K, Fujimaki H(2007a) Increased hippocampal mRNA expression of neuronal synaptic plasticity relatedgenes in mice chronically exposed to toluene at a low-level human occupational-exposure.Neurotoxicology 28:168–174.
Azuma K, Uchiyama I, Ikeda K (2007) The risk screening for indoor air pollution chemicals inJapan. Risk Anal 27:1623–1638.
Ciencewicki J, Jaspers I (2007) Air pollution and respiratory viral infection. Inhal Toxicol19:1135–1146.
Fujimaki H, Kurokawa Y, Kakeyama M, Kunugita N, Fueta Y, Fukuda T, Hori H, Arashidani K(2004a) Inhalation of low-level formaldehyde enhances nerve growth factor production in thehippocampus of mice. Neuroimmunomodulation 11:373–375.
Fujimaki H, Kurokawa Y, Kunugita N, Kikuchi M, Sato F, Arashidani K (2004b) Differentialimmunogenic and neurogenic inflammatory responses in an allergic mouse model exposed tolow levels of formaldehyde. Toxicology 197:1–13.
Fujimaki H, Yamamoto S, Win-Shwe TT, Hojo R, Sato F, Kunugita N, Arashidani K (2007) Effectof long-term exposure to low-level toluene on airway inflammatory response in mice. ToxicolLett 168:132–139.
Gomzi M, Bobic J, Radosevic-Vidacek B, Macan J, Varnai VM, Milkovic-Kraus S, Kanceljak-Macan B (2007) Sick building syndrome: Psychological, somatic, and environmental determi-nants. Arch Environ Occup Health 62:147–155.
Hayashi H, Kunugita N, Arashidani K, Fujimaki H, Ichikawa M (2004) Long-term exposure tolow levels of formaldehyde increases the number of tyrosine hydroxylase-immunopositiveperiglomerular cells in mouse main olfactory bulb. Brain Res 1007:192–197.
Hojo S, Ishikawa S, Kumano H, Miyata M, Sakabe K (2008) Clinical characteristics of physician-diagnosed patients with multiple chemical sensitivity in japan. Int J Hyg Environ Health211:682–689.
Hojo S, Sakabe K, Ishikawa S, Miyata M, Kumano H (2009) Evaluation of subjective symptomsof Japanese patients with multiple chemical sensitivity using QEESI. Environ Health Prev Med14:267–275.
Jarke H, Dravnieks A, Gordon S (1981) Organic contaminants in indoor air and their relation tooutdoor contaminants. ASHRAE Trans 87:153–166.
Jia C, Batterman S, Godwin C (2008) VOCs in industrial, urban and suburban neighbor-hoods, part 1: Indoor and outdoor concentrations, variation, and risk drivers. Atmos Environ42:2083–2100.
Katoh T, Kuroda Y, Komiya Y (2007) Questionnaire survey of factory workers regarding chemi-calsensitivity: Sangyo eiseigaku zasshi. J Occup Health 49:98–99.
Kilburn KH (2009) Neurobehavioral and pulmonary impairment in 105 adults with indoor expo-sure to molds compared to 100 exposed to chemicals. Toxicol Ind Health 25:681–692.
Kishi R, Saijo Y, Kanazawa A, Tanaka M, Yoshimura T, Chikara H, Takigawa T, MorimotoK, Nakayama K, Shibata E (2009) Regional differences in residential environments and theassociation of dwellings and residential factors with the sick house syndrome: A nationwidecross-sectional questionnaire study in Japan. Indoor Air 19:243–254.
Kunugita N, Nakashima T, Kikuta A, Kawamoto T, Arashidani K (2004) Exposure to formalde-hyde during an anatomy dissecting course. J UOEH 26:337–348.

15 Investigation of Air Pollution in Large Public Buildings in Japan 287
Manabe R, Kunugita N, Katoh T, Kuroda Y, Akiyama Y, Yamano Y, Uchiyama I, ArashidaniK (2008) Questionnaire survey of workers in specific buildings regarding multiple chemicalsensitivity. Nippon Eiseigaku Zasshi 63:717–723.
Miller CS, Prihoda TJ (1999a) The environmental exposure and sensitivity inventory (EESI):A standardized approach for measuring chemical intolerances for research and clinicalapplications. Toxicol Ind Health 15:370–385.
Miller CS, Prihoda TJ (1999b) A controlled comparison of symptoms and chemical intolerancesreported by gulf war veterans, implant recipients and persons with multiple chemical sensitivity.Toxicol Ind Health 15:386–397.
Osawa H, Hayashi M (2009) Status of the indoor air chemical pollution in japanese houses basedon the nationwide field survey from 2000 to 2005. Build Environ 44:1330–1336.
Osman LM, Douglas JG, Garden C, Reglitz K, Lyon J, Gordon S, Ayres JG (2007) Indoor airquality in homes of patients with chronic obstructive pulmonary disease. Am J Respir CritCare Med 176:465–472.
Park JS, Ikeda K (2006) Variations of formaldehyde and VOC levels during 3 years in new andolder homes. Indoor Air 16:129–135.
Sari DK, Kuwahara S, Furuya M, Tsukamoto Y, Hori H, Kunugita N, Arashidani K, FujimakiH, Sasaki F (2005) Hypothalamo-pituitary-adrenal gland axis in mice inhaling toluene PriorTo low-level long-term exposure to formaldehyde. J Vet Med Sci/Jpn Soc Vet Sci 67:303–309.
Sari DK, Kuwahara S, Tsukamoto Y, Hori H, Kunugita N, Arashidani K, Fujimaki H, Sasaki F(2004) Effect of prolonged exposure to low concentrations of formaldehyde on the corticotropinreleasing hormone neurons in the hypothalamus and adrenocorticotropic hormone cells in thepituitary gland in female mice. Brain Res 1013:107–116.
Takigawa T, Wang BL, Saijo Y, Morimoto K, Nakayama K, Tanaka M, Shibata E, Yoshimura T,Chikara H, Ogino K, Kishi R (2010) Relationship between indoor chemical concentrations andsubjective symptoms associated with sick building syndrome in newly built houses in japan.Int Arch Occup Environ Health 83:225–235.
Taneja A, Saini R, Masih A (2008) Indoor air quality of houses located in the urban environmentof Agra, India. Ann NY Acad Sci 1140:228–245.
Tsukahara S, Yamamoto S, Win-Shwe TT, Ahmed S, Kunugita N, Arashidani K, Fujimaki H(2006) Inhalation of low-level formaldehyde increases the bcl-2/bax expression ratio in thehippocampus of immunologically sensitized mice. Neuroimmunomodulation 13:63–68.
WHO (2009) WHO Guidelines for Indoor Air Quality: Dampness and Mould. WHO RegionalOffice for Europe, Copenhagen.
Win-Shwe TT, Kunugita N, Yamamoto S, Arashidani K, Fujimaki H (2010a) Strain differ-ences influence N-methyl-D-aspartate receptor subunit gene expression in the olfactorybulb of an allergic mouse model following Toluene exposure. Neuroimmunomodulation 17:340–347.
Win-Shwe TT, Tsukahara S, Yamamoto S, Fukushima A, Kunugita N, Arashidani K, FujimakiH (2010b) Up-regulation of neurotrophin-related gene expression in mouse hippocampusfollowing low-level toluene exposure. Neurotoxicology 31:85–93.
Yamamoto S, Win-Shwe TT, Yoshida Y, Kunugita N, Arashidani K, Fujimaki H (2009)Suppression of th1- and th2-type immune responses in infant mouse spleen after prenatal andpostnatal exposure to low-level toluene and peptidoglycan. Inhal Toxicol 21:793–802.
Yamato H, Nakashima T, Kikuta A, Kunugita N, Arashidani K, Nagafuchi Y, Tanaka I (2005)A novel local ventilation system to reduce the levels of formaldehyde exposure during agross anatomy dissection course and its evaluation using real-time monitoring. J Occup Health47:450–453.
Zuraimi MS, Tham KW, Chew FT, Ooi PL (2007) The effect of ventilation strategies of childcare centers on indoor air quality and respiratory health of children in Singapore. Indoor Air17:317–327.

Chapter 16
Assessment of Chemical Hazards in SickBuilding Syndrome Situations: Determinationof Concentrations and Origin of VOCs in IndoorAir Environments by Dynamic Samplingand TD-GC/MS Analysis
Eva Gallego, Francisco Javier Roca, José Franciso Perales,
and Xavier Guardino
16.1 Introduction
Nowadays, people spend approximately between 80 and 90% of the hours of theday indoors. So, the subgroup of population more sensitive to contaminants is atmuch greater risk of having adverse health effects deriving out of the chronic expo-sition to low levels of indoor air pollutants (Bernstein et al. 2008; Ashmore andDimitroulopoulou 2009; Jo and Sohn 2009; Xu et al. 2010). Volatile organic com-pounds (VOCs), defined as having a boiling point that ranges between 50 and 260 C(WHO 1989), are a highly diverse class of chemical contaminants; and between50 and 300 compounds may be found in non-industrial indoor air environments(Mølhave 1992; Johansson 1999; Gallego et al. 2008a; 2009a). Due to their lowboiling point, VOCs pass to indoor air in vapour form.
High levels of VOCs may be found indoors due to several causes, e.g. type ofbuilding materials, poor function of the ventilating system, recirculation of ventila-tion air, moisture damage of building materials or the development in the building ofnot advisable activities (Lundgren et al. 1999). VOC have been generally less stud-ied than other indoor air contaminants, and the knowledge of the adverse effects onhealth associated to indoor air VOCs concentrations is nowadays limited (Edwardset al. 2001; Venn et al. 2003; Järnström et al. 2006; Liang and Liao 2007; Bernsteinet al. 2008; Rios et al. 2009; Yu et al. 2009). On the other hand, the different expo-sition locations to VOCs (e.g. homes, work environment, public buildings, vehicles,outdoor air) and their different pollution loads lead to uncertainties when an eval-uation of personal exposure is to be done (Sexton et al. 2004; Peng and Lin 2007;Ashmore and Dimitroulopoulou 2009).
E. Gallego (B)Laboratori del Centre de Medi Ambient, Universitat Politècnica de Catalunya (LCMA-UPC),08028 Barcelona, Españae-mail: [email protected]
289S.A. Abdul-Wahab (ed.), Sick Building Syndrome,DOI 10.1007/978-3-642-17919-8_16, C© Springer-Verlag Berlin Heidelberg 2011
290 E. Gallego et al.
Therefore, concentration controls are important in air quality determination, andVOCs levels in indoor air should be legislated and maintained as low as reasonablyachievable (ALARA), to diminish the organic pollution load in these environments(EC 1997a; Hodgson et al. 2000; Righi et al. 2002; Mølhave 2003). In additionto that, accurate pollution controls would improve health risk assessments and therisk management decisions taken in relation to indoor contamination (Sexton et al.2004). In this way, the procedure for sampling and analysis low concentrations ofVOCs in indoor air building samples has been standardized (Gallego et al. 2009a).
16.2 Health Effects and Reactions Caused by Exposition
to Low Levels of VOCs
Several human VOCs exposure studies have been carried out to determine pos-sible health effects (Wolkoff 1995; Andersson et al. 1997; Pappas et al. 2000;Mølhave 2001; Zeliger 2003; Hey et al. 2009), as well as in-vitro experiments todetermine the role of VOCs in inflammatory and immuno-modulatory effects inhuman tissues (Wichmann et al. 2005; Lehmann et al. 2008; Pariselli et al. 2009).However, the VOCs concentrations experimented are relatively high and far fromthe usual dwelling concentrations, making difficult the extrapolation between theresults obtained and the real effects of indoor air VOCs concentrations (Holcomband Seabrook 1995; Wolkoff et al. 1997).
In addition to that, VOCs concentrations that trigger adverse reactions in targetpopulation (e.g. sick building syndrome and multiple chemical sensitivity affectedpeople), are generally tolerated by the general population (Zeliger 2008). On theother hand, the evaluation of health issues caused by complex VOCs mixtures is alsodifficult because their effects may be additive, synergistic, antagonist or even inde-pendent for each other, making hardly predictable the toxicological consequences ofVOCs exposition to human wellness (Mølhave et al. 1997). However, a daily expo-sure to multiple chemicals (e.g. VOCs) could contribute to an increasing prevalenceof several illnesses (Pappas et al. 2000; Bernstein et al. 2008; Rios et al. 2009),such as asthma, medically unexplained symptoms and childhood cancer (Zhang andSmith 2003).
16.2.1 Sensory Irritation and Odour
Environmental pollutants can act as irritants to the human organism. Pollutants cancause biological responses from the different components that comprise the humandefense system, being the responses different depending on the susceptibility ofeach individual (Bascom et al. 1995). Poor indoor air quality has been stronglyassociated to both irritation and odour nuisances (Pappas et al. 2000; Mølhave2001; Wolkoff et al. 2006). On the other hand, in relation to outdoor air quality,

16 Assessment of Chemical Hazards in Sick Building Syndrome Situations 291
the exposure to traffic-related VOCs has been linked to respiratory tract irritation(phlegm and chest tightness), as well as to sore throat, cough and asthma (Kongtipet al. 2006; Ana et al. 2009). In addition to that, a 45% of the compounds deter-mined in a dwelling where complaints were related to industrial activities, presentedcombined R-phrases associated to irritation of the eyes, skin and respiratory system(Gallego et al. 2009a).
16.2.2 Sick Building Syndrome
The term sick building syndrome (SBS) describes the reduction of comfort andhealth status of the occupants of a whole building or a part of it, where the residentshave complaints with the perceived indoor air quality and relate them to possiblehealth effects (Maroni et al. 1995). The symptomatology of SBS is varied and com-plex, but nasal, ocular, oropharyngeal, cutaneous and general (tiredness, headache,etc.) manifestations are the five most common symptoms (Guo et al. 2004). Thecauses of SBS remain unknown and further investigations have to be done (Eberlein-Königa et al. 2002; Dalton 2003) but some factors have been described to contributein SBS, such as outdoor and indoor chemical contaminants (e.g. VOCs), biologicalcontaminants and inadequate ventilation (WHO 1982; WHO 1986; EC 1989; Wanget al. 2008).
16.2.3 Multiple Chemical Sensitivity
People repetitively exposed to long-term relatively high levels of VOCs, speciallythe subgroup of population more sensitive to VOCs concentrations found indoors,can modulate their physiological response to a given VOC (Hummel et al. 1999;Wolkoff and Nielsen 2001; Chun et al. 2010), and achieve multiple chemical sen-sitivity (MCS) (Levy 1997; Shorter 1997; Zeliger 2008). Multiple symptoms (e.g.chest pain, dry eyes, anxiety, headache, nausea) can appear to affected people whenthey are exposed to low levels of VOCs, generally tolerated by healthy popula-tion (Zeliger 2008). MCS can implicate disruptions in immunological and/or allergyprocesses, alterations in nervous system functions, changes in biochemical or bio-transformation capacities and changes in psychological and/or neurobehavioralfunctions in human organisms (Winder 2002).
16.3 Sources of VOCs in Indoor Air
Most indoor air pollution comes from sources inside the building, such as adhesives,carpeting, building materials, tobacco smoke, wood products or cleaning products,which may emit VOCs (Knöppel and Schauenburg 1989; Seltzer 1995; Salthammer1997; Jones 1999; Hodgson et al. 2000; Jensen et al. 2001; Reiser et al. 2002;

292 E. Gallego et al.
Zhang and Xu 2002; Jia et al. 2008a; Katsoyiannis et al. 2008). However, the build-ing design and the ventilation applied to indoor environments (both natural and/ormechanical) would also be a determinant in the ingress of outdoor pollution indoors(Seltzer 1995; Olson and Corsi 2002; Ashmore and Dimitroulopoulou 2009).
Outdoor air that enters the building through poorly located air intake vents, win-dows and other openings can also be the main source of indoor air pollution for somecontaminants, for example, pollutants form motor vehicle exhausts, plumbing vents,building exhausts (kitchen and bathroom exhausts) and combustion products froma nearby garage (EC 1989; Mølhave 1991a; EC 1997b; Mølhave 1999; Weschlerand Shields 2000; Zuraimi et al. 2003; Weisel et al. 2005; Batterman et al. 2007).In addition to that, emission of odorous VOCs from heating, ventilating and air con-ditioning (HVAC) HVAC filters have been observed, being these compounds associ-ated to the dust layer in the filter and the microbial growth (Seppänen and Fisk 2002;Fisk et al. 2002; Hummelgaard et al. 2007; Hyttinen et al. 2007; Yu et al. 2009).
Nevertheless, it has to be taken into account that the entrance of outdoor airindoors due to its infiltration through the building fabric has decreased in the lastdecades. Improvements in buildings airtightness (better building techniques and newmaterials) have been applied to reduce energy costs and maintain comfortable tem-peratures indoors (Yu et al. 2009), as well as to maintain good levels or indoor airquality (Ashmore and Dimitroulopoulou 2009). However, an increase in artightnesscan also decrease natural ventilation rates in dwellings not provided with HVACsystems, leading to an increase of pollution indoors due to the emission of VOCsfrom building materials (Hodgson et al. 2000; Jia et al. 2008a; Kim et al. 2008; Yuet al. 2009).
The knowledge of VOCs concentrations and its sources in buildings is a keyparameter to regulate indoor air quality and establish effective pollution sourcecontrol strategies and energy-efficient ventilation guidelines (Zuraimi et al. 2003).Consequently, chemical control based in VOCs adsorption onto solid sorbents fol-lowed by thermal desorption coupled to gas chromatography/mass spectrometry is areliable methodology to identify and quantify VOCs concentrations indoors (Ribeset al. 2007; Gallego et al. 2008a; b; Gallego et al. 2009a; b).
16.3.1 Indoor Sources
Building materials are among the most important VOCs emitters in indoor envi-ronments (EC 1992; Maroni et al. 1995). Furniture and furniture coatings havebeen found to cause an increase of the levels of VOCs indoors, especially whenlow air exchange rates are applied to the building (e.g. the absence of HVAC sys-tems) (Salthammer 1997; Chan et al. 2009). In addition to that, household products(e.g. detergents and waxes) are also an important source of VOCs indoors. It hasbeen observed that the absence/presence of water in its composition is an importanttrigger of VOCs emissions (Knöppel and Schauenburg 1989).
On the other hand, human activity related processes (e.g. cleaning and cooking)can also be important sources of VOCs in indoor air (Wolkoff et al. 2006). Hence,

16 Assessment of Chemical Hazards in Sick Building Syndrome Situations 293
due to the differences existing in heating and cooking, indoor VOCs sources derivedfrom these activities would be different in developed and in developing countries,as well as between people from different socio-economic conditions (Godish 2001;Rehfuess et al. 2006; Ashmore and Dimitroulopoulou 2009). The use of biomassfuels inside the building to cook and/or to heat the dwelling is one of the main causesof bad indoor air quality and poor health worldwide (WHO 2002; Prüs-Üstüm andCorvalán 2006; WHO 2006).
In addition to that, a garage directly connected to the house has been identi-fied as one of the most influential factors in indoor air pollution (Duarte-Davidsonet al. 2001; Ilgen et al. 2001a; Emmerich et al. 2003; Batterman et al. 2006; 2007;Gallego et al. 2008b; Jia et al. 2008a). Apart from the VOCs released from gas-firedengines, other products present in garages (e.g. paints, varnishes, solvents) can alsoemit pollution into the indoor environment of the garage and consequently to theattached house (Emmerich et al. 2003). Tobacco smoke is another important sourceof VOCs indoors, which can increase benzene concentration in indoor air (Edwardsand Jantunen 2001; Schlink et al. 2004; Gallego et al. 2008c; Jia et al. 2008a).
Moreover, the professional activities developed in buildings (e.g. offices,libraries) are also noteworthy to the burden of VOCs found in these indoor environ-ments (Zuraimi et al. 2004). Desktop and notebook computers, monitors, printersand copiers are VOCs emitters (Destaillats et al. 2008).
16.3.2 Outdoor Sources
Outdoor air is also a known cause of indoor air pollution (Seltzer 1995; Saarela et al.2003; Jia et al. 2008a; Chan et al. 2009). Industries, power plants, refineries, gasstations and major roads would be potential VOCs sources for indoor air (Seltzer1995; Chan et al. 2009). However, the proximity to these sources is not alwaystranslated into higher levels of VOCs indoors (Jia et al. 2008a), as other factors suchas environmental variables (e.g. temperature, humidity, wind direction and windspeed) can alter VOCs concentrations as well as carry them farther from the nearestplace, creating annoyance in locations far away from the original source (Gallegoet al. 2008a; b). Nevertheless, traffic density is an important source of benzene,toluene and xylenes (BTX) indoors, as generally higher concentrations of BTX andother VOCs are found in indoor environments in dwellings located in high trafficdensity areas (Baek et al. 1997; Mohamed et al. 2002; Zuraimi et al. 2003; Gallegoet al. 2008c; Jia et al. 2008a).
16.3.3 Seasonal Variations
Seasonal patterns in indoor air VOCs concentrations have been observed in severalstudies (Baek et al. 1997; Ilgen et al. 2001b; Schlink et al. 2004; Gallego et al.2008c; Jia et al. 2008a). Generally, winter time present higher VOCs concentrations

294 E. Gallego et al.
than summer time (Jia et al. 2008b), mainly owing to higher ventilation rates duringsummer (Schneider et al. 2001), and being the observed summer concentrationsup to three to four times higher. However, the type of the room evaluated and theindividual VOC considered could vary this seasonal pattern (Schlink et al. 2004).
16.3.4 New and Established Buildings Differences
An important percentage of the complaints related to indoor air nuisance and odoursare correlated to new buildings or the use of new building materials (Mølhave et al.1991b; Kim et al. 2008; Jo and Sohn 2009). Generally, VOCs concentrations relatedto building materials decrease in several factors since the building or the renovationof the dwelling, nevertheless, the decrease would depend on the kind of compoundand the material characteristics (e.g. material thickness) (Lundgren et al. 1999;Hodgson et al. 2000; Huang and Haghighat 2003; Tuomainen et al. 2003; Zuraimiet al. 2004; Järnström et al. 2006; Jo and Sohn 2009).
In addition to that, VOCs emitted by building materials tend to be replaced byother VOCs, related to the activities developed in the building, as the occupancyperiod broadens (Järnström et al. 2006). On the other hand, it has been observedthat some of the building materials can behave as VOCs reservoirs, emitting VOCsunder diffusion or reactions with air during longer periods of time (Reiser et al.2002; Zuraimi et al. 2004). Hence, the concentration of individual VOCs wouldbe different between dwellings depending on the presence or absence of potentialemission sources of each kind of compound.
Several countries, e.g. North European, Asian and the United States of America,have developed labelling schemes to regulate the maximum permissible emis-sions of VOCs from building materials, especially carpets and flooring materials(Järnström et al. 2006; Katsoyiannis et al. 2008), and have established recommendedguidelines for VOCs concentration levels in new buildings (Kim et al. 2008; Jo andSohn 2009). However, these labelling are generally country-specific and the testexperiments to determine VOCs emissions are not standardized. In this line, theEuropean Union underlined in 1997 the necessity of an extensive applicable vali-dated methodology for the evaluation of VOCs emissions from building materials(EC 1997b). Hence, more demanding and systematized methods to determine VOCsemissions for all building and furnishing products should be established worldwide(Reiser et al. 2002; Katsoyiannis et al. 2008).
16.4 Indoor (IAQ) Determination
Air quality can be defined in a variety of ways, but the most realistic form to define itwould be in terms of a measurable condition of the atmosphere. Generally, specificatmospheric pollutants are established and measured, physically or chemically, inreal-time or average concentrations (Godish 1997; Johansson 1999; Mølhave 2003;
16 Assessment of Chemical Hazards in Sick Building Syndrome Situations 295
Monks et al. 2009). Outdoor air quality in a specific place and period of time woulddepend on several variables, such as the chemical emissions to the atmosphere, thesource emission density, the topography and orography of the area, the meteorolog-ical conditions and the territorial planning (in many occasions industrial facilitiesare located very close to inhabited areas).
Due to the specific meteorology of the area, changes in the wind regimes cancause variability in air quality over the course of the year, over 24 h periods andfrom one location to another (Godish 1997; Gallego et al. 2008b). On the otherhand, indoor air quality (residential, commercial, office and public buildings) woulddepend mainly on the emissions from a variety of sources, including building mate-rials and appliances of various types and consumer products, environmental tobaccosmoke, outdoor air entrance and ventilation rates (Maroni et al. 1995; Godish2001).
Varied types of VOCs and in variable concentrations, as it has been said previ-ously, can be found in non-industrial indoor air environments (Gallego et al. 2008a;2009a). Hence, the interest in determining air quality in reference to VOCs concen-trations in both indoor and outdoor air has increased over the last several decades(EC 1997a; Atkinson 2000; Wolkoff and Nielsen 2001; Zuraimi et al. 2006; Liangand Liao 2007; Peng and Lin 2007; Vautard et al. 2007; Jia et al. 2008b; Gallegoet al. 2009a), mainly due to their association with odorous annoyance and SBSsymptoms (Hutter et al. 2006; Gallego et al. 2008a; Wang et al. 2008; Peng et al.2009).
Environmental analysis means in many cases the analysis of pollutants in traceand ultra-trace quantities (Ras 2008). The complexity of pollutants occurrence in theatmosphere, in terms of composition (polar to non-polar compounds, very volatileand semi-volatile compounds) and abundance (below detection limit (ppbv to pptv)to over detectors saturation limit), points out the necessity to develop versatileanalytical methods (Desauziers 2004; Ribes et al. 2007). Consequently, sensitive,selective, fast and reliable methodologies are needed to detect pollutants in ambientair to determine air quality, and concentration techniques have often to be appliedprior to the analysis (Harper 2000; Dettmer and Engewald 2002; Desauziers 2004;Demeestere et al. 2007; Ulman and Chilmonczyk 2007; Barro et al. 2009).
In this line, chemical control, based in the adsorption of pollutants in solidsorbents and their posterior analysis by TD-GC/MS, is used for the individual deter-mination of a wide range of odorous and nuisance VOCs present in air samples(Ribes et al. 2007; Demeestere et al. 2008a; Gallego et al. 2008a), and has beensuccessfully used in the determination of air quality (Dettmer and Engewald 2003;Donaldson et al. 2003; Kuntasal et al. 2005; Ribes et al. 2007; Ras 2008). However,when an analytical methodology is developed to study air quality, several termshave to be taken into account such as the pollutant state (gaseous or particulate mat-ter), compound type or family, compound concentration, period of measurement(short- or long-term, e.g. instantaneous, 24-h, monthly or yearly concentrations),the measurement site (in situ or in the laboratory) and the principal aim of the study(qualitative, estimation of a emission, punctual or long-term concentrations, main,minor or trace components study).
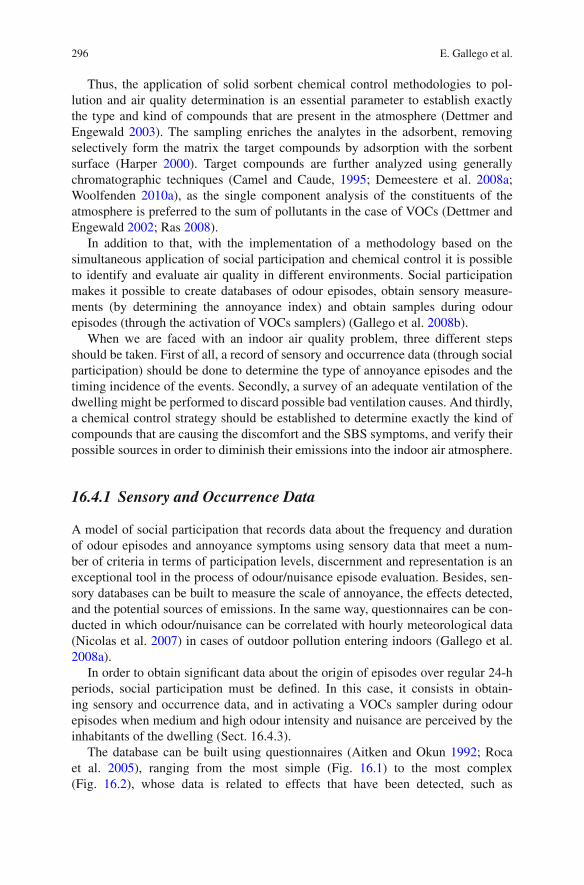
296 E. Gallego et al.
Thus, the application of solid sorbent chemical control methodologies to pol-lution and air quality determination is an essential parameter to establish exactlythe type and kind of compounds that are present in the atmosphere (Dettmer andEngewald 2003). The sampling enriches the analytes in the adsorbent, removingselectively form the matrix the target compounds by adsorption with the sorbentsurface (Harper 2000). Target compounds are further analyzed using generallychromatographic techniques (Camel and Caude, 1995; Demeestere et al. 2008a;Woolfenden 2010a), as the single component analysis of the constituents of theatmosphere is preferred to the sum of pollutants in the case of VOCs (Dettmer andEngewald 2002; Ras 2008).
In addition to that, with the implementation of a methodology based on thesimultaneous application of social participation and chemical control it is possibleto identify and evaluate air quality in different environments. Social participationmakes it possible to create databases of odour episodes, obtain sensory measure-ments (by determining the annoyance index) and obtain samples during odourepisodes (through the activation of VOCs samplers) (Gallego et al. 2008b).
When we are faced with an indoor air quality problem, three different stepsshould be taken. First of all, a record of sensory and occurrence data (through socialparticipation) should be done to determine the type of annoyance episodes and thetiming incidence of the events. Secondly, a survey of an adequate ventilation of thedwelling might be performed to discard possible bad ventilation causes. And thirdly,a chemical control strategy should be established to determine exactly the kind ofcompounds that are causing the discomfort and the SBS symptoms, and verify theirpossible sources in order to diminish their emissions into the indoor air atmosphere.
16.4.1 Sensory and Occurrence Data
A model of social participation that records data about the frequency and durationof odour episodes and annoyance symptoms using sensory data that meet a num-ber of criteria in terms of participation levels, discernment and representation is anexceptional tool in the process of odour/nuisance episode evaluation. Besides, sen-sory databases can be built to measure the scale of annoyance, the effects detected,and the potential sources of emissions. In the same way, questionnaires can be con-ducted in which odour/nuisance can be correlated with hourly meteorological data(Nicolas et al. 2007) in cases of outdoor pollution entering indoors (Gallego et al.2008a).
In order to obtain significant data about the origin of episodes over regular 24-hperiods, social participation must be defined. In this case, it consists in obtain-ing sensory and occurrence data, and in activating a VOCs sampler during odourepisodes when medium and high odour intensity and nuisance are perceived by theinhabitants of the dwelling (Sect. 16.4.3).
The database can be built using questionnaires (Aitken and Okun 1992; Rocaet al. 2005), ranging from the most simple (Fig. 16.1) to the most complex(Fig. 16.2), whose data is related to effects that have been detected, such as
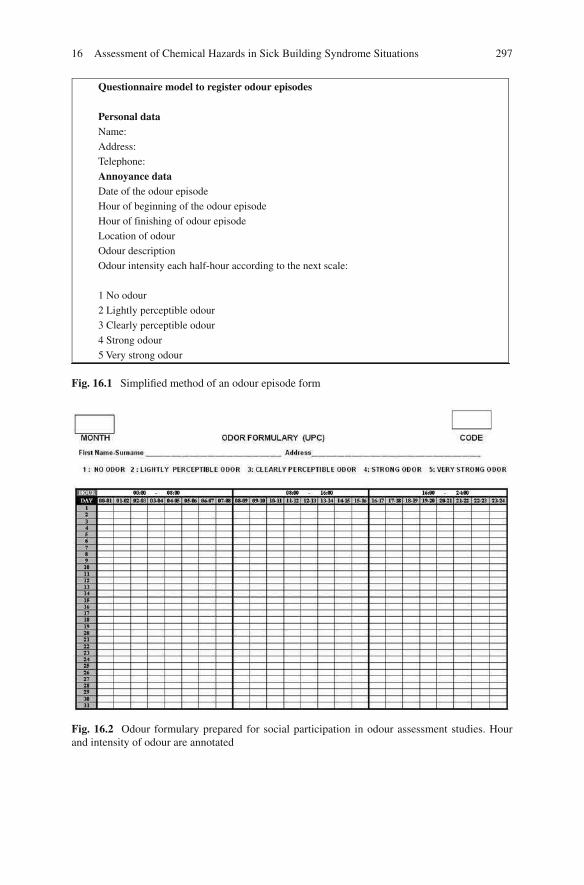
16 Assessment of Chemical Hazards in Sick Building Syndrome Situations 297
Questionnaire model to register odour episodes
Personal data
Name:
Address:
Telephone:
Annoyance data
Date of the odour episode
Hour of beginning of the odour episode
Hour of finishing of odour episode
Location of odour
Odour description
Odour intensity each half-hour according to the next scale:
1 No odour
2 Lightly perceptible odour
3 Clearly perceptible odour
4 Strong odour
5 Very strong odour
Fig. 16.1 Simplified method of an odour episode form
Fig. 16.2 Odour formulary prepared for social participation in odour assessment studies. Hourand intensity of odour are annotated

298 E. Gallego et al.
headaches, nausea and irritation of the respiratory system, and to personal circum-stances (time of presence in the place, type of work, etc.). Standard questionnairesshould include the date of the odour episode, the time the odour episode began, thetime the odour episode ended, the location of the odour, a description of the odourand its intensity, which should be recorded every 30 min using the following scale:1, no odour; 2, slight odour; 3, clearly perceptible odour; 4, strong odour; and 5,very strong odour (Gallego et al. 2008a; b).
The assignment of specific values for odour intensity (Aitken and Okun 1992;McKenzie and Mann 2004) is one way to quantify to what extent odours annoypeople over time. As several factors, such as differences in sensitivity to odours, caninfluence the participants’ responses, these control processes are not considered veryobjective. Nevertheless, citizen participation can provide a great deal of very impor-tant information about episodes of low air quality and aid in the identification of thechemical compounds responsible for odour episodes (Gallego et al. 2008a). Beforefilling out these forms, participants should take part in preparatory sessions in orderto explain them the rules for recording odours and common problems. Integrationin a continuous information process helps to maintain a high ongoing participationlevel throughout a control process.
Questionnaires that record data on a quarter-hourly basis produce an ampledatabase (60,000 data over a 6-month period) (Roca et al. 2005), which, in cases ofoutdoor air being the main source of indoor pollution, can be used to map episoderoses (frequency of episodes graphed along the 16 cardinal directions, like windroses) and annoyance indices that make it possible to determine the contributionsof the known emission sources and to identify initially unknown or unconsideredsources in the group of VOCs emitters (Roca et al. 2006). The final identificationof unknown emission sources would be determined by using additional data fromthe chemical analysis of air samples and mathematical modelling (Gallego et al.2008b).
16.4.2 Annoyance Index
The obtention of the annoyance index (AI) is done according to the followingvalidation criteria (Aitken and Okun 1992; Roca 2006):
a. Participation level: The participant is eliminated if his/her response is lower than70% (fewer than 456 annotations in a 6-month period).
b. The participant is eliminated if the discernment coefficient (CD) is smaller than0.3 and F(1) = 0 or F(2)+F(3) = 0.
C D = σ2 − 5 / σmax
Where:σ 2 − 5: Standard deviation of the number of responses in the different ranges
comprised between 2 (light annoyance) and 5 (very high annoyance).σmax: Maximum possible standard deviation for the total number of responses
with an annoyance level between 2 and 5.

16 Assessment of Chemical Hazards in Sick Building Syndrome Situations 299
F(1): Number of annotations for annoyance index 1 (no annoyance).F(2): Number of annotations for annoyance index 2 (light annoyance).F(3): Number of annotations for annoyance index 3 (moderate annoyance).
c. The participant is eliminated for the month if:
Xi /∈ [X − S, X + S] or Si > 2S
Where:
Xi: Average value of the participant’s sensory annotations for the range 1–5.X: Average value for all participants in the area for the range 1–5.S: Standard deviation of the annotations of all participants in the area.
Based on the resulting data after the aforementioned criteria have been applied, theAI is calculated by applying a weighted value for each annoyance value: 0 for value1, 25 for value 2, 50 for value 3, 75 for value 4 and, finally, 100 for value 5. Thefinal result, expressed as an annoyance percentage (scale: 0–100) is calculated usingthe following expression:
AI(%) = (1/Nk) i (WiNik)
Where:
AI: Annoyance index for the period under studyNk: Total number of annotations
I: Annoyance value (1–5)WI: Weighting factorNiK: Number of annotations for each annoyance value
The AI values can be calculated for daily, hourly or monthly intervals for each ofthe affected locations.
16.4.3 Survey of Adequate Ventilation/Comfort
Mechanical ventilation has to assure the renovation of indoor air, removing indoor-generated air pollutants, and provide thermal comfort and good indoor air quality ina building (EC 1992; TIP-VENT 2001; ASHRAE 2007; Yu et al. 2009). The appliedventilation rates have to be in accordance with indoor emissions from buildingoccupants (e.g. bioeffluents), emissions from the developed activities, and buildingmaterials emissions (EC 1992; Zuraimi et al. 2003). In addition to that, adequateventilation has to avoid the formation of irritant and annoying compounds throughpotential chemical reactions among indoor air VOCs. Suitable ventilation rates haveto warrant low residence times of VOCs indoors as well as decrease their concentra-tions, limiting the possibility of VOCs reactions (Weschler and Shields 2000; Penget al. 2009; Yu et al. 2009).

300 E. Gallego et al.
On the other hand, outdoor incoming fresh air can also introduce pollutionindoors (EC 1992; Seppänen and Fisk 2002; ASHRAE 2007). It has been observedthat the location of the air gathering of the HVAC system can be an important factorin areas with remarkable traffic. In public buildings, mechanical ventilation is gen-erally inoperative during non-working hours. Due to this fact, indoor VOCs emittedlevels increase during these periods, mainly because there is no removal throughventilation (Cheong and Chong 2001). Nonetheless, VOCs that enter the buildingthrough the ventilation system (e.g. traffic-related), tend to decrease (Zuraimi et al.2003).
The most internationally used ventilation standardized methodologies and guide-lines for suitable indoor air quality are ASHRAE standard 62 for indoor air qualityand ventilation (ASHRAE 2007), and the CR 1752 technical report “Ventilation forBuildings: Design Criteria for the Indoor Environment” from the European standardorganization (CEN) (Olesen 2004).
When complaints related to bad indoor air quality are stated in a building, a sur-vey for satisfactory ventilation has to be done to dismiss inadequate ventilation asthe cause of the annoyance, as deficiencies in HVAC design, construction, operationand maintenance can cause pollutant emissions from the system (Cheong and Chong2001; Seppänen and Fisk 2002; Zuraimi et al. 2004). First of all, a thorough visualsurvey searching for evidence of poor indoor and/or outdoor HVAC hygiene (e.g.water intrusion, mould, dust/particles) is advised. HVAC systems are complex andbuildings provided with them have usually little natural ventilation, being the air-tightness of the building an important key (Yu et al. 2009). Intake fresh air grilles,pipes, coils and filters have to be checked to ensure their cleanliness and assurethat they provide outdoor air indoors without contaminating it during the process(Seltzer 1995).
On the other hand, carbon dioxide is often used as a direct indicator of acceptableventilation due to its relationship with the occupancy level of the place (EC 1992;TIP-VENT 2001; Clements-Croome et al. 2008; Wong et al. 2008), however, thisapproach ignores the ventilation needs related to other pollutants (Baek et al. 1997;Olesen 2004; Lin et al. 2005), such as VOCs, which its main indoor sources wouldbe building materials and the activities developed in the building. In addition tothat, a direct measurement of air velocity in the air suppliers and gatherers is alsosuggested. Knowing this value, the airflow (volume/time) can be established (Seltzer1995) and the correct flow of air through the room ensured, as well as the ventilationeffectiveness and the age of air.
16.4.4 VOCs Sampling and Analysis Protocol
The procedure for sampling and analysis of low concentrations of VOCs in indoorair has been standardized in three sampling steps (Gallego et al. 2009a). The designaims to determine the type of VOCs present in indoor air in a first step, through24 h samplings. The second control step is based on integrated odour episodes sam-pling in several points of the dwelling, mainly where more incidences have been

16 Assessment of Chemical Hazards in Sick Building Syndrome Situations 301
detected, when medium or high odour intensity is percept by the inhabitants. Theodour episodes are characterised (type of VOCs found and at which time of the daythe episodes occur) and the concentrations of VOCs are determined. The third andlast step implies taking samples following the usual working timetable (e.g. from 8am to 5 pm).
16.4.4.1 Air Sampler
A collector pump sampler has been specially designed in our laboratory (LCMA-UPC) to collect dynamically air samples in solid sorbent tubes (Fig. 16.3). TheVOCs sampler is equipped with inert sampling line and high precision total vol-ume measurement. On the other hand, other sampler characteristics include 10calibration flow levels, high flow stability, very low breakthrough values and inex-istent tube contamination during pre-activation processes. The airtihghtness of thesystem was evaluated coupling a sorbent tube to the collector pump sampler duringa month. The analysis of the sorbent tube revealed no VOCs contamination. Theoperating flow can range between 40 and 200 ml min–1.
By means of a remote control (both radio frequency and mobile phone), the airsampler can be activated by the potentially affected people when medium or highodour intensity and nuisance is percept (Roca 2006; Gallego et al. 2008a). Hence,the remote-controlled LCMA-UPC pump sampler allows the dwelling occupants toturn on and turn off the sampler when an odorous and/or discomfort episode occurs.Sampling flows applied are generally of 90 ml min–1 for control periods higher than6 h and 120 ml min–1 for episodic controls (Gallego et al. 2009a).
A minimisation of sampling costs is achieved with this control program, as theactivation of the remote-controlled sampler by the inhabitants of the building inthe very moment of the occurrence of odorous episodes diminishes the number ofsamples necessary to obtain reliable data for the study.
Fig. 16.3 LCMA-UPCcollector VOCs sampler
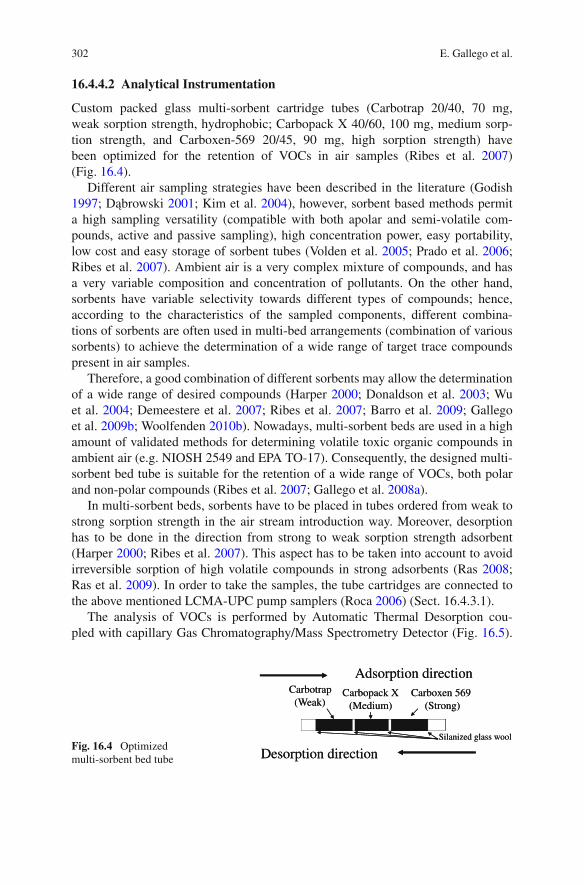
302 E. Gallego et al.
16.4.4.2 Analytical Instrumentation
Custom packed glass multi-sorbent cartridge tubes (Carbotrap 20/40, 70 mg,weak sorption strength, hydrophobic; Carbopack X 40/60, 100 mg, medium sorp-tion strength, and Carboxen-569 20/45, 90 mg, high sorption strength) havebeen optimized for the retention of VOCs in air samples (Ribes et al. 2007)(Fig. 16.4).
Different air sampling strategies have been described in the literature (Godish1997; Dabrowski 2001; Kim et al. 2004), however, sorbent based methods permita high sampling versatility (compatible with both apolar and semi-volatile com-pounds, active and passive sampling), high concentration power, easy portability,low cost and easy storage of sorbent tubes (Volden et al. 2005; Prado et al. 2006;Ribes et al. 2007). Ambient air is a very complex mixture of compounds, and hasa very variable composition and concentration of pollutants. On the other hand,sorbents have variable selectivity towards different types of compounds; hence,according to the characteristics of the sampled components, different combina-tions of sorbents are often used in multi-bed arrangements (combination of varioussorbents) to achieve the determination of a wide range of target trace compoundspresent in air samples.
Therefore, a good combination of different sorbents may allow the determinationof a wide range of desired compounds (Harper 2000; Donaldson et al. 2003; Wuet al. 2004; Demeestere et al. 2007; Ribes et al. 2007; Barro et al. 2009; Gallegoet al. 2009b; Woolfenden 2010b). Nowadays, multi-sorbent beds are used in a highamount of validated methods for determining volatile toxic organic compounds inambient air (e.g. NIOSH 2549 and EPA TO-17). Consequently, the designed multi-sorbent bed tube is suitable for the retention of a wide range of VOCs, both polarand non-polar compounds (Ribes et al. 2007; Gallego et al. 2008a).
In multi-sorbent beds, sorbents have to be placed in tubes ordered from weak tostrong sorption strength in the air stream introduction way. Moreover, desorptionhas to be done in the direction from strong to weak sorption strength adsorbent(Harper 2000; Ribes et al. 2007). This aspect has to be taken into account to avoidirreversible sorption of high volatile compounds in strong adsorbents (Ras 2008;Ras et al. 2009). In order to take the samples, the tube cartridges are connected tothe above mentioned LCMA-UPC pump samplers (Roca 2006) (Sect. 16.4.3.1).
The analysis of VOCs is performed by Automatic Thermal Desorption cou-pled with capillary Gas Chromatography/Mass Spectrometry Detector (Fig. 16.5).
Carbopack X
(Medium)
Adsorption direction
Desorption direction
Carbotrap
(Weak)Carboxen 569
(Strong)
Silanized glass wool
Carbopack X
(Medium)
Adsorption direction
Desorption direction
Carbotrap
(Weak)Carboxen 569
(Strong)
Silanized glass woolFig. 16.4 Optimizedmulti-sorbent bed tube

16 Assessment of Chemical Hazards in Sick Building Syndrome Situations 303
Cold trap
He
Inlet split
Adsorbent tube
Heating
Detector
GC column
Adsorbent tube
Cooling
Hot trap
He DetectorGC column
Outlet split
He
Primary desorption
Secondary desorption
Cold trap
He
Inlet split
Adsorbent tube
Heating
GC column
Adsorbent tube
Cooling
Hot trap
He DetectorGC column
Outlet split
He
Primary desorption
Secondary desorption
Fig. 16.5 Scheme of a thermal desorber coupled with gas chromatography/mass spectrome-try. Two stages of thermal desorption. Primary desorption: the analytes are transferred from theadsorbent tube to the cold trap through heating. Secondary desorption: The cold trap is rapidlyheated and the analytes are transferred to the chromatographic system
Thermal desorption is one of the most widespread techniques used (Demeestereet al. 2007; Ulman and Chilmonczyk 2007), as it is precise, has high sensitivity, lowdetection limits, and it is automatic (Desauziers 2004). Besides, all trapped pollu-tants can be chromatographed and directed to the detector in only one run, avoidingsample manipulation and dilution (Dettmer and Engewald 2002; Sunesson 2007;Barro et al. 2009; Woolfenden 2010a). In addition to that, solvent use is eliminated(Batterman et al. 2002).
The thermal desorption of the sampling tubes is carried out at 300C with a flowrate of 50 ml min–1 for 10 min (primary desorption), during that time the eluted com-pounds are swept from the tube to a cryofocusing trap (containing approximately15 mg of Tenax TA and 15 mg of Carbotrap) maintained at –30C, applying a flowsplit of 4 ml min–1. After the primary desorption, the cold trap is rapidly heatedfrom –30C to 300C (secondary desorption) and then maintained at this temper-ature for 10 min. During the secondary desorption, the compounds are submittedto a flow split of 7 ml min–1 and are injected onto the capillary column (DB-624,60 m × 0.25 mm × 1.4 µm) via a transfer line heated at 200C. The column oventemperature starts at 40C for 1 min, increases to 230C at a rate of 6C min–1 andthen it is maintained at 230C for 5 min. Helium (99.999%) carrier gas flow in theanalytical column is approximately 1 ml min–1 (1.4 bar) (Ribes et al. 2007; Gallegoet al. 2008a).
Mass spectral data are acquired over a mass range of 20–300 amu. A 6 minsolvent delay time is applied for standards analysis to avoid saturation of massspectrometer detector.

304 E. Gallego et al.
16.4.4.3 Qualitative and Quantitative Determination of Individual VOCs
Qualitative identification of target compounds is based on the match of the reten-tion times and the ion ratios of the target quantification ions and the qualifierions (Xcalibur 1.2 validated software package). Quantification of field samples isconducted by the external standard method. Standards are prepared in methanoland injected at 30C on the multisorbent-tubes under an inert Helium gas flow(100 ml min–1) using a conventional gas chromatograph packed column injector.Tube loading lasts not less than 5 min. The large variability of VOCs occurrence inair samples, in terms of abundance, lets to the necessity of working with two dif-ferent concentration ranges. Hence, the quantification method is validated for twodifferent quantification ions for each VOC to allow a reliable quantification in bothvery diluted (major characteristic ion in the VOCs spectra) and very concentratedsamples (minor characteristic ion, normally the molecular ion) (Ribes et al. 2007).
The chromatographic separation is satisfactory for most of VOCs (Fig. 16.6,Table 16.1). Mainly all co-eluting VOCs are satisfactory quantified using charac-teristic ions. Only m-xylene and p-xylene are quantified together as they exhibitidentical mass spectra. Limits of detection (LOD), determined applying a signal-to-noise ratio of 3, range from 0.001 to 10 ng. However, NN-Dimethylformamide andN-Methylformamide present values of 14 and 97 ng, respectively. The studied com-pounds exhibit linearity ranges (ng) from 3 to 4 orders of magnitude. Nonetheless,ethanol, carbon disulfide, methylethylketone and benzene exhibit the wider lineardynamic ranges (around 106 ng).
Most of the VOCs show repeatabilities (% relative standard deviation values)lower than 25%, accomplishing the EPA performance criteria (US EPA 1999).
Fig. 16.6 GC chromatogram for stock standard solution. Correspondent VOCs reference numbersare listed in Table 16.1

16 Assessment of Chemical Hazards in Sick Building Syndrome Situations 305
Table 16.1 Method target VOCs analytes. CAS number (CAS No.), molecular weight (MW, gmol–1), boiling point (BP, ºC, at 760 mmHg), retention time (RT, min) and quantification ions m/z1 (low concentration range) and m/z 2 (high concentration range)
Quantificationions
Target VOCsVOCref. no. CAS no.
MW(g mol–1)
BP(C)
RT(min) m/z 1 m/z 2
EthanolPropanalAcetoneCarbon disulfideMethyl acetateIsopropanolTert-butylmethylethern-HexaneButanalEthyl acetateChloroformMethylethylketoneTetrahydrofuran1,1,1-TrichloroethaneCyclohexaneCarbon tetrachlorideIsobutanolBenzene1-ButanolTrichloroethyleneMethylcyclohexanePentanalMethyl methacrylateMethylisobutylketoneToluene1,1,2-TrichloroethaneTetrachloroethyleneButyl acetateHexanalN,N-DimethylformamideN-MethylformamideEthylbenzenen-Nonanem-Xylenep-Xyleneo-XyleneStyreneHeptanal2-Butoxyethanolα-PineneCyclohexanonePropylbenzenen-Decane1,3,5-Trimethylbenzeneβ-Pinene
123456789
101112131415161718192021222324252627282930313233343536373839404142434445
64-17-5123-38-667-64-175-15-079-20-967-63-01,634-04-4110-54-3123-72-8141-78-667-66-378-93-3109-99-971-55-6110-82-756-23-578-83-171-43-271-36-379-01-6108-87-2110-62-380-62-6108-10-1108-88-379-00-5127-18-4123-86-466-25-168-12-2123-39-7100-41-4111-84-2108-38-3106-42-395-47-6100-42-5111-71-7111-76-27,785-70-8108-94-1103-65-1124-18-5108-67-8127-91-3
46585876746088867288
1177272
13184
151747874
129988646
10092
1321631161007359
10612810610610610411411813698
120142120136
79495646578255697577618066748177
10880
11887
101103100117111114121126131153183137150139138145145150171157155159174165167
7.47.57.567.848.148.168.819.11
10.1610.4811.0211.1211.1211.4211.5411.7411.912.1213.1113.1313.7713.7813.8315.5315.9716.8317.2217.5517.5918.5619.0619.4519.6319.7319.7320.7520.7521.221.6421.6521.9722.7123.0423.1523.4
45584376a
74a
45735744618372429756
117437856
1305544
100a
4392
166166
73a
447359
10657
106106
91a
104a
445793989171
10593
46584476745957867288875772
11784
121745131
1349886
10010065
1681687372583065
128777791
1048687
13683
120142120136

306 E. Gallego et al.
Table 16.1 (continued)
Quantificationions
Target VOCsVOCref. no. CAS no.
MW(g mol–1)
BP(C)
RT(min) m/z 1 m/z 2
1,2,4-TrimethylbenzeneBenzaldehydeIsocyanatocyclohexaneLimonenep-Dichlorobenzenen-UndecanePhenol1-OctanolNaphthaleneIsothiocyanatocyclohexane2-Methylnaphthalene1-Methylnaphthalene
464748495051525354555657
95-63-6100-52-73,173-53-35,989-27-5106-46-71,120-21-4108-95-2111-87-591-20-31,122-82-391-57-690-12-0
12010612517614715694
130128141142142
168178169177174195182194218219242245
24.1624.2524.8824.8825.2426.2226.3226.8831.432.935.3435.9
105778293
146579441
12855
142142
120106125136
75156
6684
102141115115
aCompound with only one characteristic quantification ion.
Multi-sorbent bed tubes do not exhibit significant breakthrough values for the stud-ied VOCs (sampling volumes up to 90 l), except the VVOCs ethanol (for samplingvolumes over 10 l), and acetone, dichloromethane and isopropanol (for samplingvolumes over 40 l) (Gallego et al. 2010). Extreme precautions are established forquality assurance, injecting periodically blank samples and known concentrationsof chosen standards (Ribes et al. 2007; Gallego et al. 2008a).
The majority of the identified VOCs are quantified, establishing as a criteriontheir abundance in indoor air, toxicity or request in TVOC analysis (WHO 1989;EC 1997a; Mølhave et al. 1997; ISO 16000-6).
16.4.4.4 Total VOCs (TVOC) Determination
Wide ranges of sampling strategies and Total VOCs (TVOC) concentration calcu-lation methods have been used in the literature to evaluate VOCs concentrations.Differences observed between calculated TVOC values in the literature can berelated to the differences in the analytical systems used, the type of sampling adsor-bents, sampling rate, sampling volume, the chromatographic separation and thedetection system used. Hence, these aspects often make TVOC published data notcomparable (EC 1997a; Andersson et al. 1997; Mølhave et al. 1997; Wolkoff et al.1997; Johansson 1999; Hodgson et al. 2000).
The European Commission recommended a definition of TVOC and a proce-dure for its sampling and analysis (EC 1997a), focusing in the main indoor VOCsfamilies, such as aliphatic hydrocarbons, aromatic hydrocarbons, terpenes, alcohols,aldehydes, ketones, halocarbons and esters (Table 16.2).
In the same way, the international standard ISO 16000-6 describes a way ofmeasuring TVOC. Generally, TVOC calculated values do not include very volatile

16 Assessment of Chemical Hazards in Sick Building Syndrome Situations 307
Table 16.2 Minimum number of compounds to be quantified in a TVOC analysis
Aromatic HydrocarbonsAliphaticHydrocarbons Cycloalkanes Terpenes
Benzene n-hexane Methylcyclopentane 3-carene
Toluene n-heptane Cyclohexane α-pinene
Ethylbenzene n-octane Methylcyclohexane β-pinene
m+p-xylenes n-nonane Alcohols Limonene
o-xylene n-decane 2-propanol Aldehydes
n-propylbenzene n-undecane 1-butanol Butanal
1,2,4-trimethylbenzene n-dodecane 2-ethyl-1-hexanol Pentanal
1,3,5-trimethylbenzene n-tridecane Glycols/Glycolethers Hexanal
2-ethyltoluene n-tetradecane 2-methoxyethanol Nonanal
Styrene n-pentadecane 2-ethoxyethanol Benzaldehyde
Naphthalene n-hexadecane 2-butoxyethanol Ketones
4-phenylcyclohexene 2-methylpentane 1-methoxy-2-propanol Methylethylketone
Esters 3-methylpentane 2-butoxyethoxyethanol Methylisobutylketone
Ethylacetate 1-octene Halocarbons Cyclohexanone
Buthylacetate 1-decene Trichloroethylene Acetophenone
Isopropylacetate Others Tetrachloroethylene Acids
2-ethoxyethylacetate 2-pentylfuran 1,1,1-trichloroethane Hexanoic acid
Texanolisobutyrate (TXIB) Tetrahydrofuran 1,4-dichlorobenzene
Source: EC (1997a).
organic compounds (0ºC < Boiling point <50ºC), and only include the range ofcompounds obtained in the analytical window between hexane and hexadecane ona non-polar column (ISO 16000-6; Zuraimi et al. 2003).
The standardized procedure for sampling and analysing low concentrations ofVOCs in indoor air building samples (Gallego et al. 2009a) proposes the evaluationof the TVOC value following the European Union recommended procedure (EC1997a) and Mølhave et al. (1997) recommended method. The main and more toxiccompounds found in the studies and the minimum number of compounds to beanalysed suggested by the methods above mentioned (Table 16.2) are quantifiedindividually. The rest of compounds are quantified by the response factor of toluene.The summation of all that values gives us the TVOC value.
A selection of recent (2000–2010) TVOC concentrations in worldwide privateand public dwellings is shown in Table 16.3. TVOC concentrations would mainly beinfluenced by the age of the dwelling (building materials and furniture emissions),the use of low emitting materials, the presence or absence of forced ventilation andthe activities developed (e.g. cooking, printing, use of glue and painters) (Tham et al.2004; Zuraimi et al. 2004).
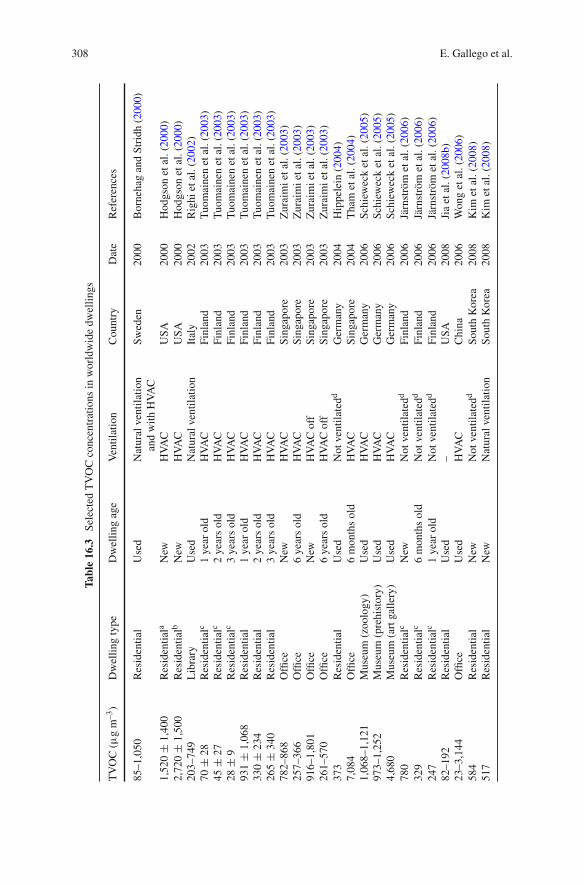
308 E. Gallego et al.
Tab
le16.3
Sel
ecte
dT
VO
Cco
ncen
trat
ions
inw
orld
wid
edw
elli
ngs
TV
OC
(µg
m–3
)D
wel
ling
type
Dw
elli
ngag
eV
enti
lati
onC
ount
ryD
ate
Ref
eren
ces
85–1
,050
Res
iden
tial
Use
dN
atur
alve
ntil
atio
nan
dw
ith
HV
AC
Sw
eden
2000
Bor
neha
gan
dS
trid
h(2
000)
1,52
0±
1,40
0R
esid
enti
ala
New
HV
AC
US
A20
00H
odgs
onet
al.(
2000
)2,
720
±1,
500
Res
iden
tial
bN
ewH
VA
CU
SA
2000
Hod
gson
etal
.(20
00)
203–
749
Lib
rary
Use
dN
atur
alve
ntil
atio
nIt
aly
2002
Rig
hiet
al.(
2002
)70
±28
Res
iden
tial
c1
year
old
HV
AC
Fin
land
2003
Tuo
mai
nen
etal
.(20
03)
45±
27R
esid
enti
alc
2ye
ars
old
HV
AC
Fin
land
2003
Tuo
mai
nen
etal
.(20
03)
28±
9R
esid
enti
alc
3ye
ars
old
HV
AC
Fin
land
2003
Tuo
mai
nen
etal
.(20
03)
931
±1,
068
Res
iden
tial
1ye
arol
dH
VA
CF
inla
nd20
03T
uom
aine
net
al.(
2003
)33
0±
234
Res
iden
tial
2ye
ars
old
HV
AC
Fin
land
2003
Tuo
mai
nen
etal
.(20
03)
265
±34
0R
esid
enti
al3
year
sol
dH
VA
CF
inla
nd20
03T
uom
aine
net
al.(
2003
)78
2–86
8O
ffice
New
HV
AC
Sin
gapo
re20
03Z
urai
mi
etal
.(20
03)
257–
366
Offi
ce6
year
sol
dH
VA
CS
inga
pore
2003
Zur
aim
iet
al.(
2003
)91
6–1,
801
Offi
ceN
ewH
VA
Cof
fS
inga
pore
2003
Zur
aim
iet
al.(
2003
)26
1–57
0O
ffice
6ye
ars
old
HV
AC
off
Sin
gapo
re20
03Z
urai
mi
etal
.(20
03)
373
Res
iden
tial
Use
dN
otve
ntil
ated
dG
erm
any
2004
Hip
pele
in(2
004)
7,08
4O
ffice
6m
onth
sol
dH
VA
CS
inga
pore
2004
Tha
met
al.(
2004
)1,
068–
1,12
1M
useu
m(z
oolo
gy)
Use
dH
VA
CG
erm
any
2006
Sch
iew
eck
etal
.(20
05)
973–
1,25
2M
useu
m(p
rehi
stor
y)U
sed
HV
AC
Ger
man
y20
06S
chie
wec
ket
al.(
2005
)4,
680
Mus
eum
(art
gall
ery)
Use
dH
VA
CG
erm
any
2006
Sch
iew
eck
etal
.(20
05)
780
Res
iden
tial
cN
ewN
otve
ntil
ated
dF
inla
nd20
06Jä
rnst
röm
etal
.(20
06)
329
Res
iden
tial
c6
mon
ths
old
Not
vent
ilat
edd
Fin
land
2006
Järn
strö
met
al.(
2006
)24
7R
esid
enti
alc
1ye
arol
dN
otve
ntil
ated
dF
inla
nd20
06Jä
rnst
röm
etal
.(20
06)
82–1
92R
esid
enti
alU
sed
–U
SA
2008
Jia
etal
.(20
08b)
23–3
,144
Offi
ceU
sed
HV
AC
Chi
na20
06W
ong
etal
.(20
06)
584
Res
iden
tial
New
Not
vent
ilat
edd
Sou
thK
orea
2008
Kim
etal
.(20
08)
517
Res
iden
tial
New
Nat
ural
vent
ilat
ion
Sou
thK
orea
2008
Kim
etal
.(20
08)
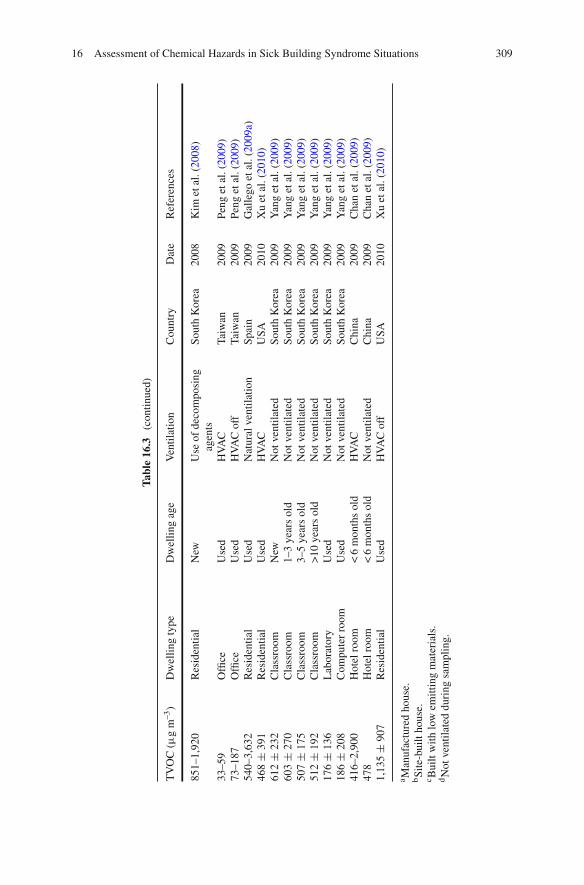
16 Assessment of Chemical Hazards in Sick Building Syndrome Situations 309
Tab
le16.3
(con
tinu
ed)
TV
OC
(µg
m–3
)D
wel
ling
type
Dw
elli
ngag
eV
enti
lati
onC
ount
ryD
ate
Ref
eren
ces
851–
1,92
0R
esid
enti
alN
ewU
seof
deco
mpo
sing
agen
tsS
outh
Kor
ea20
08K
imet
al.(
2008
)
33–5
9O
ffice
Use
dH
VA
CT
aiw
an20
09P
eng
etal
.(20
09)
73–1
87O
ffice
Use
dH
VA
Cof
fT
aiw
an20
09P
eng
etal
.(20
09)
540–
3,63
2R
esid
enti
alU
sed
Nat
ural
vent
ilat
ion
Spa
in20
09G
alle
goet
al.(
2009
a)46
8±
391
Res
iden
tial
Use
dH
VA
CU
SA
2010
Xu
etal
.(20
10)
612
±23
2C
lass
room
New
Not
vent
ilat
edS
outh
Kor
ea20
09Y
ang
etal
.(20
09)
603
±27
0C
lass
room
1–3
year
sol
dN
otve
ntil
ated
Sou
thK
orea
2009
Yan
get
al.(
2009
)50
7±
175
Cla
ssro
om3–
5ye
ars
old
Not
vent
ilat
edS
outh
Kor
ea20
09Y
ang
etal
.(20
09)
512
±19
2C
lass
room
>10
year
sol
dN
otve
ntil
ated
Sou
thK
orea
2009
Yan
get
al.(
2009
)17
6±
136
Lab
orat
ory
Use
dN
otve
ntil
ated
Sou
thK
orea
2009
Yan
get
al.(
2009
)18
6±
208
Com
pute
rro
omU
sed
Not
vent
ilat
edS
outh
Kor
ea20
09Y
ang
etal
.(20
09)
416–
2,90
0H
otel
room
<6
mon
ths
old
HV
AC
Chi
na20
09C
han
etal
.(20
09)
478
Hot
elro
om<
6m
onth
sol
dN
otve
ntil
ated
Chi
na20
09C
han
etal
.(20
09)
1,13
5±
907
Res
iden
tial
Use
dH
VA
Cof
fU
SA
2010
Xu
etal
.(20
10)
a Man
ufac
ture
dho
use.
bS
ite-
buil
tho
use.
c Bui
ltw
ith
low
emit
ting
mat
eria
ls.
dN
otve
ntil
ated
duri
ngsa
mpl
ing.

310 E. Gallego et al.
16.4.5 Indoor/Outdoor Ratios
Generally, indoor VOCs concentrations are higher than outdoor concentrations(Saarela et al. 2003; Zuraimi et al. 2003; Sexton et al. 2004; Edwards et al. 2005; Jiaet al. 2008b) for several reasons, but VOCs emissions from building materials andfurniture, and underventilation of the buildings, mainly in cold climate locations,are among the most important factors (Ashmore and Dimitroulopoulou 2009).
The indoor/outdoor (I/O) ratio determines the main contributor to VOCs inindoor air, and can be used as an indicator of the relative share of indoor and out-door sources to the total VOCs burden (Baek et al. 1997; Freijer and Bloemen 2000).I/O values above 1 would indicate that indoor VOCs concentrations are higher thanoutdoor concentrations; hence, indoor sources are more important to the load ofVOCs indoors than outdoor sources (Peng et al. 2009; Chan et al. 2009). Besides,I/O ratios exceeding 10 expose that indoor sources are mainly the unique sourcesof these compounds indoors (Jia et al. 2008b). However, an increase of the airtight-ness of the buildings would decrease the infiltration of outdoor air, decreasing alsothe contribution of outdoor air indoors and consequently increasing the I/O ratio(Ashmore and Dimitroulopoulou 2009).
16.5 Air Quality and Toxicity of VOCs in Indoor Air
Several criterions, based on guides and quality standards, have been established todetermine air quality. Some of them, proposed by the US Environmental ProtectionAgency (US EPA), are referred to indoor and outdoor air and are established toprotect the population from adverse health effects caused by their exposition to toxicsubstances. In addition to that, other types of standards, such as the threshold limitvalues (TLV) from the American Conference of Governmental Industrial Hygienists(ACGIH), are used as professional exposure limits, for both outdoor and indoor airpollutant concentrations, applicable to the working population. These values are notadvisable to be used directly on general population, as they have been establishedwith specific exposition conditions, however, they can be useful as indicators.
Nowadays, different quality criteria for individual compounds exist worldwide,as no international guidelines have been established. However, the most commonlyused are the Threshold Limit Values in working ambient (TLV) divided by a fac-tor that ranges from 30 to 1,000. The value obtained depends on the toxic potentialof the compound. The value TLV/420 is commonly used to establish maximumconcentration limits in urban outdoor air in a 24-h period for non-carcinogenic com-pounds. The factor 420 is an uncertainty factor that takes into account the variedphysiological status of people (Repetto 1997).
All the identified VOCs in a qualitative analysis in a residential flat and in twooffices (in a Research Building and in a University building) located in Barcelonacity (Spain) are shown in Table 16.4. More than one hundred compounds weredetected in these indoor environments. Odour thresholds, TLV/420, associated

16 Assessment of Chemical Hazards in Sick Building Syndrome Situations 311
Tab
le16.4
Res
iden
tial
flat
,Res
earc
hbu
ildi
ngan
dU
nive
rsit
ybu
ildi
ng(O
ffice
s).I
dent
ified
VO
Cs,
Odo
urT
hres
hold
s(µ
gm
–3),
TLV
/420
(µg
m–3
),re
leva
ntas
soci
ated
R-p
hras
es,r
elev
ant
asso
ciat
edne
wH
labe
llin
g,C
ance
rR
isk
Con
cent
rati
ons
(µg
m–3
),an
dIA
RC
canc
ercl
assi
fica
tion
Com
poun
dC
AS
#R
esid
enti
alfl
at
Res
earc
hbu
ildi
ng
(offi
ces)
Uni
vers
ity
buil
ding
(offi
ces)
Odo
ur
thre
shol
db
(µg
m–3
)
TLV
/420
c
(µg
m–3
)R
-phr
ases
Hla
bell
ing
Con
cent
rati
onfo
r
canc
erri
skd
(µg/
m3
)
IAR
Cca
ncer
clas
sifi
cati
one
α-P
inen
ea80
-56-
8x
xx
230
267
36-3
7-38
β-P
inen
ea12
7-91
-3x
xx
8,90
026
736
-37-
38
1,1-
Dim
ethy
lcyc
lopr
opan
e
1,63
0-94
-0x
1,1,
1-T
rich
loro
etha
nea
71-5
5-6
x5,
300
4,54
820
H33
2
1,1,
2- Tri
met
hylc
yclo
hexa
ne
7,09
4-26
-0x
1,1,
3- Tri
met
hylc
yclo
hexa
ne
3,07
3-66
-3x
1,2-
Die
thyl
benz
ene
135-
01-3
1,2,
3- Tri
met
hylb
enze
nea
526-
73-8
x29
336
-37-
38
1,2,
4- Tri
met
hylb
enze
nea
95-6
3-6
xx
x14
029
320
-36/
37/3
8H
332-
H31
9-
H33
5-
H31
5
1,3,
5- Tri
met
hylb
enze
nea
108-
67-8
xx
180
293
37H
335
1,3-
Pen
tadi
ene
504-
60-9
xx
x
1-B
utan
ola
71-3
6-3
xx
x10
145
37/3
8-67
H33
5-H
315-
H33
6
1-H
epte
ne59
2-76
-7x
37,0
00
1-H
exen
e59
2-41
-6x
410
1-M
etho
xy-2
-pro
pano
l10
7-98
-2x
x37
,000
879
36-3
7-38
1-P
ropa
nol
71-2
3-8
x5,
900
586
67H
336
2,2,
4,4,
6,8,
8-
Hep
tam
ethy
lnon
ane
4,39
0-04
-9x
2,2,
4,6,
6-
Pen
tam
ethy
lhep
tane
13,4
75-8
2-6
x

312 E. Gallego et al.
Tab
le16.4
(con
tinu
ed)
Com
poun
dC
AS
#R
esid
enti
alfl
at
Res
earc
hbu
ildi
ng
(offi
ces)
Uni
vers
ity
buil
ding
(offi
ces)
Odo
ur
thre
shol
db
(µg
m–3
)
TLV
/420
c
(µg
m–3
)R
-phr
ases
Hla
bell
ing
Con
cent
rati
onfo
r
canc
erri
skd
(µg/
m3
)
IAR
Cca
ncer
clas
sifi
cati
one
2,2,
5,5-
Tet
ram
ethy
lhex
ane
1,07
1-81
-4x
2,3-
Dim
ethy
lhex
ane
584-
94-1
2,4-
Dim
ethy
lhep
tane
2,21
3-23
-2x
2,6-
Dim
ethy
loct
ane
2,05
1-30
-1x
2-B
rom
ohep
tane
1,97
4-04
-5x
2-B
utan
ol78
-92-
2x
285,
000
714
36/3
7-67
H31
9-H
335-
H33
6
2-B
uten
e10
7-01
-7x
4,80
01,
366
2-B
utox
yeth
anol
a11
1-76
-2x
x50
023
120
/21/
22-3
6/38
H33
2-H
319-
H31
5
2-E
thyl
-1-b
utan
ol97
-95-
0x
300
2-E
thyl
-1-h
exan
ol10
4-76
-7x
400
36-3
7-38
2-H
exen
e59
2-43
-8x
2-M
ethy
l-1-
bute
ne56
3-46
-2x
2-M
ethy
l-1-
hept
ene
15,8
70-1
0-7
2-M
ethy
l-1-
pent
ene
763-
29-1
x
2-M
ethy
l-2-
bute
ne51
3-35
-9x
2-M
ethy
l-2-
pent
anol
590-
36-3
x
2-M
ethy
lhep
tane
592-
27-8
x38
-67
H31
5-H
336
2-M
ethy
lhex
anea
591-
76-4
xx
x38
-67
H31
5-H
336
2-M
ethy
lnon
ane
871-
83-0
x
2-M
ethy
lpen
tane
107-
83-5
x4,
191
2-M
ethy
lpen
tano
l10
5-30
-6x
100
2-P
ente
ne10
9-68
-2x
36-3
7-38
3,5-
Dim
ethy
loct
ane
15,8
69-9
3-9
3-E
thyl
hexa
ne61
9-99
-8x
3-M
ethy
lhep
tane
589-
81-1
xx
3-M
ethy
lhex
ane
589-
34-4
xx

16 Assessment of Chemical Hazards in Sick Building Syndrome Situations 313
Tab
le16.4
(con
tinu
ed)
Com
poun
dC
AS
#R
esid
enti
alfl
at
Res
earc
hbu
ildi
ng
(offi
ces)
Uni
vers
ity
buil
ding
(offi
ces)
Odo
ur
thre
shol
db
(µg
m–3
)
TLV
/420
c
(µg
m–3
)R
-phr
ases
Hla
bell
ing
Con
cent
rati
onfo
r
canc
erri
skd
(µg/
m3
)
IAR
Cca
ncer
clas
sifi
cati
one
3-M
ethy
lpen
tane
96-1
4-0
xx
x4.
191
4,5-
Dim
ethy
lnon
ane
17,3
02-2
3-7
4-M
ethy
l-2-
pent
anon
ea10
8-10
-1x
x14
019
520
-36/
37-6
6H
332-
H31
9-
H33
5
4-M
ethy
l-2-
pent
ene
4,46
1-48
-7
Ace
tald
ehyd
e75
-07-
0x
2.7
36/3
7-40
H35
1-H
319-
H33
5
3.7f
5g2B
Ace
tic
acid
64-1
9-7
xx
x90
60
Ace
tone
a67
-64-
1x
xx
11,0
002,
829
36-6
6-67
H31
9-H
336
Ace
toni
tril
e75
-05-
8x
x28
5,00
081
20/2
1/22
-36
H33
2-H
319
Ace
toph
enon
e98
-86-
2x
1.2
117
36H
319
Ben
zald
ehyd
e10
0-52
-7x
x10
0
Ben
zene
a71
-43-
2x
xx
28,0
004
45-4
6-36
/38-
48/2
3/24
/25
H35
0-H
340-
H37
2-
H31
9-
H31
5
1.3–
4.5g
,h
0.4f
1A
Ben
zoic
acid
,2-
[(tr
imet
hyls
ilyl
)oxy
]-
,tri
met
hyls
ilyl
esth
er
3,78
9-85
-3x
Ben
zoth
iazo
le95
-16-
9x
x20
–36
Bro
mof
orm
75-2
5-2
x2,
200
1223
-36/
38H
331-
H31
9-
H31
5
But
anoi
cac
id10
7-92
-6x
0.35
But
ylac
etat
ea12
3-86
-4x
xx
7,70
01,
698
66–6
7H
336
Cam
phen
ea79
-92-
5x
26,0
0036
/37/
38

314 E. Gallego et al.
Tab
le16.4
(con
tinu
ed)
Com
poun
dC
AS
#R
esid
enti
alfl
at
Res
earc
hbu
ildi
ng
(offi
ces)
Uni
vers
ity
buil
ding
(offi
ces)
Odo
ur
thre
shol
db
(µg
m–3
)
TLV
/420
c
(µg
m–3
)R
-phr
ases
Hla
bell
ing
Con
cent
rati
onfo
r
canc
erri
skd
(µg/
m3
)C
ompo
und
Car
bon
disu
lfide
a75
-15-
0x
xx
180
736
/38-
48/2
3-62
-63
H36
1-H
372-
H31
9-
H31
5
Car
bon
tetr
achl
orid
ea56
-23-
5x
x26
0,00
074
23/2
4/25
-40-
48/2
3H
351-
H33
1-
H37
2
0.2f
0.7h
2B
Chl
orof
orm
a67
-66-
3x
xx
650,
000
117
38-4
0-48
/20/
22H
351-
H37
3-
H31
5
0.4h
1.9f
2B
Cyc
lobu
tane
287-
23-0
x38
–67
Cyc
lohe
xane
a11
0-82
-7x
xx
35,6
0081
938
–67
H31
5-H
336
Cyc
lohe
xano
ne10
8-94
-1x
x48
011
967
–68
Cyc
lope
ntan
e28
7-92
-34,
095
Dic
hlor
omet
hane
a75
-09-
2x
xx
4,10
041
540
-48/
20H
351
20g
2B
DL
-Lim
onen
ea7,
705-
14-8
xx
x10
38–4
3H
315
Eth
anol
64-1
7-5
xx
x26
04,
476
20-3
6-37
-38-
40
Eth
ylac
etat
ea14
1-78
-6x
xx
2,20
03,
429
36-6
6-67
H31
9-H
336
Eth
ylbe
nzen
ea10
0-41
-4x
xx
10,0
001,
033
20H
332
4f2B
Eth
ylcy
clob
utan
e4,
806-
61-5
x
Eth
ylcy
cloh
exan
e1,
678-
91-7
x
Eth
ylhe
xano
icac
id14
9-57
-5x
1263
H36
1
Eth
ylis
obut
ylke
tone
623-
56-3
x20
For
mic
acid
64-1
8-6
x2,
000
22
Fur
an11
0-00
-9x
26–4
52B
Hep
tano
icac
id11
1-14
-8x
5020
Hex
amet
hyle
than
e59
4-82
-1x
Hex
anm
ethy
lcyc
lotr
isil
oxan
e54
1-05
-9x
xx
Hex
anoi
cac
id14
2-62
-1x
2020
Isob
utyl
isob
utyr
ate
97-8
5-8
x
Isoc
yana
tocy
cloh
exan
e3,
173-
53-3
x23

16 Assessment of Chemical Hazards in Sick Building Syndrome Situations 315
Tab
le16.4
(con
tinu
ed)
Com
poun
dC
AS
#R
esid
enti
alfl
at
Res
earc
hbu
ildi
ng
(offi
ces)
Uni
vers
ity
buil
ding
(offi
ces)
Odo
ur
thre
shol
db
(µg
m–3
)
TLV
/420
c
(µg
m–3
)R
-phr
ases
Hla
bell
ing
Con
cent
rati
onfo
r
canc
erri
skd
(µg/
m3
)C
ompo
und
Isoo
ctan
e54
0-84
-1x
38–6
7H
315-
H33
6
Isop
enta
ne78
-78-
4x
4,21
466
–67
H33
6
Isop
ropa
nola
67-6
3-0
xx
x80
01,
172
36–6
7H
319-
H33
6
Isop
ropy
lben
zene
a98
-82-
8x
650
586
37H
335
Isot
hioc
yana
tocy
cloh
exan
e1,
122-
82-3
x
Met
hyl
acet
ate
79-2
0-9
xx
x22
,000
1,44
336
-66-
67H
319-
H33
6
Met
hylc
yclo
buta
ne59
8-61
-8x
Met
hylc
yclo
hept
ane
4,12
6-78
-7x
Met
hylc
yclo
hexa
nea
108-
87-2
xx
x3,
833
38–6
7H
315-
H33
6
Met
hylc
yclo
pent
anea
96-3
7-7
x
Met
hyle
thyl
keto
nea
78-9
3-3
xx
x2,
900
1,40
536
-66-
67H
319-
H33
6
m-E
thyl
tolu
enea
620-
14-4
xx
m-X
ylen
ea10
8-38
-3x
xx
700
1,03
320
/21-
38H
332-
H31
5
N,N
-Dim
ethy
lfor
mam
ide
68-1
2-2
xx
140
7161
-20/
21-3
6H
360-
H31
9
N-N
itro
sodi
met
hyla
min
e62
-75-
924
26-4
5-61
H35
0-H
330-
H37
2
0.00
2f2A
Nap
htha
lene
a91
-20-
3x
xx
712
440
H35
10.
3f2B
n-D
ecan
ea12
4-18
-5x
xx
11,3
0036
-37-
38
n-D
odec
anea
112-
40-3
xx
11,8
00
n-H
epta
nal
111-
71-7
xx
1436
-37-
38
n-H
epta
nea
142-
82-5
xx
x93
0,00
03,
905
38–6
7H
315-
H33
6
n-H
exad
ecan
ea54
4-76
-3x
500
38
n-H
exan
al66
-25-
1x
x25
n-H
exan
ea11
0-54
-3x
xx
107,
000
419
38-4
8/20
-62-
67H
361-
H37
3-
H31
5-
H33
6
n-N
onan
ala
124-
19-6
xx
2036
–38
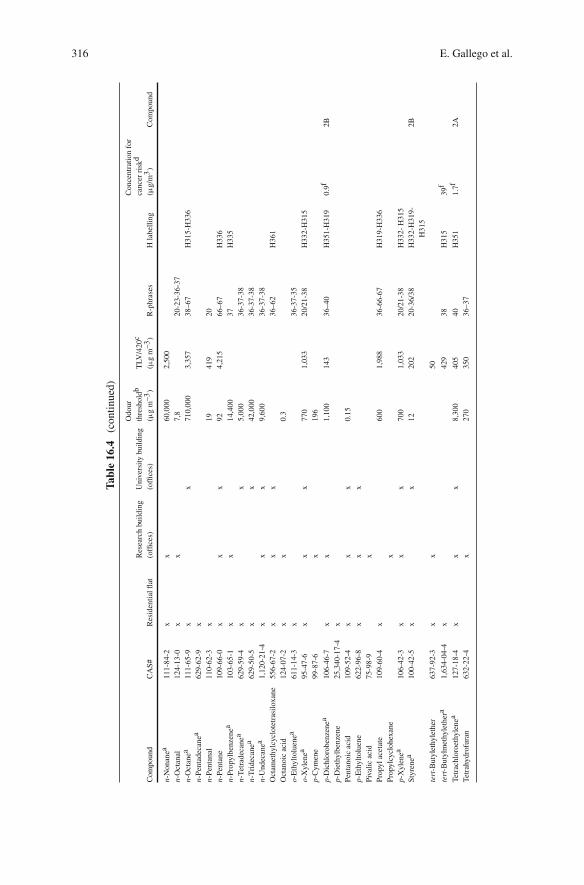
316 E. Gallego et al.
Tab
le16.4
(con
tinu
ed)
Com
poun
dC
AS
#R
esid
enti
alfl
at
Res
earc
hbu
ildi
ng
(offi
ces)
Uni
vers
ity
buil
ding
(offi
ces)
Odo
ur
thre
shol
db
(µg
m–3
)
TLV
/420
c
(µg
m–3
)R
-phr
ases
Hla
bell
ing
Con
cent
rati
onfo
r
canc
erri
skd
(µg/
m3
)C
ompo
und
n-N
onan
ea11
1-84
-2x
x60
,000
2,50
0
n-O
ctan
al12
4-13
-0x
x7,
820
-23-
36-3
7
n-O
ctan
ea11
1-65
-9x
x71
0,00
03,
357
38–6
7H
315-
H33
6
n-P
enta
deca
nea
629-
62-9
x
n-P
enta
nal
110-
62-3
x19
419
20
n-P
enta
ne10
9-66
-0x
xx
924,
215
66–6
7H
336
n-P
ropy
lben
zene
a10
3-65
-1x
x14
,400
37H
335
n-T
etra
deca
nea
629-
59-4
xx
5,00
036
-37-
38
n-T
ride
cane
a62
9-50
-5x
x42
,000
36-3
7-38
n-U
ndec
anea
1,12
0-21
-4x
xx
9,60
036
-37-
38
Oct
amet
hylc
yclo
tetr
asil
oxan
e55
6-67
-2x
xx
36–6
2H
361
Oct
anoi
cac
id12
4-07
-2x
x0.
3
o-E
thyl
tolu
enea
611-
14-3
x36
-37-
35
o-X
ylen
ea95
-47-
6x
xx
770
1,03
320
/21-
38H
332-
H31
5
p-C
ymen
e99
-87-
6x
196
p-D
ichl
orob
enze
nea
106-
46-7
xx
1,10
014
336
–40
H35
1-H
319
0.9f
2B
p-D
ieth
ylbe
nzen
e25
,340
-17-
4x
Pen
tano
icac
id10
9-52
-4x
xx
0.15
p-E
thyl
tolu
ene
622-
96-8
xx
x
Piv
alic
acid
75-9
8-9
x
Pro
pyl
acet
ate
109-
60-4
x60
01,
988
36-6
6-67
H31
9-H
336
Pro
pylc
yclo
hexa
nex
p-X
ylen
ea10
6-42
-3x
xx
700
1,03
320
/21-
38H
332-
H31
5
Sty
rene
a10
0-42
-5x
x12
202
20-3
6/38
H33
2-H
319-
H31
5
2B
tert
-But
ylet
hyle
ther
637-
92-3
xx
50
tert
-But
ylm
ethy
leth
era
1,63
4-04
-4x
429
38H
315
39f
Tet
rach
loro
ethy
lene
a12
7-18
-4x
xx
8,30
040
540
H35
11.
7f2A
Tet
rahy
drof
uran
632-
22-4
x27
035
036
–37

16 Assessment of Chemical Hazards in Sick Building Syndrome Situations 317
Tab
le16.4
(con
tinu
ed)
Com
poun
dC
AS
#R
esid
enti
alfl
at
Res
earc
hbu
ildi
ng
(offi
ces)
Uni
vers
ity
buil
ding
(offi
ces)
Odo
ur
thre
shol
db
(µg
m–3
)
TLV
/420
c
(µg
m–3
)R
-phr
ases
Hla
bell
ing
Con
cent
rati
onfo
r
canc
erri
skd
(µg/
m3
)C
ompo
und
Tet
ram
ethy
lure
a10
8-88
-3x
Tol
uene
a10
8-88
-3x
xx
600
179
38-4
8/20
-63-
65-6
7H
361-
H37
3-
H31
5-
H33
6
Tri
chlo
roet
hyle
nea
79-0
1-6
xx
x3,
900
129
45-3
6/38
-67
H35
0-H
341-
H31
9-
H31
5-
H33
6
5f2A
Tri
chlo
rofl
uoro
met
hane
a75
-69-
4x
xx
28,0
0013
,381
36-3
7-38
a VO
Cid
enti
fied
inse
vera
lw
orld
wid
ein
door
air
stud
ies
(Hol
com
ban
dS
eabr
ook
1995
).bO
dour
thre
shol
dsob
tain
edfr
om:
Com
pila
tion
sof
odou
rth
resh
old
valu
esin
air
and
wat
er.
L.J
.van
Gem
ert
(TN
ON
utri
tion
and
Foo
dR
esea
rch
Inst
itut
e).
Boe
lens
Aro
ma
Che
mic
als
Info
rmat
ion
Ser
vice
(BA
CIS
),T
heN
ethe
rlan
ds,2
003,
and
Odo
rT
hres
hold
sfo
rC
hem
ical
sw
ith
Est
abli
shed
Occ
upat
iona
lHea
lth
Sta
ndar
ds.A
mer
ican
Indu
stri
alH
ygie
neA
ssoc
iati
on.U
SA
,198
9.c T
LV=
Thr
esho
ldli
mit
valu
es, w
ww
.acg
ih.o
rg(A
cces
sed
May
2010
).dE
stim
ated
life
tim
eex
cess
canc
erri
sk(9
5th
perc
enti
leup
per-
boun
d)of
1×
10–5
(1in
100,
000)
for
anin
divi
dual
expo
sed
toth
isco
ncen
trat
ion
for
a70
-yea
rli
feti
me.
e IAR
C(I
nter
nati
onal
Age
ncy
for
Res
earc
hon
Can
cer)
Cla
ssifi
cati
on:
1A:
Car
cino
geni
cto
hum
ans,
2A:
Pro
babl
yca
rcin
ogen
icto
hum
ans,
2B:
Pos
sibl
yca
rcin
ogen
icto
hum
ans.
f Cal
ifor
nia
Env
iron
men
tal
Pro
tect
ion
Age
ncy
Val
ue( 2
010)
.gM
inne
sota
Hea
lth
Ris
kV
alue
(HR
V).
hU
SE
nvir
onm
enta
lP
rote
ctio
nA
genc
yIR
IS(I
nteg
rate
dR
isk
Info
rmat
ion
Sys
tem
).

318 E. Gallego et al.
Table 16.5 R-phrases meaning
R-phrase
R-20 Harmful by inhalationR-23 Toxic by inhalationR-26 Very toxic by inhalationR-36 Irritating to eyesR-37 Irritating to respiratory systemR-38 Irritating to skinR-40 Possible risk of cancerR-45 May cause cancerR-46 May cause heritable genetic damageR-48 Danger of serious damage to health by prolonged exposureR-61 May cause harm to the unborn childR-62 Possible risk of impaired fertilityR-63 Possible risk of harm to the unborn childR-66 Repeated exposure may cause skin dryness or crackingR-67 Vapours may cause drowsiness and dizziness
R-phrases and H labelling, concentration for cancer risk, and the IARC cancerclassifications are also shown.
R-phrases (short for Risk phrases) (Directive 2001/59/EC) describe the natureof special risks attributed to dangerous substances and preparations. These riskphrases, nonetheless, are used in an international context, not just in the EuropeanCommunities. At the moment, however, the new Regulation of the EuropeanCommunities (EC) 1272/2008 on classification, labelling and packaging of sub-stances and mixtures transposes the Globally Harmonised System (GHS), whichis expected to facilitate global trade and the harmonised communication of hazardinformation of chemicals and to promote regulatory efficiency. With this new regula-tion the R-phrases are being replaced by the Hazard labelling (H). The meanings forthe simple and combined R-phrases and the H labelling are described in Tables 16.5,16.6 and 16.7.
A great number of the indoor detected compounds (both in the private dwellingand the offices) (Table 16.4) present irritation potential (skin, eyes and respiratorysystem), as well as some of them are possibly, probably or assured carcinogens.
On the other hand, several compounds can threaten the unborn child in additionto reproduction. A complete evaluation of all VOCs present indoors is a useful toolwhen assessing indoor air quality. Their associated R-phrases and H labelling andtheir TLV/420 value are helpful data when no other reference recommended valuesor guidelines are published.
16.5.1 Indoor Air Quality Regulations, Guidelines
and Recommendations
Different health organizations have established exposure limits/guidelines for cer-tain chemical compounds found in indoor environments. A few examples aredescribed below (EC 2004; EC 2005).

16 Assessment of Chemical Hazards in Sick Building Syndrome Situations 319
Table 16.6 Combined R-phrases meaning
CombinedR-phrase
R20/21 Harmful by inhalation and in contact with skinR20/21/22 Harmful by inhalation, in contact with skin and if swallowedR23/24/25 Toxic by inhalation, in contact with skin and if swallowedR36/37 Irritating to eyes and respiratory systemR36/37/38 Irritating to eyes, respiratory system and skinR36/38 Irritating to eyes and skinR37/38 Irritating to respiratory system and skinR48/20 Harmful: danger of serious damage to health by prolonged exposure
through inhalationR48/20/22 Harmful: danger of serious damage to health by prolonged exposure
through inhalation and if swallowedR48/23 Toxic: danger of serious damage to health by prolonged exposure
through inhalationR48/23/24/25 Toxic: danger of serious damage to health by prolonged exposure
through inhalation, in contact with skin and if swallowed
Table 16.7 H labelling meaning
H-phrase
H315 Causes skin irritationH319 Causes serious eye irritationH330 Fatal if inhaledH331 Toxic if inhaledH332 Harmful if inhaledH335 May cause respiratory irritationH336 May cause drowsiness or dizzinessH340 May cause genetic defectsH341 Suspected of causing genetic defectsH350 May cause cancerH351 Suspected of causing cancerH360 May damage fertility or the unborn childH361fd Suspected of damaging fertility or the unborn childH372 Causes damage to organs through prolonged or repeated exposureH373 May cause damage to organs through prolonged or repeated exposure
The World Health Organization has developed the Air Quality Guidelines forEurope. For several compounds the guidelines establish certain recommendationsto reduce human exposure to harmful levels of air pollutants. For some compounds,tough, there are no guideline values recommended, however their estimated risk isindicated. Besides, guidelines based on carcinogenic effects have also been estab-lished for those carcinogens that are considered to be genotoxic (WHO 2005). See:www.who.int
The Agency for Toxic Substances and Disease Registry (ATSDR), a federalpublic health agency of the US Department of Health and Human Services, has

320 E. Gallego et al.
established the Minimal Risk Levels (MRLs). MRLs are estimations of the dailyhuman exposure to hazardous substances that are plausible to be without observablerisk of adverse noncancer health effects over a specified duration of exposure. See:www.atsdr.cdc.gov
The Integrated Risk Information System (IRIS), from the US EnvironmentalProtection Agency, has developed the inhalation Reference Concentration (RfC).The RfC is analogous to the oral RfD (Reference Dose) in respect to breathed air.The inhalation RfC considers toxic effects for both the respiratory system (portal-of-entry) and for effects peripheral to the respiratory system (extrarespiratory effects).In general, the RfC is an estimate of a daily inhalation exposure of the human pop-ulation that is plausible to be without an observable risk of harmful effects during alife period. See: www.epa.gov/iris
The Office of Environmental Health Hazard Assessment of the CalifornianEnvironmental Protection Agency (OEHHA) has developed the Reference ExposureLevels (RELs), the concentrations at or below which no adverse health effects arepredictable in the general human population. RELs are based on the most sensitiverelevant adverse health effects reported in the literature (medical and toxicological).RELs are designed to protect the most sensitive individuals in the population bythe inclusion of margins of safety. REL values are subdivided in acute and chronicexposures to pollutants. See: www.oehha.org
The Massachusetts Department of Environmental Protection provides the TELs(Threshold Effects Exposure Limits), the NTELs (Non-threshold Effects ExposureLimits) and the AALs (Allowable Ambient Limits). TELs determine the com-pound air concentration that is allowable based on protection against thresholdhealth effects (e.g. acute and chronic toxicity, developmental and reproductive toxi-city). NTELs are designed to provide protection against nonthreshold effects basedon estimates of potential risks to humans from carcinogenicity and mutagenicity.AALs are the lowest of the values obtained for TELs and NTELs for each com-pound, and cover all types of effects, including the most sensitive effect. See:www.mass.gov/dep
The Minnesota Pollution Control Agency has developed the Health Risk Values(HRVs) for chemicals or chemical mixtures emitted to ambient air. HRVs arereferred to the concentration of a chemical or defined mixture of chemicals inambient air, at or below which the chemical or defined mixture of chemicals isimprovable to cause an adverse health effect to the general public. See: www.pca.state.mn.us
The Federal Environmental Agency of Germany (Umweltbundesamt – UBA) hasestablished two Guideline Values. Guideline Value I (GV I) is the concentrationlevel at which a compound does not induce negative health effects even at a lifetimeexposure period. On the other hand, Guideline Value II (GV II) settles the limitconcentration for a given compound. If this concentration is reached or exceeded in aconcrete place, immediate actions have to be conducted due to continuous exposureat this concentration level can represent a threat to health, especially for sensitivepeople. See: www.Umweltbundesamt.de

16 Assessment of Chemical Hazards in Sick Building Syndrome Situations 321
Environment Canada – Health Canada (EC-HC) has established the TolerableConcentrations (TCs) and the Tumorigenic Concentrations 05 (TC05). TCs arethe air pollution concentrations to which it is believed that a human being can beexposed continuously over a lifetime without observed harmful effects. On the otherhand, the TC05 is the air pollution concentration correlated with a 5% increasein incidence of deaths or tumours associated with pollution exposure to concretepollutants. See: www.hc-sc.gr.ca
In addition to that, during the last 20 years both the European Commission andthe United States have developed several studies related to human exposure to cho-sen gaseous pollutants and particles (e.g. EU-EXPOLIS project, US-TEAM project,US-NHEXAS project) (Saarela et al. 2003; Ahsmore and Dimitroulopoulou 2009).Recently, in the year 2002, the Joint Research Centre of the European Commissionstarted a project called “Critical Appraisal of the Setting and Implementation ofIndoor Exposure Limits in the EU” (INDEX) to assess the health risks of indoorair pollutants. The main objectives of the project were to determine health risks ofindoor-originated chemical pollutants and to provide suggestions and recommenda-tions on potential exposure limits or other risk management measures. The INDEXproject established high priority compounds to be regulated in indoor air due totheir health impact on human beings as well as their presence in indoor sources(Table 16.8). Benzene, toluene, xylenes, naphthalene, styrene, formaldehyde, andthe terpenes α-pinene and limonene were among the selected compounds (EC2005; Koistinen et al. 2008; Ashmore and Dimitroulopoulou 2009). A summaryof recommendations and management options were published (EC 2004).
16.5.2 TVOC Classification
TVOC has been recommended to be used as a screening tool, due to it does not havebiological relevance, and is not recommended for making definitive conclusions
Table 16.8 Indoor pollutants that were assessed and considered the most hazardous in theidentification process of hazardous compounds in the INDEX project
1-Butanol Benzenea Hexaldehyde Phenol2-Buthoxyethanol Benzo[a]pyrene Lead Propionaldehyde2-Ethyl-1-hexanol Cadmium m+p-Xylene Propylbenzene2-Methyl-1-propanol Carbon monoxidea Mercury Styrene3-Carene Decane Methyl-ethyl-ketone TetrachloroethyleneAcetaldehyde Dichloromethane Naphtalenea TolueneAcetone Diisocyanate Nitrogen dioxidea TrichloroethyleneAmmonia d-Limonene Nonane Trimethylbenzenesα-Pinene Ethylbenzene o-Xylene Tris-(2-chloroethyl)
phosphateBenzaldehyde Formaldehydea Pentachlorophenol Undecane
aPriority pollutants.

322 E. Gallego et al.
about indoor air quality (Andersson et al. 1997). However, it has some usefulapplications as an indicator of the presence of VOCs indoors and for identifyingtheir possible sources (Mølhave 2000; Wolkoff and Nielsen 2001; Mølhave 2003;Hippelein 2004; Wong et al. 2006; Gallego et al. 2009a).
Seifert (1990) estimated a target TVOC indoor air quality guideline valuebased on two empirical field studies in German and Dutch homes (Seifert andAbraham 1982; WHO 1989; Lebret et al. 1986; Krause et al. 1987), suggestingthat TVOC concentrations in indoor air should not exceed 300 µg m–3. On thebasis of the above mentioned empirical field studies, a standard classification of thedwelling indoor air VOCs concentrations was proposed depending on the differ-ent chemical families present indoors. Alkanes, aromatic hydrocarbons, terpenes,halocarbons, esters, aldehydes (except formaldehyde) and ketones and other com-pounds, should contribute with 33, 17, 10, 10, 7, 7 and 16% of the TVOC,respectively.
In addition to that, two indoor air quality criterions were established. Criterion1: no individual compound should exceed 50% of the average value of its classand Criterion 2: no individual compound should exceed 10% of the TVOC value.Moreover, Mølhave (1991a) suggested four exposure ranges of TVOC: comfortrange (<0.2 mg m–3), multifactorial exposure range (0.2–3 mg m–3), discomfortrange (3–25 mg m–3) and toxic range (>25 mg m–3).
16.6 Solutions for Poor IAQ
The concern related to bad indoor air quality has increased in the past years, mainlydue to the fact that people spend around 90% of their time indoors. Buildingsprovided with HVAC systems are not an exception, and sometimes they presenthigh levels of prevalence of nuisance problems associated with poor indoor airquality (Seppänen and Fisk 2002). As building materials and indoor developedactivities are two of the main sources of indoor air pollution, a control over themshould be advised in a first instance (EC 1992; Tuomainen et al. 2003). However,if these aspects cannot be controlled, indoor air purification could be a valuablemethodology to improve IAQ (Yu et al. 2009).
16.6.1 Source Identification Through Detected Compounds
The type of compounds determined in indoor air analysis would be indicative oftheir sources. Depending on the kind of compounds found, their source would beindoors or outdoors, indicating that their emission comes from building materialsor the activities developed inside the dwelling or, on the other hand, that the com-pounds found indoors come from outdoors (e.g. nearby industries, traffic, powerplants) entering the building through intake vents, the HVAC system or by means ofthe open doors and windows.

16 Assessment of Chemical Hazards in Sick Building Syndrome Situations 323
16.6.1.1 Indoor Sources
In new built homes, the best way to provide adequate indoor air quality would be theapplication of adequate ventilation and the use of building and furnishing materialswith low VOCs emission rates (Hodgson et al. 2000; Guo et al. 2003; Wolkoff 2003;EC 2004; Chan et al. 2009; Yang et al. 2009; Yu et al. 2009).
Guo et al. (2003) developed a methodology to select low emitting building mate-rials to create a low VOCs emission house. Their methodology is divided in threestages. The first stage is based in the evaluation of the products to be used in thehouse through the information that can be obtained from manufacturers or from theliterature. The second stage is based in a TVOC analysis through GC-FID. Andthe third and last stage is based on the occupant exposure to indoor air VOCs dur-ing the occupation of the building (e.g. identification of specific VOCs by GC/MS,chemical/toxicological evaluation, health risks evaluation).
16.6.1.2 Outdoor Sources
Several studies in different worldwide established dwellings expose that the mostabundant VOCs found in residential and public buildings are toluene, benzene,ethylbenzene, m+p-xylenes, 1,2,4-trimethylbenzene, 1,3,5-trimethylbenzene,DL-limonene, α-pinene, p-dichlorobenzene, trichloroethylene, tetrachloroethylene,n-decane, 2-buthoxyethanol, chloroform, n-hexanal and n-nonanal (Godish 2001;Lee et al. 2002; Saarela et al. 2003; Sexton et al. 2004; Schlink et al. 2004; Wolkoffet al. 2006; Jia et al. 2008b). In addition to that, in American office buildings,acetone and 2-buthoxyethanol also have been detected in relevant abundance(Griman et al. 1999).
On the other hand, terpenes have strong sources indoors, as their I/O ratio val-ues tend to be higher than the observed for other compounds (Saarela et al. 2003).However, if the compounds found in highest concentrations in the studied build-ings are not the expected, that can mean that their release is not originated by thecommon sources of VOCs indoors (Jones 1999; Gallego et al. 2008b), like clean-ing products, floor waxes, paints or vehicle exhausts (Weschler et al. 1990; Godish2001; Reiser et al. 2002; Zhang and Xu 2002; Jia et al. 2008a; Katsoyiannis et al.2008), and that their origin may come from polluted outdoor air entering indoors(Gallego et al. 2009a).
An exhaustive revision of the activities realized in the adjacent buildings of thestudied dwelling has to be done in order to find the possible sources of the unex-pected detected VOCs. In previous studies, these kind of surveys have allowed thefinding of not declared activities (e.g. manipulation and storage facilities of indus-trial solvents) that caused the annoying episodes indoors, as the polluted outdoor airentered the dwelling through the windows and interior patios (Gallego et al. 2009a).
In addition to that, remote outdoor sources such as transportation (motor vehicleexhausts), fossil-fuel-burning power plants, chemical plants, petroleum refineries,construction work, and solid waste and sewage facilities (Baek et al. 1997; Godish

324 E. Gallego et al.
1997; Mohamed et al. 2002; Brown et al. 2007; Gallego et al. 2007; Khoder 2007)can also contribute to poor indoor air quality generating annoying odour episodes.In this case, a combination of social participation (Sect. 16.4.1), chemical control(Sect. 16.4.3) and back-trajectory modelling is used to determine the origin of odourepisodes, as well as the exact VOCs that generate them (Gallego et al. 2008a; b).
16.6.2 Application of Corrective Measures
When an appropriate ventilation rate, with good quality outdoor air, is appliedto a dwelling, VOCs concentrations should be maintained in an acceptable level(Holcomb and Seabrook 1995; Weschler and Shields 2000; Zuraimi et al. 2003;Kim et al. 2008). However, if adequate ventilation is applied and VOCs values con-tinue high, probably strong local sources of these compounds are located inside ornear the building (Weschler et al. 1990). In these cases, when the control of pollu-tion sources is not possible, indoor air purification is an important methodology toimprove IAQ removing indoor air contaminants (Godish 2001; Fisk et al. 2002; Yuet al. 2009; Xu et al. 2010). Five methods of indoor air purification are the mostcommon: filtration, adsorption, photocatalytic oxidation (PCO), negative air ions(NAIs) and non-thermal plasma (NTP).
Filtration methodologies are economical and efficient, however, drawbacksderived from micro-organisms contamination, mainly due to their growth in theparticulate matter deposited in the filters, can be problematic. Adsorption meth-ods, based in activated carbon, activated carbon fibres, zeolites, porous clay ore,activated alumina, silica gel and/or molecular sieves adsorbents, are highly usedmechanisms. Nonetheless, the adsorptive capacity of the filters is limited and gen-erally family/compound specific (Tham et al. 2004), and their replacement is oftenexpensive. In addition to that, secondary pollution can be derived from the filters(Chan et al. 2009).
PCO techniques degrade indoor pollutants and transform them into final com-pounds such as CO2, water and mineral inorganic substances less harmful to humanhealth than VOCs. Pollutants removing efficiencies are relatively high (Demeestereet al. 2008b), however, more research has to be done to apply PCO in an efficientway as most applications are still limited to ambient air conditions (Chan et al.2009).
NAIs procedures remove aerosol particles from air through particle charging.The reactions produced between VOCs and NAIs are slow and complicated, andthey are also affected by temperature and relative humidity. Hence, more researchhas to be done to develop more adequate NAIs methodologies.
NTP approaches produce chemically active species (e.g. atomic oxygen,hydroxyl radicals, ozone) that are able to remove indoor air pollutants. Nevertheless,NTP efficiency is low at the present time, and the formation of several by-productsduring air purification can also be a negative aspect of this concrete metrology.A combination of several of the above mentioned techniques can be more useful toolfor indoor air purification than the use of a unique methodology (Yu et al. 2009).

16 Assessment of Chemical Hazards in Sick Building Syndrome Situations 325
References
Aitken MD, Okun MF (1992) Quantification of wastewater odours by the affected public. WaterEnviron Res 64:720–727.
Ana G, Shendell DG, Odeshi TA, Sridhar MKC (2009) Identification and initial characterization ofprominent air pollution sources and respiratory health at secondary schools in Ibadan, Nigeria.J Asthma 46:670–676.
Andersson K, Bakke JV, Bjørseth O, Bornehag C-G, Clausen G, Hongslo JK, Kjellman M,Kjærgaard S, Levy F, Mølhave L, Skerfving S, Sundell J (1997) TVOC and health innon-industrial indoor environments. Indoor Air 7:78–91.
Ashmore MR, Dimitroulopoulou C (2009) Personal exposure of children to air pollution. AtmosEnviron 43:128–141.
ASHRAE (2007) Ventilation for Acceptable Indoor Air Quality. ANSI/ASHRAE Standard62.1.2007. American Society of Heating, Refrigeration and Air-Conditioning Engineers, Inc,Atlanta, GA.
Atkinson R (2000) Atmospheric chemistry of VOCs and NOx. Atmos Environ 34:2063–2101.Baek S-O, Kim Y-S, Perry R (1997) Indoor air quality in homes, offices and restaurants in Korean
urban areas-indoor/outdoor relationships. Atmos Environ 31:529–544.Barro R, Regueiro J, Llompart M, Garcia-Jares C (2009) Analysis of industrial contaminants
in indoor air: Part 1. Volatile organic compounds, carbonyl compounds, polycyclic aromatichydrocarbons and polychlorinated biphenyls. J Chromatogr A 1216:540–566.
Bascom R, Kesavanathan J, Swift DL (1995) Human susceptibility to indoor contaminants. OccupMed 10:119–132.
Batterman S, Hatzivasilis G, Jia C (2006) Concentrations and emissions of gasoline and othervapors from residential vehicle garages. Atmos Environ 40:1828–1844.
Batterman S, Jia C, Hatzivasilis G (2007) Migration of volatile organic compounds from attachedgarages to residences: A major exposure source. Environ Res 104:224–240.
Batterman S, Matts T, Kalliokoski P, Barnett E (2002) Low flow active and passive sampling ofVOCs using thermal desorption tubes: Theory and application at an offset printing facility.J Environ Monit 4:361–370.
Bernstein JA, Alexis N, Bacchus H, Bernstein IL, Fritz P, Horner E, Li N, Mason S, Nel A, OulletteJ, Reijula K, Reponen T, Seltzer J, Smith A, Tarlo SM (2008) The health effects of nonindustrialindoor air pollution. J Allergy Clin Immun 121:585–591.
Bornehag C-G, Stridh G (2000) Volatile organic compounds (VOC) in the Swedish housing stock.Proc Health Build 1:437–442.
Brown S, Frankel AM, Hafner HR (2007) Source apportionment of VOCs in the Los Angeles areausing positive matrix factorization. Atmos Environ 41:227–237.
California Environmental Protection Agency (2010) Office of Environmental Health HazardAssessment, Sacramento, CA; www.oehha.org/air.html. Accessed May 2010.
Camel V, Caude M (1995) Trace enrichment methods for the determination of organic pollutantsin ambient air. J Chromatogr A 710:3–19.
Chan W, Lee S-C, Chen Y, Mak B, Wong K, Chan C-S, Zheng C, Guo X (2009) Indoor air qualityin new hotels’ guest rooms of the major world factory region. Int J Hosp Manag 28:26–32.
Cheong KW, Chong KY (2001) Development and application of an indoor air quality audit to anair-conditioned building in Singapore. Build Environ 36:181–188.
Chun C, Sung K, Kim E, Park J (2010) Self-reported multiple chemical sensitivity symptoms andpersonal volatile organic compounds exposure concentrations in construction workers. BuildEnviron 45:901–906.
Clements-Croome DJ, Awbi HB, Bakó-Biró Z, Kochhar N, Williams M (2008) Ventilation rates inschools. Build Environ 43:362–367.
Dabrowski A (2001) Adsorption-from theory to practice. Adv Colloid Interface Sci 93:135–224.Dalton P (2003) Upper airway irritation, odor perception and health risk Due To airborne
chemicals. Toxicol Lett 140–141:239–248.

326 E. Gallego et al.
Demeestere K, Dewulf J, De Roo K, De Wispelaere P, Van Langenhove H (2008a) Qualitycontrol in quantification of volatile organic compounds analysed by thermal desorption-gaschromatography-mass spectrometry. J Chromatogr A 1186:348–357.
Demeestere K, Dewulf J, De Witte B, Beeldens A, Van Langenhove H (2008b) Heterogeneousphotocatalytic removal of toluene from air on building materials enriched with TiO2. BuildEnviron 43:406–414.
Demeestere K, Dewulf J, De Witte B, Van Langenhove H (2007) Sample preparation forthe analysis of volatile organic compounds in air and water matrices. J Chromatogr A1153:130–144.
Desauziers V (2004) Traceability of pollutant measurements for ambient air monitoring. TrACTrends Anal Chem 23:252–260.
Destaillats H, Maddalena RL, Singer BC, Hogdson AT, McKone TE (2008) Indoor pollutants emit-ted by office equipment: A review of reported data and information needs. Atmos Environ42:1371–1388.
Dettmer K, Engewald W (2002) Adsorbent materials commonly used in air analysis for adsorp-tive enrichment and thermal desorption of volatile organic compounds. Anal Bioanal Chem373:490–500.
Dettmer K, Engewald W (2003) Ambient air analysis of volatile organic compounds usingadsorptive enrichment. Chromatogr Suppl 57:S339–S347.
Donaldson JD, Grimes SM, Mehta L, Jafari AJ (2003) Application of thermal desorption tothe development of a gas chromatographic/mass spectrometric method for the determina-tion of toluene, chlorinated aromatic hydrocarbons, and 2,3,7,8-tetrachlorodibenzo-p-dioxinin combustion emissions. J AOAC Int 86:39–43.
Duarte-Davidson R, Courage C, Rushton L, Levy L (2001) Benzene in the environment: Anassessment of the potential risks to the health of the population. J Occ Env Med 58:2–13.
EC (European Commission) (1989) Sick Building Syndrome. Indoor air quality & its impact onman (Report No. 4). Office for Official Publication of the European Communities, Luxembourg.
EC (European Commission) (1992) Ventilation Requirements in Buildings. Indoor air quality & itsimpact on man (Report No. 11). Office for Official Publication of the European Communities,Luxembourg.
EC (European Commission) (1997a) Total Volatile Organic Compounds (TVOC) in Indoor AirQuality Investigations. Indoor air quality & its impact on man (Report No. 19). Office forOfficial Publication of the European Communities, Luxembourg.
EC (European Commission) (1997b) Evaluation of VOC Emissions from Building Products.Indoor air quality & its impact on man (Report No. 18). Office for Official Publication ofthe European Communities, Luxembourg.
EC (European Commission) (2004) Summary on recommendations and management options.Joint Research Centre, Institute for Health and Consumer Protection Physical and ChemicalExposure Unit, Ispra, Italy.
EC (European Commission) (2005) Final Report. The INDEX Project. Critical Appraisal of theSetting and Implementation of Indoor Exposure Limits in the EU. Joint Research Centre,Institute for Health and Consumer Protection Physical and Chemical Exposure Unit, Ispra,Italy.
Eberlein-Königa B, Przybillaa B, Kühnla P, Golling G, Gebefügi I, Ring J (2002) Multiplechemical sensitivity (MCS) and others: Allergological, environmental and psychologicalinvestigations in individuals with indoor air related complaints. Int J Hyg Envir Health205:213–220.
Edwards RD, Jantunen MJ (2001) Benzene exposure in Helsinki, Finland. Atoms Environ35:1411–1420.
Edwards RD, Jurvelin J, Koinstinen K, Saarela K, Jantunen M (2001) VOC source identificationfrom personal and residential indoor, outdoor and workplace microenvironment samples inEXPOLIS-Helsinki, Finland. Atmos Environ 35:4829–4841.

16 Assessment of Chemical Hazards in Sick Building Syndrome Situations 327
Edwards RD, Schweizer C, Jantunen M, Lai HK, Bayer-Oglesby L, Katsouyanni K,Nieuwenhuijsen M, Saarela K, Sram R, Künzli N (2005) Personal exposures to VOC in theupper end of the distribution-relationships to indoor, outdoor and workplace concentrations.Atmos Environ 39:2299–2307.
Emmerich SJ, Gorfain JE, Howard-Reed C (2003) Air and pollutant transport from attachedgarages to residential living spaces. Int J Ventilation 2:265–276.
Fisk WJ, Faulkner D, Palonen J, Seppanen O (2002) Performance and costs of particle air filtrationtechnologies. Indoor Air 12:223–234.
Freijer JI, Bloemen HJ (2000) Modeling relationships between indoor and outdoor air quality. J AirWaste Manage Assoc 50:292–300.
Gallego E, Roca FJ, Perales JF, Guardino X (2008a) Simultaneous evaluation of odor episodes andair quality: Methodology to identify air pollutants and their origin combining chemical analysis(TD-GC/MS), social participation, and mathematical simulations techniques. In: Romano GC,Conti AG (Eds.) Air Quality in the XXI Century. Nova Science Publishers Inc., New York, NY.
Gallego E, Soriano C, Roca FJ, Perales JF, Alarcón M, Guardino X (2008b) Identification ofthe origin of odour episodes through social participation, chemical control and numericalmodelling. Atmos Environ 42:8150–8160.
Gallego E, Roca FJ, Guardino X, Rosell MG (2008c) Indoor and outdoor BTX levels in Barcelonacity metropolitan area and catalan rural areas. J Environ Sci 20:1063–1069.
Gallego E, Roca FJ, Perales JF, Guardino X (2009a) Determining indoor air quality and identifyingthe origin of odour episodes in indoor environments. J Environ Sci 21:333–339.
Gallego E, Roca FJ, Perales JF, Guardino X (2009b) Use of sorbents in air quality control systems.In: Willis TP (Ed.) Sorbents: Properties, Materials and Applications. Nova Science PublishersInc., New York, NY.
Gallego E, Roca FJ, Perales JF, Guardino X (2010) Comparative study of the adsorption perfor-mance of a multi-sorbent bed (carbotrap, carbopack X, carboxen 569) and a tenax TA adsorbenttube for the analysis of volatile organic compounds (VOCs). Talanta 81:916–924.
Gallego E, Roca FX, Perales F, Ribes A, Carrera G, Guardino X, Berenguer MJ (2007)Isocyanatocyclohexane and isothiocyanatocyclohexane levels in urban and industrial areas andpossible emission-related activities. Atmos Environ 41:8228–8240.
Godish T (1997) Air Quality. Lewis Publishers, CRC Press, Boca Raton, FL.Godish T (2001) Indoor Environmental Quality. Lewis Publishers, CRC Press, Boca Raton, FL.Griman JR, Hadwen GE, Burton LE, Wombe SE, McCarthy JF (1999) Individual volatile organic
compound prevalence and concentrations in 56 buildings of the building assessment surveyand evaluation (BASE) study. In: Proceedings of the 8th international conference on indoor airquality and climate, vol. 2, pp. 460–465, Edinburgh, Scotland.
Guo H, Lee SC, Chan LY, Li WM (2004) Risk assessment of exposure to volatile organiccompounds in different indoor environments. Environ Res 94:57–66.
Guo H, Murray F, Lee SC (2003) The development of low volatile organic compound emissionhouse-a case study. Build Environ 38:1413–1422.
Harper M (2000) Sorbent trapping of volatile organic compounds from air. J Chrom A885:129–151.
Hey K, Juran S, Schäper M (2009) Neurobehavioral effects during exposures to propionic acid-anindicator of chemosensory distraction? Neurotoxicology 30:1223–1232.
Hippelein M (2004) Background concentrations of individual and total volatile organic compoundsin residential indoor air of Schleswig-Holstein, Germany. J Environ Monit 6:745–752.
Hodgson AT, Rudd AF, Beal D, Chandra S (2000) Volatile organic compound concentrations andemission rates in new manufactured and site-built houses. Indoor Air 10:178–192.
Holcomb LC, Seabrook BS (1995) Indoor concentrations of volatile organic compounds:Implications for comfort, health and regulation. Indoor Environ 4:7–26.
Huang H, Haghighat F (2003) Building materials VOC emissions-a systematic parametric study.Build Environ 38:995–1005.
Hummel T, Dalton P, Dilks DD (1999) Effects of exposure to irritants. Soc Neurosci Abstr 25:2187.

328 E. Gallego et al.
Hummelgaard J, Juhl P, Sæbjörnsson KO, Clausen G, Toftum J, Langkide G (2007) Indoor airquality and occupant satisfaction in five mechanically and four naturally ventilated open-planoffice buildings. Build Environ 42:4051–4058.
Hutter H-P, Moshammer H, Wallner P, Damberger B, Tappler P, Kundi M (2006) Health complaintsand annoyances after moving into a new office building: A multidisciplinary approach includinganalysis of questionnaires, air and house dust samples. Int J Hyg Environ Health 209:65–68.
Hyttinen M, Oasanen P, Björkroth M, Kalliokoski P (2007) Odors and volatile organic compoundsreleased from ventilation filters. Atmos Environ 41:4029–4039.
Ilgen E, Karfich N, Levsen K, Angerer J, Schneider P, Heinrich J, Wichmann H-E, DunemannL, Begerow J (2001a) Aromatic hydrocarbons in the atmospheric environment: Part I. Indoorversus outdoor sources, the influence of traffic. Atmos Environ 35:1235–1252.
Ilgen E, Levesen K, Angerer J, Schneider P, Heinrich J, Wichmann H-E (2001b) Aromatichydrocarbons in the atmospheric environment: Part II. Univariate and multivariate analysis andcase studies of indoor concentrations. Atmos Environ 35:1253–1264.
ISO 16000-6. Indoor air. Determination of volatile organic compounds in indoor and test chamberair by active sampling on Tenax TA sorbent, thermal desorption and gas chromatography usingMS/FID.
Järnström H, Saarela K, Kalliokoski P, Pasanen A-L (2006) Reference values for indoor airpollutant concentrations in new, residential buildings in Finland. Atmos Environ 40:7178–7191.
Jensen LK, Larsen A, Mølhave L, Hansen MK, Knudsen B (2001) Health evaluation of volatileorganic compound (VOC) emissions from wood and wood-based materials. Arch EnvironHealth 56:419–432.
Jia C, Batterman S, Godwin C (2008a) VOCs in industrial, urban and suburban neighborhoods-part2: Factors affecting indoor and outdoor concentrations. Atmos Environ 42:2101–2116.
Jia C, Batterman S, Godwin C (2008b) VOCs in industrial, urban and suburban neighbor-hoods, part 1: Indoor and outdoor concentrations, variation, and risk drivers. Atmos Environ42:2083–2100.
Jo W-J, Sohn J-S (2009) The effect of environmental and structural factors on indoor air quality ofapartments in Korea. Build Environ 44:1794–1802.
Johansson I (1999) The Role of Volatile Organic Compounds in the Assessment of Indoor AirQuality. Thesis, Department of Chemistry, Division of Analytical Chemistry. Royal Institute ofTechnology, Stockholm.
Jones AP (1999) Indoor air quality and health. Atmos Environ 33:4535–4564.Katsoyiannis A, Leva P, Kotzias D (2008) VOC and carbonyl emissions from carpets: A
comparative study using four types of environmental chambers. J Hazard Mater 152:669–676.Khoder MI (2007) Ambient levels of volatile organic compounds in the atmosphere of Greater
Cairo. Atmos Environ 41:554–566.Kim S-S, Kang D-H, Choi D-H, Yeo M-S, Kim K-W (2008) Comparison of strategies to improve
indoor air quality at the pre-occupancy stage in new apartment buildings. Build Environ43:320–328.
Kim K-H, Oh S-I, Choi Y-J (2004) Comparative analysis of bias in the collection of airbornepollutants: Tests on major aromatic VOC using three types of sorbent-based methods. Talanta64:518–527.
Knöppel H, Schauenburg H (1989) Screening of household products for the emission of volatileorganic compounds. Environ Int 15:413–418.
Koistinen K, Kotzias D, Kephalopoulos S, Schlitt C, Carrer P, Jaunten M, Kirchner S, McLaughlinJ, Mølhave L, Fernandes EO, Seifert B (2008) The INDEX project: Executive summary of aeuropean union project on indoor air pollutants. Allergy 63:810–819.
Kongtip P, Thongsuk W, Yoosook W, Chantanakul S (2006) Health effects of metropolitan traffic-related air pollutants on street vendors. Atmos Environ 40:7138–7145.
Krause C, Mailahn W, Nagel R, Schulz C, Seifert B, Ullrich D (1987) Occurrence of volatileorganic compounds in the air of 500 homes in the Federal Republic of Germany. In:Proceedings of indoor air’87, institute of water, soil and air hygiene, Berlin-Dahlem, Germany.

16 Assessment of Chemical Hazards in Sick Building Syndrome Situations 329
Kuntasal ÖO, Karman D, Wang D, Tuncel SG, Tuncel G (2005) Determination of volatile organiccompounds in different microenvironments by multibed adsorption and short-path thermaldesorption followed by gas chromatographic-mass spectrometric analysis. J Chromatogr A1099:43–54.
Lebret E, van del Wiel HJ, Bos H, Noij D, Boleij JSM (1986) Volatile organic compounds in Dutchhomes. Environ Int 12:323–332.
Lee SC, Li W-M, Ao C-H (2002) Investigation of indoor air quality at residential homes in HongKong-case study. Atmos Envrion 36:225–237.
Lehmann I, Röder-Stolinski C, Nieber K, Fischäder G (2008) In vitro models for the assess-ment of inflammatory and immuno-modulatory effects of the volatile organic compoundchlorobenzene. Exp Toxicol Pathol 60:185–193.
Levy F (1997) Clinical features of multiple chemical sensitivity. Scand J Work Envrion Health23:69–73.
Liang H-M, Liao C-M (2007) Modeling VOC-odor exposure risk in livestock buildings.Chemosphere 68:781–789.
Lin Z, Chow TT, Fong KF, Tsang CF, Wang Q (2005) Comparison of performances of displacementand mixing ventilations. Part II: Indoor air quality. Int J Refrig 28:288–305.
Lundgren B, Jonsson B, El-Olausson B (1999) Materials emission of chemicals-PVC flooringmaterials. Indoor Air 9:202–208.
Maroni M, Seifert B, Lindvall T (1995) Indoor Air Quality. A comprehensive reference book. AirQuality monographs-vol. 3. Elsevier, Amsterdam.
McKenzie JR, Mann J (2004) Use of odour annoyance index surveys for the confirmation ofcomputer based dispersion modelling. Proceedings of Air Quality Modelling Conference: AirQuality Modelling. Air & Waste Management Association, pp.285–299.
Minnesota Pollution Control Agency (2010) Health Risk Values, Minnesota Rules, sections4717.8000 to 4717.8600, St. Paul, MN; www.revisor.leg.state.mn.us/arule/4717. Accessed May2010.
Mohamed M, Kang D, Aneja VP (2002) Volatile organic compounds in some urban locations inunited states. Chemosphere 47:863–882.
Mølhave L (1991a) Volatile organic compounds, indoor air quality and health. Indoor Air1:357–376.
Mølhave L, Jensen JG, Larsen S (1991b) Subjective reactions to volatile organic compounds as airpollutants. Atmos Environ 25A:1283–1293.
Mølhave L (1992) Interpretation and limitations of the concept “total volatile organic compounds”(TVOC) as an indicator of human responses to exposures of volatile organic compounds (VOC)in indoor air. Indoor Air 2:65–77.
Mølhave L (1999) The TVOC concept. In: Salthammer T (Ed.) Organic Indoor Air Pollutants.WILEY-VCH, Weinheim.
Mølhave L (2000) Volatile organic compounds and the sick building syndrome. In: Spengler Jet al (Eds.) Human Toxicants: Human Exposures and Their Health Effects. WILEY-VCH,Weinheim.
Mølhave L (2001) Sensory irritation in humans caused by volatile organic compounds (VOCs) asindoor air pollutants: A summary of 12 exposure experiments. In: Spengler J et al (Eds.) Indoorair Quality Handbook. McGraw-Hill, New York, NY.
Mølhave L (2003) Organic compounds as indicators of air pollution. Indoor Air 13:12–19.Mølhave L, Clausen G, Berglund B, De Ceaurriz J, Kettrup A, Lindvall T, Maroni M, Pickering
AC, Risse U, Rothweiler H, Seifert B, Younes M (1997) Total volatile organic compounds(TVOC) in indoor air quality investigations. Indoor Air 7:225–240.
Monks PS, Granier C, Fuzzi S, Stohl A, Williams ML, Akimoto H, Amann M, Baklanov A,Baltensperger U, Bey I, Blake N, Blake RS, Carslaw K, Cooper OR, Dentener F, FowlerD, Fragkou E, Frost GJ, Generoso S, Ginoux P et al (2009) Atmospheric compositionchange-global and regional air quality. Atmos Environ 43:5268–5350.

330 E. Gallego et al.
Nicolas J, Denne P, Romain AC, Delva J (2007) Estimation de nuisances olfactives. Campagnede mesures des odeurs sur le CET de Malvoisin. Département des Sciences et de Gestion del’Environment-Université de Liège, Arlon.
Olesen BW (2004) Internacional standards for the indoor environment. Indoor Air 14:18–26.Olson DA, Corsi RL (2002) Fate and transport of contaminants in indoor air. Soil Sediment Contam
11:583–601.Pappas GP, Herbert RJ, Henderson W, Koenig J, Stover B, Barnhart S (2000) The respiratory
effects of volatile organic compounds. Int J Occup Environ Health 6:1–8.Pariselli F, Sacco MG, Rembges D (2009) An optimized method for in vitro exposure of human
derived lung cells to volatile chemicals. Exp Toxicol Pathol 61:33–39.Peng C-Y, Lan C-H, Wu T-J (2009) Investigation of indoor chemical pollutants and perceived odor
in an area with complaints of unpleasant odors. Build Environ 44:2106–2113.Peng C-Y, Lin T-S (2007) Volatile organic compound exposure of suburban elementary students in
Taiwan. Bull Environ Contam Toxicol 78:25–28.Prado C, Alcaraz MJ, Fuentes A, Garrido J, Periago JF (2006) Storage stability of ketones on
carbon adsorbents. J Chromatogr A 1129:82–87.Prüs-Üstüm A, Corvalán C (2006) Preventing disease Through Healthy Environments: Towards an
Estimate of the Environmental Burden of Disease. World Health Organization, Geneva.Ras MR (2008) Determinació de Compostos Orgànics Volàtils i Semivolàtils en Atmosferes
Urbanes i Industrials del Camp de Tarragona. Thesis, Department of Analytical Chemistryand Organic Chemistry, Universitat Rovira i Virgili, Tarragona, Spain.
Ras MR, Borrull F, Marcé RM (2009) Sampling and preconcentration techniques for determinationof volatile organic compounds in air samples. TrAC Trends Anal Chem 28:347–361.
Rehfuess E, Mehta S, Prüss-Üstün A (2006) Assessing household solid fuel use: Multipleimplications for the millennium development goals. Environ Health Persp 114:373–378.
Reiser R, Meile A, Hofer C, Knutt R (2002) Indoor air pollution by volatile organic com-pounds (VOC) emitted from flooring material in a Technical University in Switzerland. In:Proceedings: Indoor Air 2002, pp. 1004–1009.
Repetto M (1997) Toxicología Fundamental. Ediciones Díaz Santos, S.A. Madrid, Spain.Ribes A, Carrera GE, Roca X, Berenguer MJ, Guardino X (2007) Development and validation
of a method for air-quality and nuisance odors monitoring of volatile organic compoundsusing multi-sorbent adsorption and gas chromatography/mass spectrometry thermal desorptionsystem. J Chromatogr A 1140:44–55.
Righi E, Aggazzotti G, Fantuzzi G, Ciccarese V, Predieri G (2002) Air quality and well-being perception in subjects attending university libraries in Modena (Italy). Sci Tot Environ286:41–50.
Rios JLM, Laerte J, Gioda A, dos Santos CY, Neto FRA, Silva JRL (2009) Symptoms preva-lence among office workers of a sealed versus a non-sealed building: Associations to indoor airquality. Environ Int 35:1136–1141.
Roca FJ (2006) Disseny d’un sistema de control d’olors i de la qualitat de l’aire. Caracterització,quantificació i assignació de l’origen dels compostos orgànics volàtils. Thesis, Department ofMining Engineering and Natural Resources, Polytechnic University of Catalonia. Barcelona,Spain.
Roca FJ, Gallego E, Perales JF, Guardino X (2006) Projecte de realització de control d’episodisd’olor i qualitat de l’aire a l’àrea urbana de Benicarló. Laboratori del Centre de Medi Ambient,Polytechnic University of Catalonia. Barcelona, Spain.
Roca FJ, Ribes A, Perales JF, Carrera G (2005) Projecte de caracterització d’episodis d’olor i de laqualitat de l’aire a les zones d’impacte de l’àrea urbana de Banyoles. Laboratori del Centre deMedi Ambient, Polytechnic University of Catalonia, Barcelona.
Saarela K, Tirkkonen T, Laine-Ylijoki J, Jurvelin J, Nieuwenhuijsen MJ, Jantunen M (2003)Exposure of population and microenvironmental distributions of volatile organic compoundconcentrations in the EXPOLIS study. Atmos Environ 37:5563–5575.

16 Assessment of Chemical Hazards in Sick Building Syndrome Situations 331
Salthammer T (1997) Emission of volatile organic compounds from furniture coatings. Indoor Air7:189–197.
Schieweck A, Lohrengel B, Siwinski N, Genning C, Salthammer T (2005) Organic and inor-ganic pollutants in storage rooms of the lower saxony state museum Hanover, Germany. AtmosEnviron 39:6098–3108.
Schlink U, Rehwagen M, Damm M, Ritchter M, Borte M, Herbath O (2004) Seasonal cycle ofindoor-VOCs: Comparison of apartments and cities. Atmos Environ 38:1181–1190.
Schneider P, Gebefugi I, Richter K, Wölke G, Schnelle J, Wichmann H-E, Heinrich J, Study GroupINGA (2001) Indoor and outdoor BTX levels in German cities. Sci Total Environ 267:41–51.
Seifert B (1990) Regulating indoor air. In: Proceedings of the 5th international conference onindoor air quality and climate, Toronto, ON.
Seifert B, Abraham HJ (1982) Indoor air concentrations of benzene and some other aromatichydrocarbons. Ecotox Environ Safety 6:190–192.
Seltzer JM (1995) Sources, concentrations, and assessment of indoor pollution. In: Seltzer JM(Ed.) Occupational Medicine: Effects of the Indoor Environment on Health. Hanley and Belfus,Philadelphia, PA.
Seppänen O, Fisk WJ (2002) Association of ventilation system type with SBS symptoms in officeworkers. Indoor Air 12:98–112.
Sexton K, Adgate JL, Ramachandran G, Pratt GC, Mongin SJ, Stock TH, Mornandi MT (2004)Comparison of personal, indoor and outdoor exposures to hazardous air pollutants in threeurban communities. Environ Sci Technol 38:423–430.
Shorter E (1997) Multiple chemical sensitivity: Pseudodisease in historical perspective. Scand JWork Environ Health 23:35–42.
Sunesson A-L (2007) Passive sampling in combination with thermal desorption and gaschromatography as a tool for assessment of chemical exposure. In: Greenwood KM et al (Eds.)Comprehensive Analytical Chemistry (48): Passive Sampling Techniques in EnvironmentalMonitoring. Elsevier, Amsterdam.
Tham KW, Zuraimi MS, Sekhar SC (2004) Emission modelling and validation of VOCs’ sourcestrengths in air-conditioned office premises. Environ Int 30:1075–1088.
Tuomainen M, Tuomainen A, Liesivuori J, Pasanen A-L (2003) The 3-year follow-up study ina block of flats-experiences in the use of the finnish indoor climate classification. Indoor Air13:136–147.
Ulman M, Chilmonczyk Z (2007) Volatile organic compounds: Components, sources, determina-tion. A review Chem Anal 52:173–200.
US EPA (1999) Compendium of Methods for the Determination of Toxic Organic Compoundsin Ambient Air, Method TO-15 (EPA/625/R-96/010b). Center for Environmental ResearchInformation, Office of Research and Development, Cincinnati, OH.
US EPA (2010) Integrated Risk Information System (IRIS); www.epa.gov/iris/. Accessed May2010.
Vautard R, Szopa S, Beekmann M, Menut L, Hauglustaine DA, Rouil L (2007) Modelling regionalair quality over decades: Past and future trends in photochemical smog. Dev Environ Sci6:210–219.
Venn AJ, Cooper M, Antoniak M (2003) Effects of volatile organic compounds, damp, and otherenvironmental exposures in the home on wheezing illness in children. Thorax 58:955–960.
TIP-VENT (2001) Towards improved performances of mechanical ventilation systems. NonNuclear Energy Programme JOULE IV. European Commission.
Volden J, Tomasen Y, Greibrokk T, Thorud S, Molander P (2005) Stability of workroom air volatileorganic compounds on solid adsorbents for thermal desorption gas chromatography. Anal ChimActa 530:263–271.
Wang B-L, Takigawa T, Yamasaki Y, Sakano N, Wang D-H, Ogino K (2008) Symptom defini-tions for SBS (sick building syndrome) in residential dwellings. Int J Hyg Environ Health211:114–120.

332 E. Gallego et al.
Weisel CP, Zhang J, Turpin BJ, Morandi MT, Colome S, Stock TH, Spektor DM, Korn L, WinerA, Alimokhtari S, Lwon J, Mohan K, Harrington R, Giovanetti R, Cui W, Afshar M, MabertiS, Shendell D (2005) Relationship of indoor, outdoor and personal air (RIOPA) study: Studydesign, methods and quality assurance/control results. J Expo Anal Env Epid 15:123–137.
Weschler CJ, Shields HC (2000) The influence of ventilation on reactions among indoor pollutants:Modelling and experimental observations. Indoor Air 10:92–100.
Weschler CJ, Shields HC, Rainer D (1990) Concentrations of volatile organic compounds at abuilding with health and comfort complaints. Am Ind Hyg Assoc J 51:261–268.
WHO (World Health Organisation) (1982) Indoor Air Pollutants, Exposure and Health EffectAssessments (Euro Reports and Studies No. 78). WHO regional office for Europe, Copenhagen.
WHO (World Health Organisation) (1986) Indoor Air Quality Research: Report on a WHOMeeting (Euro Reports and Studies No. 103). WHO, Regional Office for Europe, Copenhagen.
WHO (World Health Organisation) (1989) Indoor Air Quality: Organic Pollutants (Euro Reportsand Studies No. 111). WHO Regional Office for Europe, Copenhagen.
WHO (World Health Organisation) (2002) Reducing Risks, Promoting Healthy Life. The WorldHealth Report 2002, Geneva.
WHO (World Health Organization) (2005) WHO Air Quality Guidelines: Global Update. WHORegional Office for Europe, Copenhagen.
WHO (World Health Organisation) (2006) Fuel for Life: Household Energy and Health. WHO,Geneva.
Wichmann G, Mühlenberg J, Fischäder G, Kulla C, Rehwagen M, Herbarth O, Lehmann I(2005) An experimental model for the determination of immunomodulating effects by volatilecompounds. Toxicol Vitro 19:685–693.
Winder C (2002) Mechanisms of multiple chemical sensitivity. Toxicol Lett 128:85–97.Wolkoff P (1995) Volatile organic compounds-sources, measurements, emissions, and the impact
on indoor air quality. Indoor Air Suppl 3:9–73.Wolkoff P (2003) Trends in europe to reduce the indoor air pollution of VOCs. Indoor Air 13:5–11.Wolkoff P, Clausen PA, Jensen B, Nielsen GD, Wilkins CK (1997) Are we measuring the relevant
indoor pollutants? Indoor Air 7:92–106.Wolkoff P, Nielsen GD (2001) Organic compounds in indoor air-their relevance for perceived
indoor air quality? Atmos Environ 35:4407–4417.Wolkoff P, Wilkins CK, Clausen PA, Nielsen GD (2006) Organic compounds in office
environments-sensory irritation, odor, measurements and the role of reactive chemistry. IndoorAir 16:7–19.
Wong LT, Mui KW, Hui PS (2006) A statistical model for characterizing common air pollutants inair-conditioned offices. Atmos Environ 40:4246–4257.
Wong LT, Mui KW, Hui PS (2008) A multivariate-logistic model for acceptance of indoorenvironmental quality (IEQ) in offices. Build Environ 43:1–6.
Woolfenden E (2010a) Sorbent-based sampling methods for volatile and semi-volatile organiccompounds in air. Part 1: Sorbent-based air monitoring options. J Chromatogr A1217:2674–2684.
Woolfenden E (2010b) Sorbent-based sampling methods for volatile and semi-volatile organiccompounds in air. Part 2: Sorbent selection and other aspects of optimizing air monitoringmethods. J Chromatogr A 1217:2685–2694.
Wu C-H, Feng C-T, Lo Y-S, Lin T-Y, Lo J-G (2004) Determination of volatile organic com-pounds in workplace air by multisorbent adsorption/thermal desorption-GC/MS. Chemosphere56:71–80.
Xu Y, Raja S, Ferro AR (2010) Effectiveness of heating, ventilation and air conditioning sys-tem with HEPA filter unit on indoor air quality and asthmatic children’s health. Build Environ45:330–337.
Yang W, Sohm J, Kim J, Son B, Park J (2009) Indoor air quality investigation According To age ofthe school buildings in Korea. J Environ Manage 90:348–354.

16 Assessment of Chemical Hazards in Sick Building Syndrome Situations 333
Yu BF, Hu ZB, Liu M, Yang HL, Kong QX, Liu YH (2009) Review of research on air-conditioningsystems and indoor air quality control for human health. Int J Refrig 32:3–20.
Zeliger HI (2003) Toxic effects of chemical mixtures. Arch Environ Health 58:23–29.Zeliger HI (2008) Chemical sensitivity: Multiple chemical sensitivity (MCS), chronic fatigue syn-
drome (CFS), fibromyalgia (FM), and gulf war syndrome (GWS). In: Zeliger H (Ed.) HumanToxicology of Chemical Mixtures. William Andrew Publishing, Norwich, New York, NY.
Zhang J, Smith KR (2003) Indoor air pollution: A global health concern. Brit Med Bull68:209–225.
Zhang Y, Xu Y (2002) Characteristics and correlations of VOC emissions from building materials.Heat Mass Transfer 46:4877–4883.
Zuraimi MS, Roulet C-A, Tham KW, Sekhar SC, Cheong KWD, Wong NH, Lee KH (2006)A comparative study of VOCs in Singapore and European office buildings. Build Environ41:316–329.
Zuraimi MS, Tham KW, Sekhar SC (2003) The effects of ventilation operations in determiningcontributions of VOCs sources in air-conditioned tropical buildings. Build Environ 38:23–32.
Zuraimi MS, Tham KW, Sekhar SC (2004) A study on the identification and quantification ofsources of VOCs in 5 air-conditioned Singapore office buildings. Build Environ 39:165–177.

Chapter 17
Is it Safe Enough to Depend on Ventilation?Recommendation of Radical Measuresfor Addressing Sick Building Syndrome
Yoshiharu Imai and Nami Imai
17.1 Sick Building Syndrome (SBS) from An Architectural
Perspective
Reduction of energy use is an important mitigation measure against global warming.However, in order to reduce energy consumption, developers construct airtightbuildings and use a variety of methods to help keep the air inside buildings coolin summer and warm in winter. In addition, earthquake resistance has increased inimportance in recent years, and building materials are now also selected for theirability to withstand earthquakes. Unfortunately however, the desire for materialsthat have the desired characteristics of strength and airtightness often outweighsconsiderations of the health and safety of the inhabitants of these buildings.
Materials such as medium-density fiber (MDF) board are designed to resist defor-mation and maintain airtightness. These MDF boards are produced using a varietyof organic solvents to glue the wood fiber material derived from wood chips. In hightemperature and high humidity environments, the synthetic compounds in theseboards can volatilize harmful chemical substances like formaldehyde.
These toxic chemical compounds that are volatilized from building materialsbecome trapped inside energy efficient buildings where they are inhaled by peopleand cause health problems. This process of volatilization is the mechanism respon-sible for the onset of sick building syndrome (SBS). In this chapter, we describethe countermeasures that need to be implemented against SBS caused by toxicchemicals in the living environment.
Y. Imai (B)Division of Information Engineering, Graduate School of Engineering, Mie University, Tsu City,Mie, Japane-mail: [email protected]
335S.A. Abdul-Wahab (ed.), Sick Building Syndrome,DOI 10.1007/978-3-642-17919-8_17, C© Springer-Verlag Berlin Heidelberg 2011

336 Y. Imai and N. Imai
17.2 Are Ventilation and/or Adsorption Sufficient for Solving
the SBS Problem?
Despite the common belief in Japan that ventilation and/or the adsorptionof the toxic compounds responsible for SBS will resolve the problem, suchcountermeasures are often insufficient for addressing indoor air pollution problems.
The initial response of most people who detect indoor air pollution is to dis-perse the agent using a ventilation fan. Next, they place adsorbent materials, suchas active charcoal, in the room, or they employ air purifiers. These measures areintended to reduce the concentration of the toxic chemicals contaminating the indoorair, and while they are not entirely ineffective, they are often insufficient. This isbecause many people believe that only a limited quantity of toxic chemicals will bevolatilized and, consequently, that indoor air quality can be restored after a severaldays or weeks of ventilation or adsorption. However, this misunderstanding actuallyprolongs the problem and aggravates the symptoms. To explain how such a situationmay arise, we examine a case in which formaldehyde, a known carcinogen, was theprimary pollutant in a new apartment.
17.2.1 Example of Health Problems Caused by Formaldehyde
Formaldehyde (systematic name: methanal) is an organic compound with the for-mula CH2O. It is a colorless gas at room temperature. Formalin is an aqueoussolution that contains 37% formaldehyde by mass. Formaldehyde is the simplestaldehyde and is an important precursor to many other chemical compounds, includ-ing urea, melamine, phenolic and resorcinol resin adhesives. These compounds areused the manufacture plywood and particle board and as glue for wallpaper. In thehome environment, these compounds can volatilize formaldehyde into the indoorair, causing mucosal damage or skin lesions.
The production of most of these adhesive resins is achieved through a polycon-densation reaction between formaldehyde and another monomer. The result is theformation of a polymer macromolecule and a small molecule byproduct, such aswater. Importantly however, these polycondensation reactions are reversible. Forexample, with the chemical equilibrium of the polycondensation reaction drivenin the reverse direction, urea resin adhesives will hydrolyze at high tempera-tures and humidities causing the volatilization of formaldehyde (Fig. 17.1). Thischange in chemical equilibrium due to changes in environmental conditions meansthat the quantity of formaldehyde volatilized increases at high temperatures andhumidities and decreases at low temperatures and humidities. Consequently, thequantity of formaldehyde volatilized from building materials and furniture contain-ing formaldehyde-based resins is greater at higher temperatures and humidities. Theinfluence of temperature and humidity on formaldehyde volatilization is also the rea-son why the number of SBS patients increases from the rainy season to summer anddecreases from autumn to winter. In theory, this reversible reaction will continue

17 Is it Safe Enough to Depend on Ventilation? 337
Fig. 17.1 Reaction scheme showing the chemical equilibrium of urea resin adhesives; the chem-ical equilibrium moves to the left by hydrolytic cleavage at high humidities and to the right bypolycondensation at low humidities
until formaldehyde is no longer present in the adhesive, at which time the adhesivewill no longer be effective.
Thus, in cases where the concentration of formaldehyde in a newly constructedbuilding is high, the concentration of formaldehyde in a room is likely to increaseand reach dangerous levels repeatedly over time, even though the concentration maydecrease to safe levels immediately after ventilation.
Moreover, because people misunderstand this process, they believe that their SBSproblem will be resolved by ventilation, when in fact it is not, and their symptomsoften become prolonged as a result.
In one example of the SBS problem in Japan, a couple moved into a newly con-structed apartment in 2001. They were both in their 1930s and in good health.Shortly after moving in, both experienced onset of nasal mucosal damage, cuta-neous symptoms, and central nervous system damage. After an agonizing searchfor the cause of their ailments and numerous visits to different hospitals, theywere eventually correctly diagnosed as suffering from SBS caused by formaldehydeexposure.
After the diagnosis, the couple attempted to reduce the concentration offormaldehyde by fully opening all of the windows to ventilate their apartment, plac-ing activated charcoal throughout their apartment, and operating air purifiers allday, even during the winter. Nonetheless, because the building materials used inthe construction of their apartment contained significantly high concentrations offormaldehyde, their symptoms were not alleviated.
Specifically, when measured immediately after 5 h of ventilation, the concentra-tion of formaldehyde in the air of their apartment was 60 µg/m3, which is lower thanthe 100 µg/m3 recommended by the World Health Organization (WHO). However,the formaldehyde concentrations in the air of the apartment returned to 420 µg/m3
after 5 h of not ventilating the apartment.Detailed investigation of the apartment revealed that building materials contain-
ing high levels of formaldehyde had been used in the floor, wallpaper, doors, curtainpelmets, and the doors and shelves of closets. The couple had to move out of theirapartment in the rainy season because the concentration of formaldehyde increasedto very high levels due to the increase in temperature and humidity. They eventuallyexperienced financial difficulties as they were forced to pay their mortgage as wellas the rent for their temporary accommodations while suffering from SBS.
In countries such as in Japan, where housing costs account for a high proportionof a family’s budget, falling ill with SBS after moving into a newly purchased homeis like falling into the pit of an ant lion.
338 Y. Imai and N. Imai
17.2.2 Examples of Countermeasures for Reducing Formaldehyde
Concentrations
To address the problems encountered in the apartment described above, the own-ers implemented several countermeasures. Since the combined effect of ventilation,air purifiers, potted ornamental plants, and activated charcoal was ineffectual, thefirst measure we employed was the application of a paint sealer. Even though theconcentration of formaldehyde decreased by 50% after implementing this coun-termeasure, the concentrations remained higher than the recommended guidelines(Imai and Imai 2006).
This result was not surprising because, although paint sealers are applied to thevisible surfaces from which volatilized toxic chemicals are released, such sealerscannot be applied to surfaces that are not visible. Consequently, since toxic air con-taining high densities of formaldehyde can still leak from apertures in the wall, theconcentration of toxic substances in the air will gradually increase.
We then attempted to completely remove the formaldehyde from the apartmentby removing all of the hazardous materials and replacing them with safer ones. Theprocess involved the following steps:
Step 1: Identification of hazardous materials through the analysis of the mate-rials used in the apartment. Fresh material samples were obtained, includingthe glue used to manufacture them, and the quantity of volatized toxicchemicals were measured in a chamber.
Step 2: All of the non-structural building materials used in the apartment wereremoved.
Step 3: Antioxidation paint was applied to exposed surfaces in order to convertformaldehyde into H2O and CO2. The concentrations of formaldehyde andtotal volatile organic compounds (TVOC) in the indoor air of the apartmentwere measured.
Step 4: All of the new building materials used to refurbish the apartment wereplaced inside and the doors and windows were sealed. The concentrationof formaldehyde and the TVOC in the air of the apartment were then mea-sured to confirm that no toxic substances were being released from the newmaterials.
Step 5: Upon completion of refurbishing the house, the air inside the apartmentwas chemically analyzed to identify which chemicals were present after theapartment was refurbished.
Qualitative chemical analysis of the indoor air of the apartment was not performedbefore refurbishing because, with the exception of formaldehyde, we already knewthat there were no toxic chemicals in the apartment. In addition, to avoid prolongingthe construction schedule and increasing refurbishing costs, we did not measure theconcentrations of chemicals by qualitative chemical analysis at each step.
Since the TVOC concentrations in the apartment were high after completingstep 4, we qualitatively analyzed the chemicals in the air. The results showed that

17 Is it Safe Enough to Depend on Ventilation? 339
the high TVOC levels were due to constituents of the natural wood in the buildingmaterials. This same result was obtained after the final step, but the concentration offormaldehyde decreased to levels below that measured outdoors (Imai et al. 2007).
These results revealed that ventilation, adsorption and sealing are not effectivefor eliminating indoor air pollution completely. Removal of all hazardous materialsand the use of safe alternatives is the only way to solve the SBS problem.
17.3 Are the Safety Guidelines for Formaldehyde Truly Safe?
Concerns have recently been raised regarding whether the current safety guide-lines recommended for formaldehyde are appropriate. For example, exposure toformaldehyde at a concentration of 100 µg/m3 in the air over a lifetime is not con-sidered harmful to human health. However, in this case, “human” refers to an adultand does not include children or the elderly. Furthermore, since these safety guide-lines were not developed after long-term exposure experiments involving humansubjects, the author doubts whether the 100 µg/m3 limit stipulated in the safetyguidelines for formaldehyde is truly safe.
Moreover, while the Japanese government considers the standard of 100 µg/m3
formaldehyde in the air to be sufficient, this recommendation is not based onformaldehyde concentrations in a sealed room. Rather, this standard assumes thatthe air of the room is circulated once every 2 h by ventilation. The Japanese guide-lines incorporate ventilation because lobby groups affiliated to the constructionindustry petitioned the government, insisting that constructing a building that sat-isfied the recommended guidelines was not possible. However, as described above,we demonstrated that it was indeed possible to construct the interior of an apartmentand meet the recommended standards using only commercially available productsand no ventilation (Imai et al. 2007). Therefore, wherever possible, home environ-ments should be constructed using building materials that have low levels of toxicchemicals and which do not need to be used in conjunction with ventilation.
17.4 Difficulties Associated with Resolving the SBS Problem
in Public Buildings
The same approach cannot always be adopted when developing countermeasuresfor SBS. For example, a different set of countermeasures needs to be employedwhen dealing with SBS in public buildings, primarily because the convenience ofthe various people using the building need to be considered.
In the case of a private building, the number of people affected is usually limited,the scale of the mitigation measures is relatively small, and the problem can beresolved privately. On the other hand, if SBS occurs in a public building, the sourceof harmful chemicals may not necessarily be the building materials, but chemicalsthat are carried into the building by an unspecified number of people.

340 Y. Imai and N. Imai
The possible causes of air contamination in public buildings are varied and caninclude furniture, printing ink, chemicals used on electrical appliances, floor wax,perfume, cosmetics, shampoos or skin creams, and synthetic detergents, amongothers. Consequently, identifying the cause of SBS under these circumstances isextremely difficult.
Also, if SBS occurs in a private building and the cause of the problem is deter-mined to be the building materials, then countermeasures can be implementedrelatively easily because the building is usually owned by a single entity.
However, the implementation of countermeasures in public buildings is oftendelayed, or is insufficient, because building managers typically know very littleabout SBS, or they try to hide the problem to avoid incurring the repair costs orbeing prosecuted for violating public health standards.
As mentioned in Chap. 6, many of the students and staff at a nursing schooldeveloped SBS symptoms, such as cephalgia, mucosal damage and mental disordersin a newly constructed teaching facility at the school. The headmistress of the schoolrefused further inspections by a specialist and ordered the staff to keep quiet aboutthe matter out of concern that the number of applicants to the school would declineif it was discovered that the school had an SBS problem.
As a result of the delay in implementing appropriate countermeasures, the mag-nitude of the health hazard increased and a teacher who consulted the author hadto resign from the school due to ill health (q.v. Chap. 6). In this way, the ignoranceof management regarding SBS, combined with the fear of SBS becoming a publichealth problem, prolonged exposure to hazardous materials in this public buildingand prevented the resolution of the issue.
17.5 Conclusions
Radical measures are required to adequately reduce the levels of toxic chemicals inthe home environment to affect both prevention and recovery from SBS without theuse of ventilation. Instead of relying on countermeasures such as ventilation to miti-gate the dangers of contaminated air, the use of building materials that release toxicsubstances should be avoided. Furthermore, increased attention should be focusedon preventing the use of potentially hazardous materials in the construction of pub-lic buildings. This is because identifying the origin of SBS in public facilities ismore difficult than it is in private buildings, particularly since the visitors to thesefacilities may bring a wide variety of chemical contaminants into these buildings.
References
Imai Y, Imai N (2006) Attempt to mitigate indoor air pollution of whole apartment by sealer paints.Society of Indoor Environment Japan 2006, paper ID B-15.
Imai Y, Imai N, Imai Y (2007) Specifying the source of the indoor air formaldehyde contaminationand verifying the effectiveness of the radical measures to improve the indoor air condition.Society of Indoor Environment Japan 2007, paper ID B-10.

Chapter 18
Building Related Illnesses
Gustavo Silveira Graudenz
18.1 Introduction
The first reports of health and comfort complains among building occupants ofartificially ventilated buildings started to pop up in the literature during the seven-ties (Ricks 1982). A significant robust prevalence study was published by Finneganet al. (1984), on work-related complains as headache, lethargy, mucosal symptoms(nasal congestion, nasal discharge, eye-tearing and ocular itching) and chest tight-ness from workers from office buildings. These complaints were two fold higher inbuildings with artificial ventilation when compared to naturally ventilated buildings.A longitudinal study by Sterling and Sterling (1983) demonstrated an increased rateof absenteeism in employees transferred from one building with natural ventilationto another with air conditioning system.
In the early 1980s, around 5,000 studies reporting the existence of “sick build-ing syndrome” were published (Stolwijk 1984). The World Health Organizationdefined the sick building syndrome in 1983 as a high prevalence of symptoms inthe occupants of these buildings. These symptoms include headaches, eye prob-lems (irritation, pain, dryness, itching, and tearing), nasal symptoms (obstruction,rhinorrhea and irritation), oropharyngeal symptoms (irritation, dryness or pain) andproblems to keep the concentration at work (WHO 1983).
Also during the 1980s some studies stressed the role of Heating, Ventilation andAir Conditioning (HVAC) systems as risk factor for building related complains.Danish Indoor Climate Study Group evaluated 4,369 employees from municipal-ities, showing a higher prevalence of symptoms of mucous membrane irritation,headache and asthenia strongly associated with the indoor environment condi-tions (Skov et al. 1989; Skov 1992). A third large European study was conductedby Burge et al. (1987), with 4,373 employees in 42 office buildings, showing a
G.S. Graudenz (B)Department of Microbiology and Immunology, School of Medicine, Nove de Julho University,Sao Paulo, Brazile-mail: [email protected]
341S.A. Abdul-Wahab (ed.), Sick Building Syndrome,DOI 10.1007/978-3-642-17919-8_18, C© Springer-Verlag Berlin Heidelberg 2011

342 G.S. Graudenz
prevalence of 80% of workplace-related complaints. Employees working with air-cooling system had the highest rate of symptoms. The most common symptomsobserved were lethargy (57%), nasal obstruction (47%), pharyngeal irritation (46%)and chest tightness (9%). Mendell and Smith (1990) published a meta-analysis ofepidemiological studies showing a consistent pattern of increased risk of reportingwork-related headache, lethargy, and upper respiratory/mucus membrane symptomsin office buildings with air conditioning, when compared to buildings with naturalventilation.
Since the arrival of 1990s, changes in lifestyle of the urban population were con-solidated and large cities inhabitants spend about 90% of their time indoors makingindoor environment and air quality a matter of global importance. At the same time,there was a generalized awareness that close contact with indoor environment con-taminants and increased susceptibility of the population from industrialized worldare associated with an epidemic increase of allergic diseases in industrialized coun-tries (Bousquet et al. 2008), and indoor environment quality problems affectinghuman health were considered the most common environmental problems of clinicalpractice (Ledford 1994).
During the past 10 years there was an increase in attention to indoor air qual-ity (IAQ) problems in developing regions of the world due to burning of biomass(especially for cooking) that produces a deadly mixture of pollutants that results inmore than 2,000,000 people, mainly women, elderly and children, that die becauseof this exposure yearly (Smith and Sundell 2002). This is the present priority ofWorld Health Organization in matters related to indoor air pollution.
In the developed world studies on radon and environmental tobacco smoke ascauses of cancer of the lungs, and studies on volatile organic compounds, particles,allergens, and agents of microbial origin and their relation to the increasing preva-lence of allergies in the industrialized world are matter of debate (Kim and Bernstein2009).
18.2 Definitions
In this chapter the term building-related illnesses will be used for diseases or symp-toms that occur in non-industrial and non-residential buildings, which are in vastmajority, office buildings. The term “specific diseases building related illnesses”refers to a group of diseases with fairly homogeneous clinical presentations, objec-tive laboratory abnormalities, and one or more identifiable causes or agents knownto be capable of carrying infectious diseases, immunological or allergic reactions.The term “nonspecific diseases related to buildings” refers to a heterogeneous groupof work-related symptoms that include irritation of skin and mucous membranes(eyes, nose and throat), headache, fatigue and difficulty concentrating. These symp-toms may be considered based on disease incidence or prevalence of these, evenin the absence of objective clinical and laboratory abnormalities or causing agents,according to the classification proposed by Menzies and Bourbeau (1997).

18 Building Related Illnesses 343
18.2.1 Specific Building-Related Illnesses
A single causative can result in outbreaks of diseases related to buildings with manymanifestations due complex interaction of a biological agent and the immunologicalsystem. Let us use the Legionella pneumophila as an example. This gram-negativebacteria, depending on the virulence of the strain and individual susceptibility, canresult in Legionnaires’ disease, a type of pneumonia with fatality rates up to 16% ofcases, or may manifest as a milder form, called Pontiac fever, with only symptomsof fever and muscle pain and no lung symptoms (Seltzer 1994a).
Similarly, diseases such as humidifier fever (HF) and hypersensitivitypneumonitis (HP) will generate a clinical spectrum resulting from the interactionbetween the host immune system and inhaled airborne bacteria, fungi or pro-tozoa that can be tracked to contaminated humidifiers, air conditioners systemsor other sources. The clinical picture of PH is presented as recurrent pneumo-nia with pulmonary infiltrates visible at the chest images, associated with muscleaches, fever, cough and chest tightness. The causative agents of PH are particlesmeasuring 1–5 µm of diameter that are deposited in the terminal alveoli. Once sen-sitized, individuals exposed again to tiny amounts of the same agent can producean immunological reaction mediated by antibodies and pro-inflammatory cytokinesthat will lead to symptoms. The diagnosis of PH is classically described with theassociation of high levels of antibodies against biological contaminants responsi-ble for the clinical picture that are found in the indoor environment (Laukova et al.2009). However about 50% of individuals without symptoms may have demonstra-ble immunity (IgG), which reduces the specificity of the research (Seltzer 1994b).Careful medical history together with quantitative and qualitative approach to anti-bodies directed against environmental contaminants normally help confirm thediagnosis.
The HF is presented as a flu-like illness with fever, chills, muscle aches andweakness. Lung images are normal and pulmonary symptoms can be absent, dif-ferently from HP. This two diseases are much related, both result from exposure tobiological contaminants in indoor environments and the clinical presentation willdepend on the type and amount of biologically active contents and their interactionwith the host immune system. The most important problems related to buildings arepresented in Table 18.1.
18.2.2 Nonspecific Building-Related Diseases
This category is not related to diseases, but rather nonspecific symptoms that occurin a particular building and not in the home environment, without objective findingsthat can convincingly explain its cause. The prototype is sick building syndrome(SBS). “Sick Buildings” are identified by prevalence among occupants of non-industrial buildings above 20% of the symptoms described in the Table 18.2. Thereis no universally accepted definition for this entity because the clinical spectrum isvariable, and environmental findings are inconclusive.
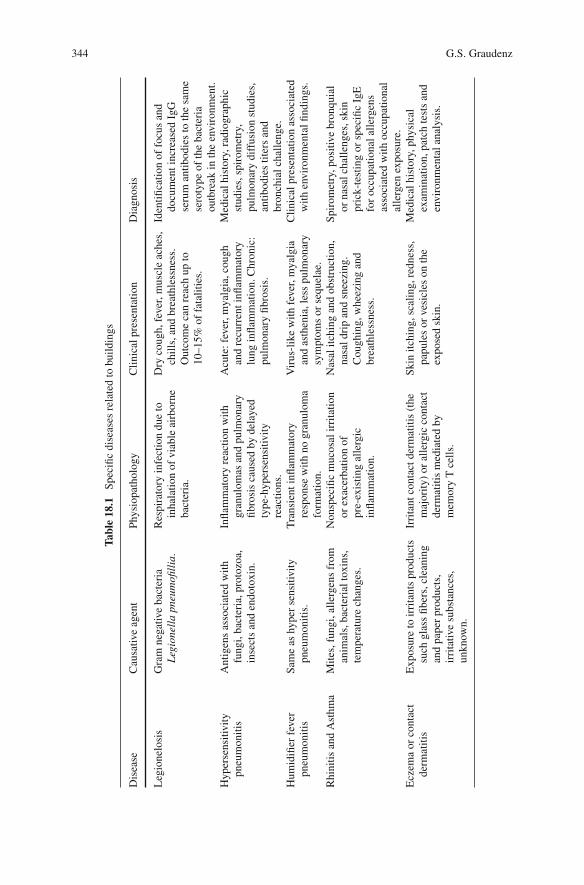
344 G.S. Graudenz
Tab
le18.1
Spe
cifi
cdi
seas
esre
late
dto
buil
ding
s
Dis
ease
Cau
sati
veag
ent
Phy
siop
atho
logy
Cli
nica
lpre
sent
atio
nD
iagn
osis
Leg
ione
losi
sG
ram
nega
tive
bact
eria
Leg
ionel
lapneu
mofill
ia.
Res
pira
tory
infe
ctio
ndu
eto
inha
lati
onof
viab
leai
rbor
neba
cter
ia.
Dry
coug
h,fe
ver,
mus
cle
ache
s,ch
ills
,and
brea
thle
ssne
ss.
Out
com
eca
nre
ach
upto
10–1
5%of
fata
liti
es.
Iden
tifi
cati
onof
focu
san
ddo
cum
ent
incr
ease
dIg
Gse
rum
anti
bodi
esto
the
sam
ese
roty
peof
the
bact
eria
outb
reak
inth
een
viro
nmen
t.H
yper
sens
itiv
ity
pneu
mon
itis
Ant
igen
sas
soci
ated
wit
hfu
ngi,
bact
eria
,pro
tozo
a,in
sect
san
den
doto
xin.
Infl
amm
ator
yre
acti
onw
ith
gran
ulom
asan
dpu
lmon
ary
fibr
osis
caus
edby
dela
yed
type
-hyp
erse
nsit
ivit
yre
acti
ons.
Acu
te:
feve
r,m
yalg
ia,c
ough
and
recu
rren
tin
flam
mat
ory
lung
infl
amm
atio
n.C
hron
ic:
pulm
onar
yfi
bros
is.
Med
ical
hist
ory,
radi
ogra
phic
stud
ies,
spir
omet
ry,
pulm
onar
ydi
ffus
ion
stud
ies,
anti
bodi
esti
ters
and
bron
chia
lch
alle
nge.
Hum
idifi
erfe
ver
pneu
mon
itis
Sam
eas
hype
rse
nsit
ivit
ypn
eum
onit
is.
Tra
nsie
ntin
flam
mat
ory
resp
onse
wit
hno
gran
ulom
afo
rmat
ion.
Vir
us-l
ike
wit
hfe
ver,
mya
lgia
and
asth
enia
,les
spu
lmon
ary
sym
ptom
sor
sequ
elae
.
Cli
nica
lpre
sent
atio
nas
soci
ated
wit
hen
viro
nmen
tal
find
ings
.
Rhi
niti
san
dA
sthm
aM
ites
,fun
gi,a
ller
gens
from
anim
als,
bact
eria
lto
xins
,te
mpe
ratu
rech
ange
s.
Non
spec
ific
muc
osal
irri
tati
onor
exac
erba
tion
ofpr
e-ex
isti
ngal
lerg
icin
flam
mat
ion.
Nas
alit
chin
gan
dob
stru
ctio
n,na
sal
drip
and
snee
zing
.C
ough
ing,
whe
ezin
gan
dbr
eath
less
ness
.
Spi
rom
etry
,pos
itiv
ebr
onqu
ial
orna
sal
chal
leng
es,s
kin
pric
k-te
stin
gor
spec
ific
IgE
for
occu
pati
onal
alle
rgen
sas
soci
ated
wit
hoc
cupa
tion
alal
lerg
enex
posu
re.
Ecz
ema
orco
ntac
tde
rmat
itis
Exp
osur
eto
irri
tant
spr
oduc
tssu
chgl
ass
fibe
rs,c
lean
ing
and
pape
rpr
oduc
ts,
irri
tati
vesu
bsta
nces
,un
know
n.
Irri
tant
cont
act
derm
atit
is(t
hem
ajor
ity)
oral
lerg
icco
ntac
tde
rmat
itis
med
iate
dby
mem
ory
Tce
lls.
Ski
nit
chin
g,sc
alin
g,re
dnes
s,pa
pule
sor
vesi
cles
onth
eex
pose
dsk
in.
Med
ical
hist
ory,
phys
ical
exam
inat
ion,
patc
hte
sts
and
envi
ronm
enta
lan
alys
is.

18 Building Related Illnesses 345
Table 18.2 Clinical presentation of sick building syndrome (SBS)
No. Most common symptoms in SBS
1. Mucosal symptoms: nasal obstruction and/or nasal itching, irritation, pain, dryness,affecting also the lining of the eye, nose and pharynx.
2. Asthma-like symptoms: chest tightness, cough, dyspnea (breathlessness) and chestwheezing.
3. Neuro-toxic symptoms: headache, lethargy, difficult concentration, memory loss,depression and irritability.
4. Skin symptoms: xeroderma (dry skin), irritation and erythema (redness).5. Other symptoms: fatigue, nausea, general aching, neck/back pain, numb hands,
increased awareness to smells, and visual changes.
The prevalence of buildings-related health complains is still largely unknown.The prevalence of different symptoms can vary greatly, even within the samemicroenvironment, depending on environmental exposure and individual suscep-tibility.
In cross-sectional studies, up to 60% of occupants report at least one work-relatedsymptom and 10–20% reported it to occur at least twice a week, according to meta-analysis (Mendell and Smith 1990). Although not considered serious, symptoms canbe very uncomfortable and can lead to a considerable work-loss, productivity andquality of life. The intensity of symptoms generally decreases over time, but theymay persist up to 50% of the affect individuals after 7 years of onset, despite theactions taken (Edvardsson et al. 2008). The concern with a more severe disease iscommon and can become obsessive in susceptible personalities (Bardana 1997).
18.3 Triggering Events
There is no single causal agent in SBS and it is much related to the altered perceptionof indoor environment quality. The causes of altered perception of indoor qualityenvironments are many and have complex interactions. They include temperature,relative humidity, air exchange rates, odor, indoor air speed, exposure to biologi-cal contaminants (fungi, algae, bacteria, protozoa, allergens and their derivatives),volatile organic compounds, organizational and psychosocial factors described inreview by Burge (2004). Some of the most common contributing events in SBS arelisted below:
18.3.1 Climatic and Geographical Variations
Complaints about air quality may be substantially different in different locationsrelated to their respective climates. Populations living in places with more adverseoutdoor conditions tend to spend more time indoors and are more dependent on arti-ficial ventilation, but relevant prevalence’s of IAQ problems are reported in locations

346 G.S. Graudenz
with milder climates. Some studies in tropical and sub-tropical climate also demon-strated increased risk for mucosal and neuro-toxic symptoms in populations workingwith air conditioning when compared to natural ventilation (Ooi and Goh 1996;Graudenz et al. 2005). Buildings located in humid climates tend to have problemswith mould and biological contamination in indoor environment and they requirespecial maintenance precautions (Spaul 1994). Exposure to low humidity condi-tions can lead to respiratory symptoms due to mucosal dehydration and shredding.In addition, air conditioning systems using humidification systems that might getbiological contamination in dry climates. The buildings must be adapted regionalclimate, which is not always the case, for example, in companies that have branchesin different locations and want to have the same building pattern resulting in thermaldiscomfort among the occupants.
18.3.2 Artificial Ventilation
The prevalence of mucosal symptoms reported in meta-analysis covering US andEuropean cross-sectional studies show an excess of 50% of symptoms of mucosalirritation in buildings with air conditioning systems when compared to natural venti-lation (Mendell and Smith 1990). The prevalence of symptoms is higher in buildingswith a renewal rate of air less than 10 l/s/per, described by Menzies and Bourbeau(1997), probably due to the difficulty of removing indoor pollutants.
18.3.3 Age of Building and Maintenance of Air Conditioning
System
In this aspect, the buildings are similar to humans; some problems are more commonwith certain ages. The newer buildings tend to have problems related to the exposureto chemicals as volatile organic compounds (VOCs) or due to initial testing and eval-uation of air-conditioning system. The older buildings are more prone to biologicalcontamination by fungi, bacteria, algae, protozoa and other biological contami-nants (Spaul 1994). The degradation and lack of maintenance of the HVAC systemcan lead to improper air quality due to contamination by biological agents, inade-quate air exchange and filtration rates and loss of indoor thermal control parameters(Oliver and Shackleton 1998). Symptoms of nasal and eye irritation had a positiveassociation ageing of the HVAC system without adequate maintenance (Graudenzet al. 2002a). In such circumstances remediation procedures can decrease signifi-cantly the building related symptoms (Graudenz et al. 2004). On the other hand,non-regulated air conditioning systems or indoor environmental exposure to suddenindoor temperature changes has been showed to induce nasal inflammation in bothnormal but more pronounced and long lasting in the allergic individuals (Graudenzet al. 2006a).

18 Building Related Illnesses 347
18.3.4 Renovations
Air quality complaints often occur after renovations of buildings. This may be due toexposure to bioaerossols, dust particles or volatile organic compounds used in build-ing renovations (Kilburn 2000). The time required to reduce emission of pollutantsfrom glues, paints and coatings, is rarely observed in situations of re-occupationof the workplace. The use of low emission materials are recommended to diminishthis problem although their safety is still not adequately confirmed. Renovations inhospitals with immunocompromissed patients can lead to a serious fungi infectiousdisease named invasive aspergilosis (Pini et al. 2008), demanding careful precautionmeasures to avoid dust exposure to inpatients during hospitals renovations.
18.3.5 Bioaerossol Exposure
Situations of flooding and dampness are often the triggering events of indoor airquality problems. Although subsequent proliferation of fungi or bacteria is expected,is not systematically demonstrated (Bornehag et al. 2004). The exposure of fungican affect individuals in various ways, depending on the degree of exposure andindividual susceptibility:
A- Sensitization: Exposure to fungi and other microorganisms can lead to con-ditions of sensitization after initial contact to Cladosporium, Penicillium,
Aspergillus and other fungi characterized by the induction of immunoglobulinE antibodies (IgE) that mediate diseases as asthma, and rhinitis in individualspredisposed to allergic diseases (atopic). It is possible that higher exposure tothese contaminants could lead to lung inflammatory conditions as pneumonitis(inflammation of the lung) or hypersensitivity (allergic alveolitis) in special sit-uations. Diagnosis is done through tests of hypersensitivity (skin prick tests)and antibodies detection formed against to the suspicious fungi present inthe indoor environment. If the environmental analysis comes up with thepresence of a large number of dispersed viable fungal spores in the air, itcorroborates to the diagnosis. This association can be difficult to establish inretrospective studies due to the impossibility of establishing either the time orexposure situation able to cause sensitization to fungi to characterize sensitizingexposure.
B- Irritation of mucous membranes: Considerable exposure to bioaerosols as fungior bacteria, either as viable or non-viable particles can cause nonspecific irri-tation of the airways, which presents with cough, wheezing, sneezing, nasalstuffiness, breathlessness, eyes and throat irritations. It can also present withfever, chills, muscle aches and joint pain, like a flu-like condition. Normallythere is a degree of adaptation with reduction of symptoms during the nor-mal working days and recurrence during the re-exposure after long weekendsand public holidays (Monday-fever). In this case, is better known as humidifier

348 G.S. Graudenz
fever, toxic pneumonitis or organic dust toxic syndrome (Bardana 1997). Amongthe bioaerosols, endotoxins from gram-negative bacteria are most commonlyincriminated. Skin tests and specific antibodies do not help in diagnosis.Presumptive diagnosis is with environmental evidence and clinical findings.
C- Mycotoxicosis: is the health effect resulting from exposure to a secondarytoxic metabolite produced by fungi. Mycotoxicosis can have a clinical presen-tation with generalized headaches, fatigue, joint pain and vague neurologicalsymptoms. These symptoms are transient and may be caused by fungi likeStachybotrys and Aspergillus. The environmental and clinical diagnosis is dif-ficult to establish due to neither the possibility of any demonstrable allergicmechanisms in clinical research or an increase of viable fungal spores exposurein environmental reserch.
18.3.6 Work Stress
Personal factors are of great importance due to diversity and intensity that individu-als perceive and react to same external stimuli. Although some studies demonstrateassociations between work stress and SBS symptoms, no feature of the organiza-tional system of work or types of personalities prone to develop symptoms havebeen identified so far (Skov et al. 1989; Kjaergaard et al. 1992; Ooi and Goh 1997).
18.3.7 Interaction of Multiple Factors
The cases of dampness infiltration and building renovations are described asthe major risk factors for the onset of nonspecific diseases related to Buildings(Pejtersen et al. 2001; Li et al. 1997). Often, there is a lack of attention to the occu-pants with nonspecific complaints by the team of occupational health professionals.Moreover, the lack of an objective cause for the explanation of the facts associ-ated with sensationalist misinformation from media can perpetuate the symptomsin susceptible personalities, even outside the workplace, creating situations such asdisabling syndromes as multiple chemical sensitivities (Bardana 1997).
18.4 Individual Susceptibility and to Building-Related Disorders
The increased susceptibility to develop the allergic symptoms related to the build-ings is known, but poorly understood (Brooks 1994; Ooi and Goh 1996; Bjornssonet al. 1998). Patients with asthma and young females are more likely to expresssymptoms. Patients with respiratory allergy may also have lowered respiratoryepithelium thresholds limits to react to different pollutants exposure or temperaturechanges (Graudenz et al. 2006b) and perceive indoor air quality differently fromcontrols in similar conditions. The variation of threshold limits for some indoor

18 Building Related Illnesses 349
pollutants may vary greatly even in normal individuals (Menzies and Bourbeau1997), making difficult to establish valid safety limits for all indoor pollutants.
Carpets are reservoirs for dust, dust mites and fungi, which can be suspendeddepending on the local turbulence (Skov et al. 1989). Wallace (1993) described theassociation of respiratory symptoms with exposure to dust and carpeted surfaces inoffice buildings. Menzies et al. (1998) showed an increased risk to develop work-related symptoms in employees exposed to dust mites levels greater than 1 µg ofDer p 1 per gram of dust, or detectable levels of Alternaria alternata dispersed inthe air. Nevertheless, these authors found no differences in skin tests for allergies tothe control group.
The passive transport of substances that can trigger allergies (allergens) to pub-lic places has attracted more scientific attention as an alternative source of allergenexposure and sensitization and as a potential cause of triggering allergic respira-tory symptoms has been demonstrated (Almqvist et al. 1999; Perzanowski et al.1999; Chan-Yeung et al. 1999; Graudenz et al. 2002b), but the evidence that it isresponsible for a substantial role in building related diseases and symptoms remainsuncertain.
The assessment of exposure to fungal allergens is still controversial, becausealthough they are known sensitizing agents, there are no sensitization thresholdslimits widely accepted to result in allergic sensitization or allergic response to fungiexposure. Moreover, there is great variation between sampling methods (Buttnerand Stetzenbach 1993; Verhoeff et al. 1994), making comparisons difficult. Somefungi are important causes of allergic respiratory symptoms, and include the gen-era Cladosporium, Alternaria, Aspergillus and Penicillium (Cooley et al. 1998). Theoutstanding growth of the fungus Penicillium sampled in indoor air when comparedto outdoor air, as well as the presence of Stachybotrys mold in the internal environ-ment may be linked to indoor air quality-related symptoms. It is a matter of currentresearch, the role of low and repeated low dose exposure to fungi and the appearanceof symptoms (Menzies et al. 1998).
Fungi and bacteria can be implicated in building-related diseases, normally acombination of non-specific symptoms with indicators of potential microbial con-tamination, such as high humidity, surface dust, carpets and dampness (Saijo et al.2009). Older carpets may emanate various types of pollutants and their presenceis reflected in the worsening of air quality perceived, even when these are hiddenfrom view (Wargocki et al. 1999). In addition, there may be an improvement in theperception of QAAI associated with cleanliness (Raw et al. 1993). Unfortunatelythe association between exposure and health effects can be misleading. Menzies andBourbeau (1997) demonstrated that the level of airborne fungi and bacteria is almostalways low and the association with symptoms can be inconsistent. Epidemics ofasthma related to occupation of office buildings are occasionally reported, however,no causative agent is routinely identified (Hoffman et al. 1993; Burge et al. 1985).
In summary, to date no single environmental factor has proved to be the solecause of SBS. Factors associated with the perception of air quality are multiple andinteractive and multidisciplinary research is needed to expand the current limitationsof the knowledge related to indoor environment quality and human health.

350 G.S. Graudenz
References
Almqvist C, Larsson PH, Egmar AC, Hedren M, Malmberg P, Wickman M (1999) School as arisk environment for children allergic to cats and a site for transfer of cat allergen to homes.J Allergy Clin Immunol 103(6):1012–1017.
Bardana EJ (1997) Sick building syndrome: A wolf in sheep’s clothing. Ann Allergy AsthmaImmunol 79(4):283–293.
Bjornsson E, Janson C, Norback D, Boman G (1998) Symptoms related to the sick building syn-drome in a general population sample: Associations with atopy, bronchial hyper-responsivenessand anxiety. Int J Tuberc Lung Dis 2(12):1023–1028.
Bornehag CG, Sundell J, Bonini S, Custovic A, Malmberg P, Skerfving S, Sigsgaard T, VerhoeffA (2004) Dampness in buildings as a risk factor for health effects, EUROEXPO: A multidisci-plinary review of the literature (1998–2000) on dampness and mite exposure in buildings andhealth effects. Indoor Air 14(4):243–257.
Bousquet J, Khaltaev N, Cruz AA, Denburg J, Fokkens WJ, Togias A, Zuberbier T, Baena-CagnaniCE, Canonica GW, Van WC, Agache I, Ait-Khaled N, Bachert C, Blaiss MS et al (2008)Allergic rhinitis and its impact on asthma (ARIA) 2008 update (in collaboration with the worldhealth organization, GA(2) LEN and ALLerGEN). Allergy 63(Suppl 86):8–160.
Brooks SM (1994) Host susceptibility to indoor air pollution. J Allergy Clin Immunol 94:344–351.Burge PS (2004) Sick building syndrome. Occup Environ Med 61(2):185–190.Burge PS, Finnegan M, Horsfield N, Emery D, Austwick P, Davies PS, Pickering CA (1985)
Occupational asthma in a factory with a contaminated humidifier. Thorax 40(4):248–254.Burge S, Hedge A, Wilson S, Bass JH, Robertson A (1987) Sick building syndrome: A study of
4373 office workers. Ann Occup Hyg 31(4A):493–504.Buttner MP, Stetzenbach LD (1993) Monitoring airborne fungal spores in an experimental indoor
environment to evaluate sampling methods and the effects of human activity on air sampling.Appl Environ Microbiol 59(1):219–226.
Chan-Yeung M, McClean PA, Sandell PR, Slutsky AS, Zamel N (1999) Sensitization to cat withoutdirect exposure to cats. Clin Exp Allergy 29(6):762–765.
Cooley JD, Wong WC, Jumper CA, Straus DC (1998) Correlation between the prevalence ofcertain fungi and sick building syndrome. Occup Environ Med 55(9):579–584.
Edvardsson B, Stenberg B, Bergdahl J, Eriksson N, Linden G, Widman L (2008) Medical and socialprognoses of non-specific building-related symptoms (sick building syndrome): A follow-upstudy of patients previously referred to hospital. Int Arch Occup Environ Health 81(7):805–812.
Finnegan MJ, Pickering CA, Burge PS (1984) The sick building syndrome: Prevalence studies. BrMed J (Clin Res Ed) 289(6458):1573–1575.
Graudenz GS, Kalil J, Latorre MR, Arruda LK, Morato-Castro FF (2002a) Passive transport of dogand cat allergens in office buildings. Rev Bras Alerg Imunopatol 25(3):99–106.
Graudenz GS, Kalil J, Saldiva PH, Gambale W, Latorre MDR, Morato-Castro FF (2002b) Upperrespiratory symptoms associated with aging of the ventilation system in artificially ventilatedoffices in sao paulo, brazil. Chest 122(2):729–735.
Graudenz GS, Kalil J, Saldiva PH, Latorre MDR, Morato-Castro FF (2004) Decreased respira-tory symptoms after intervention in artificially ventilated offices in sao paulo, brazil. Chest125(1):326–329.
Graudenz GS, Landgraf RG, Jancar S, Tribess A, Fonseca SG, Fae KC, Kalil J (2006a) The roleof allergic rhinitis in nasal responses to sudden temperature changes. J Allergy Clin Immunol118(5):1126–1132.
Graudenz GS, Latorre MR, Tribess A, Oliveira CH, Kalil J (2006b) Persistent allergic rhinitis andindoor air quality perception: An experimental approach. Indoor Air 16(4):313–319.
Graudenz GS, Oliveira CH, Tribess A, Mendes C Jr, Latorre MRD, Kalil J (2005) Association ofair-conditioning with respiratory symptoms in office workers in tropical climate. Indoor Air15(1):62–66.

18 Building Related Illnesses 351
Hoffman RE, Wood RC, Kreiss K (1993) Building-related asthma in denver office workers. Am JPublic Health 83(1):89–93.
Kilburn KH (2000) Indoor air effects after building renovation and in manufactured homes. Am JMed Sci 320(4):249–254.
Kim H, Bernstein JA (2009) Air pollution and allergic disease. Curr Allergy Asthma Rep9(2):128–133.
Kjaergaard S, Pedersen OF, Molhave L (1992) Sensitivity of the eyes to airborne irritant stimuli:Influence of individual characteristics. Arch Environ Health 47(1):45–50.
Laukova D, Marget I, Plutinsky J (2009) Extrinsic allergic alveolitis: Rarely diagnosed disease.Vnitr Lek 55(5):489–500.
Ledford DK (1994) Indoor allergens. J Allergy Clin Immunol 94(2):327–334.Li CS, Hsu CW, Lu CH (1997) Dampness and respiratory symptoms among workers in daycare
centers in a subtropical climate. Arch Environ Health 52(1):68–71.Mendell MJ, Smith AH (1990) Consistent pattern of elevated symptoms in air-conditioned office
buildings: A reanalysis of epidemiologic studies. Am J Public Health 80(10):1193–1199.Menzies D, Bourbeau J (1997) Building-related illnesses. N Engl J Med 337(21):1524–1531.Menzies D, Comtois P, Pasztor J, Nunes F, Hanley JA (1998) Aeroallergens and work-related
respiratory symptoms among office workers. J Allergy Clin Immunol 101(1):38–44.Oliver LC, Shackleton BW (1998) The indoor air we breathe. Public Health Rep 113(5):398–409.Ooi PL, Goh KT (1996) Sick-building syndrome in a tropical city. Lancet 347(9004):841–842.Ooi PL, Goh KT (1997) Sick building syndrome: An emerging stress-related disorder? Int J
Epidemiol 26(6):1243–1249.Pejtersen J, Brohus H, Hyldgaard CE, Nielsen JB, Valbjorn O, Hauschildt P, Kjaergaard SK,
Wolkoff P (2001) Effect of renovating an office building on occupants’ comfort and health.Indoor Air 11(1):10–25.
Perzanowski MS, Ronmark E, Nold B, Lundback B, Platts-Mills TA (1999) Relevance of allergensfrom cats and dogs to asthma in the northernmost province of sweden: Schools as a major siteof exposure. J Allergy Clin Immunol 103(6):1018–1024.
Pini G, Faggi E, Donato R, Sacco C, Fanci R (2008) Invasive pulmonary aspergillosis inneutropenic patients and the influence of hospital renovation. Mycoses 51(2):117–122.
Raw G, Roys MS, Whitehead C (1993) Sick building syndrome: Cleanliness is next To healthiness.Indoor Air 3:237–245.
Ricks DT (1982) Sick houses, sick offices. Respir Ther 12(6):59–66.Saijo Y, Yoshida T, Kishi R (2009) Dampness, biological factors and sick house syndrome. Nippon
Eiseigaku Zasshi 64(3):665–6671.Seltzer JM (1994a) Biological contaminants. J Allergy Clin Immunol 94(2):318–326.Seltzer JM (1994b) Building-related illnesses. J Allergy Clin Immunol 94(2):351–361.Skov P (1992) The sick building syndrome. Ann NY Acad Sci 641:17–20.Skov P, Valbjorn O, Pedersen BV (1989) Influence of personal characteristics, job-related factors
and psychosocial factors on the sick building syndrome. Danish indoor climate study group.Scand J Work Environ Health 15(4):286–295.
Smith KR, Sundell J (2002) Human exposures to combustion products from household use ofunprocessed solid fuels (biomass and coal) in simple stoves are substantial sources of ill-healthin a world perspective. Indoor Air 12(3):145–146.
Spaul WA (1994) Building-related factors to consider in indoor air quality evaluations. J AllergyClin Immunol 94(2):385–389.
Sterling E, Sterling T (1983) The impact of different ventilation levels and fluorescent lightingtypes on building illness: An experimental study. Can J Public Health 74(6):385–392.
Stolwijk JA (1984) The Sick Building Syndrome: Recent Advances in Health Sciences. LiberTryck, Stockholm.
Verhoeff AP, van Wijnen JH, Reenen-Hoekstra ES, Samson RA, Strien RT, Brunekreef B (1994)Fungal propagules in house dust: II. Relation with residential characteristics and respiratorysymptoms. Allergy 49(7):540–547.

352 G.S. Graudenz
Wallace L (1993) A decade of studies of human exposure: What have we learned? Risk Anal13(2):135–139.
Wargocki P, Wyon DP, Baik YK, Clausen G, Fanger PO (1999) Perceived air quality, sick buildingsyndrome (SBS) symptoms and productivity in an office with two different pollution loads.Indoor Air 9(3):165–179.
WHO (1983) Indoor Air Pollutants: Exposure and Health Effects. World Health OrganizationReports, Copenhagen.

Chapter 19
A Continuous and Proactive Process to EnhanceWell-being Indoors
Tarja Takki, Kirsi Villberg, Valtteri Hongisto, Risto Kosonen, and Anne Korpi
19.1 Introduction
The purpose of this chapter is to describe a systematic process for proactive andcontinuous management of indoor environmental quality. The indoor climate affectspeople during various human activities, such as work, learning, healing, sports, andentertainment. Indoor conditions either support or harm these activities, through apositive or negative impact on human health and comfort.
Controlling the quality of the indoor environment increases occupant satisfaction,improves productivity, supports the organisation’s image, facilitates the manage-
ment of risks to occupational safety and of disability pension due to deterioration in
the work environment, and supports the quality management system of the relevant
company.
People’s well-being and environmental issues are among the major concerns of
European societies today. Increased hospital admissions, extra medication, and mil-
lions of lost work days due to poor indoor environment not only are a financial issue
but, above all, influence the quality of our everyday life.
People in modern societies spend most of their time (90%) in indoor spaces such
as at home, work, or school and in vehicles. Improving the quality of the indoor envi-
ronment enhances human well-being and productivity. Prevention of dissatisfaction
and health symptoms created by poor indoor environment and incorrect operation
of technical systems needs to be our aim.
Buildings are usually prototypes. They are not built as cars are by repeating
the standard work phases and thus enabling a more consistent outcome. There is
always a new group of designers, product suppliers, and contractors creating the new
facility. In addition, it is not mandatory to inspect buildings and their performance
annually, unlike with, for example, cars. Building management is not proactive, nor
is it properly regulated as MOT tests are (the Ministry of Transport requires cars
to be inspected regularly). Instead, it seems as if only when problems arise do the
T. Takki (B)Oy Halton Group Ltd., Helsinki, Finlande-mail: [email protected]
353S.A. Abdul-Wahab (ed.), Sick Building Syndrome,DOI 10.1007/978-3-642-17919-8_19, C© Springer-Verlag Berlin Heidelberg 2011

354 T. Takki et al.
performance of and conditions in the building receive attention. Proactive indoorenvironment management is a new approach to building maintenance. The tools forit already exist, as will be shown in this chapter.
Indoor environment can create dissatisfaction and health problems for usersfor various reasons. Comfort-related and sometimes even health-related problemsoften reported by occupants include too high or low temperature, draught, stuffyor stale indoor air, lack of sound privacy in open-plan offices, and poor quality ofcleaning services (Takki and Virta 2007). At the same time, average physical mea-surements (e.g., room air temperature) and average occupant satisfaction may showhigh comfort. The most common health symptoms reported in buildings includeeye and respiratory tract symptoms, skin irritation, neurotoxic symptoms (e.g.,headache, fatigue, and insomnia), and a sensation of unpleasant odour (Reijula andSundman-Digert 2004; Norbäck 2009). In addition, stress symptoms and difficultiesin concentration may be experienced especially in open-plan offices (Haapakangaset al. 2008).
19.2 A Systematic Method to Analyse Indoor Environment
Here, indoor environment is viewed as having seven main elements: the physicalbuilding, indoor air quality, thermal conditions, acoustics, lighting, maintenance,and building cleanliness. Various factors in these categories are described inFig. 19.1. In a broader context, building safety and security can also be viewed asone category of indoor environment. Building safety includes assessment of injuryrisks, provisions for emergency situations, and personal security against theft orassault.
BuildingIndoor Air
Quality
Thermal
Comfort Acoustics CleanlinessMaintenanceLighting
Indoor Environment
Layout
Location
Materials &
furnishing
Noise level
Speech
privacy
Quality
Quantity
Building
maintenance
Workspace
maintenance
General
cleanliness
Cleaning
service Air
distribution Air movement
Air qualityTemperature
Relative
humidity
Sound
insulation
Fig. 19.1 The different factors of indoor environment

19 A Continuous and Proactive Process to Enhance Well-being Indoors 355
Fig. 19.2 Proactive,continuous process toenhance indoor environmentquality and well-being
A systematic method for assessing and improving indoor environmental quality(IEQ) in existing and occupied buildings is presented in Fig. 19.2. The proactive andcontinuous indoor environment management process consists of the following threesteps: an occupant satisfaction survey, technical analysis, and corrective actions.
By conducting the three phases in this sequence on a regular basis, the well-beingof occupants can be enhanced and kept at a satisfactory level. This process has beensuccessfully utilised in several projects for improving IEQ (Villberg et al. 2008).It is important to manage the indoor environment systematically, in order to preventproblems from appearing in an uncontrollable way.
19.2.1 The Occupant Satisfaction Survey
Questionnaires used for surveying occupant satisfaction and building-related symp-toms (see, e.g., Andersson 1998; Engvall et al. 2004; Takki and Virta 2007; Zagreuset al. 2004) include questions on satisfaction with indoor air quality, thermal con-ditions and ventilation, the health status of the user (previous doctor-diagnosedasthma, current medication, and other illnesses), and symptoms. The benefits ofquestionnaires include that they are easy to carry out, non-expensive, repeatable,accurate, and sensitive.
On the other hand, low response rate and the list of non-specific symptomsweaken the utilisation potential of questionnaires. This is why they seldom workas a sole management method but need the inclusion of physical measurements toserve in the proactive building management process.
19.2.1.1 Comfort-Related Questionnaire
The process begins with an occupant satisfaction survey that is directed to everyoneworking in the building. The suggested minimum number of occupants is 20 per

356 T. Takki et al.
floor/cardinal point/department. The response rate should exceed 50–60%. Only
those results for which there are more than five respondents per building area should
be analysed. Respondents are asked to identify the area of the building where their
workplace is located. The survey questions ask whether the workspace is in the
internal or perimeter zone and whether it is near a window, and also the orientation
and layout type of the office are linked with the information collected. These ques-
tions are specific to each building and tailored for the direction and shape of the
building, and the wishes of the customer.
The satisfaction items encompass questions on the human perception/experience
of the indoor environment. The topics are general satisfaction with the building
and workspace, office layout, office furnishings, thermal comfort, indoor air qual-
ity, lighting, acoustics, building cleanliness, and maintenance. The occupants are
asked to give a score indicating their personal satisfaction with each item on a
scale from ‘very dissatisfied’ to ‘very satisfied’ (Zagreus et al. 2004). The numeric
values are as follows (see Fig. 19.3): very dissatisfied = −3, dissatisfied = −2,
slightly dissatisfied = −1, neutral = 0, somewhat satisfied = 1, satisfied = 2, very
satisfied = 3. When the occupant chooses a negative value to describe his or her
state of satisfaction, additional questions are presented to be answered.
With regard to thermal comfort, the aim is to clarify what is wrong with the
temperature (too low/too high/or both/in turns), when the problem occurs (e.g.,
am/pm/all day/on weekends/on Monday mornings/always/unpredictably), and the
apparent reasons behind thermal discomfort (draught caused by ventilation equip-
ment or windows/stagnant air/sunshine/hot or cold surfaces/heat generated by
Average Scores by Category
1.58
1.36
1.54
1.30
0.67
0.83
1.41
0.66
0.64
–3 –2 –1 0 1 2 3
General satisfaction – building
General satisfaction – work space
Office layout
Office furnishing
Thermal comfort
Air quality
Lighting
Acoustics
Cleanliness & Maintenance
Very
dissatisfied
Very
satisfied
a
4%
10% 12% 13%
23%
29%
9%
0%
10%
20%
30%
40%
50%
60%
70%
– 3 –2 –1 0 +1 +2 +3
% r
esp
on
den
ts
62%N = 247 26% 13%Dissatisfied Neutral Satisfied
Mean 0.67
b
Fig. 19.3 Examples of occupant satisfaction survey results. (a) Average scores by category.(b) Satisfaction distribution for the survey responses on thermal comfort. The results show a widedistribution of results that our studies have shown to be typical of thermal comfort. Either thermalcomfort overall is not managed systematically and therefore the deviation of this ‘process’ is highor human perception of thermal comfort varies greatly individual by individual

19 A Continuous and Proactive Process to Enhance Well-being Indoors 357
office machines/inaccessible thermostat/thermostat adjusted by other people/slowadjustment or insufficient capacity of heating or cooling systems).
Dissatisfaction with indoor air quality (IAQ) may be examined in more detailvia questions on the presence of odours/ irritation symptoms (yes/no), when theodour/irritation problem occurs (am/pm/all day/on weekends/on Mondaymornings/always/in summer/in winter/in fall/in spring/unpredictably), and theorigin of the odours (tobacco smoke/office machines/food/surface materials/furniture/humans/cleaning agents/sewers/mould) or irritation (dust/humans/paper/pollen/sand/cleaning/surface materials/furniture). It is also determined whetherstuffy/stale air or too high or low relative humidity causes problems.
There is always also an opportunity to give verbal feedback and answers inaddition to predetermined options.
The survey can be utilised as a diagnostic tool to identify specific problems andtheir likely sources. When administered in Web-based form, survey can make useof streamlined, rationalised data processing. This approach has three main benefits.Firstly, it can inexpensively involve all occupants in the building. Secondly, being aninteractive tool, it can reveal the areas/premises with the most dissatisfied occupants.Finally, the survey’s interactive branching questions allow it to focus on items to
which occupants give low ratings and thus in many cases diagnose the core of the
problems. The approximate time required to complete the survey is 5–12 min.
The overall results show the average score given by respondents for each indoor
environment element (see Fig. 19.3, pane a). Also the range of the responses can be
seen (Fig. 19.3, b). The graph shows the overall IEQ situation in the building at a
glance, and the results can be compared to a database of results for buildings of the
same type. When the average satisfaction values for each of the indoor environment
factors/categories are calculated, typically they fall between 0 and 2, regardless of
the factor, as the figure shows. However, the range of satisfaction scores is much
wider when the data set is broken down by area of the building (see Table 19.1).
This means that (i) problems are local and (ii) in a building, there are both satis-
fied and dissatisfied occupants. Thus, even when relatively high average scores are
given for satisfaction, there may exist major problems in some parts of the building.
In searching for areas for technical improvement in buildings, it is more useful to
present each aspect of indoor environment separately.
19.2.1.2 Indoor Environment Perception Map
The result of the comfort-related questionnaire is an indoor environmental percep-
tion map (Takki and Virta 2007). This is enabled by the respondents identifying
their location in the building. The perception map locates the causes of dissatisfac-
tion more precisely, by area, floor, compartment, cardinal point, and department as
well as according to specific indoor environment factors (see Table 19.1). All who
scaled their perception as slightly dissatisfied/dissatisfied/very dissatisfied are con-
sidered dissatisfied in this perception map. The perception map helps to allocate
actions to specific areas where they are needed.

358 T. Takki et al.
Table 19.1 An example of indoor environment perception map on different floors and at thevarious façades (dissatisfaction over 30% is highlighted)
Percentage of dissatisfied people
Indoor environmentcategory All
2ndfloor 3rd floor 4th floor 5th floor 6th floor North South
General satisfaction –building
3 3 0 0 13 7 3 0
General satisfaction –Workplace
5 3 6 0 29 0 0 14
Office furnishing –Comfort
10 15 12 8 0 6 7 0
Office furnishing –adjustment
10 9 15 9 0 13 10 14
Thermal comfort 26 36 12 58 0 35 19 43Air quality 20 39 12 8 25 12 10 43Lighting quantity 9 15 6 25 0 0 0 29Lighting quality 12 12 12 17 13 12 16 0Acoustic quality –
sound level16 15 21 33 13 6 10 43
Acoustic quality –acoustic privacy
32 21 36 58 25 35 16 57
Furthermore, if the exact problems have been localised, it is often possible to
optimise the HVAC system such that its energy usage and the dissatisfaction of
users can be reduced at the same time (e.g., when users complain of too cold room
temperatures during summer). In many cases, reporting of visible moisture damage
in the building may also be provided in the survey’s free-comment section.
When the proportion of dissatisfied occupants exceeds a suitable threshold value
(e.g., at least 30%), the next step in the protocol (i.e., the technical analysis and
measurements) is to be taken.
When one is interpreting the average occupant satisfaction survey results, it is
important to realise that the numeric average does not necessarily describe the mag-
nitude of problems. Firstly, this is because psychologically occupants scale different
elements in different ways. For example, satisfaction scores for office layout, office
furnishings, lighting, and cleanliness are invariably higher than scores for thermal
comfort, air quality, and acoustics, because either people normally expect more from
the latter elements or less is invested in them and they are not maintained in a sys-
tematic way. This is also visible in a broader range of results for thermal comfort,
indoor air quality, and acoustics. In addition, these are the elements with most of the
technical problems. Secondly, people tend to emphasise a response by giving a more
extreme score. Thirdly, organisational problems are reflected in overall dissatisfac-
tion. Lastly, the time and time span of a retrospective survey may distort the scaling.
Therefore, in intervention studies it is advisable to ask for current perception both
before and after interventions.

19 A Continuous and Proactive Process to Enhance Well-being Indoors 359
In conclusion, a comfort-related questionnaire is useful in measurement of per-ceived indoor environment quality. As the function of buildings is to provide anindoor environment in which people conduct various activities, perceived indoorenvironmental quality is the main metric for building quality. The results of thesurvey form the basis for further actions to improve indoor conditions in existingbuildings, to provide information to the design team for a new or renovated building,or to measure the success of improvement actions.
19.2.1.3 Health Symptom Questionnaire
Often the first sign of problems with indoor environment quality is the reportingof a specific health problem by a large number of occupants. The most com-mon health symptoms reported include eye and respiratory tract irritation, andgeneral symptoms. Eye symptoms include ocular irritation, burning of the eyes,and dry eyes. The nose symptoms consist mainly of rhinitis, stuffy nose, irrita-tion, and also sinusitis, and throat symptoms such as hoarseness are among thetypical building-related symptoms. In addition to irritation, concepts such as sting-ing, scratching, burning, and itching are used. Lower respiratory tract symptomsinclude dyspnoea and phlegm. In addition, skin irritation, neurotoxic symptoms(e.g., headache, fatigue, and insomnia), and sensation of an unpleasant odour arereported (Villberg et al. 2002; Reijula and Sundman-Digert 2004; Norbäck 2009).Dissatisfaction with acoustics can cause stress symptoms (particularly overstrain),and difficulties in concentration (Haapakangas et al. 2008).
From health symptoms alone, it is, unfortunately, difficult to draw definitive con-clusions as to reasons, because various problems in indoor air/environment qualitycan have very similar health effects. However, it is recommended that a health symp-tom questionnaire, such as the Örebro MM40 questionnaire (Andersson 1998), beincorporated into the survey in order to link users’ health symptoms with indoor
environmental quality.
In a health questionnaire, the following symptoms may be recorded by the
respondents on a weekly basis: fatigue, feeling heavy-headed, headache, difficulties
in concentrating, irritation or a burning or itching sensation in the eyes, stuffy or
runny nose, hoarseness or dry throat, cough, cough disturbing sleep, dry or flushed
facial skin, dry or itching hands (or red skin on the hands), shortness of breath
(dyspnoea), wheezing, fever or chill, joint aches or joint stiffness, and muscle pain.
A symptom map is created from the responses (see Table 19.2).
The interpretation of and decisions on medical actions due to symptom data
requires medical expertise. The indoor environmental specialist can conduct the
health questionnaire and compile the symptom map similarly to the satisfaction
survey.
In cases where dissatisfaction for certain elements and symptoms overlap, con-
clusions as to possible connections between causes and effects may be easier to
draw. However, differences in sensitivity, and the healthy-worker effect (workers
with symptoms have recently been relocated and only healthy ones remain on the
premises), for example, may hamper the discovery of such connections. Therefore,

360 T. Takki et al.
Table 19.2 An example of a symptom map, with symptom prevalence of ≥20% highlighted
Percentage of people having weekly symptoms
Building 1 Building 2
SymptomsAll(1)
Southwing,1stfloor
Southwing,2ndfloor
Southwing,3rdfloor
Northwing,1stfloor All (2)
Southwing
Northwing
n 98 40 12 13 16 73 52 30
Fatigue 27 33 42 0 6 34 35 23Feeling
heavy-headed19 25 33 15 0 27 29 17
Headache 13 20 17 8 0 21 21 13Difficulties in
concentration10 13 17 0 0 18 21 7
Itching, burning, orirritation of theeyes
24 30 42 8 19 37 40 20
Irritated, stuffy, orrunny nose
34 43 33 15 6 48 50 30
Hoarseness or drythroat
27 30 33 23 6 34 35 23
Cough 7 10 8 0 0 14 8 20Cough disturbing
sleep3 0 17 0 0 1 0 3
Dry or flushed facialskin
15 15 25 8 6 26 21 27
Hands dry, itching,or red skin
24 28 50 8 6 30 29 23
Dyspnoea 3 3 8 0 0 3 0 7Wheezing 3 0 17 0 0 3 0 7Fever or chill 3 3 17 0 0 7 10 0Joint aches or
stiffness6 3 17 0 0 10 12 3
Muscle pain 7 3 25 0 0 8 10 3Other 1 3 0 0 0 3 2 3Total % of
symptomaticpersons
65 68 92 62 31 77 73 60
a lack of clear area-based connections between indoor environment quality com-plaints and adverse health effects should not be considered to mean there are nosuch problems to be attended to.
19.2.2 Technical Analysis
A technical analysis is conducted in building areas where at least 30% of respon-dents are dissatisfied. Alternatively, in line with the goals set for indoor environment

19 A Continuous and Proactive Process to Enhance Well-being Indoors 361
quality, further actions can be taken beyond a different predetermined thresholdpercentage.
Typically the main problem areas are thermal comfort, indoor air quality, andacoustic environment. Comprehensive analysis of indoor environment requires amultidisciplinary team representing expertise in at least IAQ, building physics, andHVAC systems. The team also needs knowledge of lighting, acoustics, and air distri-bution, in case these areas have been a source of significant dissatisfaction or healthsymptoms.
In many cases, technical problems causing local dissatisfaction can be found onlyif questionnaires are completed before technical analysis. The results of the physicalmeasurements and qualitative observations are compared with reference values inthe literature, standards, or results in corresponding investigations in order to definesignificant deviation. Corrective measures are to be determined from the results ofthe survey and the technical analysis.
19.2.2.1 Indoor Air Quality
Indoor air quality can be reduced by, for example, dust, man-made mineral fibres,microbial spores, propagules and metabolic products, soot, pollens, insect and petallergens, volatile and semi-volatile organic and inorganic compounds, and asbestos.Also unsuitable relative humidity, high temperature, and high CO2 concentrationmay decrease perceived IAQ and indicate problems.
Choosing the right technical measurements in situations of high prevalence ofIAQ dissatisfaction requires special expertise. There is neither a systematic samplingstrategy to follow nor a panacea with respect to what samples to take, since therange of things to measure is vast, as can be deduced from the list of contaminatingagents. Instead, on the basis of hints obtained during the OSS as to possible causes,the technical measurements can be targeted cost-effectively. The pros and cons ofthe methods for measuring some of these agents are discussed in more detail inChap. 24.
Despite the lack of clear correlation between health symptoms and underlyingcauses, several studies have shown that too high room temperature has a negativeeffect on perceived indoor air quality and increases symptom prevalence. This isbecause, as a result of increased temperature, also material emissions and prod-ucts of human metabolism increase, and the air is perceived as dryer and stuffier.Also too high RH reduces the perceived indoor air quality. In particular, complaintsof fatigue, headache, and upper respiratory tract symptoms have been reported toincrease with temperature (Norbäck and Nordström 2008). This is why temperatureand RH should always be routinely measured. Also the adequacy and functioning ofventilation should be a starting point especially when irritation and nose symptomsand central nervous system symptoms are recorded.
19.2.2.2 Thermal Conditions
Poor thermal comfort refers to too cold or too hot circumstances or the sensationof draught. Methods to analyse thermal conditions are dealt with in more detail in

362 T. Takki et al.
Chap. 24. In brief, they include recordings of room air temperature, air velocity, andturbulence intensity. Also, smoke visualisation of air distribution and air flows, pres-sure differences, and the airtightness of certain structures is an appropriate method.Sometimes measurements of water-flow rates in heating and cooling systems – e.g.,
via thermal infrared imaging – should be employed. Furthermore, observations by
experts play an important role in assessing the causes of the problems.
The whole-body thermal sensation may be acceptable while local perception
could be dissatisfactory. Temporarily or spatially fluctuating thermal conditions
are typically caused by insufficient capacity of heating or cooling systems, high
thermal loads from indoor or outdoor sources, and poor control and regulating sys-
tems. Unacceptable local thermal sensations, in turn, can be caused by incorrect
positioning of work areas with respect to air distribution.
Too high a room temperature is often accompanied by complaints of stuffy air
due to increased material emissions and products of human metabolism. Also, com-
plaints of fatigue, headache, and upper respiratory tract irritation have been reported
to correlate with increasing temperature (Norbäck and Nordström 2008).
In the case of the need for larger corrective actions for air conditioning, mock-ups
in the room or built in a laboratory might be appropriate tools, as might compu-
tational fluid dynamics (CFD) simulations. These are, however, heavy tools and
require great investments in time and resources.
19.2.2.3 Acoustics
Noise is the most distracting factor in an indoor environment, especially in open-
plan offices (Kaarlela-Tuomaala et al. 2009). The objective of room acoustics is
to enhance desirable sounds and at the same time reduce non-desirable sounds so
that they are not perceived as disturbing. Improper acoustic design can result in
reduced work or learning performance and in communication difficulties or insuf-
ficient speech privacy. The negative effects of noise can be significantly mitigated
by proper acoustic design. This demands special expertise that is not always avail-
able in building design. Therefore, in many cases, the acoustic problems need to be
solved afterward, which is very challenging.
There are six important acoustic descriptors that need to be considered during
the design process:
1. Intelligibility of speech inside the room, which is usually determined via
measurement of the speech transmission index
2. The noise level of HVAC systems.
3. The reverberation time of the room.
4. The noise level of external environmental sounds.
5. Airborne sound insulation between rooms.
6. Impact sound insulation between rooms.
Acoustic design has two important elements: room acoustics and sound insulation.
A room’s acoustic quality depends on descriptors 1–4. Sound insulation is involved

19 A Continuous and Proactive Process to Enhance Well-being Indoors 363
in descriptors 4–6. Determination of the acoustic descriptors is described in the
standards ISO/DIS 3382 (descriptor 1) and EN ISO 10052 (descriptors 2–6).
What constitutes a good acoustic environment is determined by the purpose of
use of the room. Work premises can be roughly divided into three main categories
according to their room acoustic environments:
• Category 1: large spaces for several independent knowledge workers – e.g., open-
plan offices, shared patient rooms, lounges, bank halls, and libraries.
• Category 2: spaces for good oral communication – e.g., auditoria, classrooms,
meeting rooms, and operating theatres.
• Category 3: small rooms – e.g., private office rooms and doctor’s consulting
rooms.
The most common room acoustic problems for spaces in category 1 are the dis-
turbance of surrounding speech and insufficient acoustic privacy. These cause
concentration difficulties and problems in the management of confidential discus-
sions, respectively. The problem can be solved by applying an ‘ABC’ principle
involving simultaneous management of the following three factors (Virjonen et al.
2009):
• Absorption. Maximise the amount of absorption material in the ceiling, walls,
and furniture. Textile floor coverings are recommended. However, the effect on
perceived IAQ should be assessed and low-emission materials chosen.
• Blocking. Install sufficiently high space dividers such as screens and storage units
between workstations and between team work areas.
• Covering. Mask speech sounds with a continuous masking sound that has the
same spectrum as speech. The background sound pressure level of the room
should be high enough to mask the surrounding speech. The recommended sound
pressure level for masking is 42 dBA in open-plan offices and 48 dBA in other
category-1 spaces.
In addition, the room should be provided with supporting spaces, such as phone call
rooms and silent workrooms to permit perfect speech privacy, for temporary use.
The most common room acoustic problems for categories 2 and 3 include too
high a background noise level and too long a reverberation time of (i.e., too much
echo in) the room. These cause reduced speech intelligibility, which degrades both
learning performance and communication quality. The noise level should be less
than 35 dBA. Reverberation time can be controlled via absorption materials at the
perimeter of the ceiling and in the upper part of one or two walls. The absorption
area should not be more than 100% of the floor area, to keep speech sound pressure
high enough throughout the room.
Sound insulation problems are similar in all three categories. In most cases, the
structural sound insulation of walls and floors may be sufficient while the problems
are caused by sound leaks due to negligent workmanship. These occur because of
missing door seals; missing doorsills; improper sealing around the wall perimeter;

364 T. Takki et al.
and holes made for electric, ventilation, water, or heating lines. The ventilation ductscan also transmit airborne sound between nearby rooms. Structural changes shouldnot be made before these acoustic paths are fully eliminated. If structural changesare still needed, they should be designed by an acoustic expert, as the original struc-tures and other edge conditions of the room need to be examined in order to find theoptimal way to increase sound insulation.
If acoustic problems appear in the workplace, acoustic measurements may benecessary for uncovering the failure in acoustic design and providing informa-tion for complementary acoustic design. The measurement results are comparedto national building norms or other target values presented in the building or rentalcontract.
19.2.2.4 Lighting
Proper lighting conditions enhance vision; reduce eyestrain and pain associated withthe neck, shoulder, and head; and do not generate mental stress. In addition, properlighting creates a comfortable work environment that has a positive impact on theemployee’s well-being.
The European standard CEN 12464 (2002) does not call for uniform lighting
throughout a room, but the work area and areas in its close proximity have to be
illuminated properly. The intensity of illumination in other parts of the room can be
lower. The advantages of this guideline are flexibility in locations of light fixtures
and lower energy use.
The most important factors in lighting quality are:
• sufficiency of illumination,
• suitable luminance ratios in the work area and its immediate surroundings,
• limiting of glare from both lighting fixtures and windows,
• good colour-rendering,
• comfortable and luminous colour, and
• lighting that does not fluctuate.
Our field studies indicate that lighting conditions are rarely the main cause for dis-
satisfaction or health symptoms. In the rare cases when dissatisfaction with lighting
exceeds 30%, it is important for an expert to observe the conditions and check the
illumination in the work area and luminance ratios.
19.2.2.5 Typical Technical Problems
Typical technical reasons for complaints include the following:
• non-balanced ductwork or pipework,
• unfavourable positioning of the work area with regard to supply air,
• incorrect exhaust grille positioning,
• diffusers with unsuitable throw patterns,

19 A Continuous and Proactive Process to Enhance Well-being Indoors 365
• furniture and light fittings directing air flows toward work areas,• room units operating outside optimal range,• large windowpanes causing uncontrolled air movements and asymmetric thermal
radiation,• poor operation of the building management system or room controllers,• inappropriate materials or improperly maintained materials,• unfavourable room acoustics,• an insufficient number of sound absorption panels in the room,• too little masking of background noise, and• sound leaks through unsealed door or wall seams, electric cable holes, or duct
holes.
Technical measurements that help to identify and verify the typical problems arepresented in Table 19.3.
19.2.3 Corrective Actions
An action plan is created on the basis of the occupant satisfaction survey results(addressing comfort and/or health symptoms) and the technical analysis conductedfor spaces or indoor environment factors representing high dissatisfaction and/or
Table 19.3 Methods that aid in identifying the typical technical problems
Technical problem Useful measurements for identifying/verifying the problem
Non-balanced ductwork orpipes
– Air-flow rate measurement– Water-flow measurement
Diffusers with unsuitablethrow patterns
– Air distribution (smoke visualisation)
Room units/terminalsoperating outside optimalrange
– Air-flow rate measurement– Pressure level of room branch– Smoke visualisation
Large windowpanescausing uncontrolled airmovements and draught
– Air-flow rate measurement– Air distribution– Temperature and RH
Poor operation of thebuilding managementsystem/room controller
– Check the set values and temperature sensor locations– Compare set values (temperature and flow rates) with actual
values– Control the heating and cooling strategy
Inappropriate materials ormaterials with impropermaintenance
– VVOCs, VOCs, and SVOCs– Dust and airborne particles– RH and temperature
Unfavourable roomacoustics
– Sound level– Reverberation time– Speech transmission index

366 T. Takki et al.
high symptom frequency. To ensure high quality in the work, the corrective actionsmust be carried out by certified maintenance and service personnel.
According to our field studies, the typical corrective actions include:
• changes in air distribution patterns,• removal of moist building materials,• change of interior materials,• updating of cleaning instructions,• air-flow rate adjustments,• alterations to the building management system, and• changes to room acoustics through increased use of sound absorption panels and
masking of background noise.
The impact of corrective actions needs to be verified after 6–12 months. The most
suitable method is to conduct a post-action survey to compare the perceived IEQ and
reported health symptoms before and after the corrections. Furthermore, analysis of
selected IAQ samples and technical system measurements should be part of the
procedure. This method could be utilised also in refurbishment projects where the
results of before-and-after evaluations show success in reaching the targeted quality
levels and perceived IEQ.
Thanks to a systematic method, it is possible to rectify defects and errors in a
building, not just the symptoms of these errors. As a result, user satisfaction will be
improved and complaints reduced, and often also the system’s energy-efficiency will
be enhanced. This is especially true of modern office buildings where summertime
indoor temperatures (typical set value: 21C) are often too low to match the general
clothing of occupants. Increasing the temperature set point to 24C (and decreasing
the cooling) would save energy.
19.3 IEQ Certificates
It is important to communicate to building occupants the dedication to a continuous
and proactive IEQ management process. It is essential to provide them with exact
and prompt information regarding indoor environment status, since IEQ is not tan-
gible and, in the absence of proper information and knowledge, occupants may draw
conclusions that are not realistic. An IEQ certificate is a tool for communication.
An IEQ certificate (see Fig. 19.4) is granted to buildings that follow the continu-
ous and proactive IEQ management process. This certificate expresses the building
management’s aim to continuously maintain a good or even delightful indoor envi-
ronment, and it can be displayed in the lobby of the building and on the intranet. The
management’s dedication to sustainable building maintenance and energy-efficiency
through measurement of energy consumption and the building’s carbon footprint
can be added to this process. It is, however, essential to point out that buildings
are for people and that the occupants’ well-being should never be compromised

19 A Continuous and Proactive Process to Enhance Well-being Indoors 367
Fig. 19.4 An example of an IEQ certificate
368 T. Takki et al.
for energy-efficiency. The granting organisation could be a local company that hasbeen certified to utilise the indoor environmental management process and possessesthe knowledge and resources to steer the process and provide the needed tools andexpertise.
The IEQ management process should also include regular meetings of an indoorenvironment group, composed of representatives of occupants, the building manage-ment, the maintenance organisation, and occupational health care services. The aimof the meetings is to discuss the possible problems or challenges related to IEQ andto prevent serious problems from developing. The presence of indoor environmen-tal groups has proved to enhance occupants’ well-being and tenants’ commitment
to continuing lease agreements.
19.4 Discussion
The built environment is a critical factor in societies. The majority of our work
occurs on indoor office-type premises. Thus, actions to improve productivity should
be aimed at office premises instead of production premises. Good IEQ increases
occupants’ performance and productivity. Perceived IEQ and the health symptoms
suffered play an integral role in determining the quality of a building. Even though
numeric physical measurements describe IEQ accurately, only occupant satisfaction
and comfort, and lack of health symptoms, indicate quality and functionality of the
building. Perceived IEQ should be the measure of indoor environment. An occupant
perception map (addressing comfort and health symptoms) is a useful initial tool for
systematic detection of indoor environmental problems.
Sometimes the reason for an indoor environmental problem is a device fault, but
very often it is just a consequence of a change in the office layout or in the usage
profile of the premises. In these cases, changes have been made in furniture and
wall layout while no adaptation of technical systems to the new situation has been
made. The combination of air diffusion, warm or cold window surfaces and thermal
plumes, and non-ideal layout of office furnishings may create unexpected air flows
in the space.
Professional building-owners consider buildings to be bonds. The real value of a
building is formed from the tenancy contracts. Customer satisfaction is part of long-
term success in generating revenues in terms of long lease contracts. According
to an American study (Boma 1999), at least 90% of office tenants consider the
following six amenities and services very important: comfortable temperature,
indoor air quality, quality of building maintenance work, the building manage-
ment’s responsiveness, the building management’s ability to meet tenant needs, and
acoustics/noise control. Yet, in practice, the occupant satisfaction with these features
is usually the poorest. Saari and Takki (2008) have presented one market mechanism
for combining customer satisfaction and lease revenues.
For IAQ or acoustics in a cellular office room, the percentage of dissatisfied per-
sons (PPD) could be set at 15%, 20%, and 30% for an excellent, good, and basic

19 A Continuous and Proactive Process to Enhance Well-being Indoors 369
level, respectively. For thermal conditions and lighting, the corresponding PPD val-ues might be 6%, 10%, and 15%, respectively (Saari and Takki 2008). However, inpractice, the lowest PPD values for thermal comfort are seldom realised, as a resultof lack of possibilities for personal adjustments.
Currently, target values for physical parameters and proportions of dissatisfiedpersons by which to categorise indoor environmental circumstances exist for designpurposes only. There remains no process to control how successfully the set criteriaare met or to guarantee that follow-up and maintenance maintain these values. Yetit would be possible to use occupant-perceived IEQ as a basis for evaluation in sucha practice.
Through requirement of certain standards for indoor environmental conditionsand targets and their monitoring already in the lease contract between the lessor andthe tenant, the indoor environment can be made part of the office services offeredby the property-owner (Saari and Takki 2008).
New building and renovation projects rarely succeed in delivering satisfactoryconditions to occupants. Buildings are prototypes, so the quality of the end resultcannot be predicted. Therefore, it would be beneficial to tie some of the monetaryvalue of the contract for the new building or correction team to the results of thepost-work evaluation. This would create a value-based compensation method alongwith the more traditional hourly or cost-based reward. Measuring the quality of thebuilding from the occupants’ point of view would shift the construction industry at
least slightly toward its main objective: providing comfortable and healthful indoor
conditions for people.
Acknowledgments The authors thank Jorma Lehtovaara, M.Sc., from the Aalto UniversitySchool of Science and Technology for consulting on lighting issues. The Academy of Finland,Research Council for Natural Sciences and Engineering (grant 130187), is acknowledged forfinancial support.
References
Andersson K (1998) Epidemiological approach to indoor air problems. Indoor Air 8(S4):32–39.BOMA (1999) What Office Tenants Want: Building Features, Amenities and Services. Building
Owners and Managers Association and Urban Land Institute, Washington, DC.EN ISO (2004) Acoustics — Field measurements of airborne and impact sound insulation and of
service equipment sound — Survey method. International Organization for Standardization,10052:2004, Geneva.
Engvall K, Norrby C, Sandstedt E (2004) The stockholm indoor environment questionnaire: asociologically based tool for the assessment of indoor environment and health in dwellings.Indoor Air 14:24–33.
European Committee for Standardization (CEN) (2002) Light and lighting – Lighting of workplaces – Part 1: Indoor work places, CEN EN 12464–1.
Haapakangas A, Helenius R, Keskinen E, Hongisto V (2008) Perceived acoustic environment,work performance and well-being – survey results from Finnish offices. In: Proceedings of 9thInternational Congress on Noise as a Public Health Problem (ICBEN) 2008, pp. 434–441.
ISO/DIS 3382-3 (2010) Acoustics — Measurement of Room Acoustic Parameters — part 3: OpenPlan Spaces. International Organization for Standardization, Geneva.

370 T. Takki et al.
Kaarlela-Tuomaala A, Helenius R, Keskinen E, Hongisto V(2009) Effects of acoustic environmenton work in private office rooms and open-plan offices – longitudinal study during relocation.Ergonomics 52:1423–1444.
Norbäck D (2009) An update on sick building syndrome. Curr Opin Allergy Clin Immunol9:55–59.
Norbäck D, Nordström K (2008) Sick building syndrome in relation to air exchange rate, CO2,room temperature and relative air humidity in university computer classrooms: an experimentalstudy. Int Arch Occup Environ Health 82:21–30.
Reijula K, Sundman-Digert C (2004) Assessment of indoor air problems at work with aquestionnaire. Occup Environ Med 61:33–38.
Saari A, Takki T (2008) The indoor condition guarantee procedure and associated lease contractmodel. Facilities 26:144–156.
Takki T, Virta M (2007) A systematic method for improving indoor environment quality throughoccupant satisfaction survey. In: Proceedings of Clima 2007, paper ID 1209.
Villberg K, Saarela K, Mussalo-Rauhamaa H, Malmberg M, Haahtela T (2002) Correlationbetween VOCs emitted from building materials and diagnosed building related symptoms. In:Proceedings of Indoor Air 2002, 2:207–212.
Villberg K, Virta M, Kajaala M, Tuomainen M (2008) Occupant satisfaction survey as a tool toimprove IEQ: a case-study in a hospital. In: Proceedings of Indoor Air 2008, paper ID 892.
Virjonen P, Keränen J, Hongisto V (2009) Determination of acoustical conditions in open-planoffices – proposal for new measurement method and target values. Acta Acustica United withAcustica 95:279–290.
Zagreus L, Huizenga C, Arens E, Lehrer D (2004) Listening to the occupants: a web-based indoorenvironmental quality survey. Indoor Air 14(Suppl. 8):65–74.

Chapter 20
Sick Building Syndrome from an ArchitecturalPerspective
S. Müjdem Vural and Ayse Balanlı
20.1 Introduction
People produce new and artificial environments by rearranging and manipulatingthe conditions provided by nature due to the fact that these conditions generally donot meet all of their needs. This activity is called building production. Constructionactivity has always been essential to people’s efforts towards creating a compatiblenew environment. Environments that cannot meet the needs, structure and actionsof people will adversely affect the health of their users.
Healthy life is the most basic of human rights. A healthy environment is crucialfor this right. In general, people spend 80–90% of their lives inside buildings (indoorenvironment). Because of this, it is an important and vital right to live in a healthybuilding.
People in charge of design and construction stages of buildings are also respon-sible for the production of healthy buildings. The right of the building’s users tolive in a healthy environment is taken away if the design and construction stages aremismanaged and do not address the purpose of the building.
The purpose of this chapter is to contribute to the design and construction stagesby determining the situations that have adverse health affects and focus on the risksduring these stages.
Sick Building Syndrome (SBS) is part of the Building Related Illness (BRI).In order to establish the relation between the negative building quality and biologicalas well as psychological health problems, this chapter will describe the relationshipbetween
• SBS and architecture• SBS and quality of the building
S.M. Vural (B)Department of Architecture, Faculty of Architecture, Yildiz Technical University,34349 Istanbul, Turkeye-mail: [email protected]
371S.A. Abdul-Wahab (ed.), Sick Building Syndrome,DOI 10.1007/978-3-642-17919-8_20, C© Springer-Verlag Berlin Heidelberg 2011

372 S.M. Vural and A. Balanlı
20.2 Sick Building Syndrome
Health problems caused by the negative quality of buildings are in the context ofBuilding Biology (See Chap. 7) or Building Related Illness. These health problemscan be biological or psychological. Biological problems include headaches, visualdisorders, deafness, high blood pressure, heart throb, digestive disorders, pain, frac-tures, cuts, wounds, colds, allergies, itching, burning, legionnaires disease, dyspnea,lacrimation, nasal flow, metabolic diseases, throat irritation, dizziness, nausea, vom-iting, memory loss, cacosmia, various types of cancers, asbestosis, pleural tumors,mesothelioma. Psychological problems include tension, irritability, anger, absentia,attention disorders, pessimism and personality disorders. Psychological problemscan also lead to psychosomatic diseases. Some of these health problems appearwhile people are in the building and vanish some time after leaving the building.SBS is used to explain these kinds of health problems.
Symptoms of health problems may start within the first 15 min up to few hoursafter entering the building and vanish after leaving the building in 30 min up to fewhours (Spellman 2008).
World Health Organization classifies SBS into five groups (WHO 1982; Redlichet al. 1997).
• Mucous membrane irritation: eye, nose, throat irritation• Skin irritation: rash, pruritus, dryness, ache• Neurotoxic effects: headache, dizziness, nausea, vomiting, physical and mental
fatigue, loss of memory, lack of concentration• Nonspecific hypersensitive reactions: asthma and other respiratory problems• Chemosensory changes: odor and taste sensations
SBS sufferers usually show no clinical signs of illness (WHO 1982).The age, occupation, addiction, immune system and existing health problems
of building users are significant factors for SBS. Infants, children, elderly people,workers of specific manufacturing processes, smokers and drug addicts, people withimmune system problems are primarily and most commonly affected by SBS.
The building must be designed and constructed with features that will not causeSBS. This is the primary concern of the field of architecture.
Architecture, in its broadest sense, is the restriction of a field in nature by cover-ing it. In other words, architecture is the creation of an inner space that will meet itsintended functions (Izgi 1999).
Architects take full charge of building construction, with its responsibilities andobligations. Architect is the person who;
• Determines the characteristics and needs of the building users• Forms – designs the building• Orients other designers (e.g., engineers, interior designers)• Selects the building products• Decides on production

20 Sick Building Syndrome from an Architectural Perspective 373
• Supervises the building• Manages relations with building inspectors• Organizes all groups of people in the entire building (Öztürk and Balanlı 1995)
Therefore, an architect is primarily responsible for positive or negative inter-actions between the building and the people. The foremost cause of negativeinteraction is incorrect definition of user needs.
Needs arising from the nature of users are met by environmental features of thebuilding. Building features that determine a positive quality are a result of boththe design decisions of the architect as well as the successful reflection of thesedecisions to the actual construction.
If the architect cannot adequately define the needs of users or if the design hasnegative qualities, the building cannot meet the user needs, which may lead to SBS(Fig. 20.1).
It is very difficult for a healthy building to maintain this status during its entirelifetime.
Changes in time and conditions may adversely affect the sustainability of ahealthy building. Time has negative effects on both the building and its users. Theseeffects are caused by;
• Physical aging of the building• Aging of the users
Fig. 20.1 Relationship between SBS, user and building

374 S.M. Vural and A. Balanlı
Fig. 20.2 Changes that cause a healthy building to become unhealthy building
Changes that cause a healthy building to become unhealthy occur due to;
• Building conditions (function, environmental features)• User conditions (user, groups of users or structure of users)• Rules (obligations and scientific findings) (Sarp 2007) (Fig. 20.2)
Determination of a healthy building’s (designed, constructed and brought in usewith healthy qualities) condition in the usage stage is another concern of the fieldof architecture. It is also the duty of the field of architecture to train experts on thistopic.
Sustainability of buildings without SBS depends on periodic assessments.
20.3 Quality of Building and SBS
Physical and social characteristics related to the indoor environment of a buildingare affected by;
• Outdoor environment (physical and social outdoor environment)• Building (as an object)• Usage (See Chap. 3)
SBS can be determined with the help of the examination model given in Chap. 7.The steps of this model developed to specify the health problems caused by thebuilding are

20 Sick Building Syndrome from an Architectural Perspective 375
• The negative features within the indoor and outdoor environments of the building,• The negative conditions due to those negative features,• Hazardous impacts of those negative conditions on health,• The health problems that might be caused by those hazardous impacts (See
Chap. 7)
20.3.1 Physical Indoor Environment Features
The characteristics of the physical indoor environment of a building are;
• Dimensional and spatial features• Visual features• Auditory features• Tactile features• Atmospheric features
The negative physical and social indoor characteristics of a building are significantin terms of SBS.
20.3.1.1 Dimensional and Spatial Features of Indoor Environment and SBS
The needs of human beings, deriving from their biological, psychological and soci-ological structure are usually resolved by their actions. These actions performedwithin a building require, depending on the type of action, an area of a certain size,dimensions and shape.
Size of these building spaces and elements is based on the human dimensions.Dimensions of all buildings are primarily designed to comply with the dimen-sions of its users. This compliance must be both in terms of static and dynamicanthropometry.
Static anthropometry is the measurements of the human body taken in an erectand motionless status. Dynamic anthropometric dimensions are body measurementstaken while performing specific actions (Toka 1989).
To design building spaces, one needs to determine;
• The functions of the space, actions to be taken• Equipment required for these actions• Shape and size of the equipment and how to place them within the space• Required fields for the settlement and usage of the equipment
This determination is a prerequisite to the operational and effective design of thespace.
The form needs to be in harmony with the function. The form mustexplain the mass of the structure, its expression, shape and the distinguishingfeatures.

376 S.M. Vural and A. Balanlı
If the size and shape of the structure and its elements are not appropriate forthe users and their actions, the design is unsuccessful and cannot respond to therequirements. This situation affects the health of the users and leads to SBS.In table 20.1 the biological and psychological SBS formation caused by negativeeffects resulting from dimensional and spatial indoor environmental properties willbe given.
20.3.1.2 Visual Features of Indoor Environment and SBS
Visual features such as light, color related to seeing can cause different healthproblems.
Light from the source or objects enters through the eye. The photoreceptor neu-rons in the retina collect the light and send signals to neurons that then generateelectrical impulses those go to the brain. The brain then processes those impulsesand gives information about the sight. The visual system reacts to luminance andcolor differences (Drahonovska 2005; Tiller and Phil 2000).
Through out the design stage architects must work with lighting experts on illu-minance, illuminance distribution, light source color, and shadow characteristics aswell as natural and artificial light to create healthy buildings.
Table 20.2 shows the biological and psychological SBS formation resulting fromthe negative visual features of indoor environment properties.
20.3.1.3 Auditory Features of Indoor Environment and SBS
Features regarding noise and regarding acoustics (which is related to hearing) cancause different health problems.
Noise can be defined as irregular, physiologically unwanted sound. Indoornoise can result from mechanical systems within the structure, from other humanactivities or outdoor noise (e.g., traffic, construction) (Çevre Orman Bakanlıgı2008).
The parameters of discomfort from noise can be categorized as
• The person’s psychological state at that time (angry, happy, etc.).• The person’s current action (work, sleep, rest, etc.).• Sound quality• Noise level• Noise spectrum• Personal sensitivity to noise perception• Age (infants, children, elderly)• Duration• Nutrition and bad habits (e.g., cigarettes, alcohol)• Certain drugs and toxic substances (EC 1996; Yılmaz Demirkale 2007; Berglund
and Lindvall 1995; Devranoglu 1997)

20 Sick Building Syndrome from an Architectural Perspective 377
Tab
le20.1
Dim
ensi
onal
and
spat
ialf
eatu
res
ofin
door
envi
ronm
ent
and
SB
S
Sic
kbu
ildi
ngsy
ndro
me
Fea
ture
Neg
ativ
efe
atur
esof
buil
ding
Neg
ativ
eco
ndit
ions
Haz
ardo
usef
fect
sH
ealt
hpr
oble
m
Bio
logi
cal
Psy
chol
ogic
al
Dif
ficu
lty
ofm
ovem
ent
Cra
shA
che
Inju
ry
Dim
ensi
onS
pace
inad
equa
tein
dim
ensi
ons
for
the
need
sL
imit
atio
nsof
mov
emen
tC
onst
rict
ion
Tac
hyrh
ythm
iaH
igh
orlo
wbl
ood
pres
sure
Nee
dof
urin
ate
Sto
mac
han
din
test
ine
mov
emen
ts(Ö
ztür
k19
97)
Str
ess
Spa
ceto
ola
rge
for
the
need
s
Unn
eces
sary
amou
ntof
mov
emen
tF
atig
ueS
tren
gth
redu
ctio
nS
tres
sL
oss
ofco
ncen
trat
ion
(Isı
l19
91)
Ove
rwhe
lmin
gef
fect
Dep
ress
ion
Str
ess
Spa
ceca
usin
gfr
eque
ntM
yalg
iam
uscu
lar
cont
ract
ion
and
myo
toni
aL
owox
ygen
envi
ronm
ent
Fat
igue
Shi
ver
Dif
ficu
lty
inm
ovem
ent
Dis
incl
inat
ion
(Isı
l19
91)

378 S.M. Vural and A. Balanlı
Tab
le20.1
(con
tinu
ed)
Sic
kbu
ildi
ngsy
ndro
me
Fea
ture
Neg
ativ
efe
atur
esof
buil
ding
Neg
ativ
eco
ndit
ions
Haz
ardo
usef
fect
sH
ealt
hpr
oble
m
Bio
logi
cal
Psy
chol
ogic
al
Too
muc
hbe
ndin
gP
ress
ure
onth
elu
ngs
Apn
eaS
pace
inha
rmon
ious
wit
hus
eran
ddi
men
sion
ofeq
uipm
ents
Res
pira
tory
prob
lem
s
Too
muc
hre
achi
ngR
estr
icte
dbl
ood
flow
toex
trem
itie
sA
che,
shiv
er(Ö
ztür
k19
97)
Met
abol
icdi
sord
ers
Insu
ffici
ent
volu
me
Low
oxyg
enen
viro
nmen
tIn
adeq
uate
cell
oxyg
enS
leep
ines
sR
educ
edbr
ain
func
tion
sD
isin
clin
atio
n
Inad
equa
tede
term
inat
ion
ofus
ers
stru
ctur
ean
dD
isin
clin
atio
nL
ack
ofm
otiv
atio
n
For
m
need
sin
the
desi
gnst
age
Inap
prop
riat
efo
rmD
issa
tisfi
edF
atig
ueU
nhap
pine
ssS
tres
s
Aes
thet
icch
arac
teri
stic
ssu
chas
harm
ony,
rati
oan
dfo
rmne
glec
ted
Una
esth
etic
form

20 Sick Building Syndrome from an Architectural Perspective 379
Tab
le20.2
Vis
ual
feat
ures
ofin
door
envi
ronm
ent
and
SB
S
Sic
kbu
ildi
ngsy
ndro
me
Fea
ture
Neg
ativ
efe
atur
esof
buil
ding
Neg
ativ
eco
ndit
ions
Haz
ardo
usef
fect
sH
ealt
hpr
oble
m
Bio
logi
cal
Psy
chol
ogic
al
Sta
gger
Con
tusi
onIn
appr
opri
ate
ligh
ting
Fal
lS
prai
nC
rash
Ble
edin
gN
egat
ive
feel
ings
Dif
fere
nces
inei
ther
the
lum
inan
ceof
obje
cts
orsu
rfac
esA
dapt
atio
nin
the
reti
naB
lurr
edan
ddo
uble
Vis
ion
(Dra
hono
vska
2005
)
Str
ess
Exc
item
ent
Dep
ress
ion
Rap
idch
ange
sin
cont
rast
Irri
tabi
lity
Lig
htL
ack
ofli
ght
anal
ysis
(int
erna
lan
dex
tern
alfa
ctor
s,us
erne
eds)
Uni
form
ity
ofar
tifi
cial
ligh
ting
Sti
mul
ate
few
erel
emen
tsof
reti
naan
dde
crea
sevi
sual
perf
orm
ance
Eye
fati
gue
(Dra
hono
vska
2005
)
Lac
kof
perc
epti
on
Lac
kof
dayl
ight
Dis
turb
ance
inth
ere
gula
rpr
oduc
tion
ofm
elat
onin
Imm
une
and
horm
one
syst
ems
disb
alan
ce(D
raho
novs
ka20
05)
Syn
drom
ese
ason
alde
pres
sion
Hig
hlu
min
ance
Dis
com
fort
glar
eIn
crea
sese
nsit
ivit
yto
glar
eV
isua
lim
pair
men
tT
ired
ness
Ner
vous
ness
Lac
kof
wel
l-be
ing
Con
tras
tof
back
grou
ndD
isab
legl
are
Vis
ual
inst
ant
inab
ilit
y
Hig
hgl
ossy
obje
cts
Cor
rupt
edli
ghti
ngfi
xtur
eF
lick
erin
gli
ght
Hea
dach
e(S
arp
2007
)N
egat
ive
feel
ings

380 S.M. Vural and A. Balanlı
Tab
le20.2
(con
tinu
ed)
Sic
kbu
ildi
ngsy
ndro
me
Fea
ture
Neg
ativ
efe
atur
esof
buil
ding
Neg
ativ
eco
ndit
ions
Haz
ardo
usef
fect
sH
ealt
hpr
oble
m
Bio
logi
cal
Psy
chol
ogic
al
Inap
prop
riat
eco
lor
Em
otio
nch
ange
s
Col
orL
ack
ofli
ght
anal
ysis
(int
erna
lan
dex
tern
alfa
ctor
s,us
erne
eds)
Fix
edpa
tter
nsan
dco
lors
Tim
esh
ift
ofre
tina
lad
apta
tion
Aft
er-i
mag
es(D
raho
novs
ka20
05)
Str
ess
Lon
gw
avel
engt
hssp
ectr
umto
geth
erw
ith
low
illu
min
ance
Tra
nsie
ntm
yopi
a(D
raho
novs
ka20
05)
Fat
igue
Pes
sim
ism
Aes
thet
icA
esth
etic
char
acte
rist
ics
such
asha
rmon
y,ra
tio
and
form
negl
ecte
dU
naes
thet
icfo
rmD
issa
tisfi
ed

20 Sick Building Syndrome from an Architectural Perspective 381
The SBS caused by noise are
• Temporary threshold shift (TTS)• Sleep disorders• Stress and psychosomatic disorders
Hearing disorder is defined as an increase in hearing threshold. This rise may betemporary or permanent (Yılmaz Demirkale 2007).
When affected by severe noise, nerve cells in the cochlea of the inner ear canbe permanently (permanent threshold shift) or temporarily damaged. If the hearingthreshold eventually returns to its original state, this can be defined as a temporaryhearing impairment. A temporary threshold shift (TTS) is a short duration reversiblehearing loss of, usually returning within a few seconds, minutes, or hours afterexposure (Godish 1997).
An uninterrupted sleep of sufficient duration is essential for the biological andpsychological health of a human being. Sleeping disorders resulting from noise startwith a noise level of 30 dBA (EC 1996). Common sleeping disorders are difficultyin falling asleep, changes in sleep patterns, deep sleep and sudden stimulation.
The definition of an unwanted sound is subjective; its effects on psychologicaland neurological system can vary from person to person (Sabuncu 1999). A directcorrelation with increasing noise and exacerbation of existing psychological prob-lems has been observed (Berglund et al. 1999).
Room acoustics is an important factor for audial comfort, the elements of whichare the reflection, absorption, propagation, refraction, and reverberation, focus andecho of sound in enclosed spaces.
In a room volume, some of the sound waves that hit a surface are reflected, whileothers are absorbed or transmitted.
A person first hears the sound coming directly from the sound source withina space, then hears the reflected sound, while having difficulty hearing the soundabsorbed by the soft and porous surfaces as well as other persons inside the space.Additionally, the propagation, refraction, reverberation and echo of the sound areconsidered as acoustic discomforts. Diversity of the forms and coating on the sur-faces of the volume cause propagation of the sound, while certain obstacles (e.g.,columns, beams) cause refraction of the sound.
Reverberation is the continuation of the sound energy through consecutivereflections down to inaudible levels.
The louder and longer repeat of the sound after initially being heard is called anecho (Yılmaz Demirkale 2007; Everest 2000; Cavanaugh and Wilkes 1999).
The noise within a building and its negative acoustic features can affect the healthof the users may lead to SBS.
Table 20.3 shows the biological and psychological SBS formation resulting fromthe negative auditory features of indoor environment properties.
20.3.1.4 Tactile Features of Indoor Environment and SBS
Users tactile interaction with the surface of building elements can also create prob-lems. In general people interact with walls, floor coverings and service elements.

382 S.M. Vural and A. Balanlı
Tab
le20.3
Aud
itor
yfe
atur
esof
indo
oren
viro
nmen
tan
dS
BS
Sic
kbu
ildi
ngsy
ndro
me
Fea
ture
Neg
ativ
efe
atur
esof
buil
ding
Neg
ativ
eco
ndit
ions
Haz
ardo
usef
fect
sH
ealt
hpr
oble
m
Bio
logi
cal
Psy
chol
ogic
al
Sho
rtte
rmhe
arin
gpr
oble
ms
Tem
pora
ryth
resh
old
shif
tT
achy
card
iaS
tres
s
Sle
epin
gdi
sord
ers
Fat
igue
Imm
unod
efici
cien
cydi
sord
ers
Tac
hyca
rdia
(Ber
glun
dan
dL
indv
all
1995
)
Men
tal
diso
rder
sD
istr
acti
on
Noi
seL
ack
ofno
ise
anal
ysis
(int
erna
lan
dex
tern
alfa
ctor
s,us
erne
eds)
Inad
equa
teso
und
isol
atio
n
Str
ess
Hig
hbl
ood
pres
sure
Nau
sea
Diz
zine
ssM
igra
ine
Thr
oat
irri
tati
onA
sthm
aex
acer
bati
onIt
chin
gS
wea
ting
(Ber
glun
dan
dL
indv
all
1995
)
Lac
kof
conc
entr
atio
nA
nxie
tyD
istr
essi
ngA
bstr
acti
onN
ervo
usne
ssD
isqu
ietu
de(K
ökne
l19
97)
Aco
usti
csIn
suffi
cien
tro
omac
oust
ican
alys
is
Refl
ecti
on,a
bsor
ptio
n,pr
opag
atio
n,re
frac
tion
,re
verb
erat
ion,
focu
sing
and
echo
Lac
kof
acou
stic
com
fort
Lac
kof
hear
ing
Inab
ilit
yto
unde
rsta
ndIn
abil
ity
todi
scer
n(Ö
ztür
kan
dB
alan
lı19
95)
Hea
dach
eM
igra
ine
Str
ess
Acr
imon
yA
nger
Ner
vous
ness

20 Sick Building Syndrome from an Architectural Perspective 383
Elements and components may have slippery, rough, prominent, sharp, hot or coldfeatures.
Design decisions, building product decisions, bad application or usage are themain reason for these elements causing negative conditions.
Slipperiness in particular is an issue of floor coverings. The reasons forslipperiness are,
• Surface of floor finishing being slippery• Slope of walking surface being unsuitable for use• Loss of adhesion properties of surface due to water, oil, mud or similar substances
(Reese 2008)
Roughness, similar to slipperiness, (R-Value, Class A) is a surface property thatcan be classified (Rz surface roughness) (HSE 2007) and is relevant for all surfacesthat can be touched. Roughness is a positive factor against slipperiness but it is anegative factor for accumulation of dust and bacteria.
Difference of levels on surfaces, especially in flooring, is the result of faultydesign and wrong application. When unnoticed, small differences of levels maycause tripping and falling.
Sharp-edged surfaces and building products are dangerous, especially in loca-tions used by children, disabled, sick, elderly people.
Hotness or coldness of a surface is detected by skin contact. There is heat lossif a cold surface is touched and there is heat gain if a hot surface is touched. Heatloss and gain are crucial for thermal comfort. The biological and psychological SBSformations caused by negative effects of the tactile indoor environmental propertiesare given in Table 20.4.
20.3.1.5 Atmospheric Features of Indoor Environment and SBS
The condition of the indoor air can cause different health problems. In term of users’health atmospheric features can be classify as;
• Air quality• Temperature• Humidity• Air flow• Electromagnetic fields
Design decisions, building product decisions, bad application or usage are the mainreason for these elements causing negative conditions.
Atmosphere contains nitrogen, oxygen, argon, carbon dioxide and trace amountof other gases. When the ratio of these components changes the air quality changescalled as air pollution. Indoor air quality is also changes as the ratio of indoor atmo-sphere components changes. This pollution has negative effects on users’ health.

384 S.M. Vural and A. Balanlı
Tab
le20.4
Tac
tile
feat
ures
ofin
door
envi
ronm
ent
and
SB
S
Bui
ldin
gsy
ndro
me
Fea
ture
Neg
ativ
efe
atur
esof
buil
ding
Neg
ativ
eco
ndit
ions
Haz
ardo
usef
fect
sH
ealt
hpr
oble
m
Bio
logi
cal
Psy
chol
ogic
al
Sli
pper
ym
ater
ials
sele
ctio
nS
tagg
er
Sli
pper
ines
sL
oss
ofsu
rfac
ead
hesi
onS
lipp
erin
ess
Fal
lC
ontu
sion
Inap
prop
riat
esl
ope
Dif
ficu
lty
inw
alki
ngS
prai
n
Rou
ghne
ssR
ough
mat
eria
lsse
lect
ion
Rou
ghsu
rfac
esD
ust
and
bact
eria
accu
mul
atio
n
Cra
shT
ouch
Fri
ctio
n
Pai
nB
leed
ing
All
ergy
Mic
robi
aldi
seas
eS
tres
sE
xcit
emen
t
Pro
trus
iven
ess
Des
ign
orco
nstr
ucti
onpr
oble
ms
Lev
eldi
ffer
ence
sT
rip
Fal
lF
rict
ion
Con
tusi
onS
prai
nB
leed
ing
Pai
n
Sha
rpne
ssT
ouch
edsu
rfac
esan
ded
ges
too
shar
pS
harp
edge
sC
rash
Tou
chB
leed
ing
Pai
n
Tem
pera
ture
Tou
ched
surf
aces
too
cold
orto
oho
tU
ncom
fort
able
surf
ace
tem
pera
ture
sC
hill
Bur
ned
Col
dA
mbu
stio
nS
tres
sD
issa
tisf
acti
on

20 Sick Building Syndrome from an Architectural Perspective 385
The detailed study about the health effects of indoor air pollution is given inChap. 3. Some indoor air pollutants can cause SBS. Temperature of the human bodyis between 36.5 and 37.5C. This temperature is affected by the condition of indoorenvironment because of continuous heat exchange between the body and air aroundit. Thermal comfort zone differs for each user according to
• Temperature• Activity level• Insulation value of clothing• Age• Gender• Medical background (Balanlı and Öztürk 2006).
Humidity is the amount of water vapor in the air. Mainly sweating controlsbody temperature. At high humidity, sweating is less effective. One of the fac-tors that affect comfort zone of users is relative humidity (Balanlı and Öztürk2006).
Airflow is created by differences of air pressure levels, which basically dependson the air temperature. Hot air dilates and rises with the decrease in its pressurereplacing by cold air. Various environmental factors can affect the air movementand cause changes on the aspects of airflow. The speed of the flow, contentsand temperature of the air and air change rates of indoor spaces should besufficient and accurate. Inadequate airflow may cause SBS (Darçın and Balanlı2010).
Electro magnetic fields determine the electrical characteristics of air. Pollution ofelectro magnetic fields affects biological and psychological structure of users. Lackof negative ions is one of the important factors of SBS (Topar 1996). The biologicaland psychological SBS formations caused by negative effects of the atmosphericindoor environmental properties are given in Table 20.5.
20.3.2 Social Indoor Environment Features and SBS
Needs arising from social natures of users:
• Living in groups• Obeying norms• Socialization processes (See Chap. 7)
If social needs are not fulfilled, health effects on user will have long-term results.Some negative building conditions related with social environments can cause SBSeven in short usage duration. The relation between social indoor environmentalfeatures and SBS is given in Table 20.6.

386 S.M. Vural and A. Balanlı
Tab
le20.5
Atm
osph
eric
feat
ures
ofin
door
envi
ronm
ent
and
SB
S(S
eeC
hap.
3)
Sic
kbu
ildi
ngsy
ndro
me
Fea
ture
Neg
ativ
efe
atur
esof
buil
ding
Neg
ativ
eco
ndit
ions
Haz
ardo
usef
fect
sH
ealt
hpr
oble
m
Bio
logi
cal
Psy
chol
ogic
al
Car
bon
mon
oxid
e
Hea
dach
eF
atig
ueB
reat
hles
snes
sW
eakn
ess
Diz
zine
ssD
imne
ssof
visi
onV
omit
ing
Lac
kof
coor
dina
tion
and
perf
orm
ance
Con
fusi
on
Air
Qua
lity
Lac
kof
poll
utan
tan
alys
is(i
nter
nal
and
exte
rnal
fact
ors,
user
need
s)F
alse
buil
ding
prod
uct
sele
ctio
nIn
adeq
uate
deta
ils
Poo
rin
door
air
qual
ity
Car
bon
diox
ide
Dro
wsi
ness
Diz
zine
ssH
eada
che
Nau
sea
Bre
athl
essn
ess
Nit
roge
nox
ides
Bur
ning
and
stin
ging
ofey
es,n
ose
and
thro
at
Sul
fur
oxid
esC
ough
ing
Tol
uene
Fat
igue
Dis
turb
edsl
eep
Eye
irri
tati
onL
ack
ofco
ordi
nati
on

20 Sick Building Syndrome from an Architectural Perspective 387
Tab
le20.5
(con
tinu
ed)
Sic
kbu
ildi
ngsy
ndro
me
Fea
ture
Neg
ativ
efe
atur
esof
buil
ding
Neg
ativ
eco
ndit
ions
Haz
ardo
usef
fect
sH
ealt
hpr
oble
m
Bio
logi
cal
Psy
chol
ogic
al
For
mal
dehy
de
Bur
ning
ofey
esan
dla
crim
atio
nS
neez
eH
eada
che
Nau
sea
Vom
itD
iarr
hea
All
erge
ntr
igge
rC
ough
ing
Fat
igue
Dis
turb
edsl
eep
Unc
omfo
rtab
leof
odor
Inqu
ietu
de
Ozo
ne
Dim
ness
ofvi
sion
Che
stpa
inC
ough
ing
Hea
dach
eL
ack
ofco
ncen
trat
ion
Pol
len
Hou
sedu
stm
ite
All
erge
ntr
igge
r
Dus
t

388 S.M. Vural and A. Balanlı
Tab
le20.5
(con
tinu
ed)
Sic
kbu
ildi
ngsy
ndro
me
Fea
ture
Neg
ativ
efe
atur
esof
buil
ding
Neg
ativ
eco
ndit
ions
Haz
ardo
usef
fect
sH
ealt
hpr
oble
m
Bio
logi
cal
Psy
chol
ogic
al
Tem
pera
ture
Inad
equa
tehe
atis
olat
ion
Exp
ose
tote
mpe
ratu
reno
tw
ith
inth
eth
erm
alco
mfo
rtzo
ne
Ery
them
aC
old
orsw
eati
ngE
yeir
rita
tion
(Sar
p20
07)
Lac
kof
conc
entr
atio
n
Sle
epin
gdi
sord
erF
atig
ue
Hum
idit
yIn
adeq
uate
vent
ilat
ion
Low
orhi
ghhu
mid
ity
Ery
them
aH
eada
che
Las
situ
de(S
peng
ler
etal
. 200
0)
Air
flow
Lac
kof
anal
ysis
(int
erna
lan
dex
tern
alfa
ctor
s,us
erne
eds)
Dry
air
Eye
irri
tati
on
Cha
nges
inth
esp
eed
ofai
rfl
owC
old
orsw
eati
ng(D
arçı
nan
dB
alan
lı20
10)
Dis
quie
tude
Dis
sati
sfac
tion
Ele
ctro
mag
neti
cfi
eld
Spa
ceE
lect
rom
agne
tic
fiel
dM
yalg
iaE
yean
dsk
inir
rita
tion
Fat
igue
Hea
dach
eD
izzi
ness
(Top
ar19
96)
Str
ess
Dis
trac
tion
Ner
vous
ness
Agg
ress
ion
Ang
erU
nhap
pine
ss
Dec
reas
ein
nega
tive
ions
Incr
ease
inse
roto
nin
Dec
reas
ein
mel
aton
in

20 Sick Building Syndrome from an Architectural Perspective 389
Tab
le20.6
Soc
ial
indo
oren
viro
nmen
tfe
atur
esan
dS
BS
Sic
kbu
ildi
ngsy
ndro
me
Fea
ture
Neg
ativ
efe
atur
esof
buil
ding
Neg
ativ
eco
ndit
ions
Haz
ardo
usef
fect
sH
ealt
hpr
oble
m
Bio
logi
cal
Psy
chol
ogic
al
Gro
upE
rror
sin
grou
pch
arac
teri
stic
sas
sess
men
t
Inad
equa
tesp
ace
for
grou
pch
arac
teri
stic
s
Lac
kof
com
mun
icat
ion
Soc
ial
clas
hes
Noi
seP
riva
cyS
uffo
cati
onH
eada
che
Phy
sica
lan
dm
enta
lfa
tigu
eT
hrob
Str
ess
Nor
mE
rror
sin
user
norm
sas
sess
men
t
Inap
prop
riat
esp
ace
for
norm
s(e
.g.,
reli
giou
s,et
hica
l,tr
adit
iona
l)
Cla
shP
riva
cyV
iola
tion
ofno
rms
Soc
iali
zati
onU
ser
soci
aliz
atio
npr
oces
ses
negl
ecte
d
Spa
ces
that
hind
erso
cial
izat
ion
Dis
plea
sure
Sup
pres
sed
pers
onal
ity

390 S.M. Vural and A. Balanlı
20.4 Conclusion
Users of building can have health problems caused by the building. Not all of thesehealth problems can cause SBS. SBS is used to explain the health problems thatappear while people are in the building and vanish some time after leaving thebuilding.
Architects design and construct buildings that will meet the users’ needs of phys-ical and social indoor environment by following some features. The characteristicsof the physical indoor environment of a building are;
• Dimensional and spatial features• Visual features• Auditory features• Tactile features• Atmospheric features
The negative physical and social indoor characteristics of a building are significantin terms of SBS.
To prevent SBS
• User must leave the building• Reduce the effects of SBS factors• Dispose of SBS factors (e.g., ventilation)
Architects can use the given model in this chapter to design health buildings andprevent SBS or define the causes of users’ health problems.
References
Balanlı A, Öztürk A (2006) Building Biology – Approaches. YTU University Publication No:YTÜ.MF.YK – 06.0759/Faculty of Architecture Publication No: MF.MIM- 06.002, Istanbul.(in turkish)
Berglund B, Lindvall T (1995) Community Noise. Stockholm University and Karolinska Institute,Stockholm.
Berglund B, Lindvall T, Schwela DH (1999) Guidelines for Community Noise. WHO Report,Geneva.
Cavanaugh WJ, Wilkes JA (1999) Architectural Acoustics – Principles and Practice. Wiley, NewYork, NY.
Çevre Orman Bakanlıgı (2008) Çevresel Gürültü Degerlendirilmesi ve Yönetmeligi. Ankara.Darçın P, Balanlı A (2010) An Examination of Building Ventilation Methods in Terms of
Enviroment and Natural Ventilation. Ecological Agenda International Conference on NewPerspectives in Eco-Technologies and Eco-Economy, Yildiz Technical University, 10-12 May;in press.
Devranoglu I (1997) Gürültü ve Saglık. Gürültü ile Savasım Sempozyumu; 26–30, Istanbul.Drahonovska H (2005) Light and lighting. In: Rostron J, (Ed.) Sick Building Syndrome: Concepts,
Issues and Practice, Taylor and Francis, New York, NY.

20 Sick Building Syndrome from an Architectural Perspective 391
EC (1996) European Commission. Green Paper on future Noise Policy, http://ec.europa.eu/environment/noise/pdf/com_96_540.pdf.
Everest FA (2000) The Master Handbook of Acoustics. McGraw-Hill, New York, NY.Godish T (1997) Air Qality, (3rd Ed.) Lewis Publishers, New York, NY.HSE (2007) Assessing the Slip Resistance of Flooring. Health and Safety Executive http://news.
hse.gov.uk/2007/03/09/assessing-the-slip-resistance-of-flooring/Isıl B (1991) Ergonomi. Yıldız Üniversitesi Yayınları, 228, Izmit.Izgi U (1999) Mimarlıkta süreç. Kavramlar-Iliskiler. YEM Yayınları, Istanbul.Köknel Ö (1997) Gürültünün Insanın Ruh Saglıgına Etkisi, Gürültü ile Savasım Sempozyumu;
23–25, Istanbul.Öztürk MO (1997) Ruh Saglıgı ve Bozuklukları. Hekimlerbirligi Yayını, 7. Basım, Ankara.Öztürk A, Balanlı A (1995) “Yapı Biyolojisi: Kavram ve Kapsam”, Saglıklı Kentler ve Insaat
Mühendisligi, TMMOB Insaat Mühendisleri Odası Izmir Subesi, Izmir, 20-21 Ekim:135–140.Redlich CA, Sparer J, Cullen MR (1997) Sick-building syndrome. Lancet 349:1013–1016Reese CD (2008) Slips, Trips and Falls Handbook of Safety and Health for the Service Industry.
Crc Press, Boca Raton, FL.Sabuncu H (1999) Endüstride Gürültü ile Olusan Isitme Kayıpları ve Alınacak Önlemler, Is Saglıgı
ve Güvenligi Konferansı, TMMOB Makina Mühendisleri Odası; 99–108, Istanbul.Sarp A (2007) Saglıklı Yapının Sürdürülebilirliginin Degerlendirilmesinde Kullanılabilecek Bir
Yaklasım Önerisi. Doktora Tezi. YTU FBE, Istanbul.Spellman FR (2008) The Science of Air, Concepts and Applications. (2nd Ed.) CRC Press, Boca
Raton, FL.Spengler JD, Samet JM, McCartht JF (2000) Indoor Air Quality Handbook. McGraw-Hill,
New York, NY.Tiller DK, Phil D (2000) Lighting recommendations. In: Spengler JD, Samet JM, McCarthy JF,
ed) Indoor Air Quality Handbook, McGraw-Hill, New York, NY.Toka C (1989) Insan AraçBaglantısında Ergonomik Tasarım Ilkeleri. IDGSA Yayını, 73, Istanbul.Topar AH (1996) Yapıda Elektroiklimsel Kirlilik ile Insan Saglıgı Iliskisi ve Alınabilecek
Önlemler. Yüksek Lisans Tezi. YTU FBE, Istanbul.WHO (1982) Indoor Air Pollutants, Exposure and Health Effects Assessment. World Health
Organization Regional Office for Europe, Copenhagen.Yılmaz Demirkale S (2007) Çevre ve Yapı Akustigi. Birsen Yayınevi, Istanbul.

Chapter 21
The Role of Demographic and PsychosocialFactors in Predicting SBS Symptomsin Workplaces
Gail Kinman and Andrew Clements
21.1 Introduction
The World Health Organisation (WHO 1983) introduced the term ‘Sick BuildingSyndrome’ (SBS) to refer to a range of physiological, cognitive, psychological and
neurological disturbances experienced by employees whilst in their working envi-
ronment. As there is no generally accepted definition for SBS (or indeed an agreed
upon set of symptoms) estimates of prevalence vary widely. A review of the litera-
ture by Glas (2010) highlighted prevalence figures ranging from 4% to 88%. SBS
symptoms are more frequently reported in offices, hospitals and nursing homes, and
schools and day-care centres (Norbäck 2009). A greater prevalence of SBS symp-
toms has also been found amongst regular computer users (Skyberg et al. 2003;
Bakó-Biró et al. 2004) and in densely populated buildings (Chao et al. 2003).
A wide range of symptoms has been associated with SBS. These include skin
irritations, eye, nose and throat complaints, musculoskeletal problems, nausea,
dizziness, headache and lethargy (Hedge 1996), but mental fatigue, confusion and
irritability have also been reported (Bachman and Myers 1995; Hedge et al. 1992;
Ooi and Goh 1997; Wargocki et al. 1999). Extensive costs to industry have been
highlighted through sickness absence, impaired productivity and employee litiga-
tion (Wargocki et al. 2000; Mendell et al. 2002; Burge 2004; Niemelä et al. 2006;
Rostron 2008). The negative impact of building related factors on objectively and
subjectively-rated job performance has been demonstrated. An experimental study
conducted in an office environment by Wargocki et al. (1999) found that exposure
to a source of indoor pollution resulted in lower levels of self-reported effort during
a text typing and calculation task, as well as participants working more slowly than
when the pollution was absent.
Many studies have found relationships between self-reported symptoms and both
independent assessment of the built environment and objective clinical assessment
G. Kinman (B)Department of Psychology, University of Bedfordshire, Luton, Bedfordshire LU1 3JU, UKe-mail: [email protected]
393S.A. Abdul-Wahab (ed.), Sick Building Syndrome,DOI 10.1007/978-3-642-17919-8_21, C©Springer-Verlag Berlin Heidelberg 2011
394 G. Kinman and A. Clements
of employees (e.g. Pejitersen et al. 2001; Stenberg and Wall 1995). Nonetheless,a specific environmental cause for symptom reporting frequently cannot be found(Bachman and Myers 1995; Rothman and Weintraub 1995; Marmot et al. 2006).For example, an epidemiological study of 2,160 office workers in 67 locationsin Singapore conducted by Ooi and Goh (1997) found that factors related to thephysical environment failed to account for the variance in self-reported SBS symp-toms. Moreover, a prospective study of Danish employees conducted by Braueret al. (2006) found significant relationships between perceptions of the indoorenvironment and a number of “symptoms” that had not previously been causallyrelated to environmental factors, as well as associations with symptoms traditionallyconnected with SBS.
In order to explain such findings, it has been suggested that a range of demo-graphic and psychosocial factors might be at least as important as features of theworking environment in self-reported SBS symptoms in employees. This chapterreviews the literature that has examined sex and age as predictors of SBS, as well asseveral psychosocial and work-related factors such as stress, mood, job satisfaction,perceived control and social support.
21.2 Demographic Factors
21.2.1 Sex Differences in Symptom Reporting
The majority of studies conclude that SBS symptoms are more frequently reportedby women (e.g. Brasche et al. 2001; Marmot et al. 2006; Runeson et al. 2006;Hansen et al. 2008). A study of Swedish office-based staff conducted by Stenbergand Wall (1995) found the overall prevalence of SBS for females to be approxi-mately three times that for males. Moreover, men were more likely to be classifiedas “false positives” and women “false negatives”.
Several reasons have been proposed for the higher prevalence of SBS symp-tom reporting in women. It has been argued that males and females differ in termsof inherited biological risks, acquired risks relating to work, leisure and lifestyle,perception of symptoms and help-seeking, and general health reporting behaviour(Stenberg and Wall 1995). An increased prevalence rate of SBS symptoms amongstwomen may reflect a general tendency for women to report higher rates of generalpsychosomatic complaints (Popay et al. 1993). Women may also be more sensitiveto the various factors related to the physical and psychosocial working environment(Brasche et al. 2001). It has also been proposed that women employees experiencemore symptoms associated with SBS than their male counterparts as they typicallywork under physical and psychosocial conditions that are less favourable. A study ofoffice workers conducted by Brasche et al. (2001) tested this proposition. Findingsrevealed that men evaluated the physical working environment more positively thanwomen, and women had higher SBS prevalence rates irrespective of environmental,personal or work-related factors. Interestingly, women working alone in offices had
21 Role of Demographic and Psychosocial Factors in Predicting SBS 395
particularly high prevalence rates, whereas women working in offices with two orthree other people had the lowest. Future research should examine the role played bysocial isolation and social support as moderators of the impact of sex on symptomreporting.
A study conducted by Kinman and Griffin (2008) found some evidence that sexdifferences in symptom reporting may be at least partially attributable to inequity inworking conditions. Their sample comprised 346 informational technology workerswhere males and females were of similar occupational status and performed virtu-ally identical work. No sex differences emerged in the extent of symptom reporting,with the exception of women reporting experiencing more headaches at work thantheir male counterparts. Nonetheless, male and female employees differed in thepsychosocial factors that predicted SBS symptoms and the proportion of variance insymptoms that was explained by these factors.
21.2.2 Age Differences
The findings of research conducted in several countries suggest that SBS symp-toms are more commonly reported by younger and middle aged employees thanthose who are older (Marmot et al. 2006). An epidemiological study conducted inSweden found that SBS symptoms are twice as common in younger employees (i.e.age group 30–39) (Eriksson and Stenberg 2006). Research conducted in Singapore
by Ooi et al. (1998), who sampled 2,826 office workers from 126 offices in 56
randomly selected buildings, also found an increased prevalence of self-reported
SBS symptoms amongst younger age groups. Research findings are not, however,
unequivocal. A study of German office buildings conducted by Brasche et al. (2001)
found age to be a significant risk factor for men only, whereby SBS prevalence was
higher in male employees who were younger than 31 years (OR=2.1) or older than
50 years (OR=2.4).
It has been suggested that the increased prevalence of SBS symptom reporting
in younger employees might be due to the ‘healthy worker effect’ (Ooi et al. 1998),
whereby older employees who were unable to cope with chronic and debilitating
health symptoms left employment. As with sex differences in SBS symptomatology
discussed above, however, it is also likely that younger employees will be working
under less favourable physical and psychosocial conditions than those who are older
and more experienced. This inequity may account for the increased prevalence in
younger people that is commonly found.
As women and younger workers tend to report higher levels of SBS symptoms, it
has been suggested that future studies should control for demographic differences.
Whilst this might be valid under some conditions, it is also important to establish the
mechanisms that underlie such differences. Clearly, further research is required in
a variety of workplace settings with employees of differing demographic profiles in
order to further investigate the reasons for sex and age differences in SBS symptom
reporting.

396 G. Kinman and A. Clements
21.3 Psychosocial Factors
A wide range of work-related factors such as stress, high workload, lack of socialsupport, conflict at work, poor communication patterns, poor management, andorganisational change has been related to the reporting of symptoms typical ofSBS. Other studies have also examined the contribution made by job control, jobsatisfaction and affective variables such as mood (Skov et al. 1989; Norbäck andEdling 1991; Ryan and Morrow 1992; Bachmann and Myers 1995; Crawford andBolas 1996; Arnetz and Wilholm 1997; Ooi and Goh 1997; Spurgeon et al. 1997;Mendelson et al. 2000; Thorn 2000; Lahtinen et al. 2004). These studies will nowbe reviewed.
21.3.1 Job Stress
Several studies have found work-related stress in general to be a significant pre-dictor of SBS complaints (e.g. Ooi and Goh 1997). The majority of studies hasbeen cross-sectional and correlational in nature, and utilised self report measuresof stress. Hansen et al. (2008) examined the role played by several physiologi-cal and self-reported stress indicators as predictors of SBS symptom reporting inteachers working in three Danish schools. Although a significant association wasfound between self-reported stress and symptoms, with the exception of a higherlevel of serum testosterone no relationships emerged between physiological indi-cators of stress and symptom reporting. Interestingly, significant relationships werefound between subjective and objective stress markers for women only. The extentto which this sex difference confounded the findings of the study is, however, notpossible to identify.
Although relationships have been found between stress in general and SBSsymptoms, associations with more specific job stressors have also been exam-ined. Organisational change appears to be of particular importance. Based on areview of several studies, Arnetz and Wilholm (1997) argued that organisational re-engineering and rapid introduction of modern information technologies are majorprecipitating factors in outbreaks of SBS. Studies conducted in a range of differentoccupational settings have also highlighted high workload and high job demand asrisk factors for SBS symptoms (Bachmann and Myers 1995; Marmot et al., 2006).Role stressors (such as role overload, conflict and ambiguity) have also been asso-ciated with specific symptoms (Ooi et al. 1998; Mendelson et al. 2000; Marmotet al. 2006). As well as work-related stress having a more direct relationship withSBS symptom reporting, it is also possible that working under conditions of chronicstress is likely to lead to impaired immune functioning making an employee morevulnerable to infection. This process has been demonstrated in many studies in thefield of psychneuroimmunology, whereby acute stress enhances immune responsein the short term, but impairs it over the longer term (Cacioppo et al. 2007). Such aprocess might account for some symptom reporting.
21 Role of Demographic and Psychosocial Factors in Predicting SBS 397
21.3.2 Job Control
Low levels of perceived control (or poor job autonomy) have commonly been linkedwith negative health status in general (e.g. Spector 1986). In 1983, the WHO sug-gested that lack of control at work is likely to be related to SBS symptom reporting.It has also been argued that, over the long term, low control at work leads to a stateof learned helplessness that might manifest itself as SBS symptoms (Rostron 2008).This is supported by findings that SBS symptom reporting is higher in people witha more external locus of control (Brasche et al. 2001). Such an explanation drawson general observations in the field of social psychology whereby people are morelikely to blame negative outcomes on external rather than internal causes.
Although higher prevalence rates have been observed amongst employees atlower levels in organisational hierarchies (Zweers et al. 1992), until recently therelationship between job control and SBS symptom reporting has been little exam-ined. A study of IT workers conducted by Kinman and Griffin (2008) found positiverelationships between job control and symptoms associated with SBS. This studyutilised a measure that encompasses perceptions of control over a variety of workdomains, including task variety and order and scheduling of breaks, suggesting thatincreasing levels of autonomy over these factors might reduce symptom reporting.It could also be argued that opportunities for employees to influence their physi-
cal working conditions might be a particularly strong predictor of SBS symptoms(Vischer 2007). Indeed, a study of 4,052 office-based civil servants working in 44buildings in the UK found significant relationships between control over aspectsof the physical environment such as heating and lighting and symptoms (Marmotet al. 2006). Clearly more research is required to examine the aspects of job controlthat are more closely associated with SBS symptom reporting, and whether or notenhanced control over these domains lead to changes in symptom reporting.
21.3.3 Mood
Although a considerable body of research has examined relationships betweenemployee affective state and psychosomatic symptoms, very few have focusedspecifically on SBS symptoms. Based on a sample of 624 office workers in SouthAfrica, Bachmann and Myers (1995) found psychological distress (measured byProfile of Mood States) accounted for between 15 and 19% of the variance insymptoms of SBS. Anxiety, in particular, has been positively related to symptomreporting (Runeson and Norbäck 2005). Bauer et al. (1992) compared a range ofaffective states between employees working in a building with known SBS problemsand a control building with no known problems. Findings revealed higher levels ofanxiety in the SBS building, as well as more defensiveness and resentment.
More recently, it has been argued that symptoms experienced when employ-ees are in their working environment might exert a greater influence on moodthat is work-related. Kinman and Griffin (2008) investigated associations between

398 G. Kinman and A. Clements
work-related anxiety and depression and self-reported SBS symptoms. Findingsrevealed that respondents who were more depressed and anxious in relation totheir work tended to report more symptoms. Marked sex differences were, however,observed in the strength of the contributions made by the two mood dimensions.For males, job-related depression was a more robust predictor of symptoms thananxiety, whereas job-related anxiety made the strongest contribution to variance forwomen.
Individuals with higher levels of trait negative affectivity (NA) have a ten-dency to experience a wide range of negative emotions (including anger, guilt,tension and worry). They have also been found to demonstrate a greater reactiv-ity to stressors and hyper-vigilance to subtle bodily sensations and, accordingly,report more symptoms of ill-health (Watson et al. 1987). NA is therefore believed tounderpin many observed relationships between stress and health. Perhaps unsur-prisingly, it has been suggested that NA might be an important predictor ofself-reported symptoms typical of SBS (Hedge 1996). As yet research findingsare inconclusive, but little research has been conducted in organisational contexts.A large-scale study of UK civil servants found that NA moderated the relation-ship between aspects of the physical and psychosocial working environment andSBS symptoms (Marmot et al. 2006). In a study of informational technology work-ers, Kinman and Griffin (2008) found strong relationships between NA and anindex of symptoms associated with SBS. Multiple regression analysis revealedthat NA was also a significant predictor of variance in symptoms when otherfactors (such as job control, job satisfaction and job-related mood) were heldconstant.
The personality dimension of neuroticism is frequently used as a proxy forNA. Neuroticism reflects the tendency to experience emotional distress and aninability to cope effectively with stress. A study of 221 Croatian employeesconducted by Bobic et al. (2009) found that people who were more emo-tionally stable (in terms of lower levels of neuroticism) reported fewer SBSsymptoms.
There is some evidence that a tendency to respond negatively (or positively) tomeasures of physical and psychosocial working conditions and health status mightunderlie some of the associations found in SBS research. Nonetheless, there is alsoevidence that significant relationships between these factors remain even after con-trolling for NA (Marmot et al. 2006). The role played by NA in the reporting ofsuch symptoms in working environments is as yet relatively unexplored and moreresearch is required.
Whilst affective state appears to be related to SBS symptoms, as the majorityof studies are cross-sectional and correlational the direction of causality cannot beestablished. It is not unreasonable to suggest that a negative affective state (whetherstate or trait) might lead an employee to be more sensitive to physical features of theworking environment. The issue of causality and the need for longitudinal researchin order to establish this is discussed later in this chapter.

21 Role of Demographic and Psychosocial Factors in Predicting SBS 399
21.3.4 Job Satisfaction
Research that has examined relationships between job satisfaction and SBS symp-toms tends to conclude that employees who are less satisfied with their work reportmore symptoms (Norbäck et al. 1990; Hedge 1996). Many studies, however, utilisesingle item and/or dichotomous measures of job satisfaction (e.g. Brasche et al.2001). Kinman and Griffin (2008) provided greater insight into the relationshipbetween job satisfaction and SBS symptom reporting by differentiating betweenintrinsic and extrinsic job satisfaction in a study of IT workers. Intrinsic satisfac-tion encompasses features integral to the job (such as recognition for good work,responsibility, and skill utilisation), whereas extrinsic satisfaction covers featuresexternal to the job (such as physical surroundings and opportunities for promotion).Significant relationships were found between symptom reporting and both intrinsicand extrinsic satisfaction. Nonetheless, only satisfaction with extrinsic features ofthe job was a significant predictor of symptomatology. A potential pathway throughwhich extrinsic job satisfaction may lead to self-reported building-related symp-toms was highlighted by Ooi and Goh (1997) who argue that job dissatisfactionmight make employees more aware of, or more critical of, their physical workingenvironment. This proposition should be further examined using multi-dimensionalmeasures of job satisfaction.
21.3.5 Social Support and Management Factors
Several studies have found social support at work to be inversely related to self-reported SBS symptoms. The extent to which employees feel integrated into theorganisation and the general quality of interpersonal relationships have been foundto be related to symptom reporting (Skov et al. 1989; Thorn 2000). Research con-ducted by Ooi and Goh (1997) found an increasing prevalence of SBS symptomsin employees who perceived a poor climate of co-operation at work. Similarly,Rostron (2008) has argued that management attitudes are also important factors inpredicting SBS symptoms. He highlights two pathways by which poor quality man-agement might be associated with symptom reporting: (a) a direct route, wherebypoor management can lead to adverse environmental conditions that can cause SBSsymptoms; (b) an indirect route, where poor quality management might enhancethe sensitivity of employees to environmental conditions that were previouslyconsidered satisfactory.
Several different types of social support can be determined, such as emotional,instrumental, informational and network support (Cohen and Wills 1985). Multi-dimensional measures of social support should be utilised in order to examine thetypes of support that are more likely to protect employees from SBS symptoms. Therelative impact of different sources of support, such as that from management and

400 G. Kinman and A. Clements
colleagues, should also be investigated. The extent to which sensitive and responsivemanagement is a protective factor should also be examined.
21.3.6 Other Psychosocial Factors
There is some evidence that personality variables may be valid predictors of self-reported SBS symptoms. Sense of coherence (SOC) is viewed as a dispositionalorientation or a ‘generalised resistance resource’ (Antonovsky 1987) that can be
utilised in dealing with a wide range of situations and stressors. The SOC construct
comprises three dimensions: comprehensibility, manageability and meaningfulness.
A body of evidence indicates that the stronger the SOC the better the health sta-
tus, regardless of demographic factors such as age (Eriksson and Linstrom 2006).
Runeson and Norbäck (2005) examined the role played by SOC in SBS symptom
reporting in a cohort of 194 employees working in buildings with indoor air prob-
lems. Findings revealed that a low SOC measured at baseline was associated with
greater prevalence of tiredness, headaches and ocular, nasal and throat symptoms up
to 10 years later. Moreover, employees with a lower SOC tended to develop more
symptoms during the 10-year study period. Although only one study on the role
played by SOC in SBS symptom reporting has yet been conducted, these findings
are promising. Further research might consider the role played by other disposi-
tional variables such as coping styles and hardiness. Interventions that acknowledge
the role played by such dispositional variables might be more successful than
those that assume there is little variation in response to objective building-related
factors.
21.4 Discussion
This chapter has presented evidence that demographic variables, features of the
psychosocial working environment and other individual difference factors make a
strong contribution to self-reported symptoms compatible with SBS. It should be
emphasised, however, that this does not mean that SBS is not a genuine illness.
Nonetheless, it has been argued that the continued use of the term “sick building
syndrome” may be misleading, as symptom reporting appears to be “. . . due less
to poor physical conditions than to a working environment characterised by poor
psychosocial conditions” (Marmot et al. 2006). Investigations that consider the con-
tributions made by some of the variables reviewed in this chapter (such as employee
attitudes, personality, behaviour patterns and mood) as well as resources such as job
control and support, are likely to provide a more valid explanation for SBS symp-
tom reporting than those that solely consider the features of the objective physical
environment. It should be noted, however, that the interactions between the indoor
environment, stressful working conditions and individual differences are likely to
be complex.

21 Role of Demographic and Psychosocial Factors in Predicting SBS 401
In order to gain further insight into the SBS phenomenon, it seems necessary forfuture research to utilise more valid measures of SBS and psychosocial variables.The risk of using “biased, ambiguous, badly scaled, and poorly designed” question-naires has been recognised (Hedge 1996). Particular problems have been identifiedin the use of leading questions when examining the prevalence and predictors of SBS(Marmot et al. 2006). Questions that ask participants to indicate the extent to whichthey believe that their symptoms are caused by the building in which they workare also commonplace. Such questions should be avoided as they might promotethe reporting of building-related symptoms. Raw et al. (1996) tested 25 versionsof a questionnaire to measure SBS symptoms in a large sample of office workersin the UK. Different versions of the questionnaire yielded differing results; morespecifically, symptom reports were strongly influenced by the way the symptomswere described, and both symptom reports and ratings of environmental discom-fort were affected by the scale that was utilised to assess frequency. The authorsconcluded that, in order to enhance comparability between different SBS studies, astandardised questionnaire is required.
Studies that examine the impact of psychosocial and work-related variables onSBS symptom reporting frequently utilise single-item measures rather than vali-dated scales. Moreover, some studies have aggregated diverse factors, such as workcontent, workload and job control, into an index. Although the need for brevity isrecognised, such practices can tell us little about the specific psychosocial variablesthat are the strongest predictors of symptoms and/or interact with factors relating tothe objective working environment.
21.5 Priorities for Future Research
It has been recognised for some time that multidisciplinary teams are neededto engage collaboratively in research projects (Hodgson and Storey 1994). Suchteams should identify ways in which organisations might manage the physical andpsychosocial working environment in order to protect employees from SBS symp-toms. An examination of relationships between symptom reporting and aspectsof job control in Call Centres might be particularly fruitful. Many of the jobcharacteristics that have been associated with SBS symptoms, most notably lowautonomy, tend to be found in such working environments (Sprigg et al. 2003).Common features of Call Centre work (such as dense population, habitual computeruse with limited opportunities for breaks, and inadequate responses to variationsin temperature and lighting) might also place employees at greater risk (Brascheet al. 2001).
Most studies that have examined the psychosocial features of the working envi-ronment that predict SBS symptoms have been cross sectional. The direction ofcausality cannot, therefore, be established. It has been recognised that stress may bea reaction to working in an environment that is affected by SBS rather than an actualcause of symptoms (Bauer et al. 1992; Crawford and Bolas 1996). The findings of

402 G. Kinman and A. Clements
studies might suggest that, for example, employees report more SBS complaintsunder conditions of low job control and poor social support, where job-related moodis negative and job satisfaction is low, and negative affectivity is high. Nonethelessreverse causality is an equally plausible interpretation, as regularly experiencinghealth symptoms at work might erode perceptions of job control, impair job satis-faction and lead to more negative job-related mood. Although longitudinal researchcould provide more valid indicators of the direction of causality in symptom report-ing, very few studies have yet been conducted that have examined the role played bypsychosocial factors. Daily diaries would be a particularly appropriate way of mea-suring risk factors and symptoms of SBS over time, as well as examining the impactof controlled interventions on symptom reporting. The relative contributions ofbuilding-related and psychosocial factors to SBS symptom reporting, as well as thenature of their interaction, might be facilitated by the use of daily diaries. Multi-levelmodelling techniques might be a particularly appropriate medium through which toexamine day-to-day within-person effects of building-related and psychosocial fac-tors on symptom reporting, and the impact of between-person factors that might bepotential moderating variables.
References
Antonovsky A (1987) Unravelling the mystery of health: how people manage stress and stay well.Jossey Bass, San Francisco, CA.
Arnetz BB, Wiholm C (1997) Technological stress: psychophysiological symptoms in modernoffices. J Psychosom Res 43:35–42.
Bachmann MO, Myers JE (1995) Influences on sick building syndrome symptoms in threebuildings. Soc Sci Med 40(2):245–251.
Bakó-Biró Z, Wargocki P, Weschler CJ, Fanger PO (2004) Effects of pollution from personalcomputers on perceived air quality, SBS symptoms and productivity in offices. Indoor Air14(3):178–187.
Bauer RM, Greve KW, Besch EL, Schramke CJ, Crouch J, Hicks A, Ware MR, Lyles WB (1992)The role of psychological factors in the report of building-related symptoms in sick buildingsyndrome. J Consult Clin Psychol 60(2):213–219.
Bobic J, Gomzi M, Radosevic-Vidacek B, Kanceljak-Macan B (2009) Association of neuroticismwith sick building syndrome, quality of life and psychomotor performance. Coll Antropolo33(2):567–572.
Brasche S, Bullinger M, Morfeld M, Gebhardt H, Bischof W (2001) Why do women suffer fromsick building syndrome more often than men? Subjective higher sensitivity versus objectivecause. Indoor Air 11(4):217–222.
Brauer C, Kolstad H, Ørbaek P, Mikkelsen S (2006) No consistent risk factor pattern for symptomsrelated to the sick building syndrome: A prospective population based study. Int Arch OccupEnviron Health 79(6):453–464.
Burge PS (2004) Sick building syndrome. Occup Environ Med 61:185–190.Cacioppo JT, Tassinary LG, Berntson GG (2007) Handbook of psychophysiology. Cambridge,
Cambridge University Press.Chao HJ, Schwartz J, Milton DK, Burge HA (2003) The work environment and workers’ health in
four large office buildings. Environ Health Perspect 111(9):1242–1248.Cohen S, Wills T (1985) Stress, social support, and the buffering hypothesis. Psychol Bull
98:310–315.
21 Role of Demographic and Psychosocial Factors in Predicting SBS 403
Crawford JO, Bolas SM (1996) Sick building syndrome, work factors and occupational stress.Scand J Work, Environ Health 22:243–250.
Eriksson M, Lindstrom B (2006) Antonovsky’s sense of coherence scale and the relation with
health – a systematic review. J Epidemiol Community Health 60:376–381.
Eriksson NM, Stenberg BG (2006) Baseline prevalence of symptoms related to indoor environ-
ment. Scand J Public Health 34(4):387–396.
Glas B (2010) Methodological aspects of unspecific building-related symptoms research.
Institution for Folkhalsa och Klinisk Medicin: Umean.
Hansen AM, Meyer HW, Gyntelberg F (2008) Building-related symptoms and stress indicators.
Indoor Air 18(6):440–446.
Hedge A (1996) Addressing the Psychological Aspects of Indoor Air Quality, First Asian Indoor
Air Quality Seminar, Urumqi, China. Retrieved July 2006 from http://ergo.human.cornell.edu/
AirQuality/iaqslides96/ahpaper.html.
Hedge A, Erickson W, Rubin G (1992) Effects of personal and occupational factors on sick build-
ing syndrome reports in air conditioned offices. In: Quick JC, Murphy LR, Hurrell JJ Jr,
(Eds.) Work and well-being: assessments and interventions for occupational mental health.
APA Publications, Washington, DC. pp. 286–298.
Hodgson M, Storey E (1994) Patients and the sick building syndrome. J Allergy Clin Immunol
94(2):335–343.
Kinman G, Griffin M (2008) Psychosocial factors and gender as predictors of symptoms associated
with sick building syndrome. Stress Health 24(2):165–171.
Lahtinen M, Sundman-Digert C, Reijula K (2004) Psychosocial work environment and indoor air
problems: A questionnaire as a means of problem diagnosis. Occup Environ Med 6(2):143–149.
Marmot A, Eley J, Stafford M, Stansfeld SA, Warwick E, Marmot MG (2006) Building health: an
epidemiological study of “sick building syndrome” in the whitehall II study. Occup Environ
Med 63(4):283–289.
Mendell MJ, Fisk WJ, Kreiss K, Levin H, Alexander D, Cain WS, Girmati JR, Hines CJ, Jensen
PA, Milton DK, Rexroat LP, Wallingford KM (2002) Improving the health of workers in indoor
environments: priority research needs for a national occupational research agenda. Am J Public
Health 92(9):1430–1440.
Mendelson MB, Catano VM, Kelloway K (2000) The role of stress and social support in sick
building syndrome. Work Stress 14(2):137–155.
Niemelä R, Seppänen O, Korhonen P, Reijula K (2006) Prevalence of building-related symptoms
as an indicator of health and productivity. Am J Ind Med 49(10):819–825.
Norbäck D (2009) An update on sick building syndrome. Curr Opin Allergy Clin Immunol
9(1):55–59.
Norbäck D, Edling C (1991) Environmental, occupational and personal factors related to the
prevalence of sick building syndrome in the general population. British J Environ Med
48:451–462.
Norbäck D, Michel I, Widström J (1990) Indoor air quality and personal factors related to the sick
building syndrome. Scand J Work, Environ Health 16(2):121–128.
Ooi PL, Goh KT (1997) Sick building syndrome: an emerging stress-related disorder?. Int J
Epidemiol 26(6):1243–1249.
Ooi PL, Goh KT, Phoon MH, Foo SC, Yap HM (1998) Epidemiology of sick building syndrome
and its associated risk factors in singapore. Occup Environ Med 55(3):188–193.
Popay J, Bartley M, Owen C (1993) Gender inequalities in health: social position, affective
disorders and minor physical morbidity. Soc Sci Med 36:21–32.
Raw GJ, Roys MS, Whitehead C, Tong D (1996) Questionnaire design for sick building syndrome
and empirical comparison of options. Environ Int 22(1):61–72.
Rostron J (2008) Sick building syndrome: A review of causes, consequences and remedies. Journal
of Retail and Leisure Property 7(4):291–303.
Rothman AL, Weintraub MI (1995) The sick building syndrome and mass hysteria. Neurol Clin
13(2):405–412.

404 G. Kinman and A. Clements
Runeson R, Norbäck D (2005) Associations among sick building syndrome, psychosocial factors,and personality traits. Percept Mot Skills 100:747–759.
Runeson R, Wahlstedt K, Wieslander G, Norbäck D (2006) Personal and psychosocial factorsand symptoms compatible with sick building syndrome in the swedish workforce. Indoor Air16(6):445–453.
Ryan CM, Morrow LA (1992) Dysfunctional buildings or dysfunctional people: an examination ofthe sick building syndrome and allied disorders. J Consult Clin Psychol 60(2):220–224.
Skov P, Volbjom O, Pedersen BV (1989) Influence of personal characteristics, job-related fac-tors and psychological factors on sick building syndrome. Scand J Work Environ Health15:286–295.
Skyberg K, Skulberg K, Skaret E, Levy F, Kjuus H (2003) Symptoms prevalence among officeemployees and associations with building characteristics. Indoor Air 13(3):246–252.
Spector PE (1986) Perceived control by employees: A meta-analysis of studies concerningautonomy and participation at work. Human Relations 39(11):1005–1016.
Sprigg CA, Smith PR, Jackson PR (2003) Psychosocial risk factors in call centres: an evaluationof work design and wellbeing. Health and safety executive research report. Vol. 169, NorwichUK, HMSO Publications.
Spurgeon A, Gompertz D, Harrington JM (1997) Non-specific symptoms in response to hazardexposure in the workplace. J Psychosom Res 43(1):43–49.
Stenberg B, Wall S (1995) Why do women report sick building symptoms more often than men?.Soc Sci Med 40(4):491–502.
Thorn A (2000) Emergence and preservation of chronically sick buildings. British Medical Journal54:552–556.
Vischer JC (2007) The effects of the physical environment on job performance: towards atheoretical model of workspace stress. Stress Health 23(3):175–184.
Wargocki P, Wyon DP, Baik YK, Clausen G, Fanger PO (1999) Perceived air quality, sick buildingsyndrome (SBS), symptoms and productivity in an office with two different pollution loads.Indoor Air 9(3):165–179.
Wargocki P, Wyon DP, Sundell J, Clausen G, Fanger PO (2000) The effects of outdoor air sup-ply rate in an office on perceived air quality, sick building syndrome (SBS) symptoms andproductivity. Indoor Air 1(4):222–236.
Watson D, Pennebaker J, Folger R (1987) Beyond negative affectivity: measuring stress andsatisfaction in the workplace. Psychol Rev 96(2):234–254.
World Health Organisation (1983) Indoor Air Pollutants Exposure and Health Effects. (EUROReports and Studies No. 78) Copenhagen: WHO Regional Office for Europe.
Zweers T, Preller L, Brunekreef B, Boleij J (1992) Health and indoor climate complaints of 7043office workers in 61 buildings in the netherlands. Indoor Air 2:127–136.

Chapter 22
Epidemiologic Investigation Methods for SickBuilding Syndrome
Omur Cinar Elci, Shelly Rodrigo, and Muge Akpinar-Elci
22.1 Introduction
The Sick Building Syndrome (SBS) has been a public health concern since the1970s when anxiety arose regarding the effect of indoor air quality on health out-comes. SBS has been defined by the World Health Organization (WHO) as: “an
excess of work-related irritations of the skin and mucous membranes and other
symptoms, including headache, fatigue, and difficulty concentrating, reported by
workers in modern office buildings” (World Health Organization 1983). This def-inition refers to any situation where a proportion of building occupants (office orresidential) experience discomfort and poor health outcomes associated with a tem-poral exposure to indoor pollutants within the building. Although SBS started as anurban oriented indoor air hazard, starting from late 1980s investigators reportedhealth problems, caused by indoor air in rural communities (Clark et al. 2010;Colbeck et al. 2010; Pandey et al. 1989). This observation, not only highlighted thescope of the problem, but also pointed an urgent need for further field investigations.
In the investigation of SBS and indoor air related health problems, there is a needto determine the relationship between building related exposures and health out-comes. SBS in public buildings presents a complexity of multiple exposure factorsand variables, which creates a challenge for field investigators. Clinical diagnosismay be a “gold standard” for the identification and evaluation of health problemsrelated to SBS; however, clinical investigations are usually costly and impractical interms of coverage for the whole community or all the occupants of a sick building.The most reliable way of demonstrating this relationship is through epidemiologicfield investigation. A good methodological design of the investigation is crucial toevaluate the outcomes and risk factors; with standard and validated data collectionmethodology and detailed data management procedures playing an important rolein the final outcome and success of the investigation.
O.C. Elci (B)Department of Public Health and Preventive Medicine, St. George’s University School ofMedicine, Grenada, The Caribbeane-mail: [email protected]
405S.A. Abdul-Wahab (ed.), Sick Building Syndrome,DOI 10.1007/978-3-642-17919-8_22, C© Springer-Verlag Berlin Heidelberg 2011

406 O.C. Elci et al.
In this chapter, the epidemiologic methodology of field studies and their practicalapplications; and exposure assessment from an occupational and environmental epi-demiology perspective in SBS is discussed. This chapter also intends to summarizepractical aspects of the epidemiological investigation, without going into theoreticalconcepts and technical details, therefore helping researchers to successfully utilizethis useful toolbox called epidemiology.
22.2 Sick Building Syndrome: Epidemiological Perspective
Sick building syndrome came to attention after publication of case studies report-ing adverse health impacts on building occupants exposed to unvented combustionproducts, as well as to organic chemicals produced from consumer products (WorldHealth Organization 1983). This led to investigation of the factors that affect indoorair quality. Implicated factors include the presence of wall-to-wall carpeting; roomtemperature and the type of ventilation present; and air humidity. In addition it wasobserved that females and persons with a history of allergies were found to be moreat risk.
Symptoms of SBS generally increase with the duration of time spent in the build-ing and in some cases conditions improve or even disappear when away from thebuilding. There is no specificity in the symptoms of SBS, which are often associatedwith allergies and common illnesses; however the most familiar features include:
• Irritation of the mucus membranes: blocked or runny nose; dry or watering eyes;dry or sore throat,
• Respiratory symptoms: asthma-like symptoms, wheezing, shortness of breath,and chest tightness,
• Dry skin and skin irritation, itching and rashes,• Central nervous system problems: lethargy, headache, fatigue and difficulty
concentrating,• Chemosensory symptoms: enhanced odor perception (Hodgson 2005; Redlich
et al. 1997).
The field of epidemiology has been used in the investigation of SBS however itsapplication has been limited and some shortfalls exist in using epidemiologicalinstruments. It has been reported that there were gaps in the investigation of sickbuilding syndrome relating to design, collection and interpretation; the need fordeveloping a theoretical framework; and standardization of the data collection toolused (Dingle 1997; Raw et al. 1996). Additionally, poor sample selection has alsopresented limitations in terms of generalizability of the results since some stud-ies select the building as the unit while other select occupants within the building(Apter et al. 1994). Cross-sectional epidemiological studies have been widely usedto investigate SBS; however, these are limited in that there has been inadequate char-acterization of exposure (Apter et al. 1994); investigators having problems with case
22 Epidemiologic Investigation Methods for Sick Building Syndrome 407
definitions and exposure assessment (Laumbach and Kipen 2005). Therefore, properplanning plays a critically important role in the success of field investigations.
Epidemiological studies on SBS generally attempt to determine the prevalenceof symptoms rather than the prevalence of the condition; however some investi-gations have attempted to determine population prevalence. Apter et al. (1994)reviewed several studies including one, which showed a high prevalence of com-plaints in the sampled population. In another population study, prevalence was highand it noted also that there was a 20% decrease in productivity as a consequenceof SBS.
22.3 Principles of Epidemiological Field Investigation for Sick
Building Syndrome
The Dictionary of Epidemiology defines epidemiology as “The study of occur-
rence and distribution of health-related states or events in specified populations,
including the study of the determinants influencing such states, and the application
of this knowledge to control the health problems” (Porta 2008). This concise, yetdetailed definition brings all components of good epidemiological practice together.By using epidemiology investigators can:
• Study occurrence and distribution of the problem.• Investigate the determinants.• Control the health problems by using this knowledge.
When an unexpected health problem occurs in the community, not only the membersof the community but also the health professionals might be caught off guard. Anypart of the community might be affected: children, adults, or the elderly, houses,office buildings, public areas, schools, hospitals, work places, or vehicles. In otherwords any person or location can be affected by the problem. It is likely that eitherthe problem starts as an acute case, or a chronic problem that attracts attention withan unexpected acute exacerbation. In both scenarios, and regardless of the topic,health investigators face two major challenges:
1. Neither community, nor investigators might be fully prepared to deal with theproblem. From the epidemiological aspect, there will be no study plan, hypoth-esis, immediate goal nor objectives available. Investigators therefore, mightbe responsible for understanding, describing, hypothesizing, analyzing, anddeveloping a solution for the problem.
2. Time is a critical factor and may be the least available resource. The daily rou-tine of persons in the community who are suffering from the problem might bedisturbed, and more importantly they would want an immediate solution. In situ-ations involving health investigations, the public reflex expects a solution for theproblem as soon as possible if not immediately. Therefore, the investigation must

408 O.C. Elci et al.
start right away, and without compromising scientific integrity it has to move asfast as possible towards a solution.
Under these conditions, the most common dilemma when a health investigator facessuch problem is to decide where to start, how to start, and what to do. Not knowingthe answer to this dilemma is usually the most common cause of delays and errors.
22.4 Basic Steps of Epidemiological Field Investigations
Epidemiological field investigations follow a defined procedure even when steps orstages are combined. These steps can be grouped into categories, namely identifyingand describing the problem; systematic evaluation of the problem; and data analysisand interpretation. Based on a modification of the ten steps of field investigationspublished by Gregg (2008), these are:
I. Identifying and describing the problem:
a. Determining the existence of a health problem,b. Confirming the diagnosis,c. Developing a case definition and counting cases,d. Describing the problem,e. Determining the population-at-risk of becoming ill,
II. Systematic evaluation of the problem:
a. Hypothesizing the possible causal relationship between exposure factorsand outcome,
b. Planning a more systematic study,
III. Data analysis and interpretation:
a. Analyzing available data to test the hypothesis,b. Preparing a written report of the results and evidence,c. Developing control plans and preventive measures to be implemented.
22.4.1 Identifying and Describing the Problem
The first four steps of the investigation can be defined as “descriptive steps”. Theinvestigation may start as a result of contact (a call or letter) from community mem-bers, workers, or even from the local or regional authority itself. The investigatorsthen try to understand what the problem is and what the clinical or technical diag-noses are. They try to define and describe the problem by first consulting with thehealth authorities.

22 Epidemiologic Investigation Methods for Sick Building Syndrome 409
22.4.1.1 Determining the Existence of a Health Problem
In SBS, this would involve a visit to the building site to get an overview of thelayout and to consult with those involved. Medical records of those affected maybe obtained and reviewed in consultation with doctors to ascertain that there is amedical problem. Medical symptoms may also be verified at this time.
The health authority is responsible for starting an investigation and the first stepinvolves verification. Each complaint received must be taken into serious consider-ation and evaluated thoroughly until the investigation team concludes whether theclaimed health problem really exists or the community faces a serious risk. In addi-tion to the first complaints, investigators need to collect further information andavailable data to determine the existence of the problem. Local health authorities,local government, municipalities, health care providers, law enforcement officers,local community leaders, workers, and the community members are therefore criti-cal partners in the investigation. Hence investigators must immediately partner withlocal communities and authorities to access information and available data. Themost critical key word for the success of this effort is “communication”. Once thecommunication is established and the data and information become available, inves-tigators should search for any unexpected increase or change in the occurrence ofsymptoms, diagnoses, or any noticeable disease clusters in the community.
Investigators also face various other challenges. The local culture might be unfa-miliar; there might be language barriers; the geographical region might be new toinvestigators; or the industry and occupation might be unknown to the investigationteam. The key to success therefore is to learn from the local community since noone would know the region, culture, customs, or language better than residents ofthe community. No one is a better expert of the work, than workers themselves.
22.4.1.2 Confirming the Diagnosis
During this descriptive step of the investigation, local health records and laboratoryresults can be used to verify the diagnosis. It is recommended that additional inde-pendent laboratories and validated diagnostic techniques be used to double-checkthe diagnosis; although highly recommended, this is not one of the most criticalsteps at the beginning of the investigation. What investigators need to plan for thispurpose is to arrange laboratory connections before going to the field and preparesampling protocols for all samples including dust, mold, and any others requiredfor chemical and biological analysis. We discuss exposure assessment aspects of theinvestigation in more detail later in the chapter.
22.4.1.3 Developing a Case Definition
In order to identify cases and describe the problem existing in the community,investigators need to have a valid case definition addressing the needs of the investi-gation and the nature of the problem. There are numerous case definitions developed

410 O.C. Elci et al.
for communicable and non-communicable diseases. Investigators can adopt oneof those case definitions, modify it according to the needs of the investigation, ordevelop a new one.
Asthma is one of the most prevalent health problems related to sick buildingsyndrome. A study investigating asthma might aim to identify the prevalence ofself-reported physician diagnosed asthma cases in the population. In this situationthe following case definition for asthma would be appropriate:
1. A positive response to the survey question, “Did a doctor ever tell you that youhad asthma?”AND
2. A positive response to any of the following survey questions:
(a) “Do you still have asthma?”(b) “Have you taken prescription medications for asthma during the past year?”(c) “Have you had a wheeze episode in the past year?” (National Heart Lung and
Blood Institute 1995; National Asthma Education and Prevention Program1997;).
However, if the study aims to include incident cases and requires investigators todetermine the clinical diagnosis, then the case definition should be:
A confirmed asthma is one that meets any of the following clinical symptoms atleast three times during the past year AND at least one of the laboratory criteria:
Clinical criteria:
1. Presence of wheezing lasting two or more consecutive days,2. Persistent chronic cough, which responds to bronchodilator, continuing 3–6
weeks in the absence of allergic rhinitis or sinusitis,3. Nocturnal awakening with dyspnea, cough and/or wheezing in the absence of
other medical conditions known to cause these symptoms.
Laboratory criteria:
1. Pulmonary function testing (FEV1, FVC) demonstrating a 12% increment afterthe inhalation of a short-acting bronchodilator;
2. A 20% decrement in FEV1 after a challenge by histamine, methacholine,exercise or cold air
3. A 20% diurnal variation in peak expiratory flow over 1–2 weeks
It is important to note that developing a loosely defined case definition would iden-tify a large number of people falsely as “disease (+)”. Too tightly defined a casedefinition on the other hand, would falsely identify a lot of people as “disease(–)”. While this is not necessarily a negative concept, it actually depends on howaggressive the investigation focuses on the problem and how critical it is to find allcases.

22 Epidemiologic Investigation Methods for Sick Building Syndrome 411
22.4.1.4 Describing the Problem
The classic trilogy of “PERSON, PLACE, AND TIME” is the first epidemiolog-ical tool that the investigator uses to describe the problem. Even under the mostchallenging conditions, approaching the problem with these three indicators, whichepidemiologists call “descriptive variables”, would be the first step in conducting asuccessful investigation.
The determinant factors for the actual list of descriptive variables are the nature ofthe problem and the target of the investigation. For instance, an investigator focusingon respiratory health effects related to the quality of indoor air in an office buildingneeds to know about smoking habits, current and past respiratory symptoms, allergichistory, and physician diagnosed diseases of the occupants of the building. Timeonset of the symptoms and the spatial distribution of the problem are also criticalinformation to describe the problem. Let’s look at an example on person, place, andtime variables:
“The National Institute for Occupational Safety and Health (NIOSH) received a requestfor a health hazard evaluation of an office building in the northeastern USA. Workersreported respiratory and dermatological conditions that they perceived to be buildingrelated. Post-occupancy onset of asthma, HP, and sarcoidosis had been documented inbuilding occupants. Approximately 1,300 people worked in this smoke free building.The facility was a 20-floor building with parking garages on the bottom four floors anda lobby/cafeteria/mezzanine area on the fifth floor. It had a history of water damage,particularly on the upper floors of the building. Since the mid-1990s, the building hadincurred water intrusion through the roof, around windows, and through sliding doors ofterraces. The upper floors had suffered the most water damage and mold contamination”(Cox-Ganser et al. 2005).
The best way of describing the problem is to collect information by asking variousquestions which can be organized using the descriptive variables. In practical appli-cation of epidemiology, there are widely accepted default variables or questionsregarding to these three basic indicators.
PERSON: (Who?) To collect information about person(s) affected from the prob-lem, an investigator needs to know certain characteristics of affected individualsand the population. Age, gender, ethnicity, education level, marital status, socioeco-nomic status, etc. are some of the examples of descriptive variables of “PERSON”.In the case example, we know that approximately 1,300 people worked in thebuilding. Additionally Cox-Ganser et al. (2005) reports:
“We had demographic and participation information on the 689 employees working for oneof the two building tenant organizations. These employees had a mean age of 45 years, and74% were white, 19% were black, and 53% were female.”
Workers reported respiratory and dermatological problems and they perceived thatthese problems might be related to the indoor air problems in the office buildingthey work.
• PLACE: (Where?) The geographical location and distribution of the problem isanother important aspect that investigator needs to know to describe the case.

412 O.C. Elci et al.
Therefore the questions pertaining to address, geographical location, and the spa-tial nature of the problem as well as affected people, need to be answered. Fromthe case above, place information reveals that the building is a smoke free 20-floorbuilding. There are parking garages on the lower four floors and social gatheringareas such as a lobby, cafeteria, and mezzanine are located on the fifth floor.We also learn that the upper floors of the building had a history of water damage.
• TIME: (When?) Seasonal changes, cyclic fluctuations, secular time trends, andtemporal relationships are important pieces of information to describe the prob-lem. In the example, there has been at least a decade long history of water damageand mold contamination, especially in the upper floors of the building.
In addition to these three basic variables to describe the problem, one may addanother indicator:
• COUNT: (How many? or How much?) Starting to collect information on thequantity of the various aspects of the problem, as early as possible, helps inves-tigators to understand the magnitude of the problem. It also helps to track andrecord the changes. One may need to know how many of those 1,300 office work-ers are affected and developed respiratory and dermatological problems in thewater damaged building. The sample case states:
“The prevalence of adult-onset asthma was 12% (103/865). . . . Two-thirds (66/103) of theadult-onset asthma occurred after occupancy of the building” (Cox-Ganser et al. 2005).
22.4.1.5 Determining the Population-At-Risk of Becoming Ill
Population-at-risk is one of the most useful tools to quantify the problem in the pop-ulation. It refers to members of the community who have not developed the healthproblem yet, but carries a risk of becoming ill. Therefore population-at-risk excludesthose who already developed a disease. In determining the population at risk, anestimation of the population size is required. When considering SBS there maypotentially be a large population at risk; this information is critical to the investi-gator especially when considering any large workplace. Determining the populationat risk may not be possible depending on the size of the building and the servicesoffered, since customers may also be affected. However the population at risk amongthe regular occupants of the building can be determined and their location withinthe building established. Additionally, numbers of high risk populations (women,persons with allergies and other risk factors) must be obtained.
22.4.2 Systematic Evaluation of the Problem
From the description of the problem, a hypothesis can be generated which is thentested in a systematic evaluation. This is achieved by conducting an epidemiologicalstudy; environmental monitoring of the location; and medical testing of affected
22 Epidemiologic Investigation Methods for Sick Building Syndrome 413
persons. In the epidemiological study, a survey questionnaire may be used to elicitinformation regarding personal characteristics and social behavior that may have animpact on health; as well as perceptions of the environment. In the above exam-ple, a logical working hypothesis would be that the health of the office workers isaffected by the by the presence of mold contamination in the building, a conse-quence of past water damage. Investigators can even further hypothesize that therisk might be differentiated according to the floor and the intensity of the damage.For instance investigators might ask study question such as “Are the workers whooccupy the upper floors at the highest risk of experiencing illness?”. Such questionslead investigators to identify and formulate goals for the study.
In the epidemiological investigation, the environmental exposures and threatsare identified and from the findings goals are defined to resolve the problems expe-rienced by the building occupants. Goals should be clear and measureable and canbe categorized as being either substantive or procedural.
A substantive goal is one that refers to the characteristics that are desired in thecontext of the situation. An example of such a goal would be to reduce the exposureto pollutants within the building environment by guaranteeing the structural integrityand the use of safe building materials in the renovation of the building to meethealth-related goals.
A procedural goal supports the substantive goal and addresses its implementa-tion. Such a goal would therefore give specific instructions for the performance ofthe objective. An example of a procedural goal would be to establish clear and spe-cific decision-making processes that would promote involvement of all stakeholders(employers, workers, building designers and health officials) in the development ofpolicies and interventions that lead to improved health outcomes within the building.
22.4.2.1 Planning a Systematic Study
Several questions should be considered at the start of the systematic planningof an epidemiological field investigation. These questions (Table 22.1) guide theresearcher in creating a conceptual framework based on the research hypothesis andquestion(s). The conceptual framework provides a map of organized ideas or con-cepts that explains the practical application steps and methods that would be usedto have a successful study.
With the help of these guideline questions, the variables representing outcomesto be investigated can be established. The framework would then show the relation-ship(s), if any, that exist between the variables. Decisions can therefore be made onhow the variables can be measured – quantitative or qualitative. This actually bringsanother useful tool to discuss: variable lists.
At this stage, investigators already know what the problem is; they may not knowyet what caused this problem and how to solve it; however they are developinghypotheses to investigate the problem further and hopefully find the cause to fix it.A “variable list” is a useful tool employed to organize various contributing factorsand their hypothesized relationships, enabling investigators to easily follow every

414 O.C. Elci et al.
Table 22.1 Practical guideline questions for the SBS researcher
1. Determine: “What are you going to do?” This should be clear, concise, and self contained.A reader should understand the aim, the target population, and the dependent variable(s) of theinvestigation.
2. Establish: “What is the problem and why is it important?” This section gives a briefdescription of the problem from a public health perspective. The study can be justified sincethere would be an immediate need to investigate the problem occurring in the SBS location.
3. Develop the hypothesis, objectives and goals: “What are you planning to investigate andaccomplish? Goals and objectives should be established at this point. The researcher needs toidentify the measurable, accessible, and realistic objective(s).
4. Review the literature: “What has been reported on this problem?” Knowledge of the state ofthe science surrounding SBS is important to the epidemiological process since this wouldassist in framing the hypothesis, refining goals and designing the investigation.
5. Develop methods: “How are you going to implement this study?” Study protocols manualscontaining details on the study design are produced.a. Target population: “In which population are you going to do this study?” The target
population should be defined in clear terms addressing time, geographic location, anddemographic indicators (please remember PERSON-PLACE-TIME).
b. Study population: It is recommended that, if needed, a representative sample may beselected from the target population hence there is a need to explain:
i. What inclusion and exclusion criteria will be used to select the study population?ii. How the sample size will be calculated?
iii. What sampling method will be used?iv. Details on the control group, if used.
c. Variables: “What are the dependent and independent variables?” To reach proposedstudy’s goals and objectives, dependent and independent variable list for the studyshould be developed. Each variable must be clearly defined in terms of conceptuallyand operationally.
d. Data collection: “How are you going to collect data?” Data collection methodology isdiscussed – questionnaire or tool used produced.
e. Data analysis: “How are you going to analyze the data?” A data analysis plan is createdand should include the analytical techniques to be used.
f. Limitations and strengths: “What are the strengths and weaknesses of the study?”T limitations and strengths of the study should be considered and how limitations mayaffect the study results needs to be explained.
6. List outcomes: “What are the anticipated outcomes of the project?” Details of the endproducts of the study are given. How would the extent of the problem be assessed and thebenefits to the target population and the community explained.
7. List outputs: “What are the planned outputs of the project?” The channels of disseminatingand sharing the results of the project with the community, peers, and the scientific audienceare considered.
step of their investigation (Table 22.1). Without going into technical details, one cancategorize variables into two main groups:
1. Dependent variables: The main problem on which the investigation is focuseddetermines the dependent variable. In other words, investigators should ask thissimple question to determine the dependent variable for the investigation: “Whatis the main problem are we investigating?”.

22 Epidemiologic Investigation Methods for Sick Building Syndrome 415
In the office building case for instance, the investigation is focused on respiratoryand dermatological health problems. Suppose the investigators decided to inves-tigate asthma as the respiratory heath problem, then the dependent variable forhis investigation would be the occurrence or diagnosis of asthma. So then it canbe hypothesized that mold exposure caused asthma among the office workers.However, if the investigation focuses on mold infestation alone, than the depen-dent variable would be identification the mold infestation in the building. In thiscase, the hypothesis would be that chronic water damage caused mold infestationin the building.
2. Independent variables: All other variables that the investigators suspects or liter-ature reports as related, contribute, predispose, enable, precipitate, or reinforcethe development of dependent variable. Some of these independent variables canbe listed as “risk factors” as well. Age and previous respiratory health prob-lem might be predisposing factors for asthma. Mold exposure on the other handis a precipitating factor for asthma development. Additionally, it is a commonpractice to list demographic, socioeconomic, occupational, and environmentalvariables as default components of the variable list in field investigations.
Once the variable list is prepared, investigators must identify the operational defi-nition and the measurement scale for each variable. This actually brings us back tocase definition, since the case definition is a good example for this.
22.4.2.2 Data Collection
The next step would be to interview and administer the data collection instrumentto all workers. Data collection involves the systematic recording of informationand one of the most practical instruments used in these investigations is the ques-tionnaire. Questionnaire design is a key part of the epidemiological process andimportance can be best illustrated by the statement: “The quality of your data will
be no better than the most error-prone feature of the survey design” (Fowler 1993).In any epidemiologic investigation, knowing the right question to ask is at times
difficult. Framing and refining of the hypothesis about the problem is the first stepin creating the data collection instrument. This step can assist with decisions onwhat information is required to test the hypothesis and examine confounding factors.Knowing this, questions can be developed to obtain the data however wording, orga-nization and question type (open or closed-ended) should be carefully considered.Typically information collected can be grouped into: demographics, environmentaland occupational data, exposures or risk factors, and clinical data.
In the case example, possible questions would address current and previous his-tory of respiratory illness; current and past smoking habits; length of time workingin the building; work and social activities when in the building – use of the lobby,cafeteria and mezzanine; and other questions relevant to the situation. The answersobtained through questionnaires are important since they are in some way relatedto the outcome under consideration. For example, we know that respiratory healthmay be affected by exposure to cigarette smoke hence in an assessment of indoor air

416 O.C. Elci et al.
quality on health, information relating to past or current smoking habits need to beobtained. A well-developed question should therefore collect data that would enableformation of a hypothesis or measurement of the relationship between exposure andoutcome.
22.4.3 Data Analysis and Interpretation
22.4.3.1 Data Analysis
All data collected – questionnaire, clinical, and laboratory, – have to be reviewed,analyzed and interpreted. Technical details on data analysis are beyond the scope ofthis chapter and will not be discussed here.
Data analysis helps to identify significant associations between exposure andhealth, as well as the contribution of multiple risk factors to health outcomes; inother words relationship between dependent and independent variables is revealedby data analysis. This stage is often exciting for field epidemiologists since likeany mystery the answers will be discovered during the analysis. After all the hardwork, the investigators get a chance to bring all the pieces of the puzzle together ina picture that can be shown to and easily understood by all. The findings are thencomplied in a report that documents the process used, and the recommendations forcontrol and prevention. Caution, record keeping, and teamwork are key facets ofthis process.
Data analysis should only be conducted after the data entry has been finalized:data is cleaned and checked for accuracy. However, the data analysis plan shouldbe constructed during the hypothesis formulation and study design steps. The planshould be based on the research question(s) arising from the hypothesis, studydesign, and sampling method. It should detail the purpose of the evaluation; ques-tions to be answered and what needs to be learnt; the technique for analysis; andmethod of data presentation. The plan can therefore be used to assist with select-ing the type of question and response options on the questionnaire, hence enablingefficiency in data collection.
While having a data analysis plan ensures that the survey instrument will obtainthe required information, it also makes the investigator think about how to “report”the data during the designing of the survey instruments. There have been caseswhere investigators collected categorical data and realize that the data should havebeen collected as a continuous variable; or respiratory data collected on a weeklybasis when daily data was necessary to identify unique events distinguished byconsidering intervals or less than 7 days between events. Hence investigators mustbe careful in identifying an operational definition and measurement scale for eachvariable in the planning phase.
The main objectives of data analysis are to:
• Describe the study population,• Assess for potential bias,

22 Epidemiologic Investigation Methods for Sick Building Syndrome 417
• Estimate the measures of frequency and strength of association,• Assess the degree of uncertainty,• Examine the effects of other factors and control for these,• Clarify relationships observed and evaluate the impact and importance.
The common approach to data analysis is to first explore the data. Descriptive anal-ysis helps in understanding the data – outliers, missing data etc. It provides infor-mation relating to frequency (incidence, prevalence), association (differences) andimpact (attributable fractions) for subgroups considered in the study. Investigatorstherefore get a “feel” for the data before beginning more complex data analysis.
The next step would be to consider the research questions that arise fromthe hypothesis or study objectives, as well as any that may arise from patternsobserved during the descriptive analysis. Data are interpreted based on backgroundknowledge and experience.
Adjustments are made during this phase to account for age differences and otherrisk factors. In the example length of time employed would be a factor that shouldbe considered in the analysis, since the longer the duration of exposure the greaterthe likelihood of a negative health impact. The study hypothesis is evaluated withrespect to these factors and other forms of bias identified. The role of chance hasto be evaluated also. The most common procedure currently used is the test ofsignificance; however interpretation of p-values is difficult even for the most knowl-edgeable epidemiologist. Confidence limits, which define the interval in which theestimated population parameter exists, are also reported to quantify the degree ofuncertainty in an estimate.
22.4.3.2 Preparing a Reporting
Data analyses and results are then presented in a format that is understandableand useful to the key stakeholders. Since there are several target audiences, theway in which results are presented is important. Experienced epidemiologists knowthat findings should be presented in a simplified form that is appropriate to audi-ence. A report can and should be produced in such a way that it contains technicallanguage, yet is informative and easy to understand by nontechnical persons.
Communication of research findings is essential in any study since the affectedpopulation, health policy planners, and other stakeholders use the feedback to planthe next step. Reports should be clear, concise and logically structured. It shouldhighlight the most important findings and emphasize those points that warrantimmediate attention. Recommendations and intervention plans are also discussedwithin the report.
22.4.3.3 Development of Control Plans and Preventive Measures
Planning interventions to address SBS will require adoption of policies that willreduce the health risk to the building occupants. For any intervention, goals are

418 O.C. Elci et al.
defined and a timetable established to achieve them. Progress in the implementa-tion of the goals and the effectiveness of the implementation are then evaluated.Assessment will enable adjustments to be made in the intervention plans, poli-cies and methods of implementation. In addition, allocation of resources can bere-considered to address those gaps identified in the assessment.
22.5 Principles of Exposure Assessment for Epidemiological
Investigations
Exposure assessment can be defined as the appraisal and quantification of the pos-sible exposures in the environment that affect human health. In the risk assessment,levels of exposure are determined. Exposure or risk factor data are then used to testthe hypotheses and will be the major focus of the investigation. Information col-lected includes: the exposure specific to the issue; amount of exposure; duration ofexposure; and other relevant details.
22.5.1 The Concept of Exposure
Any contact between a physical, chemical, or biological agent in the environmentand the human body through inhalation, ingestion, or dermal or mucosal contact isdefined as exposure (Nieuwenhuijsen 2003). A person therefore becomes exposedwhen he/she is in contact or close proximity to the risk factor. Exposure may beshort term (acute), of intermediate duration, or long term (chronic). Acute exposuremay defined in terms of number – a single exposure to a toxic substance that resultsin a severe medical condition or death; or duration – exposure for up to 14 days.Intermediate duration exposure refers to contact for more that 14 days and less than1 year; while chronic exposure refers to contact for a prolonged period of time,usually more than 1 year. Duration of exposure therefore affects the level to whicha person is exposed. Exposure levels also depend on the initial concentration of theagent (Checkoway et al. 2004; Rappaport et al. 1991). Investigators therefore need tounderstand steps between exposure source and the health outcome as demonstratedin Fig. 22.1 (Nieuwenhuijsen 2003).
22.5.2 Framework for Assessing Exposure
Frameworks assist in understanding the dynamics of the multiple exposure fac-tors that impact on health outcomes. In assessing risk, the factors are determinedbased on experience and knowledge of the problem, which is then investigated usingenvironmental and/or exposure assessment techniques (Fig. 22.2).
Exposure assessment can be defined as the appraisal and quantification of thedistribution and determinants of exposures in the environment that affect human

22 Epidemiologic Investigation Methods for Sick Building Syndrome 419
Fig. 22.1 Source-receptormodel for air pollutants(Nieuwenhuijsen 2003)
Fig. 22.2 Risk assessment framework
health. From an epidemiological perspective, the success of exposure assessmentis dependent on good study planning, data collection, analysis and interpretation.Therefore, not only the epidemiological investigation, but exposure assessment alsoneeds to be thoroughly planned; and resources, knowledge, and teamwork must beestablished.
The aim of this effort is to identify the risk factors in order to decrease healtheffects and control the hazard. As mentioned earlier in this chapter, all relevant infor-mation and data are used to describe the problem; identify the possible variables;and develop hypotheses on the exposure health outcome relationship. Informationcollected includes: concentration, duration, frequency, and intensity of exposure(Akpinar-Elci and Elci 2002). It is also necessary to identify the chemical, physical,or biological composition of the exposure; and the metabolic and pathophysiolog-ical pathways. However, it is almost impossible to measure all aspects of exposurefor all times. It is usually highly expensive, time consuming, and ineffective to

420 O.C. Elci et al.
attempt to collect such data. Instead various exposure measurements, classificationsand modeling are used to assess exposure and its relationship with health outcomes(Checkoway et al. 2004).
Biological and personal exposure monitoring are the most commonly utilizeddirect exposure assessment methods. Indirect assessment methods such as envi-ronmental monitoring, exposure modeling, surveys, self-assessment questionnaires,and expert assessments are also commonly used in exposure assessment. Eventhough many of these methods utilize time weighted average exposure to assessexposure levels, in some cases short term high intensity exposure might be a relevantway to understand exposure pattern (Elci et al. 2003). Further details of exposureassessment methods are beyond the scope of this chapter.
Six questions are generally used to guide the assessment process (USEnvironmental Protection Agency 1998):
1. How does exposure occur?2. What is exposed?3. How much exposure occurs? When and where does it occur?4. How does exposure vary?5. How uncertain are exposure estimates?6. What is the likelihood that exposure will occur?
Based on the answers to these questions, an exposure assessment framework can becreated (Fig. 22.3). The framework can be used to:
Fig. 22.3 Exposure assessment framework

22 Epidemiologic Investigation Methods for Sick Building Syndrome 421
1. Characterize the source – chemical, biological or physical properties2. Determine the method of spread of the source – airborne, waterborne or via soil3. Assess the pathways for human exposure and the uptake relative to that pathway.4. Establish the interrelationships of the transport pathways prior to conducting a
systematic evaluation,5. Assess the dose-response relationship that results in adverse health outcomes.
22.6 Conclusion
This chapter presented practical steps of epidemiological investigation for theresearcher investigating SBS. Once a problem has been identified, hypotheses andobjectives are established; potential data required and risk factors that predisposea person to become adversely affected are determined. The next stage would theninvolve exposure assessment, which tries to understand “how the person is affectedby the agent”. Exposure assessment and related data are used to test these hypothe-ses and further understand the relationship between exposure factors and theirimpact to human health. Therefore successful exposure assessment is a critical com-ponent of the investigation that produces valid and desired solutions. It is hopedthat using the guidelines, non-epidemiologists can produce a conceptual frame-work from with the data collection tool, data management and analysis plans canbe formulated.
References
Akpinar-Elci M, Elci OC (2002) Importance of work intensity on respiratory problems ofhairdressers. Occup Environ Med 59:649–650.
Apter A, Bracker A, Hodgson M, Sidman J, Leung W-Y (1994) Epidemiology of the sick buildingsyndrome. J Allergy Clin Immunol 94:277–288.
Checkoway H, Pearce N, Kriebel D (2004) Research Methods in Occupational Epidemiology.Oxford University Press, New York, NY.
Clark ML, Reynolds SJ, Burch JB, Conway S, Bachand AM, Peel JL (2010) Indoor air pollu-tion, cookstove quality, and housing characteristics in two honduran communities. Environ Res110:12–18.
Colbeck I, Nasir ZA, Ali Z (2010) Characteristics of indoor/outdoor particulate pollution in urbanand rural residential environment of pakistan. Indoor Air 20:40–51.
Cox-Ganser JM, White SK, Jones R, Hilsbos K, Storey E, Enright PL, Rao CY, Kreiss K (2005)Respiratory morbidity in office workers in a water-damaged building. Environ Health Perspect113:485–490.
Dingle P (1997) Sick building syndrome. In Paul NC, Nicholas PC, Eds.) Advances in environ-mental control technology: health and toxicology. Gulf Professional Publishing, Burlington.pp. 67–92.
Elci OC, Enright P, Odencrantz J, Simoes E, Wagner GK, Kreiss GR K (2003) Pulmonary functiondecrease in popcorn production workers: One-year follow-up. Proceeding of 99th InternationalAmerican Thoracic Society Congress, Seattle, WA.
Fowler FJ (1993) Survey research methods (2nd Ed). Sage Publications, Newbury Park, California.Gregg MB (2002). Field Epidemiology. New York: Oxford University Press.

422 O.C. Elci et al.
Hodgson M (2005) Sick building syndrome. In Philip W (Ed.) (pp. 8–13). New york, NY: elsevier.Laumbach RJ, kipen HM (2005) Bioaerosols and sick building syndrome: particles, inflammation,
and allergy. Curr Opin Allergy Clin Immunol 5:135–139.National Heart Lung and Blood Institute (1995) Global Strategy for Asthma Management and
Prevention. National Institutes of Health, Bethesda, MD.National asthma education and prevention program (national heart lung and blood institute) (1997)
Expert panel report 2: guidelines for the diagnosis and management of asthma. NationalInstitutes of Health, Bethesda, MD.
Nieuwenhuijsen MJ (2003) Exposure Assessment In Occupational and EnvironmentalEpidemiology. Oxford University Press, Undefined.
Pandey MR, Boleij JS, Smith KR, Wafula EM (1989) Indoor air pollution in developing countriesand acute respiratory infection in children. Lancet 8635:427–429.
Porta M (2008) A Dictionary of Epidemiology. (5th Ed). Oxford University Press, New York, NY.Rappaport SM, Smith TJ, ACGIH. 1991. Exposure assessment for epidemiology and hazard
control: CRC Press.Raw GJ, Roys MS, Whitehead C, Tong D (1996) Questionnaire design for sick building syndrome:
an empirical comparison of options. Environ Int 22:61–72.Redlich CA, Sparer J, Cullen MR (1997) Sick-building syndrome. Lancet 349:1013–1016.US Environmental Protection Agency (1998) Guidelines for Ecological Risk Assessment.
US Environmental Protection Agency, Washington, DC.World Health Organization (1983) Indoor air pollutants. Exposure and Health Effects. WHO
Regional Office for Europe, Copenhagen.

Chapter 23
Noninvasive Health Assessment Methods in SickBuilding Syndrome
Muge Akpinar-Elci and Omur Cinar Elci
23.1 Introduction
Throughout history, successful survival of the human depended on finding protec-tive shelters to inhabit. With the second half of the twentieth Century, people beganto live in modern houses and work in modern office buildings. Public buildings andfacilities provided services for people beyond the basic needs of sheltering (Zhangand Smith 2003). Since energy conservation became an important topic in the late1970’s, developed countries began to build energy conservative buildings with thegoal of producing a decrease in energy loss. With this trend the ventilation betweenindoors and outdoors decreased. In addition, different chemical agents and syntheticmaterials have been extensively used in air tight energy efficient buildings. In theearly 1980’s, the first adverse health outcomes of this transformation in buildingconstruction were reported. Especially in public and office buildings, the combi-nation of poor ventilation and intense use of various indoor hazardous agents hasbeen associated with building-related health symptoms of occupants or employees(Abbritti and Muzi 2006).
In their review paper, Laumbach and Kipen (2005) stated that “Sick buildingsyndrome is a poorly understood condition that can be vexing to clinicians and pub-lic health investigators alike. Concerns about possible causes have recently shiftedto bioaerosols, especially indoor mold contamination. Recently, controversy overthe health effects of indoor bioaerosols has intensified in the media and in medicalforums. Allergists and other clinicians are increasingly being asked to evaluate casesof sick building syndrome attributed to bioaerosol exposure. Although allergy mayplay a role, it is unlikely to fully explain the nonspecific symptoms of the condition”.
Today we know that many cases of allergic and respiratory diseases such asasthma and sick building syndrome are related with poor indoor air quality in devel-oping and developed countries (Smith 2002; Spengler et al. 2001). Sick building
M. Akpinar-Elci (B)Department of Public Health and Preventive Medicine, St. George’s University School ofMedicine, Grenada, The Caribbeane-mail: [email protected]
423S.A. Abdul-Wahab (ed.), Sick Building Syndrome,DOI 10.1007/978-3-642-17919-8_23, C© Springer-Verlag Berlin Heidelberg 2011

424 M. Akpinar-Elci and O.C. Elci
related exposures commonly cause airways inflammation. Therefore, one of themajor goals in studying building related airways inflammation is to demonstraterelationships between building related exposures and health outcomes, which isnot an easy task. Although there are methodological limitations, epidemiologicaland toxicological studies provide evidence. In cross-sectional studies an associ-ation between bioaersol exposures and health problems has been demonstrated(Laumbach and Kipen 2005). Epidemiologic studies investigating indoor air relatedproblems often document adverse respiratory health effects by using questionnairesto describe symptoms and pulmonary function tests for objective assessment offunctional impairment. Pulmonary function tests such as spirometry or peak flowmonitoring only investigate the functional changes in lower airways which maybe in an irreversible stage of disease and may not reflect the inflammatory sta-tus of the airways. Assessment of pulmonary function alone may underestimatebuilding related airways disease because airways inflammation and pulmonary func-tion changes may occur at different times in the pathophysiological process ofdisease development (Akpinar-Elci et al. 2005; Lemière 2002). Direct monitoringof airways inflammation in response to building related exposures, are receiv-ing increased attention since they may discover inflammatory changes before theinjury becomes irreversible. It could also be useful for the follow-up of personswith inflammatory disease, and for guiding drug treatment. Invasive approachessuch as bronchoalveolar lavage and bronchial biopsies have been used to assessairways inflammation. These methods however, are not practical for use in fieldinvestigations (Akpinar-Elci et al. 2007b).
Due to the nature of these diseases, accurate, practical, and objective diagnosticmeasurement techniques are needed in field investigations. Thus, much work hasbeen focused on the development of noninvasive methods for monitoring inflam-mation in building related health problems (Quirce et al. 2010). The recent mostcommonly used noninvasive techniques in field investigations are exhaled nitricoxide, nasal nitric oxide, induced sputum, exhaled breath condensate, and nasallavage. This chapter will discuss the practical application of these methods in sickbuilding syndrome as well as technical details and the validity.
23.2 Noninvasive Inflammatory Marker Assessments in Sick
Building
Wilcosky (1993) stated that noninvasive markers are more beneficial and valu-able for field studies than invasive markers. In the same article he also stated“Unfortunately, the lack of basic information about marker properties (e.g., sen-sitivity, variability, statistical link with disease) currently precludes the effective useof most markers in studies of complex mixtures”.
Today almost two decades later, medical science has been able to expand uponwhat is known about noninvasive markers and extrapolate a new technology. Thisprogress increases our chance to diagnose a problem at an early stage before any

23 Noninvasive Health Assessment Methods in Sick Building Syndrome 425
structural damage occurs. Noninvasive inflammatory markers provide tremendousinformation about the health outcomes of building related exposure.
23.2.1 Importance of Inflammatory Markers in Building Related
Symptoms
The mechanism of inhalation hazards to the lungs starts with an inflammatoryresponse. Inflammation is designed to protect the body from external harmfulagents, but when prolonged, it does more permanent damage to the lungs than pro-tection. Inflammation is a very complex process, which depends on largely unknownfactors, different cells, mediators, and pathways. The types of lung inflammationthat have been studied most intensively include asthma, emphysema, and inter-stitial fibrosis. Inflammation assists to identify these diseases in the early stages.Diagnosing sick building related diseases in the early stage is important for controlof disease and prevention of disease in other building occupants.
Inflammation of the lung might cause many types of respiratory symptoms suchas cough, wheeze, phlegm, breathlessness, as well as systemic symptoms (fever,malaise, tiredness, fatigue). There may be indications of inflammation in the blood,such as increased numbers of cells (neutrophils, eosinophils, or lymphocytes), orinflammatory mediators (C-reactive protein, interleukins, etc.), or an increase in ery-throcyte sedimentation rate. However, these indicators in the blood are nonspecificand could be a result of inflammation of any organ system (Pizzichini et al. 1997).The gold standard to diagnose inflammation of the lung is biopsy or bronchoalveolarlavage (BAL), but as we stated earlier, these invasive procedures are expensive,impractical, and not suitable for screening or repeated follow-up programs (Firemanet al. 1999). During the last decade, considerable advances have been made innon-invasive measurements of airways inflammation by examinations of sputum ornasal lavage fluid, exhaled gases such as exhaled NO, and exhaled vapors throughexhaled breath condensate. These techniques are widely used in field studies andbuilding related health problems. A recent European Academy of Allergy andClinical Immunology (EAACI) task force consensus report states “There is a needto increase the use and availability of these tests in the investigation of occupationalasthma, nonasthmatic eosinophilic bronchitis, and occupational rhinitis. It shouldbe considered, however, that subjective symptom scores and objective physiologicalmeasurements are not necessarily correlated with the severity of airway inflamma-tion. This is probably because of the fact that neural regulation, hyperreactivity, andperception of severity of symptoms play an important role in overall severity of thedisease” (Quirce et al. 2010).
The cytokines are useful diagnostic markers of airways inflammation, espe-cially in the early stages. “Cytokines are polypeptide mediators produced by avariety of cell types that play crucial roles in inflammatory responses (Barneset al. 1998). They are often categorized as being involved in Th1 responses (exam-ples: interleukin (IL)-1, IL-6, IL-12, Tumor necrosis factor (TNF)-α, IFN-γ) or

426 M. Akpinar-Elci and O.C. Elci
Th2 responses (examples: IL-4, IL-5, IL-10 and IL-13). The activities of pro-inflammatory cytokines such as IL-1, IL-6, IL-12, IL-18, and TNF-α are tightlyregulated, in part by negative feedback mechanisms mediated by anti-inflammatoryagents such as IL-1 receptor antagonist (IL-1RA), transforming growth factor (TGF)β1 and IL-10. Complex interactions of cytokines are referred to as cytokine network-ing and have been implicated in the pathogenesis of many complex inflammatorylung diseases. Genes that code for cytokines are highly polymorphic and someof the polymorphisms directly or indirectly influence cytokine expression. Mostrespiratory diseases involve both with genetic and environmental factors” (Akpinar-Elci et al. 2007). Epidemiological studies have identified associations betweenspecific genetic variants and susceptibility and severity of environmental relatedinflammation such as asthma, chronic obstructive pulmonary disease (COPD), andhypersensitivity pneumonitis (Asada et al. 2005; Howard et al. 2001).
Cytokines can be measured in bronchoalveolar lavage fluid or bronchial biopsytissue to assess airways inflammation (Barnes et al. 2006). Since the 1990s,noninvasive methods such as nasal lavage, induced sputum, and exhaled breath con-densate provide the opportunity to use cytokines as objective biomarkers of airwaysinflammation.
Another useful diagnostic marker of airways inflammation is nitric oxide (NO).In the early stage of airways inflammation, one of the major acute inflammationmediators is histamine, which induces bronchospasm. Late airways inflammationhowever, creates a more chronic and complex local inflammation. An endogenousmediator NO as a part of this late airways inflammation causes bronchodilation andanti-inflammation. NO is the most well characterized endothelium-derived relax-ing factor (EDRF) which is produced and released by the endothelium that resultsin smooth muscle relaxation. As part of the immune response, NO is also pro-duced by phagocytes, which are armed with inducible nitric oxide synthase (iNOS).iNOS is activated by interferon game (IFN-γ) and TNF, and inhibited by TGF-β,IL-4, and IL-10 (Li et al. 2006; Nguyen et al.1992). Thus the immune system mayregulate phagocytes as part of inflammation. So NO might serve as an importantinflammatory marker for airways inflammation.
23.2.2 Nasal Lavage Measurement in Sick Building
Damp indoor environments have been associated with nasal and sinus symptoms,but little attention has been given by the health community to their environmentalcauses, objective correlates, relation to lower respiratory disease, or natural historywith environmental interventions. Allergic rhinosinusitis is one of the most commonchronic diseases and its worldwide prevalence is increasing. Estimated prevalenceranges between 10 and 50% (Bellanti and Wallerstedt 2000). Many physiciansconsider allergic rhinitis to be an inconsequential disease, because it is not lifethreatening. However it is a major source of discomfort and reduced job perfor-mance. In one of our recent studies we found the prevalence of nasal symptoms was

23 Noninvasive Health Assessment Methods in Sick Building Syndrome 427
66% among farmers but only 1% of them had physician-diagnosed rhinitis. Thisstudy’s result suggests that the upper airways diseases are prevalent, yet overlookedby health care providers (Akpinar-Elci et al. 2009).
There are two main reasons for scientific interest of nasal responses to harmfulagents. First of all, the nose is a target and entry organ for many harmful agents. Thenose prevents the entry of harmful agents into the lower airways by using a mechan-ical and immunological mechanism. Second, the nose is a highly accessible portionof the respiratory tract and may serve as a surrogate tissue for lower respiratory tractresponses (Anon 1998).
An estimated annual cost of rhinosinusitis was $2–5 billon in the US in 2003(Reed et al. 2004). Allergic rhinitis also plays an important role in exacerbat-ing asthma (Bousquet et al. 2003; Passalacqua et al. 2004) and the prevalenceof occupational rhinitis with occupational asthma is 76–92% (Siracusa et al.2000). The similarities between the histology of nasal mucosa and bronchi sug-gest that inflammation in the nasal mucosa may reflect the inflammatory responsein the lower airways (Purokivi et al. 2002a). Thus, prevention of upper airwaysdiseases may be an opportunity to prevent or minimize the severity of lower air-ways diseases, such as asthma, which will lead to increased productivity in theworkforce.
Various methods have been used to collect nasal secretions for the assessmentof nasal inflammation. One objective method for evaluating nasal inflammationis nasal lavage, which is an easy, well-tolerated, affordable, and repeatable tech-nique. It is applicable to both field and laboratory studies (Petrick and Slavin2003).
The following commonly accepted method is used in the field. The catheter isattached to a 10 ml syringe filled with 4 ml of pre-warmed (37C) saline. A precur-sor is placed on the bridge of the nose to break up mucus and facilitate fluid recovery.The saline is refluxed 3 times into the nose using the syringe and the majority of thefluid is recovered back to the syringe. The catheter is then removed from the noseand residual fluid is blown gently into the collection dish. The process is repeatedon the remaining nares. Fluid is recovered in the collection plate from both nares, isthen combined and the volume is measured (Akpinar-Elci et al. 2007a).
Nasal lavage has been widely used in respiratory disease investigations. A studycompared different nasal sampling techniques for collecting nasal cytologies andstated that for studies that require repeated sampling, the nasal lavage will be rec-ommended as the best suitable technique to obtain nasal cytologies (Deutschle et al.2005). Despite these inconsistencies, nasal lavage is still a frequently used techniquein field investigations. This technique samples the most superficial aspect of nasalmucosa. Cells sampled include resident epithelial cells and infiltrating inflammatorycells. Fluid and soluble materials sampled include mucus and various inflammatorymediators. Contaminants also include dead cells and bacteria. Nasal lavage can pro-vide information concerning both the health status and recent exposure history ofa person (Hellgren et al. 2001). Nasal lavage with measurement of inflammatorymarkers from the fluid has been used to characterize the effects of various inhalablepollutants on the upper airways.

428 M. Akpinar-Elci and O.C. Elci
Table 23.1 summarizes various biomarker measurements in nasal lavage used insick building related exposure studies. An increased risk of upper airways diseaseshas been reported to be associated with bioaerosol exposure in building environ-ments. Many recent studies have focused on adverse health effects in the upperairways reported in water damaged and moldy buildings. Stark et al. 2006 reportedthat cases with previous exposure in a moisture-damaged building had significantlyincreased IL-4 concentrations in nasal lavage after the Aspergillus fumigatus chal-lenge. Their data showed a link between inflammation markers in nasal lavageand experimental Aspergillus fumigatus challenge (Stark et al. 2006). In one ofour studies, we also found a significant relationship between IL-8 concentrationin nasal lavage and work-related flu-like symptoms in occupants of a water dam-aged building (Akpinar-Elci et al. 2007a). However, another recent study observedno IL-8 concentration change in nasal lavage associated with indoor mold expo-sure (Ebbehøj et al. 2005). Using nasal lavage for early diagnosis of upper airwaysinflammation and disease is a promising method, which can help prevent lowerairway diseases such as asthma.
23.2.3 Induced Sputum Measurement in Sick Building
Healthy persons might produce about 950 ml. of sputum every day. The sputum istransported slowly and continuously toward the mouth, then swallowed, without theperson being aware of the process. Patients with active lung inflammation may eas-ily produce sputum samples simply by coughing, but for many others, in order tocollect it reliably and within a reasonable period of time, the sputum secretion mustbe induced. Sputum induction has been used as a direct and relatively noninvasivemethod to investigate airways inflammation as a reproducible and valid technique(Lemière 2002; Lemiere 2006; Rytilä et al. 2000). The traditional method used for asubject to reliably produce sputum is to ask them to inhale a 4.5% hypertonic salinefor several minutes. After inhalation, they cough up the sputum into a plastic con-tainer (Anderson and Brannan 2003). The European Thoracic Society standardizedthis procedure (Joos et al. 2003). The collected fluid may simply be frozen for laterprocessing for cytokines’ measurement, or may be processed onsite when white cellcounts and differentials are desired.
Induced sputum has been increasingly used as a biological sample in respiratorydisease research (Vlachos-Mayer et al. 2000). Induced sputum measurement showsearly airways inflammation in persons exposed to agents known or suspected ofcausing airways inflammation (Lemière 2002). Induced sputum is especially help-ful when there is a need to evaluate the predominant type of inflammatory cell orcytokine. Compared to BAL, induced sputum is a less invasive, comfortable methodand is also suitable for screening programs (Fireman et al. 1999). There have beenconcerns about the safety of sputum induction among uncontrolled asthma patients.However, Vlachos-Mayer et al. (2000) showed that standardized sputum inductioncould be safe for such patients. Although the use of induced sputum in field settings

23 Noninvasive Health Assessment Methods in Sick Building Syndrome 429
Tab
le23.1
Bio
mar
kers
inna
sal
lava
ge(N
L)
and
asso
ciat
edbu
ildi
ngre
late
dex
posu
rean
dhe
alth
outc
omes
Ref
eren
ceP
lace
/exp
osur
eB
iom
arke
rsin
NL
Res
ults
Akp
inar
-Elc
iet
al.(
2007
a)W
ater
dam
aged
offi
cebu
ildi
ngIL
-8,A
lbum
in,M
PO
,EC
PS
igni
fica
ntre
lati
onsh
ipE
CP
and
IL-8
and
wor
k-re
late
dfl
u-li
kesy
mpt
oms.
Hig
hM
PO
leve
lsw
ere
asso
ciat
edw
ith
chil
lsan
dw
ork-
rela
ted
chil
ls.
Bak
keet
al.(
2008
)U
nive
rsit
ybu
ildi
ngE
CP,
Lys
ozym
e,A
lbum
in,
MP
O“N
AL
-lys
ozym
ew
asas
soci
ated
wit
hoc
ular
,nas
al,l
aryn
geal
sym
ptom
san
din
door
envi
ronm
enta
lpe
rcep
tion
s.”
Ebb
ehøj
etal
.(20
05)
Pub
lic
scho
olbu
ildi
ng/m
old
IL-8
,EC
PIL
-8an
dE
CP
wer
eno
tas
soci
ated
wit
hm
old.
Hir
vone
net
al.(
1999
)M
old-
cont
amin
ated
scho
olT
NF
-α
IL-6
,NO
“An
asso
ciat
ion
betw
een
infl
amm
ator
ym
arke
rsin
the
nasa
lla
vage
flui
d,th
ehi
ghpr
eval
ence
ofre
spir
ator
ysy
mpt
oms
amon
gth
eoc
cupa
nts,
and
chro
nic
expo
sure
tom
olds
inth
ein
door
envi
ronm
ent.
”K
oren
etal
.(19
92)
New
buil
ding
/VO
Cs
Neu
trop
hil
Neu
trop
hil
sign
ifica
ntly
incr
ease
daf
ter
VO
Cs
expo
sure
.L
igne
llet
al.(
2005
)M
oist
ure-
dam
aged
scho
ols/
Mic
robi
alN
O,I
L-4
,IL
-6,T
NF
-α
“Rep
orte
dal
lerg
ies
and
repe
ated
resp
irat
ory
infe
ctio
nsw
ere
asso
ciat
edw
ith
high
IL-4
leve
l.”
Nor
bäck
etal
.(20
00)
Sch
ool
buil
ding
sE
CP,
Lys
ozym
e,A
lbum
in,
MP
O“T
hem
ost
cons
iste
ntfi
ndin
gsw
ere
obse
rved
for
form
alde
hyde
,N
O2,a
ndA
sper
gil
lus
spp.
,rel
ated
toin
crea
seof
EC
Pan
dly
sozy
me.
The
pres
ence
ofye
astw
asas
soci
ated
wit
han
incr
ease
ofE
CP
and
lyso
zym
e.”
Pur
okiv
iet
al.(
2002
a)M
oist
ure-
dam
aged
buil
ding
sT
NF
-α
,IL
-1,I
L-4
,IL
-6,
NO
“Infl
amm
ator
ym
edia
tors
inN
Lar
eno
tpe
rse
are
liab
lem
etho
dto
eval
uate
the
infl
amm
ator
yst
atus
ofth
elo
wer
airw
ays
afte
rex
posu
reto
indo
orai
rpo
llut
ants
.”P
urok
ivi
etal
.(20
02b)
Moi
stur
e-da
mag
edbu
ildi
ngs
NO
“NO
mea
sure
men
tsal
one
are
not
suffi
cien
tto
quan
tify
airw
ayin
flam
mat
ion
whe
nev
alua
ting
subj
ects
expo
sed
tom
icro
bes
pres
ent
inm
oist
ure-
dam
aged
buil
ding
s.”
Rop
onen
etal
.(20
01)
Mol
d-da
mag
edbu
ildi
ngs
IL-1
,IL
-4,I
L-6
,TN
F-α
“IL
-4w
assi
gnifi
cant
lyhi
gher
amon
gal
loc
cupa
nts
duri
ngth
ew
orki
ngpe
riod
asco
mpa
red
toth
atdu
ring
vaca
tion
.”R
opon
enet
al.(
2003
)M
oist
ure-
dam
aged
buil
ding
s/vi
able
fung
i,vi
able
bact
eria
TN
F-α
,IL
-1,I
L-4
,IL
-6,
NO
“Cyt
okin
ele
vels
ofsu
bjec
tsw
ith
high
mic
robi
alex
posu
rew
ere
slig
htly
incr
ease
dco
mpa
red
toth
esu
bjec
tsw
ith
low
expo
sure
.”

430 M. Akpinar-Elci and O.C. Elci
Tab
le23.1
(con
tinu
ed)
Ref
eren
ceP
lace
/exp
osur
eB
iom
arke
rsin
NL
Res
ults
Wål
inde
ret
al.(
1999
)S
choo
lbu
ildi
ng/
dust
,cl
eani
ngag
ents
EC
P,L
ysoz
yme,
Alb
umin
,M
PO
“EC
Pan
dly
sozy
me
wer
ein
crea
sed
for
the
subj
ects
insc
hool
sw
ith
alo
wer
freq
uenc
yof
floo
rm
oppi
ng,a
low
erfr
eque
ncy
ofde
skcl
eani
ng,a
ndw
here
wet
mop
ping
was
used
.”W
iesl
ande
ret
al.(
1999
)H
ospi
tal
buil
ding
/da
mpn
ess,
mol
d,V
OC
sE
CP,
Lys
ozym
e,A
lbum
in,
MP
O“I
ncre
ased
occu
rren
ces
ofoc
ular
and
nasa
lsy
mpt
oms
and
anin
crea
sed
conc
entr
atio
nof
lyso
zym
ew
ere
foun
din
the
subj
ects
wor
king
inth
eda
mp
buil
ding
s.A
rela
tion
ship
betw
een
MP
Oan
dna
sal
sym
ptom
sw
asal
sofo
und.
”W
ålin
der
etal
.(20
01a)
Dam
pof
fice
buil
ding
EC
P,M
PO
,Alb
umin
Exp
osur
esin
ada
mp
offi
cebu
ildi
ngm
ayca
use
anin
flam
mat
ory
nasa
lm
ucos
alre
spon
se.
Wål
inde
ret
al.(
2001
b)S
choo
lbu
ildi
ngs
EC
P,L
ysoz
yme,
Alb
umin
,M
PO
“Apa
tter
nof
nasa
lre
spon
ses:
less
pate
ntno
ses
and
anin
flam
mat
ory
biom
arke
rre
spon
seco
uld
bere
late
dto
flat
roof
and
aco
ncre
tesl
abfu
ndam
ent,
fact
ors
that
are
know
nri
skfa
ctor
sfo
rw
ater
leak
age,
buil
ding
dam
pnes
san
dpo
ssib
lym
icro
bial
grow
th.”
MP
O:
Myl
eope
roxi
dase
,IL
:In
terl
euki
n,E
CP
:E
osin
ophi
lic
cati
onic
prot
ein,
TN
F:
Tum
orne
cros
isfa
ctor
,NO
:N
itri
cox
ide

23 Noninvasive Health Assessment Methods in Sick Building Syndrome 431
has provided a practical and objective monitoring method, there are methodologicalproblems to be addressed. Induced sputum is sampled predominantly from large air-ways and this may not accurately reflect the inflammation in the peripheral airways(Barnes et al. 2006; Holz et al. 1998). Another potential problem is related to thesolubilization of sputum. Solubilization with dithiotheitol disrupts sulphydryl bondsand may modify proteins, which prevents the recognition by antibodies (Kelly et al.2002). This may be a problem with several cytokines (Barnes et al. 2006).
Studies have investigated the function of biomarkers in the sputum of asthmaticpatients and have compared the results from induced sputum and blood (Pizzichiniet al. 1997; Jang and Choi 1999; Lemière et al. 1999). Pizzichini et al. (1997)reported that the proportion of eosinophils in sputum is a more accurate markerthan the proportions of eosinophils in blood or serum eosinophilic cationic protein(ECP) among asthmatic patients. Lemiere et al. (2006) supported Pizzichini’s con-clusion in their study. In another study, Leimère et al. (2000) also demonstratedthat “induced sputum differential cell counts and IL-5 might anticipate changes inlung functional parameters after exposure to occupational agents in occupationalasthmatic subjects.”
Induced sputum IL-8 has been studied extensively in environmental and occu-pational related airways inflammation investigations. In our study among popcornproduction workers, we found that sputum IL-8 concentrations were higher inthe high-exposed popcorn workers compared to the low-exposed group (Akpinar-Elci et al. 2005). Many epidemiological studies have investigated an associationbetween adverse health effects and exposure to mold or microbes from moisture-damaged buildings. Purokivi et al. (2001; 2002a; 2002b) widely studied inducedsputum among occupants of a moisture-damaged and moldy building. They tried todemonstrate a biochemical link between microbial exposure and the large varietyof reported respiratory symptoms. Purokivi et al. (2002a) also measured concen-tration of IL-1, IL-4, IL-6, TNF-α and, NO in induced sputum and nasal lavage atmoisture-damaged and reference school buildings and compared the results. Theyfound that NO and IL-4 levels in nasal lavage significantly predicted induced sputumlevels. In another study, Purokivi et al. (2001) investigated the association betweenthe respiratory symptoms such as cough, phlegm, sore throat, and the inflamma-tory mediators interleukin IL-1, IL-4, IL-6, and TNF-α in nasal lavage and inducedsputum samples collected from people working in moisture-damaged school build-ings (Purokivi et al., 2001). The sampling was performed and the questionnaireswere completed at the end of the spring term, at the end of the summer vacation (2.5months), during the winter term, and after a 1-week winter holiday. “The authorsfound a significant elevation of IL-1, TNF-α and IL-6 in nasal lavage fluid and IL-6in induced sputum during the spring term in the subjects from the moisture-damagedschool building compared to the subjects from the control building. The exposedworkers reported sore throat, phlegm, eye irritation, rhinitis, nasal obstruction andcough in parallel with these findings. The present data suggests an associationbetween microbial exposure, and symptoms as well as changes in pro-inflammatorymediators detected from both the upper and lower airways.” (Purokivi et al. 2001).Roponen et al. (2003) compared inflammatory mediators in nasal lavage, induced

432 M. Akpinar-Elci and O.C. Elci
sputum, and serum of occupants of a moisture-damaged building. They measuredconcentrations of NO, IL-1, IL-4, IL-6 and TNF-α in induced sputum of the occu-pants during the working and the vacation periods. All measured cytokines weredetectable in the induced sputum samples; however the authors could not find signif-icant differences in cytokine levels between working and vacation periods, betweenthe cases and their controls.
23.2.4 Exhaled Breath Condensate (EBC) Measurement in Sick
Building
Exhaled breath condensation (EBC) is another non-invasive method that gathersexhaled breath samples useful for investigating number of different inflammatorybiomarkers and oxidative stress. There has been an increasing interest in using EBC,which is an easy and noninvasive technique to sample the airways and is performedrepetitively over short intervals between sampling. Collection of EBC is simple; ithas no significant adverse side effects, and is well tolerated by participants. Passingexhaled breath through a cold trap collects inflammatory biomarkers. The collectedmaterial consists of aerosolized airways lining fluid droplets as well as exhaledvolatile compounds and water vapor. Collection devices can be portable; thereforethis is a very useful tool for epidemiological and field studies as well as clinical stud-ies (Horváth et al. 2005). Mutlu et al. (2001) acknowledged that “Studies are nowbeing conducted to detect nonvolatile macromolecules present in exhaled breath,including proteins, lipids, oxidants, and nucleotides. Analysis of these nonvolatilesubstances requires cooling of the expired breath, which results in condensation.These macromolecules represent biomarkers of various pathological processes inthe lungs.” EBC collection methods, advantages and the potential disadvantages ofthe technique are summarized in the ATS/ERS Task Force report (Horváth et al.2005).
EBC analysis might provide indications of ongoing biochemical and inflamma-tory activities in the lower airways (Hunt 2002). Horváth et al. (2005) stated, “EBCcontains a large number of mediators including adenosine, ammonia, hydrogen per-oxide, isoprostanes, leukotrienes, nitrogen oxides, peptides and cytokines. One ofthe current limitations of EBC measurements is the low concentration of manybiomarkers, so their measurement is limited by the sensitivity of assays.” Cytokineconcentrations in EBC might be quantified by enzyme immunoassays includingenzyme-linked immunoassays (ELISA) (Akpinar-Elci et al. 2007). The controversyis whether these concentrations actually reflect the levels in airways lining fluidaerosolized in exhaled breath (Effros et al. 2004). In a recent study, Sack et al. 2006used multiplexed immunoassays to measure cytokine profiles in EBC, which con-tain only small amounts of cytokines and they successfully detected all investigatedcytokines in EBC.
Evaluation of EBC has often been used in asthma studies, COPD and cystic fibro-sis. These studies show that EBC could be used to detect airway inflammation,

23 Noninvasive Health Assessment Methods in Sick Building Syndrome 433
particularly in a severe form of diseases (Baraldi et al. 2003; Bucchioni et al.2003). In our study, we used EBC to evaluate relationships between airways inflam-matory markers and building-related health problems among the occupants ofwater-damaged building. We measured IL-8 and nitrite in EBC. In this study weinvestigated 207 non-smoker office workers who complained of respiratory dis-eases in a water-damaged office building. EBC IL-8 levels were statistically highamong workers with work related respiratory symptoms such as cough and inthose with physician-diagnosed asthma. EBC nitrite levels were statistically sig-nificantly higher in the employees reporting shortness of breath (Akpinar-Elci et al.2008). To our knowledge, our study is the first and only published study on EBCmeasurement among the occupants of a water-damaged office building.
EBC is clearly a promising technique for evaluation of airways inflammation.However, further studies on the standardization of results of available EBC methodswill be necessary to understand whether EBC evaluation is a valid approach for theassessment of building related diseases (Horváth et al. 2005).
23.2.5 Exhaled and Nasal Nitric Oxide (NO) Measurement in Sick
Building
Exhaled and nasal NO measurement is currently the most popular non-invasivemarker of eosinophilic airways inflammation in asthma. Standards for this mea-surement have been published by the ATS and ERS (Anon 2005). Increased levelsof exhaled NO in asthma patients in clinical settings have been widely documented,but this technique has rarely been used in field studies. Nasal NO levels are usuallyvery high compared to lower airways NO level. Persons with primary ciliary dyski-nesia or cystic fibrosis have low nasal NO levels (Anon 2005). Exhaled and nasal NOmeasurement is a very valuable tool for epidemiologic investigation and monitoringof inflammatory airways disease. However, it has some disadvantages. Technicalfactors affect exhaled and nasal NO results. Low exhalation or sampling flow rateand holding the breath increase exhaled NO levels; high exhalation or sampling flowrate decrease exhaled NO levels. Other diagnostic tests such as a sputum inductionand spirometry decrease exhaled NO levels. Several factors, such as smoking, areknown to increase or decrease exhaled NO levels and nasal NO levels, thereforethese confounding factors should be avoided or noted during the pre-test question-naire (Anon 2005). Smoking status of the person must be seriously considered inthe interpretation of exhaled and nasal NO results. Most studies measure and detectexhaled and nasal NO levels by using a chemiluminescence method.
In our previous National Institute for Occupational Safety and Health (NIOSH)health hazard evaluation (HHE) study, we investigated heath problems amongoccupants of a water-damaged office building (Anon 2003). Of the 68 employeesworking in the building, 36 (53%) participated in exhaled NO measurement study.The average exhaled NO levels were 6.1 ppb and only one participant had mildlyelevated exhaled NO levels. We did not observe any significant change in exhaledNO levels in our repeated measurements between Monday and Friday (Anon 2003).

434 M. Akpinar-Elci and O.C. Elci
In another study, we collected exhaled NO and EBC measurements from 224 ofthe 356 invited employees (62.9%) at the water-damaged building. Since smokingis highly related to exhaled NO measurements, we included only 205 current non-smokers in the analyses. Consistent with the previous literature, exhaled NO levelswere higher among participants with hay fever (p = 0.019) and significantly lower inthose with physician-diagnosed chronic bronchitis (p = 0.018) (Akpinar-Elci et al.,2008). During our follow-up measurements, we observed that the prevalence ofupper respiratory symptoms remained high. Three years later, we decided to repeatthe nasal NO measurements in the same building. Nasal NO levels were low inparticipants who reported having work-related chills, nasal itchiness, and tirednesssymptoms (Akpinar-Elci et al. 2007). According to ATS guidelines low nasal NOshould also be considered abnormal (Anon 2005).
Purokivi et al. (2002b) evaluated the value of exhaled NO measurements in deter-mining the airways inflammation among occupants of moisture-damaged schoolbuildings. They did not observe any statistically significant difference in NO lev-els between study groups. This result suggested that, “NO measurements alone arenot sufficient to quantify airways inflammation when evaluating subjects exposed tomicrobes present in moisture-damaged buildings”.
Kolarik et al. (2009) investigated exhaled and nasal NO levels for assessinghuman response to indoor air pollutants. After exposure, exhaled NO concentrationsslightly increased, but nasal NO levels were not affected. As like their conclu-sion, exhaled and nasal NO measurement might be a possible objective marker ofsubclinical inflammation in healthy adults exposed to indoor air pollutants.
23.3 Conclusion
In this chapter, we discussed the role of non-invasive airways inflammation assess-ment methods and their potential applications for evaluation of sick building relatedhealth problem.
Identifying and understanding the role of airways inflammatory markers mayhelp to provide new insights into the pathogenesis of inflammatory diseases and forthe development a therapeutic modulation. These non-invasive methods are beingincreasingly recognized as tools for the detection of airways inflammation, whichmay occur in the absence of changes in pulmonary function and should be consid-ered in studies evaluating relationships between indoor air exposures and adversehealth effects. The noninvasive measurement of airways inflammation might pro-vide objective and accurate methods for detecting building related diseases, and aresuitable for the monitoring of occupants in water-damaged buildings. Early detec-tion of airways inflammation is critical for prevention of more severe clinical formsof sick building related diseases. Noninvasive assessment of inflammatory markers,in building related disease investigations, is an emerging topic that merits futureresearch. Further studies in this area will help researchers to better understand thecausal mechanism of building related health problems.
23 Noninvasive Health Assessment Methods in Sick Building Syndrome 435
References
Abbritti G, Muzi G (2006) Indoor air quality and health in offices and other non-industrial workingenvironments. La Medicina Del Lavoro 97:410–417.
Akpinar-Elci M, Siegel PD, Cox-Ganser JM, Stemple KJ, White SK, Hilsbos K, WeissmanDN (2008) Respiratory inflammatory responses among occupants of a water-damaged officebuilding. Indoor Air 18:125–130.
Akpinar-Elci M, Siegel PD, Enright PL, White SK, Dye A, Park JH, Kreiss K, Cox-Ganser JM(2007a) Symptoms associated with objective indices of upper airway inflammation in occu-pants of a water-damaged building. Presented at the World Asthma Meeting, June, Istanbul,Turkey.
Akpinar-Elci M, Stemple KJ, Enright PL, Fahy JV, Bledsoe TA, Kreiss K, Weissman DN(2005) Induced sputum evaluation in microwave popcorn production workers. Chest 128:991–997.
Akpinar-Elci M, Weikart D, Abrokwah M, Elci O (2009) Are we missing an important clue?”United airways disease” among farmers. Am J Respir Crit Care Med 179:A1658.
Akpinar-Elci M, Yucesoy B, Elci OC, Weissman DN (2007b) Noninvasive assessment of cytokinesin occupational respiratory diseases. Recent Pat Inflamm Allergy Drug Discov 1:100–107.
Anderson SD, Brannan JD (2003) Methods for “indirect” challenge tests including exercise,eucapnic voluntary hyperpnea, and hypertonic aerosols. Clin Rev Allergy Immunol 24:27–54.
Anon (1998) Respiratory health hazards in agriculture. Am J Respir Crit Care Med 158:S1–S76.Anon (2003) NIOSH Heath hazard evaluation and technical assistance report. Somerset County
Assistance Office, Somerset, Pennsylvania. US Department of Health and Human Services,Public Health Service, Center for Disease Control, National Institute for Occupational Safetyand Health, NIOSH Report No: HETA 2001-0067–2896
Anon (2005) ATS/ERS recommendations for standardized procedures for the online and offlinemeasurement of exhaled lower respiratory nitric oxide and nasal nitric oxide, 2005. Am J RespirCrit Care Med 171:912–930.
Asada M, Yamaya M, Ebihara S, Yasuda H, Tomita N, Kubo H, Sasaki H (2005) Interleukin-1betagene polymorphisms associated with COPD. Chest 128:1072–1073.
Bakke JV, Wieslander G, Norbäck D, Moen BE (2008) Atopy, symptoms and indoor environmentalperceptions, tear film stability, nasal patency and lavage biomarkers in university staff. Int ArchOccup Environ Health 81:861–872.
Baraldi E, Ghiro L, Piovan V, Carraro S, Zacchello F, Zanconato S (2003) Safety and success ofexhaled breath condensate collection in asthma. Arch Dis Child 88:358–360.
Barnes PJ, Chowdhury B, Kharitonov SA, Magnussen H, Page CP, Postma D, Saetta M (2006)Pulmonary biomarkers in chronic obstructive pulmonary disease. Am J Respir Crit Care Med174:6–14.
Barnes PJ, Chung KF, Page CP (1998) Inflammatory mediators of asthma: an update. PharmacolRev 50:515–596.
Bellanti JA, Wallerstedt DB (2000) Allergic rhinitis update: epidemiology and natural history.Allergy Asthma Proc 21:367–370.
Bousquet J, Vignola AM, Demoly P (2003) Links between rhinitis and asthma. Allergy58:691–706.
Bucchioni E, Kharitonov SA, Allegra L, Barnes PJ (2003) High levels of interleukin-6 in theexhaled breath condensate of patients with COPD. Respir Med 97:1299–1302.
Deutschle T, Friemel E, Starnecker K, Riechelmann H (2005) Nasal cytologies-impact of samplingmethod, repeated sampling and interobserver variability. Rhinology 43:215–220.
Ebbehøj NE, Meyer HW, Würtz H, Suadicani P, Valbjørn O, Sigsgaard T, Gyntelberg F (2005)Molds in floor dust, building-related symptoms, and lung function among male and femaleschoolteachers. Indoor Air 15:7–16.

436 M. Akpinar-Elci and O.C. Elci
Effros RM, Dunning MB, Biller J, Shaker R (2004) The promise and perils of exhaled breathcondensates. Am J Physiol Lung Cell Mol Physiol 287:1073–1080.
Fireman E, Greif J, Schwarz Y, Man A, Ganor E, Ribak Y, Lerman Y (1999) Assessment ofhazardous dust exposure by BAL and induced sputum. Chest 115:1720–1728.
Hellgren J, Eriksson C, Karlsson G, Hagberg S, Olin AC, Torén K (2001) Nasal symptoms amongworkers exposed to soft paper dust. Int Arch Occup Environ Health 74:129–132.
Hirvonen MR, Ruotsalainen M, Roponen M, Hyvärinen A, Husman T, Kosma VM, KomulainenH, Savolainen K, Nevalainen A (1999) Nitric oxide and proinflammatory cytokines in nasallavage fluid associated with symptoms and exposure to moldy building microbes. Am J RespirCrit Care Med 160:1943–1946.
Holz O, Richter K, Jörres RA, Speckin P, Mücke M, Magnussen H (1998) Changes in sputumcomposition between two inductions performed on consecutive days. Thorax 53:83–86.
Horváth I, Hunt J, Barnes PJ, Alving K, Antczak A, Baraldi E, Becher G, et al (2005) Exhaledbreath condensate: methodological recommendations and unresolved questions. Eur Respir J26:523–548.
Howard TD, Whittaker PA, Zaiman AL, Koppelman GH, Xu J, Hanley MT, Meyers DA, et al(2001) Identification and association of polymorphisms in the interleukin-13 gene with asthmaand atopy in a dutch population. Am J Respir Cell Mol Biol 25:377–384.
Hunt J (2002) Exhaled breath condensate: an evolving tool for noninvasive evaluation of lungdisease. J Allergy and Clin Immunol 110:28–34.
Jang AS, Choi IS (1999) Nitric oxide metabolites in patients with asthma: induced sputum versusblood. Respir Med 93:912–918.
Joos GF, O’Connor B, Anderson SD, Chung F, Cockcroft DW, Dahlén B, DiMaria G, et al (2003)Indirect airway challenges. Eur Respir J: Official J Eur Soc Clin Respir Physiol 21:1050–1068.
Kelly MM, Keatings V, Leigh R, Peterson C, Shute J, Venge P, Djukanovic R (2002) Analysis offluid-phase mediators. Eur Respir J 37:24s–39s.
Kolarik B, Lagercrantz L, Sundell J (2009) Nitric oxide in exhaled and aspirated nasal air as anobjective measure of human response to indoor air pollution. Indoor Air 19:145–152.
Koren HS, Graham DE, Devlin RB (1992) Exposure of humans to a volatile organic mixture.III. Inflammatory response. Arch Environ Health 47:39–44.
Laumbach RJ, Kipen HM (2005) Bioaerosols and sick building syndrome: particles, inflammation,and allergy. Curr Opin Allergy and Clin Immunol 5:135–139.
Lemiere C (2006) Diagnosing occupational asthma: insight from induced sputum. Can J PhysiolPharmacol 84:1–4.
Lemière C (2002) Non-invasive assessment of airway inflammation in occupational lung diseases.Curr Opin Allergy and Clin Immunol 2:109–114.
Lemière C, Chaboilliez S, Trudeau C, Taha R, Maghni K, Martin JG, Hamid Q (2000)Characterization of airway inflammation after repeated exposures to occupational agents.J Allergy Clin Immunol 106:1163–1170.
Lemière C, Pizzichini MM, Balkissoon R, Clelland L, Efthimiadis A, O’Shaughnessy D,Dolovich J, Hargreave FE (1999) Diagnosing occupational asthma: use of induced sputum.Eur Respir 13:482–488.
Li C-Q, Pang B, Kiziltepe T, Trudel LJ, Engelward BP, Dedon PC, Wogan GN (2006) Thresholdeffects of nitric oxide-induced toxicity and cellular responses in wild-type and p53-null humanlymphoblastoid cells. Chem Res Toxicol 19:399–406.
Lignell U, Meklin T, Putus T, Vepsäläinen A, Roponen M, Torvinen E, Reeslev M, et al (2005)Microbial exposure, symptoms and inflammatory mediators in nasal lavage fluid of kitchenand clerical personnel in schools. Int J Occup Med Environ Health 18:139–150.
Mutlu GM, Garey KW, Robbins RA, Danziger LH, Rubinstein I (2001) Collection and analysis ofexhaled breath condensate in humans. Am J Respir Crit Care Med 164:731–737.
Nguyen T, Brunson D, Crespi CL, Penman BW, Wishnok JS, Tannenbaum SR (1992) DNA dam-age and mutation in human cells exposed to nitric oxide in vitro. Proc Natl Acad Sci USA89:3030–3034.
23 Noninvasive Health Assessment Methods in Sick Building Syndrome 437
Norbäck D, Wålinder R, Wieslander G, Smedje G, Erwall C, Venge P (2000) Indoor air pollutantsin schools: nasal patency and biomarkers in nasal lavage. Allergy 55:163–170.
Passalacqua G, Ciprandi G, Pasquali M, Guerra L, Canonica GW (2004) An update on the asthma-rhinitis link. Curr Opin Allergy Clin Immunol 4:177–183.
Petrick MM, Slavin RG (2003) Occupational rhinitis. Immunol Allergy Clin North Am23:193–203.
Pizzichini E, Pizzichini MM, Efthimiadis A, Dolovich J, Hargreave FE (1997) Measuring air-way inflammation in asthma: eosinophils and eosinophilic cationic protein in induced sputumcompared with peripheral blood. J Allergy and Clin Immunol 99:539–544.
Purokivi M, Hirvonen M-R, Randell J, Roponen M, Meklin TM, Nevalainen AL, Husman TM,Tukiainen HO (2001) Changes in pro-inflammatory cytokines in association with exposure tomoisture-damaged building microbes. Eur Respir J 18:951–958.
Purokivi M, Hirvonen M-R, Randell J, Roponen M, Tukiainen H (2002b) Nitric oxide alone is aninsufficient biomarker of exposure to microbes in a moisture-damaged building. Inhal Toxicol14:1279–1290.
Purokivi M, Hirvonen M-R, Roponen M, Randell J, Vahteristo M, Tukiainen H (2002a)Comparison of inflammatory elements in nasal lavage and induced sputum following occu-pational exposure to moldy-building microbes. Inhal Toxicol 14:653–662.
Quirce S, Lemière C, de Blay F, del Pozo V, Gerth Van Wijk R, Maestrelli P, Pauli G, et al (2010)Noninvasive methods for assessment of airway inflammation in occupational settings. Allergy65:445–458.
Reed SD, Lee TA, McCrory DC (2004) The economic burden of allergic rhinitis: a criticalevaluation of the literature. PharmacoEconomics 22:345–361.
Roponen M, Kiviranta J, Seuri M, Tukiainen H, Myllykangas-Luosujärvi R, Hirvonen MR(2001) Inflammatory mediators in nasal lavage, induced sputum and serum of employees withrheumatic and respiratory disorders. Eur Respir J 18:542–548.
Roponen M, Toivola M, Alm S, Nevalainen A, Jussila J, Hirvonen M-R (2003) Inflammatory andcytotoxic potential of the airborne particle material assessed by nasal lavage and cell exposuremethods. Inhal Toxicol 15:23–38.
Rytilä PH, Lindqvist AE, Laitinen LA (2000) Safety of sputum induction in chronic obstructivepulmonary disease. Eur Respir J 15:1116–1119.
Sack U, Scheibe R, Wötzel M, Hammerschmidt S, Kuhn H, Emmrich F, Hoheisel G,Wirtz H, Gessner C (2006) Multiplex analysis of cytokines in exhaled breath condensate.Cytometry. Part A: The Journal of the International Society for Analytical Cytology 69:169–172.
Siracusa A, Desrosiers M, Marabini A (2000) Epidemiology of occupational rhinitis: prevalence,aetiology and determinants. Clinical and Experimental Allergy: Journal of the British Societyfor Allergy and Clinical Immunology 30:1519–1534.
Smith KR (2002) Indoor air pollution in developing countries: recommendations for research.Indoor Air 12:198–207.
Spengler JD, Samet JM, McCarthy JF (Eds.) (2001). Indoor air quality handbook. McGraw-Hill,New York, New York. 54.1–54.24.
Stark H, Roponen M, Purokivi M, Randell J, Tukiainen H, Hirvonen M-R (2006) Aspergillus fumi-gatus challenge increases cytokine levels in nasal lavage fluid. Inhal Toxicol 18:1033–1039.
Vlachos-Mayer H, Leigh R, Sharon RF, Hussack P, Hargreave FE (2000) Success and safety ofsputum induction in the clinical setting. Eur Respir J 16:997–1000.
Wieslander G, Norbäck D, Wålinder R, Erwall C, Venge P (1999) Inflammation markers in nasallavage, and nasal symptoms in relation to relocation to a newly painted building: a longitudinalstudy. Int Arch of Occup Environ Health 72:507–515.
Wilcosky TC (1993) Biological markers of intermediate outcomes in studies of indoor air and othercomplex mixtures. Environ Health Perspect 101:193–197.
Wålinder R, Norbäck D, Wessen B, Venge P (2001a) Nasal lavage biomarkers: effects of waterdamage and microbial growth in an office building. Arch Environ Health 56:30–36.

438 M. Akpinar-Elci and O.C. Elci
Wålinder R, Norbäck D, Wieslander G, Smedje G, Erwall C, Venge P (1999) Nasal patency andlavage biomarkers in relation to settled dust and cleaning routines in schools. Scand J Work,Environ Health 25:137–143.
Wålinder R, Norbäck D, Wieslander G, Smedje G, Erwall C, Venge P (2001b) Acoustic rhinometryand lavage biomarkers in relation to some building characteristics in swedish schools. IndoorAir 11:2–9.
Zhang J, Smith KR (2003) Indoor air pollution: a global health concern. Br Med Bull 68:209–225.

Chapter 24
Solving Indoor Environmental Problems: WhatCan Be Found Out through IndividualMeasurements?
Anne Korpi, Tarja Takki, Maija Virta, Risto Kosonen, and Kirsi Villberg
24.1 Introduction
Problems with indoor environment cause recurrent complaints from dissatisfiedoccupants and increase the number of unplanned service and property maintenancevisits. Sometimes the problems lead even to illnesses, such as contagious respi-ratory infections, allergic reactions, or asthma. Unfortunately, corrective actionsto improve indoor air quality (IAQ) are often implemented only after occupantsdevelop serious health problems. The slow reaction time prevails also when thecauses of thermal discomfort are corrected. In addition, the current policy seems tobe that corrective actions are implemented not systematically throughout the build-ing but only in those areas from which the complaints were coming. Thus, muchtime is wasted and the problem has become serious before corrective measuresfinally start.
Typically, there is not an isolated problem with the indoor environment, but acluster of them. Sometimes there are problems with IAQ, such as bad odours, butoften the reason is the poor performance of mechanical systems. In addition, in manycases both IAQ and mechanical problems appear in only some areas of the build-ing, complicating the process of locating them (Takki and Virta 2007). Therefore,it is important to determine carefully what kinds of measurements and analyses areneeded, and to be aware of what each individual measurement can illustrate. Theaim is to collect all of the necessary information cost-effectively in as short a time aspossible and make the right decisions for improving the situation comprehensively.
In this chapter, the benefits and limitations of the most common field mea-surements used in improving indoor environmental quality (IEQ) in office-typeenvironments are discussed.
A. Korpi (B)Oy Halton Group Ltd., Helsinki, Finland; Department of Environmental Science, University ofEastern Finland, Kuopio, Finlande-mail: [email protected]
439S.A. Abdul-Wahab (ed.), Sick Building Syndrome,DOI 10.1007/978-3-642-17919-8_24, C© Springer-Verlag Berlin Heidelberg 2011

440 A. Korpi et al.
24.2 The Basic Approach
Before any technical measurements the nature and magnitude, in addition to thelocalization, of the indoor environmental problems must be specified. This is bestachieved by conducting questionnaires, interviews, or occupant satisfaction surveys(OSS). OSS is discussed in more detail in Chaps. 4 and 19 of this book. The surveycan be utilised as a diagnostics tool to identify specific problems and their likelycauses.
It is recommended that a health symptom questionnaire, such as the ÖrebroMM40 questionnaire (Andersson 1998) be incorporated into the survey in orderto link users’ health symptoms with indoor environmental quality.
The perceived IEQ and the health symptoms suffered play an integral role indetermination of the quality of the building. The complaint areas are defined withthe indoor environment perception map that is the product of the survey (Takki andVirta 2007) and localises the problem more exactly to specific floors and façades aswell as to specific aspects of indoor environment. With OSS all comments, includingfree-form ones, can be collected and taken into account in decisions on improve-ments. Technical analysis and physical measurements are then to be conducted inthe areas where dissatisfaction and/or health symptom frequencies are the highest,to find the sources of dissatisfaction.
Based on the findings of the occupant satisfaction survey and the results oftechnical analysis, a corrective action plan is implemented. After all necessarycorrective actions have been taken, it is important to check that all problems reallyare solved. This can be done by carrying out a new occupant satisfaction survey(i.e., a ‘post-survey’) and limited physical measurements if needed. This should beperformed 6–12 months after the corrective actions.
24.3 Technical/Field Measurements
On the basis of the regions and subjects of dissatisfaction (see Table 24.1) revealedby the survey or questionnaire, the next step should be taken by multidisciplinaryprofessionals. Technical/field measurements presuppose a multidisciplinary teamof scientists representing at least indoor air quality, building physics, acoustics,and HVAC-system knowledge. The team also needs expertise in various aspectsof building services such as lighting, and air distribution.
Often the reporting of specific health problems of a large number of occupants isthe first sign of indoor air quality problems. From health symptoms, it is, unfor-tunately, difficult to draw definitive conclusions as to reasons, because variousproblems in indoor environment quality can have very similar health effects (seeFig. 24.1).
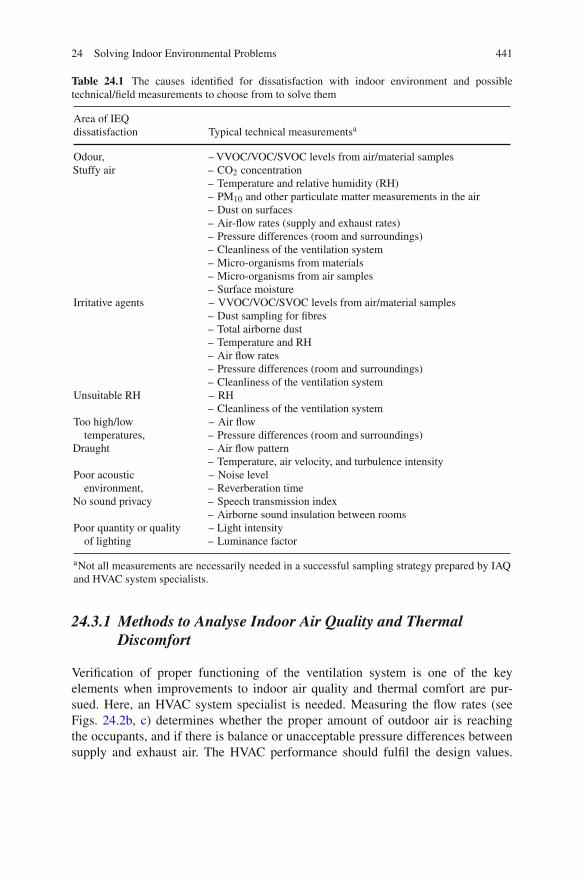
24 Solving Indoor Environmental Problems 441
Table 24.1 The causes identified for dissatisfaction with indoor environment and possibletechnical/field measurements to choose from to solve them
Area of IEQdissatisfaction Typical technical measurementsa
Odour,Stuffy air
– VVOC/VOC/SVOC levels from air/material samples– CO2 concentration– Temperature and relative humidity (RH)– PM10 and other particulate matter measurements in the air– Dust on surfaces– Air-flow rates (supply and exhaust rates)– Pressure differences (room and surroundings)– Cleanliness of the ventilation system– Micro-organisms from materials– Micro-organisms from air samples– Surface moisture
Irritative agents – VVOC/VOC/SVOC levels from air/material samples– Dust sampling for fibres– Total airborne dust– Temperature and RH– Air flow rates– Pressure differences (room and surroundings)– Cleanliness of the ventilation system
Unsuitable RH – RH– Cleanliness of the ventilation system
Too high/lowtemperatures,
Draught
– Air flow– Pressure differences (room and surroundings)– Air flow pattern– Temperature, air velocity, and turbulence intensity
Poor acousticenvironment,
No sound privacy
– Noise level– Reverberation time– Speech transmission index– Airborne sound insulation between rooms
Poor quantity or qualityof lighting
– Light intensity– Luminance factor
aNot all measurements are necessarily needed in a successful sampling strategy prepared by IAQand HVAC system specialists.
24.3.1 Methods to Analyse Indoor Air Quality and Thermal
Discomfort
Verification of proper functioning of the ventilation system is one of the keyelements when improvements to indoor air quality and thermal comfort are pur-sued. Here, an HVAC system specialist is needed. Measuring the flow rates (seeFigs. 24.2b, c) determines whether the proper amount of outdoor air is reachingthe occupants, and if there is balance or unacceptable pressure differences betweensupply and exhaust air. The HVAC performance should fulfil the design values.

442 A. Korpi et al.
Skin irritation
Hoarseness
Nose symptoms
Eye symptoms
Throat irritation
Hypersensitivity pneumonitis
Difficulties in concentration
Joint symptoms
Fever
Allergy
Heavy head
Stress symptoms
Headache
Material
emissions
Man-made
mineral fibres
Building
moisture/
mould
Thermal
discomfort
and draught
Cold hands and feet
Nose and throat symptoms
Sweating
Chill
Fainting
Dry eyesImproper
acoustic
design Fatigue
Stress symptoms
Overstrain
Visual
discomfort
Eyestrain
Dizziness
Double vision
Respiratory
infections
Itching
Headache
Neck-shoulder
symptoms
Sensation
of odour
Dry skin
Dyspnoea
Phlegm
Wheezing
Cough
Difficulties in concentration
Fig. 24.1 Indoor environment-related symptoms and their possible causes (Schneider andLundqvist 1986; Hedge et al. 1993; Korpi 2001; Mäkinen-Kiljunen and Mussalo-Rauhamaa 2002;Villberg et al. 2002; Haapakangas et al. 2008; Norbäck and Nordström 2008; WHO 2009; Boyce2010; d’Errico et al. 2010)
Disturbingly often, the causes of the problems are unbalanced ductwork, diffuserswith unsuitable throw patterns, room units operating outside optimal range, orpoor operation of room controllers and/or the building management system (BMS).Measuring certain physical parameters (temperature, relative humidity, air velocity,and CO2 level at the measurement point; Fig. 24.2e) gives information about generalair quality and ventilation efficiency in the room.
24.3.1.1 Material Emissions
For volatile organic compound (VOC) measurements and analysis (Fig. 24.2a;Table 24.2), international standards and accredited methods (ISO 16000-1; ISO16000-6, and ISO 16017-1) facilitate the analysis. Careful sampling strategy shouldbe employed. This includes, for example, not ventilating naturally ventilated roomsfor 8 h before sampling. For analysis, laboratories that apply quality managementsystems should be used.
When the measured VOC levels are lower than the established limit values (suchas the time-weighted average (TWA), or threshold limit value) for those compounds,the air quality should be acceptable in terms of VOC types and concentrations.However, indoor air offers a mixture of hundreds of VOCs, and there are no limitvalues for every one of them. Therefore, the total VOC value (TVOC) is calculated.Interpretation of the TVOC value is not straightforward either. On one hand, a high

24 Solving Indoor Environmental Problems 443
a b
c
d e
Fig. 24.2 Examples of measurements. a Sampling for airborne chemical contaminants.b Measurement of airflow. c Determination of the supply flow rate via the measurement andadjustment module. The tubes and control spindle are passed through the diffuser. The differentialpressure is measured with a manometer. The flow rate is then calculated according to the manufac-ture’s product data. d Wipe sampling for man-made mineral fibres. e Measurement of temperatureand RH
TVOC-concentration may not cause any health symptoms to occupants or presenta disturbing smell. On the other hand, a low TVOC-value can be measured in theroom while people still suffer from poor indoor air quality caused by a VOC. In theseextreme situations, interpretation of the results by a professional is very important.
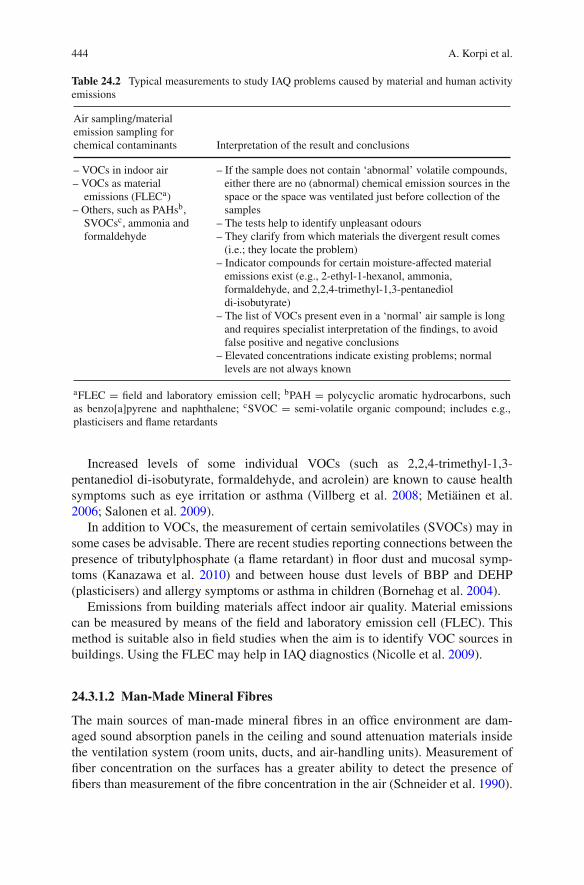
444 A. Korpi et al.
Table 24.2 Typical measurements to study IAQ problems caused by material and human activityemissions
Air sampling/materialemission sampling forchemical contaminants Interpretation of the result and conclusions
– VOCs in indoor air– VOCs as material
emissions (FLECa)– Others, such as PAHsb,
SVOCsc, ammonia andformaldehyde
– If the sample does not contain ‘abnormal’ volatile compounds,either there are no (abnormal) chemical emission sources in thespace or the space was ventilated just before collection of thesamples
– The tests help to identify unpleasant odours– They clarify from which materials the divergent result comes
(i.e.; they locate the problem)– Indicator compounds for certain moisture-affected material
emissions exist (e.g., 2-ethyl-1-hexanol, ammonia,formaldehyde, and 2,2,4-trimethyl-1,3-pentanedioldi-isobutyrate)
– The list of VOCs present even in a ‘normal’ air sample is longand requires specialist interpretation of the findings, to avoidfalse positive and negative conclusions
– Elevated concentrations indicate existing problems; normallevels are not always known
aFLEC = field and laboratory emission cell; bPAH = polycyclic aromatic hydrocarbons, suchas benzo[a]pyrene and naphthalene; cSVOC = semi-volatile organic compound; includes e.g.,plasticisers and flame retardants
Increased levels of some individual VOCs (such as 2,2,4-trimethyl-1,3-pentanediol di-isobutyrate, formaldehyde, and acrolein) are known to cause healthsymptoms such as eye irritation or asthma (Villberg et al. 2008; Metiäinen et al.2006; Salonen et al. 2009).
In addition to VOCs, the measurement of certain semivolatiles (SVOCs) may insome cases be advisable. There are recent studies reporting connections between thepresence of tributylphosphate (a flame retardant) in floor dust and mucosal symp-toms (Kanazawa et al. 2010) and between house dust levels of BBP and DEHP(plasticisers) and allergy symptoms or asthma in children (Bornehag et al. 2004).
Emissions from building materials affect indoor air quality. Material emissionscan be measured by means of the field and laboratory emission cell (FLEC). Thismethod is suitable also in field studies when the aim is to identify VOC sources inbuildings. Using the FLEC may help in IAQ diagnostics (Nicolle et al. 2009).
24.3.1.2 Man-Made Mineral Fibres
The main sources of man-made mineral fibres in an office environment are dam-aged sound absorption panels in the ceiling and sound attenuation materials insidethe ventilation system (room units, ducts, and air-handling units). Measurement offiber concentration on the surfaces has a greater ability to detect the presence offibers than measurement of the fibre concentration in the air (Schneider et al. 1990).

24 Solving Indoor Environmental Problems 445
Table 24.3 Methods and measurements to study IAQ problems caused by man-made mineralfibres and dusts
Method:– measurements Interpretation of the result and conclusions
Settled dust sampling (wipesampling) for particulate andfibrous contaminants:
– Man-made mineral fibres, mouldspores, soot, pollen, andasbestos identified with electronmicroscopy
– If the sample contains any contaminants, furtheranalysis is needed to find pollutant sources
– If the sample does not contain any contaminants, thespace is clean or surfaces were cleaned less than aweek earlier
– Only a qualitative result is obtained
Ventilation duct inspection:– Remote-controlled video camera
robots
– This determines the condition of ventilation ducts, andlocates possible contamination sources in the ducts
– It also confirms cleaning needs and records the qualityof cleaning
This is why settled dust sampling is useful in identifying mineral fibre exposure(Morawska and Salthammer 2003) (Table 24.3). Vallarino et al. (2003) have pro-posed a technique to standardise evaluation of fibres in building dust. In addition,sampling should be performed a few days after rigorous cleaning, to verify that thecollected dust represents the current situation (Fig. 24.2d). One should bear in mindthat for one to be able to say anything about the origin of the fibres in the envi-ronment, or to verify that the fibres are MMMF, or to detect also those fibres withthe smallest diameter, the analysis must employ a scanning electron microscope, orlight microscopy using plane polarised illumination.
On many occasions, a result concerning the composition of a dust sample may beobtained simultaneously with the determination concerning fibrous matter. While itis possible to detect microbial spores in the samples, one cannot reach species oreven genus level in microscopic evaluation of a dust sample.
24.3.1.3 Building Moisture and Microbial Contamination
Moisture damage and microbial growth are perhaps the most difficult IAQ problemcausing agents to locate and measure. Sometimes the visual signs of moisture areclear and distinct and no microbial sampling is needed to prompt action. But whenmoisture problems are not as obvious and damage is only suspected, there is not justone method that can detect microbial growth in all conditions (Table 24.4). That iswhy surface and material samples and sometimes also air samples may be needed.Mould growth can be verified by comparing samples from damaged and undamagedmaterials. If damage is not visible, mould growth can be found via either settled sur-face dust samples or air sampling. Air sampling should not be the only method usedfor collecting information on moisture damage, because of its limitations (Meklin2002).
Culture-based methods are for the time being a usual means of detecting micro-bial growth (WHO 2009). However, they possess certain drawbacks. Firstly, no

446 A. Korpi et al.T
ab
le24.4
Typ
ical
met
hods
ofst
udyi
ngIA
Qpr
oble
ms
caus
edby
buil
ding
moi
stur
ean
d/or
mic
robi
alco
ntam
inat
ion
inbu
ildi
ngm
ater
ials
Met
hod:
–m
easu
rem
ents
Inte
rpre
tati
onof
the
resu
ltan
dco
nclu
sion
s
Sur
face
moi
stur
em
easu
rem
ent:
–L
ocat
ing
moi
star
eas
infl
oors
,roo
fsan
dw
alls
mad
eof
hom
ogen
eous
mat
eria
l
–T
his
prov
ides
rapi
dan
dno
n-de
stru
ctiv
ede
term
inat
ion
ofth
em
oist
ure
cont
ent
ofbu
ildi
ngm
ater
ials
–It
isfo
rpr
elim
inar
yan
alys
isbe
fore
dest
ruct
ive
met
hods
–It
isin
dica
tive
and
inst
anta
neou
s–
Inte
rpre
tati
onis
ofte
nde
man
ding
Str
uctu
ral
hum
idit
ym
easu
rem
ent:
–T
hew
ater
cont
ent
ofco
ncre
teat
mea
sure
dde
pths
–It
dete
rmin
esw
heth
erth
est
ruct
ure
isdr
yen
ough
–It
dete
rmin
esw
heth
erth
eco
ndit
ions
insp
ecifi
cst
ruct
ure
are
favo
urab
lefo
rm
ould
grow
th–
Itde
stro
ysst
ruct
ures
,and
the
hole
sdr
ille
dm
ayha
rmth
efu
ncti
onin
gof
the
stru
ctur
ean
den
able
cond
ensa
tion
ofm
oist
ure
Air
sam
plin
gfo
rm
icro
orga
nism
s/m
icro
bial
cons
titu
ents
:–
Via
ble
fung
alan
dba
cter
ials
pore
s/ce
lls
pres
ent
inth
eai
r–
DN
A-b
ased
met
hods
for
iden
tifi
cati
onan
dqu
anti
fica
tion
ofm
icro
bial
gene
ra–
Gen
eral
toxi
city
ofai
rbor
nedu
st(e
.g.,
boar
sper
mm
otil
ity
test
)–
Oth
erta
rget
com
poun
ds,s
uch
asm
ycot
oxin
s,β
-glu
cans
,tox
ins
prod
uced
byac
tino
bact
eria
,and
endo
toxi
ns(–
Erg
oste
rol,
fung
alex
trac
ellu
lar
poly
sacc
hari
des,
mur
amic
acid
,and
3-hy
drox
y-fa
tty
acid
s)
–C
ultu
re-b
ased
met
hods
favo
uran
dse
lect
cert
ain
spec
ies;
whi
leth
eyal
low
the
iden
tifi
cati
onof
man
ysp
ecie
s,th
eydo
not
prov
ide
dete
ctio
nof
non-
cult
urab
lean
dde
adm
icro
-org
anis
ms,
cell
debr
is,a
ndm
icro
bial
com
pone
nts
also
havi
ngto
xic
oral
lerg
enic
prop
erti
es–
Ifth
esa
mpl
eco
ntai
nshi
gher
conc
entr
atio
nsof
spec
ific
spec
ies
orge
nera
ofm
icro
-org
anis
ms
inco
mpa
riso
nto
refe
renc
esa
mpl
es,f
urth
eran
alys
isis
need
edto
find
poll
utan
tso
urce
s–
Ifth
esa
mpl
edo
esno
tco
ntai
nab
norm
alle
vels
/gen
era
ofvi
able
fung
alsp
ores
,the
room
may
becl
ean,
ther
ew
ere
novi
able
spor
esin
the
air
atth
eti
me
ofm
easu
rem
ent,
orsp
ores
dono
tge
rmin
ate
onth
esa
mpl
ing
med
ia–
The
pres
ence
ofce
rtai
nm
icro
bial
gene
ram
ayin
dica
tem
oist
ure/
mou
ldda
mag
e,if
othe
rco
ndit
ions
are
met
–F
orto
xici
tym
easu
rem
ents
,ext
rem
ely
high
-vol
ume
air
sam
ples
are
need
ed,s
oth
esa
mpl
ing
tim
eis
onth
eor
der
ofw
eeks
–F
orno
n-cu
ltur
e-ba
sed
met
hods
and
mea
nsof
asse
ssin
gm
icro
bial
cons
titu
ents
,ref
eren
ceva
lues
for
dist
ingu
ishi
ngda
mag
edfr
omno
n-da
mag
edbu
ildi
ngs
orm
ater
ials
are
not
yet
avai
labl
e.T
hese
met
hods
are
suit
able
for
befo
re–a
fter
situ
atio
ns–
Man
yof
the
new
lyde
velo
ped
met
hods
are
not
wel
lva
lida
ted
and
rem
ain
unav
aila
ble
com
mer
cial
ly

24 Solving Indoor Environmental Problems 447
Tab
le24.4
(con
tinu
ed)
Met
hod:
–m
easu
rem
ents
Inte
rpre
tati
onof
the
resu
ltan
dco
nclu
sion
s
Sur
face
(dus
t)/m
ater
ial
sam
plin
gfo
rm
icro
-org
anis
ms/
mic
robi
alco
nsti
tuen
ts:
–(V
iabl
e)m
icro
-org
anis
ms
grow
ing
onth
esu
rfac
esa
mpl
ed–
All
mic
ro-o
rgan
ism
s,bo
thvi
able
and
non-
viab
le,p
rese
ntin
the
sam
ple
–D
irec
tm
icro
scop
icex
amin
atio
nof
asu
rfac
e–
Tox
ins
inth
esa
mpl
e–
Gen
eral
toxi
city
ofth
esa
mpl
e(e
.g.,
boar
sper
mm
otil
ity
inhi
biti
onas
say)
–D
NA
-bas
edm
etho
dsfo
rid
enti
fica
tion
and
quan
tifi
cati
onof
mic
robi
alge
nera
–O
ther
targ
etco
mpo
unds
,suc
has
myc
otox
ins,
β-g
luca
ns,t
oxin
spr
oduc
edby
acti
noba
cter
ia,a
nden
doto
xins
(–E
rgos
tero
l,fu
ngal
extr
acel
lula
rpo
lysa
ccha
ride
s,m
uram
icac
id,a
nd3-
hydr
oxy-
fatt
yac
ids)
–T
his
dete
rmin
esw
heth
erth
esu
rfac
eor
mat
eria
lsa
mpl
ed(w
ith
avi
sibl
est
ain,
disc
olor
atio
n,et
c.)
has
mic
robi
algr
owth
atth
esa
mpl
elo
cati
on–
Itin
dica
tes
whe
ther
ther
ear
eab
norm
alm
icro
bial
gene
ra/q
uant
itie
son
the
surf
ace
–S
urfa
cesa
mpl
ing
may
also
reve
alin
door
rese
rvoi
rsof
spor
esth
atha
veno
tye
tbe
com
eai
rbor
ne–
The
pres
ence
ofbi
olog
ical
mat
eria
lson
apa
rtic
ular
surf
ace
isno
ta
dire
ctin
dica
tion
ofw
hat
may
bein
the
air
–T
hem
etho
dre
quir
esa
para
llel
sam
ple
from
ano
n-su
spec
tre
fere
nce
mat
eria
lfor
vali
din
terp
reta
tion
–C
ulti
vati
onfa
vour
sce
rtai
nty
pes
ofm
icro
-org
anis
ms
–N
on-c
ultu
re-b
ased
met
hods
and
met
hods
for
asse
ssin
gm
icro
bial
cons
titu
ents
are
fast
,but
refe
renc
eva
lues
are
thus
far
lack
ing.
The
met
hod
issu
itab
lefo
rpr
e-an
dpo
st-r
enov
atio
nm
onit
orin
g–
Man
yof
the
new
lyde
velo
ped
met
hods
are
not
wel
lva
lida
ted
and
are
unav
aila
ble
com
mer
cial
lyT
herm
alin
frar
edim
agin
g:–
Air
and
ther
mal
leak
age
inst
ruct
ures
e.g.
,win
dow
san
dex
tern
alw
alls
–T
empe
ratu
redi
ffer
ence
sin
the
stru
ctur
e
–T
hem
etho
dde
tect
sbu
ildi
ng/s
truc
ture
abno
rmal
itie
sth
atre
sult
inen
ergy
loss
es–
The
data
prod
uced
can
indi
cate
poss
ible
at-r
isk
stru
ctur
esfo
rco
ldbr
idge
san
dm
oist
ure
cond
ensa
tion

448 A. Korpi et al.
health-based exposure limits have been recommended. Secondly, culture-basedmethods detect only those viable spores in the air that survive the sampling processand germinate on the sampling media. Lastly, a high outdoor air concentration ofmicroorganisms, certain human activities, and the type of the building can distort thebackground level of mould spores in the indoor air. For example, old wooden build-ings have higher background microbial concentrations than new concrete buildingsdo (Lignell et al. 2007; Meklin et al. 2005).
There are also new, non-culture-based methods to detect microorganisms. Recentstudies demonstrate promising results from DNA techniques such as the quantitativepolymerase chain reaction (qPCR) method. Methods based on DNA techniques arenot dependent on the viability of the microbes, and they can be designed to work atdifferent levels of specificity, detecting a whole group of microbes, a genus, or forexample, a biosynthetic gene (Rintala 2003; Lignell 2008; WHO 2009). For now,the disadvantages of these rapid methods include the lack of reference values andthe need for special expertise. Therefore, interpretation of the results is difficult.
Determination of microbial constituents, such as mycotoxins, β-glucans, toxinsproduced by actinobacteria, endotoxins, ergosterol, fungal extracellular polysaccha-rides, muramic acid, and 3-hydroxy-fatty acids is also among the new methods.Most of these tests lack validation and reference values for the time being (WHO2009; Kärkkäinen et al. 2010; Hyvärinen et al. 2006).
Finding at-risk or moisture-damaged structures may require surface moisturemeasurements, structural moisture measurements, and/or thermal infrared imagingperformed by a building physics specialist (Table 24.4).
24.3.1.4 Thermal Discomfort and Draught
Typical methods for studying thermal discomfort and draught are presented inTable 24.5. Performing the technical analysis at the site typically takes a few daysand requires an HVAC specialist.
When it comes to thermal conditions, the analysis concentrates on the locationsof heat loads and heat losses, and on the functioning of ventilation, heating, andcooling systems. If the problem is draught, it is important to study the air flowsin the room with the help of, for example, smoke visualisation. In areas where theair quality is of concern, the focus is on the efficiency of ventilation in the roomand on the pressure differences between rooms. Verifying the cleanliness of the air-conditioning systems and inspecting the air-conditioning devices are also important.
Problems in thermal comfort are often related to badly performing ventilationand heating systems. Typically, problems with HVAC systems’ settings, such asoperation times of air-handling units as well as air and water temperatures, and inoperation of building management system are found. Sometimes thermal discomfortis caused by the lack of cooling or heating capacity in the building, or that theoccupants and building maintenance personnel are unacquainted with the usage andoperation of the building management system.
Solving draught problems via air velocity measurements specified in interna-tional standards (e.g., ISO EN 7730 (2005) and ASHRAE Standard 55 (2004))

24 Solving Indoor Environmental Problems 449
Tab
le24.5
Typ
ical
fiel
dan
alys
ism
etho
dsfo
rst
udyi
ngth
erm
aldi
scom
fort
Met
hods
:–
mea
sure
men
tsC
oncl
usio
ns
Tre
ndlo
gsfo
rth
ebu
ildi
ngm
anag
emen
tsy
stem
:–
Roo
mai
rte
mpe
ratu
rean
dC
O2-c
once
ntra
tion
inth
ero
om–
Pri
mar
yai
r-fl
owra
tean
ddu
ctpr
essu
re–
HV
AC
-sys
tem
set
valu
es
–T
hepr
oble
mm
ayst
emfr
omsy
stem
fail
ures
inth
ebu
ildi
ngm
anag
emen
tsy
stem
,in
air-
hand
ling
unit
s(A
HU
s),o
rin
othe
rsy
stem
com
pone
nts
–T
here
may
bela
rge
vari
atio
nsin
room
cond
itio
nsca
used
by,f
orex
ampl
e,a
brok
ense
nsor
,clo
sed/
stuc
kva
lve,
brok
enfa
n,or
rele
ased
fire
dam
per
–T
hew
rong
setp
oint
sm
aybe
inus
eA
irfl
owvi
sual
isat
ion
usin
gsm
oke:
–A
irdi
ffus
ion
inth
esp
ace
–A
ir-fl
ows
betw
een
spac
es–
Pre
ssur
edi
ffer
ence
betw
een
spac
es–
Air
tigh
tnes
sof
win
dow
s
–T
his
dete
rmin
esth
eai
rm
ovem
ents
inth
esp
ace
–It
clar
ifies
reas
ons
for
drau
ght
inth
eoc
cupi
edar
ea–
e.g.
,ter
min
alun
it,
cold
win
dow
surf
ace,
infi
ltra
tion
,or
pres
sure
diff
eren
cebe
twee
nsp
aces
–It
asse
sses
the
oper
atio
nof
the
term
inal
unit
Roo
mco
ndit
ions
’m
easu
rem
ent:
–L
ocal
air
tem
pera
ture
,air
velo
city
,CO
2-c
once
ntra
tion
and
rela
tive
hum
idit
y–
Win
dow
and
othe
rsu
rfac
ete
mpe
ratu
res
–T
hem
etho
dde
term
ines
room
cond
itio
nsat
the
tim
eof
mea
sure
men
t–
The
resu
ltde
pend
son
the
actu
alm
easu
rem
ent
tim
ing
(i.e
.,he
atlo
ads
inth
esp
ace,
supp
lyai
rco
ndit
ion
(coo
ling
orhe
atin
g),s
unsh
ine,
etc.
)
Mea
sure
men
tan
dau
dit
ofH
VA
C-s
yste
mpa
ram
eter
s:–
Loc
alai
r-fl
owra
tes
indu
ctw
ork
bran
ches
and
atte
rmin
alun
its
–W
ater
-flow
rate
sin
heat
ing
and
cool
ing
syst
ems
–T
heco
ndit
ion
ofal
lH
VA
C-c
ompo
nent
s
–T
his
dete
rmin
esw
heth
erth
edu
ctw
ork
and
pipe
sar
ein
bala
nce
and
oper
atin
gat
the
desi
gnva
lues
–It
dete
rmin
esw
heth
erth
esy
stem
com
pone
nts,
such
asA
HU
s,fa
ns,fi
lter
s,co
nden
sati
ondr
ains
,and
valv
es,a
recl
ean
and
ingo
odco
ndit
ion
The
rmal
infr
ared
imag
ing:
–T
ight
ness
ofw
indo
ws
toai
ran
dhe
at–
Air
-con
diti
onin
gro
omun
itop
erat
ion
(e.g
.,ch
ille
dbe
aman
dra
dian
tce
ilin
g)–
Win
dow
surf
ace
tem
pera
ture
(Not
e:m
easu
rem
ent
isdi
fficu
ltbe
caus
eof
refl
ecti
ons)
–T
his
dete
rmin
esth
eai
r-ti
ghtn
ess
ofw
indo
wst
ruct
ures
–It
iden
tifi
esto
olo
wor
too
high
surf
ace
tem
pera
ture
ofw
indo
wor
othe
rsu
rfac
es–
Itpr
ovid
esin
form
atio
non
the
oper
atio
nof
room
unit
san
dth
eir
man
agem
ent
syst
em–
Itgi
ves
info
rmat
ion
onsy
stem
fail
ures
inpi
pew
ork
and
the
BM
S

450 A. Korpi et al.
is challenging. These standards specify the draught rating (DR) value – i.e., thepercentage of people dissatisfied because of draught. The draught rating is a func-tion of local air temperature, local mean air velocity, and local turbulence intensity.Recent studies indicate that this model should also take into account the length ofexposure, activity level, and velocity directions (Griefahn et al. 2000; Toftum et al.1997; Melikov 2005). The revised versions of both standards include a diagram forestimating the air speed required to offset an increase in temperature. Also, the pos-sibility of controlling temperature at the individual level is important for occupantsatisfaction (Toftum and Melikov 2000).
When air flow is measured in a non-occupied room, it is difficult to identifypossible draught. The velocity field at a given moment depends on the number andthe location of heat sources and on the primary air conditioning. Occupant and solarload as well as air-flow rates and the supply air temperature of terminal units vary allthe time in the space. This is why the velocity field is not stable and the flow patternwill change with the load conditions. In many cases, thermal plumes dominate airmovement by creating large eddies in the room (Kosonen et al. 2007).
Consequently, solving draught problems requires professionals who are wellaware of the operation of terminal units and behaviour of thermal plumes andair movements in the space. This is why this phenomenon is easier and fasterto visualise with smoke instead of through measurement of local velocities andtemperatures.
24.4 Conclusions
Identifying and locating the reasons behind unsatisfactory indoor environment qual-ity is a challenging task. This is because typically the problems are caused by severalcoexisting factors. Poor indoor air quality can originate from various elements, suchas microbial growth, unprotected or damaged man-made mineral fibre surfaces, orchemical emissions from materials. Also, imbalance of supply and exhaust air oftencauses IAQ problems. At the same time, there may be poor air distribution in theroom, or problems in controlling the heating system might cause thermal discomfortand draught.
The occupant symptom profile on its own is seldom adequate to lead the indoorair experts to the right track. Instead, the areas where occupant dissatisfaction is thehighest serve better for cost-effective targeting of the methods and measurements.For example, an expert relying on only one type of measurements (let’s say, surfacemoisture, airborne micro-organism, or smoke tests) rarely succeeds in improvingthe indoor environment holistically. There is neither a systematic sampling strategyto follow nor a panacea with respect to what samples to take, since the range ofthings to measure is vast and cases vary. On the whole, choosing the right technicalmeasurements and solving indoor environmental problems require multidisciplinaryskills, with at least IAQ, building physics, and HVAC-system specialists workingtogether. This chapter presented discussion of the pros and cons of typical fieldmeasurements to solve indoor environment problems.
24 Solving Indoor Environmental Problems 451
Acknowledgments The authors thank Simo Lehtinen, M.Sc., from Mikrofokus Oy Ltd forconsultancy on man-made mineral fiber issues. The Academy of Finland, Research Council forNatural Sciences and Engineering (grant 130187), is acknowledged for financial support.
References
ASHRAE (2004) Thermal Environment Conditions for Human Occupancy. ASHRAE standard 55.ASHRAE, Atlanta.
Andersson K (1998) Epidemiological approach to indoor air problems. Indoor Air 8(S4):32–39.Bornehag CG, Sundell J, Weschler CJ, Sigsgaard T, Lundgren B, Hasselgren M, Hägerhed-
Engman L (2004) The association between asthma and allergic symptoms in childrenand phthalates in house-dust: a nested case-control study. Environ Health Perspect 112:1393–1397.
Boyce PR (2010) The impact of light in buildings on human health. Indoor Built Environ 19:8–20.d’Errico A, Caputo P, Falcone U, Fubini L, Gilardi L, Mamo C, Migliardi A, Quarta D, Coffano
E (2010) Risk factors for upper extremity musculoskeletal symptoms among call centeremployees. J Occup Health 52:115–124.
Griefahn B, Künemund C, Gehring U, Mehnert P (2000) Drafts in cold environments – thesignificance of air temperature and direction. Ind Health 38:30–40.
Haapakangas A, Helenius R, Keskinen E, Hongisto V (2008) Perceived acoustic environment,work performance and well-being – survey results from Finnish offices. In: Proceedings of 9thInternational Congress on Noise as a Public Health Problem (ICBEN) 2008, pp. 434–441.
Hedge A, Erickson WA, Rubin G (1993) Effects of man-made mineral fibres in settled dust on sickbuilding syndrome in air conditioned offices. In: Proceedings of Indoor Air 1993.
Hyvärinen A, Sebastian A, Pekkanen J, Larsson L, Korppi M, Putus T, Nevalainen A (2006)Characterizing microbial exposure with ergosterol, 3-hydroxy fatty acids, and viable microbesin house dust: determinants and association with childhood asthma. Arch Environ Occup Health61:149–157.
ISO 16000-1 (2004) Indoor air – general aspects of sampling strategy. International Organizationfor Standardization.
ISO 16000-6, Indoor air – Part 6: Determination of volatile organic compounds in indoor airand test chamber air by active sampling on Tenax TA(R) sorbent, thermal desorption and gaschromatography using MS/FID. International Organization for Standardization.
ISO 16017-1, Indoor, ambient and workpalce air – Sampling and analysis of volatile organiccompounds by sorbent tube/thermal desoption/capillary gas chromatography – Part 1: Pumpedsampling. International Organization for Standardization.
ISO 7730 (2005) Ergonomics of the thermal environment – Analytical determination and inter-pretation of thermal comfort using calculation of the PMV and PPD indices and local thermalcomfort. International Organization for Standardization.
Kanazawa A, Saito I, Araki A, Takeda M, Ma M, Saijo Y, Kishi R (2010) Association betweenindoor exposure to semi-volatile organic compounds and building-related symptoms amongthe occupants of residential dwellings. Indoor Air 20:72–84.
Korpi A (2001) Fungal volatile metabolites and biological responses to fungal exposure. KuopioUniversity Publications C. Nat Environ Sci 129:77 p.
Kosonen R, Virta M, Melikov A (2007) The impact of thermal loads on indoor air flow. In:Proceedings of Clima 2007, paper ID 1149.
Kärkkäinen PM, Valkonen M, Hyvärinen A, Nevalainen A, Rintala H (2010) Determination ofbacterial load in house dust using qPCR, chemical markers and culture. J Environ Monit12:759–768.
Lignell U (2008) Characterization of Microorganisms in Indoor Environments, NationalPublic Health Institute, Department of Environmental Health, Laboratory of EnvironmentalMicrobiology. Academic dissertation, Kuopio.

452 A. Korpi et al.
Lignell U, Meklin T, Putus T, Rintala H, Vepsäläinen A, Kalliokoski P, Nevalainen A (2007) Effectsof moisture damage and renovation on microbial conditions and pupils’ health in two schools –a longitudinal analysis of five years. J Environ Monit 9:225–233.
Meklin T (2002) Microbial Exposure and Health in Schools – Effects of Moisture Damageand Renovation. Publications of national public health institute A13. Academic dissertation,Kuopio.
Meklin T, Putus T, Pekkanen J, Hyvärinen A, Hirvonen M-R, Nevalainen A (2005) Effects ofmoisture-damage repairs on microbial exposure and symptoms in school children. Indoor Air15(Suppl 10):40–47.
Melikov A (2005) Draught discomfort assessment in practice. In: Proceedings of Clima 2005,Paper Nr 20.
Metiäinen P, Mussalo-Rauhamaa H, Viinikka M (2006) TXIB-emission from floor structure andreported symptoms before and after repair. In: Proceedings of Healthy Buildings 2006, Vol. 1:127–130.
Morawska L, Salthammer T, (eds.) (2003) Indoor Environment: Airborne Particles and SettledDust. Weinheim: Wiley-VCH Verlag GmBH & Co, KGaA, p. 467.
Mäkinen-Kiljunen S, Mussalo-Rauhamaa H (2002) Casein, an important house dust allergen.Allergy 57:1084–1085.
Nicolle J, Desauziers V, Mocho P, Ramalho O (2009) Optimization of FLEC-SPME for fieldpassive sampling of VOCs emitted from solid building materials. Talanta 80:730–737.
Norbäck D, Nordström K (2008) Sick building syndrome in relation to air exchange rate, CO2,room temperature and relative air humidity in university computer classrooms: an experimentalstudy. Int Arch Occup Environ Health 82:21–30.
Rintala H (2003) Streptomycetes in Indoor Environments – PCR Based Detection and Diversity,National Public Health Institute, Department of Environmental Health, Laboratory ofEnvironmental Microbiology. Academic dissertation, Kuopio.
Salonen H, Pasanen A-L, Lappalainen S, Riuttala H, Tuomi T, Pasanen P, Bäck B, Reijula K (2009)Volatile organic compounds and formaldehyde as explaining factors for sensory irritation inoffice environments. J Occup Environ Hyg 6:239–247.
Schneider T, Lundqvist GR (1986) Manmade mineral fibres in the indoor, non-industrial environ-ment. Build Environ 21:129–133.
Schneider T, Nielson O, Bredsdorff P, Linde P (1990) Dust in buildings with man-made mineralfiber ceiling boards. Scand J Work Environ Health 16:434–439.
Takki T, Virta M (2007) A systematic method for improving indoor environment quality throughoccupant satisfaction surveys. In: Proceedings of Clima 2007, paper ID 1209.
Toftum J, Melikov A (2000) Human response to air movement, Part 1: Preference and draughtdiscomfort. ASHRAE Project 843-TRP, Technical University of Denmark.
Toftum J, Zhou G, Melikov A (1997) Airflow direction and human sensitivity to draught. In:Proceedings of Clima 2000.
Vallarino J, Spengler JD, Buck R, Dilwali KM (2003) Quantifying synthetic vitreous fiber surfacecontamination in office buildings. AIHA J 64:80–87.
Villberg K, Mussalo-Rauhamaa H, Haahtela T, Saarela K (2008) Prevalence of plastic additives inindoor air related to newly diagnosed asthma. Indoor Built Environ 17:455–459.
Villberg K, Saarela K, Mussalo-Rauhamaa H, Malmberg M, Haahtela T (2002) Correlationbetween VOCs emitted from building materials and diagnosed building related symptoms. In:Proceedings of Indoor Air 2002, 2:207–212.
World Health Organization, WHO (2009) Dampness and Mould. WHO Guidelines for Indoor AirQuality. Copenhagen: WHO Regional Office for Europe, p. 228.

Chapter 25
Sick Building Syndrome from a MedicalPerspective-Symptoms and Signs
Berndt Stenberg
25.1 Introduction
In 1982, the World Health Organization (WHO 1983) expert group defined ‘Sickbuilding syndrome, SBS’ mainly on the basis of reports from the Scandinaviancountries and the US. This definition is still in widespread use and includes thefollowing list of general, mucosal and skin symptoms and signs (Table 25.1).
This definition however, is not an accepted clinical syndrome but rather a list ofsymptoms often perceived by persons working or residing in buildings with indoorair quality problems. Consequently, SBS has been interpreted differently by variousinvestigators. For example, skin symptoms are often excluded by Anglo-Americaninvestigators (Kreiss 1989). Berglund et al. (1992) have suggested criteria for thedefinition of SBS including specific symptoms and signs, and odour or taste sen-sations, combined with requirements for the prevalence of symptomatic inhabitantswithin the building. They specified that the cause must not be exposure to a singleagent. These criteria however have never been validated and have not come intogeneral use.
Table 25.1 Prevalent symptoms reported by occupants of buildings with indoor air qualityproblems (WHO 1983)
Sensation of dry mucous membranes and skin WheezingEye, nose and throat irritation Non-specific hypersensitivityErythema Mental fatigueItching HeadacheHigh frequency of airway infections NauseaCough DizzinessHoarseness
B. Stenberg (B)Department of Public Health and Clinical Medicine, Dermatology and Venereology, UmeåUniversity, SE-901 85 Umeå, Swedene-mail: [email protected]
453S.A. Abdul-Wahab (ed.), Sick Building Syndrome,DOI 10.1007/978-3-642-17919-8_25, C© Springer-Verlag Berlin Heidelberg 2011

454 B. Stenberg
Clinical studies of SBS are sparse; indeed, it is sometimes stated that SBS hasno clinical signs (Welch 1991; Lachapelle 2000). One Swedish study is of partic-ular interest, however, as it is one of very few studies that focuses on reactions inchildren and because it is one of the studies upon which the WHO list of SBS symp-toms is based. At clinical examination dry and erythematous skin on the face andextremities, conjunctivitis and nose symptoms were more frequently found amongchildren in day care centers with indoor air quality (IAQ) problems compared withcontrol buildings (Stockholms-undersökning 1982).
25.2 Symptoms and Signs
In this section we describe the range of symptoms and signs that have been reportedin the literature and discuss any associations. Overall, SBS symptoms appear to bemore prevalent in women than in men; this may be the result of different exposuresor different constitutional and personality traits (Stenberg and Wall 1995; Brascheet al. 2001a).
25.2.1 Skin
In an earlier study of skin reactions in patients referred to a dermatological depart-ment as a result of symptoms perceived in workplace buildings with IAQ problems(Stenberg 1989), facial erythema, rosacea, scaling of scalp, ears and face, urticariaand ‘itching folliculitis’ were most common.
In the first published follow-up study of SBS patients referred to hospital(Edvardsson et al. 2008), the most common skin symptoms noted at the primaryinvestigation in the hospital clinic were facial erythema and body itch. At follow-up,facial erythema was the most common skin symptom.
In their review of skin reactions related to the indoor environment, Ring et al.(2001) discuss findings from the German ProKlimA project, which comparedquestionnaire-reported symptoms with medical observations and measurements ofskin sebum content and the hydration of the stratum corneum. Individuals charac-terised by low sebaceous secretion and/or low stratum corneum hydration reportedsignificantly more skin complaints (Brasche et al. 2001b; 2004).
In a case referent study of SBS, two personal factors were found to be signif-icant risk indicators after adjustment for atopy: photosensitive skin and a strong‘stinger test’ reaction (Stenberg et al. 1994). As the study was cross-sectional itwas not possible to assess which came first, the SBS symptoms or the ‘stinger’reactivity.
25.2.2 Eyes
Dry and irritated eyes are common symptoms in individuals working or living inbuildings with IAQ problems, according to the WHO list referred to in Table 25.1
25 Sick Building Syndrome from a Medical Perspective-Symptoms and Signs 455
(WHO 1983). Eyes problems were investigated in early epidemiological and clini-cal SBS studies. For example, foam formation at the inner eye canthus, which mayreflect the condition of the tear film, has been found to be lower among office work-ers compared with a control population and negatively correlated with symptomsand signs of dryness of the eyes (Franck and Skov 1989). Eye symptoms werestudied in ‘The Danish Town Hall Study’. In people suffering from work-relatedeye symptoms, signs of dryness, such as low Break Up Time (BUT) and cornealerosions, were noted (Franck 1986; Skov et al. 1990).
Since these early studies, eye symptoms and signs have been extensively inves-tigated and reviewed. A model has been suggested in which blink frequency,destabilisation, and break-up of the eye tear film may explain eye symptoms amongoffice workers in terms of occupational, indoor climate and personal risk fac-tors (Wolkoff et al. 2003). Methods for investigating eye symptoms in relation toIAQ factors have also been extensively discussed (Kjaergaard 2001; Rohr 2001).Although blink frequency has been used as an outcome in several experimentalstudies (Klenø and Wolkoff 2004; Klenø et al. 2005) there is good evidence thatBUT is the sign most strongly associated with reported SBS symptoms related tothe eyes (Brasche et al. 2001b; Kjaergaard 2001; Rohr 2001). BUT is a measureof tear film stability and can be measured either by fluorescein staining of the eyeto make visible, and thus enable measurement of the time from a blink until thetear film breaks (Norn 1986), or by recording the time the subject can keep theireyes open without pain, when focussing on a fixed point (self-reported BUT). Thereis a good correlation between self-reported BUT and the standard method (Wyonand Wyon 1987). Because fluorescein itself can have an effect on tear film stabil-ity, a non-invasive tear film break up time (NIBUT) has been developed (Mengheret al. 1985).
Using CO2 as an irritant to determine the threshold for eye irritation, increasedsusceptibility has been found in subjects reporting SBS symptoms (Kjaergaard et al.1992). The same study found that the CO2 threshold was related to skin irritationsensitivity assessed as response to lactic acid smeared on the cheek.
25.2.3 Upper Airways
WHO lists dry mucous membranes and nose irritation as typical SBS symptoms(WHO 1983). Clinical studies of the upper airways in subjects suffering fromSBS symptoms are lacking. Perceived nasal obstruction is a symptom that canresult from inflammation of the nasal mucosa and is often an effect of mucosalswelling. Changes in mucosal swelling and nasal patency can be studied by com-puted tomography, magnetic resonance imaging, rhinostereometry, or acousticrhinometry (Malm 1997). Other functional measures include rhinomanometry andnasal peak flow measurements. The clinical or research question is the decisivefactor in the choice of method.
Acoustic rhinometry is a convenient method to use in environmental studies. Thisapproach has been used in recent studies on the effects of the indoor environmenton the nose. Decreased nasal patency has been observed in subjects in schools with

456 B. Stenberg
low air exchange rates (Wålinder et al. 1998) and low cleaning frequency (Wålinderet al. 1999). Rhinostereometry is a more complicated method, which may explainwhy it has not been widely used in field studies. It can be combined with histaminechallenge to measure nasal hyperreactivity (Hallen and Juto 1993). This method wasused in a study of tenants living in buildings that were identified as being ‘sick’.The tenants were prone to histamine induced hyperreactivity, whether they reportedsymptoms from the upper airways or not (Ohm et al. 1997). This method has alsobeen used to track an exposed population, recording changes in hyperreactivity overtime (Rudblad et al. 2002).
25.2.4 Lower Airways
Even though the WHO list of SBS symptoms (WHO 1983) includes a number oflower airways symptoms (hoarseness, cough, airway infections and wheezing), suchsymptoms are reported less consistently than ocular problems and mucous mem-brane irritation (Mendell 1993; Menzies et al. 1993; Hodgson 1995). Typically,the lower respiratory tract seems unaffected by exposure to inadequate IAQ whenassessed using standard procedures such as spirometry and the methacholine test(Muzi et al. 1998). There are a few exceptions such as a Swedish study whichdemonstrated a decrease in forced vital capacity (FVC) during work among teach-ers in a school where there were problems with damp and mould (Dahlqvist andAlexandersson 1993).
Symptoms of the lower airways are prominent in many studies of the poten-tial health risks associated with building dampness. Other SBS symptoms from theWHO list have not been included in many of these studies. For this reason it is notclear whether the respiratory symptoms in such situations are separate from SBSor just one of a group of symptoms or a syndrome of which only the respiratorysymptoms have been studied. Building dampness studies have been summarised intwo reviews (Bornehag et al. 2001; 2004) which describe evidence that dampnessis a risk factor for respiratory symptoms (cough, wheeze and asthma) in both atopicand non-atopic individuals. These reviews also suggest an association with othersymptoms such as tiredness and headache.
25.2.5 General/Systemic Symptoms and Signs
Although general or systemic symptoms, such as headache and fatigue, may causeanxiety in affected individuals and also be associated with subjective loss ofproductivity, there have been no systematic attempts to characterise such symp-toms (Hodgson 2001). Fatigue, headache and difficulties concentrating are prevalentsymptoms reported by individuals living or working in buildings with IAQ problems(Mendell 1993; Edvardsson et al. 2008) but are also often reported in the generalpopulation (Eriksson and Stenberg 2006). Nausea and dizziness are rarely reportedand the association between IAQ and these symptoms has been questioned in arecent study (Glas 2010).

25 Sick Building Syndrome from a Medical Perspective-Symptoms and Signs 457
25.3 Laboratory Findings
The use of biomarkers in SBS research has been reviewed by Norbäck andWieslander (2002) and Norbäck (2009). Analyses of tear fluid are very rare.There are, however, reports of an increased number of conjunctival polymor-phonuclear leucocytes after exposure to n-decane (Kjaergaard et al. 1989) andincreased albumin content in tear fluid after exposure to a mixture of volatile organiccompounds normally found in buildings (Thygesen et al. 1987).
A number of studies involving analyses of nasal lavage fluid (NAL) have beenundertaken. There are many potential biomarkers, including tryptase, albumin,lysozyme, eosinophilic cationic protein (ECP), and myeloperoxidase (MPO). Otherbiomarkers that have been monitored in NAL include TNF-alpha, IL-1beta, IL-6,IL-8 and prostaglandin E(2). Nitrate and nitrite (as markers of nitric oxide for-mation) and antioxidants have also been measured in NAL. The biomarkersreflect different pathogenic mechanisms of reactions in the mucosa (Norbäck andWieslander 2002).
Most studies of biomarkers in NAL have involved experiments with exposureto single chemicals such as ozone and formaldehyde. Relevant field studies ofbiomarkers associated with IAQ factors are few. Increases in lysozyme and ECP inNAL were recorded in subjects in schools with low cleaning frequency (Wålinderet al. 1999). Increased lysocyme and ECP was also associated with higher indoorlevels of formaldehyde and nitrogen dioxide (Norbäck et al. 2000). In a longitudinalstudy, a move to an office recently painted with water-based paint was related toan increase in lysozyme and ECP in NAL (Wieslander et al. 1999a). There are alsodata indicating that exposure to micro-organisms or building dampness influencesthe nasal mucosa. ECP, MPO and albumin were all increased in subjects in build-ings with pronounced microbial growth in the fabric of the building (Wålinder et al.2001). Dampness in the floor construction of two geriatric hospitals and the presenceof 2-ethyl-1-hexanol in indoor air were both associated with increased lysocyme inNAL (Wieslander et al. 1999b). Teachers in Finland working in a school buildingwhere mould was present had higher levels of TNF-alpha, IL-6 and NO in NALthan did the unexposed controls. The biomarker concentration returned to normallevels (i.e. those recorded in the controls) during the summer vacation (Hirvonenet al. 1999).
Bronchoalveolar lavage (BAL) is not used much in IAQ research probablybecause symptoms associated with the lower airway are not as prominent asupper airway symptoms among those living or working in problem buildings. Anexamination of BAL was undertaken in patients referred to Helsinki UniversityHospital due to symptoms suspected to have been caused by long-term exposureto water damage in the home or workplace. It was concluded that exposure towater damage caused a significant change in the cellular composition of BAL (lym-phocytosis) and a decrease in the number of CD19 cells in blood (Wolff et al.2009).
A non-invasive method for analysing respiratory inflammatory response is tostudy biomarkers in exhaled breath condensate (EBC) (Gibson et al. 2000). In a

458 B. Stenberg
study of workers reporting respiratory conditions in a water-damaged office build-ing, EBC interleukin-8 (IL-8) levels were significantly increased in workers withrespiratory symptoms (Akpinar-Elci et al. 2008).
To date, laboratory analyses of the blood have not contributed much to thediagnosis of SBS, and there are no specific blood tests associated with reportedSBS symptoms. Recently, however, signs of oxidative stress measured as urinary8-hydroxydeoxyguanosine has been found to be related to indoor air pollution (Luet al. 2007a,b).
25.4 Clinical Course/Prognosis
While some reviews have stated that SBS is characterized and even defined by therelief of symptoms when the affected person leaves the building (Welch 1991),others, even among the early descriptions of the syndrome, have pointed out thegradual onset and long duration of symptoms (Akimenko et al. 1986; Redlich et al.1997). There are no studies supporting the statement that SBS symptoms alwaysresolve immediately after exposure ceases. There is, however, evidence for long-lasting symptoms in a study showing slowly decreasing mucosal hyperreactivity,years after the subjects had worked in a school with moisture problems (Rudbladet al. 2002). Other studies show that symptoms persist for at least a proportion ofthose affected. A follow-up study of the prevalence of work-related SBS symptomsamong office workers reported a decrease in symptom prevalence soon after movingto a building with a better ventilation system. Three years later, however, nearly halfof the symptom prevalence remained (Bourbeau et al. 1997). In a follow-up studyof SBS patients, it was shown that symptoms deceased over time. Nearly half of thepatients claimed that symptoms were more or less unchanged after 7 years or more,despite actions taken (Edvardsson et al. 2008).
25.5 Differential Diagnoses
Persistent SBS symptoms such as those in the studies discussed above are some-times attributed to environmental factors other than ‘sick buildings’. Nethercottet al. (1993) are among those who consider persistent SBS symptoms to representmultiple chemical sensitivity (MCS).
Since the 1980s the phenomenon of MCS has attracted great interest and has beendiscussed in numerous publications. Cullen (1987) defines MCS as “an acquireddisorder characterized by recurrent symptoms, referable to multiple organ systems,occurring in response to demonstrable exposure to many chemically unrelated com-pounds at doses far below those established in the general population to causeharmful effects. No single widely accepted test of physiologic function can beshown to correlate with symptoms”. Alternative but similar major diagnostic fea-tures have been suggested. The current knowledge of MCS is extensively reviewedin a textbook (Ducatman 2005), while similarities between SBS and MCS arediscussed by Miller and Ashford (2001).

25 Sick Building Syndrome from a Medical Perspective-Symptoms and Signs 459
Because of the non-specific nature of many symptoms appearing in the officeenvironment, psychological factors are often suggested as causes for the complaints.They may even be used as an excuse for incomplete investigations (Faust andBrilliant 1981). In a textbook of occupational dermatology SBS is described in thefollowing way: “SBS. . . refers to epidemics of subjective symptoms (itching andburning sensations) without any clinically visible signs, which occur in the workenvironment. This situation can be related, for instance, to low relative humidity butmay also represent a mass psychogenic illness” (Lachapelle 2000).
Findings from 19 episodes of probable mass psychogenic illness (MPI) investi-gated by the National Institute for Occupational Safety and Health (NIOSH) havebeen summarised by Boxer (1985). Some symptoms typical of MPI are common toSBS; skin symptoms were, however, not reported. Signs suggestive of MPI, suchas relatively severe symptoms of sudden onset, conversion symptoms and recur-rences in affected individuals when they congregate, make it possible to separatethis phenomenon from real indoor air problems (Boxer 1985).
References
Akimenko VV, Andersen I, Lebowitz MD, Lindvall T (1986) The sick building syndrome.In Berglund B, Berglund U, Lindvall T, Sundell J, (Eds) Indoor air, vol. 6. Evaluations andConclusions for Health Sciences and Technology. Swedish Council for Building Research,Stockholm. D13, pp. 87–97.
Akpinar-Elci M, Siegel PD, Cox-Ganser JM, Stemple KJ, White SK, Hilsbos K, WeissmanDN (2008) Respiratory inflammatory response among occupants of a water-damaged officebuilding. Indoor Air 18:125–130.
Berglund B, Brunekreef B, Knöppel H, Lindvall T, Maroni M, Mølhave L, Skov P (1992) Effectsof indoor air pollution on human health. Indoor Air 2:2–25.
Bornehag CG, Blomquist G, Gyntelberg F, Järvholm B, Malmberg P, Nordvall L, Nielsen A,Pershagen G, Sundell J (2001) Dampness in buildings and health. Nordic interdisciplinaryreview of the scientific evidence on associations between exposure to “dampness” in buildingsand health effects (NORDDAMP). Indoor Air 11:72–86.
Bornehag CG, Sundell J, Bonini S, Custovic A, Malmberg P, Skerfving S, Sigsgaard T, VerhoeffA (2004) Dampness in buildings as a risk factor for health effects, EUROEXPO: a multidisci-plinary review of the literature (1998–2000) on dampness and mite exposure in buildings andhealth effects. Indoor Air 14:243–257.
Bourbeau J, Brisson C, Allaire S (1997) Prevalence of the sick building syndrome symptoms inoffice workers before and six months and three years after being exposed to a building with animproved ventilation system. Occup Environ Med 54:49–53.
Boxer PA (1985) Occupational mass psychogenic illness. History, prevention, and management.J Occup Med 27:867–872.
Brasche S, Bullinger M, Bronisch M, Bischof W (2001b) Eye- and skin symptoms in Germanoffice workers – subjective perception vs. objective medical screening. Int J Hyg Environ Health203:311–316.
Brasche S, Bullinger M, Morfeld M, Gebhardt HJ, Bischof W (2001a) Why do women suffer fromsick building syndrome more often than men? – subjective higher sensitivity versus objectivecauses. Indoor Air 11:217–222.
Brasche S, Bullinger M, Schwab R, Gebhardt H, Herzog V, Bischof W (2004) Comparison ofrisk factor profiles concerning self-reported skin complaints and objectively determined skinsymptoms in German office workers. Indoor Air 14:137–143.
Cullen MR (1987) The worker with multiple chemical sensitivities: an overview. Occup Med StateArt Rev 2:655–661.

460 B. Stenberg
Dahlqvist M, Alexandersson R (1993) Acute pulmonary function impairment in school staffworking in a ‘sick building’: a pilot study. Indoor Environ 2:179–185.
Ducatman AM (2005) Multiple chemical sensitivity. In Rosenstock L, Cullen MR, Brodkin CA,Redlich CA, (Eds) Textbook of Clinical Occupational and Environmental Medicine. (2nd Ed.)Elsevier Saunders, Philadelphia, PA. pp. 867–881.
Edvardsson B, Stenberg B, Bergdahl J, Eriksson N, Lindén G, Widman L (2008) Medical and socialprognoses of non-specific building-related symptoms (sick building syndrome): a follow-upstudy of patients previously referred to hospital. Int Arch Occup Environ Health 81:805–812.
Eriksson NM, Stenberg BGT (2006) Baseline prevalence of symptoms related to indoor environ-ment. Scand J Public Health 34:387–396.
Faust HS, Brilliant LB (1981) Is the diagnosis of “mass hysteria” an excuse for incompleteinvestigations of low-level environmental contaminations? J Occup Med 23:22–26.
Franck C (1986) Eye symptoms and signs in buildings with indoor climate problems (‘office eyesyndrome’). Acta Ophtalmol (Copenh) 64:306–311.
Franck C, Skov P (1989) Foam at the inner eye canthus in office workers, compared with an averageDanish population as control group. Acta Ophtalmol (Copenh) 67:61–68.
Gibson PG, Henry RL, Thomas P (2000) Noninvasive assessment of airway inflammation in chil-dren: induced sputum, exhaled nitric oxide, and breath condensate. Eur Respir J 16:1008–1015.
Glas B (2010) Methodological Aspects of Non-specific Building-related Symptoms Research.Dept of Public Health and Clinical Medicine, Umeå University. Thesis. pp. 44–46.
Hallen H, Juto JE (1993) A test for objective diagnosis of nasal hyperreactivity. Rhinology31:23–25.
Hirvonen MR, Ruotsalainen M, Roponen M, Hyvarinen A, Husman T, Kosma VM, Komulainen H,Savolainen K, Nevalainen A (1999) Nitric oxide and proinflammatory cytokines in nasal lavagefluid associated with symptoms and exposure to mouldy building microbes. Am J Respir CritCare Med 160:1943–1946.
Hodgson M (1995) The sick building syndrome. Occup Med 10:167–175.Hodgson M (2001) Building-related diseases. In Spengler JD, Samet JM, McCarthy JF, (Eds.)
Indoor Air Quality Handbook. McGraw-Hill, New York, NY, 54.1–54.24.Kjaergaard SK (2001) The irritated eye in the indoor environment – physiology, prevalence, and
causes. In Spengler JD, Samet JM, McCarthy JF, (Eds) Indoor Air Quality Handbook. McGraw-Hill, New York. pp. 7.1–17.15.
Kjaergaard S, Mølhave L, Pedersen OF (1989) Human reactions to indoor air pollutants: n-decane.Environ Int 15:473–482.
Kjaergaard S, Pedersen OF, Mølhave L (1992) Sensitivity of the eyes to airborne irritant stimuli:influence of individual characteristics. Arch Environ Health 47:45–50.
Klenø J, Nøjgaard J, Christensen KB, Wolkoff P (2005) The effect on human eye blink frequencyof exposure to limonene oxidation products and methacrolein. Toxicol Lett 156:241–251.
Klenø J, Wolkoff P (2004) Changes in eye blink frequency as a measure of trigeminal stimulationby exposure to limonene oxidation products, isoprene oxidation products and nitrate radicals.Int Arch Occup Environ Health 77:235–243.
Kreiss K (1989) The epidemiology of building-related complaints and illness. Occup Med4:575–592.
Lachapelle JM (2000) Occupational airborne skin diseases. In Kanerva L, Elsner P, Wahlberg JE,Maibach HI, (Eds.) Handbook of Occupational Dermatology. Springer-Verlag, Berlin. p. 193.
Lu CY, Ma YC, Lin JM, Chuang CY, Sung FC (2007a) Oxidative DNA damage estimated by uri-nary 8-hydroxydeoxyguanosine and indoor air pollution among non-smoking office employees.Environ Res 103:331–337.
Lu CY, Ma YC, Lin JM, Li CY, Lin RS, Sung FC (2007b) Oxidative stress associated with indoorair pollution and sick building syndrome-related symptoms among office workers in Taiwan.Inhalat Toxicol 19:57–65.
Malm L (1997) Measurements of nasal patency. Allergy 52:19–23.

25 Sick Building Syndrome from a Medical Perspective-Symptoms and Signs 461
Mendell MJ (1993) Non-specific symptoms in office workers: A review and summary of theliterature. Indoor Air 4:227–236.
Mengher LS, Bron AJ, Tonge SR, Gilbert DJ (1985) A non-invasive instrument for clinicalassessment of the pre-corneal tear film stability. Cur Eye Res 4:1–7.
Menzies R, Tamblyn RM, Farant JP, Hanley J, Nunes F, Tamblyn R (1993) The effect of vary-ing levels of outdoor-air supply on the symptoms of sick building syndrome. N Eng J Med328:821–827.
Miller CS, Ashford NA (2001) Multiple chemical intolerance and indoor air quality. In SpenglerJD, Samet JM, McCarthy JF, (Eds.) Indoor air quality handbook. McGraw-Hill, New York, NY.p. 27.4.
Muzi G, Dell’Omo M, Abbritti G, Accattoli P, Fiore MC, Gabrielli AR (1998) Objective assess-ment of ocular and respiratory alternations in employees in a sick building. Am J Ind Med34:79–88.
Nethercott JR, Davidoff LL, Curbow B, Abbey H (1993) Multiple chemical sensitivities syndrome:toward a working case definition. Arch Environ Health 48:19–26.
Norbäck D (2009) An update on sick building syndrome. Current Opinion in Allergy and ClinicalImmunology 9:55–59.
Norbäck D, Wieslander G (2002) Biomarkers and chemosensory irritations. Int Arch OccupEnviron Health 75:298–304.
Norbäck D, Wålinder R, Wieslander G, Smedje G (2000) Indoor air pollutants in schools, nasalpatency and biomarkers in nasal lavage. Allergy 55:163–170.
Norn MS (1986) Tear film breakup time – A review. In Holly FJ, (Ed.) The Peculiar Tear Film –In Health, Disease, and Contact Lens Wear. Dry Eye Institute. Lubbock, TX. pp. 2–56.
Ohm M, Juto JE, Andersson K, Bodin L (1997) Nasal histamine provocation of tenants in a sick-building residential area. Am J Rhinol 11:167–175.
Redlich CA, Sparer J, Cullen MR (1997) Sick-building syndrome. Lancet 349:1013–1016.Ring J, Eberlein-König B, Behrendt H (2001) Environmentally induced skin disorders. In Spengler
JD, Samet JM, McCarthy JF, (Eds.) Indoor Air Quality Handbook. McGraw-Hill, New York,NY. pp. 8.1–28.12.
Rohr AC (2001) Methods for assessing irritation effects in IAQ field and laboratory studies.In Spengler JD, Samet JM, McCarthy JF, (Eds) Indoor Air Quality Handbook. McGraw-Hill,New York. pp. 6.1–26.30.
Rudblad S, Andersson K, Stridh G, Bodin L, Juto JE (2002) Slowly decreasing mucosalhyperreactivity years after working in a school with moisture problems. Indoor Air 12:138–144.
Skov P, Valbjørn O, Pedersen BV (1990) The Danish indoor climate study group. Influence ofindoor climate on the sick building syndrome in an office environment. Scand J Work EnvironHealth 16:363–371.
Stenberg B (1989) Skin complaints in buildings with indoor climate problems. EnvironInternational 15:81–84.
Stenberg B, Eriksson N, Höög J, Sundell J, Wall S (1994) The sick building syndrome (SBS)in office workers. A case referent study of personal, psychosocial and building-related riskindicators. Int J Epidemiol 23:1190–1197.
Stenberg B, Wall S (1995) Why do women report “sick building symptoms” more often than men?.Soc Sci Med 40:491–502.
Stockholms-undersökning (1982) Barn på problemdaghem har oftare hud- och ögonsymtom.(Stockholm investigation. Children in problem day care centres have skin and eye symptomsmore often) Läkartidningen (Lakartidningen) 79:4544–4545 (In Swedish).
Thygesen JE, Bach B, Mølhave L, Pedersen OF, Prause JU, Skov P (1987) Tear fluid electrolytesand albumin in persons under environmental stress. Environ Res 43:60–65.
Wålinder R, Norbäck D, Wieslander G, Smedje G, Erwall C, Venge P (1998) Nasal congestionand biomarkers in nasal lavage – the significance of air exchange rate and type of ventilation inschools. Int Arch Occup Environ Health 71:479–486.
462 B. Stenberg
Wålinder R, Norbäck D, Wieslander G, Smedje G, Erwall C, Venge P (1999) Nasal patency andlavage biomarkers in relation to settled dust and cleaning routines in schools. Scand J WorkEnviron Health 25:137–143.
Wålinder R, Wieslander G, Norbäck D, Wessen B, Venge P (2001) Nasal lavage biomarkers:the effect of water damage and microbial growth in an office building. Arch Environ Health56:30–36.
Welch LS (1991) Severity of health effects associated with building-related illness. Environ HealthPerspect 95:67–69.
WHO (1983) Indoor Air Pollutants: Exposure and Health Effects, EURO Reports and Studies 78.World Health Organization, Copenhagen.
Wieslander G, Norbäck D, Nordström K, Wålinder R, Venge P (1999b) Nasal and ocular symp-toms, tear film stability, and biomarkers in nasal lavage, in relation to building dampness andbuilding design in hospitals. Int Arch Occup Environ Health 72:451–461.
Wieslander G, Norbäck D, Wålinder R, Erwall C, Venge P (1999a) Inflammation markers in nasallavage, and nasal symptoms in relation to relocation to a newly painted building: a longitudinalstudy. Int Arch Occup Environ Health 72:507–515.
Wolff H, Mussalo-Rauhamaa H, Raitio H, Elg P, Orpana A, Piilonen A, Haahtela T (2009) Patientsreferred to an indoor air health clinic: exposure to water-damaged buildings causes an increaseof lymphocytes in bronchoalveolar lavage and a decrease of CD19 leucocytes in peripheralblood. Scan J Clin Lab Invest 69:537–544.
Wolkoff P, Skov P, Franck C, Petersen LN (2003) Eye irritation and environmental factors in theoffice environment – hypotheses, causes and a physiological model. Scand J Environ Health29:411–430.
Wyon NM, Wyon DP (1987) Measurement of acute response to draught in the eye. Acta Ophtalmol65:385–392.

Chapter 26
Improvement of the Illumination LevelsCombined with Energy Savings for a ResidentialBuilding
Sabah A. Abdul-Wahab and Syed Uzair Ahmed
26.1 Introduction
Lighting is related to both general satisfaction in the indoor environment and thecomfort of visual performance (Drahonovska 2005). Poor lighting design can causehealth problems and is likely to irritate, distract, and produce lethargy. Inadequatelighting can affect the mental performance of occupants (Mendell et al., 2002). Thismay contribute to building-related illness, which have clearly identifiable causes,or to other adverse health effects. As the eyes are the most important working toolacross a wide spectrum of jobs and professions, then they have to function in anappropriate lighting environment (Drahonovska 2005). Eye work under inappropri-ate lighting can be a very obvious cause of sick building syndrome (SBS), producingeye discomfort, eye strain and fatigue (Morris and Dennison 1995; Drahonovska2005).
World Health Organization (1983) has defined SBS as a medical condition inwhich people in a building suffer from symptoms of illness or feeling unwell forno apparent reason. The symptoms of SBS are causing discomfort and a sense ofbeing unwell rather than a distinct illness. While specific causes of SBS remainstill unknown, it is often attributed to the poor indoor air quality (Jones 1999).The most common symptoms of SBS are sore throat, fatigue, lethargy, dizziness,lack of concentration, respiratory irritation, headaches, eye irritation, sinus conges-tion, dryness of the skin (face or hands), and other cold, influenza, and allergy typesymptoms (Spengler and Chen 2001). These symptoms may occur singly or in com-bination with each other. Mendell et al. (1996) reviewed the findings of 32 studiesconducted between 1984 and 1992 that considered 37 factors potentially related tooffice worker symptoms. He prepared a summary of reported relationships betweensymptom prevalence and environmental measurements, building factors, workplacefactors, and job or personal factors.
S.A. Abdul-Wahab (B)Mechanical & Industrial Engineering Department, College of Engineering, Sultan QaboosUniversity, Muscat, Sultanate of Omane-mail: [email protected]
463S.A. Abdul-Wahab (ed.), Sick Building Syndrome,DOI 10.1007/978-3-642-17919-8_26, C© Springer-Verlag Berlin Heidelberg 2011

464 S.A. Abdul-Wahab and S.U. Ahmed
The symptoms of SBS lead to increase employee sick days and reduce the per-formance of occupants in buildings (Fisk 2000; Mendell et al., 2002). Wallaceet al. (1993) pointed out that SBS symptoms may have a greater impact on pub-lic health and cost to the economy than some major diseases due to widespreadabsenteeism and lowered productivity amongst affected people. For example, it hasbeen estimated that the annual cost of headaches amongst the employees of the USEnvironmental Protection Agency may be as high as $2 million (Jones 1999). Fisk(2000) estimated potential annual savings for the United States between $43 and$258 billion. Other studies have reported similarly high economic costs (Mendellet al., 2002; Seppänen 1999; Brightman et al., 2008).
The installation of appropriate lighting levels was found to reduce the incidenceof SBS. Sterling et al. (1983) noted a reduction in eye symptoms by varying both thequantity of ultraviolet light and the ventilation. Wilkins et al. (1989) noted a decreaseof the incidence of eye-strain and headache by more than 50% in a group of officeworkers by using solid state high frequency ballast which resulted in illuminationwith a reduced fluctuation. It is also possible that visual stress plays a part in thedevelopment of eye irritation and headache, for example through the lighting level,insufficient contrast, excessive brightness and glare.
Occupant’s satisfaction with lighting may vary with illuminance and with thecharacteristics of the lighting system (Katzev 1992). In any given office environ-ment, occupants should be able to see easily, comfortably and accurately. Theillumination level required to achieve these results will vary, depending on the givenactivity taking place and the characteristics of the occupant. For most spaces andenvironments, the perceived quality of light in any situation depends on the type ofactivity or task being undertaken, the age and eyesight of workers, and the visualdifficulty of the task being carried out. Conventional white fluorescent lighting islikely to cause eyestrain and headaches (Wilkins et al., 1988; 1989; London HazardsCentre 1990). Inadequate illumination, glare, flicker and lack of contrast can alsocause tiredness, dry and gritty eyes and headaches (Vince 1987).
Several reports have claimed that the ultraviolet light emission from fluores-cent lamps can react with various pollutants in the air creating a photochemicalsmog which acts as a toxic irritant (Wilkins et al., 1989; Stone 1992). However,Morris and Dennison (1995) pointed out that more research is needed to ascer-tain whether ultraviolet light emission has any role to play in sick buildingsyndrome.
The quality of the indoor environment depends significantly on several aspectsof lighting (Veitch and Newsham 1998) including the illuminance (intensity of lightthat impinges upon a surface), the amount of glare, and the spectrum of the light(Veitch and Newsham 1998; Fisk 2001). There is evidence that a decrease in theamount of flicker in light, i.e., the magnitude of the rapid cyclic change in illu-minance over time, may be associated with a decrease in headache and eyestrain(Wilkins et al., 1989) and with an increase in worker performance (Veitch andNewsham 1998). Lighting characteristics influence the quality of vision, and canhave psychological influences on mood and on perceptions about the pleasantnessof a space (Tiller 2001).

26 Improvement of the Illumination Levels Combined with Energy Savings 465
In general, lighting levels in offices need to be of a quality that provides an envi-ronment in which it is easy to see, so that tasks can be safely performed withouteyestrain (Brown 2006). During typical working hours, lighting inside offices tendsto rely on a combination of both daylight from windows and an artificial light-ing. The quality of artificial indoor lighting is a function of the types, locationsand number of luminaires, and the optical characteristics of indoor surfaces, suchas their spectral reflectivity and color (International Performance Measurement &Verification Protocol 2001). It is important to note that the greatest scope forincreased productivity lies with improvement in lighting quality rather than in theprovision of higher illuminances. As a general rule, the lighting system shouldbe designed and installed to effectively reveal the task(s) and to provide safe andcomfortable visual environments (Cooperative Research Centre for ConstructionInnovation 2008).
Artificial light is generated through the conversion of electrical energy intovisible radiation. In office buildings, artificial lighting is considered the secondmajor consumer of electricity after air-conditioning. According to Krarti (2003),30–50% of the electricity consumption in office buildings is used to provide lighting.Moreover, heat generated by lighting contributes to additional thermal loads thatneed to be removed by the cooling equipment. Therefore, any reduction in thelighting systems will be significant (Al-Nakib 2003). By having an understandingof the lamps, ballasts, luminaries and control options available today as well asthe techniques used to develop efficient lighting, lighting can be produced so thatit is energy efficient, cost effective and yields a better quality of light (Ali et al.,2009).
Lighting design should respect the size, height and depth of a room, the num-ber of desks or workplaces, the type of work, color and surface quality and thegeographical orientation of the building (especially windows). The choice of themain components of lighting design (both sources and system) strongly dependson these variables (Drahonovska 2005). There are many organizations that pub-lish recommended-practice documents, codes, and standards that attempts to codifygood lighting practice. Organizations that have a role in regulating lighting prac-tice around the world, along with their internet website address and self-describedmandate can be found in Tiller (2001).
In recent years, there have been many new developments in the lighting indus-try, in both technological equipment and approaches to lighting design (Ali et al.,2009). One objective of these technological developments in the lighting industryhas been the improvement potential in lighting efficiency, thus a reduction in energyconsumption and costs. Various technologies used in this regards are listed by Aliet al. (2009).
Even in university offices, housing and laboratories, complaints are often voicedregarding the poor quality of lightening. Faculty and students have observed thatintensity of the light affects their activities and may make the environment uncom-fortable. Due to these reasons, residents of faculty and student houses are in needof efficient and comfortable lighting environment to provide a better working andliving indoor environments.
466 S.A. Abdul-Wahab and S.U. Ahmed
In this chapter, DIALux lighting software was selected to study the improvedillumination level and energy saving for a selected faculty house in the SQU campus.This was done with the support of Philips lighting equipments saved in DIALuxdatabase. The proposed lighting system will provide a comfortable environment aswell as an efficient lighting system for the people living in the house.
26.2 Linkage Between Lighting and Human Performance
The quality of lighting in a space is a key element in the comfort, health, and produc-tivity category of green building. Effective lighting can enhance the mood, energy,and effectiveness of people using the space. Light also affects people’s circadianrhythms, an important factor in maintaining health sleep cycles (Armstrong andWalker 2006).
National Electrical Manufacturers Association (NEMA 1989) pointed out thatlighting has at least the theoretical potential to influence performance directly,because work performance depends on vision, and indirectly, because lighting maydirect attention, or influence arousal or motivation. Several characteristics of light-ing (e.g., illuminance, amount of glare, and the spectrum of light) may theoreticallyaffect work performance (Fisk 2001).
It is expected that performance of work that depends very highly on excel-lent vision, such as difficult inspection of products, will vary with lighting levelsand quality. The published literature, while limited, is consistent with this expecta-tion. For example, Fisk (2001) mentioned that Romm (1994) reports a 6% increasein the performance of postal workers during mail sorting after a lighting retrofitthat improved lighting quality and also saved energy. A review of the relationshipbetween lighting and human performance (NEMA 1989) provides additional exam-ples, such as more rapid production of drawings by a drafting group after brightreflections were reduced.
26.3 DIALux Lighting Software
DIALux is lighting design software that can be used to design technical lightingand lighting planning. It can be applied for the professional lighting calculations todetermine all the lighting parameters for indoor and outdoor lighting systems forvarious environments. The software can provide clear and precise results accordingthe latest regulations in the indoor architecture field. It allows applying textures andworking with a wide range of furniture, which can be simply modified and saved fora future project.
The software was developed by the DIAL-German Institute of Applied LightingTechnology. It includes the product information of all the lighting companies in itsdatabase. The program provides the lighting designers the opportunity of limitlessdesign. The program includes the products of all the lamp producers in its database

26 Improvement of the Illumination Levels Combined with Energy Savings 467
to permit its use by all lighting designers and to provide different points of view(Ekren et al., 2007).
There are many versions of the DIALux program. DIALux includes the arma-ture and lamp information from many companies, such as Philips, Osram, SURYA,AEG, Endo, Dextra, Simes, Luxonic, SEAE in its database (Ali et al., 2009). Hence,the program helps to measure the necessary lighting level and finds out the numberand type of the armature.
Being a simulation program, DIALux supports many room shapes, such as rect-angular, square, polygon, L shaped or the shapes designed by the user, and allowsthe user to choose from among those shapes. The program, which supports the addi-tion of more than one piece of furniture to the place, also takes into considerationfactors such as lighting level, reflection and glitter which can be seen on the furniture(Ekren et al., 2007).
To run DIALux software, the following data are required:
1. Space data (i.e., width, length, height)2. LUX of the space
Then the redesign of the lighting system is achieved through:
1. Power consumed by the selected luminaire.2. Number of luminaires and their locations.
26.4 Materials and Methods
26.4.1 Procedure
The exiting lighting system for each space of the house is first calculated. TheDIALux software is then run for each space of the house. For each space, theredesigning of the lighting system is tested with different luminars. The redesigningof the lighting system is repeated until obtaining the lighting system that com-plies with allowable LPD value and at the same time fulfilling the recommendedilluminance level for that space. Therefore, the following two points are takeninto account when higher efficient lighting systems and lower energy cost arerequired:
• Increasing the lux level to reach the required standards.• Reducing energy consumption for the lighting system that complies with allowed
LPD value.
For example, in the case of dining rooms, the DIALux software is run with the targetof 200 lx (i.e., recommended lighting intensity for dining rooms). The redesigningof the system will be examined with different luminars until the lighting system that

468 S.A. Abdul-Wahab and S.U. Ahmed
complies with allowed LPD value for the dining room (1.105 W/m2) is obtainedand at the same time fulfilling the recommended lighting requirement for the space(200 lx).
26.4.2 Description of the Test House
The test house under consideration is a two-story building that was constructed in1986. The ground level consists of a kitchen, dining room, bathroom, store and aliving room. The top level contains three bed rooms and two bathrooms. The floorplan of ground floor is shown in Fig. 26.1, whereas the floor plan of first floor isshown in Fig. 26.2. Although the building includes car parking area, bathrooms andstaircase area where the lighting equipments are installed, they were not consideredin the redesigning effort since residents do not stay in them for a prolonged time. Thearea of each spaces considered in this chapter is calculated and shown in Table 26.1.
26.5 Results
The existing lighting system throughout the house generally consists of tungstentube luminaires of 60 W rating (Table 26.2). The on/off switching is operated manu-ally from wall-mounted switches in each room. The existing lighting power densities(LPD) for each space in the house under consideration are calculated and shown inTable 26.2. It can be seen that the kitchen is lit by luminaires with two 60 W tung-sten lamps and by luminaires with 2 ft fluorescent lamps, each consumes 10 W. Thetotal power consumption is 140 W.
In the living room, there are 3 luminaries. They are tungsten bulb type, eachconsumes 60 W. The total power consumption is 180 W. In the dining room, thereare 2 luminaries. They are tungsten bulb type, each consumes 60 W. The total powerconsumption is 120 W.
The existing lighting system of the 3 bed rooms is similar to that of the diningroom. The existing total lighting loads of all spaces of the house are 800 W. TheLPD (Watt/ft2) for each room/space was calculated based on the total area of thespace and total power consumption.
Working on a green building project from lighting perspective also needs thecompliance of standards. According to ASHRAE/IESNA Standard 90.1-2004 acomplete, hardwired lighting system, to be efficient, should be installed with thelighting power density (LPD) requirements shown in Table 26.3. Comparison ofthe calculated LPD with the LPD allowance for the various spaces of the houseis also given in Table 26.3. Looking at Table 26.3, it can be seen that the exist-ing LPD values for kitchen, dining and living rooms are less than the allowableLPD. However, the house residents expressed the feeling that the light intensity inthese spaces is not adequate. Hence, the lighting systems do not fill the spaces luxrequirement.

26 Improvement of the Illumination Levels Combined with Energy Savings 469
Fig. 26.1 Floor plan of ground floor

470 S.A. Abdul-Wahab and S.U. Ahmed
Fig. 26.2 Floor plan of first floor
As for the three bedrooms, the calculated LPD is greater than the LPD allowance.Thus, the lighting systems for all the spaces of the house required to be redesigned.The redesigned system should not only fulfill the Lux requirements for eachspace but also operate under the allowed LPD limits. Redesigning includes the

26 Improvement of the Illumination Levels Combined with Energy Savings 471
Table 26.1 Area of the various spaces of the house
No. Space Dimensions Area
1. Kitchen 3.80 m ×3.72 m 14.136 m2 (152.2 ft2)2. Dining room 3.80 m ×3.72 m 14.136 m2 (152.2 ft2)3. Living room 3.72 m ×5.52 m 20.534 m2 (221.03 ft2)4. Bed room (1.08) 3.10 m ×3.72 m 11.532 m2 (124.13 ft2)5. Bed room (1.12) 3.10 m ×3.72 m 11.532 m2 (124.13 ft2)6. Master bed room 3.72 m ×4.105 m 15.27 m2 (164.37 ft2)
Height of each space is 2.81 m
Table 26.2 Type of existing luminaire together with the calculation of the existing lighting powerdensity
No. SpaceNo. ofluminaire Type of luminaire
Total powerconsumptionW
Area ofspaceft2
LPDa
(Calculated)W/ft2
1. Kitchen 4 2 Tungstenbulb type,each consumes 60 W
2 one feet fluorescenttube lamps,Each consumes 10 W
140 152.2 0.92
2. Dining room 2 2 Tungstenbulb type,each consumes 60 W
120 152.2 0.79
3. Living room 3 They are tungstenbulb typeeach consumes 60 W
180 221.03 0.81
4. Bed room(1.08)
2 They are tungstenbulb typeeach consumes 60 W
120 124.13 0.97
5. Bed room(1.12)
2 They are tungstenbulb typeeach consumes 60 W
120 124.13 0.97
6. Master bedroom
2 They are tungstenbulb typeeach consumes 60 W
120 164.37 0.73
Total lightingload
800
LPDa is the lighting power density = (Total power consumption/Area of the space)
consideration of better luminary and its right placement so that required lightinglevel could be achieved with minimum number of luminaries. To this effect, theDIALux software is used to redesign the lighting system according to the rec-ommended lighting intensity (LUX). The recommended lighting intensity valuesdepend on the type of the space as shown in Table 26.3.
When redesigning the lighting system for the spaces of the house, the first ques-tion to be addressed is “What lighting levels are needed?”. Luminous flux of a light

472 S.A. Abdul-Wahab and S.U. Ahmed
Table 26.3 Comparison of the calculated LPD with the LPD allowance for the various spaces ofthe house
No. SpaceCalculated LPDW/ft2
Allowable LPD(before reduction)W/ft2
Allowable LPD(after 15%reduction)c
W/ft2
1. Kitchen 0.92 2.0a 1.72. Dining room 0.79 1.3a 1.1053. Living room 0.81 1.09b 1.14. Bed room (1.08) 0.97 0.5b 0.55. Bed room (1.12) 0.97 0.5b 0.56. Master bed room 0.73 0.5b 0.5
aValues are taken from: http://nyserda.org/sclp2/technicalguide/design/targets.aspbValues are taken from: http://lpd.ies.org/cgi-bin/lpd/lpdhome.pl or http://lpd.ies.org/cgi-bin/lpd/ShowSpaceTypes.plcThis reduction is used for the optimization of energy performance for lighting power
Table 26.4 Allowable LPD with the recommended LUX levels for the various spaces ofthe house
No. Space
Allowable LPD(after 15% reduction)W/ft2
RecommendedLUX levelsa
lumens/ft2 or lx
1. Kitchen 1.7 500, 300 (gen)2. Dining room 1.105 2003. Living room 1.1 500, 100 (gen)4. Bed room (1.08) 0.5 505. Bed room (1.12) 0.5 506. Master bed room 0.5 50
aBoer and Fischer (1978)
source incident per unit area of a surface and measured in Lux (lx) is referred to asLighting Level. The recommended lighting levels (lx) with respect to space typesare shown in Table 26.4. These values were given in the IESNA Handbook and inmany other lighting books.
The change in LPD values requires redesigning of the lighting system of eachspace. Redesigning includes the consideration of better luminary and its right place-ment so that required lighting level could be achieved with minimum number ofluminaries. Each space of the building is considered and redesigned separately. Theresults of the redesigning by using the DIALux software are shown in Table 26.5.
It can be seen that the redesigning reduced the LPD values as required in com-pliance with the ASHRAE Standard. Based on these results, a comparison of theredesigned LPD and he existing LPD resulted in the reduction of lighting powerconsumption by 34.15% (526.5 W compared to 800 W). Details of the reduction

26 Improvement of the Illumination Levels Combined with Energy Savings 473
Tab
le26.5
Res
ults
ofth
eD
IAL
uxso
ftw
are
No.
Spa
ceT
otal
piec
esD
esig
nati
onP
ower
per
piec
eW
Tot
alpo
wer
W
Des
igne
dL
PD
W/f
t2
1.K
itch
enA
rea
=15
2.2
ft2
72
Phi
lips
cent
ura
2T
CS
160
1xT
L-D
58W
/840
CO
NL
1(1
.000
)4
Phi
lips
eWco
vepo
wer
core
BC
X41
01x
5-L
ED
-HB
/NW
-420
0(1
.000
)1
Phi
lips
X-t
endo
ligh
tT
CS
398
SI
1xT
L-D
36W
/840
CO
NM
2-A
(1.0
00)
66.5
4.5
42.5
193.
51.
27
2.D
inin
gro
omA
rea
=15
2.2
ft2
4P
hili
psar
ano
TW
S64
01x
TL
5-24
W/8
40H
FA
C-M
LO
(1.0
00)
28.0
112.
00.
74
3.L
ivin
gro
omA
rea
=22
1.03
ft2
2P
hili
psce
ntur
a2
TC
S16
01x
TL
-D36
W/8
40C
ON
L1
(1.0
00)
42.5
85.0
0.38
4.B
edro
om(1
.08)
Are
a=
124.
13ft
21
Phi
lips
fine
ssT
CS
198
1xT
L-D
36W
/840
CO
NL
1(1
.000
)
42.5
42.5
0.34
5.B
edro
om(1
.12)
Are
a=
124.
13ft
21
Phi
lips
fine
ssT
CS
198
1xT
L-D
36W
/840
CO
NL
1(1
.000
)
42.5
42.5
0.34
6.M
aste
rbe
dro
omA
rea
=16
4.37
ft2
2P
hili
psX
-ten
doli
ght
TC
S39
8W
H1x
TL
-D18
W/8
40C
ON
L1
(1.0
00)
25.5
51.0
0.31
Des
igne
dto
tal
pow
erco
nsum
ptio
n
526.
5

474 S.A. Abdul-Wahab and S.U. Ahmed
Table 26.6 Comparison between the existing LPD and designed LPD together with the allowableLPD and designed lux
No. SpaceExisting LPDW/ft2
DesignedLPDW/ft2
Allowable LPD(after 15%reduction)W/ft2 Designed lux
1. Kitchen 0.92 1.27 1.7 5002. Dining room 0.79 0.74 1.105 2003. Living room 0.81 0.38 1.1 1004. Bed room (1.08) 0.97 0.34 0.5 505. Bed room (1.12) 0.97 0.34 0.5 506. Master bed room 0.73 0.31 0.5 50
in LPD values for each of the spaces are shown in Table 26.6. Comparison is alsomade with the allowable LPD and the designed lux values.
LPD and lux values for each of the individual rooms were obtained as follows:
1. Kitchen: Seven pieces were used with a total power of 193.5 W (Table 26.5).They produced a designed LPD of 1.27 W/ft2 which is lower than allowableLPD (1.7 W/ft2). The associated design lux is 500.
2. Dining room: Four pieces were used with a total power of 112.0 W (Table 26.5).They produced a designed LPD of 0.74 W/ft2 which is lower than allowable LPD(1.105 W/ft2). The associated design lux is 200.
3. Living room: Two pieces were used with a total power of 85.0 W (Table 26.5).They produced a designed LPD of 0.38 W/ft2 which is lower than allowable LPD(1.1 W/ft2). The associated design lux is 100.
4. Bed rooms (1.08 and 1.12): For each bedroom, one piece was used with a totalpower of 42.5 W (Table 26.5). It produced a designed LPD of 0.34 W/ft2 for eachroom which is lower than allowable LPD (0.5 W/ft2). The associated design luxis 50 for each bedroom.
5. Master bed room: Two pieces were used with a total power of 51.0 W(Table 26.5). It produced a designed LPD of 0.31 W/ft2 which is lower thanallowable LPD (0.5 W/ft2). The associated design lux is 50.
The IsoLux maps for each space are given in Figs. 26.3-26.7. The red elementshown in these figures shows the lighting equipment position. The gradients withdifferent numbers along them represents the IsoLux lines along which the value ofLux is constant but the lux values changes as we move to another line. The numbersalong the lines outside the space is the scale representing the dimensions of theroom. The scale is read in meters.
Figure 26.3 shows the Isolux map for kitchen. For kitchen, it was required tomaintain the value of 500 lx. Although the lux values are not 500 throughout thespace, it was tried to maintain the required Lux in the working region (i.e., in thecenter region) where main kitchen related activities are performed.

26 Improvement of the Illumination Levels Combined with Energy Savings 475
Fig. 26.3 Isolux lines forkitchen
Fig. 26.4 Isolux lines fordining room
Figure 26.4 shows the isolux map for dining room. In this space, the workingarea is limited by setting its boundary 0.5 m away from the walls. This was donebecause the working area in this room is the area over the dining table which cen-tered over the room floor. In this room, it was required to maintain 200 lx. It canbe seen from the map that the required working area is maintaining the requiredLux value.
Figure 26.5 illustrates the isolux map for living room. For living room there aretwo requirements for Lux values: 100 lx and 500 lx. The selection of the requiredvalue depends on the use of the space. For example, if the living room is being usedfor just sitting and resting purpose, then 100 lx is enough. On the other hand, if theliving room is used as studying, then the value of 500 lx should be maintained. In the

476 S.A. Abdul-Wahab and S.U. Ahmed
Fig. 26.5 Isolux lines for living room
Fig. 26.6 Isolux lines for bedroom 1.05 and 1.02
studied house, the living room is used for just sitting. Looking at Fig. 26.5, it canbe observed from the map that the maintained lux value is greater than the requiredvalue while being in the allowed LPD value (100 lx).
Figures 26.6 and 26.7 represent the isolux maps for the three bed rooms. The twobed rooms 1.05 and 1.02 are same in size therefore the lighting system design for

26 Improvement of the Illumination Levels Combined with Energy Savings 477
Fig. 26.7 Isolux lines formaster bed room
the two is exactly the same (Fig. 26.6). Bed room 1.11 is a little larger in size soits lighting system design is different (Fig. 26.7). However, the requirement of Luxvalues and the allowed LPD values for all the three bed rooms are same because ofbeing of the same type. The required Lux value here is 50 lx. It can be seen that thisvalue is maintained in all the bed rooms while being in the allowed LPD values.
26.6 Conclusions
The study was undertaken to assess the design and actual performance of lighten-ing in a typical house in Muscat. The study also aimed at attempting to increasethe lighting quality and to decrease the electricity consumption in an existing res-idential house at the campus of Sultan Qaboos University. It has been shown thatexisting lighting system of the spaces of the house may be redesigned with the helpof DIALux lighting program.
In this case, improvements were made to the luminaires themselves which hadresulted not only in better lighting quality but also in reduced electricity con-sumption. Power consumption was 800 W for the existing lighting system. Theimprovements resulted in considerable savings in the electricity used for lightingpurposes. The power consumption for the proposed lighting system is 526.5 W,which represents a power reduction of almost 34% in lighting. Other than energysaving, improvement in the lux illumination level is also achieved.
Verification of the results of modeling and testing the accuracy of the modelis required. This can be carried out by actual installation of equipment andmeasurement of the lux values.

478 S.A. Abdul-Wahab and S.U. Ahmed
References
AL-Nakib D (2003) Energy conservation measures for lighting systems in office buildings. In:Akbari H, Assem EAO (eds.) Proceedings of Energy Conservation in Buildings Workshop,December 13–17, 2003, Kuwait.
Ali NAM, Fadzil SFS, Mallya BL (2009) Improved illumination levels and energy savings byuplamping technology for office buildings. Int Assoc Comp Sci Info Technol, 598–603.
Armstrong J, Walker A (2006) Health, comfort, & productivity, Chapter 5. In: Green Buildings:Project Planning & Cost Estimating, United States America.
Boer JB, Fischer D (1978) Interior Lighting. Kluwer Technische Boeken B.V.-Deventer-Antwerpen.
Brightman HS, Milton DK, Wypij D, Burge HA, Spengler JD (2008) Evaluating building-relatedsymptoms using the US EPA BASE study results. Indoor Air 18(4):335–345.
Brown SK (2006) High Quality Indoor Environments for Office Buildings. CSIRO Manufacturing& Infrastructure Technology, Australia.
Cooperative Research Centre for Construction Innovation (2008) Design guidelines for deliveringhigh quality indoor Environment. Final report, Task 2, Research Project No:2003-028-B-01,Australia.
Drahonovska H (2005) Light and lighting, chapter 3. In: Rostron J, (ed) Sick Building Syndrome:Concepts, Issues and Practice. Taylor & Francis e-Library, E & FN SPON, Chapman & Hall,London.
Ekren N, Dursun B, Aykut E (2007) Lighting computer programs in lighting technology. J Sci21(1):15–20.
Fisk WY (2000) Health and productivity gains from better indoor environments and theirrelationship with building energy efficiency. Annu Rev Energy Environ 25:537–566.
Fisk WJ (2001) Estimates of potential nationwide productivity and health benefits from betterindoor environments: an update, chapter 4. In: Spengler JD, Samet JM, McCarthy JF, (eds.)Indoor Air Quality Handbook. McGraw-Hill.
International Performance Measurement & Verification Protocol (2001) Concepts and practices forimproved indoor environmental quality, Volume II. Office of Energy Efficiency and RenewableEnergy, US Department Of Energy.
Jones AP (1999) Indoor air quality and health. Atmos Environ 33(28):4535–4564.Katzev R (1992) The impact of energy efficient office lighting systems on satisfaction and
productivity. Environ Behav 24:778–797.Krarti M (2003) Energy efficient lighting technologies. In: AkbariH, Assem EAO (eds.)
Proceedings of Energy Conservation in Buildings Workshop, December 13–17, 2003, Kuwait.London Hazards Centre (1990) Sick Building Syndrome: Causes, Effects and Control. London
Hazards Centre Trust, London.Mendell MJ, Fisk WJ, Deddens JA, Seavey WG, Smith AH, Smith DF, Hodgson AT, Daisey JM,
Goldman LR (1996) Elevated symptom prevalence associated with ventilation type in officebuildings. Epidemiology 7(6):583–589.
Mendell MJ, Fisk WJ, Kreiss K, Levin H, Alexander D, Cain WS, Girman JR, Hines CJ, JensenPA, Milton DK, Rexroat LP, Wallingford KM (2002) Improving the health of workers in indoorenvironments: priority research needs for a national occupational research agenda. Am J PublicHealth 92(9):1430–1440.
Morris A, Dennison P (1995) Sick building syndrome: survey findings of libraries in great britain.Lib Management 16(3):34–42.
NEMA (1989) Lighting and Human Performance: A Review. National Electrical ManufacturersAssociation, Washington, D.C.
Romm JJ (1994) Lean and Clean Management. Kodansha America, Inc., New York, NY.Seppanen OA (1999) Association of ventilation rates and CO2 concentrations with health and other
responses in commercial and institutional buildings. Indoor Air 9(4):226–252.
26 Improvement of the Illumination Levels Combined with Energy Savings 479
Spengler JD, Chen Q (2001) Indoor air quality factors in designing a healthy building. Annu RevEnergy Environ 25:567–600.
Sterling E, Sterling T, Mclntyre D (1983) New health hazards in sealed buildings. Am InstArchitects J 72:64–67.
Stone PT (1992) Fluorescent lighting and health. Lighting Res Technol 24(2):55–61.Tiller DK (2001) Lighting recommendations, chapter 18. In: Spengler JD, Samet JM, McCarthy
JF, (Eds.) Indoor Air Quality Handbook. McGraw-Hill, USA.Veitch JA, Newsham GR (1998) Lighting quality and energy-efficiency effects on task perfor-
mance, mood, health, satisfaction, and comfort. J Illum Eng Soc 27(1):107–129.Vince I (1987) Sick Building Syndrome. IBC Technical Services, London.Wallace L, Nelson C, Highsmith E, Dunteman G (1993) Association of personal and workplace
characteristics with health, comfort and odour: A survey of 3948 office workers in the building.Indoor Air 3:193–205.
Wilkins AJ, Nimmo-Smith I, Slate AI, Bedocs L (1989) Fluorescent lighting, headaches andeyestrain. Lighting Res Technol 21:11–18.
Wilkins AJ, Nimmo-Smith MI, Slater A, Bedocs L (1988) Fluorescent lighting, headaches andeyestrain. Proceedings of ClBSE National Lighting Conference, Cambridge (UK): 188–196.
World Health Organization (1983) Indoor air pollutants: exposure and health effects, World HealthOrganization EURO Reports and Studies 78, World Health Organization, Copenhagen.

Chapter 27
Passive Methods to Address the Sick BuildingSyndrome in Public Buildings
José A. Orosa and Armando C. Oliveira
27.1 Introduction
The sick building syndrome (SBS) was originally defined by the World HealthOrganization (WHO 1989) as the occurrence of an increased prevalence of non-specific symptoms among populations in determined buildings (Thörn 1998).
Some of the common symptoms are eye, nose and throat irritation; mentalfatigue; headaches; nausea; dizziness and skin irritation; lethargy; irritability; andlack of concentration, which appear to be linked with the occupancy of certainworkplaces (Hedge et al. 1996; Raw et al. 1996; Gupta et al. 2007).
It is difficult to detect SBS, as its exact definition depends on the method usedto determine it (Raw et al. 1996). While the usual medical syndrome constitutes agroup of signs and symptoms which present a “clinical picture of diseases” in indi-viduals, the SBS is considered to occur when one or more common, non-specificsymptoms, are present at a prevalence that exceeds the normal prevalence expectedin the population of a building. Therefore, proposed individual diagnostic proce-dures are vague, and there is no consensus on what may or may not constitute a sickbuilding.
It appears that the main criteria for diagnosis are the exclusion of other condi-tions together with the improvement of symptoms when the patient is temporarilyremoved from the workplace (Thörn 1998).
Once SBS is diagnosed for an indoor ambience, one must detect its causes and tryto correct the syndrome. It is important to recognize that SBS is based on prevalencedata which describe symptom patterns at the level of the building and not necessarilyat the level of the individual (Hedge et al. 1996).
In particular, parameters such as fleece factor, air temperature, total suspendedparticles, job stress, mechanical ventilation, illumination (James and Bahaj 2005),dust and noise were analysed and related with SBS symptoms (Thörn 1998).
J.A. Orosa (B)Department of Energy and M.P., University of A Coruña. E.T.S.N.yM., Coruña 15011, Spaine-mail: [email protected]
481S.A. Abdul-Wahab (ed.), Sick Building Syndrome,DOI 10.1007/978-3-642-17919-8_27, C© Springer-Verlag Berlin Heidelberg 2011
482 J.A. Orosa and A.C. Oliveira
Finally, if the symptoms of SBS appear at work and disappear when away fromwork, then it is important to analyse all these parameters at the workplace.
After discussing the conclusions of recent research works on SBS, the mainparameters that are typically analysed to address the SBS will be summarised.These parameters were classified into objective and subjective parameters. In par-ticular, importance will be given to building internal coverings as a tool for reducingmechanical ventilation control, the presence of VOCs and for controlling indoor airrelative humidity and, finally, to the perception of indoor air quality.
27.2 Objective Parameters
Recently, a large number of studies have attempted to relate the SBS symptoms tomeasurable parameters of indoor air, such as temperature and relative humidity. Theobjective of these studies was to control these parameters to prevent the symptoms.
However, before analysing their conclusions, some questions have to beanswered. For example, should we employ natural or mechanical ventilation forpreventing SBS? Further, if SBS is detected, should we control the indoor ambi-ences or correct the heating, ventilating and air conditioning system (HVAC)? Theanswers to these questions are presented in the following sections.
27.2.1 Should We Employ Natural or Mechanical Ventilation?
To answer this question, some recent studies were analysed (De Magalhaes et al.2009). In these studies, defective ventilation was considered to be responsible forthe symptom prevalence, and it was corrected without effect (Thörn 1998).
In particular, researchers showed that symptoms were more prevalent amongthose workers who occupied air-conditioned buildings than among those in natu-rally ventilated buildings. For example, in De Magalhaes et al. (2009), a higherprevalence of work-related upper respiratory symptoms and tiredness was observedin a sealed building with HVAC system than in a naturally ventilated building.
From this research, it can be concluded that the air passes through several poten-tial sources of contamination (ducts, humidifier, chiller, etc.) in air-conditionedbuildings and this might be the reason for higher prevalence of symptoms, whereasin naturally ventilated buildings, ventilation depends solely on operable windowsand doors (Hedge et al. 1996). Therefore, one can conclude that preference shouldbe given to the construction of naturally ventilated buildings and, when this is notpossible, the use of HVAC systems must be minimized.
27.2.2 How to Detect SBS?
To detect the SBS, one may employ objective or subjective methods. The valuesof several physical environmental parameters (such as air temperature, globe tem-perature, air velocity, carbon monoxide and ozone concentration) measured using

27 Passive Methods to Address the Sick Building Syndrome in Public Buildings 483
objective methods failed to show any significant relationship with SBS (Hedge et al.1996).
Despite a linear relationship between CO2 concentration and SBS (Gupta et al.2007), it does not necessarily imply that CO2 is the only influencing parameteraffecting the SBS score in a building. However, CO2 acts as an indicator or marker,which likely indicates the presence of indoor air pollutants. The concentration ofCO2 in a building may lie within ASHRAE standard limits, but the occupants maystill complain about symptoms of SBS.
Even though objective detection can be measured in an automatic way, subjectivedetection methods were found to present better results. These methods are based onthe information reported by the occupants themselves, such as SBS health symptoms(WHO 1989); therefore, the reports by occupants were found to cover a greaternumber of parameters.
27.2.3 Corrective Parameters: HVAC System or Building Design?
As shown before, buildings with mechanical ventilation show a higher prevalenceof SBS symptoms than natural ventilated ones, and the methods for detection aredefined. Next, we must define an effective way for detecting and preventing SBSsymptoms.
Hence, HVAC parameters were analysed with respect to the presence of SBSsymptoms (Kolari et al. 2005), and importance was given to duct cleaning andthe percentage of fresh air. For example, it was noticed that air duct cleaningdid not have a significant effect on measured air quality. The most significantimprovement in work environment factors due to duct cleaning was related to stuffy“bad” air and work-related nasal symptoms. Strong and significant correlation wasfound between dust deposition and the prevalence of nasal symptoms before ductcleaning.
After duct cleaning, the prevalence of the nasal symptoms was found to be low-ered (Kolari et al. 2005). Furthermore, despite the fact that non-problematic officebuildings were analysed in this case study, the particle mass concentration, TVOC,CO2 and fungal spore concentrations were clearly below stipulated values, bothbefore and after duct cleaning and re-balancing of the ventilation system.
Another parameter that must be analysed is the percentage of fresh air that entersthe building. One must remember that the main purpose of the ventilation systemis to deliver fresh supply air to spaces occupied inside the building and guarantee ahigh quality of indoor air in modern buildings.
In this sense, previous studies have reported a decrease in dust deposition andmicrobial count in inner duct surfaces, as well as the total concentration of volatileorganic compounds (TVOC) (Kolari et al. 2005). As a consequence of this ventila-tion, the air movement during ventilation was considered to be an important factorfor measuring the indoor air quality (Haghighat and Donnini 1999). The higher theperceived air movement, the greater is the satisfaction with indoor air quality (IAQ).

484 J.A. Orosa and A.C. Oliveira
The last factor related with ventilation is the study of pollution sources that mustbe removed to improve the perceived air quality in the building, which is pollutedby building materials and also building materials plus bio-effluents, because thechemical and sensory pollution loads in the buildings were reduced.
Recent research works (Wargocki et al. 2002) showed that the improvement inair quality obtained by reducing the pollution load by 2–2.5 times was similar tothat obtained by increasing outdoor air supply rate by three times.
For example, in Assimakopoulos and Helmis (2004), by following certain activ-ities in the building e.g. cleaning, improving ventilation conditions, restriction ofsmoking, pollutant concentrations dramatically dropped in all areas; furthermore,the employees did not complain of any sick building symptoms.
After analysing the objective parameters and its corrective methods, it should benoted that SBS is still an unsolved problem; the suspected objective cause factorswere encountered only in 25% of the cases (Hedge et al. 1996), and often SBS healthproblems continue to remain even when the suspected factors have been removed.
Thus, it may be concluded that the SBS is not only related with objective param-eters but also with subjective parameters such as job satisfaction and perception ofIAQ, which will be analysed in the next section.
27.3 Subjective Parameters
27.3.1 Job Stress
Although research studies repeatedly showed that SBS symptoms are more preva-lent among workers in air-conditioned offices than among those in naturallyventilated offices, most of these studies also found stronger associations between avariety of organizational, occupational, and personal variables and symptoms, thanbetween these parameters and environmental conditions (Hedge et al. 1996).
This study is a clear example of the fact that subjective parameters signifi-cantly influence the occurrence of SBS symptoms, especially at the workplace.Furthermore, in previous studies, it was concluded that parameters such as typeof job can influence the SBS perception.
For example, workers who used their computers for 6 or more hours reportedmore SBS symptoms than non-users (Gupta et al. 2007). From these results, it maybe concluded that each SBS perception must consider the subjective parameters,particularly the type of job.
27.3.2 Perception of IAQ
Recently, it has been observed that the occupants usually self-reported SBS healthsymptoms; therefore, these reports can be employed as a tool to detect the SBS. Forexample, in the case of the Athens Air Traffic Control Tower (ATCT), sick syndromeepisodes were reported by the employees (Assimakopoulos and Helmis 2004).

27 Passive Methods to Address the Sick Building Syndrome in Public Buildings 485
These symptoms, expressed as job satisfaction, were positively related with officeair quality, ventilation, work area temperature, and ratings of work area environmentin recent research studies (Haghighat and Donnini 1999).
Another way to express this relationship is by means of the workers’ productivity.In recent studies, workers were asked to indicate the extent to which their work wasdisrupted by each of the environmental conditions and SBS symptoms.
Results showed that inappropriate thermal conditions, both too warm and toocold, inadequate ventilation, specially a lack of perceived air movement and sen-sation of stale air, distracting noise, and glaring/lighting, highly disrupted the work(Hedge et al. 1996).
In general, all these results suggest that SBS is not a simple environmentally-induced disorder that is caused by exposure to air polluted by combustion gases,volatile organic compounds, dust and particulates, or simply poor ambient condi-tions.
27.3.3 Control of Subjective Parameters by Questionnaire
On the basis of the previous results, it was concluded that using questionnaires is aneffective method to detect and control subjective parameters. These questionnairesmust consider the objective parameters such as indoor air temperature and subjec-tive parameters such as job stress. Furthermore, this is the only tool that effectivelyquantifies the subjective situation of each occupant.
Recent studies reported the following elements of SBS questionnaire design:
1. The layout of the questions related to symptoms.2. The wording used to establish whether the symptoms are building related.3. Small differences in the symptoms listed on the questionnaire and the description
of these symptoms;4. The frequency scale used to record the occurrence of symptoms and discomfort
(Raw et al. 1996)
These research works concluded that a questionnaire using separate questions toreport building-related symptoms is a better method of collecting symptom datathan a questionnaire using a response table (Raw et al. 1996).
Another conclusion obtained was that two-thirds of the questions can alsobecome redundant within the separate questions format, which will make answeringeasier and quicker for those with few symptoms, allowing plenty of space to reportthose symptoms that occur. Note that the same questionnaires were employed in theprevious studies with adequate results, for example, the MM-40-FIN questionnairethat assesses the perceived indoor environment and work-related symptoms beforeand after duct cleaning.
Finally, in this type of questionnaires, some indices called Percentage ofDissatisfied persons with local thermal comfort (PD) and indoor air acceptability(Acc) were employed.

486 J.A. Orosa and A.C. Oliveira
These indices were employed (Simonson and Salonvaara 2000) for defining theeffect of materials on controlling indoor air temperature and relative humidity.These indices were employed to define the effect of permeable coverings in publicbuildings, which will be discussed in the following sections.
27.4 Permeable Coverings as a Realistic Solution
At this point of SBS analysis, we are ready to understand the future tendencies inSBS prevention based on building design. In particular, it is well known that in manycases, the main reasons for SBS is the inappropriate envelope design, the misuse ofthe building by the inhabitants and the combination of indoor–outdoor pollutionsources (Assimakopoulos and Helmis 2004).
Recent studies (Orosa and Baaliña 2008; 2009; Orosa and Oliveira 2009a)showed the feasibility of permeable internal coverings for reducing the need ofmechanical ventilation and for controlling indoor ambience.
These passive methods are gaining popularity, because they are energy consciousand environmentally friendly. However, there is very little published data on masstransfer between building envelopes and indoor air. Furthermore, permeable cover-ings can improve the subjective perception of an indoor ambience by controllingsome objective parameters such as indoor air relative humidity and temperature,improving the reduction of SBS symptoms. They also have positive consequences,like energy savings. All these relationships will be analysed next.
27.4.1 The Public Building
To study permeable coverings as a possible solution for SBS, 25 typical Spanishoffice buildings were monitored during 1 year. All the offices have the same internalactivity and periods of work, which began a few minutes before 9:00 and finished at14:00, in the summer and winter seasons.
Their wall structure is the same (Fig. 27.1); it comprises an external coveringof marble, concrete, brick, air barrier, polystyrene, brick, concrete, as well as oneinternal covering. The only difference is that the internal covering has been experi-mentally classified into three different groups, according to their permeability level:permeable, semi-permeable and impermeable coverings. Permeable coverings aremade of materials such as paper or plaster; semi-permeable coverings are made ofwood or plastic; and impermeable coverings are mainly made of glass.
These coverings have been selected because they are found in abundance in eachoffice building, despite that fact that other materials are present in that environment.
All offices have two clearly differentiated zones: the workers’ zone and theclients’ zone. The workers’ zone is the region where employees serve the clientslocated in the clients’ zone, and both these zones are separated by a safety glass(Fig. 27.2).

27 Passive Methods to Address the Sick Building Syndrome in Public Buildings 487
1. External coating
2. Concrete
3. Brick
4. Air barrier
5. Polystyrene
6. Brick
7. Concrete
8. Internal coating
Fig. 27.1 Wall structure
Clients’ zone
Employees’ zone
Fig. 27.2 Offices’ zones

488 J.A. Orosa and A.C. Oliveira
27.4.2 Objective Parameters Controlled by Permeable Coverings
27.4.2.1 Control of Indoor Air Relative Humidity
The main objective of the first study was to show the effect of internal wall coat-ings on indoor air conditions by means of indoor air parameters. Measurementswere taken from the 25 office buildings during different seasons of the year,with a time frequency of 10 min for each variable of temperature and relativehumidity.
To analyse the data, a One Way Anova statistical method was applied (Orosa andOliveira 2009a) to define the moisture-buffering capacity of permeable coveringsduring the unoccupied period.
Results showed that in offices with permeable coverings, the indoor partialvapour pressure is higher during winter and lower during the summer. These officeshave the most permeable internal coverings, which are similar to paper, and allowhumidity to pass through the building structure.
An opposite behaviour was found in impermeable offices, where indoor partialvapour pressure was higher during the summer and lower during the winter. In sum-mary, one may confirm that permeable coverings tend to decrease and increasepartial vapour pressure in summer and winter seasons, respectively.
Permeable coverings increased the partial vapour pressure, thereby improvingenvironment acceptability and local thermal comfort for the first few hours of occu-pation, despite using an air barrier and less permeable coverings than other authors.Therefore, permeable coverings have been proved to be a real solution as a passivecontrol method; they are also energy saving, as discussed next.
In the same study, it was demonstrated that permeable coverings improve indoorconditions even if an air barrier and less permeable coverings such as wood are used.
It was also confirmed that during a long-term study, internal permeable coveringsmaintain their regulatory property, as a result of the existence of more than 4 h ofexcessive indoor humidity before the studied period.
Finally, these results confirm the studies of Simonson and Tuomo (2000), but thiseffect is extended for more than 2 weeks after a change in weather conditions.
27.4.2.2 Control of Indoor Ambience: Control of VOCs
Recently, an airtight envelope has become popular in the design of office buildings.It is used for reducing the heating and cooling loads. Maintaining an adequate IAQfor such airtight buildings totally depends on mechanical ventilation systems (Guptaet al. 2007).
Despite this, further analyses of the results showed that the central ventilationsystem is not sufficient for the building needs; as a result, in some areas VOC pol-lution sources were developed, either because of cleaning negligence or because ofthe type of construction material used (Assimakopoulos and Helmis 2004).
The reduction in peak concentrations of formaldehyde and VOCs in indoor air,when the sources of these compounds are within the room, depends not only on

27 Passive Methods to Address the Sick Building Syndrome in Public Buildings 489
emission and ventilation rates, but also on sorption/desorption rates to/from thesurfaces of the rooms (Seo et al. 2009).
During the periods of building occupation, when the temperature is higher, theemission of VOCs from materials is favoured. In addition, it is possible to waitfor a regulating effect of permeable coverings on VOCs, so that they are adsorbedduring the occupied period and released when the air is cleaner, thereby allowing animproved quality of indoor air.
With the objective of quantifying this effect, a few studies have examined mea-surements related to the reduction in concentration of VOCs, such as toluene usingactivated carbon. Their results have demonstrated that sorptive building materialsare fairly effective in reducing VOC concentration in rooms, an effect that can beexpected in practice (Seo et al. 2009).
In these studies, the sorption saturation value and/or lifetime of the sorptioncapability of sorptive building materials were investigated.
Results showed that they have a long-lasting VOC-reduction performance; there-fore, these materials are an interesting tool to control indoor air quality with energysavings.
27.4.3 Subjective Parameters Controlled by Permeable Coverings
Some recent studies have concluded that symptoms were more prevalent amongworkers occupying air-conditioned buildings than in naturally ventilated buildings.
In studies in mechanically ventilated buildings (Cheong et al. 2006), an exten-sive investigation of Perception of Indoor Air quality (PAQ) and SBS, with adisplacement ventilation (DV) system in the tropics, has been conducted. The resultsdemonstrated that thermal gradient had an insignificant impact on PAQ, SBS andtheir corresponding PDs.
Despite this, the data showed reports of thermal problems, especially underextremely warm conditions, which were the most common components of percep-tion of poor indoor air quality. Furthermore, it was found that dry air sensation,irritations and freshness decreased with an increase of the room air temperature.One possible reason is that average values of absolute humidity and enthalpy atbreathing level increased with the room air temperature (Cheong et al. 2006).
On the other hand, despite the fact that odour intensity and PD were insignifi-cantly affected by room air temperature, it was found that PD and some comple-mentary parameters, such as dry air sensation and irritations, decreased with anincrease in the room air temperature.
The opposite effect was obtained in the case of air freshness. Air freshnessdecreased with an increase in the room temperature; therefore, if the air temperatureis low, the air inside the room is considered to be fresh (Cheong et al. 2006).
Considering previous studies (Simonson and Tuomo 2000; Orosa and Baaliña2008), moist air indices were employed for evaluating the expected percentage ofdissatisfied and the indoor air acceptability (Orosa and Baaliña 2009). Once the

490 J.A. Orosa and A.C. Oliveira
daily evolution of these two indices was obtained, it was possible to conduct a deeperanalysis of the effect of permeable coverings on indoor ambience, and define themain periods of the day during which coverings present a higher activity.
Results showed that indoor coverings exert an influence on the indoor environ-ment and PAQ for a long-term, and that it is especially important during the lasthours of unoccupation periods, the consequences of which can be appreciated inindoor air acceptability and the percentage of dissatisfaction during the first hoursof occupation.
On the other hand, when analysing the influence of humidity on accept-ability, it was concluded that it is higher than thermal parameters’ influence.This effect on indoor air acceptability was especially high in summer mornings;thus PDIAQ in offices with permeable coverings showed 25% of dissatisfaction.In winter, this effect was reduced, because of low indoor temperatures in alloffices.
27.4.4 Energy Savings
As a continuation of previous studies, the possibility of energy savings was anal-ysed. In Orosa and Oliveira (2009a,b), the energy savings of internal permeablecoverings, due to the reduction in ventilation needs, was quantified, particularlyregarding the peaks of consumption during the first hours of occupation. Energysavings were observed when the air change rate was analysed. The results showedthat the sorption of water vapour in the porous envelope has a greater effect onindoor humidity than ventilating the room with 0.5 ach. This result complementsthe previous research on estimating the effect of hygroscopic materials on energyconsumption in buildings.
These works showed the possibility of reducing the heating and cooling energyconsumption while using hygroscopic materials along with well-controlled HVACsystems. Using permeable coverings is an energy advantage, because these materialsallow achieving better indoor conditions during the first hours of occupation, whichis interesting with regard to the reduction in energy consumption peaks during themorning (Orosa and Oliveira 2009b).
27.5 Conclusions and Future Research Work
Further studies must be conducted to investigate the real effect of building mate-rials on indoor air quality, thermal comfort and energy savings, and also on howto implement or substitute the current HVAC systems with this type of passivemethod.
Above all, it is necessary to identify one method for selecting the value of materi-als’ properties (constants), the active (effective) thickness and the internal coveringto achieve the best indoor conditions with the least maintenance.

27 Passive Methods to Address the Sick Building Syndrome in Public Buildings 491
These results confirm the studies of Toftum et al. (1998) and allow, with a moreintelligent design, energy savings in indoor air renovation, especially during theinitial hours of indoor occupancy.
To attain this objective, new techniques (Ellis and Mathews 2002), such ascomputer design tools, should be developed in close co-operation with buildingdesigners. In general, the requirements for new design tools are as follows:
• The tool should be simple and easy to use.• It should provide default values for unknown variables.• Time required to learn and use the software must be as short as possible.• Output should be simple yet informative.• It should use a language familiar to designers.• The tool must be verified and tested by designers.• New tools should make provision for easy data transfer between different design
tools.
Adequate software will allow, with a more intelligent design, the saving of energyin indoor air renovation. Furthermore, these software tools must consider parameterssuch as the adaptive opportunities on thermal comfort responses and the effect ofinternal coverings on other climatic regions.
Finally, software tools also help in preventing future SBS problems. New tech-niques must be analysed; for example, a porous hedge in front of the building(Chang 2006; Seo et al. 2009) or occupant’s concienciation about effect of habitson indoor ambiences.
References
Assimakopoulos VD, Helmis CG (2004) On the study of a sick building: the case of athens airtraffic control tower. Energy Build 36:15–22.
Chang WR (2006) Effect of porous hedge on cross ventilation of a residential building. BuildEnviron 41:549–556.
Cheong KWD, Yu WJ, Tham KW, Sekhar SC, Kosonen R (2006) A study of perceived air qualityand sick building syndrome in a field environment chamber served by displacement ventilationsystem in the tropics. Build Environ 41:1530–1539.
De Magalhaes Rios JL, Boechat JL, Gioda A, Dos Santos CY, De Aquino Neto FR, Lapa e Silva JR(2009) Symptoms prevalence among office workers of a sealed versus a non-sealed building:associations to indoor air quality. Environ Int 35:1136–1141.
Ellis MW, Mathews EH (2002) Needs and trends in building and HVAC system design tools. BuildEnviron 37:461–470.
Gupta S, Khare M, Goyal R (2007) Sick building syndrome – A case study in a multi-storeycentrally air-conditioned building in the Delhi city. Build Environ 42:2797–2809.
Haghighat F, Donnini G (1999) Impact of psycho-social factors on perception of the indoor airenvironment studies in 12 office buildings. Build Environ 34:479–503.
Hedge A, Erickson WA, Rubin G (1996) Predicting sick building syndrome at the individual andaggregate levels. Environ Int 22(1):3–19.
James PAB, Bahaj AS (2005) Smart glazing solutions to glare and solar gain: a sick building casestudy. Energy Buid 37:1058–1067.

492 J.A. Orosa and A.C. Oliveira
Kolari S, Heikkilä-Kallio U, Luoma M, Pasanen P, Coronen P, Nykyri E, Reijula K (2005) Theeffect of duct clearing on perceived work environment and symptoms of office employees innon-problem buildings. Build Environ 40:1665–1671.
Orosa JA, Baaliña A (2008) Passive climate control in Spanish office buildings for long periods oftime. Build Environ 43(12):2005–2012.
Orosa JA, Baaliña A (2009) Improving PAQ and comfort conditions in spanish office buildingswith passive climate control. Build Environ 44(3):502–508.
Orosa JA, Oliveira AC (2009a) Hourly indoor thermal comfort and air quality acceptance withpassive climate control methods. Renewable Energy 34(12):2735–2742.
Orosa JA, Oliveira AC (2009b) Energy saving with passive climate control methods in spanishoffice buildings. Energy Build 41(8):823–828.
Raw GJ, Roys MAS, Whitehead C, Tong D (1996) Questionnaire design for sick buildingsyndrome: an empirical comparison of options. Environ Int 22(1):61–72.
Seo J, Kato S, Ataka Y, Chino S (2009) Performance test for evaluating the reduction of VOCs inrooms and evaluating the lifetime of sorptive building materials. Build Environ 44:207–215.
Simonson CJ, Salonvaara MH (2000) Mass transfer between indoor air and a porous buildingenvelope: part I. Field measurements. Proc Healthy Build 3:117–122.
Simonson CJ, Tuomo O (2000) Moisture performance of building envelopes with no plastic vapourretarders in cold climates. Proc Healthy Build 3:477–482.
Thörn A (1998) The sick building syndrome: A diagnostic dilemma. Soc Sci Med47(9):1307–1312.
Toftum J, Jorgensen AS, Fanger PO (1998) Upper limits of air humidity for preventing warmrespiratory discomfort. Energy Build 28:15–23.
Wargocki P, Bakó-Biró Z, Clausen G, Fanger PO (2002) Air quality in a simulated office envi-ronment as a result of reducing pollution sources and increasing ventilation. Energy Build34:775–783.
World Health Organization (1989) Indoor air quality: organic pollutants. WHO Regional Office forEurope (EURO Report and Studies 111), Copenhagen.

Chapter 28
Ventilation and the Air Ion Effect in the IndoorBuilding Environments: Impact on HumanHealth and Wellbeing
Milos Nedved
28.1 The Air Ion Effect and Its Applications – An Overview
Why are modern, well equipped hospitals still plagued with the range of cross infec-tion? How do killer viruses like Legionnaires’ disease spread, undetected, through
air-conditioning systems to meticulously clean wards?
The cause is clear and the remedy simple. The spread of Legionnaires’ disease
and other forms of infection can be traced directly to a lack of negative ions in the
atmosphere.
Tests have shown that a negative ion depleted atmosphere is a breeding ground
for bacteria. Increasing the concentration of negative ions would stop germs from
travelling and create a semi-sterile environment. This could be done quickly and
cheaply, by placing negative ion generator in any air conditioning system.
The problem was the same in many offices and factories. Even some of the symp-
toms attributed to the extended use of computer screens were in reality the fault of
the working environment atmosphere.
Ions are particles of air that have either a positive or negative electrical charge.
In natural environments they are produced to maintain a healthy ratio but in an
artificial environment of air conditioning, electrical equipment, fluorescent lighting
and even synthetic clothing the balance can be seriously affected. Each re circulation
of air through the air conditioning system reduces the concentration of negative ions.
Negative ions present in air are, most frequently: CO3–, O2
– or O2– (H2O)n,
where each of them carrying one negative charge (–). Positive ions are usually
present in the form of N2+.
The factors having a major influence on air ion indoor levels are:
• ducted air conditioning (refrigerated)
• static electricity
M. Nedved (B)Occupational Safety and Hygiene Consultancy and Training Services, Willetton, WA 6155,Australia; School of Management, Edith Cowan University, Joondalup, WA 6027, Australiae-mail: [email protected]
493S.A. Abdul-Wahab (ed.), Sick Building Syndrome,DOI 10.1007/978-3-642-17919-8_28, C© Springer-Verlag Berlin Heidelberg 2011

494 M. Nedved
• smoke and dust contamination• high density of people
Positive ions are formed by friction between either solid surfaces, or between a solidsurface and the flow of air. In a modern building, such friction is responsible for avery substantial decrease in negative ion concentration.
The following data (Table 28.1) give a good idea of the likely concentration ofnegative and positive ions in the air in various environments.
It is not only the ion imbalance, which creates discomfort for the people, butmainly the reduced negative ion level. For example, pain can be reduced by thepresence of negative ions in air, since the level of serotonine hormone which trans-mits pain, is reduced. Negative ions also reduce histamine levels, what could havepronounced impact on various allergies. In summary, air ion imbalance causesimbalance of a number of important biochemical constituents of a human body.
Because viruses and microbes can only be transmitted by attaching themselves tosolid, positively charged airborne particles the introduction of negative ions preventsthe germs travelling. To support this case we can cite examples of studies carried outaround the world.
Most burns wards in Californian hospitals are now equipped with negative iongenerators. All have reported a dramatic fall in the incidence of infection andup to 70% cut in recovery time for burns victims. The North-Eastern hospital inPhiladelphia has installed a special negative ion chamber for burns cases. Patientsplaced in the chamber are reported to be free of pain or greatly relieved after amuch shorter period of time than was the case without negative ions supply. Just asimpressive are the results of studies carried out in the workplace.
Some years ago the author was called in to advise an English company which hadmoved its office staff to new air conditioned premises. Naturally, they had expectedimproved staff moral, fewer absentees and higher productivity. The opposite was thecase. Staff complained of headaches, dizziness and nausea, and there was generaldiscontent. After the installation of a negative ion generator there was a significantimprovement in all these symptoms.
Table 28.1 Concentration of negative and positive ions in the air in various environments
Concentration in 1 ccm of air
Environment Positive ions Negative ions
Clean mountain air 2,500 2,000Rural environment 1,800 1,500Typical urban environment (mildly
polluted)600 500
Light industrial plant area 400 300Modern office environment 200 150Closed moving vehicles 100 50
28 Ventilation and the Air Ion Effect in the Indoor Building Environments 495
During his research into the ion phenomena, the author of this article measuredthe concentration of negative ions in various parts of the 8 storey administrativebuilding in Perth, housing around 1,600 people. Complaints included some throat,dizziness, rashes, headache and other flu-like symptoms, with consequent low out-put and low working morale. The management suspected low oxygen levels, andperhaps higher dust concentration in certain sections of the building. Whilst theoxygen concentration fluctuated between 19 and 20% by volume, the nuisance dustconcentration was well below 0.5 mg/m3. But, as expected by the author, the nega-tive ion concentration was very low, varying between 60 and 140 throughout thebuilding. The remedial measure suggested by the author was quite simple – to
increase the fresh air intake to the air conditioning system. Within several days,
most occupants of the building experienced marked relief. The negative ion concen-
tration measured (with 20% fresh air intake in each cycle of recirculation of air) was
then between 240 and 460 ions in 1 cm3 of air.
A booklet produced by the British Automobile Association already some years
ago warned motorists of the dangers of too many positive ions, after several studies
revealed that a motor vehicle’s electrical system, heater and air conditioner, all pro-
duce only positive ions while pollution and exhaust fumes destroyed negative ions.
Drivers were consequently overdosed by an excess of positive ions causing fatigue,
drowsiness and lack of concentration. The Association had therefore recommended
the use of a car negative ion generator.
So with all the evidence supporting the use of negative ion generation how much
is now happening worldwide? Though conclusive studies have been conducted in
a number of countries, it takes time to convince the authorities and the medical
profession. But we are now getting very positive feedback and encouraging inquiries
from doctors and from business and industrial managers who can see the cost benefit
of maintaining a healthy working environment, both in human and monetary terms.
The tests had also shown that negative ion generators could be beneficial to peo-
ple with breathing problems such as asthma. Could negative ions be the cure for our
modern-day ills? In this context it is necessary to admit, that not all the people are
sensitive to the ion effect to the same extent. From the research studies carried out
in the United States, United Kingdom, Germany and Switzerland it follows that:
• 25% of all people are very much affected by ion imbalance.
• 25% of people are not affected at all.
• 50% of people are affected in varying degrees.
The symptoms of ion imbalance include:
• sleeplessness
• migraine
• pain in joints
• headaches
• laryngitis
• respiratory problems
496 M. Nedved
• increase in mortality (Observed in Switzerland and Germany, when dry windsdepleted of negative ions were blowing)
• increase in crime rate• increase in traffic accidents frequency (Switzerland: 2.5 times increase when dry
wind depleted of negative ion was blowing)• suicides (as above)
Please note that dry winds are deprived of negative ions, since by friction betweenthe air flow and the ground positive electrostatic charge is generated. This leads todischarge of negative ions in air.
People in a high proportion of the Perth (capital of Western Australia) metropoli-tan area would experience some tiredness or at least some unpleasant feeling whilsta dry easterly wind deprived of negative ions is blowing. On the other hand, seabreeze which is high on negative ions (these are formed when the wind comes intocontact with water surface) brings substantial relief to most people.
On the basis of the above it is possible to understand why most people feelmuch more comfortable in indoor premises cooled by the evaporative systems ascompared with refrigeration systems.
It appears from all the relevant studies and observations that the atmosphere inwhich we live and work makes around three quarter of individuals to complain ofdiscomfort within their work room environment or actually precipitate complaintsof illness. The concentration of negative ions appears to be one of the major atmo-spheric factors responsible for this. The modern office environment in which manycomputer operators work is usually deficient in negative ions for a number of rea-sons, and computer operators and users work in a particularly negative ion depletedmicro-environment near to the unit, because of the positive electro static charge onthe screen surface.
The author of this chapter, in his research into the negative ion effects, has mea-sured the concentration of negative ions in the breathing zone of the computeroperators, as well as the concentration of negative ions as a function of distance froma computer screen. The results of these measurements have shown the concentrationof negative ions in the computer operators’ breathing zone being around 50–60 ions
in 1 ccm of air. This was in the well ventilated room with average concentration
1,050 negative ions in 1 ccm of air.
The above data explain, why only those who work very closely to the screen
might develop some problems. People watching a TV from a distance of several
meters breathe the air which is not depleted of negative ions any more. The introduc-
tion of artificially generated negative ions can significantly improve the subjective
rating of the environment and of the subjects own feeling of comfort and well-
being. In addition negative ions significantly reduce the complaint rate of illness,
particularly headache, nausea, dizziness and skin rashes.
Increased concentration of negative ions also improves certain types of psycho-
logical and psychomotor performance. The generation of negative ions could be a
cheap addition to the computer workstation and could bring about major improve-
ments in job efficiency, health and comfort. Other applications of negative ionization
of air would include:

28 Ventilation and the Air Ion Effect in the Indoor Building Environments 497
• increasing mental alertness and concentration (e.g. for machine operators anddrivers)
• accelerated healing of burns and wounds• dust, smoke and pollen control (increased concentration of negative ions in air
leads to the precipitation of dust and smoke)• improving transportation safety• other medical applications, such as asthma or infections control
It should be mentioned in this context that ions should not be considered in isolationof the many atmospheric, environmental, architectural, biological psychosocial andergonomic factors that all contribute in a complex and interrelated way to determinean individual’s health and well being at work.
The effectiveness of negative ions effects appears to be reduced at high tem-
peratures and high humidity. However negative ions have a particularly beneficial
effect at night and could contribute in reducing the health problems and discomfort
associated with shift work.
Small and medium sized negative ion generators are widely available in most
countries around the world. Over the last 10 or 20 years, their price has dropped
significantly in real terms therefore such generators can be seen as a cost efficient
control strategy for a number of serious problems.
28.2 Physics Related to the Air Ion Phenomenon,
and the Negative Ion Effect Impact on Human
Health and Wellbeing
Air ion complexes are unstable, changing their composition by transient associa-
tion and disassociation as the original ion moves into the air. Small air ions have a
lifespan in clean air ranging from small fractions of a second to several seconds.
While cosmic rays and solar radiation provide much of the energy for ion pro-
duction, there are other sources of energy such as radiation from compounds such
as radon in the soil.
And even the disintegration of water droplets in waterfalls can lead to ion for-
mation. Near a waterfall, the fine spray contains a considerable concentration of
negative air ions. There have been actual measurements in locations near waterfalls
demonstrating negative air ion concentrations of in the order of tens of thousands
negative ions per cubic centimeter of air.
Tens of thousands, possibly even hundreds of thousands of passengers using
the Singapore airport, were able to feel refreshing atmosphere near the man made
waterfalls in the transit lounge.
It might seem difficult to understand that positive and negative ions exist simul-
taneously in air because of the tendency of the positive and negative charges to
neutralize one another. But, in clean unpolluted mountain air the typical concentra-
tion of positive and negative ions is between 2 and 3,000/cm3 of air, the positive to
negative ratio of 1.2–1.

498 M. Nedved
This apparently surprising coexistence next to each other is possible owing to thevast numbers of neutral molecules separating the charged ions. For every one ion inair there are quadrillions of electrically neutral molecules. When oppositely chargedsmall air ions collide, they neutralize one another. Various electrical fields also candeplete air ions attracting and transporting them to surfaces where, upon contact,the ions give up their charge and cease to exist.
The concentration of air ions in all circumstances is extremely low; even ina room containing an operating ion generator; only one air ion exists for each10,000 billion of electrically neutral ordinary molecules of air.
Well known facts are that even very small electrical currents and voltages cansignificantly influence a wide variety of physiological processes. For example, ithas been documented that very tiny and very brief electrical current-just a fractionof 1/1,000,000 of ampere at a frequency of 4 Hz for just 3/10,000 of a s-to the smellsensors of a fish would substantially affect the behavior patterns of the fish.
On the basis of such evidence it is not difficult to understand that small air ionscan bring about biological responses because of the minute currents they transmit toan organism.
Some 50 years ago, the drive for improved understanding how air ions can affecthuman physiology led to the establishment of the Air Ion Research Laboratory at theUniversity of California. The Laboratory had built sophisticated facilities for expos-ing bacteria, protozoa, plants, insects, and small animals to measured concentrationsof small air ions in a controlled microenvironment.
Human subjects have not been used in this targeted research, because they can-not be maintained under completely controlled conditions for prolonged periods.Another reason was that it is difficult with humans to exclude the placebo effect –
that reactions will be influenced by the very fact that a study is going on.
Out of the work in the Air Ion Research Laboratory several hundred of pioneering
scientific reports have been published. They have described biological effects of
negative ions ranging from the destruction of microorganisms and the stimulation
of plant growth to changes in brain and blood levels of a very important nervous
systems hormone serotonin.
It has been proven beyond any doubt that small negative air ions have a
lethal effect on a wide variety of moulds and bacteria, including such dangerous
microorganisms as those responsible for cholera and typhoid fever.
Plant growth studies have confirmed the previous hypotheses that atmospheric
electricity enhances the rate of growth of various plants, among them, barley, lettuce,
oats, and peas. It has also been found that air stripped of ions inhibits plant growth
and causes the plant to die.
Many studies have focused on the effects of ions on serotonin. Serotonin is a
potent nervous system hormone. It has a wide range of physiological activity. It is,
among other things, an important neurotransmitter-or message carrier-in the brain.
In one of the studies it has been observed that small positive air ions increase
the level of serotonin in the mouse brain and blood while small negative air
ions decrease it. These ion induced changes in serotonin levels, which were later
confirmed by other investigators, led the researches to formulate the serotonin

28 Ventilation and the Air Ion Effect in the Indoor Building Environments 499
hypothesis of air ion action. That it is the change in serotonin levels which accountsfor many of the biochemical and physiological changes that result from exposure toabnormal concentrations of positive or negative ions.
Experiments demonstrating the action of air ions in killing microorganisms, stim-ulating plant growth and altering the concentration of serotonin in blood and brainalways involve electromagnetic fields generated by the ion generating equipment.The researchers were therefore faced with an ancillary question: Are air ions, asdistinct from the electromagnetic field biologically active?
To solve this problem, the researchers grew large populations of barley seedlingsin ion-depleted atmosphere under controlled conditions. Then the air ions generatedby a radioactive element were introduced. The ions produced a statistically validincrease in growth rate; an identical electromagnetic field did not. This clear indica-tion that small negative air ions were responsible in this particular case for increasedgrowth rate does not exclude the possibility that electromagnetic fields in other casescan be also biologically active.
Laboratory investigations, for the most part, have been searches for possi-ble examples of living forms, tissues or tissue components which respond to airions. Other studies have pinpointed some specific effects of ions in plant-such asincreasing plant production of iron-containing enzymes, altering iron metabolismor handling, raising the rate of oxygen consumption, and increasing the essentialmetabolic activity of chloroplast in photosynthesis and starch formation.
It has also been found, that the silkworm responded to negative and positiveions with increased larval growth and accelerated formation of important enzymes.Negative ions have been found to lower tissue levels of hormone serotonin in miceand rats, while positive ions raise the levels.
It has also been found that air ions are capable of influencing the course of cer-tain diseases. Positive ions adversely affect the survival rate for influenza and forbacterial pneumonia in mice, whilst ion-depleted air has shown the same effect onmice infected with influenza virus.
28.2.1 Some Significant Examples of How the Ion Effect Can
Influence Human Health and Wellbeing
Hippocrates, who was frequently described as the world’s “Father of Medicine,”
pointed, in the fifth Century B. C. to certain winds as having a negative influence on
the people. He observed that the winds which passed over mountains to reach cities
disturbed the air people breathe and the bodies of people were than endangered by
diseases.
The first suspicion that these so-called “winds of ill repute” (for example the
Foehn in Germany and Switzerland, and the others) might involve air ions was
raised in 1901, when a direct connection between the adverse effects of these
winds on a large proportion of people who were weather sensitive, and the pres-
ence of increased concentration of positive ions in the air have been observed and
documented.

500 M. Nedved
At Hebrew University, the researchers have accumulated extensive clinicaland biochemical evidence that the excessive concentration of positive ions seri-ously affects serotonin levels, just as it had been found to be the case in theCalifornian experiments with mice. They have also pinpointed a variety of endocrinegland effects and have also established that such disorders can be managed byincreased negative ion concentration in air as well as with serotonin-blockingdrugs.
Some British studies of students clustered in lecture rooms and classrooms haveshown that negative ion depletion brings with it tiredness, loss of attention, discom-fort, and headache. Restoration of ion concentrations to normal levels reversed theseeffects.
Another research completed some 30 years ago, in a meticulously controlledinvestigation, has found that “air ions have bio psychological influences,” clearlyinfluencing mood and serotonin levels in people.
In several countries, physicians were successful in the utilization of the potentialvalue of air ions in treating a wide spectrum of disease. Despite the uneven quality ofthese attempts the results were sufficiently promising to establish air ion treatmentin several countries under the supervision of competent physicians associated withmedical schools or reputable hospitals.
In the former Soviet Union, researchers used, with a lot of success, air ion ther-apy in asthma. In the Argentine, the research team of physicians used air ion therapyin depression and anxiety disorders. In Denmark, researchers have used air ion gen-erators in providing healing environments for patients suffering from asthma andhay fever. In the UK, the researchers have established that inhalation of negativeions enriched air successfully cut short attacks of certain types of headaches andmigraine. In Romania, the team of physicians used negative air ions in the treat-ment of duodenal ulcers. In the United States, the team of pioneers in Americanair ion research, found air ions useful in treating patients suffering from burns.Particularly important was the findings that the people in control studies exposedto high concentrations of negative air ions for 16 h a day over a period of 2 monthshave exhibited no abnormal physiological or biochemical changes, thus demonstrat-ing the fact that no harm to the human organism results from high negative ionconcentrations.
28.3 Indoor Air Quality and Its Control
Industrialization, urbanization, and streets congested with polluting traffic have cer-tainly created huge and well known pollution problems. In addition to that, there isanother increasingly significant factor which has been largely unrecognized by thegeneral public, indoor air pollution. Ultimately, it will be the professions of design-ers and engineers which will have to assume the responsibility for correcting andcontrolling this important aspect of the indoor environments in all new and manyexisting structures.

28 Ventilation and the Air Ion Effect in the Indoor Building Environments 501
Small respirable particles (particle size range between 0.5 and 7 µm) in air sus-pension are continuously circulated by air currents until they are eventually trappedby adhesion to solid surfaces or eliminated by air exchange. The modern architec-tural trends toward smaller, more space-efficient rooms which limit air currents,as well as the use of impermeable synthetic structural materials, inhibits theseclearance mechanisms.
Nowadays people are living and working in environments dictated by economyand fashion, which have been developed by science and technology for our changinglife styles under the pressures of urbanization. This is having far reaching negativeeffects on the health and wellbeing of the people, and we need to employ modernscience and technology to rectify these problems for the sake of our own wellbeingand that of our future generations.
28.3.1 Health Hazards
Airborne particles of primary concern to human health and wellbeing in indoorbuilding environments are:
• Bacteria• Mould spores• Viruses• Toxic chemical molecules or aggregates• Pollens• Organic toxins
In addition to the above there are the larger sets of particles present in the air, towhich the smaller ones attach themselves; these include dust, hair, synthetic fibersand other particles. However, unlike the outdoor environment where wind and ther-mal air currents are powerful factors in distributing large and small particles alike,the smaller sizes are of chief concern in normal indoor environments because theytend to remain in suspension in the air longer and tend to penetrate further into thehuman pulmonary system.
It had been established a long time ago, that the only reason a particle remains insuspension is because it carries an electrical charge which is acted upon by similarelectrical charges. They are in the state of continuous electrostatic suspension, heldin space by electrostatic forces which are of greater magnitude than gravity. Theyare repelled from walls and other surfaces having a like charge, until their charge isneutralized.
It is also known that friction between any two dissimilar substances creates elec-trostatic charges of opposite polarities on each. In a typical home or office interior,the friction of air currents against the wall, ceiling, floor, and furnishings made ofmost synthetic and all metal surface materials, extracts some weakly bonded elec-trons; this builds up positive charges on these surfaces, creating positive electrostaticfields which attract negatively charged particles (ions) and repel the positive ones.

502 M. Nedved
Where resistance in the earth to ground path is too high to permit these cumula-tive positive charges to be neutralized through current flow, or where the ambientconcentration of negative ions attracted to the charged surfaces is not sufficient toneutralize them at an equal rate, the positive charge on the surface of many commonmaterials can build up to the magnitude of several hundred volts.
Under these conditions, it can be seen that this mechanism is capable ofmaintaining positively charged particles in air suspension indefinitely, where theirconcentration continues to increase cumulatively, as more are added, unless theyare exhausted by air exchange systems or experience discharge of their positivecharge.
On the basis of our understanding of the electrodynamics of indoor air pollutionproblems in which the sources cannot be eliminated effectively, a set of solutionscan be developed.
If the positive charge on the particle which holds it in air suspension is neu-tralized, gravity becomes the dominant force acting on the particle which, fallingthrough the progressively diminishing resistance of Brownian motion, will be pre-cipitated to the floor. Alternatively, if the particle charge was reversed, the particlewould quickly precipitate by attraction to an oppositely charged surface, such asa wall or ceiling, to which it will adhere indefinitely until overtaken by anotherelectrostatic event.
In normal fresh air, one or both of these processes go on continuously withinadequate concentrations of highly mobile small air ions. These are continuouslycolliding with oppositely charged pollutant particles which are much larger and lessmobile, and neutralize the particle charges to initiate precipitation. This is why thepollution problem was rarely serious in the large, old fashioned, high-ceilinged, wellventilated, exterior rooms with plenty of window area as natural light and radiationcontinuously recreate the short lived air ions.
In modern indoor environments, dependent upon re circulated air, the naturalprocess of ion neutralization and solid particle precipitation is seriously impeded byabnormally low ion concentrations, particularly of negative ions. This negative iondepletion effect is due to two groups of factors commonly found in artificial envi-ronments, each of which contributes incrementally to this basic cause of progressiveindoor pollution. The following lists describe the major factors, most of which arein existence in modern, air sealed indoor environments.
(a) Architectural factors
• Forced air ventilation ducts, which acquire high positive charges from airfriction and neutralize negative ions in passage.
• Synthetic structural materials and surfaces.• Inadequate or no natural light to regenerate ion populations.• Low ceilings of 3 m or less and interrupted design (rather than long straight
line) of walls, which impede convection current circulation of air.• Electronic precipitation filters which trap out all ions.• Effective air-sealing (non opening windows, and efficient insulation).

28 Ventilation and the Air Ion Effect in the Indoor Building Environments 503
(b) Indoor furniture, equipment and people factors
• Computer and television screens, which carry high positive charges, aremajor factors in depleting the negative ion population where and when theyare used.
• Synthetic carpets, curtains, office division screens and hard surfaces.• Electrical equipment and appliances, fluorescent lamp fixtures, fans, and
blowers.• Metal and plastic furniture.• Tobacco smoke particles which attract and neutralize negative ions at a very
high rate.• Synthetic clothing and shoes.• Overcrowding of rooms (people absorb negative ions and exhale positive
ions).
In view of the ever increasing of these factors in the modern society and modernbuildings, there is an urgent need to develop and implement suitable control strate-gies against the negative effects the above listed factors are having on our indoorbuilding environments.
28.3.2 Indoor Air Control Technologies
28.3.2.1 Negative Ionization of Air
The problem of negative ion depletion, and the consequent degradation of the naturalprocess of ion discharge and solid particle precipitation in indoor environments,can be reversed by negative ionization of air; this involves the installation in eachroom to be controlled, of a negative ion generator capable of continuously producingadequate quantities of small negative ions.
A centralized negative ion generation system is less effective, since negative ionsintroduced into the air duct system are almost immediately attracted to the interiorsurface of the duct and neutralized.
28.3.2.2 Ventilation
Definition
Ventilation is defined (in ASHRAE Standard 62.1 and the ASHRAE Handbook)as the process of changing or replacing air in any space to provide high indoorair quality (to control temperature or to remove moisture, odors, smoke, excessheat, dust, airborne bacteria, carbon dioxide and to replenish oxygen). Ventilation isused to remove unpleasant smells, introduce fresh air, to keep interior building aircirculating, and to prevent stagnation of the interior air.
504 M. Nedved
Air Composition and Human Needs
A person working hard breathes about 40 l of air per minute, consumes about 2 l ofoxygen and exhales about 1.7 l of carbon dioxide. A sleeping person consumes onlyabout one-tenth of this amount.
If the oxygen concentration is reduced to 17% a healthy person can still work butwill breathe a little faster and deeper. Symptoms of dizziness, buzzing in the ears,rapid heart beat and headaches appear at 14% oxygen concentration. Life can besupported at an oxygen concentration of 13% provided the air is kept moving andthe person is at rest.
Carbon dioxide acts as a stimulus to help regulate breathing. During heavy work,the amount of carbon dioxide released in the lungs increases and this stimulatesfaster and deeper breathing. When the atmospheric carbon dioxide concentrationincreases to 3% the breathing rate doubles. At 5%, breathing rate is quadrupledand breathing is very labored. Higher percentages cause violent panting and severethrobbing in the head but providing that oxygen is still present, the concentration ofcarbon dioxide has to rise significantly to cause death.
The human body continuously produces heat derived from the consumption offood. This maintains an internal body temperature of 37C but the body cannot storeheat. Increase in exertion or work increases the amount of heat produced and this isdissipated by physiological processes regulating heat loss from the skin. In a coolenvironment heat loss is fairly rapid but in hot surroundings the body may gain heat,and then has to dissipate this together with the heat of any activity. Air movementhelps by evaporating perspiration from the skin.
When a person is seated at rest, his/her heat output is around 115 W. A persondoing very light work has a typical heat output of 140 W. During light industrialbench work the heat output is around 235 W, and during heavy manual labor theheat output is around 440 W.
The body gives off water by perspiring at rates which vary according to theneed to dissipate heat. Perspiration rates around 75 mg/s of sweat are commonduring physical activity. Perspiration which soaks into clothing or is mopped offthe face does not contribute to heat regulation. The rate of heat loss from the bodyis governed by the perspiration evaporation rate which in turn is governed by airmovement, relative humidity and temperature.
Air movement is needed in workplaces to remove bacteria and odors produced byhuman existence. Respiratory bacteria are spread by coughing and sneezing whichspread bacteria laden droplets over considerable distances. These infectious dropletsremain floating in the air unless removed by ventilation.
Body odors arise from organic substances in the air, which increase whenpersonal hygiene is deficient. Body odors are generally regarded as undesirable pol-lution. Human activity such as smoking increases the pollution of air, particularly ofstale air. To control tobacco smoke may require a ventilation rate of five times thatneeded if smoking did not occur.
Solar radiation from the sun can be transmitted through walls, roofing and win-dows, increasing building internal temperatures. In winter this may be desirable

28 Ventilation and the Air Ion Effect in the Indoor Building Environments 505
but in summer it can produce unpleasant working conditions. Glass incorporated inroofing is almost transparent to solar radiation and can transmit around 950 W/m2
from direct sunlight.
Air Movement for Human Comfort
When air movement in occupied spaces is less than 0.075 m/s it generally causesa feeling of air stagnation and above 0.4 m/s it is felt as an unpleasant draught.To maintain comfort conditions in the workplace it is generally desirable to maintainan air movement between 0.1 and 0.3 m/s.
Dilution Ventilation
Excess heat, odors and contaminants can often be controlled via dilution or replace-ment with outside air. In humid climates there is a need to remove excess moisturefrom ventilation air. The concentration of airborne contaminants in the workplacecan be reduced by introducing large quantities of fresh air. Natural ventilation is notreliable and when materials are used which could cause a health hazard, mechanicalventilation is usually necessary.
Dilution ventilation is generally used to:
• Dilute to safe concentrations the less toxic substances, and the removal of smoke,steam and unpleasant odors.
• Dilute airborne contaminants which have escaped from local exhaust systems.• Dilute flammable vapors which may be generated within enclosed or partly
enclosed spaces.
When flammable vapors and dusts are present, safe practice is to ensure that theirconcentration does not exceed one-fifth of the lower explosive limit.
Dilution ventilation is not generally a reliable method of controlling haz-ardous emissions from processes because the concentration of the contaminantsis only rarely evenly distributed throughout the room air. For this reason, dilutionventilation is only suitable when the following conditions are met:
• There must be no risk of fire or release of flammable vapors; or of exposure toharmful concentrations of atmospheric contaminants.
• The toxicity of the contaminant must be low.• The rate of release of the contaminant must be low and not from a point or
localized source; that is, release points must be well spaced throughout the area.• The sources of release must be far enough away from the workers’ breathing
zones to ensure that adequate dilution occurs between the release point and the
workers’ breathing zones.
As dilution ventilation requires a much greater volume of air than a local exhaust
system to achieve the same degree of control, this method is only suitable when
506 M. Nedved
the amount of contaminant released into the workplace air is small, otherwise thevery large air quantities required will be neither practical nor economic to provide.Because of these factors, dilution ventilation is rarely used as the major means ofcontrolling airborne dusts and fumes in industry, but is the most common methodfor air quality control in buildings.
Air Movement in Dilution Ventilation
There are three basic means of mechanically controlling air flow for dilutionventilation.
• By supply and exhaust fans
This is the preferred method, and the sole one applicable for large buildings, withapproximately equal quantities of air being supplied and exhausted by two fan sys-tems. Slight excess exhaust is appropriate if there is a possibility of contaminatingadjoining areas. Cooling or heating of the inlet air is easily accomplished to providecomfort conditions and the incoming air may be filtered to control dust.
• By supply fan only
This method is applicable when contaminant release points are scattered through-out the work area. The’ possibility of exposure to pockets of high concentration of
contaminant is less likely than with exhaust ventilation only, as air supplied under
pressure ensures better circulation and dilution. Sufficient permanent outlets must be
provided to permit the supplied air to escape freely after circulating through the con-
taminant release zones. Cooling or heating of the inlet air is readily accomplished
and all air entering may be filtered to control dust.
• By exhaust fan only
This method is applicable where contaminants are released in fixed areas of the
work environment and where the exhaust outlets can be located nearby. Adequate
openings to admit fresh replacement air must be provided. Cooling or heating, and
filtering of the fresh replacement air would be difficult in this setup.
Ventilation Rate
The ventilation rate is usually expressed by the volumetric flow rate of outside
air being introduced to the building. The typical units used are cubic feet per
minute (CFM) or liters per second. The ventilation rate can also be expressed on
a per person or per unit floor area basis, such as CFM/p or CFM/sq.ft, or as air
changes per hour. For residential and office buildings, which mostly rely on fil-
tered fresh air supply, the common ventilation rate is the number of times the
whole interior volume of air is replaced per hour, and this is referred to as air

28 Ventilation and the Air Ion Effect in the Indoor Building Environments 507
changes per hour (ACH). ASHRAE (American Society of Heating, Refrigerationand Air-Conditioning Engineers; the world leading professional body in the field ofventilation and air-conditioning) now recommends ventilation rates dependent uponfloor area in addition to CFM/person.
In 1973, in response to the 1973 oil crisis and conservation concerns, ASHRAEStandards 62-73 and 62-81 reduced required ventilation from 10 CFM per person to5 CFM per person. This reduction in fresh air supply was subsequently found to bea primary cause of sick building syndrome. Current ASHRAE standards (Standard62-89 and 62-2001) state that appropriate ventilation guidelines are 20 CFM perperson in an office building, and 15 CFM per person for schools. In commercialenvironments with tobacco smoke, the ventilation rate will range from 25 CFM to125 CFM per person.
Air Change Rate
For most residential and office buildings, schools etc., the ventilation rate expressedin air changes per hour-ACH is in the range between 4 and 10. Air change rate perhour can be expressed in Imperial Units as:
ACH = 60 q/V
where: q = fresh air flow through the room in cubic feet per minute; V = volume ofthe room in cubic feet; Air change per hour can be expressed in SI Units as:
ACH = 3, 600 q/V
Where: q = fresh air flow through the room in cubic meters per second; V= volumeof the room in cubic meters
Safe Discharge of Exhaust Air
Industrial exhaust systems should discharge outside and above the building so thatthe discharged air does not re enter that building or other nearby buildings or occu-pied spaces. The aerodynamic wake of a building typically extends to 125% of thebuilding height above ground so the exhaust points should be above this height. Thedispersion pattern around an air discharge point can frequently be severely influ-enced by adjacent structures and where this is likely to be the case; special studiessuch as wind tunnel modeling may be needed in the design stage.
References for Further Study
ASHRAE (2005). Ventilation and Infiltration Chapter. Fundamentals Volume of the ASHRAEHandbook. ASHRAE, Atlanta.

508 M. Nedved
Estola T, Makela P, Hovi T (1979) The effect of air ionization on the air-borne transmission ofexperimental newcastle disease virus infections in chickens. J Hyg 83(1):59–67.
FDA US Food and Drug Administration (2009) CFR-Code of Federal Regulations Title 21 http://www.accessdata.fda.gov/scripts/cdrh/cfdocs/cfcfr/CFRSearch.cfm?FR=801.415. Accessed 10May 2010.
Fletcher LA, Noakes CJ, Sleigh PA, Beggs CB, Shepherd SJ (2008) Air ion behavior in ventilatedrooms. Indoor and Built Environ 17(2):173–182.
Gabbay J, Bergerson O, Levi N, Brenner S, Eli I (1990) Effect of ionization on microbial airpollution in the dental clinic. Environ Res 52(1):99–106.
Happ JW, Harstad JB, et al (1966) Effect of air ions on submicron T1 bacteriophage aerosols. ApplMicrob 14:888–891.
ICCCS (1992) The future practice of contamination control. Proceedings of the 11th InternationalSymposium on Contamination Control, Westminster, Mechanical Engineering Publications.
Kreuger AP, Smith RF, et al (1957) The action of air ions on bacteria. J Gen Physiol 41:359–381.Krueger AP, Reed EJ (1976) Biological impact of small air ions; despite a history of contention,
there is evidence that small air ions can affect life processes. Science 193(4259):1209–1213.Lehtimaki M, Graeffe G (1976) The effect of the ionization of air on aerosols in closed spaces.
Proceedings of the 3rd International Symposium on Contamination Control, Copenhagen.Makela P, Ojajarvi J, Graeffe G, Lehtimaki M (1979) Studies on the effects of ionization on
bacterial aerosols in a burns and plastic surgery unit. J Hyg 83(2):199–206.Mitchell BW, King DJ (1994) Effect of negative air ionization on airborne transmission of
newcastle disease virus. Avian Dis. 38(4):725–732.NewScientist (2003). Air ionizers wipe out hospital infections. http://www.newscientist.com/
article/dn3228-air-ionizers-wipe-out-hospital-infections.htm. Accessed 10 May 2010.Phillips G, Harris GJ, Jones MW (1963) Effect of air ions on bacterial aerosols. Int J Biometerol
8(1):27–37.Soyka F, Edmonds A (1991) The Ion Effect. Bantam Books, Bentam Premium, US.

Chapter 29
Sick Building Syndrome and IndoorEnvironmental Quality in China – A Review
Yufeng Zhang and Xiuling Ji
29.1 Introduction
The term Sick Building Syndrome (SBS) is used to describe situations in which
building occupants experience acute health and comfort effects that appear to be
linked to time spent in a building. SBS is usually indicated by the complaints of
symptoms from building occupants associated with acute discomfort, e.g. headache;
eye, nose, or throat irritation; dry cough; dry or itchy skin; dizziness and nausea; dif-
Þ in concentrating; fatigue; and sensitivity to odors. The cause of the symptoms
is not known and most of the complainants report relief soon after leaving the build-
ing. SBS is related to indoor environmental parameters, such as ventilation rate and
concentrations of chemical or biological contaminants. The work on indoor envi-
ronmental quality and SBS in China started in the 1950s of last century, including
the surveys and studies on the health effects of indoor environments, the standards
and norms, and the status surveys in national scale. The status of the work on SBS
in China is reviewed through the above aspects.
29.2 Surveys and Studies on Health Effects of Indoor
Environments
Surveys and studies on health effects of indoor environments is the base for know-
ing the status of SBS, understanding the inner mechanisms of the health effects
and establishing the relevant standards and norms. It is very difÞ to perform
the surveys and studies for that various factors may affect human health and lots
of contaminants can exist in indoor environments with low level of concentration.
Compared with the rapidly developing applications and the real problems found in
Y. Zhang (B)
Department of Architecture, State Key Laboratory of Subtropical Building Science, South China
University of Technology, Guangzhou 510640, China
e-mail: [email protected]
509S.A. Abdul-Wahab (ed.), Sick Building Syndrome,
DOI 10.1007/978-3-642-17919-8_29, C© Springer-Verlag Berlin Heidelberg 2011

510 Y. Zhang and X. Ji
actual environments, the studies on health effects of indoor environments are rel-
atively slow and late, which can not make timely responses in terms of complete
explanations of the problems and valuable guidance of the potential technologies
for solving the problems. Fortunately, the national invests on s researches
and the numbers of researchers are rapidly increasing recently in China, and more
and more surveys and studies are expected to be done, which are believed to provide
the solid base for the understanding, prevention and control of SBS.
There are three main streams in the surveys and studies in China: the health
effects of air-conditioned (AC) environments, the health effects of indoor air envi-
ronments and the subjective assessments of indoor air quality, which are reviewed
and summarized in the followings.
29.2.1 Health Effects of AC Environments
Air-conditionings were occurred in industrial buildings in China for the techni-
cal requirements of productions, and the health effects of AC environments became
one of the main focuses of early studies. The work can be into two
stages: surveys and mechanism studies, and the former are to provide primary
observations and the latter is to discover the cause-and-effect relationships through
epidemiological, toxicological and statistical approaches.
29.2.1.1 Field Surveys
It was reported early in 1984 that the workers in the AC factories in electronics
industry often complained the symptoms of dizziness and exhaustion, which was
expected to be well studied (Liu 1984). Thereafter, lots of surveys have been
performed in various AC buildings and the main results are reviewed as followings.
The people working or living in AC environments for a long-time are usually
selected as test group, and those working or living in naturally ventilated (NV) envi-
ronments with similar physical conditions are selected as control group. The
surveys consist of environmental measurements, questionnaires and medical tests.
The environmental parameters often measured are air temperature, relative humid-
ity, ventilation rate, concentrations of respirable particles, CO2 and bacteria, noise
and lighting. The questionnaires include professional and medical history, com-
plainant of uncomfortable symptoms in current environments and disease report.
The medical tests are mainly immunity tests and some surveys include productivity
or neurobehavioral tests.
Zeng et al. (1986) investigated 1,183 workers in AC factory and found that the
prevalence of cold reached 58.4% and the complaints of aches on shoulder, elbow,
waist and knee and fatigue were very common, which were reported by the test
group s more than the control group. Peng et al. (1988) investigated
1,121 workers in AC workshop in 1988 and reported that the CO2 concentration,
the prevalence of SBS like headache, dizziness, insomnia, memory loss, cough,
bellyache and lumbago and the prevalence of upper respiratory illness, menstrual
29 Sick Building Syndrome and Indoor Environmental Quality in China – A Review 511
abnormality and dysmenorrhea were higher in AC environments while
compared with those in NV environments. Long et al. (1988) focused on the female
workers in AC environments and found more complaints of symptoms of dysmenor-
rhea, arthralgia, cough, stomachache and larger numbers of WBC in blood in the test
group. Pu et al. (1988) studied 409 waiters in AC environments in restaurants and
found that they reported more symptoms of irritancy, sleepiness, dizziness, angina,
stomachache and bellyache and negative ion concentration in their ambient air was
lower.
Huang et al. (1990) found in a survey of AC restaurants that the CO2 and nega-
tive ion concentrations were lower and the prevalence of symptoms of dry mouth,
fatigue, dizziness, irritancy, sleepiness, headache and memory loss was higher while
compared with the NV restaurants. Pu et al. (1992) investigated 135 waiters in AC
restaurants and obtained the similar result with their previous study that is higher
prevalence of symptoms of irritancy, fatigue and sleepiness and lower concentration
of negative ion. They also made neurobehavioral tests and found that the test group
was worse than the control group in terms of reaction time, sensitivity and visual
retention.
Huang et al. (1996) investigated 200 female workers in sealed AC workshop and
found that their prevalence of menstrual abnormality was high and the prevalence
increased with the working time in AC environments. Cao et al. (1998) performed
neurobehavioral tests on 144 workers in AC factories and reported stronger reactions
in strain, anxiety, gloom, indignation, fatigue and perplexity, longer reaction time
and more mistakes in test group. Su et al. (1999) found in their survey of 145 waiters
in AC restaurants that their prevalence of symptoms of dizziness, irritancy, fatigue,
sleepiness, muscle ache and catching cold was higher and their performances on
reaction time, sensitivity, visual retention and digital decoding were worse than the
control group, and the negative ion concentration in the ambient air was lower than
NV environments.
Song et al. (2001) investigated 225 wokers in AC restaurants and found that the
prevalence of some symptoms changed with exposure time in AC environments and
the prevalence was higher for longer exposure time. In the same year, Yang and Lu
(2001) conducted a survey on 68 workers in AC of and reported that the ventila-
tion rate was inadequate and the concentrations of contaminants were much higher
than NV of and the prevalence of SBS such as headache, fatigue, sleepiness,
respiratory (cold, snufß cough and dry throat) and eye (eye ache, lacrimation and
photophobia) irritations and lumbago was higher and the contents of lysozyme and
IgA in saliva were lower in test group. They concluded that a long-time working in
AC environments could have adverse effects on s immune functions.
Zhang (2002) conducted another survey on 160 workers in AC of and they
found higher prevalence of SBS in the test group except for headache.
Liang et al. (2004) found in a survey on 523 workers in AC of and work-
shops that the prevalence of SBS like dizziness, fatigue, sleepiness, catching cold
and uncomfortable throat in AC environments were s higher than that
in NV environments, even when the environmental parameters in both environ-
ments met the requirements of the national standards. Jiang et al. (2008) conducted

512 Y. Zhang and X. Ji
neurobehavioral tests on 86 workers in AC environments and their results showed
that while compared with the control group, their scores are higher on negative sen-
timents and lower on positive sentiments, and their reaction times are longer and
digital decoding is worse. Meanwhile, they found higher CO2 and formaldehyde
concentrations in AC environments.
29.2.1.2 Mechanism Studies
The surveys provide the primary observations on the health effects of indoor
environments, and meanwhile, many researchers attempted to explain the mecha-
nisms of the effects and determine the key factors and the acceptable environmental
conditions by using epidemiological, toxicological and statistical approaches.
Yao et al. (1994) conducted tests of cerebral blood w on 233 workers from
AC factories and hotels. They found that the long-time exposure in AC environ-
ments had adverse effects on cerebrovascular system and induced more abnormities
in cerebral blood w. They also indicated that the symptoms found in AC environ-
ments such as headache and dizziness may be relevant to the variation of cerebral
blood w. Chen and Yu (1999) selected 120 healthy female workers working in
AC environments for more than 2 years as the test group, and divided them into two
sub-groups according to the negative ion concentrations of their ambient environ-
ments, and found through immune function tests that a long-time exposure to low
concentrations of negative ions could reduce the content of IgG in blood.
Xu et al. (2002) conducted immune function tests on 90 workers in AC environ-
ments and found that the CO2 and formaldehyde concentrations were higher and
the negative ion concentration was lower in AC environments. The contents of IgG,
IgM, IgA, C3 and C4 in the blood of the test group fell within the normal ranges, but
lower than those of the control group. They concluded that the low neg-
ative ion concentration in AC environments could have adverse effects on immune
functions. Zu et al. (2003) obtained the similar results in their studies on 87 workers.
Shang et al. (2005) and Bei et al. (2005) investigated the possible factors inducing
the uncomfortable symptoms in AC environments in summer by using epidemio-
logical and statistical approaches. They c the symptoms usually reported
into 12 categories (eye irritations, nose irritations, dry throat and mouth, irritancy,
cough, dry or itchy skin, fatigue or sleepiness, anxiety, dizziness or headache, nau-
sea, dif in concentrating and others) and the illnesses into 7 categories (cough,
cold, pneumonia, asthma, allergic rhinitis, skin allergies, heat stroke), which were
included into the questionnaires reported by 2,620 workers from hotels, restaurants
and of The subjects were systematically divided into four groups according
to their using of air-conditioning: AC workplace and home, AC workplace, AC
home and NV group (control group). They found in their investigations that the
prevalence of most of the symptoms and illnesses was higher for the
test group and the differences closed twofold for six symptoms. It was shown by
multivariate logistic regressions that 11 symptoms had positive correlations with
Ò air-conditioning both in workplace and and all kinds of symptoms
and illnesses were relevant to Ò air-conditioning both in workplace and

29 Sick Building Syndrome and Indoor Environmental Quality in China – A Review 513
0
20
40
60
80
100
120
1990 1995 1999 2000 2004 2005 2006 2007 2008
Year
Po
pu
lari
ty o
f ai
r-co
nd
itio
nin
gs
in c
itie
sss
(per
10
0 f
amil
ies)
Fig. 29.1 The increase of popularity of air-conditionings in China (China National Bureau of
Statistics 2009)
most closely, and then emperature is low in wor and Air is not r and
then r orking rr and not like the The
further analysis show that air-conditioning both in workplace and
Air is not r orking rr and not like the were independent
from each other and would be the important factors for the health effects.
The above mechanism studies indicate that the negative ion concentration may be
an important factor for the health effects, and cerebrovascular and immune function
tests may be helpful for the discovery of mechanisms, and the various symptoms and
illnesses are caused synthetically by multi-factors. The large temperature difference
between indoor and outdoor and the heat or cold stress produced by the difference
is proposed as another factor for the health effects in other studies (Zhu et al. 2001).
The mechanisms of the health effects of AC environments are still on going and
needed more systematic and basic research work.
The surveys and studies in early stage follow closely with the primary applica-
tions of air-conditionings. By contrast, the popularity of air-conditionings has been
raised promptly with the recent economic development (Fig. 29.1), however, the sur-
veys and studies seem not to catch up and progress slowly and lately. Meanwhile,
the research conditions for the comparisons of test and control group are gradually
disappearing and the relevant health problems are becoming more and more seri-
ous due to the widespread air-conditionings in buildings. More work is needed to
be done timely to guide and advance the healthy AC environments and buildings in
China.
29.2.2 Health Effects of Indoor Air Environments
The studies on health effects of indoor air environments in China started in the 1970s
of last century (Qian and Dai 2006). At that time around 50% populations used

514 Y. Zhang and X. Ji
coals and biomass fuels at home and the indoor air pollutions caused by Chinese
cooking were very common, therefore, the early studies were focused on the health
effects of the pollutants from combustion, smoking and cooking. One of the most
important studies is the project P of coal combustion and lung cancer in
❳P❯❱❲❨❩ which obtains the dose-response relationship between Benzo(a)pyrene
and lung cancer mortality through more than 10 ②❲❯❬❭ investigations and provides
a solid base for the national standards on Benzo(a) pyrene (Liu 2002).
Since the late ❪❫❭s, the focus of studies has changed from the indoor air pollu-
tants in high concentration, short exposure time and heavy effect to those in low
concentration, long exposure time and light effect, which include formaldehyde,
VOC, respirable particles, radon and biological pollutants. The following presents a
brief review of those studies.
29.2.2.1 Formaldehyde (FA)
Health effects of FA can be studied through investigations of workers or subjects
exposed to environments with FA. Wei et al. (2002) reported that the male workers
working in the workplace with FA concentration of 0.341 mg/m3 had lower contents
of IgG in blood. Ying et al. (1999) exposed twenty-three non-smoking students to
0.39–0.68 mg/m3 of FA for a period of 8 weeks (3 h×3 times each week) during
anatomy classes. ❴❵❯ increase was found in the percentage of CD19, while
❵❯ decrease was observed in CD3, CD4 and CD8 with a p < 0.01 after FA
exposures. Increase in the ratio of T4/T8 was also observed with statistical signif-
icance after exposure. It was concluded by the authors that FA could have adverse
effects on immune functions. Liu et al. (1998) reported in their investigations on
4,875 workers that the prevalence of gastric cancer for the group exposed to FA
was 97.13/105, which was higher than that for the control group (33.46/105) and
they indicated that FA might be a risky factor for gastric cancer. Wang et al. (1997)
reported that 80 workers exposed to FA for 12 years had ❵❯② higher fre-
quencies of micronucleated cell in peripheral lymphocyte than the control group.
Other studies (Li et al. 2007; Lv et al. 2001; Ren 2005; Wang et al. 1990; Yu et al.
2000; Zhang 2009; Zhang et al. 1999) investigate homes, public buildings and furni-
ture shopping centers and that the health effects of FA are mainly irritations of
eye, nose and throat with the symptoms of cough, chest tightness, sleepiness, fatigue
and irregular menstruation.
Health effects of FA can also be studied through toxicological experiments on
animals. Yi et al. (2000) and Xie et al. (2003) studied the FA toxicity on germ cells
of male mice. They injected FA into mice for 5 days and found that the number
of sperm decreased, the sperm activity weakened and the sperm deformation ration
increased after injections. Liu et al. (2003b) studied the oxidation damage effects
of gaseous FA on organs of mice. The mice were treated by various doses of FA
visa inhalation for 72 h and the superoxide dismutase (SOD) activities of 5 organs
(brain, lung, heart, liver, and kidney) were measured. They found that SOD activity
in liver decreased ❵❯② (p < 0.05) after inhalation of 1.2 mg/m3 FA, and the
SOD activities in liver, kidney and lung decreased ❵❯② after inhalation of

29 Sick Building Syndrome and Indoor Environmental Quality in China – A Review 515
3.7 mg/m3 FA. Wen et al. (2001) reported that FA could suppress the humoral and
cellular immunity and macrophage function of mice.
29.2.2.2 Radon
The radon concentration is high in the traditional caves in the west-north area of
China and the health effects of radon may be serious for the local inhabitants in that
area. Wang et al. (2002) studied the lung cancer risk in Pingliang and Qingyang in
Gansu province in China. 1209 lung cancer patients diagnosed during 1994–1998
were selected as the test group and 1968 healthy persons were selected as the control
group. The surveys on both groups were conducted by using questionnaires and
radon detectors, which were placed in all houses occupied for more than 2 years
by the subjects. The mean radon concentration was 230.4 Bq/m3 for the test group
and 222.2 Bq/m3 for the control group. Lung cancer risk was found to increase with
radon level s♠♥♦♣q (p < 0.001). Based on a linear model, the excess odds ratio
(EOR) at 100 Bq/m3 was found to be 0.19 (95%CI: 0.05, 0,147) for all subjects.
They concluded that indoor radon exposures would increase lung cancer risks.
29.2.2.3 Biological Pollutants
The studies on biological pollutants started in the 1950s of last century. Xu (1956)
reported a study on chigger and scrub typhus in 1956. Zhang et al. (1961) inves-
tigated the pollutions in classrooms in 1961 and found that the increases of CO2,
dust and bacteria concentrations resulted in the tension or disorder of temperature
regulation, reduced learning effects, increased fatigue and absent rate for children.
In the recent 10 years, lots of studies were conducted in public places due to their
high density and large mobility of people, complex sources of biological pollutions
and serious health problems. Liu and Shen (2003) investigated the public entertain-
ment places in Yinchuan in 2003 and found that the concentrations of bacteria and
streptococcus hemolyticus were higher than the limits of the national standards in
1.5 and 2.4 times respectively. They also found that the people in the places com-
plained of chest tightness, memory loss, dermatitis and decreased vision. Zhu et al.
(2007) conducted a survey on asthma patients and found seasonal variations of IgE,
s-IgE, s-IgG1, s-IgG2, s-IgG4 and breeding density of dust mites in their bedrooms.
They indicated that the st♠♠ antibodies of asthma patients might be related to
the breeding density of dust mites in their bedrooms. Fang et al. (2000) indicated in
another study on asthma patients that the prevalence of asthma was relevant to the
density of dust mites.
Other studies (Chen et al. 2001; Jiang et al. 2009; Liao et al. 2005; Peng et al.
2000; H. Shen et al. 2008; Xu et al. 2008; Zhou et al. 2004) investigated the
Legionella bacteria in various kinds of public buildings (hotels, cinemas, hospitals,
subway stations, shopping centers, of♠ buildings and restaurants) and found high
prevalence of the Leg♥①s disease. The existing studies on biological pollu-
tants in China are mostly focused on the concentrations of bacteria and epiphyte,

516 Y. Zhang and X. Ji
and the number of studies on the health effects of biological pollutants is relatively
small (Zhao et al. 2009).
29.2.2.4 Integrated Effects
Except for the studies on the health effects of a single pollutant, some studies are
focused on the integrated effects of various pollutants in indoor air environments
in various kinds of actual buildings. Some examples are presented as followings.
Li et al. (1995) conducted a ③④⑤⑥ survey on shopping centers and found markedly
higher concentrations of CO2, dust, H2S, oxygen consumption and bacteria in the air
environments and larger number of T-Lymphocyte, smaller content of lysozyme and
worse performance on neurobehavioral functions in the test group. Ma (2006) inves-
tigated the of③⑦④⑧ just decorated and found that the concentrations of formaldehyde,
NH3, benzene, toluene and xylene were high in the indoor environments 2 months
after decoration, which were 0.447, 0.857, 0.460, 0.424 and 0.630 mg/m3 respec-
tively. The workers in the of③⑦④⑧ reported more complaints of symptoms such as
irritations of eye, throat, skin and nose, cough, asthma, headache, loss of appetite
and itchy skin than the control group, and the prevalence of the symptoms was found
to be correlated positively with the concentrations of formaldehyde, NH3, benzene,
toluene and xylene, and negatively with the time after decoration. Dong et al. (2005)
reported in their survey in nursery and primary schools that the prevalence of cough,
expectoration and asthma for children was 9.48, 4.82 and 1.33%, and the prevalence
increased with the number of smokers in family, and the prevalence was relatively
high for the children whose families have been decorated in recent 3 years. Wang
(2008) conducted a survey on indoor air environments in dormitories and found
that the students living in a room presence of mold/damp spots, pets, cockroach or
passive smoking had a higher prevalence of asthma and damp and mold were risk
factors of asthma.
It is worth to mention that some researchers attempted to determine the dose-
response relationship for a single indoor pollutant by using controlled human
exposure experiments. Yang et al. (1999; 2000) and Chen et al. (2000a, b) estab-
lished a climate chamber to study the effect of FA on eye illness and they obtained
the relationships between concentration of FA and sensory intensity of eye irritation
and eye blinking frequency.
29.2.3 Subjective Assessments of Indoor Air Quality
Shen (1997; 2002) introduced a subjective assessment method of indoor air quality
by referring to ASHRAE and WHO standards and guidance in the 1990s of last cen-
tury, which includes the acceptability votes of indoor air quality and the reports on
various symptoms. Lots of indoor air quality surveys have been conducted in many
cities thereafter, and those surveys provide the primary information on the status of
SBS in buildings. The main results are reviewed as followings. Shen et al. (1996)

29 Sick Building Syndrome and Indoor Environmental Quality in China – A Review 517
⑨⑩❶❷❸❹❺❻ the existence of SBS in of❷⑨❺❼ in Shanghai by reporting that the mean
acceptability of indoor air quality was only 45.2% and over one third of the occu-
pants reported the symptoms of fatigue, dizziness, headache, dry mouth and eye
and catching cold. Pan et al. (2000) investigated the indoor air quality in shopping
centers in Shanghai in 2000 and found that in some spaces of the shopping cen-
ters the temperature and CO2 concentration were high and the ventilation rate was
low, and the percentage ❻❽❼❼❾❿❽❼❷❺❻ of occupants was higher with indoor air quality
(35%) than light or sound environments. We et al. (2001) analyzed the survey data
of of❷⑨❺❼ in Shanghai by using grey system incidence theory and indicated that the
respirable particles and bacteria were the main factors for the d❽❼❼❾❿❽❼❷❺❻ indoor air
quality.
Pan et al. (2003) conducted an indoor air quality survey in seven of❷⑨❺ build-
ings in Shanghai and the results show that the percentage ❻❽❼❼❾❿❽❼❷❺❻ with indoor
air quality (more than 20%) is higher than that with other environmental qualities.
Liu et al. (2003) performed a survey in of❷⑨❺ buildings in Shenzhen and found
that meeting the requirements of national standards could not ❼❾❿❽❼❷❺❻ most of the
occupants and the percentage ❻❽❼❼❾❿❽❼❷❺❻ with indoor air quality was 25% for long-
time occupants and 51.9% for visitors. SBS was believed to be caused by the poor
indoor air quality by 44% of subjects. Tian et al. (2004) investigated the indoor air
quality in underground shopping centers in Dalian and reported that the air temper-
ature was high and the ventilation rate was low, and the prevalence of symptoms of
headache, fatigue, asthma, dry eye was 27, 29, 8 and 29% respectively. Pei et al.
(2006) reported in their survey on shopping centers in Guangzhou that the main
indoor pollutants were respirable particles, TVOC and ozone, and the percentage
❻❽❼❼❾❿❽❼❷❺❻ with indoor air quality was 22.64%, and the mainly reported SBS were
the symptoms of angina, dry eye, sleepiness, fatigue and itchy skin.
29.3 Standards and Norms
Based on the surveys and studies on health effects of indoor environments and the
references of international standards and guidance, several national standards and
norms related with indoor environments and SBS were published successively to
prevent, evaluate and control the SBS in buildings.
29.3.1 Indoor Air Quality Standards
The ➀Regulations for Hygienic Management of Public ➁➂❾⑨❺❼➃ was promulgated by
the State Council of China in 1987 and the ➀Hygienic Standard for Public ➁➂❾⑨❺❼➃
was promulgated by the Ministry of Health of China in 1988. In 1996, several
hygienic standards for public places were promulgated together by the General
Administration of Quality Supervision, Inspection and Quarantine and the Ministry
of Health of China with the following codes and titles.

518 Y. Zhang and X. Ji
GB 9663-1996, Hygienic Standard for Hotel
GB 9664-1996, Hygienic Standard for Public Place of Entertainment
GB 9665-1996, Hygienic Standard for Public Bathroom
GB 9666-1996, Hygienic Standard for Barber Shop and Beauty Shop
GB 9667-1996, Hygienic Standard for Swimming Place
GB 9668-1996, Hygienic Standard for Gymnasium
GB 9669-1996, Hygienic Standard for Library, Museum, Art Gallery and
Exhibition
GB 9670-1996, Hygienic Standard for Shopping Centre and Book Store
GB 9671-1996, Hygienic Standard for Waiting Room in Hospital
GB 9672-1996, Hygienic Standard for Waiting Room of Publictransit Means
GB 9673-1996, Hygienic Standard for Public Means of Transportation
GB 16153-1996, Hygienic Standard for Dining
The limits on CO2, FA, respirable particles and bacteria concentrations in the above
standards are listed in Table 29.1. Several hygienic standards for indoor pollutants
were promulgated by the Ministry of Health of China since 1997 and Table 29.2
shows their codes, titles and limits.
It can be seen by comparing Tables 29.2 and 29.1 that the limits on carbon diox-
ide and respirable particles are strengthened and more indoor air pollutants are
included in the standards in Table 29.2. The ➄➅➆➇ national indoor air quality stan-
dard was promulgated in a systematical and complete form in 2002 by the General
Administration of Quality Supervision, Inspection and Quarantine, the Ministry of
Health and the State Environmental Protection Administration of China. The stan-
dard provides the requirements of indoor air environments (Table 29.3) and the
Table 29.1 The limits in the hygienic standards
Place CO2 (%) FA (mg/m3)
Respirable
particles
(mg/m3)
Bacteria
(cfu/m3)
Hotel in t➈➉➊➊➋➌ve stars 0.07 0.12 0.15 1,000
Bar, teahouse and coffee house 0.15 0.12 0.20 2,500
Cinema, concert hall and
ballroom
0.15 0.12 0.20 4,000
Beauty shop 0.10 0.12 0.15 4,000
Library, museum, art gallery 0.10 0.12 0.15 2,500
Gymnasium 0.15 0.12 0.25 4,000
Shopping centre and book store 0.15 0.12 0.25 7,000
Exhibition 0.15 0.12 0.25 7,000
Waiting room in hospital 0.10 0.12 0.15 4,000
Dining place 0.15 0.12 0.15 4,000
Waiting room of train 0.15 0.12 0.25 7,000
Waiting room of airplane 0.15 0.12 0.15 4,000
Cabin of train 0.15 – 0.25 4,000
Cabin of airplane 0.15 – 0.15 2,500

29 Sick Building Syndrome and Indoor Environmental Quality in China – A Review 519
Table 29.2 Hygienic standards for indoor air pollutants in China
Code Title Limit
GB/T
17093-1997
Hygienic standard for bacteria total in indoor air 4,000 cfu/ m3
GB/T
17094-1997
Hygienic standard for carbon dioxide in indoor air 0.10% (2,000 mg/m3)
GB/T
17095-1997
Hygienic standard for inhalable particulate matter
in indoor air
0.15 mg/m3 (daily
average)
GB/T
17096-1997
Hygienic standard for nitrogen oxides in indoor
air
0.10 mg/m3 (daily
average)
GB/T
17097-1997
Hygienic standard for sulfur dioxide in indoor air 0.15 mg/m3 (daily
average)
WS/T
182-1999
Hygienic standard for benzo(a)pyrene in indoor
air
0.1 µg/100 m3 (daily
average)
GB/T
18202-2000
Hygienic standard for ozone in indoor air 0.10 mg/m3 (hourly
average)
GB/T
18203-2000
Hygienic standard for streptococcus hemolyticus
in indoor air
36 cfu/m3
GB
18468-2001
Hygienic standard for P-dichlorobenzene in
indoor air
1.0 mg/m3 (daily
average)
relevant testing methods and is suitable for residential buildings and of➍➎➏➐➑ The
built environments in other buildings can be designed or evaluated according to it as
well.
It can be seen by comparing Tables 29.2 and 29.3 that the requirements on some
indoor air pollutants are raised and more potential indoor pollutants are included in
the Indoor Air Quality Standard.
29.3.2 Hygienic Norms For Air-Conditioning and Ventilation
Systems
Air-conditioning and ventilation systems are the main sources of indoor air
pollutions and causes of SBS in buildings, and the Ministry of Health of China
promulgated three hygienic norms in 2006 to strengthen the managements of air-
conditioning and ventilation systems in public places (Ministry of Health of China
2006).
The ➒Hygienic Norm for Air-conditioning and Ventilation Systems in Public
➓→➎➏➐ prescribes the requirements and testing methods for the hygienic conditions
of air-conditioning and ventilation systems in public places and its main content is
summarized as followings.
Legionella bacteria should not be detected in cooling and condensing water and
ventilation rate should meet the requirements in Table 29.4. Air supply should
meet the requirements of Table 29.5. Inner surface of air ducts should meet the

520 Y. Zhang and X. Ji
Tab
le29.3
The
requir
emen
tsof
indoor
air
qual
ity
stan
dar
d(G
B/T
18883-2
002
2002)
No
.C
ateg
ory
Par
amet
erU
nit
Lim
itN
ote
1P
hysi
cal
Tem
per
atu
reC
22–28
Cooli
ng
seas
on
16–24
Hea
ting
seas
on
2R
elat
ive
hum
idit
y%
40–80
Cooli
ng
seas
on
30–60
Hea
ting
seas
on
3A
irsp
eed
m/s
0.3
Co
oli
ng
seas
on
0.2
Hea
tin
gse
aso
n
4C
hem
ical
Ven
tila
tio
nra
tem
3/(
h•per
son)
30
a
5S
ulf
ur
dio
xid
eS
O2
mg
/m3
0.5
0H
ourl
yav
erag
e
6S
ilic
on
dio
xid
eN
O2
mg
/m3
0.2
4H
ourl
yav
erag
e
7C
arbon
monoxid
eC
Om
g/m
310
Hourl
yav
erag
e
8C
arbon
dio
xid
eC
O2
0.1
0D
aily
aver
age
9A
mm
onia
NH
3m
g/m
30.2
0H
ourl
yav
erag
e
10
Ozo
ne
O3
mg
/m3
0.1
6H
ourl
yav
erag
e
11
Form
aldeh
yde
HC
HO
mg/m
30.1
0H
ourl
yav
erag
e
12
Ben
zene
C6H
6m
g/m
30.1
1H
ourl
yav
erag
e
13
Tolu
ene
C7H
8m
g/m
30.2
0H
ourl
yav
erag
e
14
Xyle
ne
C8H
10
mg
/m3
0.2
0H
ourl
yav
erag
e
15
Ben
zo(a
)pyre
ne
B(a
)Png/m
31
.0D
aily
aver
age
16
Res
pir
able
par
ticl
esP
M1
0m
g/m
30.1
5D
aily
aver
age
17
TV
OC
mg/m
30.6
0A
ver
age
in8
hours
18
Bio
log
ical
Bac
teri
acf
u/m
32,5
00
Dep
ended
on
dev
ices
b
19
Rad
ioac
tive
Rad
on
Rn
Bq
/m3
400
Annual
aver
age
(act
ion
level
c)
aR
equ
irem
ent
of
ven
tila
tio
nra
te≥
lim
itan
dre
qu
irem
ents
of
oth
erp
aram
eter
sex
cep
tfo
rte
mp
erat
ure
and
rela
tive
hu
mid
ity
≤li
mit
.b
See
adden
da
Dof
the
stan
dar
d.
cA
ctio
ns
are
reco
mm
end
edto
be
do
ne
tod
ecre
ase
the
con
cen
trat
ion
of
rad
on
wh
ile
the
lim
itis
reac
hed
.

29 Sick Building Syndrome and Indoor Environmental Quality in China – A Review 521
Table 29.4 Hygienic requirements for ventilation rate
Place Ventilation rate (m3/(h•person))
Hotel t↔ve stars ≥ 30
one-two stars ≥ 20
no stars ≥ 20
Dining place ≥ 20
Cinema, concert hall and video hall ≥ 20
Recreation hall and ballroom ≥ 30
Bar, teahouse and coffee house ≥ 10
Gymnasium ≥ 20
Shopping centre and book store ≥ 20
Cabin of train and ship ≥ 20
Cabin of airplane ≥ 25
Table 29.5 Hygienic requirements for air supply
Parameter Requirement
PM10 ≤ 0.08 mg/m3
Bacteria ≤ 500 cfu/m3
Epiphyte ≤ 500 cfu/m3
Streptococcus Hemolyticus Not detectable
requirements of Table 29.6. Air should not emit any pollutants in princi-
ple and should meet the requirements of Table 29.7. Air should meet the
requirements for their performances in Table 29.8.
The Hygienic Assessment Norm for Air-conditioning and Ventilation Systems
in Public prescribes the assessment methods for the new, reconstructed,
Table 29.6 Hygienic requirements for inner surface of air ducts
Parameter Requirement
Dust ≤ 20 g/m2
Pathogenic microorganisms Not detectable
Bacteria ≤100 cfu/cm2
Epiphyte ≤100 cfu/cm2
Table 29.7 Hygienic requirements for air emissions
Parameter Emission
Ozone ≤ 0.10 mg/m3
Ultraviolet radiation (in a distance
of 30 cm)
≤ 5 µw/cm2
TVOC ≤ 0.06 mg/m3
PM10 ≤ 0.02 mg/m3

522 Y. Zhang and X. Ji
Table 29.8 Hygienic requirements for air performances
Item Condition Requirement
Resistance Normal air supply and return ≤ 50 Pa
efciency for
particulates
Once through ≥ 50%
efciency for
microorganisms
Once through ≥ 50%
Performance for long time After 24 continuous
working
Decrease in efciency <
10%
Disinfection Once through Sterilization rate ≥ 90%
extended or running air-conditioning and ventilation systems in public places. Two
kinds of hygienic assessment: preventive (for design and ve❮❰ÏÐÑ and reg-
ular assessment, and their purposes, references, contents, technical requirements
and reports are provided in details in the norm. The ÓCleaning Norm for Air-
conditioning and Ventilation Systems in Public ÔÕ❮Ö×Ø prescribes the cleaning
methods for the main parts of air-conditioning and ventilation systems in pub-
lic place, which include the technical requirements, performances and security for
cleaning process, agency and devices.
29.3.3 Other Standards and Norms
Several standards and norms on building materials and constructions have been
published to prevent and control the indoor air pollutions. The ÓÙÏÚÖ for Indoor
Environmental Pollution Control of Civil Building EÐÛÐÖÖÐÛØ (GB 50325-2001)
prescribes the requirements for building materials (inorganic non-metallic main
materials for buildings and decoration materials such as ❮❰❮Õ wood, coating,
adhesive and water treatment agent), survey and design (site investigation on soil
radon concentration and material selection), constructions and ve❮❰ÏÐ× to con-
trol the concentrations of radon, formaldehyde, ammonia, benzene and TVOC,
which is applicable for the new, reconstructed or extended civil buildings.
Other standards on building materials are listed below.
GB 18580-2001, Indoor Decorating and Refurbishing Materials – Limit of
Formaldehyde Emission of Wood- Based Panels and Finishing Products
GB 18581-2001, Indoor Decorating and Refurbishing Materials – Limit of
Harmful Substances of Solvent Coatings for Woodenware
GB 18582-2001, Indoor Decorating and Refurbishing Materials – Limit of
Harmful Substances of Interior Architectural Coating
GB 18583-2001, Indoor Decorating and Refurbishing Materials – Limit of
Harmful Substances of Adhesives
GB 18584-2001, Indoor Decorating and Refurbishing Materials – Limit of
Harmful Substances of Wood Based Furniture
29 Sick Building Syndrome and Indoor Environmental Quality in China – A Review 523
GB 18585-2001, Indoor Decorating and Refurbishing Materials – Limit of
Harmful Substances of Wallpaper
GB 18586-2001, Indoor Decorating and Refurbishing Materials – Limit of
Harmful Substances of Polyvinyl Chloride Floor Coverings
GB 18587-2001, Indoor Decorating and Refurbishing Materials – Limitations
of Harmful Substances Emitted From Carpets, Carpet Cushions and
Adhesives
GB 18588-2001, Limit of Ammonia Emitted from the Concrete Admixtures
GB 6566-2001, Limit of Radionuclides in Building Materials
In summary, a primary standard system has been established in China for indoor
air environments and SBS, which includes the standards and norms on indoor air
quality, air-conditioning and ventilation system, building materials and construc-
tions, and prescribes the requirements for indoor environmental parameters, design
and operation of air-conditioning and ventilation systems, harmful substances of
decorating and refurbishing materials and pollution control of building engineering.
Though the standards and norms are needed to be improved based on the sÜÝàáâÝãÜ
researches and large-scale surveys in future, the standard system has advanced to a
large extent the improvements of indoor air environments and the solving of SBS
problems in buildings. An effective way is to revise and improve the standard system
continuously during practical applications.
29.4 Status Surveys
Many status surveys in relatively large scale have been done in China based on the
published standards and norms with the purposes of knowing the current status of
indoor air environments in buildings and providing basic information for the further
studies and standards. Most of the surveys are still on going and the primary results
are reviewed as followings.
29.4.1 Indoor Air Quality
29.4.1.1 Formaldehyde (FA)
Table 29.9 shows the survey data on FA concentration in built environments in nine
cities in China. The failure rate on FA concentration is lowest in Shenyang and
highest in Guangzhou and the average rate for all nine cities is 82.8%, which means
the FA pollutions in indoor environments are serious.
In 2009 an inspection on blockboard was performed by the General
Administration of Quality Supervision, Inspection and Quarantine of China. Totally
122 kinds of products from 10 areas were tested with a passing rate of 96.5%.
The main problems found were high FA emission and inadequate bending strength.
Compared with the previous inspections since 2005, the problems with FA emission

524 Y. Zhang and X. Ji
Table 29.9 FA concentrations in built environments in nine cities in China (Jiang and Zhang 2009)
City Sample
Range of
concentration
(mg/m3)
Average
concentration
(mg/m3)
Failure rate
(%)
Huangshi 59 0.04–2.96 0.56 86.4
Zhengzhou 250 0.02–2.42 0.38 74.5
Tianjin 200 0.03–5.02 – 87
Guangzhou 562 0.02–1.81 0.25 94
äåæçè 30 0.04–0.54 0.29 88
Fuzhou 43 0.06–2.67 – 81
Chengdu 128 0.05–0.28 0.15 82
Wuhan 50 0.07–1.6 0.08 81
Shenyang 44 0.00–3.85 0.84 71
had been greatly reduced in 2009 with an improvement of 9.4% on passing rate of
FA emission and 36.2% on that of product quality.
29.4.1.2 Biological Pollutants
There are many reports on bacteria concentrations in indoor environments in vari-
ous areas of China. The general trend is the concentration is higher in summer (vs
winter), morning and evening (vs noon), and public places (vs residential buildings)
(Zhang 2001). The bacteria concentration is less than 5,000 cfu/m3 in homes with
good conditions and higher than 10,000 cfu/m3 in homes with bad conditions (Zhou
et al. 1986). The bacteria concentration is about 13,699 cfu/m3 in the indoor envi-
ronments in northern rural buildings and 31,331 cfu/m3 in southern buildings mixed
with livestock (Shi et al. 1987). The bacteria concentration is less than 2,500 cfu/m3
in the operating rooms in hospitals (Tan and Lu 1989; Yan and Xu 1989) and more
than 10,000 cfu/m3 in the crowded and sealed waiting rooms (Shun et al. 1989;
Zhang et al. 1987).
29.4.1.3 Radon
Ren (2001) made a statistic on the radon concentrations in China based on the
published literature before 1994 and the results are shown in Table 29.10.
Figure 29.2 shows the indoor and outdoor radon concentrations in different areas
of China. The areas with higher indoor radon concentrations are Fujian, Shanxi and
Hunan, and those with lower concentrations are Jilin and Tibet. It was estimated that
the effective exposure of radon and its progeny was 0.84 mSv, in which 0.7 mSv was
for indoor and 0.14 mSv was for outdoor.
The indoor radon concentrations change seasonally and diurnally in China
(Fig. 29.3). The concentrations in spring are highest and the diurnal variation is
1.96, 4.91, 2.93 and 1.51 for spring, summer, autumn and winter.
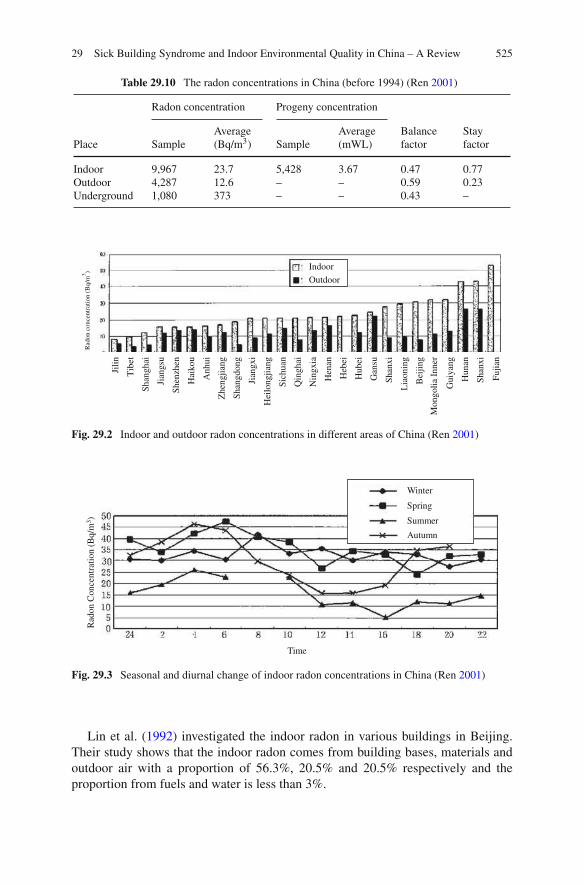
29 Sick Building Syndrome and Indoor Environmental Quality in China – A Review 525
Table 29.10 The radon concentrations in China (before 1994) (Ren 2001)
Radon concentration Progeny concentration
Place Sample
Average
(Bq/m3) Sample
Average
(mWL)
Balance
factor
Stay
factor
Indoor 9,967 23.7 5,428 3.67 0.47 0.77
Outdoor 4,287 12.6 – – 0.59 0.23
Underground 1,080 373 – – 0.43 –
Indoor
Outdoor
Jili
n
Tib
et
Shan
ghai
Jian
gsu
Shen
zhen
Hai
kou
Anhui
Zhen
gji
ang
Shan
gdong
Jian
gxi
Hei
longji
ang
Sic
huan
Qin
ghai
Nin
gxia
Hen
an
Heb
ei
Hubei
Gan
su
Shan
xi
Lia
onin
g
Bei
jing
Mongoli
a In
ner
Guiy
ang
Hunan
Shan
xi
Fu
jian
Rad
on c
once
ntr
atio
n (
Bq/m
3)
Fig. 29.2 Indoor and outdoor radon concentrations in different areas of China (Ren 2001)
Time
Rad
on C
once
ntr
atio
n (
Bq/m
3)
Winter
Spring
Summer
Autumn
Fig. 29.3 Seasonal and diurnal change of indoor radon concentrations in China (Ren 2001)
Lin et al. (1992) investigated the indoor radon in various buildings in Beijing.
Their study shows that the indoor radon comes from building bases, materials and
outdoor air with a proportion of 56.3%, 20.5% and 20.5% respectively and the
proportion from fuels and water is less than 3%.

526 Y. Zhang and X. Ji
a) pl asticizers b) flame retardants
Fig. 29.4 Consumption of plasticizers in the world and production of éame retardants in China in
2006 (Wang et al. 2010). (a) plasticizers, (b) éame retardants
29.4.1.4 SVOC
Figure 29.4 indicates that China consumed 25% of plasticizers in the world as the
biggest consumer (Tao and Liang 2008) and produced 260 kt êëìí retardants in
2006 and the growth rate of average annual consumption of êëìí retardants was
over 20% in China as 4 times that of the whole world from 2002–2004 (Wang et al.
2010).
China produces and consumes great amounts of pesticides, in which mosquito
coil, aerosol, electric mosquito-chip, electric mosquito liquid, and other pesticides
account for 45.5%, 31.9%, 8.5%, 2.7% and 11.4% respectively (Jiang and Wang
2006). The production and consumption of coal in China is the highest in the
world. 1.67 billion tons was produced in 2003, accounted for 33.5% of that in the
world, and the coal combustion provided 36% of annual civilian energy in China
(Wang 2005). The production and consumption of cigarettes is also very high in
China. Field measurements showed that both Chinese cooking, coal combustion and
cigarettes can produce vast quantities of PAHs (Chen et al. 2004; Du et al. 2006; See
et al. 2006).
Wang et al. estimated the PAEs exposure for different groups of people in China
by using the dust-concentration of PAEs found in 10 houses in China (Shen et al.
2008), and the airborne (gas-phase and particle-phase) and dust-phase concentra-
tions recorded in 30 houses in Germany (Shen et al. 2008), and the human behavior
characteristics provided by the USEPA (1997). The results are shown in Fig. 29.5.
29.4.2 Air-Conditioning and Ventilation Systems
In 2004 a national inspection on air-conditioning and ventilation systems in nearly
1,000 buildings was performed by the Ministry of Health in China and the report
of the inspection shows that around half of the samples are heavily polluted with
high concentrations of dust, bacteria and epiphyte and the passing rate is only 6%
(Ministry of Health in China 2004). The report was achieved considerable attentions
from governments, managements and researchers, and lots of îíïð surveys were

29 Sick Building Syndrome and Indoor Environmental Quality in China – A Review 527
Fig. 29.5 Total exposure of
adults and children to DEHP
(Wang et al. 2010)
Table 29.11 Distribution of the samples
Area Beijing Shanghai Tianjin Anhui Shangdong Liaoning Guangdong Zhejiang
Sample
size
139 84 32 360 238 266 96 157
Henan Hebei Hunan Jiangsu Hubei Fujian Guangxi Heilongjiang Sichuan
32 72 106 127 38 47 88 32 75
conducted thereafter on air-conditioning and ventilation systems in various area of
China. The reports and papers published since 2002 are collected by the authors
with a sample size of 2,027, which is shown in Table 29.11. The concentrations of
dust, bacteria and epiphyte are shown in Tables 29.12, 29.13, 29.14 and 29.15.
It can be seen that in the areas with high humidities, such as Shanghai, Liaoning
(most surveys in Dalian) and Zhejiang, the pollutions of bacteria and epiphyte are
more serious. The concentration of dust in Beijing is large due to the particles from
Table 29.12 The concentrations of dust, bacteria and epiphyte in air-conditioning and ventilation
systems for different areas
Area Sample size Dust (g/m2)
Bacteria
(104 cfu/g)
Epiphyte
(103 cfu/g)
Beijing 28 60.06 10.00 39.6
Tianjin 32 12.89 1.78 8.0
Shanghai 4 17.40 20.50 240.0
Hebei 72 3.75 2.33 58.7
Shangdong 127 14.22 1.20 9.0
Liaoning (Dalian) 20 21.0 12.0 150.0
Liaoning (Shenyang) 179 17.1 6.01 39.8
Zhejiang 20 9.97 7.60 76.4
Heilongjiang 30 7.7 16 600
Jiangsu 156 15.3 12.5 13.1
Hunan 62 7.18 24.3 87.3
Sichuan 5 3.6 3.38 13.1
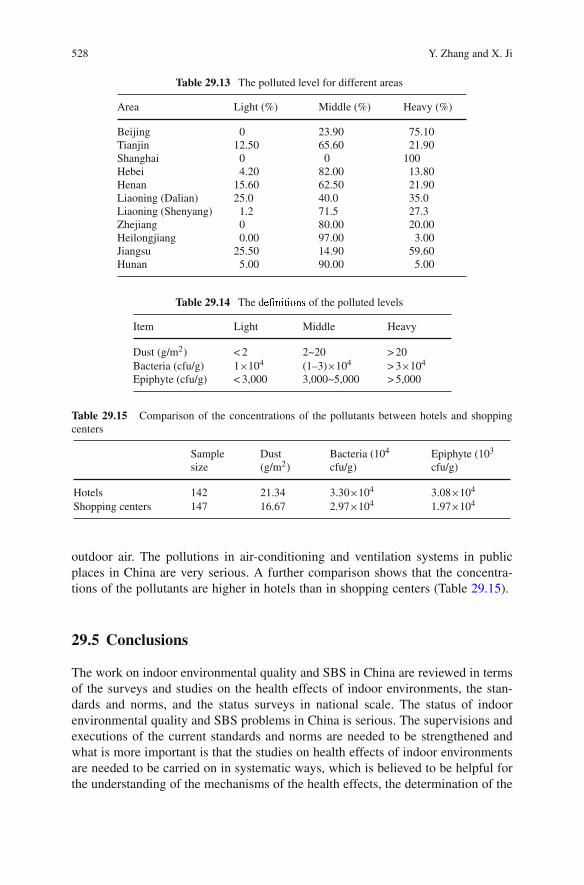
528 Y. Zhang and X. Ji
Table 29.13 The polluted level for different areas
Area Light (%) Middle (%) Heavy (%)
Beijing 0 23.90 75.10
Tianjin 12.50 65.60 21.90
Shanghai 0 0 100
Hebei 4.20 82.00 13.80
Henan 15.60 62.50 21.90
Liaoning (Dalian) 25.0 40.0 35.0
Liaoning (Shenyang) 1.2 71.5 27.3
Zhejiang 0 80.00 20.00
Heilongjiang 0.00 97.00 3.00
Jiangsu 25.50 14.90 59.60
Hunan 5.00 90.00 5.00
Table 29.14 The dñòóôõôöó÷ of the polluted levels
Item Light Middle Heavy
Dust (g/m2) < 2 2~20 > 20
Bacteria (cfu/g) 1×10⁴ (1–3)×104 > 3×10⁴
Epiphyte (cfu/g) < 3,000 3,000~5,000 > 5,000
Table 29.15 Comparison of the concentrations of the pollutants between hotels and shopping
centers
Sample
size
Dust
(g/m2)
Bacteria (104
cfu/g)
Epiphyte (103
cfu/g)
Hotels 142 21.34 3.30×10⁴ 3.08×10⁴
Shopping centers 147 16.67 2.97×10⁴ 1.97×10⁴
outdoor air. The pollutions in air-conditioning and ventilation systems in public
places in China are very serious. A further comparison shows that the concentra-
tions of the pollutants are higher in hotels than in shopping centers (Table 29.15).
29.5 Conclusions
The work on indoor environmental quality and SBS in China are reviewed in terms
of the surveys and studies on the health effects of indoor environments, the stan-
dards and norms, and the status surveys in national scale. The status of indoor
environmental quality and SBS problems in China is serious. The supervisions and
executions of the current standards and norms are needed to be strengthened and
what is more important is that the studies on health effects of indoor environments
are needed to be carried on in systematic ways, which is believed to be helpful for
the understanding of the mechanisms of the health effects, the determination of the

29 Sick Building Syndrome and Indoor Environmental Quality in China – A Review 529
important environmental factors and their acceptable ranges and the development of
the effective technologies for control of indoor pollutions.
References
Bei P, Pan Y, Wang Y, Zhao D (2005) Survey on relationship between air condition using and
incidence of pøùúûøüs common diseases in summer (in Chinese). J Lab Med 22(2):133–136.
Cao W, Qiu J, Feng X, Yang J (1998) The effects of working in air-conditioning spaces on
neurobehavior performances (in Chinese). Chin J Ind Med 11(2):109–110.
Chen D, Yang X, Yu J, Chen W (2000a) Controlled human exposure experiments – study
on measurement for eye conjunctival epithelium damage (in Chinese). J Environ Health
17(3):171–172.
Chen F, Yu S (1999) On the health effects of air ion concentrations in air-conditioned environments
(in Chinese). J Prev Med Info 15(3):179–180.
Chen W, Yang X, Li Y, Chen D (2000b) Controlled human exposure experiments – measurement
and evaluation criteria for sensory intensity of eyes irritation (in Chinese). J Environ Health
17(1):44–47.
Chen Y, Bi X, Mai B, Sheng G, Fu J (2004) Emission characterization of particulate/gaseous phases
and size association for polycyclic aromatic hydrocarbons from residential coal combustion.
Fuel 83(7–8):781–790.
Chen Y, Shen J, He Z, Jiang H (2001) Leýþùÿÿþøüs disease in shanghai in 1990–1999 (in Chinese).
Liferatue and Information on Preventive 7(2):158–159.
China National Bureau of Statistics (2009) China statistical yearbook in 2009.
Dong G, Guo H, Liu M, Jing L (2005) The effects of indoor air pollutions on respiratory system of
children (in Chinese). Chin J Health Stat 22(3):156–160.
Du X, Wang X, Tang J, Ding X (2006) Polycyclic aromatic hydrocarbons in mainstream smokes
from major cigarette brands sold in china (in Chinese). Environ Chem 25(6):785–788.
US Environmental Protection Agency (1997) Exposure Factors Handbook. US Environmental
Protection Agency, Washington DC.
Fang Z, Cai Y, Wang L, Jiang H (2000) The relationship between the density of dust mites in bed-
room and attacks of asthma (in Chinese). Chin J Ind Hygiene Occup Diseases 18(6):350–352.
Huang J, Wu Y, Sun X (1990) Indoor air quality and health effects of sealed air-conditioned
environments (in Chinese). J Hygiene Res 19(5):51–53.
Huang K, Zou H, Shen F, Chen Z (1996) The effects of sealed air-conditioned environments on
emmenia of female workers (in Chinese). Occup Health Emergency Rescue 14(3):17–18.
Ministry of Health of China (2006) Hygienic Norm for Air-conditioning and Ventilation
Systems in Public Pûøü and the others two norms are promulgated by the Ministry
of Health of China,http://www.moh.gov.ÿúûþûøþÿøûûøùýú
200804/27571.htm (in Chinese).
Jiang H, Shao Z, Li J, Zou M, Zhang S, Sun Y, Xu D (2009) Inspection on legionella pollution and
the health impact of workers in public places of central air conditioning systems in dalian city
(in Chinese). J Hygiene Res 38(1):76–77.
Jiang L, Wang Y, Deng K, Yang M (2008) Effects of air-conditioned environment on
neurobehavioral function in workers (in Chinese). J Public Health Prev Med 19(2):30–32.
Jiang T, Zhang S (2009) Actuality and prevention measure of indoor formaldehyde pollution in our
country (in Chinese). Forestry Sci Technol Info 41(1):92–94.
Jiang Z, Wang Y (2006) On the developments of pesticides in china (in Chinese). Chin J Hygienic
Insecticides Equipments 12(6):413–418.
Li S, Liu Y, Lin L, Cao P, Huo B, Zhang W (2007) Investigation on indoor air pollution to health
in decorated houses (in Chinese). Chin J Public Health 23(4):400–401.
Li Z, Sui C, Wang W, Jiang C (1995) Effect on the store air pollution on the salesmans in immune
function and neurobehavioral function (in Chinese). J Environ Health 12(6):247–249.

530 Y. Zhang and X. Ji
Liang M, Lin J, Zha Y, Yu Z (2004) Air quality in the occupational air-conditioned environment
and its effect on the health of workers (in Chinese). Chin Occup Med 31(4):21–23.
Liao T, Chen J, Lu X, Liu M (2005) Investigation on serum antibodies to legionella among healthy
people and patients suffering pulmonary diseases in Chengdu (in Chinese). Parasitoses and
Infections Diseases 3(1):3–6.
Lin L, Ma G, Wen H, Li G, Qi W (1992) Indoor radon measurements in the region of Beijing
(in Chinese). Environ Sci 13(5):10–15.
Liu C (1984) The health problems of the workers in air-conditioned factories are expected To Be
studied (in Chinese). Chin J Ind Hygiene Occup Diseases 2(5):306–307.
Liu H, Kang J, Zhao X, Jin S (2003a) A survey on the biological pollutions in indoor entertainment
spaces (in Chinese). Ningxia Med J 25(12):771–772.
Liu J (2002) Reviews on the health effects of indoor air quality (in Chinese). Chin Prev Med
3(3):161–163.
Liu J, Cui Y, Jia C, Yang S (1998) A relationship between occupational exposure to formaldehyde
and gastric cancer (in Chinese). Chin J Prev Control of Chronic Non-Communicable Diseases
6(4):775–775.
Liu J, Liu H, Wang G, Yan Y (2003b) Suppression effect of gasous formaldehyde on superoxide
dismutase (SOD) of various organs of mice (in Chinese). J Environ Health 20(2):81–81.
Liu Y, Shen J (2003) IAQ subjective assessment and analysis in a writing-building in shenzhen
(in Chinese). Contam Control Air-Conditioning Technol 10(4):17–20.
Long Y, Zhan C, Long J, Feng Y (1988) A health survey on female workers in air-conditioned
factories (in Chinese). J Prev Med Info 4(3):147–151.
Lv J, Yu H, Li X, Zheng F (2001) The relationship between formaldehyde concentration and
prevalence of uncomfortable symptoms (in Chinese). China Public Health 17(6):508–508.
Ma X (2006)Study to its health adverse effects and valuation pattern on indoor air quality in
decorated ofÞce (in Chinese). Dissertation, Shanxi Medical University.
Pan Y, Bai W, Long W, Fan C (2000) Investigation of indoor air quality in a shopping centre in
shanghai (in Chinese). Heat Ventilat Air Cond 30(3):18–20.
Pan Y, Long W, Fan C (2003) Evaluation of indoor environment quality of seven ofÞce buildings
in shanghai (in Chinese). Heat Ventilat Air Cond 33(4):15–18.
Pei Q, Zhou Z, Liu H (2006) Investigation on indoor environment for emporiums in guangzhou
(in Chinese). Heat Ventilat Air Cond 36(5):112–115.
Peng C, He J, Lai G, Luo X (1988) The effects of workplace air conditioning on works health
(in Chinese). China Occup Med 15(1):19–21.
Peng X, Pei H, Li X, He X, Yang A, Tang Y, Cao R (2000) Studies on legionella-contamination
to the air-conditioning cooling towers in big hotels and on its seroprevalence in the relatad
populations in beijing (in Chinese). Chin J Epidemiol 221(4):289–291.
GB/T 18883-2002 (2002) Indoor air quality standard (in Chinese).
Pu W, Huang M, Tan Y, Liu J (1988) The health effects of air-conditioned rooms (in Chinese).
Guangxi Med J 10(2):75–77.
Pu W, Jiang G, Huang M, Tan Y (1992) Effect of air quality in air conditioning environment on
human health (in Chinese). J Environ Health 9(5):214–216.
Qian H, Dai H (2006) An approach to indoor air pollution and its health effects (in Chinese).
Shanghai Environ Sci 25(1):33–38.
Ren T (2001) Source, level and control of indoor radon (in Chinese). Rad Prot 21(5):291–299.
Ren W (2005) A health survey on 120 painting workers (in Chinese). Practical Prev Med
12(3):627–627.
See SW, Karthikeyana S, Balasubramanian R (2006) Health risk assessment of occupational expo-
sure to particulate-phase polycyclic aromatic hydrocarbons associated with Chinese, Malay and
Indian cooking. J Environ Monitor 8:369–376.
Shang Q, Dai Z, Bei P, Pan Y (2005) Investigation and study on indoor air conditioning thermal
environment and human uncomfortable syndromes in summer (in Chinese). Heat Ventilat Air
Cond 35(5):1–7.

29 Sick Building Syndrome and Indoor Environmental Quality in China – A Review 531
Shen H, Zhao X, He T, Jiang Z (2008) Studies on legionella-contamination to air-conditioning
cooling water in big public places and its seroprevalence in populations (in Chinese). Chin J
Health Lab Technol 18(4):602–603.
Shen J (1997) Indoor air quality evaluation (in Chinese). Heat Ventilat Air Cond 27(4):22–25.
Shen J (2002) of some misconceptions on indoor air quality (in Chinese). Heat
Ventilat Air Cond 32(5):37–39.
Shen J, Mao J, Cai W (1996) A subjective assessment of indoor air quality in of buildings in
shanghai (in Chinese). Build Energy Environ 15(2):8–13.
Shen T, Wang X, Lin X (2008) Phthalate measurement in the house dust by HPLC (in Chinese).
Annual Conference 2008, Indoor Environment and Health Branch, Chinese Society for
Environmental Sciences. Shenzhen China, 2008.
Shi Q, Gao S, Hu Y (1987) A indoor air pollution survey in rural houses (in Chinese). J Environ
Health 4(5):35–35.
Shun S, Zhao P, Zhang K (1989) An indoor air pollution survey on 25 hospitals in hangzhou
(in Chinese). J Environ Health 6(5):23–23.
Song S, Zheng Q, Wang C, Fang Y, Yu J, Wang W, Xu S (2001) Health effects of exposure to
air-conditioned environments (in Chinese). Chin J Health Inspection 8(2):55–57.
Su G, Xiao H, Guo Y (1999) The health effect of air-conditioned environments (in Chinese).
Practical Prev Med 6(1):48–49.
Tan Y, Lu Y (1989) A survey on the bacteria concentration and pollution sources in the operating
rooms in hospitals (in Chinese). J Environ Health 6(5):43–43.
Tao G, Liang J (2008) Analysis on development tendency of domestic and global plasticizer market
(in Chinese). Plastics Sci Technol 36(6):78–81.
Ministry of Health in China (2004) The report of the national inspection on the air-conditioning
and ventilation systems in 2004, http://www.chinacdc.cn/n272442/n272530/n273736/n273827/
n358370/n359577/7760.html (in Chinese).
Tian T, Zhuang Z, Wu F, Zheng H (2004) Investigation and analysis of indoor air quality
at an underground emporium in Dalian (in Chinese). Contam Control Air-Cond Technol
11(2):57–60.
Wang D (2008) Study of association between student hostel indoor air quality and ss health
in china (in Chinese). Dissertation, Tianjin University.
Wang L, Han Z, Sun Z, Chen Y (1997) The research of micronuclei in peripheral lymphocyte of
workers occupationally exposed to formaldehyde (in Chinese). Carcinogenesis, Teratogenesis
Mutagenesis 9(2):123–123.
Wang L, Zhao B, Liu C, Lin H (2010) Indoor SVOC pollution in china: A review. Chin Sci Bull
55(11):967–977.
Wang Q (2005) Current situation and prospect of s energy (in Chinese). Chin Coal
31(2):22–28.
Wang Z, Chen Y, Wang Z (1990) A survey on the effects of low formaldehyde concentration on
human health (in Chinese). J Environ Health 7(4):167–169.
Wang Z, JH L, Wang L, Zhang S (2002) Relation between indoor radon and lung cancer
(in Chinese). Chin J Rad Med Prot 22(3):209–213.
Wei B, Hao L, Wen T (2002), The effects of indoor formaldehyde on immune functions
(in Chinese). The rst national conference on indoor air quality and health, Beijing, 2002.
Wen Y, Yao Y, Wang J, Huang Y (2001) Effect of formaldehyde on immune system in mice
(in Chinese). Acta Academiae Medicinae Wannan 20(3):166–166.
Xie Y, Yi Y, Tang M, Wang W (2003) Toxicity of formaldehyde on germ cells of male mice
(in Chinese). J Environ Health 20(2):84–84.
Xu H (1956) Studies on chigger and scrub typhus (in chinese). Fudan Univ J Med Sci 1(1):55–57.
Xu L, He Y, Lai H, Ai B (2002) Effect of air-conditioned environment on the human immune
function (in Chinese). Chin J Ind Med 15(5):267–269.
Xu W, Zhang H, Zhang S, Wu Y (2008) The status of legionella infection in patients with
pulmonary diseases in nanjing (in Chinese). Labeled Immunoassays Clin Med 15(6):366–367.

532 Y. Zhang and X. Ji
Yan C, Xu C (1989) The hygienic conditions in the operating rooms in hospitals (in Chinese).
J Environ Health 6(2):29–29.
Yang C, Lu Y (2001) A health survey on people in air-conditioned ofces (in Chinese). Guangdong
J Health Epidemic Prev 27(1):58–59.
Yang X, Li G, Chen W, Li Y (2000) Controlled human exposure experiments – measure-
ment and evaluation criteria for eyes blinking frequency test (in Chinese). J Environ Health
17(2):106–109.
Yang X, Li Y, Chen W, Chen D (1999) Controlled human exposure experiments – principles and
requirements. J Environ Health 16(6):351–355.
Yao J, Chen Y, Wang K (1994) Observation of REG of the workers in the air-conditioned
environment (in Chinese). J Environ Health 11(5):220–221.
Yi J, Zhang J, Gao Y (2000) Experiment on the effect of formaldehyde on the sperm toxicity of
mice (in Chinese). Ind Health Occup Diseases 26(5):263–264.
Ying C, Ye X, Xie H, Yan W, Zhao M, Xia T, Yin S (1999) Lymphocyte subsets and sister-
chromatid exchanges in the students exposed to formaldehyde vapor. Biomed Environ Sci
12(2):88–94.
Yu H, Li X, Lv J, Wang Y, Zheng F, Zhang L, Gao J, Zhang X, Chen Q (2000) Investigation on
indoor air pollution in furniture markets (in Chinese). J Environ Health 17(4):224–227.
Zeng X, Huang P, Chen J, Li H (1986) A health survey on workers in air-conditioned rooms
(in Chinese). Ind Health Occup Diseases 12(4):220–222.
Zhang J (2001) The indoor biological pollutions and the limits in standards (in Chinese). J Environ
Health 18(4):247–249.
Zhang J, Chen J, Li Z, Li Z (1987) A hygienic survey on indoor air quality in the xijing hospital
(in Chinese). s Military Surgeon 12:23–25.
Zhang Q (2002) The health effects of air-conditioned environments on workers in ofces
(in Chinese). Practical Clin J Integrated Tradit Chin West Med 2(5):50–50.
Zhang Q, Liu Z, Yang D, Bai D (1961) A hygienic survey on indoor air pollutions in two
classrooms (in Chinese). Tianjin Med J 3(1):23–26.
Zhang X (2009) Effect of formaldehyde pollution on human health in an of building of Beijing
city (in Chinese). Occup Health 25(15):1641–1643.
Zhang Y, Liu B, Cao H (1999) The effects of indoor formaldehyde on human health (in Chinese).
Heilongjiang Med Pharm 22(4):20–20.
Zhao A, Guo Y, Pan X (2009) Research advance in indoor microbial contamination and health
impact (in Chinese). J Environ Health 26(1):82–84.
Zhou H, Yang Y, Jiang S (2004) Analysis on 37 patients infected by legionella bacteria
(in Chinese). Shanghai J Prev Med 16(2):80–81.
Zhou M, Mi F, Liu Y (1986) On bacteria concentration in air (in Chinese). J Environ Health
3(6):40–40.
Zhu H, Rao L, Chen J, Cui Y (2007) Seasonal variations of mite antibodies in serum from
asthma patients and breeding densities in their bedrooms (in Chinese). J Fourth Mil Med Univ
28(1):54–55.
Zhu X, Liu Y, Shang Q, Gan Y, Dai Z (2001) The health effects of air-conditioning (in Chinese).
J Hygiene Res 30(1):62–63.
Zu A, Lai H, Guan S, Miao R (2003) Changes of certain immune indices of workers in an air
condition environment (in Chinese). Chin Occup Med 30(1):48–50.

Chapter 30
Sick Building Syndrome Identification and RiskControl Measures
Janis Jansz
30.1 Introduction
Some thoughts on issues associated with “Sick Building Syndrome” (SBS) follow:
If the mechanical services designers follow the Building Code of Australia (BCA) and therelated Australian Standards pertaining to fresh air provisions and of course good industrypractice then the potential for ventilation nightmares is much reduced. However problemsoften come about because someone takes short cuts in the installation, commissioning orthe running of such systems.
In recent years energy consumption has been a prime consideration where costs have had tobe reduced. Where the Building Code of Australia or for other good reasons the percentageof fresh air required is reduced in the misguided effort of attempting to save money, healthproblems will be a direct result. It is not uncommon for there to be at least 5–10% fresh air(outside air) and more in some cases to be introduced in the supply air side of a refrigeratedair-conditioning system. Closing off or reducing the design or statutory fresh air values tosave money will lead to false economies.
It is important to ensure the systems that control the introduction of fresh air are maintained.These systems, as with most things that move, will need to be maintained to a manufacturersrecommended maintenance schedule. Actuators that move control vanes can fail throughwear or inattention; filters need regular replacement or cleaning, sensing systems can failor wear out and so on. When owning or leasing a building, the arrangements that are inplace to service and maintain air conditioning systems need to be known and reported onto minimise the risk of sick building syndrome. Humidity control must be considered toensure that legionella and other related issues are not encouraged within the plant (thatincludes cooling towers and duct work).
An issue often attributed to poor air-conditioning performance is where dirt is observedto accumulate around air conditioning diffusers clinging to the ceiling. People will erro-neously assume the dirt build up has come from the air conditioning system. In reality thedirt is in the air in the room and due to velocity changes that occur as the conditioned air isintroduced into the room through the grille, turbulence between the existing room air (dirt
J. Jansz (B)Department of Health & Safety Environmental Health, Curtin University, Perth, WA 6845,Australia; School of Management, Edith Cowan University, Perth, WA 6845, Australia; CurtinHealth Innovation Research Centre, Perth, WA 6845, Australiae-mail: [email protected]
533S.A. Abdul-Wahab (ed.), Sick Building Syndrome,DOI 10.1007/978-3-642-17919-8_30, C© Springer-Verlag Berlin Heidelberg 2011
534 J. Jansz
laden) and the higher velocity (clean air) the dirt is deposited on the surfaces in the lowpressure areas. This dirt will be made up from dust, paper particles, skin residue, photo-copier and fax toners, carpet fibres and anything else that can be become airborne. It pays tocheck what the cleaners actually do. Are floors actually vacuumed according to the contractor service obligations? Does toner from the photo copier get spilled onto the floor? Are olddust laden files brought into the work area? All of these things will affect the air conditionedenvironment.
We in Perth in general terms do not suffer the same level of issues that confront buildingsin say Melbourne and Sydney where air-conditioning system designs are prone to complexhumidity issues. In your story, the theme for health care buildings should be that fresh airmake up should be higher than normal to minimise the very issues you describe. I recall thatat the Queen Elizabeth Medical Centre in the geriatric unit, 100% fresh air was introducedin the facility for health and comfort reasons. A special system was in use to recover theenergy from the expelled air where the energy was reintroduced to the fresh incoming airas an energy conservation measure (and that was in the early 1980s). Peter.
Peter has identified the importance of having appropriate effective ventilationin buildings to prevent the occurrence of sick building syndrome. Peter consideredsome of the building airborne contaminants that can cause ill health in humans andthe importance of not only having building cleaners, but of also of checking whatcleaners actually do to ensure that their work meets the required building cleaningstandards. Peter ends his story by describing how a hospital reduced the incidencesof infections being transferred to and from patients and staff by having 100% freshair used in the ventilation system rather than having recycled air that recycles themicro organisms which can cause infections. Peter considered including the appro-priate building ventilation system in the design stage of the building. The PropertyCouncil of Australia (2009, pp. 104–119) has check lists to use for the design, oper-
ation, maintenance and testing of the Heating, Ventilation and Air Conditioning
Systems for public and other buildings. This technical information would be use-
ful to provide to the expert who designs and provides ongoing maintenance of the
building ventilation system.
According to the Legislative Assembly (2001) preventing the occurrence of sick
building syndrome in building occupants starts in the building design stage and
every building should be constructed and fitted out with materials that do not pollute
the indoor air.
30.2 Building Design
30.2.1 Introduction to Design Considerations
Buildings were first built to provide protection for the occupants from the extremes
of the outside environment that included rain, snow, cold and heat. Technology has
enabled the design of buildings that can completely separate the people who occupy
the building from the outside environment. Particularly in areas where there was
high outdoor pollution after the industrial revolution, this was seen as being ben-
eficial. In 1987 Wallace conducted research the findings of which identified that

30 Sick Building Syndrome Identification and Risk Control Measures 535
the time that his research participants spent indoors, not their proximity to indus-trial sites, was most strongly correlated with accumulated chemical exposure forthese research participants, who were university students (Murphy 2006). Wallace’s
research highlighted the occurrence of the effects of indoor air pollution. There
have been some successful cases in law courts, particularly in the United States
of America, where building occupants have sued the building owner for indoor air
pollution that caused the building occupant to have ill health and the occupants have
been awarded substantial financial compensation (Air conditioning and indoor air
quality 2006). The Legislative Assembly (2001) wrote that research suggests that
sick building syndrome complaints occur in 40–60% of office workplaces.
The Legislative Assembly (2001, p iii–iv) states that the conditions inside a
public building are affected by the following.
• Poor building design, particularly the complete isolation of occupants from the
outside environment and the recourse to artificial lighting and “air.”
• Indoor air pollutants (chemical, biological and physical from building and fit out
materials and HVAC systems).
• Poor design and operation of Heating, Ventilation and Air Conditioning Systems.
Passarelli (2009) wrote that there are two ways that building owners can eliminate
sick building syndrome in a new building. One is using a preventative approach
which is the most cost effective approach. The other is using a reactive approach
once the building is constructed and occupants complain of having sick building
syndrome symptoms. When using the preventative approach it is important to meet
legal requirements. In Australia it is a legal requirement that all new buildings must
meet the technical regulations in the Building Code of Australia to gain approval
for building proposals from the local Council. Volume one of the Building Code of
Australia (2010) covers the legal requirements for public buildings while volume
two covers legal building requirements for residential housing. The Building Code
of Australia is up dated every year to include the latest best practice requirements.
This Building Code contains many Australian Standards including the ventilation
and lighting standards.
As well as meeting legal requirements there are other specific factors that can be
considered in the design stage of a building to prevent or minimise the occurrence
of sick building syndrome for building occupants. A very good checklist to use
to help ensure that the building includes all necessary factors is the Sick Building
Prevention Check list developed by the Property Council of Australia (2009). This
check list has been slightly modified to include additional Australian Standards
information on lighting, additional information on energy efficiency and has been
included as Appendix 1 of this chapter.
The checklist contains important information to consider in the building design
and construction stage. It includes natural and artificial lighting requirements, rec-
ommended shading devices (curtains and blinds), acoustic (noise reducing) factors,
ventilation, temperature, humidity, air movement, outdoor air source and filtra-
tion requirements. The first part of this check list also considers work space ratios

536 J. Jansz
required, the distribution of workers in the building, work station designs, clean-ing, sanitation and waste management, equipment, furniture and fittings (that do notpollute the indoor environment), interior design and decor. The second part of thechecklist documents construction issues to be considered that includes building ser-vice design, inspection and maintenance for the central air conditioning plant, airhandling equipment, cooling towers, water heaters, location of external air intakeand exhaust vents, having surfaces that are easily cleaned, preventing pollution andnoise, water proofing the building, energy efficiency and ensuring that the buildingis easy to clean.
Although this is a useful check list when using this check list think criticallyabout every item and consider if it is required in your building. For example, underthe heading of Temperature there is a question that asks “Have you prevented systemimbalance by removing tenant access to temperature controls?” (Property Councilof Australia 2009, p. 93). In the story provided by Andrew in Chap. 2 of this book(Jansz) there was a major problem with sharing the same air conditioner for morethan one room in the building because some tenants found their room too hot, whileother tenants found their room too cold. Allowing tenants to adjust the temperaturefor their work space would increase thermal comfort and productivity. Loftness et al.(2006) agreed with this and stated that allowing individuals to have thermal con-trol reduced the incidences of building occupants experiencing headaches and othersymptoms of sick building syndrome. At a hospital in Western Australia patients ineach hospital room can use a control panel to adjust the temperature in their room tosuit their comfort. Having a comfortable temperature, no matter what the patient’s
medical condition is, was seen as aiding each patient’s recovery from their illness or
surgery.
Following 5 years of intense research conducted by research students and staff
at the Center for Building Performance and Diagnostics at Carnegie Mellon by
Loftness et al. (2006), Fig. 30.1 was produced as research study results which linked
the design of a building with the health effects that identified factors could cause
to building occupants. This research group analysed 23 international building case
studies and conducted laboratory and simulation studies (results recorded at the web
address http://cbpd.arc.cmu.edu/ebids) to identify the effects that factors in build-
ing design and building fittings, when not present, had on the health of building
occupants.
In this Figure it is noticeable that the researchers look at the total person, not
just the factors that can cause sick building syndrome as ergonomic factors and
the health effects of not including good ergonomic design are also considered.
Loftness et al. (2006, p. 5) when writing about their research studies results state
that their findings have demonstrated that “Humans need access to the abundance in
nature – daylight, natural ventilation, thermal diversity, physical access and views;
at the same time, humans need protection from natural stresses – overheating,
excessive cold, rain.” These researchers described other research studies by Walch
et al. (2005), Benedetti et al. (2001) and by Choi (2005) that have demonstrated
that the sunlight reduces the stay in hospital of patients who are recovering from
surgery, from physical and from mental illnesses. Ultra violet light influences the

30 Sick Building Syndrome Identification and Risk Control Measures 537
B uilding Massing & Enclosure 1 2 3 4 5 6 7 8 9
Design for day light / view / passive solar X X X
Design for natural ventilation X X
Engineer thermal load balancing X
Design enclosure integrity X X X
Lighting & HVAC system
Separate ambient & task lighting X
Specify high performance lighting & controls X
Separate ventilation & thermal conditioning X X X
Increase outside air and ventilation
effectiveness
X
Engineer moisture / humidity management X X
Engineer individual control of temperature X
Interior systems
Specify ergonomic furniture X X
Design special layout for health / safety X
Specify acoustic quality X
Specify materials vs. out gassing / degradation X X
Specify materials vs. irritation / re-infection X X X
Specify materials vs. mould X
Operations
Continuously commission systems X
Eliminate standing water, dampness & mould X
Design for non-toxic pest / plant management X X X
Design for environmentally benign clean X X X
Reduce waste / manage waste vs. pests X X
Fig. 30.1 Linking design, decision making and health. For health effects 1 = Respiratory system.2 = Digestive system. 3 = Eyes, vision, irritation, circadian system. 4 = Ears, hearing damage,concentration. 5 = Skin. 6 = Muscular-skeletal. 7 = Circulatory system. 8 = Nervous system.9 = Mental health, stress
production of melatonin in the human body. Melatonin controls the human bodycircadian rhythms which influence the body’s sleep cycle. Loftness et al. (2006)
cited research by Ulrich (1984), Mendell (1991), and by Kellert (2005) that found
that having a view of nature through building windows reduced the incidence of the
occurrence of sick building syndrome in building occupants.
30.2.2 Designing Ventilation
When designing the ventilation for a new building natural verses artificial ventilation
was considered by these researchers and is described in Table 30.1 (Loftness et al.
2006, p. 6).

538 J. Jansz
Table 30.1 Should building windows open?
No Yes
Avoid outdoor pollution. Dilute indoor air pollution from materials andactivities.
Avoid outdoor humidity. Diffuse indoor air humidity build up.Avoid outdoor noise. Connect to nature – air, sounds.Well designed and maintained Heating,
Ventilation and Air Conditioning system(HVAC) provides temperature control.
Increases local thermal control when thereare not adverse weather conditions.
Avoid rain penetration. Design windows to shed rain.
The authors’ answer to the question (Should building windows open?) was that
buildings should be designed with natural ventilation being available without drafts
or rain entering the building. The Legislative Assembly Standing Committee on
Public Works (2001) recorded that naturally ventilated buildings are called yellow
buildings. This Committee’s investigation found that yellow buildings were health-
ier than green buildings that were sealed shut and had artificial heating, cooling and
ventilation. Using outside ventilation reduces the incidences of headaches, colds,
influenza, asthma, allergies and sick building syndrome (Brundage et al. 1988;
Jaakkola and Miettinen 1995; Drinka et al. 1996; Sundell 1996; Bourbeau et al.
1997; Frisk and Rosenfield 1997; Smedje and Norback 2000; Menzies et al. 2000;
Tham et al. 2003; Myatt et al. 2004; Loftness et al. 2006; Roy 2010). In areas where
there are adverse weather conditions a well designed and maintained HVAC sys-
tem should also be available for building occupants to use. Peter, in the story at the
beginning of this chapter, describes what he sees as a well designed ventilation sys-
tem that uses 100% outside air and allows individual control so providing the best
of natural ventilation and temperature control. The system described is also envi-
ronmentally friendly as energy is recovered from expelled air and reintroduced into
the fresh incoming air.
The Health and Safety Executive (2004) agreed with Loftness et al. (2006)
as their guideline for occupational hygiene specialist inspectors, stated that sick
building syndrome usually occurred in buildings that had air conditioning, a warm
thermal efficient environment, and “air tight rooms, e.g. where there are no openable
windows or other openings to the outside” (p. 2) and that the presence of unpleas-
ant odours was an indication of poor ventilation. The Health and Safety Executive
suggested that contributing factors to the occurrence of sick building syndrome are
inadequate ventilation, low humidity, thermal discomfort and/or air borne pollution,
including biological hazards.
Loftness et al. (2006) recommend that if a ventilation system is to be used in
the building then the building ventilation system should be separate to the building
temperature control system so that both can be adjusted separately by the building
occupants to meet their comfort needs. These authors also state that the ventilation
system should be able to be controlled by individuals so that local pollution can be
controlled at its source.

30 Sick Building Syndrome Identification and Risk Control Measures 539
The Property Council of Australia (2009) recorded that when designing the venti-lation system it should be designed to maintain the building air humidity between 40and 60%. If the humidity is lower than this level then the air is too dry and can causerespiratory, eye and dermal drying and the symptoms of sick building syndrome thatare related to these body parts. Having air humidity below 20% can cause a buildup of static electricity, off gassing and an increase in air borne dust and fibres, all ofwhich can affect the health of the building occupants (Health and Safety Executive2004). If the humidity of the air is above 70% then condensate forms on surfaces inthe building allowing mould and other micro organisms to grow and thrive in thisenvironment. Micro organisms can emit spores, fragments, cells and volatile organiccompounds into the building atmosphere. These can cause adverse health effects inthe building occupants. Chap. 11 in this book by Pinzari and Montanari describesthe sick building symptoms that can be caused by mould and other micro organisms.High humidity can cause biological and/or chemical degradation of materials in thebuilding which in turn generate indoor air pollution. “Dampness has therefore beensuggested to be the strongest and most consistent indicator of risk for asthma andrespiratory symptoms” related to the occurrence of these sick building syndromesymptoms (World Health Organisation 2006, p. 6).
Roy (2010) found that symptoms of sick building syndrome increase when thebuilding occupants perceive that the air quality is poor. As well as having a ventila-tion rate of at least 15 litres per second per person for each person in the area Roystates that the placement of the ventilation ducts in the building is very important asif the intake and outlet vent are too close then indoor air pollution is not dispersed.If the intake vent takes in polluted air then this will affect the health of buildingoccupants so air intake vents need to be located away from car parking areas andother sources of outdoor air pollution.
The United States of America Environmental Protection Agency (US. EPA 2010)has recorded that until the 1973 oil embargo building ventilation standards required15 cubic feet per minute (cfm) of outside fresh air for each building occupant todisperse the carbon dioxide produced by the breathing of the building occupants anddisperse the body odours of people in the building. As a result of this oil embargonational US energy conservation measures were implemented which reduced theamount of fresh air per person to 5 cfm per person. The US. EPA (2010) reports thatthis caused many building occupants to report experiencing sick building syndrome.In Chap. 28 in this book, Nedved describes the currently required ventilation ratesin the United States of America. In office buildings this is now 20 cfm per person.In commercial environments with tobacco smoke, the required ventilation rate isnow 125 cfm per person. This chapter by Nedved (2011) provides a comprehensivedescription of what must be considered and included in the building ventilationsystem in the design stage of the building and includes information on the requiredlocation of ventilation air intake and air exhaust vents.
Australian and other Ventilation Standards are a useful guide, but these guide-lines need to be supplemented by considering individual differences and asking thebuilding occupants if they are comfortable. If the air flow is perceived as being toohigh then the building occupants will complain about air drafts. If the air flow is

540 J. Jansz
considered too low then occupants will complain about the air in the building feel-ing stuffy. Furniture in the building needs to be positioned so that it does not obstructthe air intake or air outlet vents or obstruct the air flow through the room.
The Health and Safety Executive (2004) states that sick building syndrome couldbe a stress response to unsatisfactory workplace conditions, particularly the thermalenvironment. They state that “personal thermal comfort depends on air temperature,radiant heat, humidity, air velocity, clothing, activity rates and personal preferences”(p. 4). The Health and Safety Executive (2004) recommends that all of these shouldbe measured, considered and that the usual comfortable temperature in a buildingfor occupants in winter is between 20C and 24C and between 23C and 26C insummer. This should be considered in the planning stage when setting the buildingtemperature.
30.2.3 Planning
It is important when planning a building to consider all of the factors identified inFig. 30.1 in this chapter as well as the people who will use the building and theactivities that will be performed in this building to minimise the occurrence of illhealth occurring in building occupants due to building design, building materialsused, furniture and building fittings.
The following are practical principles to use for building design, particularly ifthe building is going to be used as a workplace.
• Plan the ideal, then the practical.• Plan the whole, then the detail.• Plan the work process and equipment around the system requirements.• Plan the workplace layout around the work process and equipment.• Plan the final enclosure around the workplace layout.• Use mocks and models to evaluate alternative solutions and to check the final
design.
When planning, if possible, involve the people who will use the building in decidingeach of the above. In Chap. 13 in this book, Clements-Croome identified that thisis important as people need to feel that they matter. The people who will use thebuilding will be able to advise how they intend to use the building, particularly if itis a workplace. They will also know what work processes will occur in the buildingand the equipment they will be purchasing to use in the building.
In the planning stage of a building the Health and Safety Executive (2000)records that to minimise the risk of sick building syndrome occurring where everpossible in the building design stage include natural light for the building as thisminimises the incidences of mould, decreases lighting costs, connects the outdoorwith the indoor and promotes a healthier outlook. To minimise glare from the morn-ing or afternoon sun blinds should be included for all windows. Adequate lighting

30 Sick Building Syndrome Identification and Risk Control Measures 541
should be included for all work tasks. The Australian Lighting Standards AS/NZS1680.2.2:2008 and AS/NZS 1680:2006 Interior lighting both provide guidelines forthe lighting requirements for specific work processes. As with temperature, ventila-tion and other environmental factors the people who will use the building need tobe able to control the lighting that they use. This must be considered in the buildingplanning stage.
In Mandurah in Western Australia a sustainable home has been built. The keydesign principles recommended, considered and used for this home include thefollowing.
• Use of passive solar principles. This includes locating the building with a north-ern orientation (in the Southern Hemisphere), having eaves around the building(to admit winter sun to warn the building and exclude summer sun) and hav-ing shading features to keep the summer sun out and allow the winter sun in.This assists with keeping the building at an even temperature throughout theyear.
• Use high insulation levels, especially to thermal mass.• Maximise north facing walls and glazing, especially in living areas with passive
solar access.• Minimise all east and west glazing. Use adjustable shading.• Use heavy drapes with sealed pelmets to insulate windows to keep the building
cool in summer and warm in winter.• Use cross ventilation through the location of doors and windows to produce
passive air flow cooling in summer. Cross ventilation increases effective aircirculation within the building.
• Encourage convective ventilation in heating circulation.• Site new buildings for solar access, exposure to cooling breezes and protection
from cold winds.• Draught seal the building thoroughly and use entry air locks.• Use reflective insulation to keep out summer heat.• Use bulk insulation to keep heat in during winter. Bulk insulate walls, ceilings
and exposed floors (The Sustainable Mandurah Home 2010, p. 1).
An advantage of following this advice is that artificial cooling and heating, with itsresultant difficulties, should not be required for the building in most climate condi-tions. Using these building recommendations should produce enough natural lightduring the day time to not require artificial light. Access of sun light to areas of thehouse, particularly wet areas such as the bathroom, should reduce the occurrenceof mould growing in the building. In bathrooms and other wet areas the floors andwalls should be made of non porous materials to reduce any opportunities for mouldto grow on building materials.
The City of Palo Alto California (2010) records that sustainable green buildingsthat take in to account the above recommendations are better long term investmentsas they have much lower operational and maintenance costs. “Green building designtypically increases productivity, because it improves factors that enhance life within

542 J. Jansz
the building such as good indoor air quality and natural lighting” (City of Palo AltoCalifornia 2010, p. 1).
In the building planning stage consider the furniture and fittings. Urea-formaldehyde resins are used when manufacturing plywood, particle boards, woodproducts surface coatings, flame retardants, textiles, in wood glues, thermal insu-lation, office copy paper and soft furnishings. All of these omit volatile organiccompounds that can cause sick building syndrome symptoms and should beavoided where ever possible. In the case study of the United States of AmericaEnvironmental Protection Authority, described by Jansz, it was identified that 68different chemicals were emitted from the new carpet. In combination with otherfactors this resulted in employees experiencing the symptoms of sick buildingsyndrome. There is a similar story that is told by Malcolm (Jansz 2011b) whereemployees experienced the symptoms of sick building syndrome after new furnitureand floor coverings were installed in their building. In both cases when occupationalhygiene monitoring was conducted there were not identified high levels of any par-ticular chemical. There were just low levels of a variety of chemicals. Brinke et al.(1998) reported that a combination of chemicals can have synergistic effects andbecome an irritant.
Research conducted by Hodgson et al. (2002) identified that if laminate wasplaced over wood products as a surface coating that it reduced the emission offormaldehyde and odorous aldehydes which have been identified as causes of sickbuilding syndrome. This should be considered in the planning stage. As volatileorganic compounds are produced from paints and coatings containing petroleumbased solvents and fungicides the City of Palo Alto California (2010) recommendsthat latex or water based paints should be used when paining the surfaces in build-ings as these paints can be manufactured with no volatile organic compoundsincluded. For all products considered in the construction and for use in the buildingin the planning stage the material safety data sheet should be checked and reviewedfor any hazardous ingredients which can have a potential impact on indoor air qual-ity (Massachusetts Division of Occupational Safety Occupational Hygiene Program1997). Products that are not hazardous to human health should be purchased andused in buildings where ever possible.
In the planning stage floor coverings must be considered. If carpet is selectedas a floor covering for some areas the carpet selected should be made of naturalmaterials such as wool. Wool is naturally resistant to mildew and static electricity.It does not contain odorous chemicals (such as 4-phenyl-cyclohexene) which areused in the manufacture of synthetic carpets or vinyl chloride monomer which is aknown carcinogen that is included in some synthetic floor coverings, such as vinyl,and which can affect the indoor air quality. Other floor surfaces which may meetthe needs of building occupants can be stone, cork or rubber all of which are naturalproducts and do not produce atmospheric contaminants.
Keep records of all suppliers and products, particularly those that have the poten-tial to produce an effect on indoor air quality. This would be important for buildingowners or tenants who have purchased the products as product manufacturers andsuppliers have a legal responsibility for providing safe goods that do not adverselyaffect human health.

30 Sick Building Syndrome Identification and Risk Control Measures 543
Work equipment chosen should have low noise emission. If the noise level of theequipment would disturb the building occupants then the machinery should be iso-lated or eliminated to minimise the building occupants having adverse health effectsdue to building equipment noise. In the planning stage it is important to identifywho will be responsible for equipments and for building maintenance and who willsupervise this work as regular maintenance is required to keep the equipment andbuilding in good condition to minimise the risk of sick building syndrome occurring.Meeting the required standard of building construction also needs to be consideredto prevent sick building syndrome from occurring.
30.2.4 Building Construction
When reporting for a government inquiry into housing construction in Victoria theRoyal Australian Institute of Architects and Archicentre Victoria (2005) identifiedthat there has been a decline in the number of skilled building workers in Australiaand that building inspections conducted by architects have identified that lack ofskilled workers has resulted in problems with unsatisfactory building brick wall con-struction (in 14.6% of buildings inspected), incomplete building work (18.9%), poorbuilding workmanship (43.6%), dampness in newly constructed buildings (6.9%),poor drainage (4.2%), gaps in window sills (2.7%) and deficits in the ceiling lining(1.6% of buildings inspected). To help prevent the occurrence of sick building syn-drome this organisation recommended that building construction workers shouldbe closely supervised to ensure that they produce work of a high standard. Theyreported that airborne toxins that can cause sick building syndrome symptoms areat their highest level while a building is being constructed and immediately afterconstruction.
The Royal Australian Institute of Architects and Archicentre Victoria (2005,p. 12), recorded that sick building syndrome costs Australians $12 billion a year.According to World Health Organisation (2006), a third of new buildings con-structed since the 1960’s are sick. Solvents, adhesives, laminates, carpets and certain
wood products “off gas” after installation; over time they dissipate to impercepti-
ble levels but always remain present. A fully sealed five star energy rated home has
many benefits both in energy and cost savings; however, it also tends to create micro
climates that can cause serious illness.
Preventing problems from occurring should commence in the building planning
stage however if these problems do occur then their risk of causing harm to building
occupants needs to be identified.
30.3 Sick Building Risk Identification
30.3.1 Introduction
A hygienist was contacted by a telecommunications company to investigate complaintsfrom a recently constructed retirement village that a bank of batteries, used to provide emer-gency backup power for telecommunications equipment, was generating acid fumes. This

544 J. Jansz
was an unusual complaint, as these batteries are not known to generate fumes and a reportfrom an electro-technical consultant indicated that the batteries were in good condition.The hygienist visited the site to conduct a walk-through survey, prior to conducting a moredetailed assessment.
The room where the batteries were located was closed off and sign posted warning peoplenot to enter. Upon entering the room the fumes were so overpowering that they hygienistand the accompanying telecommunications workers were affected. The fumes were highlyirritating to their eyes causing tearing and affected the upper respiratory tract; there was apungent odour. The room, which had recently been painted and carpeted, was used to storenew tables, chairs and trestles all of which were made from chipboard. It was noticeablethat the room was completely sealed with no ventilation.
The answer was obvious – to an experienced eye (not to mention nose)! The batteries werenot the source of the acid fumes. The problem was the room itself. The irritant gas wasrecognised as formaldehyde, which was being off-gassed by the new paintwork, carpet andfurnishings. The problem was compounded by lack of ventilation in the room. This situationis not uncommon in new buildings and time should be allowed for the fittings and furnish-ings to cure, before the building is occupied. This is sometimes referred to as ‘Sick BuildingSyndrome’. In this case the hygienist had very quickly (and cheaply) solved what could havebeen a potentially serious problem for the telecommunications company” (Jennings 2010,pp. 216–217).
This story, which describes a situation that occurred in a newly refurbished
Nursing Home, highlights the need to keep an open mind when investigating
building related problems. It shows how an experienced investigator can identify
the cause of sick building syndrome and how valuable identifying this cause can
be so that appropriate action can be undertaken to eliminate the cause of the
telecommunication workers experiencing ill health.
Gallego et al. in Chap. 16 in this book that is titled “Assessment of chemical
hazards in sick building syndrome situations: Determination of concentrations and
origin of VOCs in indoor air environments by dynamic sampling and TD-GC/MS
analysis” provides information that occupational hygienist can use when investi-
gating and determining if volatile organic compounds are present in the building
environment. The Property Council of Australia (2009) Appendix E. “Air Quality
Testing Specifications” provides useful information on tests and methods to be used
by Occupational Hygienist to investigate and determine causes of sick building syn-
drome. Appendix F (Property Council of Australia 2009) provides comprehensive
information on indoor air gaseous pollutants sources and known health effects, par-
ticulate pollutants sources and known health effects, biological pollutants sources
and known health effects and other factors that can affect the indoor air quality.
These include pesticides, static electricity charges, odours, low levels of negative
ions and electromagnetic radiation. All of this information is very useful to have
when investigation the causes of sick building syndrome.
30.3.2 Building Inspections
Although SBS can occur in any occupied building, research conducted by the
Health and Safety Executive (2000) identified that Sick Building Syndrome most

30 Sick Building Syndrome Identification and Risk Control Measures 545
commonly occurred in open plan offices with more than 10 work stations, if therewere large areas of open shelving and soft furnishings in the room, or if there wasnew furniture, carpets and newly painted surfaces. Other building related factors thatcaused Sick Building Syndrome included the building having air conditioning, par-ticularly if the air conditioner was poorly maintained, if a room had poor lighting,predominantly if there was high glare, insufficient light for work tasks to be per-formed well or if there were flickering lights, if the building occupants were unableto control the building ventilation, temperature or lighting, if there was very highor low indoor air humidity, if the building was in a poor state and needed mainte-nance, if the building was poorly cleaned or had dust particles or fibres or chemicalpollutants in the atmosphere. The Health and Safety Executive (2000) also recordedthat the people who were most affected by Sick Building Syndrome were the peo-ple who had the least amount of control over their working environment and peoplewho used display screen equipment.
The US EPA (2010, p. 3) reports that when investigation causes of sick buildingsyndrome the four most important factors to consider are building:
• Occupants,• Heating, ventilation, air conditioning (HVAC) system,• Possible pollutant pathways,• Possible contamination sources.
The Health and Safety Executive (2004, pp. 4–5), Joshi (2008) and the US EPA
(2010) state that if sick building symptoms are reported by building occupants then
the owner of the building, or the employer, should undertake an investigation into
the cause(s) of these symptoms using the following steps.
1. Identify key people who can provide building access and information.
2. Notify building occupants about the investigation.
3. Record any easy to obtain information about the history of the building.
4. Carry out a workplace employee survey to determine if the prevalence of symp-
toms is higher than expected or if the symptoms are caused by a common virus,
etc. The survey can help to identify common causes of sick building syndrome
which can easily be remedied such as changing the workplace temperature
or humidity. This survey needs to include questions that ask the employees
what they think that the causes of their symptoms might be and any pattern of
occurrence of these symptoms.
5. Analyse employee sickness and absenteeism records to look for a common
trend to pin point where the building problems might exist.
6. Look for the obvious causes of the symptoms that the people in the building
have.
7. Check that the building has satisfactory sanitation.
8. Check general building cleanliness, including checking that vacuum cleaners
are effective, regularly emptied and that filters are clean.
9. Check proprietary cleaning materials are non toxic and are being correctly used.

546 J. Jansz
10. Check general operation of heating, ventilation and air-conditioning systems,including correct setting of dampers, particularly in the fresh air supply system.
11. Check ventilation air inlets and outlets for effective location and functioning.12. Check condition and cleanliness of air filters, humidifiers, de-humidifiers and
cooling towers.13. Check heating, ventilation and air-conditioning maintenance schedules and
compliance with these schedules.14. On completion of these steps and after any required remedial actions have been
taken, if symptoms persist, carry out a more detailed investigation of the work-place environment. This may require the services of a building service engineer,an occupational hygienist or another competent consultants.
Redlich et al. (1997) record that the best way to identify the causes of sick build-ing syndrome is to use a team approach that includes the person’s treating medical
practitioner, an industrial hygienist and a building ventilation engineer to conduct
the investigation. Korpi et al. in Chap. 24 in this book called “Solving indoor envi-
ronmental problems: What can be found out through individual measurements?”,
has tables in this chapter that include important factors to be considered when
conducting a building inspection to identify the causes of sick building syndrome
symptoms.
30.3.3 Epidemiologic Investigation
If a simple building inspection and a though investigation by an occupational
hygienist has not identified the cause of building occupants experiencing sick build-
ing syndrome then an epidemiologic investigation may be conducted. Niven et al.
(2000) conducted an epidemiologic study with 1,000 research participants from
5 buildings. These participants completed a questionnaire to identify if they had
any symptoms of sick building syndrome, if they did how often they had these
symptoms and the timing of these symptoms. Demographic data was collected
as was the research participants’ subjective assessment of their work environment
and their attitude to their work. Six areas in which building occupants experi-
enced a high prevalence of symptoms, and 6 areas in which building occupants
experienced a low prevalence of symptoms, were identified for a detailed envi-
ronmental assessment to be conducted on. Air movement, temperature, humidity,
velocity, respirable particles, lighting and sound levels were all measured using the
appropriate equipment.
Univariate analysis was used to compare the presence of sick building symp-
toms for the occupants of each building. Questionnaire answers were also analysed
using Multiple Logistic Regression with people who experienced symptoms of sick
building syndrome as the dependent variable and environmental exposure indices
as the independent variable. The results of this research identified that the pres-
ence of air borne particulates and the presence of low sound frequency noise were
30 Sick Building Syndrome Identification and Risk Control Measures 547
strongly correlated with building occupants experiencing the symptoms of sickbuilding syndrome. Schneider (1999) recommended that questionnaires should beused in conjunction with building indoor air monitoring to identify any correlationbetween symptoms and the presence of air contaminants. This is what was done inthis epidemiologic investigation.
Having identified where the problems were occurring enabled appropriate riskcontrol measures to be implemented in the relevant parts of the buildings. Elci et al.in Chap. 22 in this book titled “Epidemiologic investigation methods for sick build-ing syndrome”, provide comprehensive information in relation to conducting anepidemiology investigation. If people become sick it is important to investigate thecause of their illness as Lee did in the story in Chap. 2 (Jansz 2011b) and request thesick person to see their Medical Practitioner for correct diagnosis and treatment. TheMedical Practitioner will then make a diagnosis of sick building syndrome or notbased on the person’s clinical presentation, the absence of any other likely diagnosis
and the presence of building related factors that could cause sick building syndrome
symptoms (Redlich et al. 1997).
It can be noted that an epidemiologic investigation includes a survey question-
naire being administered to building occupants to assist with identifying evidence
of, and causes of, sick building syndrome.
30.3.4 Survey Investigation
To help to identify the symptoms of sick building syndrome and its causes, building
occupants can keep a diary for a month. This will provide a record of their experi-
ences, but may not be taken seriously by the building’s owner or by the employer
if the building is a workplace. In order for building owners or managers to take
employees or building occupants’ building related ill health complaints seriously,
TSSA (2010) recommends that a questionnaire survey should be given to the build-
ing occupants, the results of the survey collated, analysed and given to the decision
maker for action. Survey results provide relevant information to support building
occupant’s claims that working or living in the building is harming their health and
should mean that the building owner or employer takes action to correct the iden-
tified causes of the people’s ill health. After the remedial action has been taken by
the building owner or employer TSSA recommends that the building occupants be
resurveyed to identify if occupants’ health has improved and if they are now satisfied
with building environmental factors.
Appendix 2 of this chapter contains a Building Occupants’ Health Survey that
can easily be used to identify the presence of sick building syndrome symptoms
and possible causes of these symptoms. All of the questions included in this ques-
tionnaire were taken from 3 previously used questionnaires. The National Institute
of Occupational Safety and Health (NIOSH) indoor air quality survey question-
naire, the American Industrial Hygiene Association (AIHA) occupational health
and comfort questionnaire and the Danish Building Research Institute building

548 J. Jansz
diagnostic human resource questionnaire all of which were published by Godish(1995). These three questionnaires have already been used for extensive researchstudies, had their questions validated and checked for reliability. Combining themost relevant questions from each questionnaire has enabled a useful generic surveytool to be developed that can be used for most buildings and by most occupations.As well as having set questions for ease of data analysis this questionnaire includesopen ended questions to also obtain qualitative information from respondents foranalysis to identify any factors related to the symptoms and causes of sick buildingsyndrome that were not included in the set questions.
For people who cannot read this survey may be administered orally as an inter-view with the interviewer recording the answers on the questionnaire. As wellas being used reactively when building occupants complain of experiencing thesymptoms of sick building syndrome this survey tool may be used proactivelywith occupants of a new building to determine if the building is healthy. Anotherproactive use can be for conducting an annual survey, particularly if building occu-pants have previously experienced the symptoms of sick building syndrome in thebuilding, to determine if the building environment has any problems which may beaffecting the health of its occupants.
This book includes another questionnaire that has been used by Abdul-Wahaband Salem and is reported in Chap. 12 titled “Is your library building sick? A casestudy from the main library of Sultan Qaboos University at Sultanate of Oman”.The questionnaire in Chap. 12 has been developed specifically to identify incidencesof, and causes of, sick building syndrome in libraries. Information provided in thischapter demonstrates the effectiveness of using a survey questionnaire as it docu-ments a comprehensive identification of building occupants’ symptoms in relation
to sick building syndrome, potential environmental causes and well written recom-
mendations for risk control measures to make the library buildings healthier places
to work in and for customers to visit. A building consultant may be used to inves-
tigate the cause of building occupants experiencing sick building syndrome and to
make recommendations.
30.3.5 Building Investigation
The following story highlights the advantage of using a qualified consultant to con-
duct an investigation when people in the workplace do not know the cause of the
occupants experiencing sick building syndrome.
Roy (2010) provided a description of how he, as the consulting occupational
hygienist, conducted an investigation of a Rural Water Corporation Office build-
ing in New Zealand in which many staff experienced symptoms of sick building
syndrome. Roy was called in to conduct an investigation into the cause of employ-
ees experiencing sick building syndrome after one staff member developed severe
pulmonary effects, was unable to continue working in the building and the remain-
ing employees walked out the building and refused to re-enter the building to work

30 Sick Building Syndrome Identification and Risk Control Measures 549
there. The building investigated was a new 5 star rated Green Building. The work-manship used when constructing this building was poor. Cold drafts of air werecommon inside the building due to gaps in the building walls. There was excessiveinternal negative pressure in this building. Wall cavities contained chip board, sawdust and volatile organic compounds.
When conducting an investigation into the reason for occupants experienc-ing the symptoms of sick building syndrome Roy (2010) began by undertakingbuilding observations, a walk around survey and talking to relevant people. Hetook a camera with him to take photos of any factors that may require furtherinvestigation. Roy (2010) then conducted a thorough HVAC system inspection.He also under took monitoring for the quality of indoor air including for thefollowing.
• Carbon dioxide level.• Carbon monoxide level.• Humidity.• Temperature.• Volatile organic compound samples (which were sent for more detailed GC/MS
analysis).• Particulate samples (which were sent for SEM/EDX analysis).• Ventilation system effectiveness measurements.• Air and surface monitoring for bacteria, for fungi and for other micro organisms.• Monitoring for fungal and for bacterial toxins.• Formaldehyde levels.
Scientific odour panels were used to detect odours. Roy (2010) consulted with expe-rienced toxicologist, mycologist, occupational physicians who had been treatingthe sick building syndrome symptoms of the employees working in the buildingand he consulted with the mechanical engineers who serviced the building’s air
conditioning.
The results of this comprehensive investigation identified that airborne mould
spores were being released from localised mould growth at several sites in the build-
ing where there were repeated water leakages. One area in this building had to have
major renovations because of the extensive wall cavity mould growth. There was dif-
fuse wide spread mould growth because the relative humidity level in this building
was consistently above 70%. This occurred because the HVAC system had design
problems and was shut down for extended periods of time. Also some areas of the
building did not have an air return pathway.
The building owner was unaware that repairs that were paid to be undertaken to
the HVAC system were not done as requested. Corroded areas of the air handling
unit were bogged and painted over instead of being repaired by the contractor who
was employed to make the repairs. Broken door hinges and worn gaskets were not
replaced as requested by the building owner. The roof air handling units were found
by Roy (2010) to be in a poor state with unsatisfactory air filtration due to the wrong
type of filter being used. The air filter used did not meet international ASHRAE
550 J. Jansz
Standard recommendations, did not fit the air handling unit and produced ineffectivefiltration of the incoming air. The air handling unit lacked mechanical pre-chillingfor fresh air dehumidification. There was no air inlet filter. Roy (2010) found thatthe original fan belt guard in the air handling unit was corroded and had not beenreplaced. The electric heating elements were exposed. The accumulated dust, dirt,insect parts, plant material, etc on the exposed heating elements released foul odoursin the building when they burnt if the building heating system was turned on. Thisodour made the building occupants feel nauseated.
Roy’s building investigation (2010) identified that air borne fibreglass dust
particles (synthetic mineral fibres) which came from damaged and exposed ceil-
ing tiles and the ceiling insulation through the ventilation system were causing
building occupants to experience skin itchiness, skin rashes, eye, nose and throat
irritations. In the ceiling space Roy found that there were uncapped open air
supply fittings that were dumping air into the ceiling spaces instead of supply-
ing air to the rooms below. These air leaks pressurised the ceiling spaces and
drove contaminants from the ceiling into the occupied rooms below. The ceil-
ing was filled with damaged, dirty, mouldy fibreglass batts piled loosely in the
ceiling.
The building air had high levels of volatile organic compounds (VOCs) in it
from new furniture, new carpets and newly painted walls. As the ventilation sys-
tem did not work properly there was insufficient fresh air flow rate to disperse these
chemicals from the air that the building occupants were breathing. Other issues that
contributed to the occupants’ ill health were found to be poor control over the air
temperature, drafts of cold air that building occupants said caused them to shiver
and develop respiratory infections, stuffiness due to the poor quality of air, musty
odours caused by the presence of mould and poor ventilation, poor lighting that
made conducting work tasks difficult and equipment noise and vibration that caused
headaches to occur amongst the building occupants. As the building ventilation sys-
tem circulated insufficient fresh air this resulted in the building air having elevated
levels of carbon dioxide in it.
Prior to Roy (2010) investigating the causes of the sick building symptoms the
building occupants had developed anxiety, stress (which can decrease the person’s
immune function), anger, and distrust of the building owner because of the long
standing and “mysterious” nature of the workplace environmental issues that were
causing them to experience the symptoms of sick building syndrome and because
of the management’s well meaning, but failed, attempts at risk communication.
Due to the above issues the building occupants had walked out of the building
and refused to re-enter this building to work until the cause of their ill health
was identified and rectified. Their employer had to transfer all staff to temporary
rented offices for almost a year while the building related causes of employees’
ill health were identified and the necessary renovations were under taken to make
the building safe for occupants to work in it without their health being adversely
affected.

30 Sick Building Syndrome Identification and Risk Control Measures 551
30.4 Sick Building Syndrome Risk Control Measures
30.4.1 Building Investigation Risk Control Measures
Once the cause of the building occupants’ ill health was determined, Roy (2010) rec-
ommended risk control measures to eliminate the causes of sick building syndrome.
Remediation measures used to make the Rural Water Corporation Office Building
in New Zealand habitable following Roy’s investigation included the following:
• New roof mounted air handling units were installed that had mechanical pre-chill
and dehumidification capacity.
• Ceiling spaces were cleaned.
• Direct ducted air supply was provided to the rooms.
• The correct filters were installed for all air handling units.
• All deficiencies in air distribution and air return pathways were corrected.
• All damaged ceiling tiles were replaced.
• New plaster tiles with polyester fibre pads instead of fibreglass batts were used
as ceiling insulation.
• Adequate lighting was installed for all work processes.
• Noise and vibration producing equipment was located outside of the office areas
and isolated.
• Water leaks were repaired.
• Mould damage was remediated.
• Gaps in the building walls were filled.
Major problems had occurred when this building was built and when repairs were
made to the building air conditioners as the contractors doing the work were not
supervised effectively and the necessary checks at the completion of the contrac-
tors’ work were not undertaken. The poor initial quality of the building contractors’
workmanship resulted in the necessity for expensive re-work to provide a healthy
environment for employees to be able to work in the building. While the above
repairs were being conducted, and at the completion of the work, Roy conducted
site inspections to verify that all remediation steps were undertaken and that the
work was completed by the contractors to a satisfactory standard.
Regular project briefings and reports were provided to all office staff.
Roy also held weekly meetings with the Property Owner/Manager, Employee
Representatives, Government Agency Officials and Consultants to keep everyone
updated on the progress of the investigation and then on the progress of the reme-
dial measures being implemented. At the conclusion of the remediation measures
being completed employee representatives were taken on a final building tour. There
was a final close-out meeting with the project team when consensus was reached by
all of the stakeholders that all issues were resolved. Roy (2010) worked with the
Project team to ensure that an ongoing building maintenance plan was put in place.

552 J. Jansz
This building was then fully re-occupied and has remained occupied with no furtherincidences of sick building syndrome being reported.
As a summary for risk control measures for sick building syndrome the USEPA (2010) documented that education and communication in both preventativeand remedial indoor air quality management and information on causes and con-sequences of having poor indoor air quality for building owners, employers andrelevant employees is important. Also important, according to the US EPA, are thefollowing:
• Immediate repair of any building water leaks from plumbing, roof, HVAC system,or other sources must be undertaken. Any water stained ceiling, carpet and orother water stained fixtures must be removed and replaced to prevent the growthof mould or other micro organisms on them.
• Any emissions that have the potential to harm the building occupants’ health
should be ventilated out of the building from the source of the pollutant. This
may require local exhaust ventilation.
• Paints, solvents, adhesives and pesticides should be stored in a well ventilated
area outside of the main building and should only be used when the building is
not occupied. If these substances are used then the building must be well aired
before re-occupancy.
• HVAC ventilation rates must meet local building codes and standards.
• Periodic cleaning and replacement of the HVAC system filters and routine
maintenance of the HVAC system must be undertaken.
30.4.2 Maintenance
In Western Australia accommodation supplied by mining companies must meet the
requirements of the Occupational Safety and Health Act 1984. For this reason it is a
legal requirement in Western Australia that employees who work in the Western
Australian mining industry, and who live in company supplied accommodation,
have safe and healthy accommodation. The following is a story supplied by a min-
ing industry employee who lived in company supplied accommodation in Western
Australia. This story highlights the importance of the air conditioning unit, of pre-
venting the growth of mould in the house and of having good HVAC and building
maintenance.
We first moved into a 3 bedroom brick and tile house in Craig Street on 10th Dec 2007 atwhich time the APAC ducted air con system had been turned off for approximately 2 weekimmediately prior to us moving in. On arrival we turned on the ducted air con and smelt astrong mould smell. We proceeded to air the house out and disinfect everything includingthe air con filter and ducting outlets. After couple days to a week later the whole familycame down with severe sinusitis. We normally did not suffer from sinus problems priorto this. We could not shake the flu even with antibiotic for about 6 weeks. Once over thesinusitis we regularly suffered from chest infections and sinusitis for the next 12 monthsuntil we finally got moved to another house.

30 Sick Building Syndrome Identification and Risk Control Measures 553
On 20th Dec 2008 we moved into a 3 bedroom fibro house in Robinson Street with APACducted air con. Once in the house we noticed after a couple of week we all started to feela lot healthier. Over the next 9 months we had minimal sinus problems until, under theadvice of the Housing Department, we turned off the re-fridge compressor and just ran theair con unit fan to reduce power cost for the winter period. About 1 month after turning offthe compressor we started to notice a small amount of mould starting to grow around theducting and insulation, so we disinfected and immediately started the compressor again andhave not turned it off since. Over the last couple of month we have noticed an increase inmould growth despite our regular attempts to disinfect the filter and duct outlets. Our healthhas started to deteriorate again and we regular wake up of a morning with congestion in thesinus and even breathing difficulties.
Note we have two young children 3 1/2 and 1 1/2 who regularly play with other children whocould also be a source of infection. None of us are smokers. We spend most of our dayoutside other than during the heat of the day and from dinner time until we wake in themorning and go to work. Michael.
It is evident from this story that in both of these houses there was not goodbuilding and HVAC maintenance. The Property Council of Australia (2009) inAppendix B has a useful HVAC maintenance and operational checklist that contains22 considerations for HVAC maintenance. Some of the important factors included inthis checklist include the need to meet the Australian Standard requirements, whatto check and how to check for vermin (mice, rats, birds) access and system contam-inants, what and how to check to ensure that there is correct air distribution in thebuilding and that the outdoor air cycles are effective, the mechanical operation ofthe system and filter inspection, maintenance and when to replace the filters.
If a building is well designed then the Health and Safety Executive (2000) hasrecorded that having good and regular maintenance procedures is one of the bestways to prevent the occurrence of sick building syndrome symptoms from occur-ring. There should be a schedule for regular (for example, monthly) cleaning andmaintenance of the building air conditioner (which supplies building heating, cool-ing and ventilation), and lighting. Lights should be kept clean and any defectivelights replaced promptly. As part of building maintenance regular inspections by themaintenance personnel should be undertaken of the physical condition of all rele-vant equipment and of the system components. Items with fixed life spans, such asair conditioner filters, should be replaced as recommended by the equipment man-ufacturer. There needs to be a documented, known and used system for reportingany building maintenance problems. Building occupants need to be encouraged usethis system to report any problems so that repairs can be attended to promptly bythe building maintenance department or by the contractors employed by the build-ing owner. For example, if there is building damage or leaks identified followinga storm then this needs to be reported and action taken immediately to repair anydamage.
Part of the maintenance schedule should be to consider seasonal variations. Forexample the building temperature, ventilation and lighting may need adjustment totake into account the differences that occur between winter, spring, autumn andsummer in the outdoor environment. Records must be kept of building inspections,testing, maintenance activities performed and the building cleaning that occurs.

554 J. Jansz
There should be documented procedures for the people who perform this work tolet the building owner and other relevant people know any abnormalities that occurso that these can be actioned promptly. As well as having effective building mainte-nance procedures to prevent the occurrence of sick building syndrome it is importantto ensure that the building is well cleaned to maintain a high standard of cleanliness.
30.4.3 Cleaning
Poor sanitation or poor cleaning practices can contribute to the occurrence of build-ing occupants experiencing sick building syndrome as micro-organisms thrive inunclean environments. It must be identified who is responsible for building clean-ing, who will do the cleaning, who will supervise this work and how often eacharea will be cleaned. For example, in a workplace, after work has finished each day,a contract cleaning company may clean all floors, furniture, internal surfaces andempty all rubbish bins daily, clean all windows and scrub walls monthly and deepclean all carpets and soft furnishings 3 monthly. Cleaning at the end of the day is abetter time than cleaning before work commences as this allows dust to settle andprovides a better quality of air at the commencement of the next day’s work time.
Cleaning materials that give off strong odours should be avoided. Methods of
cleaning that produce a lot of dust and air borne fibers should not be used. Vacuum
cleaners with high efficiency filters can help to achieve effective cleaning without
raising dust and fibres into the air. When used for cleaning vacuum cleaners must
be regularly emptied before they become too full of dust, fibres, etc as an over full
vacuum cleaner can spread dust rather than picking it up (Environmental Illness
Resource 2010). Cleaning equipment must have regular maintenance to ensure that
it functions effectively. There must be enough cleaning supplies and people with
enough time to perform the cleaning work safely and efficiently. Having a high stan-
dard of building cleanliness should be included in the building risk control action
plan.
30.4.4 Risk Control Action Plan
A risk control action plan is essential to have to ensure that a building keeps a
healthy environment for the building occupants. In Appendix 3 there is a risk control
action plan for the following hazards of:
• Inadequate or poor ventilation,
• Uncomfortable temperature,
• Too drafty or insufficient air movement,
• Air humidity too high or too low,
• Presence of airborne particles or fibers,
• Unsatisfactory lighting,

30 Sick Building Syndrome Identification and Risk Control Measures 555
• Too much noise,• Presence of toxic vapours or gasses in the air,• Biological hazards including micro organisms,• Poor sanitation,• Unclean building,• Unpleasant odours, and• Psychosocial issues.
This list of hazards is not exhaustive and can be added to depending on the identi-fied causes of sick building syndrome and the types of risks that exist in the buildingdue to individual building construction, work processes performed in the buildingand the use that occupants make of the building. The risk control action plan inAppendix 3 just provides a starting point, and a format to use, for risk control mea-sures. The risk control action plan provides a format for likelihood of each of thehazards present in the workplace to be assessed. In this action plan, for a genericbuilding, the likelihood is assesses as either certain to occur, could possibly occur orwould rarely occur. The next column is for the assessment of the consequences ofthis hazard being present in the building. Consequences are assessed as high (wouldcause catastrophic health effects or financial loss), moderate, or low (would causeminimal health effects or financial loss).
In this action plan combining the likelihood of the hazard being present in thebuilding with the consequences of this hazard provides a risk rating. If the risk ratingis E (extreme risk) then immediate action is required. If the risk rating is high riskthen senior management attention is required. If the risk rating is moderate then theappropriate manager is responsible for organising for this risk to be controlled. If therisk rating is low then the risk of the identified hazard causing harm can be managedby routine maintenance. The next column in this risk control action plan includesthe proposed actions to be taken by the appropriate people to minimise the risks ofthe identified hazards causing harm to the building occupants. The 6th column has aspace for the name of the responsible person to be included to carry out the requiredrisk control actions. Recording the name of the person responsible for this actionprovides a person with the responsibility to carry out the required actions. The lastcolumn is to record the date that this action is completed. This provides a record ofthe actual date that risk control measures were implemented.
What is not included in this action plan, and which needs to be done, is to evalu-ate the effectiveness of the risk control measures implemented. The evaluation canbe conducted by occupational safety and health representative in a workplace, byan occupational safety and health professional or by building occupants in privateresidences. The questionnaire included in Appendix 2 of this chapter is a usefultool to use to check the effectiveness of risk control measures with the buildingoccupants. Building owners, or employers, may not always want to make the rec-ommended improvements unless they can see that it is cost effective to do this.To be able to demonstrate to building owners and employers that it is in their bestinterests, and financially worthwhile, to include sick building syndrome prevention

556 J. Jansz
measures in the design stage of the building, or to implement recommended riskcontrol measures, it may be advisable to perform a cost effective analysis.
30.5 Cost Effectiveness Analysis
A cost effectiveness analysis identifies (1) if the cost of undertaking a particularaction, or buying a particular product, saves more money than it costs and (2) ifthe benefits of purchasing this product, or undertaking this action, outweigh thecost. Mendelson et al. (2000) identify, in the story reported in Jansz (2011b), thatHospital 3 in their research study had over 200 employees on sick leave due toexperiencing the symptoms of sick building syndrome. This is a good case studyto use when examining the cost of preventing the cause of sick building syndromein this hospital and the cost of not including these measures (which is the cost ofundertaking the remedial actions).
In Hospital 3, in this case study, there had been problems with the air quality inthe hospital building in that sulphuric acid, hydrochloric acid and sodium hydrox-ide had entered the building through the air intake ducts causing adverse healtheffects in employees. Cleaning fluids used in this hospital contained phenol andformaldehyde. Exposure to these substances adversely affected employees’ health.
The cost to manage the risks and prevent sick building syndrome symptoms from
occurring to building occupants could be as follows:
• Instead of the present location locate the air intake ducts in a different location of
the building wall in the design stage of the building. This would have been at no
additional cost.
• Purchasing and installing air inlet filters to prevent sulphuric acid, hydrochloric
acid and sodium hydroxide or other fumes from entering the hospital air handling
units could have cost $100.
• There is no difference in cost between purchasing cleaning products that contain
phenol and formaldehyde and cleaning products that do not contain chemicals
that are toxic to humans.
In this example the total additional cost to prevent the occurrence of sick building
symptoms in the 200 employees in Hospital 3 would have been $100.
Employees at this hospital are paid an average of $50 an hour for their work.
They work an average of 40 h a week. Employees were each absent from work on
sick leave due to the symptoms of sick building syndrome for an average of 2 weeks.
The cost of not taking the above actions could be as follows.
• Cost of replacement employees’ wages to cover the work of employees absence
on sick leave = 200 × 50 × 40 × 2 = $800,000.
• Additional cost (to the $800,000 in wages) of obtaining replacement employees
from an Agency to cover the employees’ sick leave = $10,000.

30 Sick Building Syndrome Identification and Risk Control Measures 557
• Payment to a consultant to investigate the cause of sick building syndrome, towrite a report on the causes and suggested hazard control measures = $5,000.
• The cost to relocate the air intake ducts = $50,000.• Cost to purchase and install air inlet filters for the hospital air handling units =
$100.
Potential additional costs, that have not been included, but which could occur, areas follows:
• If any of the employees consider that their illness is work related then there willbe medical treatment and other workers’ compensation costs.
• If the occupational health and safety legislative enforcement agency perceives
that the workplace is not safe and healthy for employees the employer or build-
ing owner may be fined for not complying with the Occupational Health and
Safety Act.
• Legal advice, representation and court costs if the legislative enforcement author-
ity or an employee or another person commences legal action against the
company due to the company not meeting its legally required occupational safety
and health responsibilities.
• If employees return to work from sick leave and are not fully recovered then they
may be less efficient and effective in their work duties than they were before
experiencing adverse health effects due to sick building syndrome.
• If psychosocial issues develop with employees due to work related environmen-
tal problems or other causes related to sick building syndrome then there could
be the cost of dealing with lower employee morale and with industrial relations
issues.
• Patients in Hospital 3, and visitors to this hospital, could be affected by the symp-
toms of sick building syndrome as well as the staff being affected. The affected
patients and visitors may sue the hospital for damaging their health.
• There could be unfavourable media publicity in relation to the occurrence of
sick building syndrome which managers would be required to spend time dealing
with.
• Due to replacement Agency Staff (who are covering employees’ sick leave),
being unfamiliar with the workplace layout, where equipment is kept, how to
use this equipment and what the hospital policy and procedures are, the replace-
ment staff may take longer performing their work and not be as efficient as the
employees who are on sick leave. This would require additional staff to be able
to complete the same volume of work. Alternatively existing staff may have
to work overtime and this attracts a higher rate of payment for the extra hours
worked.
• If employees leave work due to ongoing ill health, or due to dissatisfaction
work the work environment, there is the cost of loosing these employees’
skill and experience, advertising for new employees, interviewing and selecting
new employees and of educating new employees concerning company policies,
procedures and other aspects of their work for the company.

558 J. Jansz
The total of these potential costs could be over a million dollars if they all occur.The cost of preventing the incidences of sick building syndrome for employees
at Hospital 3, in the worked example, is $100. Without considering the potentialcosts, the cost of not preventing the occurrence of the sick building symptoms forHospital 3 = $800,000 + $10,000 + $5,000 + $50,000 + $100 = $865,100. This is adifference in cost of $865,000. In this example the cost effectiveness analysis clearlydemonstrates to the building owner and employer that it saves more than it costs toprevent the occurrence of sick building syndrome and that the benefits outweighthe costs. Every dollar spent, in this example, in preventing the occurrence of sickbuilding syndrome symptoms occurring in building occupants, saved at least $8,650.
Other financial analysis that can be undertaken by employers or building ownersinclude a cost benefit analysis. A cost benefit analysis relates to allocated efficiencyin financial terms and considers if the actions proposed to be undertaken are worth-while so that a judgment can be made on whether it is advisable to undertake theproposed action or not. Opportunity costs can be considered. Opportunity costs arecomparing the cost of spending money on something, such as an air conditioner fil-ter, and comparing this with the opportunities lost to spend the money on somethingelse to determine if it is worthwhile spending the money on the proposed action orequipment. A cost utility analysis includes assessing the quality of life provided bymaking an investment in purchasing equipment or performing an action. Efficiencycost may be considered to identify if the proposed purchase is being made at thelowest possible cost in terms of material and human resource costs. Other costs thatmay be considered include direct and indirect costs, economic and non-economiccosts, fixed and variable costs, external and internal costs.
Further information on cost effectiveness analysis can be obtained from Edejeret al. (2003) in the 318 page publication called “WHO Guide to Cost-effectivenessAnalysis”. This publication includes extensive information on how to conduct costeffectiveness analysis. Clements-Croome in Chap. 13 in this book describes the costof not having a healthy building environment, a variety of methods of cost analysisand how to perform these analysis.
30.6 Conclusions
This chapter has provided information on important factors related to buildingdesign that should be considered in the planning stage to prevent sick buildingsyndrome from occurring. There is information on sick building syndrome riskidentification, recommended risk control measures and how to conduct a cost effec-tiveness analysis in relation to preventing or elimination the incidences of sickbuilding syndrome occurring in a building. This chapter has also includes refer-ences to the information included in other chapters in this book that contain researchstudies conducted in relation to sick building syndrome, practical knowledge andexperience in conducting risk assessment and management of sick building syn-drome and an extensive review of published information related to sick building

30 Sick Building Syndrome Identification and Risk Control Measures 559
syndrome causes and risk control measures. As these authors live in many differentcountries in the world (including Australia, Brazil, China, Finland, India, Kuwait,Italy, Japan, Pakistan, Portugal, Spain, Sultanate of Oman, Sweden, The Caribbean,Turkey, United Kingdom) an international perspective on sick building syndromehas been provided. This chapter has 3 Appendix. Appendix 1 is a checklist to usein the building planning and construction stage to minimise the opportunities forsick building syndrome to occur in building occupants. Appendix 2 is a buildingoccupants’ health survey. Appendix 3 is a risk control action plan. Each of these
Appendix are practical tools to use in relation to sick building syndrome either for
prevention, assessment of the current situation or for risk control. In relation to sick
building syndrome it must be remembered that most people don’t complain about
ill health, they just find another company to work for, or another place to live or to
visit.
Acknowledgements Anitha Arasu is thanked for identifying published literature on sick buildingsyndrome for review.
Paul Jansz is acknowledged for the assistance given in typing the Building Occupants HealthSurvey included in this chapter as Appendix 2.
Appendix 1: Checklist for Building Planning A construction
to Minimise Opportunities for Building Occupants to Experience
Sick Building Syndrome
Reference: Property Council of Australia (2009) Managing indoor environmental
quality. Sydney, NSW: Property Council of Australia 91–103.
1: Tentant FacilitiesThe following tenant facilities are considered in this section:
• Lighting;
• Acoustics;
• Ventilation;
• Plants;
• Work spaces;
• Recreational facilities;
• Cleaning, sanitation and waste management;
• Equipment, furniture and furnishings; and
• Interior design and décor
Lighting
Natural Lighting/Windows
Is occupied space close enough (within eight metres) to the external window
line or a sufficiently lit atrium/light well?

560 J. Jansz
Does the design take advantage of available natural light to lower lighting energyconsumption?
Is the office space designed to allow maximum daylight penetration? Are youusing glazed partitions parallel to windows for perimeter offices to allow pen-etration of light to interior space? Are you suing borrowed light where directaccess to external windows is not possible?
Are there any fully enclosed solid walled, internal offices? Do window configurations and shading devices ensure adequate control of solar
heat gain? Have you considered high performance glazing to minimise unwanted heat gain?
(i.e. double/low-E with low U-values and solar heat gain coefficient) Is sufficient glare control provided to occupied spaces? Are the workstations designed to reduce the reflection of daylight on computer
screens?
Artifical Lighting
Are there any areas with extreme lighting levels causing tenant discomfort andeyestrain?
Are lighting levels adequate? Illuminance levels should be selected to matchoccupant tasks, and both the age and visual characteristics of likely occupants.
Are there any habitable areas with very low lighting levels that may adverselyimpact upon the occupant’s wellbeing?
Do you need task lighting?
Is general lighting intensity appropriate and are fittings well laid out? Is there
uniformity of light on task surfaces?
Do you, or can you, provide some individual lighting control?
Are light switching zones less than 100 m2
Are you using the correct low brightness, non-glare standard light fittings in
commercial office spaces?
Is glare caused by artificial lighting minimised by appropriate lighting design?
Do light fittings have diffusers to reduce glare?
Is there any lighting control system provided, e.g. PE cells, dimmers, time
switches or motion detectors?
Are you using electronic ballasts and not magnetic ballasts (for existing fit-
outs)?
Is flickering of lamps avoided (e.g. by using high frequency ballasts)?
Are you using efficient lamps?
Is the colour temperature of lamps and colour rendition index suitable for
activities and supporting people’s wellbeing (greater than 80)?
Have you avoided lights causing irritating glare on computer screens? Are glossy
surfaces avoided where reflection of artificial lighting might be an issue?

30 Sick Building Syndrome Identification and Risk Control Measures 561
For more important information refer to Australian Standards AS1680.1 series:
• AS/NSZ 1680.1:2006 Interior and workplace lighting – General principles and
recommendations.
• AS/NZS 1680.0:2009 Interior lighting – Safe movement.
• AS/NZS 1680.2.1:2008 Interior and workplace lighting – Specific applica-
tions – Circulation spaces and other general areas.
• AS/NZS 1680.2.2:2008 Interior and workplace lighting – Specific applica-
tions – Office and screen-based tasks.
• AS/NZS 1680.2.3:2008 Interior and workplace lighting – Specific applica-
tions – Education and training facilities.
• AS/NZS 1680.2.4:1997 Interior lighting – Industrial tasks and processes.
• AS/NZS 1680.2.5:1997 Interior lighting – Hospital and medical tasks.
• AS 1680.3-1991 Interior lighting – Measurement, calculation and presentation
of photometric data.
• AS/NZS 1680.4:2001 Interior lighting – Maintenance of electric lighting
systems.
Shading Devices Curtains and Blinds
Are your curtains and blinds providing effective shading?
Have you considered internal as well as external shading devices?
Do your shading devices effectively control solar heat radiation and glare?
Do your shading devices allow beneficial sun penetration in the cold seasons?
Does the curtain fabric/shading screen effectively reduce glare? (e.g. density,
colour )
Do your shading devices allow solar access to areas further from the windows?
Do your shading devices allow sufficient daylight levels?
Are you using low volatile organic compound (VOC) blind and curtain materi-
als?
Acoustics
Avoid ambient sound that is distracting or unpleasant.
Does the office area provide a comfortable background noise and good speech
privacy?
Are shared noise generating resources (e.g. meeting rooms, discussion area,
lunch rooms, printer/photocopiers) located away from occupants who need quiet
to concentrate on tasks on tasks, or are they effectively soundproofed?
Do you have an office etiquette policy to control noise?
Do you have sound absorbing ceiling panels? Light fittings can also reflect sound
between workstations.
Does partition height contribute to acoustic comfort? High, wide partitions can
block sound travel.

562 J. Jansz
Have you chosen internal finishes to avoid echo? Did you consider eliminatingecho at the design of spaces?
Refer also to “Airborne Noise” below
Ventilation
Temperature
Do system designs accommodate realistic population and equipment loadings? Does zoning provide efficient operation and close control of conditions? Are swings in space temperature acceptable and are you maximising energy
savings? Have you minimised variations in temperature between supply air and room air
to avoid thermal shock, which may cause draughts and condensation? Is supplementary cooling provided for areas with high loadings, such as
conference/meeting rooms and communication rooms? Are temperature thermostats located in a clear area, away from full sun? Have you prevented system imbalance by removing tenant access to temperature
controls?
Humidity
Have you considered all specialised processes or computing areas that requirehumidity control?
Is your system designed to limit the relative humidity range? Will your humidity remain stable throughout the cooling process?
Air Movement
Does your system provide an adequate air quantity with even distribution, soas to prevent stagnation of the air within the occupied space? ( i.e. air changeeffectiveness)
Can you specify higher than minimum requirements air flow rates to promotemore stable conditions?
Do your supply air outlets provide an even distribution under heating and coolingconditions, taking air stratification into account?
Do your supply air fittings take ventilation system type into account, and in par-ticular, are they consistent with the needs of variable air volume (VAV) systemsoperating under low load conditions?
Are return air paths clear and unobstructed? Have ductwork and coils been cleaned in the previous 3 years?

30 Sick Building Syndrome Identification and Risk Control Measures 563
Outdoor Air
Does your system provide sufficient outdoor air to prevent stagnation of theroom air, and to ensure that pollutants such as carbon dioxide, body odours andthe like, are adequately diluted?
Is your outdoor air source free of pollutants and dust? Does your building operate under positive pressurisation to minimise infiltration
of unconditioned outdoor air? Does your plant configuration ensure adequate mixing of return and outdoor air
and an even distribution of outdoor air throughout the system?
Ventilation
Are ventilation systems sufficiently serving amenity areas such as toilets,showers and change rooms?
Are printers and photocopiers provided with a separate exhaust system to outsidethe building?
Is CO2 monitoring and control provided to improve indoor air quality? Is VOC monitoring provided? Are economy cycles provided and do dampers operate freely and as designed?
Filtration
Is outdoor and re-circulated air filtered? Does your filter efficiency match the requirements of the space? Is there a regular maintenance plan for air filters?
Airborne Noise
Have you eliminated any noises which emanate from:
the air conditioning plant (generally the fan) via the distribution ductwork; air outlets, generated by the throttling of the supply or return air; office equipment located within the occupied space; external sources such as vehicular traffic, trains, air craft etc; exhaust vents within staff amenity areas; and air ducts? Have you eliminated occupant generated noises conveyed between adjacent
spaces such as conference rooms, private offices, male and female toilets andthe like, via common ductwork systems?
Have you provide sufficient soundproofing to relevant components of the A/Csystems.
Have you sized air ducts adequately to avoid noise generated by high speedairflow?

564 J. Jansz
Plants
Plants are desirable in offices but they must be maintained regularly. Poor mainte-nance can lead to proliferation of moulds and bacteria on leaves and in the soil. Potplants are not rubbish bins or kitchen sinks. Flowering plants can aggravate allergiesso they may have to be pruned at the flowering stage.
Is there a plant maintenance plan provided? Is the planting mix and mulch appropriate to prevent the growth of moulds?
W orker Space
Workspace Ratios
Workspace allocations have increased over the past decade due to increasedsupport facilities (e.g. conference and training rooms) and increased equipmentrequirements in workstations.
Do office space layouts provide enough room for equipment that the averageworker uses?
Are fit-outs sufficiently flexible to allow reallocation of space and positions?
Worker Distribution
Are workspaces arranged to provide all or most parties with daylight and anoutdoor view?
Are lighting design, switching and operation suited to varied work/occupationpatterns?
Workstation Design
Are the workstations designed to respond in a flexible way to service require-ments?
Do workstations have adjustable components? Such as shelving, lock up cab-inets, adjustment to computer screen positioning and associated keyboards,armrests and task lighting so that maximum physical comfort and ergonomicsupport will be achieved?
Are acoustic/ergonomic factors considered when designing office and worksta-tion layouts?
Does workstation design eliminate solid paneling, which extends to the floor,hampering cleaning as well as restricting air circulation and flow?
Does the workstation design allow for personalisation of the space? Does itprovide sufficient privacy, where required?

30 Sick Building Syndrome Identification and Risk Control Measures 565
Are workstation finishes low contrast? Have workstations been chosen to include low VOC emitting materials?
Cleaning, Sanitation and Waste Management
Do cleaning staff have a program with guidelines for procedures? Are cleaning contractors required to avoid cleaning products with phenolic
compounds or petroleum solvents? Are cleaners briefed well on hazardous waste collection, selective waste collec-
tion and recycling, as well as on the maintenance of green waste equipments(e.g. compost bins or worm farms).
Is there sufficient lighting level provided for cleaners throughout the office? Does building management conduct periodic surveys of building cleanliness and
contractors work? Do cleaning contractors have responsible, supervisory staff checking all areas
daily? Are contract cleaning staff treated fairly and compensated appropriately for the
work they undertake? Do vacuum cleaners have the sufficiently high performance to clean carpet on a
deep level, and to recycle clean and well filtered air? Are ample power points provided for cleaner’s equipment?
Waste
Are there Construction/Operational Waste Management Plans provided, address-
ing waste streams and recycling?
Is there sufficient storage place allocated for selective waste collection and
recycling?
Is there a tenant guide on waste management?
Is there sufficient access provided for waste streams?
Equipment, Furniture and Furnishings
Have you avoided furnishings and fit-out items that include high – VOC or
formaldehyde emitting components?
Is equipment which off-gasses ozone, such as copying machines, laser print-
ers and any high voltage equipment, in areas segregated from general occupied
space? Are they well exhausted? Is it ensured that exhaust is not connected to
the return air duct?
Is equipment, which emits heat or pollutants, placed in one enclosed area where
polluted air can be exhausted?
Is there sufficient storage for equipment and associated facilities?

566 J. Jansz
Interior Design and Décor
Are the colours of the spaces and fit-out items selected with consideration ofhow they affect people’s work efficiency, emotions and abilities?
Is there sufficient contrast of colours to between walls and furnishings? Is there
sufficient contrast at sharp edges?
Are ceilings in very light colours to be light reflective and bring daylight to areas
further from windows?
Are floor colours of general light neutral tones?
Have you avoided desktops and other fit-out items, which are too reflective,
creating excessive glare?”
Are breakout space, lunchroom and staff training room colour schemes different
from workplace colour schemes to provide visual relief?
Construction Issues
The following construction issues are discussed in this section:
• Services, design, inspection and maintenance;
• Location of external intake and exhaust vents;
• building materials;
• structural layout;
• building seals and drainage;
• energy efficiency; and
• building cleanability
Service Design, Inspection and Maintenance
Management
Are design and installation drawings with any modifications available on site to
facilitate maintenance procedures and the design of any future alterations to the
systems?
Is there a tenancy user’s guide?
Is there a building user’s guide? Does it include a programmed maintenance
strategy?
Is there a building management system?
Central Plant
Is central plant arranged to facilitate access, minimise downtime and avoid
disruption to tenants?
Can adequate service be provided during maintenance shut-downs- either by
programming of maintenance visits, or by provision of standby plant?

30 Sick Building Syndrome Identification and Risk Control Measures 567
Air Handling Equipment
Does the type of plant provide access required for ongoing maintenance? Does your plant design reduce the amount of equipment within the occupied
area, and the ceiling space in particular? Is ceiling space accessible for adjustment of volume control dampers, valves
etc? Can heat exchange surfaces and drain pans be access for cleaning?
Cooling Towers
Has the cooling tower been designed and installed as per AS/NZS 3666.1:2002Air-handling and water systems of buildings – Microbial control – Design.
Installation and commissioning.
Is there a regular maintenance plan?
Is there a risk management plan?
Are towers located well away from building air intakes, other building openings,
and areas of public access?
Is make-up water fed from a clean water source to reduce sediment build up?
Hot Water Heaters
The Victorian “Legionella” Guidelines are a good example of best practice and
when followed have been shown to reduce the risk of Legionella and other microbial
growth.
Is hot water held at 60C for at least 1 h per day to minimise Legionella risk
while also minimising energy use?
Is hot water supply to hand basins and showers tempered to no more than
50
C?
General
Have you replaced all natural rubber components within water supply and
drainage pipe work with neoprene or suitable synthetic material to prevent
microbial growth?
Has redundant pipe work containing stagnant water been removed?
Is water reticulation pipe work configured to connect to a ring main system?
Location of External Intake and Exhaust Vents
Are intakes and discharges (including cooling tower discharges) sufficiently
isolated to prevent cross contamination under varying wind conditions?

568 J. Jansz
Locate vents to minimise external pollution. Have you considered ingress of noise when placing external vents? Are discharge vents located to minimise condensation or discolouration of
building façade? Do all vent locations comply with the requirements of statutory bodies and local
authorities?
Finishes and Surfaces
Easily Cleaned Finishes
Are finishing materials surface sealed and easily washable? Have you selected hard wearing and easy to clean finishes for surfaces which
are frequently handled or soiled? Are finishing materials long lasting and durable? In the event of damage can
that part of the finish be replaced the majority untouched? Where concrete or cement is the finished surface in areas such as plant rooms or
parking areas, have the floor surfaces been sealed or painted? Have you selected carpeting that is easy to clean and maintain? Has a man-
ual been provided to inform future uses of how to remove the most vulnerablesurfaces?
Low Pollutant Materials
Have you avoided building materials, finishes and finishing fabrics with highVOC content?
Have you used E1 or better rated composite timber products to reduceformaldehyde emissions?
Have you ensured appropriate maintenance of carpeting?
Structural Layout
Location of Plant Area
Are plant rooms properly located so as to minimise noise transmission to theoccupied areas?
Are doors and walls in plant rooms sound proofed and sealed to preventtransmission of air and noise?
Prevention of Pollution Migration and Noise
Are all building construction openings sealed to prevent migration of pollutedair?

30 Sick Building Syndrome Identification and Risk Control Measures 569
Have you provided dedicated exhaust systems or allowed for effective natu-ral ventilation for contaminated service areas such as gas meter rooms, sewageejectors, kitchens, battery rooms and process areas?
Have you provided exhaust systems or allowed for effective natural ventilationfor all parking areas, service vehicle parking space and loading dock areas?
Have you provided vibration isolation devices for all air conditioning plant,diesel stand-by power generation, lifts, fire pumps and hydraulic pumps?
Have you provided acoustic treatment to building fabric to minimise noise fromexternal sources?
Have you provided acoustic isolation or treatment of all service pipe work,including air conditioning pipe work, sanitary lines, storm water piping, roofdrains and internal gutters, where appropriate?
Building Seals and Drainage
Prevention of Water and Air Leaks
Is the building fabric effectively weather proofed? Have you met Building Code benchmarks for air infiltration through facades?
Have you minimised such infiltration? Are doors opening onto roofs and balconies weather proofed? Is drainage provided for water spray from weather proofed louvers?
Water Proofing Membranes
Have you considered the following to ensure you meet suitable membrane perfor-mance requirements?
Moisture vapour transmission rate; Water absorption; Acceptance of cyclic movement; Durability; and Suitability for use over particleboard?
Refer to AS/NZS 4858:2004 Wet Area Membranes for more information.
Energy Efficiency
Energy
Does the base building have a National Australian Built Environment RatingSystem (NABERS) Energy Rating Certificate? (This energy rating, which

570 J. Jansz
should be displayed in the building, is an Australian national initiative managedby the New South Wales Department of Environment, Climate Change andWater (2010).) Has the tenancy NABERS rating been estimated or measured?
Does the building/tenancy have an energy management plan? Are there sub-meters for lighting and small power on each floor and/or tenancy? Have you installed lighting control systems to turn lighting off when space is
unoccupied, or when natural lighting levels are sufficiently high? Have youinstalled a Building Management System?
Have you specified high efficiently light fittings and appliances? Have you minimised air conditioning energy use by allowing for a wide comfort
band within the building?
Renewable Energy
Have you considered providing renewable energy generation for your building? Have you considered Green Power? Have you considered using geothermal/solar power for air conditioning and
water heating?
Other Alternatives
Do conditioning systems have controls to prevent over-cooling, over-heatingand the simultaneous provision of heating and cooling?
Have you provided for full outdoor air economy cycles on air conditioningplant?
Do you take full advantage of available waste heat sources (such as condenserwater) to provide heating via heat pumps?
Passive Solar Design
Have you minimised air conditioning energy use by effective passive solardesign, provision of thermal mass, and well insulated building fabric?
Have you specified external glazing with high thermal performance? Is your building design oriented to take full advantage of natural light and solar
heating? Have you investigated the thermal efficiency of glazing vision panels or spandrel
panels? Have you investigated the thermal efficiency of external shading to windows and
glazed doors?

30 Sick Building Syndrome Identification and Risk Control Measures 571
Building Cleanability
Design Implications-General
Are materials easy to clean and maintain? Have you avoided internal materials, which will fret, fray, powder on surface
and generally add particles of dirt and dust to the air? Have you avoided materials which absorb cleaning fluids and emit pollutants? Have you avoided unnecessary rebates or articulations that will be difficult to
access and clean? Have you avoided unnecessary horizontal ledges and deep recesses which can
gather dirt and dust and which are inaccessible for cleaning? Have you avoided small recesses on vertical surfaces, such as at skirting ducts
and plinths which will make it difficult to vacuum? Are all paint finishes in all public areas washable to allow removal of dirty
marks? Are all concrete floors either sealed or painted? Are all surfaces used for food handling durable and easy to maintain in a
hygienic condition? Have you avoided rough and absorbent surfaces which are difficult to keep
clean? Is fixed equipment installed in such a manner as to facilitate cleaning of
surrounding areas? Are all door finishes high gloss to help with cleaning and wiping of high wear
areas? Have you provided cleaners’ facilities such as sinks and power outlets?
Design Implications For Toilet Areas
Have you avoided floor mounted fixtures and cubicle partitions that will hamper
cleaning?
Have you provided coving at the junction of floors and walls, at cubicle partitions
and on vanity bench tops?
Are floor, wall, partition and fitting materials impervious to water and are they
easily cleanable?
Are floor wastes provided?
Design Implications Services
Is service equipment laid out to provide ease of access for maintenance
purposes?
Are intake louvers accessible and cleanable?

572 J. Jansz
Are air intake louvers fitted with bird/insect screens? Are cooling towers accessible for cleaning and maintenance? Have you avoided stagnant water sources? Have you provided access to domestic water tanks for cleaning purposes? Have you used microbiologically inert paint for painted storage tanks?
Construction Phase
Is the building site regularly cleaned during construction? Do contract documents refer to progressive site equipment cleaning? Do contract documents specify protection and cleaning of any air handling
equipment? Do contract documents specify final cleaning expected of the builder? Do contract documents require the builder to verify that all air handling and
supply systems have been cleaned to comply with the specification? Are ends of ducting plastic sealed to minimise entry of dirt and dust during
construction? Are fan opening sealed until ducting connections are made? Are all internal ducting insulation completely sealed, especially at ends or take-
off points? Are all filters checked and clear prior to occupation of the building? Are temporary filters employed during construction? Have all intake areas of louvers and associated bird and insect screens been
cleaned prior to building handover and occupation? Have all air supply and return systems been cleaned? Have all dirt or dust producing works carried out after occupation been screened
to limit contamination? Has purge ventilation been employed during and after construction?

30 Sick Building Syndrome Identification and Risk Control Measures 573
A ppendix 2: Building Occupants’ Health Survey
Demographic Information (Please tick where appropriate)
Which of these age groups are you in :
Under 18 year old [__]
18 – 29 [__]
30 – 39 [__]
40 – 49 [__]
50 – 59 [__]
60 – 69 [__]
70 + years old. [__]
Gender Male [__] Female [__]
Do you smoke tobacco? Yes [__] No [__]
Occupation :
Position (Job title): ________________________________________________________________
Department : _____________________________________________________________________
Industry : ________________________________________________________________________
How long have you been at your present place of work ? __________________________________
Job Description
Employment status:
Permanent F/T [__]
Permanent P/T [__]
Casual F/T [__]
Casual P/T [__]
Temporary [__]
Other ____________________________________________________________________
I have worked in this area/room since (date) _____________________________________
I have worked in this building since (date) _______________________________________
I have worked in the present location since (date) _________________________________
(1)
(2)
(3)
(4)
(5) Describe briefly your main work duties.
_____________________________________________________________________________
_____________________________________________________________________________
_______________________________________________________________________
________________________________________________________________________

574 J. Jansz
Work Environment (Please tick where appropriate)
(1) Listed below are items related to the work environment. Next to each item, enter in the box the
number from the following scale that best describes the acceptability of your work area at present.
(1) = Very unacceptable (4) = Somewhat acceptable
(2) = Unacceptable (5) = Acceptable
(3) = Somewhat unacceptable (6) = Very acceptable
If any of the following are unacceptable use the following scale to indicate the time problems occur.
Morning [1]; afternoon [2]; all day [3]; no trend [4]; specific days [specify]
Acceptability Time
Temperature [___] [___]
Humidity [___] [___]
Air movement [___] [___]
Odour (smell) [___] [___]
Amount of dust [___] [___]
Loudness of sounds [___] [___]
Noisy distractions [___] [___]
Pitch / frequency of Sound [___] [___]
Brightness of lighting [___] [___]
Glare [___] [___]
Shadows [___] [___]
People in work area [___] [___]
Overall environment quality [___] [___]
(2) I am in (please tick):
A closed office [___]
My own cubicle [___]
An open area shared by others [___]
Other (specify) _______________________________________________________________
Indicate how much work space you have in square feet or meters _______________________
(3) What is the geographic location of your desk within the building?
East side [____] Northeast side [____]
West side [____] Northwest corner [____]
South side [____] Southeast corner [____]
North side [____] Southwest corner [____]
(4) (a) Are you sitting within 3.7 m (12 feet) of a window? Yes [___] No [___]
(b) Can the window be opened?: Yes [___] No [___]
(c) What is the number of windows in your work area? _______________________________
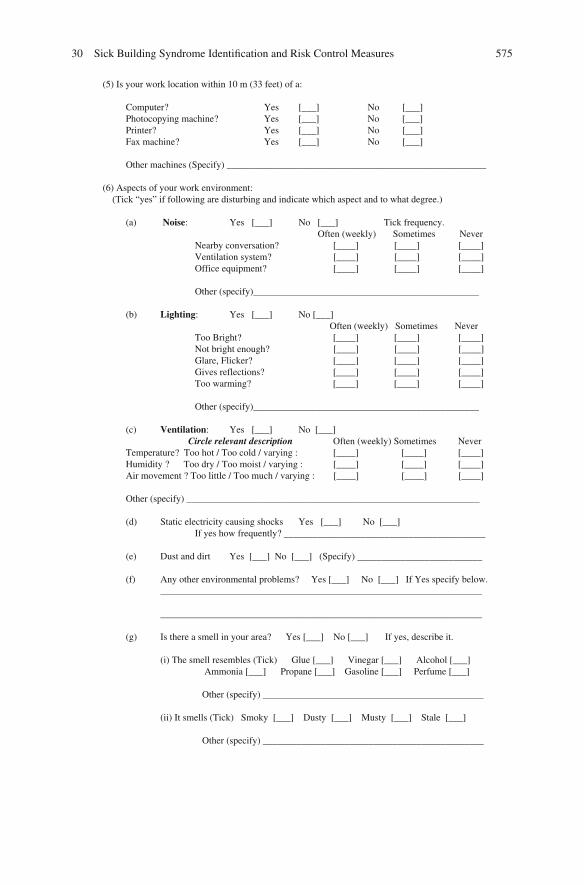
30 Sick Building Syndrome Identification and Risk Control Measures 575
(5) Is your work location within 10 m (33 feet) of a:
Computer? Yes [___] No [___]
Photocopying machine? Yes [___] No [___]
Printer? Yes [___] No [___]
Fax machine? Yes [___] No [___]
Other machines (Specify) ______________________________________________________
(6) Aspects of your work environment:
(Tick “yes” if following are disturbing and indicate which aspect and to what degree.)
(a) Noise: Yes [___] No [___] Tick frequency.
Often (weekly) Sometimes Never
Nearby conversation? [____] [____] [____]
Ventilation system? [____] [____] [____]
Office equipment? [____] [____] [____]
Other (specify)_______________________________________________
(b) Lighting: Yes [___] No [___]
Often (weekly) Sometimes Never
Too Bright? [____] [____] [____]
Not bright enough? [____] [____] [____]
Glare, Flicker? [____] [____] [____]
Gives reflections? [____] [____] [____]
Too warming? [____] [____] [____]
Other (specify)_______________________________________________
(c) Ventilation: Yes [___] No [___]
Circle relevant description Often (weekly) Sometimes Never
Temperature? Too hot / Too cold / varying : [____] [____] [____]
Humidity ? Too dry / Too moist / varying : [____] [____] [____]
Air movement ? Too little / Too much / varying : [____] [____] [____]
Other (specify) _____________________________________________________________
(d) Static electricity causing shocks Yes [___] No [___]
If yes how frequently? __________________________________________
(e) Dust and dirt Yes [___] No [___] (Specify) __________________________
(f) Any other environmental problems? Yes [___] No [___] If Yes specify below.
___________________________________________________________________
___________________________________________________________________
(g) Is there a smell in your area? Yes [___] No [___] If yes, describe it.
(i) The smell resembles (Tick) Glue [___] Vinegar [___] Alcohol [___]
Ammonia [___] Propane [___] Gasoline [___] Perfume [___]
Other (specify) ______________________________________________
(ii) It smells (Tick) Smoky [___] Dusty [___] Musty [___] Stale [___]
Other (specify) ______________________________________________

576 J. Jansz
______ ____ _______________________;
(iii) What location(s) is the smell coming from?________________________
___________________________________________________________________.
(h) Are any of the following used in your work environment?
(i) A desk lamp? [___]
(ii) A fan? [___]
(iii) A heater? [___]
(iv) A humidifier? [___]
(v) An ion generator? [___]
(vi) An air cleaner? [___]
(vii) Personal care products? Specify: e.g. hand cream, hairspray, etc.
_______________________________________
(viii) No such items [___]
(i) Have you any control over the following for your location?
(i) Ventilation ? [___]
(ii) Temperature ? [___]
(iii) Humidity ? [___]
(iv) Lighting ? [___]
Write any other comments or observations about your work environment that may affect your health.
________________________________________________________________________________
If there are indoor air quality problems, in your opinion, what are the causes these problems?
________________________________________________________________________________
________________________________________________________________________________
Work Conditions
Often Sometimes seldom never
Do you regard your work as
interesting? [__] [__] [__] [___]
Do you find your work
stimulating? [__] [__] [__] [___]
Do you have too much work
to do? [__] [__] [__] [___]
Do you have opportunities
to influence your working
conditions? [__] [__] [__] [___]
Do your fellow workers help
you with problems you may
be having in your work? [___] [__] [__] [___]
________________________________________________________________________________
Please comment on any factors you consider important concerning the quality of your work conditions.
________________________________________________________________________________

30 Sick Building Syndrome Identification and Risk Control Measures 577
Health (Please tick where appropriate.)
1. Have you experienced any of the symptoms below while in this building?
Not related Appear Increased
Symptoms Occasional Frequent to building after arrival after arrival
Dizziness [_____] [_____] [_____] [_____] [_____]
Sneezing [_____] [
Bad concentration [_____] [_____] [_____] [_____] [_____]
Aching joints [_____] [_____] [_____] [_____] [_____]
Muscle twitching [_____] [_____] [_____] [_____] [_____]
Back pain [_____] [_____] [_____] [_____] [_____]
Hearing problems [_____] [_____] [_____] [_____] [_____]
Dry, flaking skin [_____] [_____] [_____] [_____] [_____]
Discoloured skin [_____] [_____] [_____] [_____] [_____]
Skin irritation [_____] [_____] [_____] [_____] [_____]
Itching [_____] [_____] [_____] [_____] [_____]
Heartburn [_____] [_____] [_____] [_____] [_____]
Nausea [_____] [_____] [_____] [_____] [_____]
Bad odours [_____] [_____] [_____] [_____] [_____]
Sinus congestion [_____] [_____] [_____] [_____] [_____]
_____] [_____] [_____] [_____]
High stress level [_____] [_____] [_____] [_____] [_____]
Chest tightness [_____] [_____] [_____] [_____] [_____]
Eye irritations [_____] [_____] [_____] [_____] [_____]
Fainting [_____] [_____] [_____] [_____] [_____]
Hyperventilation [_____] [_____] [_____] [_____] [_____]
Contact lens problems [_____] [_____] [_____] [_____] [_____]
Head aches [_____] [_____] [_____] [_____] [_____]
Fatigue/drowsiness [_____] [_____] [_____] [_____] [_____]
Temperature too hot [_____] [_____] [_____] [_____] [_____]
Temperature too cold [_____] [_____] [_____] [_____] [_____]
Other (Specify) [_____] [_____] [_____] [_____] [_____]
____________________________________________________________________________
No health effecting symptoms experienced in this building. [______]

578 J. Jansz
2. Please circle any of the following symptoms that you may have at this moment:
Headache Backache Drowsiness Hand cramps
Eye irritation Sore throat Itchy feet Stiff arm
Nose irritation Neck pain Leg cramps Dry skin
Rash Itchy skin Mental fatigue
Unexplained memory loss Dry mucous membranes.
Record any other current symptoms you experience that may be related to your work environment.
________________________________________________________________________________
3. Effects of specific symptoms:
During the previous week while working in your ar ea please answer the following about your health.
LEFT RIGHT
Do symptoms interfere with work? Which are the troublesome symptoms?
(A) Nasal symptoms
YES [_____] Nosebleeds [_____]
NO [_____] Congestion [_____]
Sinus problems [_____]
Sneezing [_____]
Runny nose [_____]
Dry nose [_____]
Other (specify) ___________________________
(B) Throat symptoms
YES [_____] Sore throat [_____]
NO [_____] Dry cough [_____]
Other (specify)___________________________
(C) Eye symptoms
YES [_____] Redness [_____]
NO [_____] Watering [_____]
Burning [_____]
Puffiness [_____]
Dryness [_____]
Irritation [_____]
Blurred vision [_____]
Other (specify)___________________________
(D) Contact lens wearer
YES [____] NO [____]
Problems with wearing them Problems with
YES [____] NO [____] Cleaning [_____]
Deposits [_____]
Discomfort [_____]
Pain [_____]
Other (specify)___________________________

30 Sick Building Syndrome Identification and Risk Control Measures 579
(E) Skin symptoms
YES [_____]
NO [_____]
(F) Chest symptoms
YES [_____]
NO [_____]
(G) Aches and pains
YES [_____]
NO [_____]
(H) General complaints
YES [_____]
NO [_____]
(I) Other symptoms
YES [_____]
NO [_____]
Wheezing [_____]
Dryness [_____]
Flaking [_____]
Rash [_____]
Irritation [_____]
Unusual “mole” [_____]
Other (specify)__________________________
Coughing [_____]
Lung congestion [_____]
Other breathing [_____]
Chest pains [_____]
Breast pains [_____]
Breast lumps [_____]
Blurred vision [_____]
Other (specify)__________________________
Headache [_____]
Backache [_____]
Muscle pain [_____]
Tendon pain [_____]
Joint pain [_____]
Other (specify)__________________________
Drowsiness [_____]
Dizziness [_____]
Faintness [_____]
Concentration difficulty [_____]
Other (specify)__________________________
Digestive [_____]
Menstrual [_____]Other (specify)__________________________
(J) Were you ever absent from work because of any health problems that may have been caused or
aggravated by working in your present area? YES [_____ ] NO [_____]
If YES, state the health problems. ____________________________________________________
________________________________________________________________________________
________________________________________________________________________________
(K) Did you seek medical attention or treatment because of any health problem(s) caused by working at
your present location? YES [_____] NO [_____]
(L) Do you have allergies? YES [_____] NO [_____]
If YES, state the nature of your Allergy ________________________________________________
________________________________________________________________________________

580 J. Jansz
(M) Are you taking any prescribed medication for any of the symptoms you mentioned?
YES [_____] NO [_____]
What medications and dose? _________________________________________________________
________________________________________________________________________________
________________________________________________________________________________
(N) Are there any further comments which you would like to make?
________________________________________________________________________________
________________________________________________________________________________
4. S ym ptoms frequency
(A) During the last 3 months, have you had any of the following symptoms ?
If Yes: Do you
Believe that it is
Due to your work
Environment ?
Yes, often Yes, No,
(weekly) sometimes never YES NO
(a) Fatigue [_____] [_____] [_____] [___] [___]
(b) “Heavy headed” [_____] [_____] [_____] [___] [___]
(c) Headache [_____] [_____] [_____] [___] [___]
(d) Nausea [_____] [_____] [_____] [___] [___]
(e) Dizziness [_____] [_____] [_____] [___] [___]
(f) Hard to concentrate [_____] [_____] [_____] [___] [___]
(g) Eye irritation: [_____] [_____] [_____] [___] [___]
eg. Itching or burning
(h) Nose irritation: [_____] [_____] [_____] [___] [___]
eg. Stuffy or runny
(i) Throat irritation: [_____] [_____] [_____] [___] [___]
eg. Hoarse or dry
(j) Cough [_____] [_____] [_____] [___] [___]
(k) Skin irritation [_____] [_____] [_____] [___] [___]
eg. Dry, flushed, itchy, red.
(l) Scalp/ ear irritation [_____] [_____] [_____] [___] [___]
eg. Scaling or Itching
(m) Other (please specify) [_____] [_____] [_____] [___] [___]

30 Sick Building Syndrome Identification and Risk Control Measures 581
(B) When do these symptoms occur (please tick or circle)?
(i) Morning [____] Afternoon [____] Evening [_____]
(ii) Days of the week : Sun M Tu W Th F Sat
(iii) Months: Jan Feb March April May June July Aug Sept Oct Nov Dec
(iv) Seasons: Summer Autumn Winter Spring.
(C) Do symptoms disappear? YES [___] NO [___]
When ? _______________________________________________________________________
(D) If these symptoms have ceased when did they cease? _________________________________
5. Past /present medical history
YES NO
Have you ever had asthmatic problems ? [_____] [_____]
Have you ever suffered from hay fever ? [_____] [_____]
Have you ever suffered from eczema ? [_____] [_____]
Does anybody else in your family suffer
from allergies or have any of the above? [_____] [_____]
The questions included in this Building Occupant Health Survey have been taken
from 3 questionnaires. The National Institute of Occupational Safety and Health
(NIOSH) indoor air quality survey questionnaire, the American Industrial Hygiene
Association (AIHA) occupational health and comfort questionnaire and the Danish
Building Research Institute building diagnostic human resource questionnaire.
Reference: Godish T (1995) Sick Buildings. Definition, diagnosis and mitigation.Boca Raton, Florida: Lewis Publishers. 254–268

582 J. Jansz
Appendix 3: Risk Control Action Plan
Legend
L = Likelihood. C = Consequences
C = Certain. H = High.P = Possible. M= Moderate.R = Rare. L = Low.
RR = Risk Rating:E extreme risk; immediate action requiredH high risk; senior management attention requiredM moderate risk; management responsibility must be specifiedL low risk; manage by routine procedures.
P = Person responsible. In this column record the person’s name, for example,
Jessica Allen.
D = Date that action is completed.
OHSP = Occupational Safety and Health Professional.
Hazard L C RR
Action.To be conducted by the OHSP annuallyor when ever complaints are recorded. P D
Ventilation inadequate orpoor.
P M M Monitor air quality using an Air VelocityMeter. If ventilation inadequate arrangefor installation of adequate ventilationpoints & conduct further monitoring toensure that ventilation is adequate.
Ensure 3 monthly ventilation maintenanceoccurs and check adequacy of thismaintenance.
Temperature too hot or toocold.
P M M Use a Heat Stress Monitor to measuretemperature and humidity. The heatstress monitor measures wet bulb, drybulb and radiant heat in degreesCentigrade, wind speed in m/secondand Barometric pressure in KPa. Adjusttemperature levels then conduct furthermonitoring of employees’ comfort untilemployees state that temperature issatisfactory.

30 Sick Building Syndrome Identification and Risk Control Measures 583
(continued)
Air movement. Insufficientor too drafty.
P M M Monitor employee work comfort levels.Conduct air speed measuring using aKata thermometer, which allows airvelocity to be measured by determiningthe cooling power of the air.
Make recommendations for air flowimprovements and ensureimplementation of improvements.
Humidity of air too high.Excess sweating inbuilding occupants.
Humidity too low. Dryingof mucus membranes ofeyes & nose experienced.
P M M Moisture content should be measuredwith a hygrometer and the relativehumidity measured by use of a whirlinghygrometer (sling psychrometer),which consists of both wet and dry bulbthermometers & psychrometric charts.
If moisture level is too high or low arrangefor ventilation maintenance to set airconditioning moisture at correct level.
Airborne Particles. Largeparticles may lodge in thenose & throat whilesmaller particles can bedeposited lower in thelungs. Asbestos is oftenpresent in old buildings.Synthetic fibres may beshed from deterioratinginsulation material orceiling tiles.
P M H Conduct Filtration sampling by drawing aknown volume of air through apre-weighed filtering device by meansof an air pump. The device is thenweighed to determine the mass of dust,fibreglass, asbestos, etc. collectedduring the sampling period, which maybe the working day. The pore size of thefilter will determine the size of particlesthat are collected. A Dust Track and ap-track can be used for dust monitoring.Personal exposure monitoring can alsobe conducted. If airborne particles arepresent determine the cause andeliminate this cause if practicable.
Lighting. Sources ofillumination candeteriorate with time dueto windows and lightfittings accumulating dirt.
Surfaces may become dirtyso reducing the amountof light reflected fromthem. Correct level ofillumination does notnecessarily mean that theworkplace is properly lit.
Measurement ofillumination takes noaccount of glare fromunshielded lights orwindows or of theposition of the worker inrelation to the lightsource.
P M M Use a Lux Meter or Photometer toconduct lighting surveys to measureluminance levels. Also conduct a visualassessment of lighting adequacy,suitability to the work being done forlighting level, shadows, reflections,glare, colours, cleanliness, flicker andlight distribution. Talk to peopleoccupying the room about what theyfeel about the lighting levels. Make thenecessary adjustments and retainmaintenance records. Ensure adequatecleaning for maximum light sourceeffectiveness. Monitor employees’satisfaction with work related lighting.

584 J. Jansz
(continued)
Noise. P M M Sound level meters, or personal noisedose monitors, should be used tomeasure the intensity of sound in unitscalled decibels (dB). A reading indB(A) cuts out those sound frequenciesthat the human ear is not sensitive toand boosts the sensitive frequencies.Interview people in the workplace todetermine if there is nuisance noise thatinterferes with their workconcentration. If problems identifiedmake recommendations for noiseminimisation & ensure implementation.
Carbon Dioxide (CO2). P M M Monitor to ensure that CO2 remainsbelow 800 ppm in building air. If abovethis level assess cause (such as toomany people in the room or inadequateventilation), make recommendations forreducing the level of CO2 & ensureimplementation.
Carbon Monoxide.Nitrogen Oxides.Nitrogen Dioxide.Sulphur Dioxide.Polycyclic Aromatic
Hydrocarbons.Airborne contaminants.
P M H Monitor indoor air quality to determine ifthere are any pollutants includingcarbon monoxide (CO), nitrogen oxides(NO), nitrogen dioxide (NO2), sulphurdioxide (SO2) or polycyclic aromatichydrocarbons (PAHs). If presentidentify cause, make recommendationsfor eliminating the air bornecontaminant(s) in the indoor air &ensure implementation of risk controlmeasures.
Vapours from newfurniture, fittings and/ orfloor coverings.
P M M Ideally furniture, fittings and floorcoverings should be selected that do notomit volatile organic compounds(VOCs). If air monitoring determinesthat VOCs are present in theatmosphere provide advice to area onmanaging staff sensitivities/symptoms.Assess cause and manage resolution.Make recommendations for hazardcontrol and ensure implementation.

30 Sick Building Syndrome Identification and Risk Control Measures 585
(continued)
Ozone. P M H Monitor for electrical discharges &presence of ozone from photocopiers,laser printers, air filters, electric motorbrushes, air ionisers & other electricalequipment. As ozone is toxic even atlow levels if present consider replacingthe machine producing the electricaldischarge that generates ozone with amachine that does not do this. If this isnot possible isolate the machine in awell ventilated area of the workplacethat is only used by building occupantsfor very short periods of time.
Mould. P M H Cleaners should be instructed to check forevidence of mould in all areas of thebuilding that they clean each day,particularly in wet areas such as toiletsand bathrooms and also after storms ifany structural damage has occurred.If mould is reported the OSHP shouldidentify the cause, makerecommendations for elimination of themould, prevention of furtheroccurrences due to the same or similarcauses and ensure implementation ofrisk control measures.
Dust mites, bacteria, virusesor other micro organisms.
P M H Cleaners’ supervisor must checkadequacy of building cleaning at leastweekly. If inadequate cleaning thatleaves dust in the workplace the OSHP,or cleaners’ supervisor, is to check whythis occurs (may be due to inadequatetime allowed for cleaning, inadequateequipment or products for cleaning,poor work procedures, lack of training,etc) and to rectify the cause so that thebuilding cleaning is adequate. Annualcleaning report to be written by theOHSP in conjunction with the cleaners’supervisor with praise for what hasbeen well done and any opportunitiesfor improvements documented.
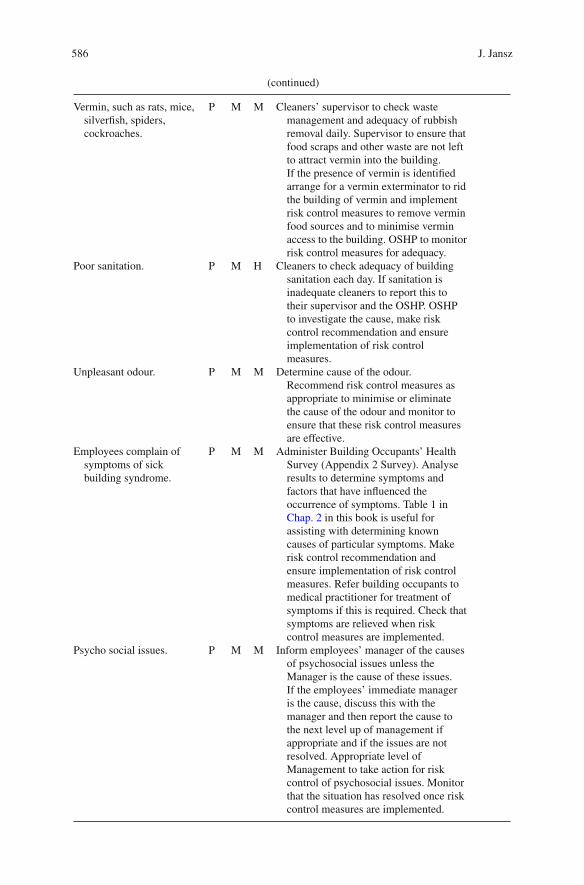
586 J. Jansz
(continued)
Vermin, such as rats, mice,silverfish, spiders,cockroaches.
P M M Cleaners’ supervisor to check wastemanagement and adequacy of rubbishremoval daily. Supervisor to ensure thatfood scraps and other waste are not leftto attract vermin into the building.If the presence of vermin is identifiedarrange for a vermin exterminator to ridthe building of vermin and implementrisk control measures to remove verminfood sources and to minimise verminaccess to the building. OSHP to monitorrisk control measures for adequacy.
Poor sanitation. P M H Cleaners to check adequacy of buildingsanitation each day. If sanitation isinadequate cleaners to report this totheir supervisor and the OSHP. OSHPto investigate the cause, make riskcontrol recommendation and ensureimplementation of risk controlmeasures.
Unpleasant odour. P M M Determine cause of the odour.Recommend risk control measures asappropriate to minimise or eliminatethe cause of the odour and monitor toensure that these risk control measuresare effective.
Employees complain ofsymptoms of sickbuilding syndrome.
P M M Administer Building Occupants’ HealthSurvey (Appendix 2 Survey). Analyseresults to determine symptoms andfactors that have influenced theoccurrence of symptoms. Table 1 inChap. 2 in this book is useful forassisting with determining knowncauses of particular symptoms. Makerisk control recommendation andensure implementation of risk controlmeasures. Refer building occupants tomedical practitioner for treatment ofsymptoms if this is required. Check thatsymptoms are relieved when riskcontrol measures are implemented.
Psycho social issues. P M M Inform employees’ manager of the causesof psychosocial issues unless theManager is the cause of these issues.If the employees’ immediate manageris the cause, discuss this with themanager and then report the cause tothe next level up of management ifappropriate and if the issues are notresolved. Appropriate level ofManagement to take action for riskcontrol of psychosocial issues. Monitorthat the situation has resolved once riskcontrol measures are implemented.
30 Sick Building Syndrome Identification and Risk Control Measures 587
References
Air Conditioning and Indoor Air Quality (2006, December), Accessed 2009, July 1from www.publicliability.net.au/.../AIR%20CONDITIONING%20&%20INDOOR%20AIR%20QUALITY.pdf. Australian Building Codes Board (2010) Building Code of Australia.Homebush, NSW: SAI Global.
Bourbeau J, Brisson S, Allaire S (1997) Prevalence of sick building syndrome in office workersbefore, and 6 months and 3 years after being exposed to a building with an improved ventilationsystem. Occup Environ Med 54:49–53.
Brinke J, Selvin S, Hodgson A, Fisk W, Mendell M, Koshland C, Daisey J (1998) Development of
new volatile organic compound (VOC) exposure metrics and their relationship to “sick building
syndrome” symptoms. Indoor Air 8:140–152.
Brundage J, McNeil R, Lednar W, Smith D, Miller R (1988) Building-associated risk of febrile
acute respiratory diseases in army trainees. J Am Med Assoc 259(14):2108–2112.
City of Palo Alto California (2010) Green buildings. City Council of Palo Alto, California, USA.
Drinka P, Krause P, Schilling M, Miller B, Shult P, Gravenstein S (1996) Report of an outbreak:
nursing home architecture and influenza-A attack rates. J Am Geriatr Soc 44:910–913.
Edejer T, Baltussen R, Adam T, Hutubessy R, Acharya A, Evans D, Murray C (2003) WHO Guide
to Cost-effectiveness Analysis. World Health Organisation, Geneva, Switzerland.
Environmental Illness Resource (2010, May 26) Sick Building Syndrome. Accessed 2010
May 26 from http://www.ei-resource.org/illness-information/related-conditions/sick-building-
syndrome.
Frisk W, Rosenfield A (1997) Estimates of improved productivity and health from better indoor
environments. Indoor Air. 7:158–172.
Godish T (1995) Sick Buildings: Definition, Diagnosis and Mitigation. Lewis Publishers, Boca
Raton, FL.
Health and Safety Executive (2000) How to Deal with SBS (Sick Building Syndrome). Guidance
for Employers, Building Owners and Building Managers. HSE, Suffolk, UK.
Health and Safety Executive (2004) Sick building syndrome. Accessed 2004, November 18 from
file://J:\dev\poperational\Ocs%2OTYP(pdf)\300-399\oc311_2.htm
Hodgson A, Apte M, Shendell D, Beal D, McIlvaine J (2002) Implementation of VOC Source
Reduction Practices in a Manufactured House and in School Classrooms. Lawrence Berkeley
National Laboratory University of California, California.
Jaakkola J, Miettinen P (1995) Ventilation rates in office buildings and sick building syndrome.
Occup Environ Med 94(2):709–714.
Jennings M (2010) When to use an occupational hygienist. In Barrett T, Cameron D, Jansz J (Eds.)
Safe Business. Good Business. A Practical Guide to Occupational Safety, Health and Insurance
in Australasia. (3rd ed.). Vineyard Publishing Pty. Ltd, Guildford, WA. pp. 211–229.
Joshi S (2008) The sick building syndrome. Indian J Occup Environ Med 12(2):61–64.
Legislative Assembly (2001, April) Sick Building Syndrome. Report No. 52/07. Standing
Committee on Public Health, Parliament of NSW, Sydney, New South Wales.
Loftness V, Hartkopf V, Poh L, Snyder M, Hua Y, Gu Y, Choi J, Yang X (2006) Sustainability and
Health are Integral Goals for the Built Environment. Lisbon, Portugal: Healthy Buildings 2006.
Massachusetts Division of Occupational Safety Occupational Hygiene Program (1997, October 23)
Preventing indoor air quality problems in construction & renovation. OH/IAQ Bull 388:p. 1–5.
Mendelson M, Catano V, Kelloway K (2000) The role of stress and social support in sick building
syndrome. Work Stress 14(2):137–155.
Menzies D, Fanning A, Yuan L, Fitzgerald J (2000) Hospital ventilation and risk for tuberculosis
infection in Canadian Health Care workers. Ann Intern Med 133(10):779–789.
Murphy M (2006) Sick Building Syndrome and the Problem of Uncertainty: Environmental
Politics, Techno-science, and Women Workers. Duke University Press, Durham.

588 J. Jansz
Myatt T, Johnson S, Zuo Z, Wand M, Kebadze T, Rudnick S, Milton D (2004) Detection of airbornerhinovirus and its relationship to outdoor air supply in office environments. Am J Respir CritCare Mede 169:1187–1190.
New South Wales Department of Environment, Climate Change and Water (2010) NationalAustralia Built Environment Rating System. Accessed 2010, July 16 from http://www.nabers.com.au
Niven R, Fletcher A, Pickering C, Faragher E, Potter I, Booth W, Jones T, Potter P (2000) Buildingsickness syndrome in healthy and unhealthy buildings: an epidemiological and environmentalassessment with cluster analysis. Occup Environ Med 57:627–634.
Passarelli G (2009) Sick building syndrome: an overview to raise awareness. J Build Apprais5(1):55–66.
Pinzari F, Montanari M (2011) Mould growth on library materials stored in compactus- typeshelving units, chapter 11. In: Abdul-Wahab SA (Ed.) Sick Building Syndrome in PublicBuildings and Workplaces. Springer.
Property Council of Australia (2009) Managing Indoor Environment Quality. Property Council ofAustralia, Sydney, NSW.
Redlich C, Sparer J, Cullen M (1997) Sick building syndrome. Lancet 349:1013–1016.Roy P (2010) Sick? Sick, or real sick? Presented at the AIOH June Sundowner. Chemistry Centre.
Curtin University. Bentley, Western Australia.Schneider T (1999) Measuring strategies and monitoring of the indoor air environment. J Environ
Monit 1:427–434.Smedje G, Norback D (2000) New ventilation systems at select schools in Sweden: Effects on
asthma and exposures. Arch Environ Health 35(1):18–25.Standards Australia (2006) AS/NZS 1680:2006 Interior Lighting, Part 1: General Principles and
Recommendations. Standards Australia, Homebush, NSW.Standards Australia (2008) AS/NZS 1680.2.2:2008 Interior and Workplace Lighting–Specific
Applications–Office and Screen-Based Tasks. Standards Australia, Homebush, NSW.Sundell J (1996) What We Know, and Don’t Know, About Sick Building Syndrome. ASHRAE J
38(6):51–57.Tham K, Willem H, Sekhar S, Wyon D, Wargocki P, Fanger P (2003) Temperature and ventila-
tion effects on the work performance of office workers (study of a call centre in the tropics).In Proceedings of healthy buildings 2003, December 7–11, Singapore.
The Royal Australian Institute of Architects and Archicentre Victoria (2005) Submission toHousing Construction Inquiry-Victorian Competition and Efficiency Commission. The RoyalAustralian Institute of Architects, Melbourne, VIC.
The Sustainable Mandurah Home (2010) Accessed 2010, July 31 from www.sustainablemandurah.com.au
TSSA (2010) Sick Building Syndrome. Accessed 2010, May 26 from http://www.tssa.org.uk/article-47.php3?id_article=1001.
United States of America Environmental Protection Agency (US. EPA) (2010) Indoor air factsno. 4 (revised) Sick Building Syndrome. Accessed 2010, June 3 from http://www.epa.gov/iaq/pubs/sbs.html
World Health Organisation (2006) Development of WHO guidelines for indoor air quality. Reporton a Working Group Meeting. Bonn, Germany. 23–24 October, 2006. Copenhagen, Denmark:World Health Organisation Regional Office for Europe.

Chapter 31
The Way Forward
Mahmoud Yousef Abdulraheem
Sick Building Syndrome (SBS) is a phenomenon considered to be caused by poor
architecture, exposure to some man-made building materials, air borne biological,
chemical, dust and fiber hazards, low frequency noise, inadequate lighting and by
inadequate ventilation/air conditioning systems. In arid regions, such as the Arabian
Peninsula, where extreme heat and high dust loads are a common feature, com-
munities have adapted their home designs and building materials to provide the
maximum insulation and natural ventilation. However, the region leaped into an
urbanization boom in the middle of last century, with high rise buildings made from
concrete, glass and metal and fitted with artificial lightning and air conditioning
all year around. The indoor environmental conditions have radically changed. This
change in the micro climate of buildings has attracted little attention by the envi-
ronment and health authorities and experts. Cases of allergies, migraines, rhinitis
and other symptoms are often diagnosed as allergies and attributed mostly to the
high dust loads in the air. Accordingly, this book comes in time to fill a gap in our
knowledge of the causes, symptoms and mitigation approaches of SBS conditions.
Upon the kind invitation of Professor Sabah Abdul-Wahab, I had the pleasure of
looking at the final draft of the book. I commend her on the choice of contributors
who are authorities in their specific fields. The chapters are focused, well written
and oriented towards the provision of guidance in understanding, assessment and
mitigation of SBS. I hope that this book will not only capture the eyes of planners in
our region but also becomes a base for developing guidelines for planning, design
and assessment of building designs throughout the world to reduce the potential for
developing SBS.
After reading the chapters in this book I suggested that the Sultan Qaboos
University would take the initiate to call for a regional conference on SBS during
which this book can be launched and the authors are invited to conduct a workshop
for planners, architects, environmental and health specialists to be educated on SBS
and engage them into initiating the process of developing guidelines for meeting
M.Y. Abdulraheem (B)
Research Directorate, Kuwait Fund for the Advancement of Sciences (KFAS), Kuwait
e-mail: [email protected]
589S.A. Abdul-Wahab (ed.), Sick Building Syndrome,
DOI 10.1007/978-3-642-17919-8_31, C© Springer-Verlag Berlin Heidelberg 2011

590 M.Y. Abdulraheem
health and comfort indicator values in the indoor environment, and thus promote
avoidance of SBS. I have been asked by Professor Abdul-Wahab to put forward
some ideas to be discussed at the proposed workshop that may help in pointing
the way forward in SBS related research. I can see that there are areas of applied
research, planning and management that may be pursed in future, building upon the
concepts and information elegantly elaborated in the various chapters of this book.
These include carrying out epidemiological studies on randomly selected house-
holds, development of alternative building designs and development of alternative
air conditioning systems. The following are some recommendations that have arisen
from the research conducted to write this book.
1. Conduct cohort epidemiological studies. More and more, it is realized that indoor
environments can represent a health risk that may equal that associated with
outdoor exposure (Harvard School of Public Health 2005; Abdulraheem 2006).
Two cohort studies have been conducted in the Gulf Cooperation Council (GCC)
region, one in Kuwait by the Harvard School of Public Health (Evans 2006)
in which both indoor and outdoor air quality were assessed and related to the
health status of the occupants. This study was aimed at determining the impact
of war on the Kuwaiti population but it did give an insight on the health-related
effects of the indoor environment. The most recent study was carried out by
the University of North Carolina in the UAE (MacDonald and Brammer 2009;
MacDonald et al. 2010) which was funded by the Abu Dhabi Environment
Authority (EAD). The study confirmed that particulate matter in air represents
a greater risk to health to the public and that cigarette smoke may pose greater
health risks indoors. The study also suggests that smokers may represent as much
as 30% of the population. Repeating such studies with a focus on ventilation (rate
of air exchange), type of air conditioning and social habits as smoking, incense
burning or cooking inside air conditioned homes and the relationship with the
health status and SBS may be extremely useful to health officials in the GCC
countries. The impacts of total suspended particles (TSP), their composition and
health impacts are of extreme importance to such an arid region and thus may be
simultaneously monitored and assessed.
2. Development of alternative building designs. Traditionally houses in the GCC
countries were built from available materials, e.g. coral rock, mud and palm
leaves and were mostly one floor with an open yard located in the middle of the
house. The ceiling was high and the roofs were built from wooden logs covered
with sheets of bamboo slices that were covered with mud. Air cooling tunnels
running on the side wall, locally called Badgeer, provided air circulation. During
the 1970s a comparative study of globe temperature was made on a traditional
house and a modern concrete villa. The indoor air temperature reached equilib-
rium with the outdoor temperature by around 10 in the evening, while it barely
reached such a level by 3 am in the concrete houses. In the GCC countries air
conditioning is a necessity that comes with an extremely high cost. Electricity
consumption by building air conditioning represents around 70% of the total
house electrical bill. To keep homes cool in the extreme heats of June until

31 The Way Forward 591
September, air conditioning suppliers tend to reduce the fresh air exchange rate
to the minimum to conserve cold air. This means that contaminants would be
trapped and re circulated. Cigarette smoke, chemicals from furniture, dust from
outside, insect remains and stove emissions are common indoor contaminants,
the exposure to which would increase if the air exchange rates are reduced. This
is a major dilemma, i.e. while resources are spent on burning fossil fuels to pro-
duce electricity which is spent to run air conditioners; we increase the health risk
by reducing the air exchange rate at home. The problem becomes more compli-
cated during dust storms which have increased in intensity and frequency over
the past decade due to droughts, dams that reduced river flows and agriculture as
well as overgrazing and urbanization.
The reason for pushing this condensed information upon the reader is to
emphasize the complexity and potential areas of research that are associated
with the issues of building design in the GCC region. It is a challenge to the
environmental and to health specialists that must be addressed before all build-
ings become boxes of concrete and glass that are lacking when it comes to human
health and comfort.
3. Alternative air conditioning systems. As stated above, air conditioning is respon-
sible for up to 70% of energy consumption at homes, while not necessarily
guaranteeing indoor air quality, and may even be responsible for SBS symptoms.
Looking at more energy efficiency, with greater potential for mixing indoor and
outdoor air seems to be a sound area for research. Systems such as floor cooling,
adiabatic cooling and heat exchange between cooled exhaust air and outside air
are only few of the potential areas for research.
The social aspects of SBS may also be in need of further assessment. To elab-
orate, an indoor environment that is healthy and pleasant would be more inductive
for family members to spend more time at home and allow for a more relaxing
environment to prevail.
References
Abdulraheem, MY (2006) Health and Environment Program: KFAS Perspective. Second Project
Planning Meeting (November 12–13).
Harvard School of Public Health (2005) Kuwait air monitoring activities. In: Evans J. et al.
Submitted to the Kuwait Authority for Compensation.
Evans JS (2006) Environment and Health in Kuwait, Towards a Kuwait National Center for Sound
Decisions to Improve Health and Environment. Second Project Planning Meeting (November
12–13).
MacDonald Gibson J, Brammer A, Davidson C (eds.) (2010) The State of Environmental Health
in the United Arab Emirates—2010. Abu Dhabi, United Arab Emirates: Environment Agency-
Abu Dhabi, 340pp.
MacDonald Gibson J, Brammer A (eds.) (2009) National Strategy and Action Plan for
Environmental Health, United Arab Emirates—2010. Abu Dhabi, United Arab Emirates:
Environment Agency-Abu Dhabi, 104pp.