siemens ag · pdf file · 2017-02-07the stable outlook on germany-based industrial...
TRANSCRIPT

Siemens AG
Primary Credit Analyst:
Tuomas E Ekholm, CFA, Frankfurt (49) 69-33-999-123; [email protected]
Secondary Contact:
Tobias Buechler, CFA, Frankfurt +49 (0)69-33 999-136; [email protected]
Table Of Contents
Rationale
Outlook
Our Base-Case Scenario
Company Description
Business Risk
Financial Risk
Liquidity
Other Credit Considerations
Ratings Score Snapshot
Reconciliation
Related Criteria And Research
WWW.STANDARDANDPOORS.COM/RATINGSDIRECT FEBRUARY 6, 2017 1
1795785 | 302560242

Siemens AG
Business Risk: STRONG
Vulnerable Excellent
Financial Risk: MODEST
Highly leveraged Minimal
aa+ a+
Anchor Modifiers Group/Gov't
CORPORATE CREDIT RATING
A+/Stable/A-1+
Rationale
Business Risk: Strong Financial Risk : Modest
• Leading market positions in all business divisions,
and a highly diverse global industrial portfolio.
• Strong technological capabilities, with high entry
barriers in all markets, and an ability to reorient the
portfolio toward growth segments.
• A faster margin improvement than expected owing
to group-wide cost-saving initiatives.
• Modest but stable growth as a result of reviving
commodity prices, infrastructure spending, and
acquisitions of industrial software businesses.
• Political risk in different regions across the world,
with overall low economic growth continuing to
constrain investment.
• Ongoing pressure on margins across all segments
due to low economic growth and global industrial
overcapacities.
• Robust credit metrics despite significant
acquisition-related cash spending in 2017.
• Conservative financial policy, including a cap on
industrial net debt to EBITDA of 1x.
• Abundant liquidity, with sound discretionary cash
flow generation through the cycle providing a high
degree of financial flexibility.
• Ongoing pressure on credit ratios from high
shareholder distributions through dividends and
share buybacks, as well as from smaller acquisitions.
WWW.STANDARDANDPOORS.COM/RATINGSDIRECT FEBRUARY 6, 2017 2
1795785 | 302560242

Outlook : Stable
The stable outlook on Germany-based industrial conglomerate Siemens AG reflects S&P Global Ratings' base-case
expectation that the group's operating performance will remain relatively steady, despite the economic and
political risk in its operating environment. In our view, this should enable the group to maintain an S&P Global
Ratings-adjusted ratio of funds from operations (FFO) to debt at the higher end of the 45%-60% range in the next
several years, which we see as being in line with the current ratings, all else being equal.
We expect that Siemens will have adequate financial means to absorb the impact of likely slow global economic
growth, particularly in Asia, and continuously low investment in commodities-driven end markets, while continuing
to match shareholder distributions and acquisitions to cash generation.
Downside scenario
We view headroom for the key credit metrics at the current rating level as largely exhausted. We would consider
taking a negative rating action if Siemens pursued a more aggressive financial policy than we anticipate. This
would be the case if we observed additional sizable cash- and debt-financed acquisitions, with no offsetting asset
disposals, resulting in credit ratios no longer in line with the current rating, in particular FFO to debt at the lower
end of the 45%-60% range.
A negative rating action could also be prompted by a higher shareholder payout ratio than the 40%-60% of net
income we assume in our base case and the current €3 billion share buyback program we expect Siemens to
complete over the next two years. Moreover, we could also lower the rating if Siemens' operating performance,
margins, or portfolio diversification were to weaken significantly.
Upside scenario
We consider an upgrade as unlikely because announced acquisitions have weakened Siemens' forward-looking key
credit ratios. In particular, we do not expect FFO to debt to permanently exceed 60% over the medium term.
Additionally, we expect the volatile economic environment to hamper the group's growth and margin potential.
Upside rating potential could develop if we thought that Siemens could consistently achieve debt-protection
measures commensurate with a minimal financial risk profile, including FFO to debt well above 60%. In the current
environment, this would likely include a more conservative financial policy involving refraining from cash- or
debt-funded acquisitions and large shareholder remuneration plans in order to boost the key credit metrics.
Our Base-Case Scenario
Siemens posted a solid operational and financial performance in 2016, which was a difficult year for the capital goods
sector overall. The group was able to grow its revenues by 5.3% to €79.6 billion and its EBITDA by 18.9% to €10.2
billion, with reported EBITDA margins widening from 11.4% to 12.8%. The effect of higher profitability on Siemens'
credit ratios largely offset a €3.9 billion increase in pension liabilities caused by lower discount rates for pensions in
Germany. This development looks to have reversed as in the first quarter of 2017 (ending Dec. 31, 2016), as Siemens'
WWW.STANDARDANDPOORS.COM/RATINGSDIRECT FEBRUARY 6, 2017 3
1795785 | 302560242
Siemens AG
reported pension deficit dropped by €2.6 billion to €11.1 billion.
Siemens' recent performance underlines the stability of its business. We expect Siemens to continue to show solid
operational and financial performance in 2017, backed by a strong order book, particularly in 2017, when the group
will execute some large orders, as well as a continuous focus on containing its cost base and increasing its margins.
We do not expect additional downside pressure on Siemens' credit metrics from the increase in pension liabilities due
to increasing benchmark interest rates.
In our view, Siemens' recent transactions to merge its Wind Power segment with Gamesa S.A., the acquisition of
industrial software supplier CD-adapco, and the recently announced takeover of semiconductor and electronics design
software company Mentor Graphics for $4.5 billion, will strengthen Siemens' business profile by complementing its
products and solutions and generating synergies. In particular, we view the acquisitions of CD-adapco and Mentor
Graphics as vital for the development of Siemens' digitalized products and solutions portfolio through the
strengthening of its systems design and simulation capacity in fluid mechanics and electronics.
We do not expect the pending transactions with Mentor Graphics and Gamesa to weaken Siemens' credit-protection
measures beyond our thresholds for the ratings. Under our base-case scenario, we project an improving trend in the
group's key ratios after the closing of the Mentor Graphics acquisition. We forecast that Siemens will maintain adjusted
FFO to debt at the high end of the 45%-60% range over the next three years. We note, however, that the
aforementioned transactions have largely used up Siemens' key ratio headroom for the rating level.
WWW.STANDARDANDPOORS.COM/RATINGSDIRECT FEBRUARY 6, 2017 4
1795785 | 302560242
Siemens AG
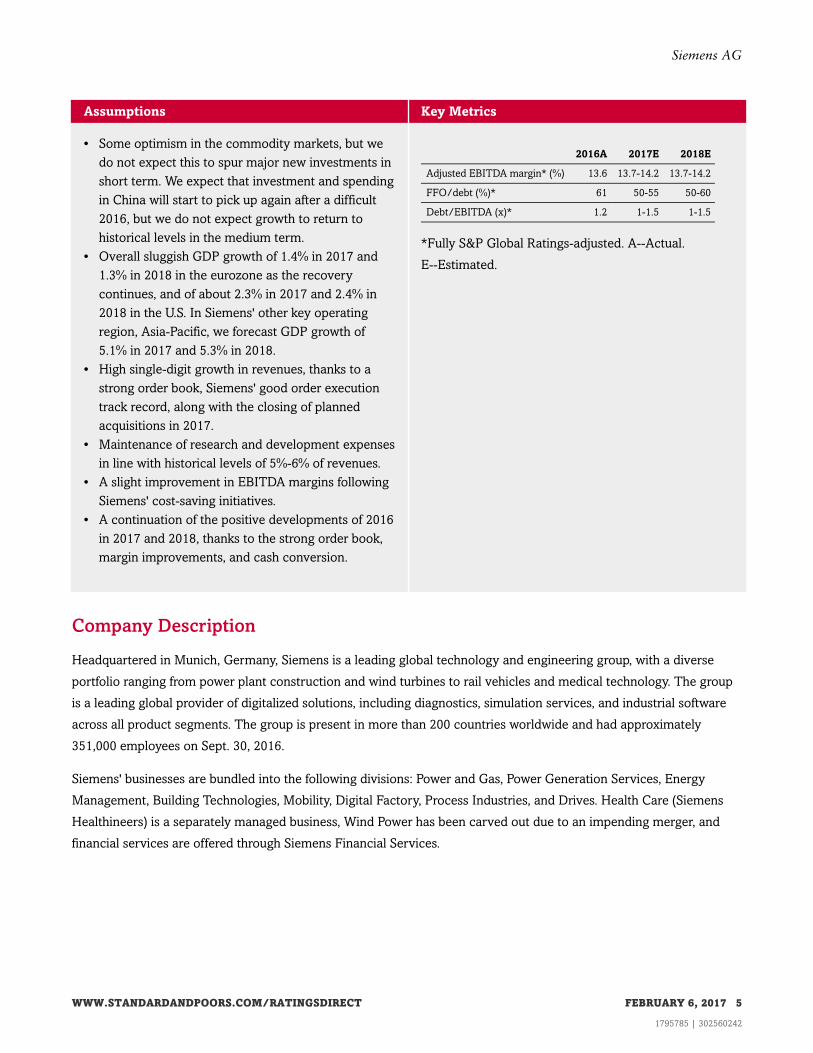
Assumptions Key Metrics
• Some optimism in the commodity markets, but we
do not expect this to spur major new investments in
short term. We expect that investment and spending
in China will start to pick up again after a difficult
2016, but we do not expect growth to return to
historical levels in the medium term.
• Overall sluggish GDP growth of 1.4% in 2017 and
1.3% in 2018 in the eurozone as the recovery
continues, and of about 2.3% in 2017 and 2.4% in
2018 in the U.S. In Siemens' other key operating
region, Asia-Pacific, we forecast GDP growth of
5.1% in 2017 and 5.3% in 2018.
• High single-digit growth in revenues, thanks to a
strong order book, Siemens' good order execution
track record, along with the closing of planned
acquisitions in 2017.
• Maintenance of research and development expenses
in line with historical levels of 5%-6% of revenues.
• A slight improvement in EBITDA margins following
Siemens' cost-saving initiatives.
• A continuation of the positive developments of 2016
in 2017 and 2018, thanks to the strong order book,
margin improvements, and cash conversion.
2016A 2017E 2018E
Adjusted EBITDA margin* (%) 13.6 13.7-14.2 13.7-14.2
FFO/debt (%)* 61 50-55 50-60
Debt/EBITDA (x)* 1.2 1-1.5 1-1.5
*Fully S&P Global Ratings-adjusted. A--Actual.
E--Estimated.
Company Description
Headquartered in Munich, Germany, Siemens is a leading global technology and engineering group, with a diverse
portfolio ranging from power plant construction and wind turbines to rail vehicles and medical technology. The group
is a leading global provider of digitalized solutions, including diagnostics, simulation services, and industrial software
across all product segments. The group is present in more than 200 countries worldwide and had approximately
351,000 employees on Sept. 30, 2016.
Siemens' businesses are bundled into the following divisions: Power and Gas, Power Generation Services, Energy
Management, Building Technologies, Mobility, Digital Factory, Process Industries, and Drives. Health Care (Siemens
Healthineers) is a separately managed business, Wind Power has been carved out due to an impending merger, and
financial services are offered through Siemens Financial Services.
WWW.STANDARDANDPOORS.COM/RATINGSDIRECT FEBRUARY 6, 2017 5
1795785 | 302560242
Siemens AG

Chart 1
WWW.STANDARDANDPOORS.COM/RATINGSDIRECT FEBRUARY 6, 2017 6
1795785 | 302560242
Siemens AG

Chart 2
Business Risk: Strong
Siemens is exposed to a wide variety of industries and their related risks, primarily within the traditional capital goods
area. We consider that the group's less cyclical divisions, such as Digital Factory and Building Technologies, have
lower risk, and view Power and Gas, Process Industries, and Drives as more volatile. In our view, the Energy
Management, Wind Power, and Mobility divisions have long operating cycles and higher industry risk. The group has
decided to operate its lowest risk Health Care division as a separate listed entity, but with a majority stake post listing.
Our view of Siemens' business risk profile is supported by the group's strong industry, geographic, and customer
diversification; leading market positions as a systems provider rather than as a component supplier; and good
long-term demand characteristics in most of its business lines. Siemens typically holds a top-three global position and
is often the leading player in its markets.
In the countries where it operates, Siemens' performance is linked to GDP growth and the investment cycle, but we
see a positive long-term demand pattern for Siemens' products and solutions. Generally, Siemens' process know-how
and technological capabilities provide competitive advantages and should underpin performance over the longer term.
WWW.STANDARDANDPOORS.COM/RATINGSDIRECT FEBRUARY 6, 2017 7
1795785 | 302560242
Siemens AG

In our view, these strengths are tempered by Siemens' high exposure to late- and long-cyclical markets and moderate
profitability relative to some peers'.
Siemens managed to execute its €1 billion cost-saving program ahead of schedule, while a productivity improvement
of 3%-5% of aggregate functional costs every year is underway. This signals the group's commitment to bring its
operating margins closer to those of its more profitable peers.
As part of its portfolio-adjustment process, Siemens is restructuring or exiting low-profit operations. We expect that
the group will continue to focus on higher-margin businesses and digitalization, as evident from its announcement to
acquire Mentor Graphics in November 2016. We view the planned acquisition as a positive step for the development of
Siemens' core business, as we understand that Mentor Graphics will complement Siemens' existing software portfolio,
enabling the group to offer a full set of industrial design software.
Our Base-Case Operating Scenario
• Muted S&P Global Ratings outlook for global capital goods sector companies in 2017 because of continued
weakness in commodity-related demand and mixed conditions in other general industrial subsectors.
• Slow GDP growth in the developed economies of North America and Europe over the next year. Weak
economic conditions in Latin America and the slowdown of the Chinese economy--despite government
investment and plans to shift the country toward a consumption-oriented economy--have further reduced
growth prospects for the global capital goods sector.
• Some positive developments in commodity sectors such as mining and oil, but commodity prices remain low
and are unlikely to spur a high level of new investment.
• Stable performance in the automotive market, positively affecting investment in that sector.
• Growth potential in U.S. infrastructure in the coming years, owing to the government's potential stimulus
measures.
• Uncertain investment levels in the global general industrial markets in light of expected low economic growth
and growing political risk. In addition, the potential for large new orders in power and gas remains a concern.
• Ongoing cost-optimization and focus on being a complete systems provider. In light of weak conditions in their
end markets, it will be critical for global capital goods companies dealing with stagnating top-lines to execute
ongoing cost-improvement programs to mitigate low growth, pricing pressure, and deterioration of their
margins.
• Single-digit revenue growth in 2017, through the execution of existing large contracts and recent transactions in
the renewables and software spaces.
• Moderate margin expansion, thanks to continued restructuring and cost-efficiency programs.
Peer comparisonTable 1
Siemens AG Peer Comparison
Siemens AG ABB Ltd.
Schneider
Electric S.E.
Rolls-Royce
PLC
Atlas Copco
AB
(Mil. €)
--Fiscal year ended
Sept. 30, 2016--
--Fiscal year ended
Dec. 31, 2015-- --Fiscal year ended Dec. 31, 2015--
Revenues 78,820.0 32,667.1 26,640.0 18,626.2 11,121.0
WWW.STANDARDANDPOORS.COM/RATINGSDIRECT FEBRUARY 6, 2017 8
1795785 | 302560242
Siemens AG

Table 1
Siemens AG Peer Comparison (cont.)
Siemens AG ABB Ltd.
Schneider
Electric S.E.
Rolls-Royce
PLC
Atlas Copco
AB
(Mil. €)
--Fiscal year ended
Sept. 30, 2016--
--Fiscal year ended
Dec. 31, 2015-- --Fiscal year ended Dec. 31, 2015--
EBITDA 10,746.5 4,297.1 3,512.5 2,848.3 2,611.4
Funds from operations (FFO) 8,136.7 3,062.2 2,403.7 2,514.7 1,721.6
Net income from continuing
operations
5,262.0 1,776.9 1,407.0 112.6 1,279.8
Cash flow from operations 6,450.6 3,732.5 2,596.7 1,568.8 1,942.4
Capital expenditures 1,793.0 806.5 533.0 1,145.4 218.2
Free operating cash flow 4,657.6 2,925.9 2,063.7 423.4 1,724.2
Discretionary cash flow 1,594.6 1,550.4 844.7 (148) 923.2
Cash and short-term
investments
11,897.0 5,706.4 2,999.0 4,312.9 967.8
Debt 13,341.8 5,024.9 6,526.6 1,749.1 2,221.9
Equity 32,193.0 13,799.3 21,449.7 6,807.2 5,020.4
Adjusted ratios
EBITDA margin (%) 13.6 13.2 13.2 15.3 23.5
Return on capital (%) 16.0 15.2 7.6 18.5 29.1
EBITDA interest coverage (x) 9.4 10.8 7.9 16.6 21.5
FFO cash interest coverage
(x)
11.5 17.0 8.5 33.0 8.3
Debt/EBITDA (x) 1.2 1.2 1.9 0.6 0.9
FFO/debt (%) 61.0 60.9 36.8 143.8 77.5
Cash flow from
operations/debt (%)
48.3 74.3 39.8 89.7 87.4
Free operating cash flow/debt
(%)
34.9 58.2 31.6 24.2 77.6
Discretionary cash flow/debt
(%)
12.0 30.9 12.9 (8.5) 41.5
Financial Risk: Modest
We base our assessment of Siemens' financial risk profile as modest on the group's strong balance sheet, exceptional
liquidity, sound discretionary cash flow generation through the cycle, and robust financial flexibility.
At the end of fiscal 2016, Siemens' adjusted debt was about €13.3 billion, higher than €3.7 billion one year earlier. This
increase was largely due to an increased pension deficit following lower interest rates. As of the fiscal year ended Sept.
30, 2016, adjusted FFO to debt was about 60.9%, and adjusted debt to EBITDA was 1.2x. In our adjusted debt
calculation, we exclude €22.4 billion of debt at the group's captive finance operations and deduct €8.9 billion of surplus
cash. We view the captive finance operations as neutral to Siemens' credit profile.
We anticipate that Siemens will maintain credit ratios that compare favorably with our benchmarks in fiscal 2016 and
fiscal 2017, including adjusted FFO to debt at the upper end of the 45%-60% range or higher; debt to EBITDA below
WWW.STANDARDANDPOORS.COM/RATINGSDIRECT FEBRUARY 6, 2017 9
1795785 | 302560242
Siemens AG

1.5x; and significantly positive free operating cash flow.
We continue to view Siemens' financial policy as conservative, reflecting the group's commitment to a strategy
focusing on low leverage (including its publicly communicated cap on debt to EBITDA of 1x), long-term funding,
access to undrawn committed bank facilities, and ample liquid funds.
The group has limited headroom within its communicated financial policy target. We therefore do not anticipate that
Siemens will undertake any large debt- or cash-financed acquisitions in the near term.
Our Base-Case Cash Flow And Capital Structure Scenario
• Capital expenditures (capex) of €2.0 billion-€2.5 billion annually.
• A dividend payout ratio of 40%-60% of net income according to Siemens' financial policy.
• High mergers and acquisitions-related cash spending of more than €5 billion in 2017. We expect the group to
adjust future acquisition-related spending to its annual cash generation.
• Continuation of the share buyback program until 2018.
• No changes in financial policy.
Financial summaryTable 2
Siemens AG Financial Summary
--Fiscal year ended Sept. 30--
(Mil. €)
Revenues 78,820.0 74,781.0 71,174.0 72,484.0 76,536.0
EBITDA 10,746.5 9,100.0 9,628.0 8,777.5 10,020.0
Funds from operations (FFO) 8,136.7 6,494.7 7,908.4 6,983.3 8,163.4
Net income from continuing operations 5,262.0 5,251.0 5,266.0 4,053.0 4,511.0
Cash flow from operations 6,450.6 5,669.4 6,353.9 6,101.0 6,271.4
Capital expenditures 1,793.0 1,543.0 1,488.0 1,474.0 2,486.0
Free operating cash flow 4,657.6 4,126.4 4,865.9 4,627.0 3,785.4
Discretionary cash flow 1,594.6 1,198.4 2,152.9 1,892.0 946.4
Cash and short-term investments 11,897.0 11,132.0 8,938.0 9,791.0 11,415.0
Debt 13,341.8 9,601.0 5,375.7 6,567.1 7,116.8
Equity 32,193.0 33,633.5 29,543.4 27,225.5 30,507.6
Adjusted ratios
EBITDA margin (%) 13.6 12.2 13.5 12.1 13.1
Return on capital (%) 16.0 17.3 19.6 16.0 17.2
EBITDA interest coverage (x) 9.4 9.8 108.6 38.6 27.5
FFO cash interest coverage (x) 11.5 13.7 14.2 17.0 19.0
Debt/EBITDA (x) 1.2 1.1 0.6 0.7 0.7
FFO/debt (%) 61.0 67.6 147.1 106.3 114.7
Cash flow from operations/debt (%) 48.3 59.1 118.2 92.9 88.1
Free operating cash flow/debt (%) 34.9 43.0 90.5 70.5 53.2
WWW.STANDARDANDPOORS.COM/RATINGSDIRECT FEBRUARY 6, 2017 10
1795785 | 302560242
Siemens AG

Table 2
Siemens AG Financial Summary (cont.)
--Fiscal year ended Sept. 30--
(Mil. €)
Discretionary cash flow/debt (%) 12.0 12.5 40.0 28.8 13.3
Liquidity: Exceptional
The short-term rating is 'A-1+' and we regard Siemens' liquidity as exceptional.
Principal Liquidity Sources Principal Liquidity Uses
• Reported cash and cash equivalents of about €8.9
billion on Sept. 30, 2016, after a 25% haircut.
• A total of €7.1 billion of committed credit facilities
(RCFs), including an RCF maturing in 2020, all of
which are currently undrawn.
• FFO in the range of €8.0 billion-€8.5 billion per year.
• Long- and short-term debt maturities of about €4.6
billion in 2017 and about €3.7 billion in 2018.
• Capex in the range of €2.0 billion-€2.5 billion
annually.
• Our assumption of discretionary dividend payments
within the group's targeted payout range of
40%-60% of net income.
• Discretionary share repurchases of about €1 billion
in each of 2017 and 2018.
• Acquisition-related cash spending of approximately
€5.2 billion in the first half of 2017, and no large
acquisitions without commensurate disposals
thereafter. We perceive the impact of acquisition
spending on liquidity ratios to be temporary.
Long-term bond maturities:
• 2017: Approx. €3.4 billion
• 2018: Approx. €3.7 billion
• 2019: Approx. €2.8 billion
• 2020 and beyond: Approx. €15.6 billion
Other Credit Considerations
Our analysis includes a one-notch uplift to the anchor, based on Siemens' moderate diversification, reflecting the broad
reach of the group's moderately correlated products and end markets. In particular, we view the contribution of the
health care segment as positive for the group's credit profile. We believe that this segment will continue to benefit the
group in terms of diversification, despite the recently announced partial listing of the entity.
WWW.STANDARDANDPOORS.COM/RATINGSDIRECT FEBRUARY 6, 2017 11
1795785 | 302560242
Siemens AG
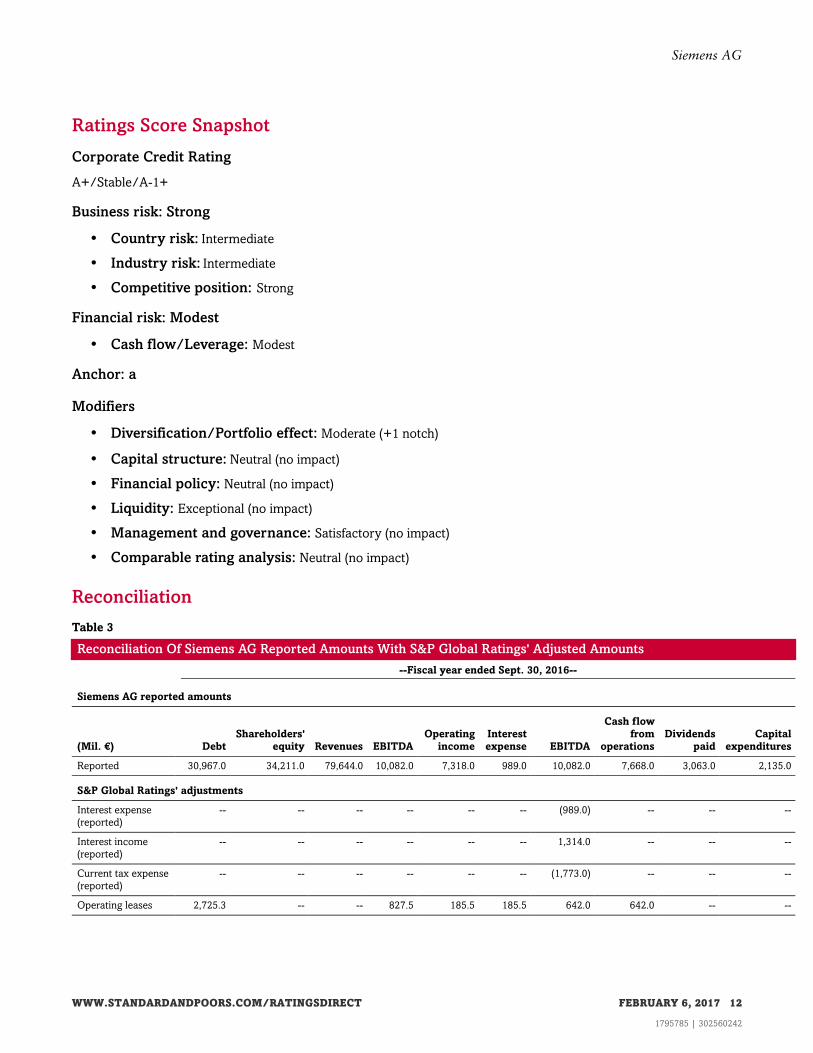
Ratings Score Snapshot
Corporate Credit Rating
A+/Stable/A-1+
Business risk: Strong
• Country risk: Intermediate
• Industry risk: Intermediate
• Competitive position: Strong
Financial risk: Modest
• Cash flow/Leverage: Modest
Anchor: a
Modifiers
• Diversification/Portfolio effect: Moderate (+1 notch)
• Capital structure: Neutral (no impact)
• Financial policy: Neutral (no impact)
• Liquidity: Exceptional (no impact)
• Management and governance: Satisfactory (no impact)
• Comparable rating analysis: Neutral (no impact)
Reconciliation
Table 3
Reconciliation Of Siemens AG Reported Amounts With S&P Global Ratings' Adjusted Amounts
--Fiscal year ended Sept. 30, 2016--
Siemens AG reported amounts
(Mil. €) Debt
Shareholders'
equity Revenues EBITDA
Operating
income
Interest
expense EBITDA
Cash flow
from
operations
Dividends
paid
Capital
expenditures
Reported 30,967.0 34,211.0 79,644.0 10,082.0 7,318.0 989.0 10,082.0 7,668.0 3,063.0 2,135.0
S&P Global Ratings' adjustments
Interest expense
(reported)
-- -- -- -- -- -- (989.0) -- -- --
Interest income
(reported)
-- -- -- -- -- -- 1,314.0 -- -- --
Current tax expense
(reported)
-- -- -- -- -- -- (1,773.0) -- -- --
Operating leases 2,725.3 -- -- 827.5 185.5 185.5 642.0 642.0 -- --
WWW.STANDARDANDPOORS.COM/RATINGSDIRECT FEBRUARY 6, 2017 12
1795785 | 302560242
Siemens AG

Table 3
Reconciliation Of Siemens AG Reported Amounts With S&P Global Ratings' Adjusted Amounts (cont.)
Postretirement
benefit
obligations/deferred
compensation
9,223.2 -- -- (4.0) (4.0) 276.0 (273.5) (14.5) -- --
Surplus cash (8,922.8) -- -- -- -- -- -- -- -- --
Capitalized
development costs
-- -- -- (324.0) (135.0) -- (324.0) (324.0) -- (324.0)
Share-based
compensation
expense
-- -- -- 332.0 -- -- 332.0 -- -- --
Dividends received
from equity
investments
-- -- -- 302.0 -- -- 302.0 -- -- --
Captive finance
operations
(22,418.0) (2,623.0) (824.0) (292.0) (1,434.0) (331.4) (976.8) (698.0) -- (18.0)
Asset retirement
obligations
1,611.0 -- -- -- -- 22.0 (22.0) (14.0) -- --
Non-operating
income (expense)
-- -- -- -- 1,448.0 -- -- -- -- --
Reclassification of
interest and
dividend cash flows
-- -- -- -- -- -- -- (809.0) -- --
Non-controlling
interest/minority
interest
-- 605.0 -- -- -- -- -- -- -- --
Debt--guarantees 799.0 -- -- -- -- -- -- -- -- --
Debt--other (643.0) -- -- -- -- -- -- -- -- --
EBITDA--gain/(loss)
on disposals of
PP&E
-- -- -- (177.0) (177.0) -- (177.0) -- -- --
Total adjustments (17,625.2) (2,018.0) (824.0) 664.5 (116.5) 152.1 (1,945.3) (1,217.4) 3,063.0 (342.0)
S&P Global Ratings' adjusted amounts
Debt Equity Revenues EBITDA EBIT
Interest
expense
Funds
from
operations
Cash flow
from
operations
Dividends
paid
Capital
expenditures
Adjusted 13,341.8 32,193.0 78,820.0 10,746.5 7,201.5 1,141.1 8,136.7 6,450.6 3,063.0 1,793.0
Related Criteria And Research
Related Criteria
• Methodology: The Impact Of Captive Finance Operations On Nonfinancial Corporate Issuers, Dec. 14, 2015
• Methodology And Assumptions: Liquidity Descriptors For Global Corporate Issuers, Dec. 16, 2014
• Corporate Methodology, Nov. 19, 2013
• Corporate Methodology: Ratios And Adjustments, Nov. 19, 2013
• Key Credit Factors For The Health Care Equipment Industry, Nov. 19, 2013
• Key Credit Factors For The Capital Goods Industry, Nov. 19, 2013
• Group Rating Methodology, Nov. 19, 2013
• Methodology: Industry Risk, Nov. 19, 2013
WWW.STANDARDANDPOORS.COM/RATINGSDIRECT FEBRUARY 6, 2017 13
1795785 | 302560242
Siemens AG
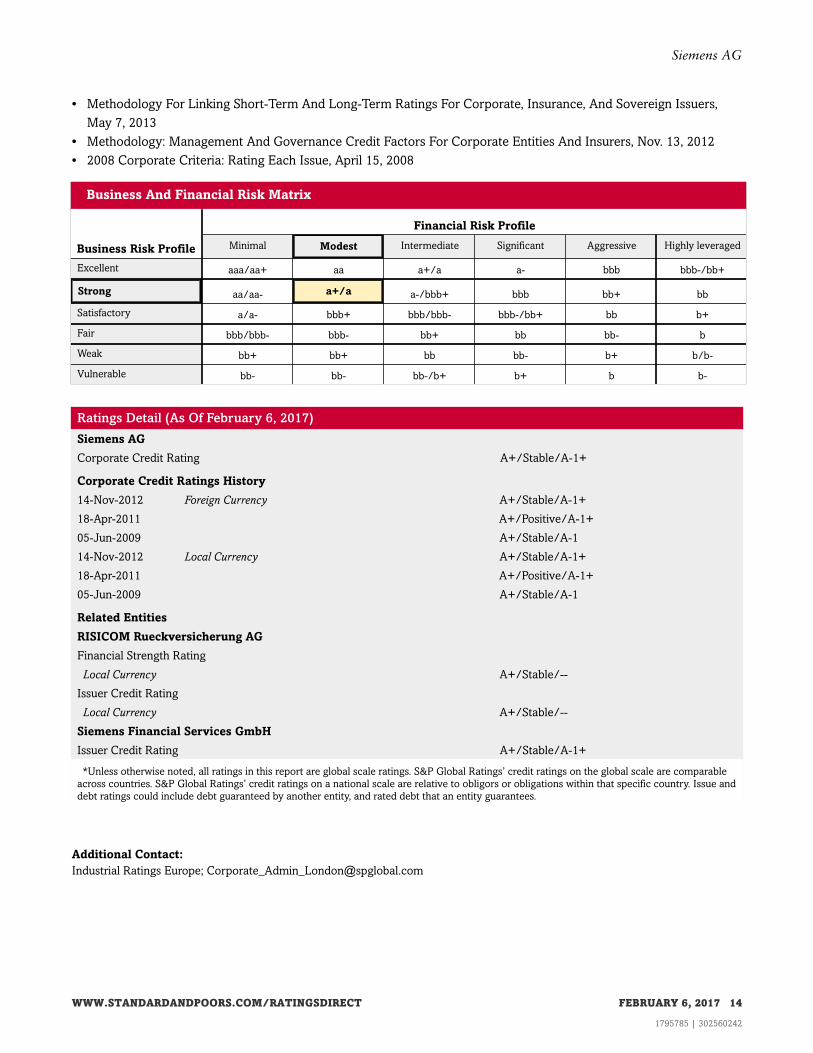
• Methodology For Linking Short-Term And Long-Term Ratings For Corporate, Insurance, And Sovereign Issuers,
May 7, 2013
• Methodology: Management And Governance Credit Factors For Corporate Entities And Insurers, Nov. 13, 2012
• 2008 Corporate Criteria: Rating Each Issue, April 15, 2008
Business And Financial Risk Matrix
Business Risk Profile
Financial Risk Profile
Minimal Modest Intermediate Significant Aggressive Highly leveraged
Excellent aaa/aa+ aa a+/a a- bbb bbb-/bb+
Strong aa/aa- a+/a a-/bbb+ bbb bb+ bb
Satisfactory a/a- bbb+ bbb/bbb- bbb-/bb+ bb b+
Fair bbb/bbb- bbb- bb+ bb bb- b
Weak bb+ bb+ bb bb- b+ b/b-
Vulnerable bb- bb- bb-/b+ b+ b b-
Ratings Detail (As Of February 6, 2017)
Siemens AG
Corporate Credit Rating A+/Stable/A-1+
Corporate Credit Ratings History
14-Nov-2012 Foreign Currency A+/Stable/A-1+
18-Apr-2011 A+/Positive/A-1+
05-Jun-2009 A+/Stable/A-1
14-Nov-2012 Local Currency A+/Stable/A-1+
18-Apr-2011 A+/Positive/A-1+
05-Jun-2009 A+/Stable/A-1
Related Entities
RISICOM Rueckversicherung AG
Financial Strength Rating
Local Currency A+/Stable/--
Issuer Credit Rating
Local Currency A+/Stable/--
Siemens Financial Services GmbH
Issuer Credit Rating A+/Stable/A-1+
*Unless otherwise noted, all ratings in this report are global scale ratings. S&P Global Ratings’ credit ratings on the global scale are comparable
across countries. S&P Global Ratings’ credit ratings on a national scale are relative to obligors or obligations within that specific country. Issue and
debt ratings could include debt guaranteed by another entity, and rated debt that an entity guarantees.
Additional Contact:
Industrial Ratings Europe; [email protected]
WWW.STANDARDANDPOORS.COM/RATINGSDIRECT FEBRUARY 6, 2017 14
1795785 | 302560242
Siemens AG

STANDARD & POOR'S, S&P and RATINGSDIRECT are registered trademarks of Standard & Poor's Financial Services LLC.
S&P may receive compensation for its ratings and certain analyses, normally from issuers or underwriters of securities or from obligors. S&P
reserves the right to disseminate its opinions and analyses. S&P's public ratings and analyses are made available on its Web sites,
www.standardandpoors.com (free of charge), and www.ratingsdirect.com and www.globalcreditportal.com (subscription) and www.spcapitaliq.com
(subscription) and may be distributed through other means, including via S&P publications and third-party redistributors. Additional information
about our ratings fees is available at www.standardandpoors.com/usratingsfees.
S&P keeps certain activities of its business units separate from each other in order to preserve the independence and objectivity of their respective
activities. As a result, certain business units of S&P may have information that is not available to other S&P business units. S&P has established
policies and procedures to maintain the confidentiality of certain nonpublic information received in connection with each analytical process.
To the extent that regulatory authorities allow a rating agency to acknowledge in one jurisdiction a rating issued in another jurisdiction for certain
regulatory purposes, S&P reserves the right to assign, withdraw, or suspend such acknowledgement at any time and in its sole discretion. S&P
Parties disclaim any duty whatsoever arising out of the assignment, withdrawal, or suspension of an acknowledgment as well as any liability for any
damage alleged to have been suffered on account thereof.
Credit-related and other analyses, including ratings, and statements in the Content are statements of opinion as of the date they are expressed and
not statements of fact. S&P's opinions, analyses, and rating acknowledgment decisions (described below) are not recommendations to purchase,
hold, or sell any securities or to make any investment decisions, and do not address the suitability of any security. S&P assumes no obligation to
update the Content following publication in any form or format. The Content should not be relied on and is not a substitute for the skill, judgment
and experience of the user, its management, employees, advisors and/or clients when making investment and other business decisions. S&P does
not act as a fiduciary or an investment advisor except where registered as such. While S&P has obtained information from sources it believes to be
reliable, S&P does not perform an audit and undertakes no duty of due diligence or independent verification of any information it receives.
No content (including ratings, credit-related analyses and data, valuations, model, software or other application or output therefrom) or any part
thereof (Content) may be modified, reverse engineered, reproduced or distributed in any form by any means, or stored in a database or retrieval
system, without the prior written permission of Standard & Poor's Financial Services LLC or its affiliates (collectively, S&P). The Content shall not be
used for any unlawful or unauthorized purposes. S&P and any third-party providers, as well as their directors, officers, shareholders, employees or
agents (collectively S&P Parties) do not guarantee the accuracy, completeness, timeliness or availability of the Content. S&P Parties are not
responsible for any errors or omissions (negligent or otherwise), regardless of the cause, for the results obtained from the use of the Content, or for
the security or maintenance of any data input by the user. The Content is provided on an "as is" basis. S&P PARTIES DISCLAIM ANY AND ALL
EXPRESS OR IMPLIED WARRANTIES, INCLUDING, BUT NOT LIMITED TO, ANY WARRANTIES OF MERCHANTABILITY OR FITNESS FOR
A PARTICULAR PURPOSE OR USE, FREEDOM FROM BUGS, SOFTWARE ERRORS OR DEFECTS, THAT THE CONTENT'S FUNCTIONING
WILL BE UNINTERRUPTED, OR THAT THE CONTENT WILL OPERATE WITH ANY SOFTWARE OR HARDWARE CONFIGURATION. In no
event shall S&P Parties be liable to any party for any direct, indirect, incidental, exemplary, compensatory, punitive, special or consequential
damages, costs, expenses, legal fees, or losses (including, without limitation, lost income or lost profits and opportunity costs or losses caused by
negligence) in connection with any use of the Content even if advised of the possibility of such damages.
Copyright © 2017 by Standard & Poor’s Financial Services LLC. All rights reserved.
WWW.STANDARDANDPOORS.COM/RATINGSDIRECT FEBRUARY 6, 2017 15
1795785 | 302560242