sierra nevada runoff into san francisco bay- why has it ... with the pattern in fig-ure 3,which...
TRANSCRIPT

Interagency Ecological Program for the Sacramento-San Joaquin Estuary
LIBRARY COpyBAY-DEI'T~ FISHERY PROJECT
Summer 1995
Readers are encouraged to submit brief articles or ideas for articles. Correspondence, including requestsfor changes in the mailing list, should be addressed to Randy Brown, California Department of WaterResources, 3251 S Street, Sacramento, CA 95816-7017.
Sierra Nevada Runoff into San Francisco Bay - Why Has It Come Earlier Recently?Mike Dettinger, Dan Cayan, and Dave Peterson
. USGS/ San Diego
By the time most of the Sierra Nevadasno~ack has melted each summer,freshwater outflows from the Sacra-mento-San Joaquin Delta to San Fran-ciscoBay are typically small, even afterthe wettest wmters. These small deltaoutflows during the warm months (incomparison WIth the large flows ofwinter and spring) are overwhelmedby salty coastal waters, and the baybecomes more and more salty as sum-mer progresses. Because longer low-flow seasons allow the bay to'becomesaltier, timing of the Sierra Nevadasnowmelt ana runoff, which are thesource of the delta flows, has a fro-found influence on the salinity 0 thebay and, thus/ can affect its ecosys-tems (Peterson et all995).COIlSeCluently,a recent tendency towardearlier snowmelt and runoff - de-scribed in this article - is a matter ofconcern. Is it a symptom of globalwarming? Is it a response to local orregional urban heat-ISland effects? Oris ltjust a normal part of the variabilityofCalifornia/s hydrology? These ~SSI-bilities raise concerns also about howmuch earlier the low-flow seasons inSan Francisco Bay might begin in thefuture if the observed trends continue
and how well the bay ecosystems willbe able to cope witfi the flow-timingchanges.The "earlier runoff" trend was firstnoted by Maurice Roos, DWR, in 1987(Roos 1987). Although it has muchyear-to-year variability, the runoff-timing trend can be detected by eye(Fi~e 1a) and is significantly differ-ent from random-cliance occurrencesaccording to a range of statistical tests(Dettinger and Cayan 1995). Sinceearly in the centuFy,the average AEril-June fraction of annual runoff hasdiminished from almost 50% to lessthan 40%. The trend toward smallerlate-spring and early-summer fractionsof each year/s streamflow from theSierra Nevada is shown in Figure 1a.This trend has been compensated forby a subtler set of opposite trendstoward more winter and early-springstreamflow during the same period.The influence of these monthly trendson the overall timing of streaffiflow inthe American River near Sacramentois shown in Fi~e 1b, in which theaverage recent flow re~e is com-pared with the average flow re~efrom 30years ago, when flows usUallypeakedaImost a month later. Inspec-
tion of a large collection of streamflowrecords indicates that similar changesoccurred throughout much of thewestern United States. A clue to theirorigin is that in the Sierra Nevadathese changes are most accentuated inmiddle altitudes and are muted instreamflow records representing veryhigh (more than 2/5O(Jm) or very low(less than 1,000m) altitudes.The mechanism involved in thesetrends is mostly a hastening of thepeak snowmelt period in recent dec-ades in response to an observed trendtoward warmer Januaries, Februar-ies/ and Marches in the Sierra Nevada(Figure 2): Actually, this temp~raturelltlIuenceIS somewhatsurprlSlng/be-cause historically the dominant con-trol on seasonal runoff-timingfluctuations has been precipitationtiming rather than temperature(Cayan etall993). Since the fate 1940s,however, temperatures throughoutthe year in the Sierra Nevada haveincreased, with the January-Marchseason experiencing the greatestwarming, a total of about 2"F) in 50years (Dettinger and Cayan 1995).During the same period, precipitationtiming has shown little if any overall

a SPRING FRACTION OF EIGHT-RIVERS FLOW
70
~ 9-ye8t0 • averagesce60 •~ •~50 ••u.0 •l!l40 •~w&!30 •w • •Q.
•201930 1950 1970 1990,~10
0.25
~ 0.20n ...h 0.10
~ 0.05
Figure 1CHANGES IN RUNOFF TIMING
a. April.June Fractions 9f An!1ual Streamflow inEight Major RI~ers .
b. Mean Monthly American River Flow Fractions
Figure 2WINTER MEAN TEMPERATURE IN ANAVERAGE OF FOUR SIERRA NEVADA
WEATHER STATIONS
trend. The runoff-timing resp~nse ismost pronounced at middle altitudesbecause at these altitudes the snow:-pack and winter runoff are .most.sen-sitive to small changes m wmtertemperature. At low altitudes, tem-perature is less important be~auseprecipitation falls mostly as ram; athigh altitudes, winter are so cold thatfluctuations of a degree or two do notmatter. About 67% of Sierr~.Neva~awatersheds are in the sensItive rmd-dIe-altitude range. Notably, thewarming since the late 1940s lias l~dto earlier snowmelt and runoff ofwm-ter and spring precipitation but nodetectable change in 1;heq~antity oftotal runoff - in keepmg WIth recentwatershed-simulation studies by Det-tinger and Jeton (1994).
Toanswer questions about the natureof these trends, we turned to broader-scale climate measures. Analysis ofthe historical fluctuations of winter-time atmospheric circulation over theNorth PacIfic Ocean and westernNorth America identifies broad, slowchanges that have been the immediatecauses of the warming and runoff-timing trends (Dettinger and Cay~1995).The circulation changes are il-lustrated in Figure 3 in terms of astatistical measure of long-termchanges in the atmospheric-pressurefields about one-third of the way upinto the atmosphere - at 3 km abovesea level. The Kendall's-tau statisticplotted in that figure is a measure ofthe correlation between time and thepressure series at each point on themap. These statistics range from 71when applied to an uninterrupted ns-ing trend. to 0 for a non-treniling se-ries, to -{for steady negative trends.The long-term pressure changesfound sigllify an increasing tendenqfor the winter wind pattern over theNorth Pacific and West Coast to ben9-away from the usual p~ths ~ong lati-tude circles to something like tfie ar-row in Figure 3.This wind pattern hasbrought air to California from farthersouili more often than usual in recentwinters. The progression of the winterwinds toward iliis configuration can·be illustrated by a time series of "p~t-tern correlations" between each wm-ter's average wind pattern and thecontours in Figure 3. (Like the Ken-dall's-tau statistic, these pattern corre-lations range from +1 whencalculated for two maps that are thesame at each point, to 0 for two mapsthat bear no overall resemblance .toeach other, to -1 for a map and Itsphoto~aphic negative.) This me~s-ure of the resemblance between wm-ter circulation pa~terns an.d t~econtours of Figure 3 ISshown m ~Ig-ure 4 in whiell it is evident - armdstconsiderable year-to-year variabilio/- that the resemblance has grown mrecent decades. Thus, the change incirculation has unleashed a chain of
Figure 3KENDALL'S-TAU TREND-TEST STATISTICS
FOR JANUARY-MARCH700-MBAR HEIGHT ANOMALIES, 1948-1992
Shaded where significantly tr!3nding anddashed Where negatIVe.
effects: a more southerly source ~orwinter winds, leading to warmerwm-ter temperatures in ilieSierra Nevada,leading to earlier snowmelt and run-off, and contributing to early peaks ofdelta outflow to the bay (Peterson et al1995).Afurther aspect of these atmospheric-circulation Changes concerns the per-sistence of weather patterns durmgthe course of each winter and, thus,the predictabiligr of winter weather .One measure of the month-to-monthsimilarities between winter/springclimate patterns over the North Pa-cific Ocean is the season-averagelagged-pattern correlations of se~-surface temperature, also sho~ mFigure 4. Lagged-p~ttern correlationsare high (approaChing +1) when themontAly average circUlation patternsdo not change much from month tomonth during a given season, andthey are small when each mon1;h'spattern is different from the precedmgmonth's pattern. The l~gged-patterncorrelations (plotted WltJ:lop~n sym-bols and dashed curve m FIgure 4)show year-to-year and d~cade-to-decade variations in the perSIstence ofsea-surface temper~tu:es of thE7NorthPacific Ocean, vanations which areclosely related to the specific. atm~s-pheric-circulation patterns ImpliE7dby Figure 3. As is clearly shown mFIgure 4,month-to-montli. persistenceor sea-surface temperature patternshas been increasing in recent decadesand even more dramatically, patternper~istence and similarity ~othe con-tours of Figure 3 go hand m hand ondecadal scales (Wlth an annual cross-correlation coefficient of +0.6). Themost persistent sea-surface tempera-ture patterns have been shown (byDettinger et aI1994) to be most often
a • a• • •
• ••• • • •
Figure 4SPATIAL AND TEMPORAL CORRELATIONS
AMONG ATMOSPHERIC ANDSEA-SURFACE PATIERNS
Solid symbols and curve are correlations betwee~ contoursof Figure 3 and winter mean 700-mbar anomalies. 0llensymools and dashed curve ~ow average Janu!i!y°Maylag-one-month pattern correlations of North Pacific sea-suiface temperatures.

associated with the pattern in Fig-ure 3, which itself is tIi.emost persist-ent winter atmospheric-circulationpattern. Together these sea-surfaceand atmospheric-eirculation patternsmust mutuaIly reinforce each other tosustain such persistent conditions
.with such regularity.The recent trend toward more persist-ent ocean-air relationships and thefrequent correspondence of persist-ence with the WInd pattern of Figure 3sup'ports optimism that snowpackana runoff-.timing prediction withseveral months lead time is possible.Knowledge early in the season that awinter's air-sea patterns are closelyreplicating the persistent patterns cansuggest that circulations are mostlikefy to p'ersist in that mode, ulti-mately to fulfill the runoff-hasteningpotential that this atmospheric pat-tern holds for the Sierra Nevada. Incontrast, reco~tion that circulationpatterns are not in the persistent modehas been an indication historicallythat winter North Pacific climate willbe highly variable and that runofffrom the Sierra Nevada would be con-tingent on the particular (unpre-dictable) course of the winter tofollow. This strategy was exploited ina preliminary preaiction scbeme forApril sno:wPack water content in thePacific Northwest - based on theJanuary sea-surface temperature pat-terns associated with persistence -which captured 70% of the year-to-year snowpack variability oetween1948and 1987 (Dettinger et al1994).Thus, a major component of the at-mospheric Changes discussed here isa trend toward more frequent occur-rence of the wind pattern of Fi~e 3.In effect, the pattern in Figure 3 has
become more and more the normalweather pattern over the North Pa-cificand North America in recent dec-ades. It probably is not coincidentalthat this pattern is associated withparticularly persistent conditions inboth the atmosphere and ocean. Reas-suringly, further analyses (not shownhere) of longer-term data series indi-cate that ocean-air patterns alsolapsed into such perSIstent patternsduring prior episodes in the 1920sandearly 1960s. This suggests that thesechanges are probably part of the natu-ral decadal variations of Pacific clima-tology on decadal time scales andneed -not be interpreted as part ofsome new phenomenon such: as thegreenhouse effect. If, however, theyare part of some human-inducedchange in the global system, then thechanges must Deassuming the shapesof natural-looking mechanisms of cli-mate variation.The atmospheric changes discussedhere are much slower than, and notdirectlr associated with, year-to-yeargloba fluctuations such as ElNino/Southern Oscillation (ENSO).ENSO fluctuations are usually con-sidered to be rapid variations aroundsome "normal' tropical state. In re-cent decades, however, there havebeen indications that the "normal"tropical state may be changing. In-deed, recently, 5 years of El Nino andnear-El Nino conditions have beensustained without the usual interrup-tions by "anti" -El Nino conditions.This sustained El Nino/near-El Ninostate has led some climatolo~ts tosuggest that near-El Nino conditionsmay have become the new normaltropical condition (Monastersky1995).At least some of the long-termchanges associated with this "tropical
drift" actually began in the late 1940s- with the commencement of a grad-ual sustained warming of the westerntropical Pacific. Perhaps not coinci-dentally, this also is when the NorthPacific changes, the Sierra Nevadawarming, and the runoff-timingchanges Degan.In summary, we find that the timingof delta outflows to the bay are linkedthrough air temperatures over thewestern United States and in the Si-erra Nevada to climatic fluctuationsover the North Pacific and beyond.Since the late 1940s, these linkageshave resulted in a statistically si~-cant trend toward earlier annual Si-erra Nevada snowmelt and deltaoutflow. Many other western streamsshow a similar trend. The trend seemsto be associated with interdecadalvariations of the North Pacific climatesystem and, possibly, with long-termchanges in ilie tropical Pacific. As wecome to understand them more, thesedistant linkages may form the basisfor long-term Sierra-climate anddelta-outflow p'redictions. At present,the recent trends seem to reflect natu-ral variability of California's climateand, thus, are part of the natural vari-ability of the San Francisco Bay eco-system. If so, these long-termfluctuations would be part of the hy-droclimatic range witFrin which tI1ebay ecosystems aeveloped and, thus,probably are not threats to the viabil-Ity of the ecosystems; they are ex-tremes, however, that cannot be safelyigt!ored in the evaluation of humaniiilluences on those ecosystems (suchas the long-term decrease in springdelta outfrows resulting from 10ng-term increases in water exports).
ReferencesCayan, D.R., E. Aguado, L.G. Riddle. 1993. The influence of precipitation and temperature on seasonal streamflow in California. Water
Resour. Res. 29:1127-1140. . .Dettinger, M.D., and D.R. Cayan. 1995. Large-scale atmospheric forcing of recent trends toward early snowmelt in California. Journal of
Climate 8(3):606-623.Dettinger, M.D., D.R. Cayan, G.M. McCabe Jr. 1994. Decadal trends in runoff over the western United States and links to persistent North
Pacific SSTand atmospheric-circulation patterns. Proceedings, 18th Annual NOAA Climate Diagnostics Workshop, Boulder, CO, November1-5,1993,240-243.
Dettinger, M.D., and A.E. Jeton, A.E. 1994. Potential effects of climate change on the American and Carson rivers, Sierra Nevada, California.Proceedings, USDA Agricultural Research Service Workshop, Use of Hydrological Models for Evaluating the Impacts of Climate Change inSnowmelt Water Supply Basins, Santa Fe, NM, April 1993, 26-27.
Monastersky, R. 1995. Tropical trouble: Two decades of Pacific warmth have fired up the globe. Science News 147:154-155.Peterson, D.H., D.R. Cayan, J. DiLeo-Stevens, M. Noble, M.D. Dettinger. 1995.The role of climate in estuarine variability. American Scientist.
83:58-67.Roos, M. 1987. Possible changes in California snowmelt patterns: Proceedings, Fourth Pacific Climate Workshop, Pacific Grove, CA. 22~31.

Real-Time Monitoring ProgramLeoWinternitz (DWR), Pat Brandes (FWS), Randy Baxter (DFG), Chuck Armor (DFG)
Real-time monitoring, an idea pro-posed about 15years ago, has arnvedm this estuary. A combmation of newtechnology, old equip'ment, and lotsof hard work has maae this programa reality. Reliable boats, dedicatedpeople, and the ability to condense alOgIstics nightmare into a simplespreadsheet are necessary to collectthe data. Fax machines, cellularphones, personal computers, and aworldwide web communications sys-tem are necessary to disseminate thedata. Put both together, and you havefisheries data collected daily at adozen sites by 15 boats and 45 peopleturned into iriformation and availableworldwide within 24 to 48 hours ofcollection. This is what the Inter-agency Program did in the delta dur-ing May and June this year, withfinancial and technical assistancefrom various water users - contrac-tors from the Swp' CVP, CaliforniaUrban Water Agencies, and delta andSan Joaquin River tributary agencies.Field crews consisted of personnelfrom DFG (Bay-Delta and Region 4),DWR, USFWS, USBR, Hansen Envi-ronmental, and Beak Consultants.Cost of operating this program is esti-mated at $250,000 per month.The purpose of this year's real-timemomtormg (also known as near-real-time monitoring), was twofold:• Todetermine if the monitoring couldbe conducted consistently over along period given the uncertaintiesassocIated with operation of me-chanical equipment, use of nets, andscheduling of people, and to deter-mine whether data collected on adaily basis could be provided as re-liable information within 24 to 48hours.
• Toassess the feasibility for protectingChinook salmon, delta smelt, split-tail, longfin smelt, and other fish spe-cies from SWP and CVP operationsin the southern delta.
The 1995 program specifically tar-geted ChinooK salmon, delta smelt,and splittail. The overall objective is toprotect targeted fish from entrain-ment at the SWP / CVP facilities whileproviding for water supply reliability.Data collected during May and Junewill be used to determine if a predic-tive relationship exists betweencatches of targeted species at desig-~ated locations and the corresp'ond-mg pattern and magnitude of fishlosses in SWP and CVP salvage opera-Page 4
tions. Through this effort, it may bepossible to reduce overall losses ofentrained fish at no net additionalwater supply cost to the CVP andSWP.For example, if the susceptibilityof a target species to loss is greater atone facility, then pumping could beshifted to the facility where there isless susceptibility. Under another setof circumstances, export pumpingcould be reduced if the monitoringstations detect high densities of tar-geted sp'ecies in tfie channels headedtoward SWP/ CVP facilities. Reducedpumping levels would result in lesstake. Higher pumping levels couldresume once monitoring indicates thetargeted species are no longer in anestablished zone of influence.The real-time monitoring programwas implemented in two phases.Phase 1Degan May 1and ran throughMay 21. It was orig41ally targeted atjuvenile salmon and 20+ mm deltasmelt. However, monitoring indi-cated that while splittail were abun-dant through the delta (particularlythe San Joaquin Rivert· most deltasmelt were west of Chipp's Island.Therefore, emphasis shifted to split-tail and salmon. Phase 2 ran fromMay 22 to June 30 and targeted pri-marily splittail. Monitoring sites, geartypes, and sampling schedules areshown in Table r.
Salmon Eva! uation
About 10 million salmon smolts werereleased from Coleman National FishHatchery (below Shasta Dam) onApril 24 and 25. Peak movement ofthe smolt into the delta was observedon May 1in the Sacramento monitor ..ing sites (Sherwood Harbor near Sac-ramento, Walnut Grove andGeorgiana Slough). Many of thesmolts appear to have entered the cen-tral delt~ via Georgi~a Slough (Fig-ure 1),With some movmg farther intothe southern delta (Old River at WebbTract and Old River and Middle Riverstations; Figure 2). Most of the Sacra-mento smolts that moved into the cen-tr~ delta app'ear to have successfullyrm~ated to the western delta via Jer-sey Point (Figure 3). These data sug-gest that although many smolts movemto the centraf delta via GeorgianaSlough and successfully migrate tothe western delta (at least in a wetyear), a si~cant fraction moves far-ther into the southern delta, even athigh flows. _An additional 275,000 smolts were re-leased on May 10 from the MercedRiver Fish Facility, with the peak
.numbers entering the delta at Moss-dale on May 18, 26, and 31 (Figure 2).Between May 22 and 27, daily averageCVP/SWP pumping was reduced oy
Table 1REAL-TIME MONITORING STATIONS, GEAR, AND FREQUENCY
At the Ol~ Riverand Middle Riversites and upperOld River and SanJoaquin River at Dos Reis sitesten 19-mlnutetows were conducteddaily for a total of 100 minu1esat each s~e. At all other sites, tel20-mln~te tows wer~ conducted for a total of 200 minutes at each site. At the San Joaquin River aDos Rets and Old River near the confluence with the San Joaquin River sampling was conducte'May 8-17. . , ."
Samolina Site May 1-May21 May 22.June 30Sacramento River at Sacramento' 7dayslweek 3dayslweek
Midwater Trawl Midwater TrawlSacramento River at Georgiana Slough 4-5 dayslweek 4-5 dayslweek
Kodiak Trawl Kodiak TrawlSan Joaquin River at Jersey Point 7 days/week No Sampling
Midwater TrawlChipps Island 7 dayslweek 7 days/week
Midwater Trawl Midwater TrawlOld River southwest of Bacon Island 7 days/week 7dayslweek
Kodiak Trawl Kodiak TrawlMiddle River southeast of Bacon Island 7 dayslweek 7 days/week
Kodiak Trawl Kodiak TrawlOld River adjacent to Webb Tract 7 dayslweek 7 days/week
Kodiak Trawl Kodiak TrawlSan Joaquin River at Mossdale 7 dayslweek 7dayslweek
Kodiak Trawl Kodiak TrawlSan Joaquin River at Dos Reis 7 dayslweek No Sampling
Kodiak TrawlUpper Old River near the confluence with 7 days/week No SamplingSan Joaquin River Kodiak Trawl
'Sampling began April 27.

about 1,500 cfs (to 3,900-4,500cfs) tofacilitate movement of these smoltspast the pumping plants. Eventhough the peal< of smolts migratinginto the delta from the Merced releaseshould have been relatively straightforward to track, the fluctuation be-tween the peaks made it difficult torecommend the len~ of curtailmentnecessary to p'rovide protection.Peaks of naturaIly spawned salmonalso will likely be difficult to detectbecause of the within-season fluctua-tions.Between May 12 and May 20, kodiaktrawling was conducted at the head ofOld River and in the San JoaquinRiver near Dos Reis to evaluate therelative densities in the two channelsand assess whether high numbers ofsalmon migrate down Old River (Fig-ure 4). These sites were added Inresponse to the release of fish from theMerced River hatchery. With theexception of one sampli.ii.gday, catchper acre-foot was always greater in
Old River than in the San JoaquinRiver downstream of Old River. Thisindicates that even in high flow years,many smolts migrate toward theCVP /SWP pumping plants via Old River.Information gathered in dry years in-dicates that survival is about two timesgreater if smolts migrate to ChippsIsland via the San Joaquin River.
Splittail EvaluationThis year's real-time monitoring pro-gram documented the movement ofyoung-of-the-year splittail leavingthe Sacramento and San Joaquin riv-ers and moving through tile delta(Figw.:e5). In 1995, nature providedone of the best water years Slllce1983and splittail took advantage, produc-ing what may be the largest year classsince the mid-1960s. Although a goodyear class was expected, ilie magni-tude of the spawnmg success, particu-larly from tile San Joaquin River, wasnot expected. In conjunction withFWS beach seining and other Inter-
'0 20&!~ 15..III
: 10~III
o 5coE"il 0CI) 4128 5108 5/18 5128 6107 6/17
Figure 1SALMON CATCH, NORTHERN DELTA SITES
Real-TIme Monitoring Program
g 2.5u..~ 2u<i 1.5.c-a 1uIS 0.5-i
(I) 05101 5/11 5/21 5/31 6/10 6/20
Figure 2SALMON CATCH, CENTRAL DELTA SITES
Real-TIme Monitoring Program
agency Pro~am sampling, real-timemonitoring aata will proVIde the bestpicture yet of how a large ye,arclass ofsplittail disperse.One objective of real-time monitor-ing - to use fish density and distribu-tion information to mo?ify pumpinglevels and reduce fish rmpacts otwater exports - was addressed in1995. Unp'recedented numbers ofyoung-of-the-year splittail collectedat Mossdale on June 4 and 5 led to arequest to reduce export pumping tolinUtsplittail entrainment. After somediscussion on water costs and biologi-cal benefits, a 3-day export reductionwas implemented onJune 11.Althou~the short-term biological benefits ofthe action are debatable, the long-term benefits of the process are eVI-dent. Real-time monitoring provideddata that identified a potential prob-lem, the problem and alternativesolutions were discussed, and acourse of action was identified andimplemented in a timely manner.
g 6u..~ 5u~4GI
~3u
~2IS 1Eii 0(I) 5101 5/11 5/21 5/31 6110 6120
Figure 3SALMON CATCH, WESTERN DELTA SITES
ReaI-TIITIElMonitoring Program
'8 1.6LL
~.:{ 1.2•..Q).fi 0,8(;ioc:: 0.4oE~ 0
5/12 5/14 5/16 5/18 5/20
Figure 4SALMON CATCH, OLD RIVER AND SAN JOAQUIN RIVER SITES
Real-TIme Monitoring Program

G:' 250~ 200'(ijrg 150c.en........100~~ 50Q)o 0
MossdaleCVP
SWPFay Island
Bacon IslandWebb Tract
Chipps IslandGeorgiana Slough
Walnut GroveSherwood
Figure 5SPUTIAIL CATCH PER ACRE-FOOT, BY LOCATION
Real-TIme Monitoring Program
Future WorkReal-time monitoring was conductedduring May and June this year. Forhatchery salmon, it provided valuableinformation on rmgration throughdelta channels. For splittail, it pro-vided early warning on peaks ofyoung of the year cormng through theClelta,which resulted in reduced ex-port pumping for 3 days. This year'ssustamedlligb flows moved most ofthe striRed bass, delta smelt, and long-fin smelt out of the delta. Therefore,we cannot draw any conclusions fromreal-time monitoring about these s~-des or whether the monitoring willprove effective for either hatchery ornatural runs of salmon.The real-time monitoring pro~am isbeing evaluated for inclusion into arevised Interagency Program. Evalu-ation of the program will inclup.einput from agency and water user
biologists, CVP and SWP operators,and members of the CALFED Opera-tions Group. To assist in that evalu-ation, a report is being prepared andwill be ~o~plet~d in August. The re-port will Identify what went right,what went wrong, program costs,.other work foregone, data analysis,and recommendations for future work.If you would like a copy of the report,or have any questions on this pro-gram, please contact:Chuck Armor, DFG
(209/948-78(0) .Pat Brandes, FWS
(209/946-6400)Dale Sweetnam, DFG .
(209/942-6112)Chuck Hansen, Consultant, StateWater
Contractors (510/937-4606)Leo Wmternitz, DWR
(916/227-7548)
Research EnhancementProgram
This year the Interagency Programawarded about $100,000to universi~researchers for studies that will-helpus develop a better understanding ofimportant processes affecting the es-tu~. Three of the twelve proposalssubmitted were selected after a thor-ough review for technical merit and
,relevance to the Interagency Pro-gram's goals and objectives. selectedproposals are:
Principal Investigator - Deborah PenryInstitution - University of California, BerkeleyAmount - $24,705
Subject - Modeling and measuring digestiveperformance in the bivalves Potamocorbulaamurensis and Macoma balthica.
Relevance ~ This study will assist inunderstanding the roles of the twofilter-feeding clams in recycling organic andtoxic materials in the estuary.
Principal Investigator - E. John ListInstitution - California Institute of TechnologyAmount - $49,880
Subject - Fingerprinting natural waters of thebay/detta by Inductively Coupled-MassSpectrometry (ICP-MS) as a basis forresolving estuarine mixing problems.
Relevance - This technique may lead toestimates of net delta outflow as well as flowpatterns and levels of mixing in delta channels.
Principal Investigator - Elizabeth CanuelInsmution - Virginia Institute of Marine Science,
College of William and MaryAmount - $27,394
Subject - Sources and reactivity of organicmatter in San Francisco Bay including the roleof hydrologic regimes and autochthonousproduction.
Relevance - The study will help elucidate theroles and food web importance of organicmaterial produced in the estuary as comparedto this material coming in from the watershedand waste discharges.

Cordgrass Invasions Likely in Northem San Francisco EstuaryDonald R. Strong, University of California, Davis, Bodega Marine Laboratory
Open intertidal mud without vegeta-tion is a hallmark of Pacific estuaries,in contrast to Atlantic and Gulf Coastestuaries where vast stands of mono-cots prevail. Smooth cord grass,Spartina alterniflora, is the most ag-gressive of these intertidal plants; it ISdense and tall, with thick, solid turfsof roots. Estuaries comE rise a farsmaller fraction of the Pacific than At-lantic and Gulf coasts of North Amer-ica, and open mud without intertidalgrasses is key to the ecology of thegeologically young communities inrow-energy intertiaal environmentsof California, Oregon, and Washing-ton. The openness of intertidal mud IScrucial to shore birds, some marinemammals, fish, and invertebrates, aswell as flood control, recreation, navi-gation, and the esthetics of our Pacificestuaries.Smooth cordgrass has been inadver-tently and p~osefullyintroduced toseveral Pacific estuaries where it hasspread, covered a large fraction ofpre-VIously open mud, and caused greatimmediate economic harm to naviga-tion and fish. The longer-term threatsof these invasions indude loss of pre-cious fora~g areas of shore bIrdsand larval fisn, as well as wholesalesediment accumulation .and severechannelization. In San Francisco Bay,
smooth cordgrass has spread sincethe early 1970s from its introductionI:>ointto many sites in the south ba~Clogging the Alameda Flood ControlChanner, it is now the object of anexpensive and ecologically hazard-ous aerial herbicide sprayjng cam-paign. The longer-term threats tobirds, fish, and water managementare enormous. A special threat in thebay is to the noninvasive Californiacordgrass, Spartina joliosa, which re-mains high on the intertidal ~adientand is tfie habitat of the Ciliforniaclapper rail and salt marsh harvestmouse, both endangered species.Smooth cordgrass overgrows Califor-nia cordgrass and probably hybrid-izes with it.North San Francisco Bay, San PabloBay,and Suisun Marsh are likely sitesof mvasion by smooth cordgrass. Sa-linity and tides in these areas are per-fect for this alien. Fortunately, mostseed produced by smooth cordgrassin the bay area is sterile, and spreadhere is mostly by clonal growth andfragmentation. Many clonal frag-ments break off in chUnks of mud aslarge as an ice chest or larger. How-ever, waves wash the mud away andleave the light-eolored fibrous rootmasses to float or be carried to a newsite. Most root masses are at least the
size of one's fist and are attached to agreen stem with bilateral leaves. Thestems and leaves can be up to a meterlong in late summer, but even a small,steffiless root mass can be a vigorouspropagu!e. The most likely means ofaispersal of root masses from thesouthern to the northern parts of theSan Francisco estuary is madvertenttransport on dredges and other ves-sels, on boat trailers, or in bait or liveseafood containers (smooth cordgrasswas introduced to Willapa Bay,Wash-ington, as oyster packirig material).The hopeful aspect of the likelysmooth cordgrass colonization of thenorthern San"Francisco estu~ is thatyoung, small colonies can be eradi-cated with the legal herbicide Rodeo,or even removed by hand. Youngcolonies are lime green, roundpatches of grass in the mtertidal mud,usually close to mean high water. Sofar, all cord grass that we know of inthe northern parts of the San Fran-cisco estu~ IS the native and valu-able California cordgrass. Youngcolonies of the two specIes are difficuftto distinguish, but any reddish colora-tion of upper roots or lower stemsindicates the noxious alien, smoothcordgrass.
No Year34 1993
35 1993
36 1994
37 1994
38 1994
39 1994
40 1995
41 1995
42 In Review
43 In Review
Interagency Program Technical Reports Since 1993Title
Proceedings of the Ninth Annual Pacific Climate (PACLIM) WorkshopK. Redmond, V. Tharp, editors
Observations of the Early Life Stages of Delta Smelt, Hypomesus transpaciftcus, in the Sacramento-San Joaquin Estuaryin 1991, with a Review of Its Ecological Status in 1988 to 1990
J. Wang, R. BrownProceedings of the Tenth Annual Pacific Climate (PACLIM) Workshop
K. Redmond, V. Tharp, editorsDelta Agricultural Diversion Evaluation 1992 Pilot Study
S. SpaarLong-Term Trends in Benthos Abundance and Persistence in the Upper Sacramento-San Joaquin Estuary-Summary Report: 1980-1990
Z. Hymanson, D. Mayer, J. SteinbeckSeasonality and Quality of Eggs Produced by Female Striped Bass (Marone Saxatilis) in theSacramento and San Joaquin Rivers
J. Arnold, T. HeyneProceedings of the Eleventh Annual Pacific Climate (PACLIM) Workshop
C. Isaacs, V. Tharp, editorsFood Habits of Several Abundant Zooplankton Species in the Sacramento-San Joaquin Estuary
J.OrsiWorking Conceptual Model for the Food Web of the San Francisco Bay/Delta Estuary
Estuarine Ecology TeamObservations of Early Life Stages of Splittail (Pogonichthys macrolepidotus) in the Sacramento-San Joaquin Estuary,1988 to 1994
J. Wang

Critical Thermal Minima and Maxima in Sacramento SplittailPaciencia S. Young and Joseph J. Cech, Jr., University of California, Davis
times of the year may be inferred fromthe estimated upper safe temperaturelimit of different size groups of fishacclimated at different temperatures;ie, summer upper limit of safe tem-perature would be based on 20°C ac-climation; spring/fall upper limit on~7°<;:accl.iIriation; ~d WInter upperlumt on 12°C acclimation. UntIl amore detailed study is done on tem-perature effects on survival, growth,reproduction, etc, these upper limitsof safe temperature would serve as thebases for ~stimating upper tempera-ture reqwrements of young-of-the-)l"ear,juvenile and sub adult splittail atClifferenttimes of the year. Table 1alsoprovides the estimated preferred tem-perature (final preference) and tem-perature for optimal growth. Readersshould be cautioned in using thesedata derived from eguations uobling1981)based on 49 different fish spe-cies. Under certain conditions, physi-ological processes may have differentthermal optima, and this effect mayresult in manges in the preferred tem-perature (Crawshaw 1977). Othernon-thermal influences (eg, season,photoperiod, age, light mtensity,Salinity,disease, pollutants, biotic inter-actions) can also affect temperaturepreference (Reynolds and Casterlin1979).This study was funded by the Inter-agen~ Ecological Program for theSan Francisco Bay/Delta. We thank S.Matern, L. Hess, S. Siegfried, G. Weis,J. Morinaka, L. Grimaldo, R.Baxter,T.Hampson, H. Bailey, and the alosaand longfin groups headed by K. Heiband J. Arnold of DFG for assIstance insplittail collection. We extend ourtfianks to P. Lutes and B. Bentley forassis~ce in fish maintenance system;L.Gnmaldo for iden~g the small-size young of the year, and J. Wang for
Critical thermal minima (CTMi) andmaxima (CTMa) were measured inyoung-of-the-year (0.1-4.0g), juvenile(10-42 g), ana subadult (79-201 g)splittail, Pogonichthys macrolepidotus,using the method by Cox (1974),andBecker and Genoway (1919) definedby a loss of equilibnum. Differencesin thermal acclimation or size did nothave any significant effect on CTMivalues (Figure 1; below sY!llbol leg-end). Whereas fish size and acclima-tion history had no effect on CTMi,they had important influences onCTMa (Figure 1; above symbol leg-end). Increases in accliIriation tem-Eerature resulted in an increase inCTMa value except in the small sizeyoung of the year (0.1-0.5 g). In thelarge size young of the year (1.0-4.0g),an illcrease of 3 C in acclimation tem-tirMture resulted in a 3°C increase in
a. A SOCincrease in acclimationtemperature resulted in an 8°C in-crease for juveniles and a 7°C increasefor sub adUlts. Bridges (1971)reportedthat juvenile spot were not killed byincreased temperature resulting frompower plant discharges during thewinter 15ecausethe ambient water hasa lower temperature so that the maxi-mum temperature reached is still lessthan CTMa. However, our results in-dicated that for 17°C- and 20°C-accli-mated splittail (simulatingfall/ spring and summer acclimationtem?:ratures) a 12°C increase wouldbe lethal; while for 12°C-acclimatedfish (simulating winter acclimationtemEerature) a smaller increase of 9°CwoUld be lethal.For fish acclimated at 17°C, meanCTMa (28.9-30.8°C) was negativelycorrelated with size (Figure 2). Thismight be because young of the yearhaoitats are shallower, tne water tem-peratures are warmer, and the_seyoung fish are more adapted to thehigher temperatures. Another reason
. rmght be oecau.~ the subadult ~h'~were more sensItive to heat stress ill
terms of loss of equilibrium. Cox(1974) reported that larger bluegillwere more sensitive than small onesto heat stress in terms of loss of equi-librium but had greater stamina inresisting physiological death.Based on the safety factor of SOCbe-low CTMa (Bridges 1971),upper lim-its of safe temperature were estimatedfor young-of-the-year, juvenile, andsubadult splittail acclimated at differ- .ent temperatures (Table 1). Upperlimit bf safe temperature at different
Page 8
Fish SizeSmallYOY
302:~ 25
~'" 20~l=l 15:;js: 10
B
2: 31.0
~ 30.5
~~ 30.0
~~ 29.5
E!J 29.0
confirming identification of the small-size young of the year. We also thankD. Shigematsu, D. Irwin, M. Thibo-deau, -So Cummings, C. Porter, J.Lorenzo, J. Hubline, J. Khoo, G. C~ch,L. Brink, and P. Moberg for technicalassistance.
• acclimated at":ZO·C.•. .cdimated at l"-C• .«Iim.ted .t 12·C
o 25 50 75 100 125 150 175
WET WEIGHT (g)
1~ 1~ 1~
WET WEIGHT (g)
Table 1ESTIMATED UPPER LIMIT OF
SAFE TEMPERATURE, FINAL PREFERENCE, AND GROWTH OPTIMUM FORYOUNG-OF-THE-YEAR, JUVENILE, AND SUBADULT SPLITIAIL AT
DIFFERENT ACCLIMATED TEMPERATURESTemperature values are in degrees Celsius.
Acclimated Upper Umit for FinalTemperature SafeTemperature Preference
~ ~ ~17 26 22~ ~ ~17 25 2117 24 1912 1617 2412 17
GrowthOptimum
2422252120

Literature Cited
Becker, CD., and RG. Genoway. 1979. Evaluation of critical thermal maxima for determining thermal tolerance of freshwater fish. Env.Bioi. Fish. 4:245-256.
Bridges, D.W. 1971. The Critical Thennal Maximum of Juvenile Spot, Leiostomus xanthurus. Lacepede. Water Resource Research Institute of theUniversity of North Carolina. Publication 17. 39 pp. .
Cox, D.K. 1974. Effects of three heating rates on the critical thermal maximum of bluegill. Pages 158-163 in Thennal Ecology. J.W. Gibbonsand RR Shartiz, editors. AEC Symposium Series (CONF-730505), National Technical Information Service, Springfield, VA.
Crawshaw, L.L. 1977. Physiological and behavioral reactions of fishes to temperature changes. J. Fish Res. Bd. Can. 34:730-734.Joblin~ M. 1981. Temperature tolerance and the final preferendum - rapid methods for the assessment of optimum growth temperatures.
J. Fish Bioi. 19:439-455. .Reynolds, W.W., and M.E. Casterlin. 1979. Behavioral thermoregulation and the "final preferendum" paradigm. Amer. Zool. 19:211-224.
Update on Delta Smelt Culture
This year the Interagency Programcontinued in its attempts to culturedelta smelt, with the primary goal ofrearing enough animals to conductvarious tests. We divided the effortsbetween a UC-Davis laboratory cul-ture study and San Francisco StateUniversity study of culturing the fishin large tanks using delta water. Thisis a bnef summary of the tank studiesusing delta water.Early this year Dr. Joan Lindberg ofthe Romberg Tiburon Centers col-lected 281~prespawning delta smeltfrom the CVP and SWP fish screensfor use in this study. Some of the fishhad been used in a handling study by:DFG at Skinner Fish Facility. Use ofthe salvaged fish was necess<:uyafterattempts to collect them in the deltawere unsuccessful.Joan held the fish in an outdoor 20-foot-diameter tank filled with unfil-tered water from the CaliforniaAqueduct. The tank is at Skinner FishFacility near the intake to the aque-duct and is part of the facilities usedto hold salvaged striped bass for usein a mitigation program.About 87%of the prespawning adultssurvived the first 2 months of nolding-in the large outdoor tank. This sur-vival is considered good, since the fishhad all been through the salvage proc-ess and some hadoeen used motherstudies.While examining the fish, it appearedthat a large percentage of the smeltmight be waKasagi. SUbsequently, thestiEPling characteristics aevelopedby DPG and' presented in the springissue of this newsletter were used toseEarate 39 fish that appeared to bewakasa~. These fish are frozen andare avaIlable for blood chemistrywork to provide more definitive sepa-ration between the species.
On March 22, the researchers placed168adult delta smelt into three 5-foot-diameter spawning tanks. Mortalityduring the next 2 months was low,with 93% of the fish surviving. Theadults were allowed to spawn natu-rally, and the eggs and larvae werecolIected periodIcally: to determinespawning and hatching success.Hatched farvae fed on zooplanktonoccurring naturally in the de1tawaterflowing through the tanks.A few observations from this year'sstudies:• The crew observed frequent spawns,
butfewprovided theexpectea.num-bers of eggs. Itwasn't clear if this wasdue to fower-than-expected fecun-dity:or if the females did not spawnall their eggs at one time.
• Eggsurvival varied during the season,WIththe best survival toward the endof the spawning period (see figure).
• Early:on, the researchers encounteredproblems with fungal infections inthe newly-hatched eggs. Anewincu-bator design seemed to eliminatethis problem, although during the
middle of the spawning period mostof the eggs aEpeared overripe and alleggs were aead at 48 hours postspawn.
• Insufficient prey density probablyreduced larval survival. The natu-rally-occurring prey will have to besupplemented willi rotifers or otherzooplankton grown in culture.
The main successes this first year ofthese culture eXEeriments were theconstruction ana operation of thehatchery, the high survival of theadult brood stock, and the improvedhatching as the season pro~essed.Aside from the low natural preyabundance, the principal problem en-countered was the high silt load in theinfluent. The biggest surprise was theapparent hign proportion ofwakasagi in smelt salvaged at the fishfacilities.Over the summer, Dr. Lindberg andher staff will keep the adult post-spawning delta smelt alive in thetanks and will work on a system forproducing the necessary zooplank-ters for the larval smelt.
300 -~~~ 250 ..,..5~~ 200 -:-
'0G3 150 ...:..
~Z 100 _.

USGS Supports "Ecosystem Management" in San Francisco Bay and the DeltaFrederic H. Nichols, USGS, Menlo Park
In the past several years, the Depart-ment of the Interior has ,l?laced par-ticular emphasis on ' ecosystemmanagement" - the integration ofscientific knowledge of ecologicalrelationships with resource manage-ment practices to sustain ecological,cultural, and economic systems inbroad habitat areas; e!?, forest, desert,and aquatic habitats. The goal of eco-system management is to understandthe habitat requirements of manyspecies and thereby assess the impact01 a variety of human activities onregional biodiversity rather than tomanage for individual species.In support of the management of thenatural resources of SanFrancisco Bayand the delta, the USGS is augment-ing its ongoing research program toprovide additional researcn, monitor-mg, and assessment information andto rmprove the availability of that in-formation. Following a workshopwith resource and reglAatory ag~ncyrepresentatives, hosted by the USGSin early 1994,USGS researchers iden-tified specific areas where existingand new scientific information couldcontribute to resolving some of thecritical bay and delta land and aquaticmanagement issues. The "ecosystemsinitiative" effort now underway ad-dresses questions in three areas:• Freshwater flow,including sediment
and contaminant transport.• Wetlands.• Information and data access.Following is a brief description ofactivities oeing supported by thisinitiative.
Freshwater Flows andRelated Issues
One of the long standing needs· ofwater management in California is in-creased understanding of factors thatdetermine wateravaTIability in theSacramento/San Joaquin River water-shed. To contribute to this under-standing, past and ongoing USGSfield measurements ana numericalsimulations will be used to examinethe links between atmospheric condi-tions, river basin water availability,and estuarine chemistry. The purposeof this study is to quan~ long-termpatterns of freshwateririflow to theestuary and salinih' responses withinthe estuary. While the initial worklinking atmospheric circulation, pre-cipitation, snowpack, and stream dis-
charge is largely statistical, analyses ofthe 1987-19g4drought will be used todescribe atmosphenc circulation pat-terns that contnbuted to the sustameddry spelL Construction of physically-based numerical models of rainfall,snowpack, and river discharge proc-esses on the Merced River, in conabo-ration with the National Park Serviceand the National Biological Service, isintended to close another link alongthe path from atmospheric circulationto cfelta-outflow vanability.Tocalibrateand validate anew numeri-cal model of flow throughout the delta(DWRDSM2)and to gam a better un-derstanding of the hydrod~cs ofthe delta, the USGS is expanding itspresent in-situ flow morutoring net-work by installing anew flow monitor-ing station on DUtchSlou~. Flows atthIs site will be monitored using anultrasonic velocih' meter. This instru-ment will provide index velocity datathat, when related to mean cross-sec-tional velocities determined from peri-odic flow measurements using anADCP (acoustic Doppler current pro-filer), can be used to produce a 15-m-inute-interval flow record. Inclusion ofthe Dutch Slough flow monitoring sitewill expand thelNMnetwork to eightdelta SIteS.The flow data provided 'bythe new Dutch Slough siteWillbe com-bined with that from three of the exist-ing UVM flow monitoring sites toprovide a measure of delta outflow.Application of the newly established"XJ:' salinih' standard for the upperes~ and delta ~uires an i:ncreaSedunderstanding of the physical aspectsofwater flow and, thereby, the paftemsofmovement ofsalinity,sediment, toxi-cants, and biota in Suisun Bay. In re-sponse to that need, the USGS isaUgn:l.entingits two Suisun Bay sus-pended sOlids monitoring SItes atMartinez and Mallard Island with ad-ditional sites during summer 1995.CTD (conductivIty / tempera-ture/ d~th),OBS (opticalbackscatter),and velocity instruments are being in-stalled at rune stations in the shalfowsof Suisun Bay to provide measure-ments of horizontalllow, salinity,sedi-ment, and wind-wave pro~es. Datafrom this study will be uSeful for ex-plaining how variations in net stream-Row (eg, the effect of the neap / springtidal cyCle)influence the salinityregimeand sediment transport. Such informa--tion will be important in determininghow to manage fresh water flow tomeet the new standard. The informa-
tion obtained will also be used to in-vestigate the contribution of horizon-tal processes to the fluxes of salt andsediment and to help resolve patternsof spatial variability in plankton andlarval fish data.Similarly, to increase the capability forpredicting the fate of dredged materi-als deposited in San Francisco Bay,various sites in the bay will be instru-mented to provide direct informationon the relationships between bottomcurrents, weather, suspended sedi-ment and other climatic variables. In-itially, a cluster of instruments will bedtployed in South Bay to collect datarelevant to the response of sedimentmaterials to near:})ottom hydrody-namic properties. This study will in-volve three field efforts, two of whichhave already been undertaken: Octo-ber 1994 (calmer period betweensummer winds and winter rains) andMarch/ April 1995 (period of peakrunoff) usmg AOCPs, ODs, and theGEOPROBE (an instrumented tripodthat sits on the bottom and collects avariety of flow and water parametermeasurements). The third field effortwill take place in summer (period ofmaximum winds). In future years, thesame instrument arrays will be de-ployed at other bay locations, includ-mg shallow areas. The goal is todevelop a better understanaing of in-terrelationships among factors con-tributing to flow variability andsediment movement and linkages be-tween these processes and biologicalprocesses suCh as the timing and in-tensity of phytoplankton blooms.An important objective of the SanFrancisco Estuary Institute in design-ing the San Francisco Bay RegionalMOnitoring Program isOtodevefop anefficient sampliiig strategy for charac-terizing spatial patterns of habitat fea-tures, biological populations, andcontaminantlevelS. 10 help meet thisobjective, a new data acgUlSitionsys-tem (the Multiple Interface Data Ac-quisition System, MIDAS) has beendeveloI'ed to examine recently col-lected USGSbaywide data on salinity,temperature, turbidity, and sus-penaed sediment concentration.Analysis and inteq>retation of thesedata Will permit the development ofan oEtimaI design for a network ofsampling sites. The newly collecteddata will be incorporated mto a data-base structure thilt is also consistentwith the databases developed for theInteragency Ecological Program.

There is increasing evidence that pes-ticide concentrations in delta waterperiodically reach levels known to betoxic to aquatic organisms. Further,there is concern that concentrations ofsome potentially toxic componentshave not been quantified because of thelack of appropriate analytical equip-ment and meffiods. Becausenew pesti-cide regulation management plans arebeing considered, fuller understandingof pesticide concentrations is needed.To provide this understanding a newhigh performance liquid chro~to a-pny: method has been develo toanalyze for a suite of additio. pesti-cides in the estu~ and delta. The newpro.c~~ will be ~ to address keytOXICItyISsues,particularly focusing onthose compounds in delta waters thatwould affectthe results of ongoing bio-assay experiments conducted in col-laboration with the Central ValleyRegional Water Quality Control Board.In an effort to better couple informationabout contaminant concentrations insediments and biota with informationon effects of those contaminants on bi-ota, two measures of the health of thebivalve mollusk Potamocorbula amuren-sis (histological examination of repro-ductive organ development and tissuecondition) arebeing examined at a suiteof five sites in northern San FranciscoBayin relation to already collected dataon contaminant concentrations (Cu,Zn, Cr, Cd, Ag, V,Ni). In the study ofclam "condition" (body: weight as afunction ofshell length), there isalready
evidence that condition of clams de-creases ~th increasing contaminantconcentrations.
Wetland Processes~ecause of the importance of know-mg the extent ana condition of theremaining wetlands in the San Fran-cisco Bay area, digital Landsat The-matic Mapper and MultiSpectralScanner images are being generatedto document Changes in wetland mor-phology and water flow/sedimentpatterns since 1972. Thus far, threeLandsat MSS images (April 4, 1973;April 6,1983;April11, 1988)have beenused to compile an atlas of multitem-poral Landsat MSS and change detec-tion images.A long-term perspective of erosionand sedimentation in the bay is im-portant to understanding and manag-mg wetland changes and othersediment-related phenomena such asparticle and particle- associated con-taminant transport and deposition. Toprovide that perspective, historicaland recent changes in sedimentationand shoreline location in San PabloBay are being quantified using com-puter modelfug of depth soundingsand shoreline positions taken fromhydrograp~ic survey charts madefrom ffie nud-1800s to the 1980s.Thisstudy will document and interpret~torical changes in wetland mar-gms, water depth, areas of sedimentaccumulation and erosion, and sedi-
Category IIIEarly Implementation Projects
In the spring issue of the Newsletter, Walt Wadlow described the Category ill2rogram, a c,?mponent of the December 1994.Bay/D~lta Agreement. Basically,Category ill ISto fund non-flow-related~proJects to rmprove fish resources mCentral Valley streams and the delta. Over the past several weeks severalmembers of an ad hoc committee have met to evaluate proposals that ~anbe inplace, or substantial progress made, between now ana the end of 1996- theso-called "~arly ~pfementa!i'?~" J~r,?jec~.Eight projects were rated fundablebased on bIOlOgicaland feasIbility cntena. .• Restoring flows in Battle Creek.• Fish screen and fish ladder at Durham Dam on Butte Creek.• Restoring spawning gravel in the Sacramento River below Keswick Dam.• Relocating a diversion pump and fish screen on Big Chico Creek a tributary
to the Sacramento River. '• ~tegrated pest management program to reduce diazinon and other pesticide
discharges to Central Valley streams and the delta.• Restoring riparian habitat to a small stretch of the Sacramento River.• Screening up to five diversions in Suisun Marsh.• Wmter Chinook captive breeding program at Bodega Marine Laboratory.The ad hoc work group will meet on August 19 tOJ~othrough the list, and theymay rec~mmend a process to allocate ilie funds. They may also change the listat th:at time. Co~t.to Category ill of th:ese eight projects is about $4.5 million,leavmg $5.5 million available for this year. If you have a specific projectproposal, submit it soon to Walt Wadlow at Santa Clara Valley Water District.
ment transport pathways in San Pa-bl~ Bay.In subsequent years the studywill focus on other areas in the bay.Choosing among management op-tions for the protection and restora-tion of the bay's wetlands would befacilitated with better inforInation onsediment movement within and adja-cent to wetlands and the relationshipsbetween weather conditions andsed~ent loss. To pr,?vide such infor-mation, meteorofogIcal stations arebeing established in three wetlandssites (Sonoma Baylands marsh resto-ration demonstration site; Bear Island;Coyote Creek) to measure sedimentflux over tidal and fortnightly cyclesto derive relationships between sedi-ment flux into and out of wetlandareas. The instrument packages willproVide hourly data on wind condi-tions, water depth, flow rate, salinity,opacity (suspended sediment concen-trations), ana water temperature;As part of the effort to monitor theeffectiveness of restoring wetlands us-ing dredge spoils at the Sonoma Bay-lands Demonstration site, sedimentcore samples collected from both un-contaminated and contaminated loca-tions, as well as from an adjacentpristine marsh, are being anal~ fororganic contaminants (~, PAlls, hy-drocarbon biomarkers, PCBs, Chlor-dane, DOT, DDE, and DDD).Resultsfrom these analyses will aid in estimat-ing the potential for exposure to con-taminants b the biota that will inhabitthe new wedand. In addition, naturallyoccurring organics (eg, sterols and fattyacids) will De studied to follow geo-chemical chan~ in the sediments asthe wetland develops.
Data AccessibilityTo provide resource managementagencies and the public wiffi readyaccess to USGS data and reports, theUSGS is using World Wide Web pro-tocols to develop and join vanousUSGS databases. Called "AccessUSGS", the new Home Page on WorldWide Web will serve as an informa-tion provider regarding all USGSwork under its San Francisco Bay"ecosystem initiative", and otherrelated USGSbay studies. Most of thepresent content comes from pastUSGS work, including the completeUSGS bibliography on San FranciscoBay.The SanIlrancisco Bay access ex-ists in beta form at http://bard.wr.usgs.gov / access/ access_sfb.html.For further information about theoverall USGS I'rogram, contact FredNichols (415/32g-4412 or throughInternet at fnichols®USgs.gov.
Page 11

Comparison of New Standards and Historical FlowsBruce Herbold, USEPA
On May 22,1995, the SWRCBadoptedan estuarine water quality controlplan based largely on the DecemberIS, 1994, Principles for Agreementthat was signed by diverse water in-terests and various state and federalagencies. The Water Quali~ ControlPlan contains a number of measuressimilar to water quality standards thatEPA finalized on December IS, 1994.At the March 1995 Interagency Pro-gram conference and in numerousconversations since, it appears thatthese standards are not well under-stood. I expand on the new standardsand their relationship to streamflowsand to the former fish and wildlifes~dards. I am not assessing biologi-cal rmpacts.The new SWRCB standards replaceonly the fish and wildlife standardscontained in the its 1978water rightsDecision 1485.All the agricultural andmunicipal standards remain in effect.In the large majority of months sinceadoption of Decision 1485, delta out-flow has been maintained because ofmunicifal and industrial and agp.-cultura water requirements at theContra Costa Canal intake. Since theContra Costa Canal standard is un-changed in the new plan, the reelace-ment of D-1485's fish and wildlifeprotection measures is unlikely toreduce the baseline patterns of deltaoutflow.The new SWRCB standards addressflows in the Sacramento and SanJoaquin rivers, closure of the DeltaCross Channel, limits on export ratesby the CVP and SWP, and the main-te~ance of low salinity conditions inSwsun Bay. The new water qualityplan includes a number of otherstandards that address dissolvedoxygen, salinity, salmon protection,and marsh protection. Because theirimpacts cannot be easily predicted,however, they are beyond the scopeof this article. The new plan alsoallows deviations in export criteriawith the goal of improving biologicalprotectio~ at no net change in watercosts. This effort to change exports inresponse to biological data has theP?tential to greatly chang~ the mecha-msms of resource protection.
StreamflowThe new SWRCB streamflow stand-ards for the fall months at Vernalisand Rio Vista are unlikely to result inany change in operations, becausethey are generally less than historicalflows to meet agricultural and mu-nicipal requirements. Since 1978,SanJoaquin River flows have been greaterthan would have been required bythese standards in all but file last 2years of the drought and in 1993.Therequired Rio Vista flows have beenexceeded in all but three of the 60 fallmonths since 1978. These require-ments for fish and wildlife, then, arelargely redundant to the flows requiredto meet other unchanged standards.Such redundancy protects wildlifean~ fishery flow needs ifmunicipal oragnculturaI standards change, or iftfieSWP and CVP develop alternativemethods of meeting agricultural andmunicipal standards. For example, itmay be that the Contra Costa Canalstandard could be met either by in-creasing flows down the SacramentoRiver or by increasing export rates inthe southern delta so that more freshwater is drawn toward the ContraCosta Canal intake.
Since fillin~ New Melones Reservoirin 19.83,.USBRhas tried to meet waterquality ill the lower San Joaquin Riveroy releasing fresh water £fom NewMelones. Irsalt loading into the SanJoag~ is controlled by other means,sprmgtiI?:leflows at Vernalis could bereduced. The new SWRCB flowst~dards are largely a safeguard8:gamst such fu~e cli.anges. Spring-time flow reqUIrements on ilie SanJoaquin include a baseline flow fromFebruary through June and a 31-daypulse requirement from April 15 toMay 15.The baseline flow require-ments are less than the historical flowsin all years prior to 1991,whereas thepulse flow requirement is ~eater thanhistorical flows in all but the wettestyears (Table 1). Clearly, the baselineflow requirements will seldom affectproject operations, whereas the dry-year pulse flow requirements oftenrepresent a doublirig or tripling ofdry-year flows. Required flows inspring of wet years lell far short ofsome wet-year flows. Interestingly;1993,a wet year that followed severalcritical years, led to flows very similarto preVIOUSdrought flows, out 1995,another wet year, yielded flows com-parable to W82 and 1983.
Table 1BASELINE AND PULSE FLOWS THAT WOULD HAVE BEEN REQUIRED IN THE
SAN JOAQUIN RIVER AT VERNALIS, 1979-1992Year types under new standards: C = Critical, D = Dry, BN = Below Normal, AN = Above Normal, W = Wet.
Th~ larger numbers would be required when X2 was required to be west of Ch~I?S Island.Hlstoncal avera~s and eXJl9r1sare for the relevant ~eriodSas recorded in D YFLOW
aseline = February 1 to April 14 & at 16 to June 30 .Pulse = April 15 to May 1
Year Baseline Historical Pulse Historical HistoricalYear Type Reguirement Average Reguirement Average Exports
1979 AN 2,130 or 3,420 5,492 5,730 or 7,020 2,105 6,8351980 W 2,130 or 3,420 14,727 7,330 or 8,620 9,821 4,9341981 D 1,420 or 2,280 2,559 4,020 or 4,880 2,497 6,8241982 W 2,130 or 3,420 8,818 7,330 or 8,620 25,019 7,6721983 W 2,130 or 3,420 29,997 7,330 or 8,620 34,834 3,2731984 AN 2,130 or 3,420 10,267 5,730 or 7,020 3,709 7,4741985 D 1,420 or 2,280 2,796 4,020 or 4,880 2,462 6,9271986 W 2,130 or 3,420 11,529 7,330 or 8,620 13,156 4,8821987 C 7100r 1,140 2,514 3,110 or 3,540 2,393 6,5901988 C 710 or 1,140 1,725 3,110 or 3,540 2,130 8,5251989 C 710orl,140 1,577 3,110 or 3,540 2,082 7,4911990 C 710 or 1,140 1,357 3,110 or 3,540 1,311 5,9771991 C 710 or 1,140 1,033* 3,110 or 3,540 1,025 4,0801992 C 710 or 1,140 1,220** 3,110 or 3,540 1,218 1,5671993 W 2,130 or 3,420 2,936*** 7,330 or 8,620 3,913 2,958
* One monthly average below requirement.•• Two monthly averages below requirement.
. *** All four months below requirement.

Delta Cross ChannelGate Operations
The new SWRCB standards req~rea substantial increase above Dec1SlOn1485in the number of days the DeltaCross Channel is closed. Under Deci-sion 1485, the gates were to be closedto protect fish passage whenever thedelta outflow index was greater than12 000 cfs between January 1 andApril 15. At the request of DFG, anadditional 20 days wen:: available inthe April 16-May 31 penod, but onlyif the delta outflow mdex exceedea12 000 cfs. The new standards callfo~ up to 45 days of gate closure inNovember through Janu~, constantclosure for the 109 days from Febru-ary to May 20, and aoout 15 days ofclosure from May 21 through June 15.The Decision 1485restriction to timesof higher delta outflow no longerapplies, so that the greatest changesaffect drier years. Gate closurt;s con-tinue to be mandated at any time offlood danger. Table 2 presents the his-torical number of days when the crosschannel was closed. Note that in 1992and 1993,requiremen~ of ~e win~r-run ChinOOKsalmon blOloglcal opm-ion required closures similar to tfioseof the new SWRCB standards.
Table 2NUMBER OF DAYS THE DELTA CROSS
CHANNEL GATES HAVE BEEN CLOSED DUETO WATER QUALITY OR FLOW ANDNUMBER OF ADDITIONAL DAYS OF
CLOSURE REQUESTED BY DFGThe last column indicates the increasednum~erofdays that the new standardswould have reqUIred.
February Annual AdditionalYear June Total Requirement"
1979 76 103 661980 77 156 131981 80 114 551982 138 217 01983 150 248 01984 79 168 21""1985 51 131 58""1986 110 147 221987 52 107 621988 0 47 1221989 45 52 1171990 2 13 1561991 44 45 1241992 105 105 641993 134 165 4
* Additionalnumber of days that would have beenrequiredunder the new standards.
** Incrementbased on springtime requirement.
ExportsIn the new SWRCBstandards exportsare allowed at four different levels,depending on the time of year. I?x-ports are limited to 65% of delta m-Row from July to Janu~ 35-45% inFebruary, and 35% from Marchthrough June. Concurrent with thepulse Row on the SanJoaquin, e?'!'ortsare restricted to 100% of the flow atVernalis or 35% of total inflow,whichever is smaller. A variety ofother factors ensure that these llinitsare approached only d~g dry con-ditions. For example, durmg ilie wetspring of 1995, the SWP and CVPcoula only take about 4-8%of the totalinflows.In the December 15, 1994, Principlesfor A~eement, the April 15-May ~5restriction to 100%of the San Joaqumflow was linked to installation of abarrier at the head of Old River. Thebarrier ensures that the SWPand CVPwould draw all their water out of thecentral delta, thereby includin.g alarge fraction of Sacramento Riverwater. At Vernalis flows greater than4,000-5,000 cfs, USBR ana DWR areconcerned that abarrier would lead tounacceptable flood risks in the south-ern delta and Stockton, so itis unlikelythat a temporary barrit;r.will be useain any but dry and cntical years. Apermanent barrier that could beopened and closed might allowopera-tion in other y'ear rypes. The newwater qua1i~ plan does not addressthe issue of a barrier, but DWR andUSBRare ~ctivelypurs~g theneces-sary permlts and funding.The restriction of exports to anamount equivalent to 100%of the SanJoaquin flow is a large reduction inboili absolute and percentage termsfrom recent conditions (comp'!1'ethehistorical exports in Table 1 WIth thehistorical flows). During the 1987-1992 drought, the SWP and CVP ex-ported as much as 500% of the flowof the San Joaquin. In some years,even if the new pulse flows had beenrequired, eXEortswould have had tobe 1ess than half of the historical ex-ports (in Table 1 compare historicale:lports with the pulse requirements).06viously, much of thewatere~rtedhistorically was Sacramento Riverwater and, even without the OldRiver barrier, much of the exports un-der the new standards will still consistof Sacramento River water. On theother hand, the new requirements forclosure of the Delta Cross Channelthroughout this period may reducethe percentage oTSacramento River
that goes for export. The restriction oftotal exports to an amount equivalentto 100% of the San Joaquin Row hasbeen frequently mischaracterized as aremoval of the entire flow of the SanJoaquin River or as an increase in ex-ports fueled by the required SanJoaquin releases elements; in mostyears this restriction would be themost stringent of the restrictions onexports.The restriction to 35% of total inflowfrom March to May is l.essdram~t:!-cincomparison to hfstoncal condItionsbut would ha~e required reductit?nsin exports durmg 19 of the 36 spnngmonths during the 1987-1992drought. This restriction pertains to3-day running averages ofooth pump-ing and inflow during times whenreservoir releases are feeding the ex-port pumps and to 14-day averages of3elta inflow at times when thepumpsare taking unregulated flows mto thedelta. There is often considerable day-to-day variabili~ in historical pump-ing rates such that monthly averagesare often much lower than many' ofthe 3-day averages contained withinthe month. Thus, the impact of thenew restrictions are better reflected incomparison with histori~al d~y c911-ditions rather than WIth histOrIcalmonthly averages. Table 3 includesboth comparisons.
Table 3PERCENTAGE OF INFLOW EXPORTEDSINCE ADOPTION OF DECISION-1485Bold numbersshow months in excessof the
35% standard.
TotalDays
Year Feb Mar Apr May Jun >35%"
1979 10 12 31 29 41 521980 10 5 16 17 24 11981 28 20 47 29 33 441982 13 12 7 9 11 01983 6 2 3 3 6 01984 13 17 35 31 34 331985 35 49 47 39 43 1201986 7 1 8 23 23 111987 37 25 46 42 42 1001988 75 62 45 47 47 1401989 60 25 47 37 35 941990 69 71 58 29 31 1061991 49 37 61 31 20 811992 18 49 26 23 21 421993 18 12 12 11 14 0
* Total number of days during the 5 monthswhendaily export percentagesexceeded35% are givenin rightmostcolumn.

The July through June restriction ofeXEorts to 65% of inflow repres~ntslittle improvement over hIstorIcalconditions. Monthly averag~ exportsin the July to January penod naveexceeded 65%in only 2 months in thehistorical record (note from Table 2that the 65% level was also exceededin February and March of 1990).How-ever, daily export~ have exceeded65% on some craysm every year and,on average, fo~a~out 9% of the .~e.This stanaard ISlikely to result ~ m-creases in the monthly average dIver-sions but decreases in the number ofd~sw~ne~orne~eed65%ofin-flow.The intent of the 65% limit is not toimprove conditions that have dam-aged fish populations in the p~st but,rather, to cap the extent to wlUch thereductions of spring exporn can bemade up in other months. In wetyears, much of the sEringtime flowscannot be retained for later e~ort, butin drier years, reservoir releaseswould likely be delayed as .much aspossible until· after June. GIven thathistorical export rates have seldombeen sustained above 65% and thatother delta withdrawals are !¥eatestduring the summer, the 65% limita-tion is likely to be redundant to otherwater quality standards.
Estuarine Habitat,aka Delta Outflow
One of the most significant aspects ofthe new water quallty,standaras ~!heinclusion of a very slightly modifiedversion of the "X2" standard devel-oped by EPA and a number of inter-ested parties. X2refers to the dIstanceupstream fro~ ~he ,Golden Ga~ewnere mean salini~ IS 2 ppt; X2 ISstrongly correlated ..with aelta out-flow. Iri the new SWRCB water qual-ity control plan, this sta?da!a iscontained in Table A, which IS re-ferred to in footnote 14 on the secondof 14 lines describing required deltaoutflows. A reader Unfainiliar withthe history and context. of .thi~ ta~~ewould be Unlikely to realize Its signifi-cance. However, compliance with thisstandard, alone, accounts for morethan half, and in many dry years asmuch as 90%, of the total water costsassociated with the new water qualitycontrol plan.The standard requires X2to be down-stream of each of three points in the
estuary - Collinsville, Chipps Island,and Roe Island - for a specifiednumber of days. The stancrard canalso be satisfied by minimum dailyoutflows of 7,100 cfs, 11,400cfs ana29,200 cfs, respectively. In all yearssince 1978, the standard would havekept X2 downstream of the conflu-ence for the entire Fe~ruary-June pe-riod. In each year, a different numberof days woula have been required forX2tobe downstream ofChipps Island(Table 4). The timing and <:furationofthis requirement is determmed by theprevious month's unimpaired flowson the eight major rivers of the CentralValley. There are two differences be-tween the EPA and SWRCB stand-ards.• The level of protection targeted un-
der the EPAstandard corresponds ~oan estimated level ofdevelopmentm1968; under the SWRCBstandard,the targeted level of protection is1971.5.The greatest difference be-tween these two targeted levels isabout 1day ofChipps Island r~uire-ment, although in most cases there isno difference.
• The SWRCBstandard allows for re-laxation of the 150 days required atthe confluence in exceptiorially dryyears; the EPA standard does not.Both years of the 1976-1977drought
Table 4NUMBER OF DAYS MINIMUM X2 LOCATION
OR SPECIFIED NET DELTA OUTFLOWWOULD BE REQUIRED HISTORICALLY AND
UNDER THE NEW STANDARDSR'1irement at Collinsvilleis 150 dax;; in all years.
equirementat Chipps Islandis unctjonofpreviousmonth's Inflowto reservoirs.
Chipps ChippsIsland Island Collinsville
Year Historical ReqUirement Historical1979 121 128 1431980 151 122 1511981 79 92 1331982 150 150 1501983 150 150 1501984 92 115 1511985 39 64 1101986 139 118 1501987 51 61 96
..1988 7 46 521989 45 72 1111990 0 56 381991 35 30 591992 48 56 821993 150 150 150
met the criteria for relaxation; noneof the 1987-1992drought years did.
Dry year X2 positions in 1979-1992were often substantially differentthan these standards woUld require(Table4), The requirements at Roe Is-land are unlikely to lead to substantialreductions in water available for otheruses, because these requirements areclosely timed to perioas of elevateddelta outflow. For example, in 1993the Roe Island component of thestandard would have been triggeredbut flood control operations wouldhave incidentally satisfied the re-quirements. In 1995 the Roe Islandrequirement was triggered and inci-dentally satisfied Wllli flood controloperations.Delta outflows mandated for othermonths are fenerally much lowerthan those 0 the Feoruary-June pe-riod. Nevertheless, some of these re-quirements reEresent changes fromrecent historical conditions. These re-quirements are based on year typeand have their greatest impact on JUlyand August of critical years. Of the 14years from 1979 to 1992, eight of theJuly average flows are below the newmandates; 7 of the August averageflows are below the new mandates,and three of the historical averages forSeptember are below the new man-dates. Flows in the October-Januaryperiod have generally been in accorawith the new requirements, althoughthree monthly averages are slightlybelow the target.
Summary• Most flow changes in drier years will
arise from flows needed to meet es-tuarine protection measures in theFebruary-June period. Most man-dated streamflows are generally lessthan would occur anyway.
• Mandated pulse flows at Vernalisfrom April 15 to May 15 and theirsimultaneous restriction of e~ortsare both major changes from mosthistorical conditions.
• Mandated changes in Delta CrossChannel gate operations are similarto those m the NMFS winter-runopinion but allow closure over alonger period.
• Restrictions of pumping relative to apercentage of delta inflow representa significant decrease in export rCl;tesdurmg dry conditions in the spongbut not during the rest of the year.

Delta Smelt Draft Recovery CriteriaDeborah McEwan (OWR) and Dale Sweetnam (OFG)
The draft Recovery Plan for the Sacra-mento San Joaquin Delta Native Fisheswas prepared by the Delta NativeFishes Recovery Team, which consistsof ten members from federal and stateagencies, universities, and a privateconsultant. The Recovery leam,chaired by Dr. Peter Moyle of UC-Davis, ana the draft Recovery Planserve an advisory function for use bythe USFWS and other agencies as aguide in recovery actiVIties for thespecies considered in the RecoveryPlan. USFWS released the RecoveryPlan for public review and commentin December 1994.The Recovery Plan considers eightspecies that occur in the Sacramento-San Joaquin estuary: delta smelt(listed as threatened m 1993); Sacra-mento splittail (proposed as a threat-ened species in 199"4);lon~ smelt;green sturgeon; spring-run, late fall-run, and San Joaquin fall-run Chi-nook salmon; and Sacramento perch.For each species, the Recovery Plancontains species descriptions, abun-dance and distribution information,habitat requirements, life history, andtaxonomy and discusses the species'status ana recovery potential, reasonsfor decline, conservation measuresand actions needed, and restorationobjectives and criteria. For the threat-ened delta smelt and the proposed-threatened Sacramento splittail, theRecovery Plan recommends recoveryobjectives and criteria.The recovery objective for delta smeltis to remove it from the federal endan-gered species list by returning itsabundance and distnbution patternsto levels similar to those during thepre-decline period (1967-1981). Therecovery plan is based on both abun-dance and distribution criteria, re-quiring specific levels to be met overa period covering five generations.For delta smelt, five generations cov-ers an evaluation period of 5 years.For a longer-lived species, the valu-ation penOd is lon~er (eg, the evalu-ation period for splittail is 35 years).These criteria are consistent withother recovery plans.Both the abundance and distributionciiteria employ DFG fall midwatertrawl data from 35 stations through-out the delta. The fall midwater trawl
surve~ covers the entire ran~e of thesmelt s distribution, and the data pro-vide one of the best and longest meas-ures of smelt abundance. Actual catchnumbers are used instead of the abun-dance index. Only data from Septem-ber and October are used, becausethese are the months sampled mostconsistently throughout ilie years ofthe survey and because in Novemberand December stormy weather andthe movement of delta smelt up-stream to spawn can result in morevariability in fish-eapture numbers.
Recommended Recovery CriteriaThe recommended distribution crite-ria require that delta smelt be cap-tured at a certain number of siteswithin three spe¢ic areas throughoutthe delta over the 5-year evaluationperiod. Smelt do not need tobe caughtm all areas every year. However tneymust be caught m at least one area fortwo of the years, two areas for one ofthe years, and all three areas in two ofthe years. Failure to capture smelt atthe required number of sites in allthree areas in any year restarts theS-year evaluation period for distribu-tion criteria.The recommended abundance crite-ria are twofold: a low number that isa 2-year running average belowwhicb abundance cannot fall, and ahigh number to be reached or ex-ceeded in 2 of the 5 years. If either ofthe two conditions are not met, the5-year evaluation period is restarted.
Recovery and DelistingIf both the distribution and abun-dance criteria are met over the S-yearevaluation period, delta smelt will beconsidered to have recovered. The Re-covery Plan proposes that delisting be.considered when the recovery criteriaare met over a 5-year period duringwhich two sequential years of ex-treme outflow occur, with one of thetwo years being dry or critical. Ex-treme outflow IS considered to beeither very high or very low outflow.Occurrence of two successive years ofextreme outflow is important inevaluating species recovery, sincesuch condItions could put delta smeltat risk of extinction.
Tracking Delta Smelt RecoveryA spreadsheet has been written totraCK whether or not the recom-mended recovery criteria approachare being or have been met. The"spreadsheet is designed to have catchnumbers entered, and then performsa number of formulas to checkwhether or not the criteria have beenmet. It is also designed to tell us if the5-year evaluation period is to be re-started due to a failure to meet therecovery criteria. The first 5-yearevaluation period began with 1993,the year delta smelt were listed. Deltasmelt distribution requirements weremet in all three areas during 1993andonly one area in 1994;thus, so far, therecovery criteria are being met. Forabundance criteria, the high numberwas exceeded in 1993 (one of the re-quired two years), but not in 1994.TheI-year running average of 209 alsoexceeds the low numoer criteria. In-terestinglyenough, the recovery crite-ria are lJemg met, despite the fact that1994 fall rmdwater trawl samples in-dicate the delta smelt po:eulation hitan all.,time low. As descnbed above,one of the two abundance criteria is a2-year running average of abundance(not to fall below 84), which is beingused to allow for the high de~ 01variability in delta smelt abunaance.Because delta smelt had a good yearin 1993, the 2-year running averagefor 1994exceeded 84, and tfle critenacontinued to be met, despite th~ badyear for delta smelt. ThiS year couldbe a "make or break" year for delta.smelt. We had back-to-back years ofextreme outflow in 1994 and 1995 -1994was a critical year and 1995is awet year. It will be interesting to seewhat numbers of delta smelt turn upin this year's fall midwater trawl sam-ples.For further information about thedraft Recovery Plan /!Jr the Sacramento-San Joaquin Native Fishes, the recom-mended delta smelt recove~ criteria,or the spreadsheet for tracking deltasmelt recovery, you may contactDebbie McEwan (916/227-7624) orDale Sweetnam (209/948-78(0).

Radical Changes in the Estuary's Zooplankton Caused byIntroductions from Ballast WaterJames J. Orsi, DFG, Bay-Delta and Special Water Projects Division
Copepods and mysi~ shrimp arecrustacean plankton ImEortant asfood for larval and small fish. Largechanges have occurred in their abun-dance and species composition inSuisun Bay and the Delta since 1978and especIally since 1992. The causeis introduction of non-indigenousspecies from ballast water ot ocean-going ships. Such introductions, firstdetected In 1978,became frequent in1992-1993, when 3 copepods and2 mysid shrimp were introduced(Table1).The spate of introductions in1992-1993appears related to a sharEincrease in Shipping at the Port ofOakland. None of the other major portsin the bays or on the rivers showedsuch an increase in these years.The native copepod fauna (excludingthe small, benthic ha;pacticoids) 01Suisun Bay and the delta consistedmainly of several species of Diaptomusand Cyclops in fresh water and 3 Acar-tia species in saline water seaward ofthe entrapment zone. Eurytemora af-finis, the Important entraEment zonecopepod, was possibly introducedalong with stnped bass in 1879.Oitluina davisae, a cyclopoid copepodnative to Japan, was afready presentin San Pablo Bay in 1963 when zoo-plankton samplfug was first done. Forsome reason it did not appear in DFGSuisun Bay samples unfif1979.In 1978,the first exotic calanoid cope-}2odto appear, Sinocalanus doerrii fromChina, apparently slippe4 into an un-occupied niche between the ranges ofEurylemora in the entrapment zone and
Diaptomus in the San Joaquin Riverbetween the mouth of Old "River andStockton. Although Diaptomus spe-cies were found thi'oughout the delta,their abundance was lUghest in thissection of the San Joaquin River. Sino-calanus eventually spread to Stockton,and Diaptomus abundance fell to lowlevels. Although the range- of Sinoca-lanus overlapped the upstream extentof Eurytemora, it had, at most, a minorimpact on Eurytemora abundance.Since 1987, however, Eurytemora hasbeen replaced in the entrapment zoneby two other Chinese calanoids and in1994 Sinocalanus disap~ through-out its range. Diaptomus abundance,however, has not shown a resurgence.The replacement of Eurytemora was inpart due to the introduction of an ex-otic clam, Potamocorbula amurensis, in1986.This clam feeds on the nauplii ofcopepods, and Eurytemora naupliiappear to be particularly vulnerable.Competition with a Chiriese calanoid,Pseudodiaptomus forbesi, introduced in1987,may also have played a role. Thereplacement of Eury1emora has been aseasonal one; Eurytemora is presentduring winter and spring when clamgrazing rates are low and when P.J2rbesi abundance is also low. In theSan Joaquin River at Stockton, up-stream from the range of the clam,Eurytemora is present until late spring,when P. forbesi becomes very abun-dant. Atl native copepods are nowmo~t abundant in WInter and spring,while summer and fall are dommateaby the exotics, many of which are sub-tropical or even tropical species.
Table 1NATIVE AND INTRODUCED COPEPODS AND MYSID SHRIMPS AND
YEAR OF INTRODUCTION
NATIVE COPEPODSDiaptomus spp.Cyclops spp.Acartia spp.Minor species
NATIVE MYSIDSNeomysis mercedisFour minor species found mostly inSan Pablo and San Francisco bays
INTRODUCED COPEPODSEurytemora affinisGithena davisaeSinocaJanus doerriiUmnoithona sinensisPseudodiaptomus marinusPseudodiaptomus forbesiAcartiella sinensisTortanus sp.Umnoithona tetraspina
YEARINTRODUCED
1879?Before 1963
1978197919861987199219931993
INTRODUCED MYSIDSAcanthomysis asperaAcanthornysis sp.
Pseudodiaptomus forbesi is now sharingthe entrapment zone with still anotherChinese exotic, Acartiella sinensis, in-troduced in 1993. This species is noTabundant in fresh water and does notreach the eastern delta.A major change in the habitat of all ofthese calanoid copepods has been thereduction in phytop1ankto~, theirpri-I!1aI'Yfood resource, espeCIally SIncethe introduction of Potamocorbula.Phytoplankton had already been de-cliiring throughout the bay and deltasince the mid-1970s, but Potamocor-bula grazed phytoplankton to verylow concentrations In Suisun Bay anathe western delta. A reduction in foodavailabili~ would not affect cope-pods until a limiting or threshold levelISreached. At this level egg Eroduc-tion would decline sharP.ly. labora-tory experiments have shown thatsuch thIeshold levels are generally<311g/L-l chlorophylla. Suchconcen-trations have been typical of the estu-ary in recent years.In 1979,a Chinese <yclopoid copepod,Limnoithona sinensIS, entered ilie estu-ary and became abundant. In 1993,sb1l another Limnoithona species, 1.tetraspina, appeared and by early 1994had replaced 1. sinensis. The abun-dance of 1. tetraspina has exceeded40,000m-3, making it the most abun-dant copepod we nave ever seen inthe estuary'. Thanks to Limnoithona,cyclopoid copepods became moreabundant thail caIanoids in 1992andcontinued their dominance in 1993and 1994(Figure 1).
E 5,000
:rua 2,000~
200 MAR APR HAY JUN JUL' AlJG SEPT OCT NOV
CAlANOiDS CYQ.ClPOIDS
Figure 1CALANOID AND CYCLOPOID COPEPOD
ABUNDANCE IN 1994

This sudden explosion of cyclopoidcopepods suggests that somethinghas nappenea to the trophic status 01the estu~. Cyclopoids have a differ-ent feeding mode than calanoids.They grasp particles rather than filterthem from the water as calanoids do.As a consequence, they are more pre-dacious tnan most calanoids. Al-though calanoids are also capable ofpredacious feeding, they are not ac-tive predators. An exception is a largecalanoid, Tortanus sp., mtroduced m1993.It is a known predator on othercopepods and may nave been respon-siDle for the disappearance ofPseudodiaptomus in western SuisunBay in 1994.Food availability (phytoplankton) forcalanoids has been reduced, but cy-clopoid food resources may have in-creased. What the cyc1oEoidsconsume is unknown. Themtroaucedcyclopoids are small - 0.6 mm longat maturity - and would not be ableto feed on adult calanoids, which aregenerally twice their size. Even thenauplii of the calanoids should be toolarge. Rotifers are a possible preyitem, but rotifer abundance has beendeclining since the late 1970s.Ciliatedprotozoa may be a food source, butwe know nothing of the abundance of
ciliates aside from protozoan countsmade in 1966-1967 by the originalDFG Delta Study.Mysid shrimp have also been affectedby changes in the trophic status andby introductions. The only abundantnative mysid in Suisun Bay and thedelta, Neomysis mercedis, underwent along-term downtrend starting in thelate 1970s. This decline became pro-nounced after 1986 and has been at-tributed to the reduction in the foodresource for young mysids, phyto-plankton. In 1992, two Asian mysidsappeared in eastern San Pablo Bayand western Suisun Bay. The abun-dance of one, Acanthomysis asperafrom Japan, remained low and it didnot move into the entrapment zone.The other, an undescriboo species ofAcanthomysis, moved upstream dur-ing 1993, and in 1994 occupied thesame range as Neomysis and achieveda higher abundance than Neomysis.The mvading mysids are somewhatsmaller than Neomysis but probablyhave similar feeding habits. Competi-tion with introduced amphipods mayalso affect Neomysis.Because of the exotic species, theabundance of native copepods andmysids is unlikely to rebound even ifthe estuary becomes more eutrophic.
Unless ballast water dumping is con-trolled, more non-indigenous andpossibly h~ s~cies may arrive.These can be fish and benthos, such asthe European ruffe and the infamouszebra mussel, as well as zooplankton.In Janu~ 1994, the ''ballast waterinitiative' became law in California.This law merely asks shiE masters tofollow the International Maritime Or-ganization's Guidelines for.the. Dis-charge of Ballast Water. Theseguidelines suggest that ballast waterDe exchanged in the open sea atdepths> 2000meters before a ship en-ters a port. The assumptions are thatfreshwater and estuarme organismswill be pumped out of the tanks orkilled by the sea water if they remainin them, and oceanic organismspumped into the tanks will not be ableto live in coastal or estuarine waters.The California law does not requireballast exchange but does require un-der penal!y that a ballast water con-trol form De filled out to show whatthe vessel master has done with hisballast. The law also provides a pen-alty for falsifying information on theform. However, the Coast Guard hasfailed to provide support for DFG,and this law has not Deen enforced.Ballast water dumping is still totallyunregulated.- _." .
Program Revision'
The Agency Directors are scheduledto meet on October 17 to review therecommended changes in the Inter-agency Program's monitoring andspecial studIes elements. In this short3-month period, staff and other inter-ested parties must pull together into aprogram all the fnformation beinggatfiered for the revisions. Followingare some of the steps and meetingsunderway to help accomplish this for-midable task.• Over the past few weeks, there has
been a fl~ of meetings of the pro-ject work teams with part of theircharge being to develop recommen-dations for specific monitoring andspecial studies elements.
• On July 6and 13,staffresponsibleforimplementing the Central ValleyProject Improvement Act is discuss-ing its Comprehensive Assessmentana Monitoring Program. Parts ofthis program may complement theInteragency Program.
• On July 6 and 7, Leo Winternitz andPat CoUlston met with Judd Monroe,
Jim Buell, Chuck Hanson, and BillAlevizon of the stakeholders to gothrough a formal process leading torecommended cnanges. Their re-sults will be summarIZed in a draftreport from the stakeholders to theInteragency Program.
• On July 26 and 27, the InteragencyProgram's Science Advisory Com-mittee will hold a 2-day workshopwith staff and others to review tlleprogram and develop recom-menaed changes.
• On August I, the Modeling Forum issponsoring a 1-dayworksnop to dis-cuss the aata needs of physical,chemical and biological modelers.
• On August 7, Interagency Programstaff will hold an all-a.ay meeting toreview information gathered to dateand further define the process lead-ing to the recommendeCl program.
• In mid-August, Interagency Pro-gram staff IS schedulea to have adraft report from this spring's real-time monitoring evaluation. Thereport will probably contain recom-
mendations about how real-timemonitoring should be included inthe overill program.
.DFG will soon be releasing a draftdocument describing a comprehen-sive Central Valley Salmonid moni-toring program.
• A management advisory groupcomposed of representatives ofwater interests, environmental inter-ests, and agencies has met severaltimes to provide management inputto the Agency Coordinators .
Itwill be a challenge to take all of theseoften disparate pieces and shape theminto a comprenensive data cOllectionand integ>retation effort that can pro-vide the Kind and volume of informa-tion needed by decision makers. Inaddition, any program developedthrough this process must be coordi-nated with existing effortssu~,asthose underway at TheSan FranClSCoEstuary Institute to arrive at a pro-gram ~t provicies a systemwide in-formation network.

Observation of Possible Larval and Prejuvenile and Wakasagi/Delta Smelt Hybridsin the Delta and Tributary StreamsJohnson Wang, National Environmental Sciences, Inc.
DFG data indicate that wakasagi wascollected occasionally in the upper es-tuary and lower rivers durmg _theearly 1980s (Sweetnam 1995). OtherDFG data show that wakasa~ be-came abundant in several NorthernCalifornia reservoirs during the late1980s and early 1990s (Dennis Lee,personal communication). Two ofthese reservoirs, Folsom and Oroville,contain wakasagi and can contributelarge numbers of them to the delta,wnere they can compete or hybridizewith delta smelt.Before showing the data, it may behelpful to review the status of larvalwakasagi identification.Biologists are still having difficultymaking a clear-cut distinction be-tween wakasagi hybrid larvae anddelta smelt larvae. Many" off and on"characteristics have been recorded,and it is very confusing. In general,the associated factors are:• Heavy overlapping of morphologi-
cal charactenstics of two species,while adding more complicationsfrom the hybrid.
• Insufficient field experience andspecimens gathered from the Sacra-mento River and delta.
• Wakasagi larvae collected from lakesand reservoirs not always matchingwith specimens collected in the Sac-ramento River and delta.
• Not knowing whether the electro-phoretic analysis on species identifi-cation is completely accurate(Trenham et al 1994) to compare itwith current morphological Charac-teristics know-how.
• When specimens reach 20-30 mmtotal length or are in the prejuvenileto early juvenile stages, the problempon identification of wakasagi/hvbrid(as a group) from the delta smelt are~adually diminished. Using organ-ology,morphometric measurementsand -pigmentations are all helpful(Young and Cech 1994; Sweetnam1995).
Table 1 is a listing of the possiblewakasagi and wakasagi/delta smelthybrids In various sample collectionsover the past several years.Between 1990 and 1992, the larvaewere found in the vicinity of theAmerican River and SacramentoRiver above Walnut Grove, which is'
on the margin or above the usual~?wning ground of delta smelt(Wang and Brown 1993).Larvae wereobserved from March to June.In 1993 and 1994, a relatively highnumber of larvae were observed Inthe American River, the SacramentoMetropolitan Airport area of the Sac-ramento River downstream to theCache Slough, Barker Slough, andMokelumne River area of the delta.In these 2 years, the distributionrange and observation period of thewal<.asagi/hybrid larvae heavilyoverlapped that of the delta smelt.In 1994, prejuvenile, juvenile, andadult wakasagi/hybrid were observedat various locations on the AmericanRiver (below Lake Natoma), Sacra-mento River (from SacramentoMetropolitan A!rRort and Bryte areasdownstream), Delta Cross Channel,Mokelumne River, Cache Slough,Barker Slough, and CVP/SWP fishprotective faCilities (Sweetnam 1995;USBR/USFWS unpublished data;Lisa Lynch,personal communication).In summer 1994, selected smelt (inprejuvenile and juvenile life stages)taken from CVP,Swp, Cache Slough,Mokelumne River, and Decker Islandwere stored in dry ice when the fishwere still alive and shipped to theUC-Davis for electrophoretic analysisto .distinguish them to the species.Hybrid fish (wakasagi/delta smelt)were detected as part of the result(Trenham et all994). Before this test-ing, some morphological charac-teristics of wakasagl from otherknown smelt were noted by CVP andSWP biologists. There, the smelt hadbeen identified as longfin smelt, deltasmelt, wakasagi, and wakasagi/ delta
smelt (this study; personal communi-cation with Lloyd Hess, Scott Sieg-fred, Jerry Morinaka). 'I'nemorphometric differences were alsoreported by other researchers by us-ing the specimens collected at CVPand SWP (Young and Cech 1991;Cin<;:in Young, personal communica-tion).Stevens et al (1990) reported collec-tions of wakasagi from Folsom Lakein 1989. Since 1992, DFG has beensampling wakasagi populations atFolsom Lake, Lake Oroville, and LakeAlmanor. All life stag~s of wakasagihave been captured (Lisa Lynch, per-sonal communication). Recently,DFGbiologists have found more morpho-logical characteristics to separate thejuvenile and adult wakasagi fromdelta smelt; the pigt!lentation patternsat mandible and ISthmUSare particu-larly useful (Sweetnam 1995).Judging by the larvae and other lifestages of wakasagi taken, a possiblescenario is: the wakasagi appeared inthe Sacramento River in 1990, in-vaded the Delta in 1993;a self-repro-
. duced population appeared in theAmerican River, Sacramento River,and possibly Cache Slough areas(where the delta smelt spawning con-centrated in the last many years) in1994.Hybridization might have hap-pened as early as 1993.Knowledge of identification of larvaewakasagi is in progress, but more re-search and development is needed tomake it into a comprehensive fieldkey. The native delta smelt now is inthreatened status, but the introducedwakasagi is not. A complete separa-~on of the two species is ecolOgicallyrmportant. .
Table 1OBSERVATIONS OF WAKASAGI HYBRID LARVAE IN THE
DELTA AND TRIBUTARY STREAMS
Observation Sample NumberYear Period Sampling Area Source Observed1990 4120 to 5116 Lower Sacramento River DFG 41991 4117 to 6/09 Lower American River Hanson Assoc. 9
Sacramento River near Bryte USBR 1Sacramento River below mouth of American River DFG 3
1992 3/27 Lower Sacramento River DFG 11993 3/11 to 5104 Lower Sacramento River DFG 75+1994 3/07 to 5106 American River through Delta DFG 34
San Luis Creek of San Luis Reservoir USSR 3Sacramento River, Air Force Pier (near Bryte) USBR 4
Total 129+
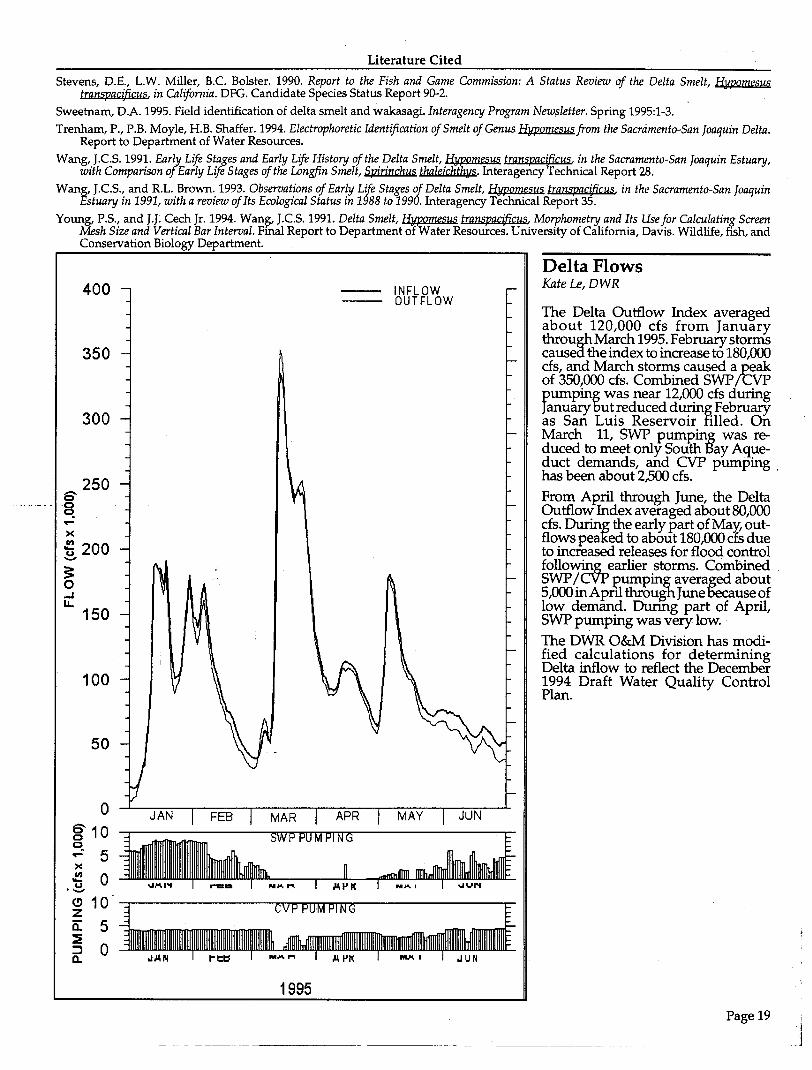
Literature CitedStevens, D.E., L.W. Miller, B.C. Bolster. 1990. Report to the Fish and Game Commission: A Status Review of the Delta Smelt, Hy.pomesus
tran~ac{ficus, in California. DFG. Candidate Species Status Report 90-2.Sweetnam, D.A. 1995. Field identification of delta smelt and wakasagi. Interagency Program Newsletter, Spring 1995:1-3.Trenham, P., P.B. Moyle, H.B. Shaffer. 1994. Electrophoretic Identification of Smelt of Genus If:vJ!omesusfrom the Sacramento-San Joaquin Delta.
Report to Department of Water Resources.Wang, J.C.S. 1991. EarlJ Life Stages and Early Life History of the D.elta Smelt, If:vJ!omesus tranliPllctficus. in the Sacramento-San Joaquin Estuary,
with Comparison ot Early Life Stages of the Longfin Smelt, Spirinchus thaleichthys. Interagency Technical Report 28.Wang, J.C.S., and RL. Brown. 1993. Obseruations of Early Life Stages of Delta Smelt, If:vJ!omesus tmnliPllc{ficus in the Sacramento-San Joaquin
Estuary in 1991, with a review of Its Ecological Status in 1988 to 1990. Interagency Technical Report 35.Young, P.S., and J.J: Cech Jr. 1994. Wang, J.C.S. 1991. Delta Smelt, H}tpomesus tranliPllc{ficus. Morphometry and Its Use for Calculating Screen
Mesh Size and Vertical Bar Interual. Final Report to Department of Water Resources. University of California, Davis. Wildlife, fish, andConservation Biology Department.
2506'8.xti 200-
08' 10q
5~xen 0..... ,e.(!) 10za:: 5::!
0:JQ.
INFLOW-- OUTFLOW
~SWPPU~PING
"'M.I'I ......N.........,L\ ~J(
MAY JUN
_Immh~r_~,~
Delta FlowsKate Le,DWR
The Delta Outflow Index averagedabout 120,000 cfs from Januarythrough March 1995.February stormscaused the index to increase to 180,000cfs, and March storms caused a ~~of 350,000 cfs. Combined SWP/CVPpumping was near 12,000cfs duringJanuary but reduced during Febru'!!)'as San Luis Reservoir filled. OnMarch 11, SWP pumping was re-duced to meet only South Bay Aque-duct demands, and CVP pumping ,has been about 2,500cfs.From AEril through June, the DeltaOutflow Index averaged about 80,000cfs. During the early part of May, out-flows peaKed to about 180,000ds dueto increased releases for flood controlfollo~ earlier storms. CombinedSWP/ :eumping averaged about5,oooinApr1l througbJune13ecauseoflow demand. Durfug part of April,SWP pumping was very low.The DWR O&M Division has modi-fied calculations for determiningDelta inflow to reflect the December1994 Draft Water Quality ControlPlan.

3251 S StreetSacramento, CA 95816-7017
Interagency Ecological Program for the Sacramento-San Joaquin Estuary
~-----Pat Coulston, Department of Fish and Game, Program Manager
Randy Brown, Department of Water Resources, Managing EditorLarry Smith, D.S.Geological Survey, Interagency Coordinator Review
Vera Tharp, Department of Water Resources, Editor
The Interagency Ecological Program is aCooperative Effort of the:
California Department of Water ResourcesState Water Resources Control BoardU.S. Bureau of ReclamationU.S. Army Corps of Engineers
California Department of Fish and GameU.S. Fish and Wildlife Service
U.S. Geological SurveyU.S. Environmental Protection Agency
National Marine Fisheries Service
BEFORE CITING'INFORMATION CONTAINED HEREIN,BEAR IN MIND THAT ARTICLES HAVE NOT RECEIVED PEER REVIEW.