sigma green belt case study. ii paper organizers...
TRANSCRIPT
Full Terms & Conditions of access and use can be found athttp://www.tandfonline.com/action/journalInformation?journalCode=lqen20
Quality Engineering
ISSN: 0898-2112 (Print) 1532-4222 (Online) Journal homepage: http://www.tandfonline.com/loi/lqen20
Paper Organizers International: A Fictitious SixSigma Green Belt Case Study. II
Dana Rasis , Howard S. Gitlow & Edward Popovich
To cite this article: Dana Rasis , Howard S. Gitlow & Edward Popovich (2002) Paper OrganizersInternational: A Fictitious Six Sigma Green Belt Case Study. II, Quality Engineering, 15:2, 259-274,DOI: 10.1081/QEN-120015858
To link to this article: https://doi.org/10.1081/QEN-120015858
Published online: 16 Aug 2006.
Submit your article to this journal
Article views: 260
View related articles
Citing articles: 9 View citing articles

Paper Organizers International:A Fictitious Six Sigma Green BeltCase Study. II
Dana Rasis,1 Howard S. Gitlow,2,* and Edward Popovich3
1Agilent Technologies, 11625 Community Center Dr., #1228,
Northglenn, CO 802332Department of Management Science, Institute for the Study of
Quality, School of Business Administration, University of Miami,
Coral Gables, FL 331243Sterling Enterprises International, Inc., P.O. Box 811002,
Boca Raton, FL 33481-1022
ABSTRACT
The purpose of this paper is to present the second part of a detailed, step-by-step
case study of a simple Six Sigma Green Belt project. In the last edition of Quality
Engineering, the first part of a Six Sigma Green Belt case study was presented. That
paper showed the Define and Measure phases of the DMAIC method. This paper
presents the rest of the case study, or the Analyze, Improve, and Control phases of
the DMAIC method.
Key Words: Six Sigma; Case study; Green Belt; DMAIC; Analyze; Improve;
Control
PURPOSE
The purpose of this paper is to present the final part
of a fictitious application of the DMAIC model[1] to be
used as an educational aid by those individuals
interested in learning the structure of a simple “Six
Sigma” project, called a Green Belt project. The first
paper presented the Define and Measures phases. This
paper presents the Analyze, Improve, and Control
phases.
259
DOI: 10.1081/QEN-120015858 0898-2112 (Print); 1532-4222 (Online)
Copyright q 2002 by Marcel Dekker, Inc. www.dekker.com
QUALITY ENGINEERINGVol. 15, No. 2, pp. 259–274, 2002–03
©2002 Marcel Dekker, Inc. All rights reserved. This material may not be used or reproduced in any form without the express written permission of Marcel Dekker, Inc.
MARCEL DEKKER, INC. • 270 MADISON AVENUE • NEW YORK, NY 10016

REVIEW OF THE COMPANY
Paper Organizers International (POI) offers a full
range of filing, organizing, and paper shuffling services.
To accomplish these tasks, POI purchases Metallic Secur-
ing Devices* (MSDs), staplers, hole punches, folders,
three-ring binders, and a full range of related products to
serve its customers in paper handling needs. The
employees, or internal customers, of POI use MSDs to
organize piles of paper pending placement into folders or
binders.
The Purchasing Department of POI has noticed an
increase in complaints from employees in the Paper
Shuffling Department (PSD) about MSDs breaking and
failing to keep papers together. This creates opportunities
for client papers to be mixed together. The Purchasing
Department would like to improve the purchasing process
to eliminate complaints from employees in the PSD.
DEFINE PHASE
The Define phase involves understanding the
relationships between Suppliers–Inputs–Process–Out-
puts–Customers (SIPOC), gathering and analyzing
Voice of the Customer data, and preparing a project
charter. Recall, the two-part project objective for the
MSD project is:
Project Objective 1: Decrease (direction) the percent-
age of MSDs that cannot withstand 4 or more
bends without breaking (measure) bought by the
Purchasing Department (process) from 62.50 to
00.62% (goal) by January 1, 2001 (deadline). Go
for 4-sigma!
Project Objective 2: Decrease (direction) the percen-
tage of boxes of MSDs with more than 5 broken
clips (measure) bought by the Purchasing Depart-
ment (process) from 62.50 to 00.62% (goal) by
January 1, 2001 (deadline). Go for 4-sigma!
MEASURE PHASE
The measure phase has three steps; they are: opera-
tionally define the CTQs (critical to quality characteristics),
perform a gauge Reliability and Reproducibility (R&R)
study on each CTQ, and develop a baseline for each CTQ.
First, durability and functionality were operationally
defined to the satisfaction of all relevant stakeholders of
the MSD project. Second, an Attribute Gauge R&R study
of functionality showed that its measurement system is
sufficient for the needs of this project. An attribute Gauge
R&R study was not performed on durability due to the
destructive nature of the test. Even so, an operational
definition of the testing process will be established and
testing will be audited to assure consistency in the near
future. Finally, a baseline capability study of durability
revealed that it is not stable with a predictable distribution
of output. A similar study of functionality indicated that it is
stable with a predictable distribution of output. However,
neither CTQ is operating at an acceptable level
(DPMO ¼ 625,000 or approximately 1.2 process sigma)
of quality.
This article begins where “Paper Organizers Inter-
national: A Fictitious Green Belt Case Study—Part 1,[1]”
left off, with the Analyze phase of the DMAIC method.
ANALYZE PHASE
The Analyze phase has five steps: develop a more
detailed process map (i.e., more detailed than the process
map developed in the SIPOC analysis of the Define
phase), construct operational definitions for each input or
process variable (called Xs), perform a gauge R&R study
on each X (test the adequacy of the measurement
system), develop a baseline for each X, and develop
hypotheses between the Xs and Ys. The Ys are the output
measures used to determine if the CTQs are met. First,
team members prepare a detailed process map identify-
ing and linking the Xs and Ys (Fig. 1).
Note: Some Six Sigma project teams identify the Xs in
the Measure phase of the DMAIC model. This is done
when the Xs have been defined and monitored prior to the
start of the Six Sigma project through an organizational
metrics tracking system (for example, dashboards or
balanced scorecards). If the Xs and CTQs were not
defined and monitored prior to the start of the project,
then the Xs are monitored and analyzed in the Analyze
phase, as is the situation in this case study.
Second, team members develop an operational
definition for each X variable identified on the process
map. The operational definitions for X1, X2, X3, and X8
relate to individual MSDs and are as follows.
Criteria: Each X conforms to either one or the other of
the options.
*The idea for a Six Sigma case study focusing on MSD was adapted from Cordis Corporation’s (A Division of Johnson & Johnson) Six
Sigma training manuals that were developed by Oriel Inc. (Madison, WI). Metallic Securing Devices (MSDs) are paper clips.
Rasis, Gitlow, and Popovich260
©2002 Marcel Dekker, Inc. All rights reserved. This material may not be used or reproduced in any form without the express written permission of Marcel Dekker, Inc.
MARCEL DEKKER, INC. • 270 MADISON AVENUE • NEW YORK, NY 10016

Figure 1. Process map linking CTQs and Xs for the MSD purchasing process.
Six Sigma Case Study. II 261
©2002 Marcel Dekker, Inc. All rights reserved. This material may not be used or reproduced in any form without the express written permission of Marcel Dekker, Inc.
MARCEL DEKKER, INC. • 270 MADISON AVENUE • NEW YORK, NY 10016

X1 Vendor Ibix Office Optimum
X2 Size Small
(stock size)
Large (stock size)
X3 Ridges With ridges Without ridges
X8 Type
of usage
Large stack
of paper
(# papers is
10 or more)
Small stack of paper
(# papers is 9 or less)
Test: Select MSD. Decision: Determine X1, X2, X3, and X8 options for
the selected MSD.
The operational definitions for the procedures used to
measure X4, X5, X6, and X7 are shown below.
Criteria: Compute cycle time in days by subtracting the
order date from the date on the bill of lading.
X4 Cycle time from order to receipt for MSDs In days
Test: Select a box of MSDs upon receipt of shipment from vendor.
Compute the cycle time. Decision: Determine X4 for the selected box
of MSDs.
Criteria: Count the number of boxes of MSD received
for a given order. Subtract the number of boxes ordered
from the number of boxes received for the order under
study.
X5 Discrepancy in count from order
placed and order received
In boxes of MSDs
by order
Test: Select a particular purchase order for MSDs. Decision: Compute
the value of X5 in number of boxes for the selected purchase order.
Criteria: Compute cycle time in days to place a shipment
of MSDs in inventory by subtracting the date the
shipment was received from the date the order was
placed in inventory.
X6 Cycle time to place product in inventory In days
Test: Select a particular purchase order. Decision: Compute the value of
X6 in days for the selected purchase order.
Criteria: Compute inventory shelf time in days for a box
of MSDs by subtracting the date the box was placed in
inventory from the date the box was removed from
inventory.
X 7 Inventory shelf time In days
Test: Select a box of MSDs. Decision: Compute the value of X7 in days
for the selected box of MSDs.
Third, team members conduct Gauge R&R studies for the
Xs. Recall, that the purpose of a Gauge R&R study is to
determine the adequacy of the measurement system for an
X. In this case, the measurement systems for all of the Xs
are known to be reliable and reproducible; hence, Gauge
R&R studies were not conducted by team members.
Fourth, team members collect baseline data for each
of the Xs. Team members gathered baseline data on dura-
bility (Y1) and functionality (Y2), and relevant Xs using
the following sampling plan. For a two-week period, the
first box of MSDs brought to the PSD each hour was
selected as a sample; this yielded a sample of 80 boxes of
MSDs (Table 1). For each sampled box, team members
determined the durability (Y1) and functionality (Y2) mea-
surement. Furthermore, they collected information conc-
rning the vendor (X1), size of the MSD (X2), whether or
not the MSD has ridges (X3), and inventory shelf life will
be recorded (X7). Please note that Purchasing Depart-
ment will separately study cycle time from order to
receipt of order (X4), discrepancy between ordered and
received box counts (X5), and cycle time from receipt of
order to placement in inventory (X6). These last factors
may influence such concerns as choice of vendor,
ordering procedures, and inventory control, but they do
not impact durability and functionality. Furthermore, the
MSDs are not tested after they are used so the type of
usage (X8) is not studied here. As was indicated in the
Define phase, certain variables (e.g., X4, X5, X6, and X8)
can be addressed in subsequent Green Belt projects.
The baseline data revealed that the yield for durability
is 0.4625 (37/80) and the yield for functionality is 0.425
(34/80) (Table 2). As before, this indicates very poor
levels for the CTQs in the PSD. For comparison
purposes, the judgment sample carried out by the team
during the Define phase showed that the yield was
approximately 40% (i.e., the team assumed the failure
rate was approximately 60%) for both durability and
functionality. The slight increased yields in this study can
be due to natural variation in the process. The baseline
data also showed that 56.25% of all MSDs are from
Office Optimum (X1), 42.50% of MSDs are small (X2),
50.00% of all MSDs are “without ridges” (X3), and the
average shelf time for boxes of MSDs (X7) is 6.5 days,
with a standard deviation of 2.5 days (Table 2).
Fifth, team members develop hypotheses ½Y ¼ f ðXÞ�
about the relationships between the Xs and the Ys to
identify the Xs that are critical to improving the center,
spread, and shape of the Ys in respect to customer
specifications. This is accomplished through data
mining. Data mining is a method used to analyze passive
data; that is, data that is collected as a consequence of
Rasis, Gitlow, and Popovich262
©2002 Marcel Dekker, Inc. All rights reserved. This material may not be used or reproduced in any form without the express written permission of Marcel Dekker, Inc.
MARCEL DEKKER, INC. • 270 MADISON AVENUE • NEW YORK, NY 10016
running a process. In this case, the baseline data in Table
1 is the passive data set that will be subject to data mining
procedures. Dot plots or box plots of durability (Y1) and
functionality (Y 2) stratified by X1, X2, X3, and X7 can be
used to generate some hypotheses about main effects
(i.e., the individual effects of each X on Y1 and Y2).
Interaction plots can be used to generate hypotheses
about interaction effects (i.e., those effects on Y1 or Y2
for which the influence of one X variable depend on the
level or value of another X variable) if all combinations
of levels of X variables are studied. If all combinations of
levels of X variables are not studied, then often interac-
tion effects are not discovered. Frequently, screening
designs are utilized to uncover interaction effects.
Table 1
Base Line Data
Sample Day Hour X1 X2 X3 X 7 Dur Fun
1 Mon 1 1 0 0 7 2 5
2 Mon 2 0 1 0 7 2 9
3 Mon 3 0 0 1 7 10 7
4 Mon 4 0 1 0 7 1 4
5 Mon 5 0 0 0 7 7 3
6 Mon 6 0 1 1 7 2 5
7 Mon 7 0 1 1 7 1 9
8 Mon 8 0 0 0 7 7 5
9 Tue 1 0 1 0 8 2 8
10 Tue 2 0 1 0 8 1 7
11 Tue 3 0 1 0 8 1 13
12 Tue 4 1 1 1 8 9 5
13 Tue 5 1 1 0 8 9 9
14 Tue 6 1 1 1 8 10 11
15 Tue 7 1 1 1 8 10 11
16 Tue 8 0 0 1 8 8 9
17 Wed 1 1 1 1 9 8 11
18 Wed 2 1 0 0 9 1 11
19 Wed 3 1 1 1 9 10 11
20 Wed 4 0 0 0 9 7 11
21 Wed 5 1 1 1 9 9 9
22 Wed 6 0 0 1 9 9 5
23 Wed 7 1 0 1 9 2 11
24 Wed 8 1 0 0 9 1 10
25 Thu 1 1 0 1 10 1 14
26 Thu 2 0 1 1 10 1 10
27 Thu 3 1 1 1 10 8 13
28 Thu 4 0 0 1 10 10 12
29 Thu 5 0 0 0 10 7 14
30 Thu 6 0 1 1 10 3 13
31 Thu 7 0 0 0 10 9 13
32 Thu 8 1 1 1 10 8 11
33 Fri 1 0 1 0 1 2 0
34 Fri 2 0 1 0 1 2 1
35 Fri 3 0 1 0 1 1 6
36 Fri 4 0 1 0 1 3 3
37 Fri 5 0 1 0 1 2 2
38 Fri 6 1 1 0 1 10 6
39 Fri 7 0 0 1 1 10 0
40 Fri 8 0 1 0 1 2 0
41 Mon 1 0 1 1 4 3 4
42 Mon 2 0 1 0 4 3 7
43 Mon 3 0 1 1 4 3 3
44 Mon 4 0 0 0 4 10 2
45 Mon 5 1 1 0 4 8 5
46 Mon 6 0 1 1 4 3 4
47 Mon 7 1 0 0 4 1 4
48 Mon 8 0 0 1 4 10 5
49 Tue 1 1 1 1 5 11 6
50 Tue 2 1 0 1 5 3 4
Table 1
Continued
Sample Day Hour X1 X2 X3 X 7 Dur Fun
51 Tue 3 1 1 0 5 10 6
52 Tue 4 1 0 1 5 3 5
53 Tue 5 1 0 0 5 2 4
54 Tue 6 0 0 0 5 9 5
55 Tue 7 0 0 1 5 9 5
56 Tue 8 0 1 0 5 3 7
57 Wed 1 0 0 1 6 9 5
58 Wed 2 1 1 0 6 9 7
59 Wed 3 0 0 0 6 9 5
60 Wed 4 1 0 0 6 2 6
61 Wed 5 1 0 1 6 2 5
62 Wed 6 1 1 1 6 10 5
63 Wed 7 0 1 0 6 1 7
64 Wed 8 0 1 0 6 2 5
65 Thu 1 0 0 1 7 10 7
66 Thu 2 1 1 0 7 9 5
67 Thu 3 1 0 0 7 1 7
68 Thu 4 0 1 0 7 2 5
69 Thu 5 1 0 1 7 1 6
70 Thu 6 0 1 0 7 1 5
71 Thu 7 1 0 0 7 1 8
72 Thu 8 1 1 1 7 10 5
73 Fri 1 0 1 1 8 3 7
74 Fri 2 1 1 1 8 9 7
75 Fri 3 1 0 0 8 1 13
76 Fri 4 0 1 1 8 2 8
77 Fri 5 0 1 1 8 3 9
78 Fri 6 1 1 1 8 8 10
79 Fri 7 1 0 1 8 3 11
80 Fri 8 0 0 1 8 10 11
X1 ¼ Vendor (0 ¼ Office Optimum and 1 ¼ Ibix); X2 ¼ Size
(0 ¼ Small and 1 ¼ Large); X3 ¼ Ridges (0 ¼ Without and
1 ¼ With); X7 ¼ Inventory shelf time, in days.
Six Sigma Case Study. II 263
©2002 Marcel Dekker, Inc. All rights reserved. This material may not be used or reproduced in any form without the express written permission of Marcel Dekker, Inc.
MARCEL DEKKER, INC. • 270 MADISON AVENUE • NEW YORK, NY 10016
Team members constructed dot plots from the
baseline data in Table 1 to check if any of the Xs
(i.e., main effects) impact durability (Y1) and
functionality (Y 2). The dot plots for durability are
shown in Figs. 2–5. The dot plots for functionality
are shown in Figs. 6–9.
The dot plots for durability (Y1) indicate: (1) the
values of durability tend to be low or high with a
significant gap between 4 and 6 for X1, X2, X3, and
X7, and (2) the variation in durability is about the
same for all levels of X1, X2, X3, and X7. The dot
plots for functionality (Y2) indicate: (1) the values of
functionality tend to be lower when X1 ¼ 0 than when
X1 ¼ 1; (2) the variation in functionality is about the
same for all levels of X2 and X3, and (3) the values
of functionality tend to be lower for low values of X7.
Discussion of the Analysis of Durability
Since there are no clear differences in variation (i.e.,
spread) of durability for each of the levels of X1, X2, X3,
and X7, the team wondered if there might be differences
in the average (i.e., center) for each level of the indivi-
dual Xs. Team members constructed a main effects plot
for durability to study differences in averages (Fig. 10).
Figure 10 indicates that for the range of shelf lives
observed there is no clear pattern for the relationship of
shelf life (X7) to the average Durability. On the other
hand, it appears that ridges (i.e., X3 ¼ 1) has a positive
relationship to the average Durability. At first glance it
would seem that the better results for the average
Durability are seen when the vendor Ibix is chosen using
small MSDs (i.e., X1 ¼ 1 and X2 ¼ 0), while using large
MSDs from Office Optimum (i.e., X1 ¼ 0 and X2 ¼ 1)
yield worse results.
While discussing the dot plots and main effects plot, it
was suggested that it is dangerous to make any
conclusions without knowing if there are interaction
effects. An interaction effect is present when the amount
of change introduced by changing one of the Xs depends
on the value of another X. In that case, it is misleading to
choose the best value of the Xs individually without first
considering the interactions between the Xs.
Consequently, team members did an interactions plot
for X1, X2, and X3. X7 was not included in the
interactions plot because the main effects plot indicated
no clear pattern or relationship with durability (Y1). All
combinations of levels of the X variables must be present
to draw an interactions plot. This is often not the case
with passive data (i.e., no plan was put in place to insure
all combinations were observed in the data gathering
Figure 2. Dot plot for durability by X1 (i.e., vendor). Figure 3. Dot plot for durability by X2 (i.e., size).
Table 2
Basic Statistics on Baseline Data
Variable Proportion Mean Standard Deviation
Y1: Durability 4 or more bends/clip 0.4625 5.213 3.703
Y2: Functionality 5 or fewer broken/box 0.4250 7.025 3.438
X1: Vendor 0 ¼ Office Optimum 0.5625
1 ¼ Ibix 0.4375
X2: Size 0 ¼ Small 0.4250
1 ¼ Large 0.5750
X3: Ridges 0 ¼ Without Ridges 0.5000
1 ¼ With Ridges 0.5000
X7: Inventory shelf time Shelf time in days 6.5000 2.5160
Rasis, Gitlow, and Popovich264
©2002 Marcel Dekker, Inc. All rights reserved. This material may not be used or reproduced in any form without the express written permission of Marcel Dekker, Inc.
MARCEL DEKKER, INC. • 270 MADISON AVENUE • NEW YORK, NY 10016

phase). Fortunately, although not all combinations were
observed equally often they were all present. Figure 11 is
the interaction plot for Durability.
Surprise! The interaction plot indicates that there is a
possible interaction between X1 (i.e., vendor) and X2
(i.e., size). How is this known? When there is no
interaction the lines should be parallel to each other
indicating the amount of change in average Durability
when moving from one level of each X variable to
another level should be the same for all values of another
X variable. This plot shows the lines on the graph of X1
and X2 not only are not parallel, but they cross. The
average Durability is the highest when either large Ibix
MSDs (i.e., X1 ¼ 1 and X2 ¼ 1) or small Office
Optimum MSDs (i.e., X1 ¼ 0 and X2 ¼ 0) are used.
This means the choice of vendor may depend on the size
of MSD required. The main effects plot suggests that the
best results for average Durability would occur when
small MSDs from Ibix are used, but the interactions plot
suggests this combination would yield a bad average
Durability. In order to study all this further the team
decides that during the Improve phase they will run a full
factorial design to examine the relationship of X1, X2,
and X3 on Durability (Y1) since the main effects plot
indicates potential patterns. Again, there does not appear
to be a relationship between Durability (Y1) and X7.
Discussion of the Analysis of Functionality
Figures 12 and 13 represent the main effects and inter-
actions effects plots, respectively, for Functionality (Y 2).
The main effects plot indicates that higher values of shelf
life (X 7) yield higher values for Functionality (Y 2). The
team surmised that the longer a box of MSDs sits in
inventory (i.e., higher values of shelf life), the higher the
count of broken MSDs (i.e., functionality will be high).
From a practical standpoint, the team felt comfortable
with this conclusion. They decided the Purchasing
Department should put a Six Sigma project in place to
investigate whether the potential benefit of either a “just
in time” MSD ordering process or establishing better
inventory handling procedures will solve the problem.
The interaction effects plot indicate a potential
interaction between the X2 (i.e., size) and X3 (i.e.,
ridges). The better results for functionality (i.e., low
values) were observed for large MSDs without ridges
(i.e., X2 ¼ 1 and X3 ¼ 0). Why this may be the case
would need to be studied further. In addition, there may
be an interaction between X1 (i.e., vendor) and X2 (i.e.,
size), but it appears that better results are observed
whenever Office Optimum is used (i.e., X1 ¼ 0). In other
words, the average count of broken MSDs is lower (i.e.,
functionality average is lower) whenever Office Opti-
mum is the vendor.
Figure 4. Dot plot for durability by X3 (i.e., ridges).
Figure 5. Dot plot for durability by X 7 (i.e., shelf life).
Figure 6. Dot plot for functionality by X1 (i.e., vendor).
Figure 7. Dot plot for functionality by X2 (i.e., size).
Six Sigma Case Study. II 265
©2002 Marcel Dekker, Inc. All rights reserved. This material may not be used or reproduced in any form without the express written permission of Marcel Dekker, Inc.
MARCEL DEKKER, INC. • 270 MADISON AVENUE • NEW YORK, NY 10016

Analyze Phase Summary
The Analyze Phase resulted in the following
hypotheses:
Hypothesis 1: Durability ¼ f ðX1 ¼ Vendor; X2 ¼
Size; X3 ¼ RidgesÞ with a strong interaction effect
between X1 and X2.
Hypothesis 2: Functionality ¼ f ðX1 ¼ Vendor; X2 ¼
Size; X3 ¼ Ridges; X7 ¼ Shelf Life) with the
primary driver being X7 with some main effect due
to X1 and an interaction effect between X2 and X3.
X7 is the main driver of the distribution of Functionality
(Y 2) and is under the control of the employees of POI.
Hence, team members restructured Hypothesis 2 as
follows:
Functionality ¼ f ðX1 ¼ Vendor; X2 ¼ Size; X3 ¼
Ridges) for each fixed level of X7 (Shelf Life).
Improve Phase
The improve phase involves designing experiments to
understand the relationship between the Ys and the vital
few Xs and major noise variables, generating the actions
needed to implement the levels of the vital few Xs that
optimize the shape, spread, and center of the distributions
of the Ys, developing action plans, and conducting pilot
test of the action plans.
First, team members conducted an experimental
design to determine the effect of X1 (Vendor), X2
(Size), and X3 (Ridges), and their interactions, on the Ys
with X7 ¼ 0 (no shelf life—MSDs are tested immedia-
tely upon arrival to POI before they are placed in
inventory). A 23 full factorial design with 2 replications
(16 trials) was performed for durability and functionality.
The factor conditions for Vendor (X1) are Office
Optimum (21) or Ibix (1); the factor conditions for
Size are “Small” (21) or “Large” (1), and the factors
conditions for Ridges (X3) are “Without Ridges” (21) or
“With Ridges” (1). The experiment was set-up in two
blocks to increase experimental reliability, with the first
8 runs conducted in the morning and the second 8 runs
conducted in the afternoon. The runs were randomized
within each block. The purpose of the blocks and
randomization is to help prevent lurking (background)
variables that are related to time (e.g., time of day and
order in which data are collected) from confusing the
results. Additional information can be gathered since 16
trials were run, rather than the minimum of 8 trials,
especially regarding potential interactions. The data from
the 23 full factorial design, with 2 replications in run
order with the first 8 runs constituting the first replicate,
are shown in Table 2.
A Pareto Chart showing which of the vital few Xs, and
the interactions between them, have a statistically
significant effect on Durability (Y1) at the 10% level of
significance can be seen in Fig. 14.
The major effects (i.e., those that have significance
level less than 0.10, in other words over 90% confidence
level) for Durability are the interaction of Vendor andFigure 9. Dot plot for functionality by X 7 (i.e., shelf life).
Figure 8. Dot plot for functionality by X3 (i.e., ridges).
Figure 10. Main effects plot for durability by X1, X2, X3, and
X 7.
Rasis, Gitlow, and Popovich266
©2002 Marcel Dekker, Inc. All rights reserved. This material may not be used or reproduced in any form without the express written permission of Marcel Dekker, Inc.
MARCEL DEKKER, INC. • 270 MADISON AVENUE • NEW YORK, NY 10016

Size and the main effect due to Ridges. There are no
significant effects due to Vendor, Size, or Ridges present
for Functionality. No Pareto diagram is shown for
significance of effects. This indicates that since the effect
of shelf life was held constant in this designed
experiment, while it was shown to affect Functionality
in the data mining analysis, the team can restrict its
attention to improving Functionality by addressing shelf
life first. As Durability is the only outcome influenced by
Vendor, Size, or Ridges in this designed experiment,
further consideration in this study will be restricted to
Durability. Another project can address shelf life and its
effect on Functionality.
Since interaction effects should be interpreted prior to
studying main effects the team decided to construct an
interaction effect plot for Vendor and Size. Figure 15
shows the interaction effect plot for Vendor and Size
relative to Durability.
The interaction effect plot between Size and Vendor
shown in Fig. 15 indicates that the best results for
Durability are obtained using small MSDs supplied by
Office Optimum or large MSDs supplied by Ibix. The
reasons for this interaction may be due to factors such as
materials used for each size MSD, differences in supplier
processes for each size MSD, or other supplier-
dependent reasons. Team members can ask each vendor
why their sizes show significant differences in average
durability, if there is a preference to use only one vendor.
Otherwise, the Purchasing Department should buy small
MSDs from Office Optimum or large MSDs from Ibix to
optimize Durability (Y1).
The only significant main effect not involved within a
significant interaction effect is X3 ¼ Ridges: The main
effect for Ridges on Durability is shown in Fig. 16.
It indicates that the average Durability is about
6:5 2 5:4 ¼ 1:1 more when an MSD with Ridges is
used rather than an MSD without Ridges. Therefore,
since Ridges is a main effect independent of any
interaction effects, then the right selection of MSDs is
to use Office Optimum for small MSDs with ridges
and Ibix for large MSDs with ridges. If the
experimental results from Table 2 are used, then the
average Durability for Office Optimum’s small MSDs
Figure 11. Interaction effects plot for durability by X1, X2, and X3.
Figure 12. Main effects plot for functionality by X1, X2, X3,
and X7.
Six Sigma Case Study. II 267
©2002 Marcel Dekker, Inc. All rights reserved. This material may not be used or reproduced in any form without the express written permission of Marcel Dekker, Inc.
MARCEL DEKKER, INC. • 270 MADISON AVENUE • NEW YORK, NY 10016

with ridges is ð10 þ 9Þ=2 ¼ 9:5 while the average
Durability for Ibix’s large MSDs with ridges is
ð11 þ 9Þ=2 ¼ 10:0: Both averages are well above the
required corresponding CTQ of at least 4. As long as
the variation (spread) of results is small enough so that
no individual Durability result is far from these
averages, then the team is successful with respect to
Durability. The variation in these results can be
monitored using control charts after changing the
purchasing process for selecting MSDs.
The team members decided to purchase all “MSDs
with Ridges.” In addition, the choice of Vendor and Size
will be as follows: (Vendor ¼ Office Optimum) and
(Size ¼ Small) or (Vendor ¼ Ibix) and (Size ¼ Large)
to maximize average durability. In addition, the team
decided to take on another project to reduce shelf life
to less than 5 days to address Functionality. The
revised flowchart for the Purchasing Department
incorporating the findings of the Six Sigma project is
shown in Fig. 17.
Figure 14. Pareto chart of effects for durability.
Figure 13. Interaction effects plot for functionality by X1, X2, and X3.
Figure 15. Interaction effect plot for vendor and size for
durability.
Rasis, Gitlow, and Popovich268
©2002 Marcel Dekker, Inc. All rights reserved. This material may not be used or reproduced in any form without the express written permission of Marcel Dekker, Inc.
MARCEL DEKKER, INC. • 270 MADISON AVENUE • NEW YORK, NY 10016

The team members conducted a pilot test of the
revised best practice (flowchart). Data for durability from
the pilot test is shown in Table 3.
Table 3 indicates that the RTY (rolled throughout
yield) for durability is 100%. Functionality was also
tested, but not shown here, using shelf life ¼ 0 days; that
is, the MSDs were tested immediately upon arrival to
POI before they were placed in inventory. It resulted in a
RTY of 75% that is better than the baseline RTY. The
effect on Functionality of shelf life and inventory control
procedures will be investigated in subsequent projects if
management decides these projects should be chartered.
Figure 18 shows that durability is in control with a
higher mean number of bends for all MSDs in the pilot
test. The test pilot data shown in Table 3 includes results
for both small MSDs from Office Optimum and large
MSDs from Ibix. Subsequently, team members realized
that, with all things being equal, large MSDs from Ibix
should have a higher average durability than small MSDs
from Office Optimum. Consequently, team members
constructed two control charts, one for small MSDs from
Office Optimum and another for large MSDs from Ibix
(Figs. 19 and 20), respectively.
Figures 18–20 show that Durability (Y1) is in
control, but it is dangerous to compute any process
capability statistics due to the small sample sizes.
However, estimates for the mean and standard deviation
of Small MSDs from Office Optimum are 8.625 and
1.05 (calculated from the data but the calculation is not
shown here), respectively. The mean and standard
deviation for Large MSDs from Ibix are 10.25 and 0.83,
respectively. Since the CTQ for durability requires the
number of bends to be 4 or more, then this requirement
is 4.4 standard deviations below the mean for Small
MSDs from Office Optimum and 7.5 standard
deviations below the mean for Large MSDs from Ibix.
Team members all agreed that as long as the process for
both Small MSDs from Office Optimum with ridges and
Large MSDs from Ibix with ridges remain in control,
then it is extremely unlikely that the MSDs will fail the
CTQ for Durability (Y 1).
Control Phase
The control phase involves mistake proofing the
improvements and/or innovations discovered in the Six
Sigma project, establishing a risk management plan to
minimize the risk of failure of product, service, or
process, documenting the improvement and or inno-
vation in ISO 9000 documentation, and preparing a
control plan for the process owners who will inherit the
improved or innovated product, service, or process.
First, team members identified and prioritized two
problems while mistake proofing the process improve-
ments discovered in the improve phase; they were:
(1) purchasing agents do not specify with ridges on a
purchase order, and (2) purchasing agents do not
consider that the choice of vendor depends on the size
of the MSDs being requested on the purchase order.
Team members created solutions that make both errors
impossible; they are: (1) the purchase-order entry system
does not process an order unless “with ridges” is
specified on the purchase order, and (2) the purchase-
order entry system does not process an order unless
Office Optimum is the selected vendor for small MSDs
and Ibix is the selected vendor for large MSDs.
Second, team members use risk management to
identify two risk elements, they are: (1) “failing to train
new purchasing agents” in the revised purchasing
process shown in Fig. 17, and (2) Office Optimum and
Ibix are out of MSDs with ridges. Team members
assigned risk ratings to both risk elements (Table 4).
Both risk elements must be dealt with in risk
abatement plans. The risk abatement plan for failing to
train new purchasing agents is to document the revised
purchasing process in training manuals. The risk
abatement plan for “vendor out of MSDs with ridges”
is for POI to request that both Office Optimum and Ibix
manufacture only MSDs with ridges due to their superior
durability. This is a reasonable and acceptable suggestion
to POI, Office Optimum, and Ibix because the cost
structures for manufacturing MSDs with and without
ridges are equal, and neither Office Optimum nor Ibix
has other customers requesting MSDs without ridges.
Office Optimum and Ibix agree to produce only MSDs
with ridges after a six-month trial period in which they
check incoming purchase orders for requests for MSDs
without ridges. If the trial period reveals no requests for
Figure 16. Main effect plot for ridges for durability.
Six Sigma Case Study. II 269
©2002 Marcel Dekker, Inc. All rights reserved. This material may not be used or reproduced in any form without the express written permission of Marcel Dekker, Inc.
MARCEL DEKKER, INC. • 270 MADISON AVENUE • NEW YORK, NY 10016

MSDs without ridges, then the POI Purchasing
Department will revise Fig. 17 and the appropriate ISO
9000 documentation to reflect the possibility of
purchasing only MSDs with ridges. Additionally, Office
Optimum and Ibix thanked POI for pointing out to them
that average durability is higher for MSDs with ridges
than MSDs without ridges. Both vendors claim that they
are going to experiment with possible different ridge
patterns to increase durability and decrease costs. Both
vendors stated that they anticipate decrease costs from
only producing MSDs with ridges because of the lower
amortized costs of having only one production line.
Figure 17. Revised flowchart of the purchasing department.
Rasis, Gitlow, and Popovich270
©2002 Marcel Dekker, Inc. All rights reserved. This material may not be used or reproduced in any form without the express written permission of Marcel Dekker, Inc.
MARCEL DEKKER, INC. • 270 MADISON AVENUE • NEW YORK, NY 10016
Third, team members prepare ISO 9000 documen-
tation for the revisions to the training manual for the
purchasing process from Fig. 17.
Fourth, team members develop a control plan for the
PSD that requires a monthly sampling of the boxes of
MSDs in inventory. The purpose of the sampling plan is
to check if the boxes of MSDs being purchased are either
small Office Optimum MSDs with ridges or large Ibix
MSDs with ridges. The percentage nonconforming boxes
of MSDs will be plotted on a p-chart. PSD management
will use the p-chart to highlight violations of the new and
improved purchasing process shown in Fig. 17.
The p-chart will be the basis for continuously tuning
Table 3
Data from the Pilot Test
Hour Vendor Size Ridges Durability
Shift 1—Hour 1 Office Optimum Small With 10
Ibix Large With 11
Shift 1—Hour 2 Office Optimum Small With 7
Ibix Large With 11
Shift 1—Hour 3 Office Optimum Small With 10
Ibix Large With 11
Shift 1—Hour 4 Office Optimum Small With 8
Ibix Large With 11
Shift 1—Hour 5 Office Optimum Small With 9
Ibix Large With 10
Shift 1—Hour 6 Office Optimum Small With 9
Ibix Large With 9
Shift 1—Hour 7 Office Optimum Small With 8
Ibix Large With 11
Shift 1—Hour 8 Office Optimum Small With 9
Ibix Large With 10
Shift 2—Hour 1 Office Optimum Small With 9
Ibix Large With 11
Shift 2—Hour 2 Office Optimum Small With 8
Ibix Large With 10
Shift 2—Hour 3 Office Optimum Small With 10
Ibix Large With 9
Shift 2—Hour 4 Office Optimum Small With 7
Ibix Large With 9
Shift 2—Hour 5 Office Optimum Small With 7
Ibix Large With 10
Shift 2—Hour 6 Office Optimum Small With 9
Ibix Large With 11
Shift 2—Hour 7 Office Optimum Small With 10
Ibix Large With 9
Shift 2—Hour 8 Office Optimum Small With 8
Ibix Large With 11
RTY 32=32 ¼ 1
Figure 18. Control chart for durability.
Six Sigma Case Study. II 271
©2002 Marcel Dekker, Inc. All rights reserved. This material may not be used or reproduced in any form without the express written permission of Marcel Dekker, Inc.
MARCEL DEKKER, INC. • 270 MADISON AVENUE • NEW YORK, NY 10016
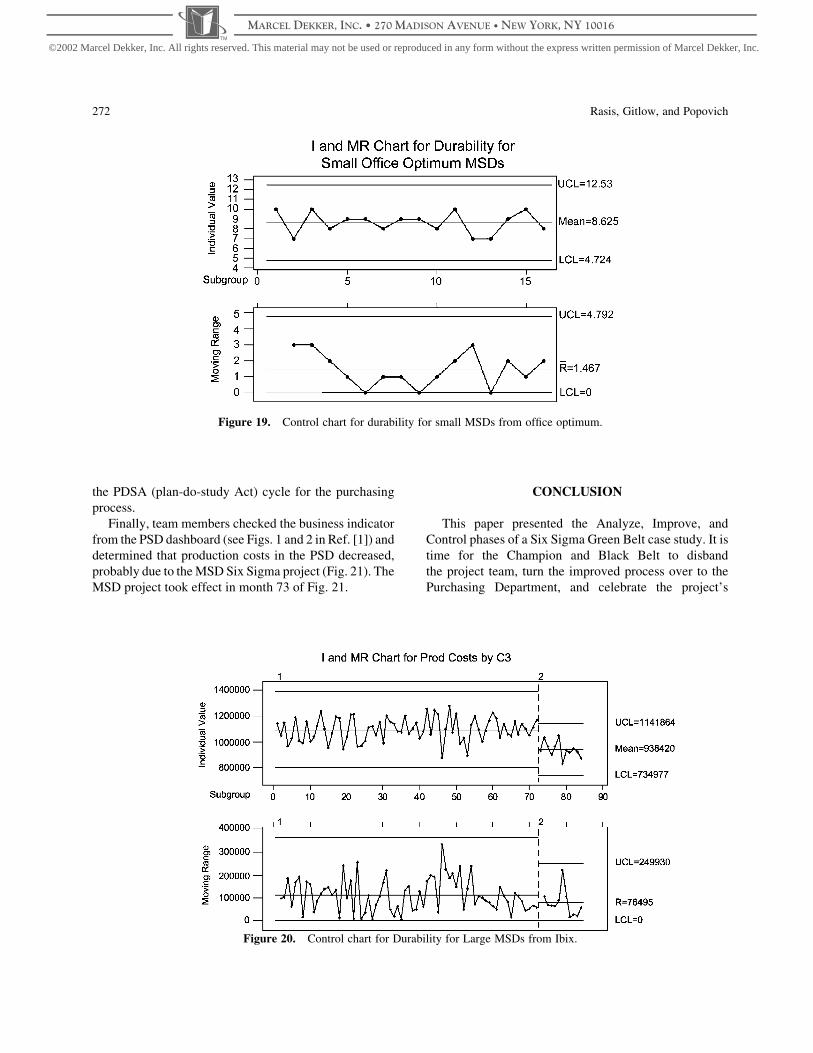
the PDSA (plan-do-study Act) cycle for the purchasing
process.
Finally, team members checked the business indicator
from the PSD dashboard (see Figs. 1 and 2 in Ref. [1]) and
determined that production costs in the PSD decreased,
probably due to the MSD Six Sigma project (Fig. 21). The
MSD project took effect in month 73 of Fig. 21.
CONCLUSION
This paper presented the Analyze, Improve, and
Control phases of a Six Sigma Green Belt case study. It is
time for the Champion and Black Belt to disband
the project team, turn the improved process over to the
Purchasing Department, and celebrate the project’s
Figure 19. Control chart for durability for small MSDs from office optimum.
Figure 20. Control chart for Durability for Large MSDs from Ibix.
Rasis, Gitlow, and Popovich272
©2002 Marcel Dekker, Inc. All rights reserved. This material may not be used or reproduced in any form without the express written permission of Marcel Dekker, Inc.
MARCEL DEKKER, INC. • 270 MADISON AVENUE • NEW YORK, NY 10016

success with team members. The authors hope that readers
find this case study a profitable learning experience.
ABOUT THE AUTHORS
Ms. Dana Rasis is a Business Planner with Agilent
Technologies in Fort Collins, Colorado. She received her
M.B.A. from the University of Miami (2001) and B.A.
from the University of Missouri (1996). Ms. Rasis is a
member of the American Society for Quality.
Dr. Howard S. Gitlow is Executive Director of the
Institute for the Study of Quality, Professor of Manage-
ment Science, and Six Sigma Master Black Belt, at the
University of Miami, Coral Gables, Florida. He received
his Ph.D. in Statistics (1974), M.B.A. (1972), and B.S. in
Statistics (1969) from New York University. His areas of
specialization are the management theories of Quality
Science and statistical quality control.
Dr. Gitlow is a senior member of the American
Society for Quality and a member of the American
Statistical Association. He has consulted on quality,
productivity, and related matters with many organiz-
ations, including several Fortune 500 companies. Dr.
Gitlow has co-authored 8 books and over 45 academic
articles in the areas of quality, statistics, management,
and marketing. While at the University of Miami,
Dr. Gitlow has received awards for Outstanding
Teaching, Outstanding Writing, and Outstanding Pub-
lished Research Articles.
Table 4
Risk Elements for Purchasing Process
Risk Elements Risk Category
Likelihood of
Occurrence
Impact of
Occurrence
Risk Element
Score
Failing to train new
purchasing agents
Performance 5 5 25 High
Vendor out of MSDs
with ridges
Materials 2 5 10 Medium
Scale: 1–5 with 5 being the highest.
Figure 21. Individuals and moving range chart of production costs in the PSD before and after the MSD Six Sigma project.
Six Sigma Case Study. II 273
©2002 Marcel Dekker, Inc. All rights reserved. This material may not be used or reproduced in any form without the express written permission of Marcel Dekker, Inc.
MARCEL DEKKER, INC. • 270 MADISON AVENUE • NEW YORK, NY 10016

Dr. Edward Popovich is President of Sterling
Enterprises International, Inc. a firm that provides
consulting and training services. Previously, he worked
for Harris Corporation, then he worked as a senior
consultant for Process Management International pro-
moting Dr. Deming’s management principles, while
consulting with the board of Jaguar Cars Limited on
Dr. Deming’s teachings and later he worked for Motorola
Corporation where he held significant management
positions. Dr. Popovich often represented Motorola as a
keynote speaker on Six Sigma.
Dr. Popovich earned his Ph.D. in Statistics (1983), his
Masters degree (1979), and his B.S. in Mathematics
(1977) at the University of Florida. He has taught at the
University of Florida, University of Central Florida,
Florida Atlantic University, Nova Southeastern
University, and has guest lectured at several other
universities.
REFERENCE
1. Rasis, D.; Gitlow, H.; Popovich, E. Paper Organizers
International: A Fictitious Green Belt Case Study—Part 1.
Qual. Eng., 2002–03, 15 (1), 127–145.
Rasis, Gitlow, and Popovich274
©2002 Marcel Dekker, Inc. All rights reserved. This material may not be used or reproduced in any form without the express written permission of Marcel Dekker, Inc.
MARCEL DEKKER, INC. • 270 MADISON AVENUE • NEW YORK, NY 10016