signal modeling techniques in speech...
TRANSCRIPT
Signal Modeling Techniques Signal Modeling Techniques in Speech Recognitionin Speech Recognition
Hassan A. KingraviHassan A. Kingravi
OutlineOutline
►► IntroductionIntroduction►► Spectral ShapingSpectral Shaping►► Spectral AnalysisSpectral Analysis►► Parameter TransformsParameter Transforms►► Statistical ModelingStatistical Modeling►► DiscussionDiscussion►► ConclusionsConclusions
1: Introduction1: Introduction
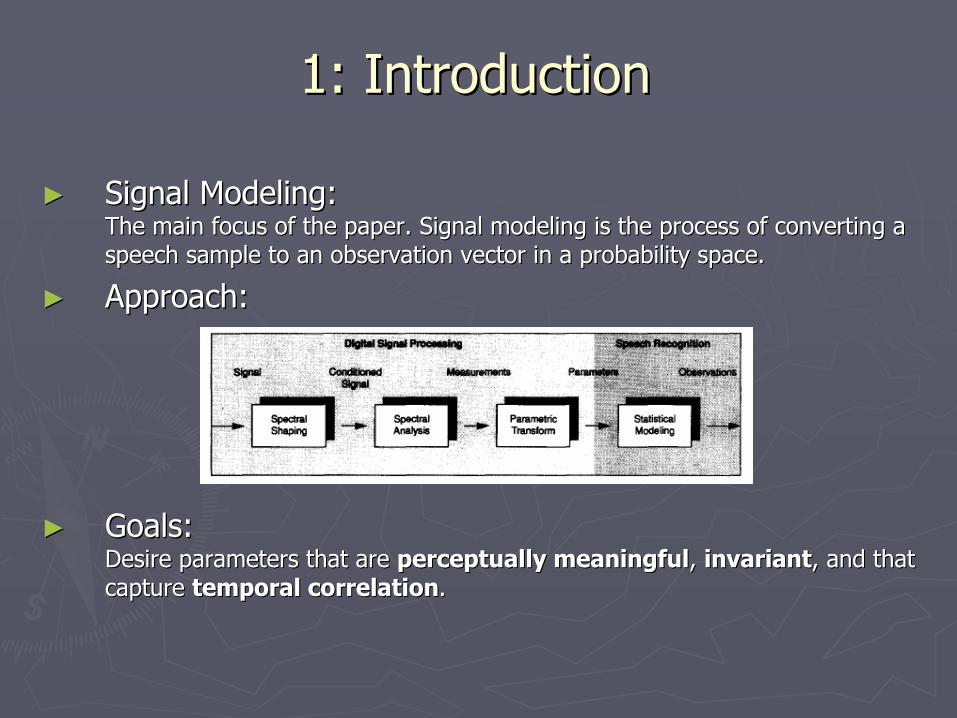
►► Signal Modeling:Signal Modeling:The main focus of the paper. Signal modeling is the process of cThe main focus of the paper. Signal modeling is the process of converting a onverting a speech sample to an observation vector in a probability space.speech sample to an observation vector in a probability space.
►► Approach:Approach:
►► Goals:Goals:Desire parameters that are Desire parameters that are perceptually meaningfulperceptually meaningful, , invariantinvariant, and that , and that capture capture temporal correlationtemporal correlation. .
2: Spectral Shaping2: Spectral Shaping
►► AnalogAnalog--toto--Digital ConversionDigital Conversion►► Digital FilteringDigital Filtering
Create a data representation of the signal with as high an SNR aCreate a data representation of the signal with as high an SNR as is s is possible. possible.
Once conversion is finished, the signal is filtered to emphasizeOnce conversion is finished, the signal is filtered to emphasize important important frequencies in the signal. This is performed via the use of Finifrequencies in the signal. This is performed via the use of Finite Impulse te Impulse Response filters. For e.g. hearing is more sensitive in the 1Response filters. For e.g. hearing is more sensitive in the 1--KHz region of KHz region of the spectrum, so this is emphasized.the spectrum, so this is emphasized.
3: Spectral Analysis3: Spectral Analysis
►► Step 1:Step 1: Extraction of fundamental frequency and power.Extraction of fundamental frequency and power.►► Fundamental frequency: Fundamental frequency:
Measured via different methods; Measured via different methods; a) Golda) Gold--RabinerRabiner: multiple measures of periodicity in the signal and votes : multiple measures of periodicity in the signal and votes among them.among them.b) NSA: average magnitude difference function and DA of multipleb) NSA: average magnitude difference function and DA of multiple voicing voicing measuresmeasuresc) Dynamic Programming: evaluate several measures of correlationc) Dynamic Programming: evaluate several measures of correlation and and spectral change in the signal, and compute an optimal fundamentaspectral change in the signal, and compute an optimal fundamental l frequency and voicing patternfrequency and voicing patternd) Cepstrumd) Cepstrum
3: Spectral Analysis3: Spectral Analysis
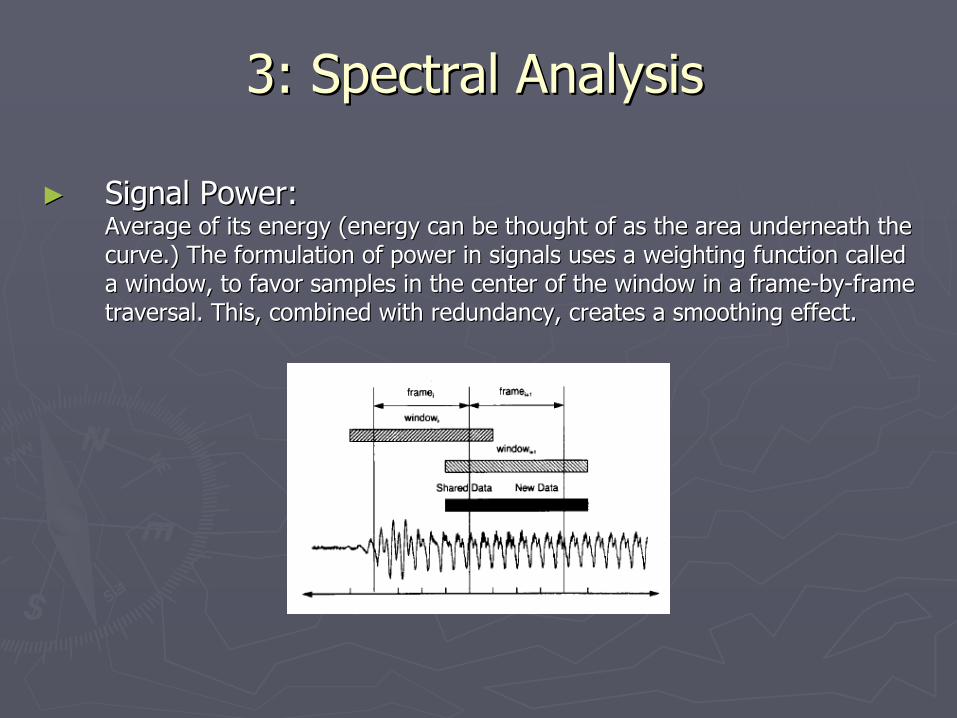
►► Signal Power: Signal Power: Average of its energy (energy can be thought of as the area undeAverage of its energy (energy can be thought of as the area underneath the rneath the curve.) The formulation of power in signals uses a weighting funcurve.) The formulation of power in signals uses a weighting function called ction called a window, to favor samples in the center of the window in a frama window, to favor samples in the center of the window in a framee--byby--frame frame traversal. This, combined with redundancy, creates a smoothing etraversal. This, combined with redundancy, creates a smoothing effect. ffect.
3: Spectral Analysis3: Spectral Analysis
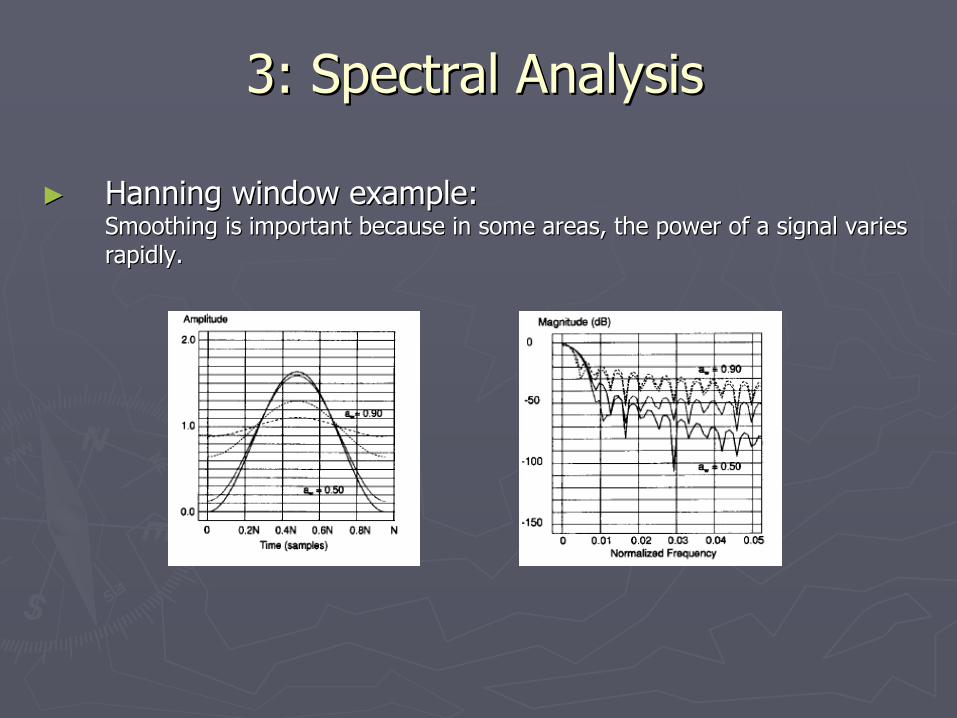
►► HanningHanning window example:window example:Smoothing is important because in some areas, the power of a sigSmoothing is important because in some areas, the power of a signal varies nal varies rapidly.rapidly.
3: Spectral Analysis3: Spectral Analysis
►► Step 2:Step 2: Spectral Analysis, proper. Spectral Analysis, proper. ►► Digital Filter BankDigital Filter Bank►► Fourier Transform Filter BankFourier Transform Filter Bank►► Cepstral CoefficientsCepstral Coefficients►► Linear Prediction CoefficientsLinear Prediction Coefficients►► LPLP--Derived Filter Bank AmplitudesDerived Filter Bank Amplitudes►► LPLP--Derived Cepstral CoefficientsDerived Cepstral Coefficients

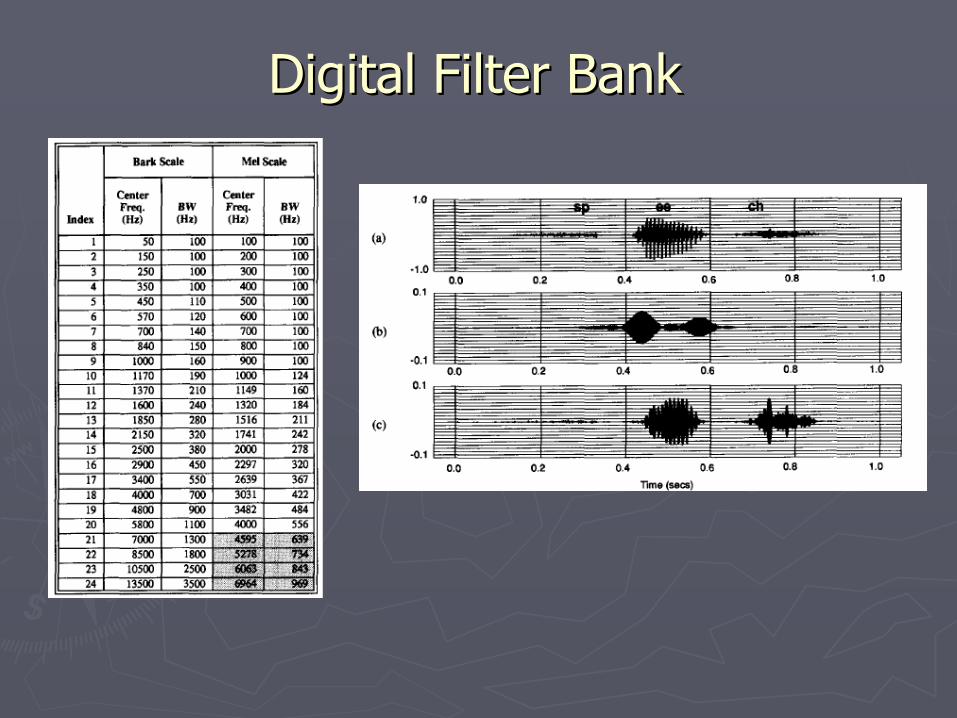
Digital Filter BankDigital Filter Bank
►► Motivations: Motivations: PhysiologicalPhysiological, i.e. the , i.e. the ““place theoryplace theory”” of hearing, and of hearing, and perceptualperceptual, i.e. , i.e. frequencies of complex sounds with a certain bandwidth cannot befrequencies of complex sounds with a certain bandwidth cannot beindividually identified.individually identified.
►► Critical Bandwidth Critical Bandwidth Human auditory system cannot distinguish between frequencies cloHuman auditory system cannot distinguish between frequencies close to one se to one another; the higher the frequency, the larger the interval; thisanother; the higher the frequency, the larger the interval; this is the critical is the critical band for a frequency. band for a frequency.
►► Filter Bank Filter Bank Collection of linear phase FIR Collection of linear phase FIR bandpassbandpass filters arranged linearly across the filters arranged linearly across the BarkBark or or melmel scales. Used in systems that attempt to emulate human scales. Used in systems that attempt to emulate human auditory processing. Merit: certain filter outputs correlated wiauditory processing. Merit: certain filter outputs correlated with certain th certain speech sounds.speech sounds.
Digital Filter BankDigital Filter Bank
Fourier Transform Filter BankFourier Transform Filter Bank
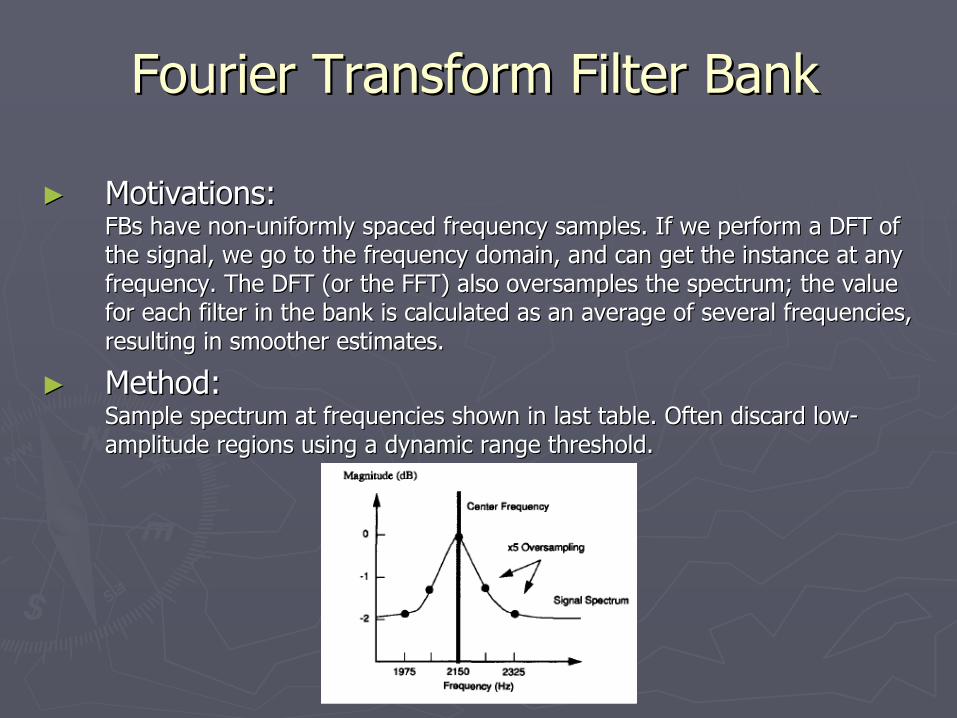
►► Motivations: Motivations: FBsFBs have nonhave non--uniformly spaced frequency samples. If we perform a DFT of uniformly spaced frequency samples. If we perform a DFT of the signal, we go to the frequency domain, and can get the instathe signal, we go to the frequency domain, and can get the instance at any nce at any frequency. The DFT (or the FFT) also frequency. The DFT (or the FFT) also oversamplesoversamples the spectrum; the value the spectrum; the value for each filter in the bank is calculated as an average of severfor each filter in the bank is calculated as an average of several frequencies, al frequencies, resulting in smoother estimates.resulting in smoother estimates.
►► Method:Method:Sample spectrum at frequencies shown in last table. Often discarSample spectrum at frequencies shown in last table. Often discard lowd low--amplitude regions using a dynamic range threshold. amplitude regions using a dynamic range threshold.
Cepstral CoefficientsCepstral Coefficients
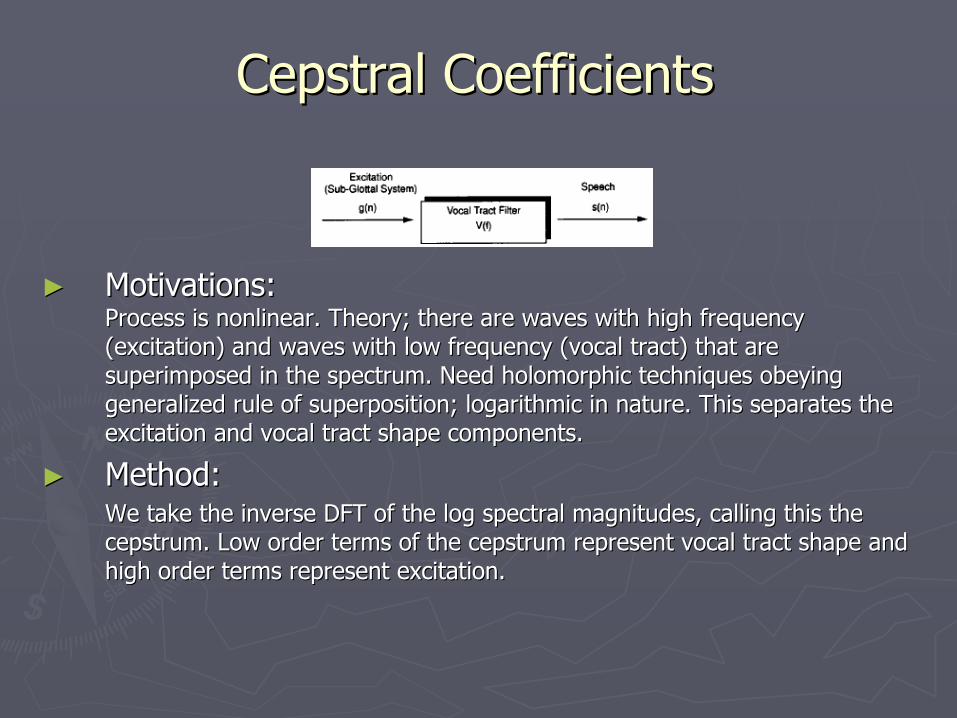
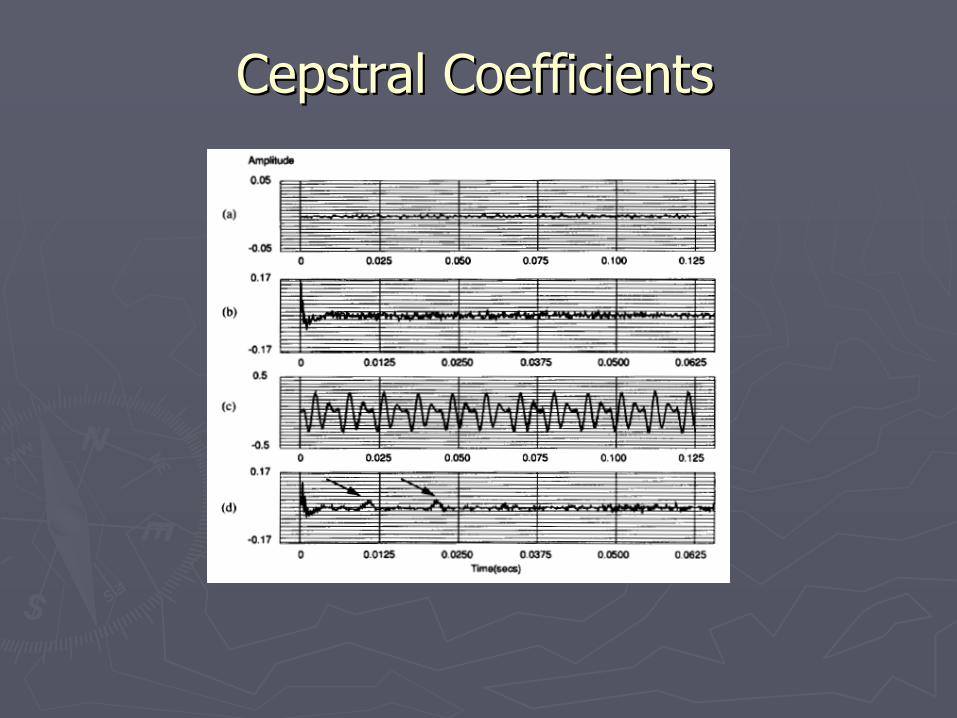
►► Motivations:Motivations:Process is nonlinear. Theory; there are waves with high frequencProcess is nonlinear. Theory; there are waves with high frequency y (excitation) and waves with low frequency (vocal tract) that are(excitation) and waves with low frequency (vocal tract) that aresuperimposed in the spectrum. Need superimposed in the spectrum. Need holomorphicholomorphic techniques obeying techniques obeying generalized rule of superposition; logarithmic in nature. This sgeneralized rule of superposition; logarithmic in nature. This separates the eparates the excitation and vocal tract shape components. excitation and vocal tract shape components.
►► Method:Method:We take the inverse DFT of the log spectral magnitudes, calling We take the inverse DFT of the log spectral magnitudes, calling this the this the cepstrum. Low order terms of the cepstrum represent vocal tract cepstrum. Low order terms of the cepstrum represent vocal tract shape and shape and high order terms represent excitation. high order terms represent excitation.
Cepstral CoefficientsCepstral Coefficients
Linear Prediction CoefficientsLinear Prediction Coefficients
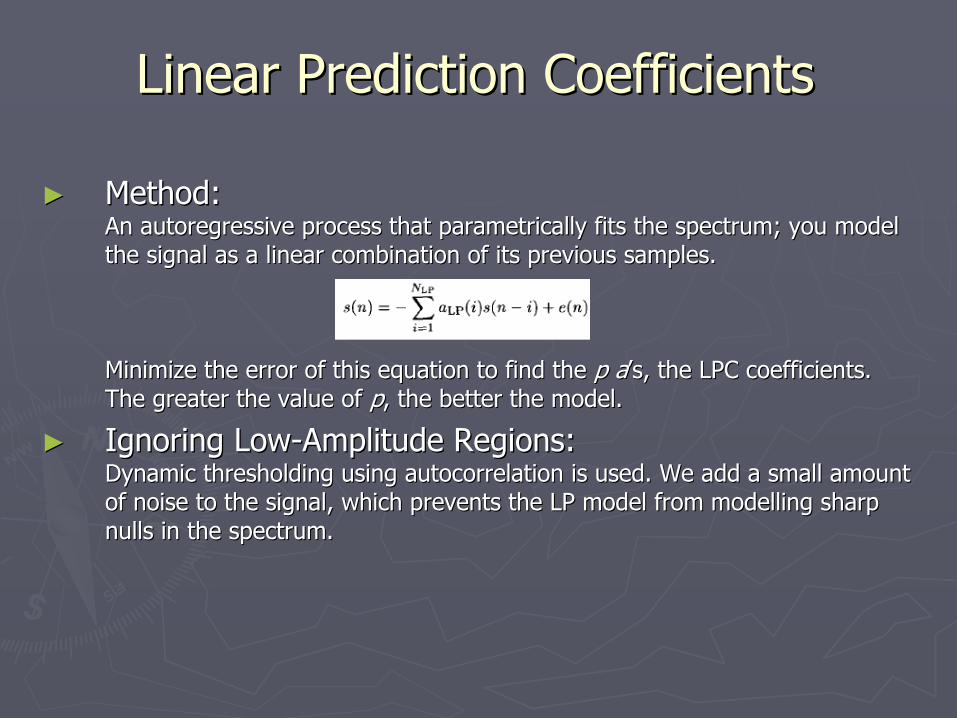
►► Method:Method:An autoregressive process that parametrically fits the spectrum;An autoregressive process that parametrically fits the spectrum; you model you model the signal as a linear combination of its previous samples. the signal as a linear combination of its previous samples.
Minimize the error of this equation to find the Minimize the error of this equation to find the pp aa’’s, the LPC coefficients. s, the LPC coefficients. The greater the value of The greater the value of pp, the better the model. , the better the model.
►► Ignoring LowIgnoring Low--Amplitude Regions:Amplitude Regions:Dynamic Dynamic thresholdingthresholding using autocorrelation is used. We add a small amount using autocorrelation is used. We add a small amount of noise to the signal, which prevents the LP model from of noise to the signal, which prevents the LP model from modellingmodelling sharp sharp nulls in the spectrum. nulls in the spectrum.
LPLP--Derived Filter BanksDerived Filter Banks
►► Motivations:Motivations:Similar to the other filter banks, except we sample the LP modelSimilar to the other filter banks, except we sample the LP model at the at the given frequencies, instead of the spectrum. This is done becausegiven frequencies, instead of the spectrum. This is done because the LP the LP model gives more robust spectral estimates. model gives more robust spectral estimates.
►► Caveat:Caveat:As DSP technology has developed further, difference between apprAs DSP technology has developed further, difference between approaches oaches not so great any more. not so great any more.
LPLP--Derived Cepstral CoefficientsDerived Cepstral Coefficients
►► Method:Method:Recall that the Recall that the cepstralcepstral coefficients are calculated from the FFT of the log coefficients are calculated from the FFT of the log amplitudes. The LPamplitudes. The LP--derived derived cepstralcepstral coefficentscoefficents are the LP equivalent, where are the LP equivalent, where we take the logarithm of the inverse filter (remember, the LP eqwe take the logarithm of the inverse filter (remember, the LP equation is a uation is a filter). The number of filter). The number of cepstralcepstral coefficients usually equivalent to the number coefficients usually equivalent to the number of LP coefficients.of LP coefficients.
►► Difficulties:Difficulties:The coefficients calculated reflect a linear frequency scale; woThe coefficients calculated reflect a linear frequency scale; work needs to be rk needs to be done to make it nonlinear. done to make it nonlinear.
4: Parameter Transforms4: Parameter Transforms
►► Motivations:Motivations:The previous process gives us absolute measurements. Now we geneThe previous process gives us absolute measurements. Now we generate rate signal parameters from the measurements via differentiation and signal parameters from the measurements via differentiation and concatenation. Output; parameter vector with raw estimates of siconcatenation. Output; parameter vector with raw estimates of signal. gnal.
►► Differentiation:Differentiation:Using the concept of a gradient, we take approximate derivativesUsing the concept of a gradient, we take approximate derivatives of the of the signal to highlight changes in variation.signal to highlight changes in variation.
►► Concatenation:Concatenation:Take as input a large matrix of all the measurements called Take as input a large matrix of all the measurements called XX. Using . Using auxiliary matrices, we perform all the necessary filtering operaauxiliary matrices, we perform all the necessary filtering operations tions discussed, including weighting, differentiation and averaging; rdiscussed, including weighting, differentiation and averaging; results in esults in creation of single parameter vector per frame that contains all creation of single parameter vector per frame that contains all desired signal desired signal parameter. parameter.
5: Statistical Modeling5: Statistical Modeling
►► Motivations:Motivations:Assumption; signal parameters generated via some underlying multAssumption; signal parameters generated via some underlying multivariate ivariate probability distribution. Job is to find the model; treat the daprobability distribution. Job is to find the model; treat the data as signal ta as signal observations. Uses topics from:observations. Uses topics from:
►► Multivariate Statistical ModelsMultivariate Statistical Models►► Distance MeasuresDistance Measures

Multivariate Statistical ModelsMultivariate Statistical Models
►► Motivations:Motivations:Quantities with different numerical scales and that are correlatQuantities with different numerical scales and that are correlated are mixed ed are mixed with each other; lot of redundancy. Scales can be rewith each other; lot of redundancy. Scales can be re--adjusted; correlation is adjusted; correlation is more difficult to deal with.more difficult to deal with.
►► The Whitening Transform:The Whitening Transform:Assuming that the process we are modeling is Gaussian in nature,Assuming that the process we are modeling is Gaussian in nature, we can we can use a use a prewhiteningprewhitening transform to transform to decorrelatedecorrelate the parameters. the parameters.
This involves computing the This involves computing the eigenvalueseigenvalues and eigenvectors of the covariance and eigenvectors of the covariance matrix. The matrix. The eigenvalueseigenvalues can be further used to determine which can be further used to determine which eigenvectors are the most significant, leading to a reduction ineigenvectors are the most significant, leading to a reduction in features. features.
Note: need data for this for mean and variance calculations. Note: need data for this for mean and variance calculations.
Multivariate Statistical ModelsMultivariate Statistical Models
►► Vector Quantization:Vector Quantization:If the Gaussian model is not appropriate, need a nonIf the Gaussian model is not appropriate, need a non--parametric parametric representation. Hypothesize a discrete distribution and try to frepresentation. Hypothesize a discrete distribution and try to fit it. Vector it it. Vector quantizersquantizers compress the distribution; physiological precedents include thecompress the distribution; physiological precedents include theassumption that a finite set of stationary vocal tract shapes exassumption that a finite set of stationary vocal tract shapes exists.ists.Need to estimate a vector quantizing codebook Need to estimate a vector quantizing codebook Q, Q, which contains a finite which contains a finite set of set of ‘‘idealideal’’ vectors, which will replace an input vector. Secondly, must vectors, which will replace an input vector. Secondly, must maximize maximize P(y|P(y|QQ).).Latter is simple. Former is done by use of the KLatter is simple. Former is done by use of the K--Means algorithm.Means algorithm.
Multivariate Statistical ModelsMultivariate Statistical Models
►► KK--Means Algorithm:Means Algorithm:Given the training data, and a number, say Given the training data, and a number, say kk, of clusters, place the , of clusters, place the kk points points in the space as far apart as possible. For each element in the din the space as far apart as possible. For each element in the data, assign it ata, assign it to the cluster closest to it. Once this is done, to the cluster closest to it. Once this is done, recomputerecompute the the centroidscentroids of the of the clusters. Repeat this until the clusters. Repeat this until the centroidscentroids no longer move. This results in the no longer move. This results in the kkgroups we need, and the groups we need, and the centroidscentroids become the components of become the components of QQ. .
Distance MeasuresDistance Measures
►► Motivation:Motivation:The kThe k--means algorithm requires the definition of a distance measure inmeans algorithm requires the definition of a distance measure in the the vector space, without which it cannot proceed.vector space, without which it cannot proceed.
►► Properties:Properties:Distance measures must satisfy the properties of Distance measures must satisfy the properties of nonnegativitynonnegativity, symmetry, , symmetry, and the triangle inequality.and the triangle inequality.
►► Examples:Examples:Most famous form is Euclidean. An interesting approximation thatMost famous form is Euclidean. An interesting approximation that’’s s presented is the dot product form of the Euclidean distance, whipresented is the dot product form of the Euclidean distance, which is ch is obviously very cheap to evaluate. obviously very cheap to evaluate.
DiscussionDiscussion
►► Overview:Overview:Author gives a table of methods used in the community as of 1993Author gives a table of methods used in the community as of 1993; not ; not really important.really important.
►► Comments:Comments:Neural Network based classification systems employ filter banks Neural Network based classification systems employ filter banks (tying in (tying in with cognition and the auditory system etc.)with cognition and the auditory system etc.)
Cepstral coefficients dominant acoustic measurement.Cepstral coefficients dominant acoustic measurement.
FFTFFT--derived derived cepstralcepstral coefficients are more common than LPcoefficients are more common than LP--derived ones. derived ones. FFT is still popular because of its immunity to noise.FFT is still popular because of its immunity to noise.
SummarySummary
►► Overview:Overview:Presented the various processes involved in the modeling of a siPresented the various processes involved in the modeling of a signal and its gnal and its conversion to a meaningful representation, one necessary for anaconversion to a meaningful representation, one necessary for analysis.lysis.