sil area 5 - manitoba hydro · 2017-10-20 · sil area 3 sil area 2 sil area 5 sil area 7 sil area...
TRANSCRIPT
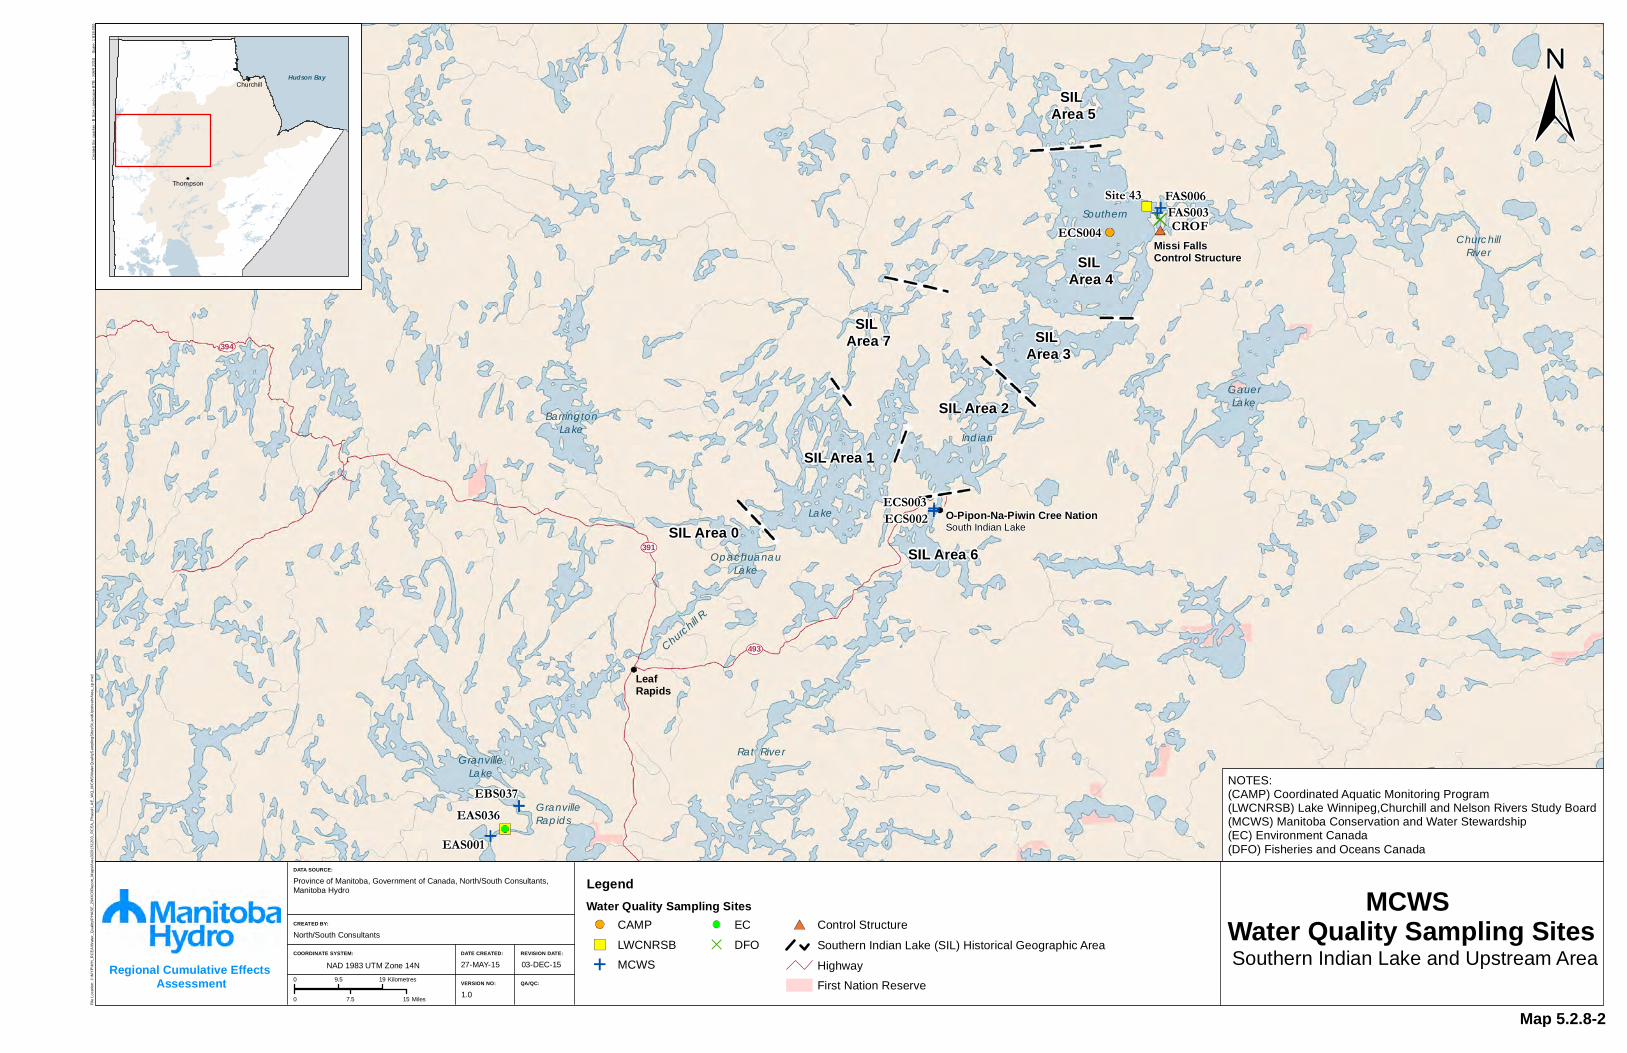
MCWS Water Quality Sampling Sites Southern Indian Lake and Upstream Area
Province of Manitoba, Government of Canada, North/South Consultants,Manitoba Hydro
North/South Consultants
1.0
27-MAY-15 03-DEC-15
OpachuanauLake
Lake
BarringtonLake
GranvilleLake
ChurchillRiver
GauerLake
Rat River
Southern
Granville Rapids
Indian
Churchill R.
493
394
391
O-Pipon-Na-Piwin Cree NationSouth Indian Lake
Leaf Rapids
Missi Falls Control Structure
CROF
Site 43
ECS004FAS003FAS006
ECS002ECS003
EBS037
EAS001EAS036
SIL Area 3
SIL Area 2
SIL Area 5
SIL Area 7
SIL Area 6
SIL Area 4
SIL Area 1
SIL Area 0
Cre
ated
By:
cpa
rker
- B
Siz
e La
ndsc
ape
BTB
- M
AR
201
5
Sca
le: 1
:818
,000
Regional Cumulative Effects Assessment
NAD 1983 UTM Zone 14N
0 7.5 15 Miles
0 9.5 19 Kilometres
File
Loc
atio
n: J
:\MY
P\M
H_R
CE
A\W
ater
_Qua
lity\
PH
AS
E_2
\MX
D\R
epor
t_M
aps\
Are
a3\2
0151
203_
RC
EA
_Pha
seII_
AE
_WQ
_MC
WS
Wat
erQ
ualit
ySam
plin
gSite
sSIL
andU
pstre
amA
rea_
cp.m
xd
DATA SOURCE:
DATE CREATED:
CREATED BY:
VERSION NO:
REVISION DATE:
QA/QC:
COORDINATE SYSTEM:
Hudson Bay
Thompson
Churchill
Water Quality Sampling SitesLegend
CAMP
LWCNRSB
MCWS
EC
DFO
Control Structure
Southern Indian Lake (SIL) Historical Geographic Area
Highway
First Nation Reserve
NOTES:(CAMP) Coordinated Aquatic Monitoring Program(LWCNRSB) Lake Winnipeg,Churchill and Nelson Rivers Study Board(MCWS) Manitoba Conservation and Water Stewardship(EC) Environment Canada(DFO) Fisheries and Oceans Canada
Map 5.2.8-2

DFO and CAMP Water Quality Sampling Sites
Southern Indian Lake
Province of Manitoba, Government of Canada, North/South Consultants,Manitoba Hydro
North/South Consultants
1.0
27-MAY-15 03-DEC-15
Missi Falls Control Structure
O-Pipon-Na-Piwin Cree NationSouth Indian Lake
ECS001
ECS004
ECS005
EBS046
79
76
72
6X6F
6D6C
6B6A
66
61
60
5B
5A58
5552
50
4D
4C
4B
47
46
4443
4241
40
3A35
34
3332
31
30
2G
2E
2422
21
20
1A
18
16
12
11
10
090402
01
Opachuanau Lake
CROF above Missi
391
493
Indian
Lake
Lake
Gauer
Southern
Barrington River
SIL Area 3
SIL Area 2
SIL Area 5
SIL Area 7
SIL Area 6
SIL Area 4
SIL Area 1
SIL Area 0
Cre
ated
By:
cpa
rker
- B
Siz
e La
ndsc
ape
BTB
- M
AR
201
5
Sca
le: 1
:499
,000
Regional Cumulative Effects Assessment
NAD 1983 UTM Zone 14N
0 4.5 9 Miles
0 5.5 11 Kilometres
File
Loc
atio
n: J
:\MY
P\M
H_R
CE
A\W
ater
_Qua
lity\
PH
AS
E_2
\MX
D\R
epor
t_M
aps\
Are
a3\2
0151
203_
RC
EA
_Pha
seII_
AE
_WQ
_DF
OA
ndC
AM
PW
ater
Qua
lityS
ampl
ingS
outh
ernI
ndia
nLak
e_cp
.mxd
DATA SOURCE:
DATE CREATED:
CREATED BY:
VERSION NO:
REVISION DATE:
QA/QC:
COORDINATE SYSTEM:
Water Quality Sampling Sites
Hudson Bay
Thompson
Churchill
Legend
DFO
CAMP
LWCNRSB
Control Structure
Southern Indian Lake (SIL) Historical Geographic Area
Highway
First Nation Reserve
NOTES:(DFO) Fisheries and Oceans Canada(CAMP) Coordinated Aquatic Monitoring Program(LWCNRSB) Lake Winnipeg,Churchill and Nelson Rivers Study Board
Map 5.2.8-3
REGIONAL CUMULATIVE EFFECTS ASSESSMENT – PHASE II WATER – WATER QUALITY
DECEMBER 2015 5.2-129
5.2.8.1 Key Published Information The earliest record of water quality data for SIL was a brief study conducted in May/June 1952, in which relatively limited in situ data (Secchi disk depth and DO) were measured in several areas of the lake (McTavish 1952). Since that time, SIL has been the subject of extensive and intensive study, notably over the 1970s and 1980s. The key water quality studies or monitoring programs conducted in this area include:
• the LWCNRSB studies conducted by DFO in 1972–1973;
• additional studies conducted by DFO in 1974–1988 and 1998; • long-term monitoring conducted by MCWS at two locations (SIL near the Missi Falls CS in
1975–1977 and 1987–1989, and South Bay of SIL in 1972–1984, and 1987–present); and • Manitoba/Manitoba Hydro’s CAMP initiated in 2007.
Water quality data for the pre-CRD period (1972–1973) were presented and effects were predicted as part of the LWCNRSB program (Cleugh 1974b; Hecky 1974; Hecky and Ayles 1974a; Hecky et al. 1974). Numerous publications presenting results of the DFO studies on SIL have also been produced. Key reports in which effects of CRD on water quality were discussed include Bodaly et al. (1984), Hecky (1984), Hecky and Guildford (1984), Hecky and McCullough (1984a,b), Hecky and Newbury (1977), Hecky et al. (1984, 1987a, b), Guildford (1985), Newbury et al. (1984), Patalas and Salki (1984), and Salki et al. (1999). Not all data that were collected have been published and an integrated comprehensive report on changes in water quality based on these data has not been produced.
Water quality monitoring data collected by MCWS near the community of South Indian Lake and near the Missi Falls CS have been subject to formal assessments of water quality changes in the lake (Playle and Williamson 1986; Playle et al. 1988; Duncan and Williamson 1988; Ralley and Williamson 1990; Williamson and Ralley 1993). The most recent of the latter studies (Williamson and Ralley 1993) statistically compared water quality for the two long-term monitoring sites over four time frames, defined as: pre-CRD period (1972–1973); construction period (1974–1976); immediate post-CRD period (1977–1980 at the Missi Falls CS and 1977–1984 near the South Indian Lake community); and later post-CRD period (1987–1989 at the Missi Falls CS and 1987–1992 near the South Indian Lake community).
Results of the first three years of CAMP were synthesized and presented in CAMP (2014), which included several sites in SIL and one site in each of Opachuanau and Granville lakes.
The results of a number of studies on mercury in water in SIL have also been published; key reports include EC and DFO (1992b), Jackson (1988), Ramsey (1988, 1990, 1991b), and Rannie and Punter (1987).
5.2.8.2 New Information and/or Re-analysis of Existing Information Raw water quality data were compiled (to the extent data could be located) from various sources, integrated, and analysed to provide a description of changes over time and to provide information on

REGIONAL CUMULATIVE EFFECTS ASSESSMENT – PHASE II WATER – WATER QUALITY
DECEMBER 2015 5.2-130
recent or contemporary conditions (the most recent published reports generally considered data only to the early 1990s). For this area, data sources included: • raw data from published historical reports (McTavish 1952); • LWCNRSB water quality data (i.e., raw data were obtained from the LWCNRSB reports
[Cleugh 1974b], and/or from DFO [2015]);
• raw water quality data collected by DFO (2015); • the MCWS water quality database (raw data were provided by MCWS 2014); and
• Manitoba/Manitoba Hydro’s CAMP.
Three general analyses were undertaken as part of the RCEA to supplement the existing published information:
• statistical analysis of the MCWS data sets collected near the Missi Falls CS and near the community of South Indian Lake (Table 5.2.8A-1);
• qualitative analysis of data collected by the LWNRSB and DFO in Areas 1 to 7 of SIL and Opachuanau Lake, supplemented where appropriate, with data collected under CAMP (Table 5.2.8A-2); and
• linear regression analysis examining relationships between hydrological (i.e., water level and discharge) and water quality metrics at two sites (near the Missi Falls CS and near the Community of South Indian Lake).
The objective of the re-examination of the MCWS data were primarily to update the previous temporal analyses, which utilized data up to and including 1992 (i.e., Williamson and Ralley 1993), with additional, more recent data. Data analysed for the MCWS site near the South Indian Lake community was provided by MCWS (2014). Data for the site near the Missi Falls CS included data provided by MCWS (2014), supplemented with data provided by DFO (2015), as was done in previous assessments for this site (i.e., Williamson and Ralley 1993), and data collected since 2008 under CAMP. These datasets are collectively referred to as the “MCWS datasets” hereafter. Sites are presented in Map 5.2.8-2.
To standardize the MCWS datasets, only data collected over the period of June-October (i.e., open water season) were included in statistical analyses. The statistical analyses were based on comparison of conditions in five time intervals, following the approach applied in Williamson and Ralley (1993):
• pre-construction period: 1972–1973;
• construction/impoundment period: 1974–1976; • post-impoundment period 1: 1977–1986;
• post-impoundment period 2: 1987–1992; and • post-impoundment period 3: 1993–2013.
Data collected at sites located upstream of the study area, near the inflow to Granville Lake, were also analysed to provide additional supporting information regarding conditions of the inflowing Churchill River. Data for this area, collectively referred to as the “Granville Lake dataset” hereafter, were provided by MCWS (2014) and supplemented with data collected by EC for the earlier period.
Analysis of the LWCNRSB and DFO datasets was undertaken to provide a more comprehensive examination of water quality, as many publications based on these studies did not incorporate the full

REGIONAL CUMULATIVE EFFECTS ASSESSMENT – PHASE II WATER – WATER QUALITY
DECEMBER 2015 5.2-131
period of monitoring and/or some of the water quality parameters measured during the studies. As some of the LWCNRSB/DFO sites were located in nearshore areas, near small tributary inflows, and/or in isolated bays, the dataset was reduced to include sites located in more offshore areas and those that were monitored most regularly over the period of study. This reduction was done to eliminate noise in the datasets (i.e., noise associated with irregular and/or short-term sampling in areas where chemistry potentially inherently differed from sites located in the main offshore areas of the lake, such as sites near a local tributary inflow with different chemistry than the more offshore areas). Data collected under CAMP were also included in this analysis to provide more contemporary water quality data for Southern Indian and Opachuanau lakes. Sites included for the detailed analyses are indicated in Map 5.2.8-3. These data are hereafter referred to as the “DFO dataset”. Data were plotted for the open water season (defined here as June-October) and the ice cover season (defined here as December-April), separately. Where a replicate sample was collected, the sample with the most comprehensive analytical suite of parameters or the first reported sample was included.
Qualitative comparison of water quality data reported by Cleugh (1974b) to data provided by DFO (2015) for the period of 1972–1973 indicated a number of discrepancies. In general, results as reported in Cleugh (1974b) were included in the analysis. However, exceptions included: • TSS data provided by DFO were retained for analysis where available. Data presented in Cleugh
(1974b) for TSS were generally reported as less than 10 mg/L, whereas values provided by DFO were reported to a higher level of resolution;
• where a measurement was reported by DFO (2015) but was not reported in Cleugh (1974b), the data provided by DFO were included; and
• where gross transcription errors were noted through qualitative comparisons of the two datasets (e.g., where results for two water quality parameters were reversed), the laboratory results provided by DFO were used.
Linear regression analysis was conducted between water quality metrics and hydrological metrics (i.e., water level and discharge) for the MCWS water quality datasets in Areas 4 and 6 of SIL. Hydrological metrics examined included SIL water level, discharge of the upper Churchill River near Leaf Rapids (i.e., to represent inflowing conditions), and discharge at the Missi Falls CS. This exercise was undertaken using post-CRD data (i.e., 1977 onwards) for the open water season only. Data were tested for normality on raw and log-transformed values.
Inventories of water quality data that were used for analysis of the MCWS and DFO datasets are indicated in Tables 5.2.8A-1 and 5.2.8A-2 and a summary of the waterbodies and areas subjected to detailed analysis is provided in Table 5.2.8-1.

REGIONAL CUMULATIVE EFFECTS ASSESSMENT – PHASE II WATER – WATER QUALITY
DECEMBER 2015 5.2-132
Table 5.2.8-1: Water Quality Data Subject to Detailed Analysis
Waterbody Area Period of Record
Granville Lake Area Upper Churchill River and Granville Lake 1971–2013
Opachuanau Lake Area 0 1972–1973, 1975–1986, 1998, 2011
Southern Indian Lake
Area 1 1972–1988, 1998, 2009, 2012
Area 2 1972–1986, 1988, 1998
Area 3 1972, 1974–1975, 1978–1986, 1998
Area 4 1972–1988, 1998, 2008–2014
Area 5 1972–1986, 1988, 1998
Area 6 1972–2013
Area 7 1972, 1978–1986, 1998
5.2.8.3 Changes in Indicators over Time Potential effects of CRD on water quality in SIL vary spatially, as follows: • Flooding: Flooding potentially causes increases in nutrients, metals, and colour, and decreases in
pH, DO, and water clarity. • Diversion: The largest physical effects of diversion occurred in Areas 3 and 4 (i.e., a reduced
influence of the Churchill River and reduction in flows) and Area 6 (i.e., an increased influence of the Churchill River and increased flows) of SIL. Diversion could alter water quality conditions in relation to inherent differences between the Churchill River and local tributaries, as well as through changes in velocities and water residence times.
• Erosion/Sedimentation: Increased shoreline erosion due to flooding and/or changes in sedimentation due to changes in hydrology/morphology of the lake. This pathway could affect TSS, notably in areas of increased erosion, and/or alter rates of sedimentation where water velocities, depths, and/or residence times were affected. Effects would be expected to vary spatially in relation to shoreline characteristics, residence times, depths, and fetch.
The conclusions of published assessments of the effects of CRD on water quality in SIL have not always been in agreement, likely due to differences in datasets utilized within the individual studies or publications.
Reported effects to water quality in SIL also varied spatially. In general, some effects reflected the shift in the main flow path of the Churchill River. Prior to CRD, the Churchill River flowed from Opachuanau Lake through SIL Areas 1 to 4, exiting at Missi Falls. Following diversion, the Churchill River flow shifted to affect Area 6, which was previously relatively isolated from the Churchill River influence. Further, the influence of the Churchill River in comparison to local inflow in SIL Areas 2 to 4 was reduced following diversion. This shift, in turn, influenced water quality metrics that were previously defined based on the relative influence of the Churchill River or local tributaries in the various areas of the lake. Other effects also varied spatially, including effects on water clarity. In this instance, spatial differences reflected

REGIONAL CUMULATIVE EFFECTS ASSESSMENT – PHASE II WATER – WATER QUALITY
DECEMBER 2015 5.2-133
shoreline characteristics, fetch, water depth, and residence times (i.e., shoreline erosion varied between areas).
5.2.8.3.1 Nutrients and Trophic Status
PRE-HYDROELECTRIC DEVELOPMENT
In 1972-1973, the Churchill River provided the majority of nutrients to SIL (i.e., nutrient loads), though concentrations of TP and TN were similar between small tributaries to the lake and the Churchill River inflow (Hecky and Ayles 1974a). In 1972, the lake had moderately high concentrations of phosphorus (Figure 5.2.8A-1) and nitrogen (Figure 5.2.8A-2). TP concentrations fell within the mesotrophic/meso-eutrophic category and, on average, TP concentrations were within the current Manitoba narrative guideline for lakes, reservoirs, and ponds (0.025 mg/L), with the exception of Area 7 (Figure 5.2.8A-3). Area 7 was notably more nutrient-rich than other regions in the early 1970s (Figures 5.2.8A-1 and 5.2.8A-2). Of the two major nutrients, nutrient ratios suggest that phosphorus was more limiting than nitrogen (Figure 5.2.8A-4).
Prior to CRD, Hecky et al. (1974) reported that SIL was generally more productive than most shield lakes in the region, which was attributed to the nutrient richness of the Churchill River. Chlorophyll a data collected in 1972 by the LWCNRSB indicate that primary productivity was relatively similar in Opachuanau Lake (SIL Area 0) and most areas of SIL (Figure 5.2.8A-5 and 5.2.8A-6). However, there is some indication that SIL Area 6, and to a lesser extent SIL Area 5, may have had lower levels of primary productivity prior to CRD. Hecky and Ayles (1974a) indicated that primary productivity was lowest in SIL Area 6 due to low water clarity and nutrients (Hecky and Ayles 1974a).
Conclusions regarding spatial differences in primary productivity vary in the reported literature in relation to the method of characterizing productivity (e.g., chlorophyll a or biomass measurements). Further, conclusions may differ due to variability associated with sampling sites, periods, and methods. For example, consideration of data collected at only the core (i.e., most intensively sampled) LWCNRSB sites sampled in 1972 (i.e., sites 09, 10, 20, 30, 40, 50, 60, and 79) indicate that Area 3 may have been more productive than other areas of the lake (Figure 5.2.8A-6). Considering mid-summer values, Patalas and Salki (1984) reported that chlorophyll a was highest in Areas 2, 3, and 4 in 1972.
Despite potential spatial differences, like nutrients, chlorophyll a concentrations measured in 1972 were, on average, indicative of mesotrophic conditions across all areas of Southern Indian and Opachuanau lakes (Figure 5.2.8A-5).
Hecky (1974) indicated that nutrients may have increased in SIL at the approximate time of construction of upstream hydroelectric development in the Churchill River system. This postulation was based on results of sediment cores collected in the lake, which indicated peaks in nutrient concentrations at sediment depths estimated at an approximate age of 30–40 years at the time of study (i.e., corresponding to the period of 1930–1940). However, analysis of fossil diatoms in the sediment cores indicated the lake likely had similar levels of productivity prior to and following upstream developments in the watershed. As the cores were not radio-dated, these suggestions were based on numerous assumptions and cannot be confirmed.
REGIONAL CUMULATIVE EFFECTS ASSESSMENT – PHASE II WATER – WATER QUALITY
DECEMBER 2015 5.2-134
POST-HYDROELECTRIC DEVELOPMENT
Analysis of raw data collected by DFO and MCWS in SIL indicate some effects to nutrients occurred in association with CRD and that the effects varied spatially across the lake. Conclusions based on these datasets, and those presented in the literature, are not always in agreement.
Area 4, which includes the Missi Falls CS, has been monitored by DFO (multiple sites) and MCWS (single site near the Missi Falls CS), and under CAMP (single site near the center of SIL Area 4), over the period of 1972 to 2013. Long-term data collected by MCWS in the Missi Falls CS area indicate that TP was not significantly altered by CRD and that concentrations have been similar since the early 1970s (Figures 5.2.8A-7 and 5.2.8A-8). Although pre-CRD data are limited, available data collected by DFO and under CAMP also suggest that TP was largely unchanged during and following impoundment and diversion, though concentrations were more variable in the most recent period of CAMP monitoring (2008–2013; Figure 5.2.8A-9). The latter observation may reflect differences in sampling sites and/or methods between the studies.
In Area 6 (i.e., South Bay), MCWS data indicate that TP was unchanged over the impoundment period (1974–1976), increased immediately post-impoundment (1977–1983), and then returned to pre-impoundment concentrations by the 1987–1992 period (Figure 5.2.8A-7). Further, TP concentrations in Area 6 have been similar to those measured at a site upstream (in the Granville Lake area) for approximately the last two decades, indicating that conditions have been affected primarily by the Churchill River inflow rather than local processes, such as erosion. TP was, on average, above the Manitoba narrative nutrient guideline in the initial post-impoundment period (1977–1983) but on average was within guidelines prior to CRD, during construction, and post-1984. Similarly, monitoring conducted by DFO suggests a possible temporary increase in TP occurred in Area 6 during the impoundment and/or immediate post-impoundment period (Figure 5.2.8A-9). Williamson and Ralley (1993) suggested that the temporary rise followed by the decline in TP concentrations in Area 6 were likely due to decreased effects of erosion over time.
As there are no reliable TN data from the MCWS dataset prior to CRD (see Section 5.2.1.4.2 for details), a pre- vs. post-CRD comparison cannot be undertaken for this dataset (Figure 5.2.8A-10). Qualitative review of data collected by DFO indicate TN concentrations temporarily increased during the impoundment period in SIL Area 4 but were similar to pre-CRD conditions during the immediate post-impoundment period (Figure 5.2.8A-11). Data collected under CAMP (2008–2013) are more variable than the earlier data collected by DFO, which may reflect differences in sampling sites and/or methods between the studies.
Data collected by DFO and under CAMP in SIL Area 6 indicate that TN may have increased during the impoundment period with relatively high interannual variability thereafter (Figure 5.2.8A-11). Like TP, concentrations of nitrogen measured at the MCWS site in Area 6 have been similar to those measured at a site upstream in the Granville Lake area over the post-impoundment period (Figure 5.2.8A-10). This observation suggests the primary influence on TN concentrations in this area has been the Churchill River inflow since diversion.
REGIONAL CUMULATIVE EFFECTS ASSESSMENT – PHASE II WATER – WATER QUALITY
DECEMBER 2015 5.2-135
Examination of nutrient data for other areas of SIL (i.e., Areas 1 to 3, 5, and 7), which were monitored during the DFO studies (Area 1 is also monitored under CAMP), indicates that TP temporarily increased in Areas 1 and 2 during the impoundment period but was relatively consistent in Areas 3, 5, and 7 over the period of record (Figure 5.2.8A-9). Similarly, although data are more limited, TN appears to have increased temporarily in Areas 1 to 3 (Figure 5.2.8A-11).
Though many studies have measured nutrients and chlorophyll a in the SIL area over the last four decades, few studies have discussed effects of CRD, or general temporal changes, on these metrics, notably nutrients. Bodaly et al. (1984) reported that soluble reactive phosphorus increased in all areas of SIL over the period of 1975–1978. Williamson and Ralley (1993) reported that TP was unchanged while TKN decreased near the Missi Falls CS after 1973 (note that this analysis included the pre-CRD nitrogen data that were excluded from the RCEA for reasons discussed in Section 5.2.1.4.2). The fact that phosphorus concentrations were unchanged in the vicinity of the Missi Falls CS, but increased upstream of CRD (i.e., at Granville Lake), was believed to support the impact prediction that phosphorus would decrease on the lower Churchill River, and to a lesser extent Area 4 of SIL, due to a reduction in the more nutrient-rich Churchill River flow. Conversely, TP increased during the immediate post-impoundment period (1977–1984) relative to pre-1974 concentrations at a site in Area 6 near the community of South Indian Lake (Williamson and Ralley 1993). Effects of CRD on nitrogen in Area 6 were not assessed by Williamson and Ralley (1993). Several studies concluded that phytoplankton was not limited by phosphorus or nitrogen after CRD (Hecky and Guildford 1984), but changes in concentrations of nutrients in lake surface water were not discussed.
Regardless of the direction or magnitude of changes in TP over time, concentrations have generally remained within the Manitoba narrative nutrient guideline (0.025 mg/L) for lakes and reservoirs since 1972 in all areas of SIL and in Opachuanau Lake. The primary exception includes the impoundment and immediate post impoundment/diversion period where TP frequently exceeded the guideline in at least some areas of SIL. Recent monitoring data indicate that exceedances continue to occur in the lake on occasion, which is similar to what is observed upstream in the Granville Lake area.
Trophic status of Opachuanau Lake and Areas 1 to 7 of SIL based on TP has also remained relatively consistent over the period of record, generally fluctuating between mesotrophic to meso-eutrophic status (Figures 5.2.8A-8 and 5.2.8A-12). TN concentrations have been indicative of oligotrophic to mesotrophic status in both lakes over this same period (Figure 5.2.8A-10).
Effects of CRD on chlorophyll a, as well as general delineation of temporal trends, are more difficult to discern due to potential confounding issues associated with variability in sampling periods, frequencies, sites, and/or sampling methods. The MCWS datasets for Area 4 (Missi Falls CS site) and Area 6 (site near the community of South Indian Lake) are inadequate to assess changes pre- vs. post-CRD (Figure 5.2.8A-13). There are only two measurements for the pre-CRD period for the Area 4 site and no pre-CRD data for the Area 6 site.
The primary limitation associated with the DFO chlorophyll a dataset relates to differences in sampling methods and, to a lesser extent, differences in sites, timing and frequency of sampling (e.g., in some years sampling was conducted over the period of June-October while in other years sampling was largely, or only, conducted in July and/or August). To attempt to isolate potential issues associated with

REGIONAL CUMULATIVE EFFECTS ASSESSMENT – PHASE II WATER – WATER QUALITY
DECEMBER 2015 5.2-136
different sampling times (i.e., seasonality of chlorophyll a), data were also evaluated for three time periods: June-October; July-August; and August. Standardizing the data for sampling methods, however, was not possible due the degree of inconsistencies and/or lack of documentation of sampling methods. Water samples were sometimes collected at discrete depths, while at other times they were collected as depth-integrated samples. In addition, the actual depths sampled using both methods varied over time. These differences may substantively affect measurements of chlorophyll a as phytoplankton densities may vary across the water column (e.g., due to depth of the euphotic zone, motility, buoyancy etc.). Given this caveat, comparisons of chlorophyll a data collected by DFO in SIL among time periods is associated with some uncertainty.
Notwithstanding this uncertainty, considering data collected for the period of June-October by DFO and under CAMP, there is qualitative evidence of temporal trends in chlorophyll a for some areas of SIL (Figure 5.2.8A-14). Areas 1 to 4 appear to show a weak negative trend (i.e., decreases over the period of record), while Opachuanau Lake and Areas 5 and 6 appear to have relatively consistent concentrations of chlorophyll a. Data for Area 7 are inadequate to determine temporal changes. Data collected in July-August and August only generally indicate the same trends, or lack thereof (Figures 5.2.8A-15 through 5.2.8A-22). In fact, these temporally reduced datasets more strongly indicate a decreasing trend, or at a minimum decreases post-CRD, in chlorophyll a concentrations in Areas 2 to 4.
These observations generally concur with the literature in which changes in chlorophyll a are discussed. Patalas and Salki (1984) indicated that chlorophyll a concentrations decreased in Areas 2, 3, and 4, were relatively unchanged in Opachuanau Lake and Areas 5 and 6, and were moderately lower in Areas 1 and 7 when comparing pre-CRD (1972) to post-CRD (1977–1980) data. Salki et al. (1999) collected limnological data in SIL in 1998 at many of the stations sampled between 1972 and 1988 and reported on changes since impoundment and diversion. The authors noted that average chlorophyll a concentrations in the northern regions of SIL (i.e., Areas 3 to 5) between 1977 and 1998 were 31.1% lower than the “pre-diversion mean (1972–1975) of 5.31 µg/L”, likely due to reduced input of both nutrients and heat (i.e., due to reduced influence of the warmer Churchill River water) with CRD.
Other studies (e.g., Bodaly et al. 1984; Hecky and Guildford 1984) have been conducted in Southern Indian and Opachuanau lakes in which primary productivity was measured using different methods and indicators (e.g., algal biomass or integral primary production) and the conclusions of these studies vary somewhat from those based on chlorophyll a as the indicator. For example, Bodaly et al. (1984) reported that integral primary production was unchanged in Areas 1 to 4 but increased in Areas 5 and 6 (effects on Area 7 were not reported). Hecky and Guildford (1984) reported that although each area of the lake responded differently following flooding, on average, integral primary productivity was relatively unchanged by impoundment; however, these authors defined the pre-impoundment period as 1974–1975, when impoundment had already been initiated. Therefore, the results of this study more accurately indicate no substantive changes between the impoundment (1974–1975) and post-impoundment/diversion period (1976–1978). Studies by Guildford (1985) suggested that this was due to the combined effects of decreased light (resulting from increased suspended sediments water column depth), and increased phosphorus loading from flooded moss-peat material. Hecky and Guildford (1984) reported that in most areas of the lake, phosphorus increased sufficiently to eliminate the phosphorus deficiency observed in the lake prior to CRD. Other researchers have noted that primary productivity was
REGIONAL CUMULATIVE EFFECTS ASSESSMENT – PHASE II WATER – WATER QUALITY
DECEMBER 2015 5.2-137
limited by light (i.e., due to increased turbidity) after CRD (e.g., Bodaly et al. 1984; Salki et al. 1999) and some reports indicate light-limitation also occurred prior to CRD (Hecky and Ayles 1974a).
Regardless of potential temporal changes, chlorophyll a concentrations indicate that Opachuanau and Southern Indian lakes have been typically mesotrophic over the period of record and, therefore, that CRD did not result in a fundamental shift in trophic status (Figures 5.2.8A-13 and 5.2.8A-14).
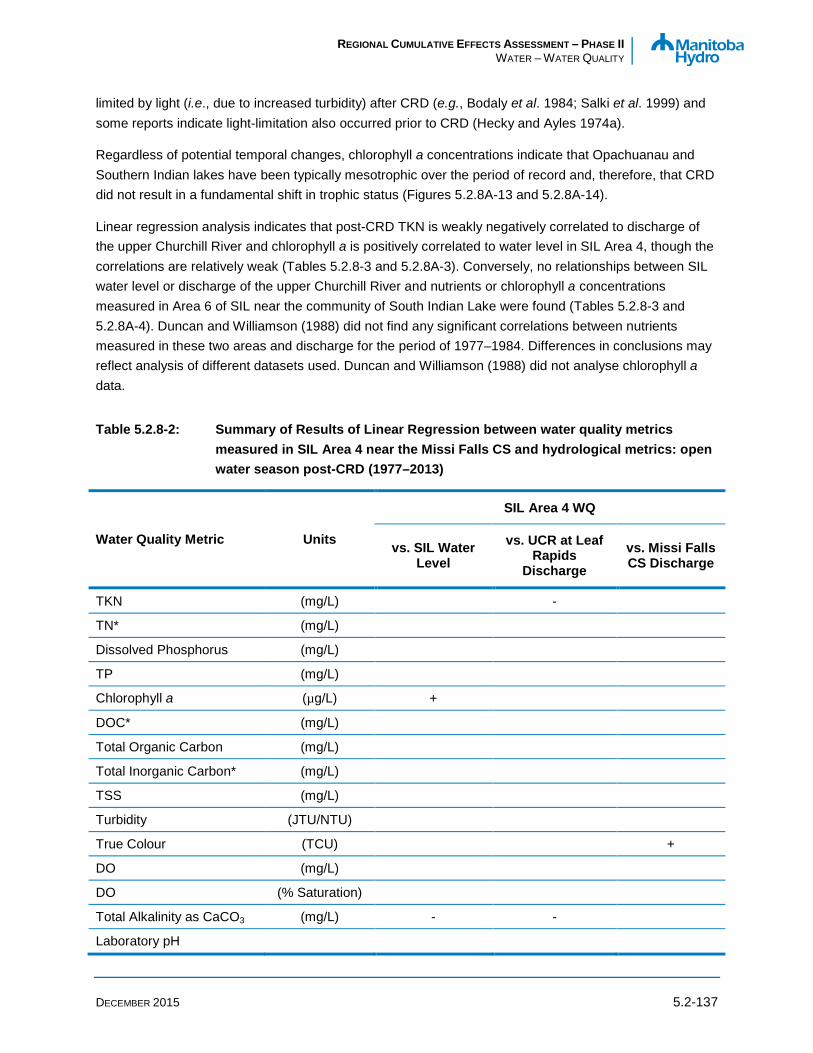
Linear regression analysis indicates that post-CRD TKN is weakly negatively correlated to discharge of the upper Churchill River and chlorophyll a is positively correlated to water level in SIL Area 4, though the correlations are relatively weak (Tables 5.2.8-3 and 5.2.8A-3). Conversely, no relationships between SIL water level or discharge of the upper Churchill River and nutrients or chlorophyll a concentrations measured in Area 6 of SIL near the community of South Indian Lake were found (Tables 5.2.8-3 and 5.2.8A-4). Duncan and Williamson (1988) did not find any significant correlations between nutrients measured in these two areas and discharge for the period of 1977–1984. Differences in conclusions may reflect analysis of different datasets used. Duncan and Williamson (1988) did not analyse chlorophyll a data.
Table 5.2.8-2: Summary of Results of Linear Regression between water quality metrics measured in SIL Area 4 near the Missi Falls CS and hydrological metrics: open water season post-CRD (1977–2013)
Water Quality Metric Units
SIL Area 4 WQ
vs. SIL Water Level
vs. UCR at Leaf Rapids
Discharge vs. Missi Falls CS Discharge
TKN (mg/L)
-
TN* (mg/L)
Dissolved Phosphorus (mg/L)
TP (mg/L)
Chlorophyll a (µg/L) +
DOC* (mg/L)
Total Organic Carbon (mg/L)
Total Inorganic Carbon* (mg/L)
TSS (mg/L)
Turbidity (JTU/NTU)
True Colour (TCU)
+
DO (mg/L)
DO (% Saturation)
Total Alkalinity as CaCO3 (mg/L) - -
Laboratory pH

REGIONAL CUMULATIVE EFFECTS ASSESSMENT – PHASE II WATER – WATER QUALITY
DECEMBER 2015 5.2-138
Table 5.2.8-2: Summary of Results of Linear Regression between water quality metrics measured in SIL Area 4 near the Missi Falls CS and hydrological metrics: open water season post-CRD (1977–2013)
Water Quality Metric Units
SIL Area 4 WQ
vs. SIL Water Level
vs. UCR at Leaf Rapids
Discharge vs. Missi Falls CS Discharge
Laboratory Specific conductance (µS/cm) - - -
Total Dissolved Solids* (mg/L) -
-
Hardness as CaCO3 (mg/L) - - -
Calcium (mg/L) - - -
Chloride (mg/L)
Magnesium (mg/L) - - -
Potassium* (mg/L) - - -
Sodium* (mg/L)
+
Sulphate (mg/L) + + +
Notes: Significant relationships are shown as + or – to denote direction of relationship. * Metric not normally distributed (raw or log-transformed) and regression analysis results may not be reliable. WQ = water quality; UCR = Upper Churchill River at Leaf Rapids; SIL = Southern Indian Lake; ID = Insufficient Data for Analysis; DO = dissolved oxygen; TSS = total suspended solids: CaCO3 = calcium carbonate; TP = total phosphorus; TKN = total Kjeldahl nitrogen; TN = total nitrogen; DOC = dissolved organic carbon.
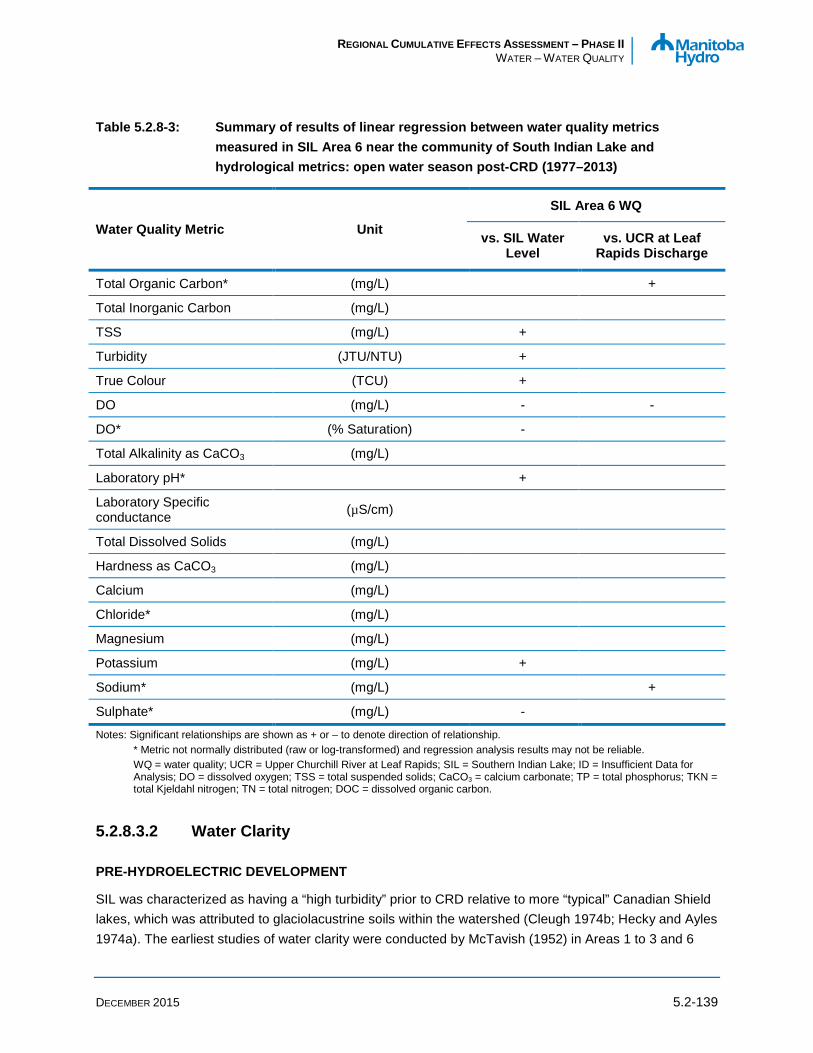
Table 5.2.8-3: Summary of results of linear regression between water quality metrics measured in SIL Area 6 near the community of South Indian Lake and hydrological metrics: open water season post-CRD (1977–2013)
Water Quality Metric Unit
SIL Area 6 WQ
vs. SIL Water Level
vs. UCR at Leaf Rapids Discharge
TKN* (mg/L)
TN* (mg/L)
Dissolved Phosphorus (mg/L)
TP (mg/L)
Chlorophyll a (µg/L)
DOC (mg/L) ID ID
REGIONAL CUMULATIVE EFFECTS ASSESSMENT – PHASE II WATER – WATER QUALITY
DECEMBER 2015 5.2-139
Table 5.2.8-3: Summary of results of linear regression between water quality metrics measured in SIL Area 6 near the community of South Indian Lake and hydrological metrics: open water season post-CRD (1977–2013)
Water Quality Metric Unit
SIL Area 6 WQ
vs. SIL Water Level
vs. UCR at Leaf Rapids Discharge
Total Organic Carbon* (mg/L)
+
Total Inorganic Carbon (mg/L)
TSS (mg/L) +
Turbidity (JTU/NTU) +
True Colour (TCU) +
DO (mg/L) - -
DO* (% Saturation) -
Total Alkalinity as CaCO3 (mg/L)
Laboratory pH*
+
Laboratory Specific conductance (µS/cm)
Total Dissolved Solids (mg/L)
Hardness as CaCO3 (mg/L)
Calcium (mg/L)
Chloride* (mg/L)
Magnesium (mg/L)
Potassium (mg/L) +
Sodium* (mg/L)
+
Sulphate* (mg/L) -
Notes: Significant relationships are shown as + or – to denote direction of relationship. * Metric not normally distributed (raw or log-transformed) and regression analysis results may not be reliable. WQ = water quality; UCR = Upper Churchill River at Leaf Rapids; SIL = Southern Indian Lake; ID = Insufficient Data for Analysis; DO = dissolved oxygen; TSS = total suspended solids; CaCO3 = calcium carbonate; TP = total phosphorus; TKN = total Kjeldahl nitrogen; TN = total nitrogen; DOC = dissolved organic carbon.
5.2.8.3.2 Water Clarity
PRE-HYDROELECTRIC DEVELOPMENT
SIL was characterized as having a “high turbidity” prior to CRD relative to more “typical” Canadian Shield lakes, which was attributed to glaciolacustrine soils within the watershed (Cleugh 1974b; Hecky and Ayles 1974a). The earliest studies of water clarity were conducted by McTavish (1952) in Areas 1 to 3 and 6
REGIONAL CUMULATIVE EFFECTS ASSESSMENT – PHASE II WATER – WATER QUALITY
DECEMBER 2015 5.2-140
over the period of May/June 1952. Average Secchi disk depths were highest in Area 1 and lowest in Area 6 (Figure 5.2.8A-23).
Conversely, later studies of water clarity (1972–1973), which included other areas of the lake and multiple sampling periods, showed that Secchi disk depth generally increased along the flow path of the Churchill River, culminating in greater water clarity in Area 4 (Hecky and Ayles 1974a; Figure 5.2.8A-23). This was attributed to settling of suspended materials along the flow path of the Churchill River (Hecky 1974; Hecky and Ayles 1974a). Area 6 (South Bay) was more turbid than other areas of the lake (Hecky and Ayles 1974a), which has been attributed to shoreline erosion and a tendency for wind-induced resuspension of sediments (Hecky 1974). In much of the lake, water clarity was limiting to phytoplankton prior to CRD (Hecky and Ayles 1974a). Relative to the 1952 study, water clarity was lower in Areas 1 to 3 but similar in Area 6 in 1972–1973.
Patterns of water clarity are more difficult to discern based on TSS data; data collected in 1972 by the LWCNRSB indicate relatively similar conditions in Opachuanau Lake and Areas 1 to 6 of SIL, though the lowest mean occurred in Area 4 which is consistent with observations of water clarity based on Secchi disk depths (Figure 5.2.8A-24).
Turbidity was measured in 1972 and 1973 at the MCWS long-term monitoring sites (Figure 5.2.8A-25). Similar to Secchi disk depth, Area 6 was more turbid than Area 4 prior to impoundment of SIL. A Landsat image taken in 1973 illustrates the higher turbidity of South Bay (Figure 5.2.8A-26).
POST-HYDROELECTRIC DEVELOPMENT
Analysis of long-term MCWS monitoring data indicated a temporary increase in turbidity at a site near the Missi Falls CS (i.e., Area 4) and at a site near the community of South Indian Lake (i.e., Area 6; Playle and Williamson 1986; Playle et al. 1988; Williamson and Ralley 1993). The latter study concluded turbidity increased during the initial years of CRD operation (i.e., 1977–1980 near the Missi Falls CS and 1977–1984 near the South Indian Lake community) but declined to pre-CRD levels thereafter (i.e., 1987–1989 at the Missi Falls CS and 1987–1992 at the South Indian Lake community). Effects were attributed to increased shoreline erosion following impoundment and subsequent reductions in erosion rates.
Reassessment of these MCWS data yielded some different conclusions (Figure 5.2.8A-25). Specifically, the reanalysis did not indicate that turbidity temporarily increased in the vicinity of the Missi Falls CS but did indicate a temporary increase at the site near the South Indian Lake community during the initial operation period. The de novo analysis, which also examined changes in turbidity after 1992 when the last assessment was completed, indicate that turbidity was significantly higher in the period of 1993–2013 at both sites relative to pre-CRD conditions. However, significantly higher levels of turbidity were also observed for an upstream site in the Granville Lake area over this same period, though the magnitude of the increase was smaller, indicating that changes in the inflowing Churchill River may in part have contributed to the observed increase in SIL over this period. Discrepancies between results of previous assessments and the results of the present study may reflect differences in data sets used.

REGIONAL CUMULATIVE EFFECTS ASSESSMENT – PHASE II WATER – WATER QUALITY
DECEMBER 2015 5.2-141
TSS data collected at the MCWS sites were inadequate to statistically assess changes before and after CRD (Figure 5.2.8A-27). However, qualitative examination of TSS data for the Missi Falls CS site indicates TSS increased during the impoundment and immediate post-impoundment/diversion period.
Data collected by DFO indicates TSS increased in SIL Areas 1 to 4 and 6 post-diversion/impoundment (Figure 5.2.8A-28). As discussed in Section 4.4.2.4 (Erosion and Sedimentation), large fetches and the prevalence of permafrost-affected lacustrine silt and clay shorelines in the northern part of the lake resulted in severe erosion in Areas 3 and 4, and to a lesser extent in Area 6 (South Bay). Recent data (2008–2013) collected under CAMP in Opachuanau Lake and SIL Areas 1, 4, and 6 indicate TSS concentrations similar to1972 conditions (Figures 5.2.8A-24 and 5.2.8A-28).
Secchi disk depths increased in 1974 during the impoundment period in Areas 2 to 6 and then decreased relatively abruptly post-diversion in each of these areas excepting Area 5 (Figure 5.2.8A-29). There are insufficient data to assess changes in Areas 0, 1, and 7 associated with CRD. Recent assessment of changes in erosion rates (Erosion and Sedimentation, Section 4.4.2.4.2) indicates that rates have declined since the 1980s and 1990s, which would imply decreasing effects of CRD on water clarity. Although TSS appears to be relatively similar now to pre-CRD concentrations in the lake, Secchi disk depths recently measured under CAMP indicate lower levels of water clarity in SIL Areas 1, 4, and 6 than measured in 1972 (Figure 5.2.8A-23).
The most widely reported change to water quality in SIL due to CRD, based on data collected by DFO, was a reduction in water clarity. Although SIL was reportedly “relatively untransparent” prior to CRD (Cleugh 1974b), impoundment and diversion of the Churchill River increased shoreline erosion and subsequently turbidity and TSS in the lake (Bodaly et al. 1984; Newbury et al. 1984; Hecky 1984; Hecky and Newbury 1977; Hecky et al. 1987a, b; Hecky and McCullough 1984 a, b; Patalas and Salki 1984). However, effects of CRD on TSS and water clarity varied spatially across the regions of the lake. Patalas and Salki (1984) reported that water transparency (measured as Secchi disk depth) was most affected in SIL Area 4 and least affected in SIL Area 5 in the initial years post-impoundment (i.e., 1977–1980), though decreases were also observed in all areas of the lake. Similarly, Bodaly et al. (1984) reported that “suspended sediment concentrations rose dramatically in regions 1, 2, 3, 4, and 6”, with the greatest increases in Area 4 immediately following impoundment: “No substantial increases occurred in regions 5 and 7” due to shoreline characteristics and/or low wave energies.” Hecky and Newbury (1977) reported that euphotic zone depth was “dramatically” reduced in Areas 2, 4, and 6 in 1976, relative to the four years prior to that time. Landsat imagery collected prior to, during, and following impoundment and diversion of SIL provides a visual depiction of increases in turbidity across the lake over the period of 1972 to 1978 (Figure 5.2.8A-26).
Salki et al. (1999) recently summarized effects to water chemistry and limnology in SIL over the period of scientific study by DFO (up to 1998). The authors indicated that water transparency was reduced by CRD in the southern regions of the lake and stated that, with the exception of 1984, levels had not recovered to pre-CRD conditions. They further indicated that water transparency was initially reduced in the northern region of the lake (i.e., Areas 3 and 4) but levels had recovered to near pre-CRD conditions in the 1980s. Salki et al. (1999) indicated a relationship between water transparency and water levels and flows in SIL; specifically that during high flow/water level years, greater shoreline erosion coupled with higher loadings of sediment from the Churchill River leads to a reduction in water transparency in the southern areas of
REGIONAL CUMULATIVE EFFECTS ASSESSMENT – PHASE II WATER – WATER QUALITY
DECEMBER 2015 5.2-142
the lake. However, they suggested that effects in northern areas would be a function of not only water levels and inflows, but also operation of the Missi Falls CS.
Linear regression analysis exploring relationships between water clarity metrics and hydrological metrics at two sites in SIL (Area 4 and Area 6) for the post-CRD period indicated some significant, though weak, correlations. TSS and turbidity in SIL Area 6 are positively correlated to SIL water level but not discharge of the upper Churchill River (Tables 5.2.8-3 and 5.2.8A-4). No significant relationships were found for water clarity and hydrological metrics in SIL Area 4 (Tables 5.2.8-2 and 5.2.8A-3). Duncan and Williamson (1988) found no relationships between these water clarity metrics and discharge for the same two sites (water level was not examined).
5.2.8.3.3 Dissolved Oxygen
PRE-HYDROELECTRIC DEVELOPMENT
SIL did not stratify prior to CRD in the open water season (Cleugh 1974b; Hecky and Ayles 1974a; Hecky 1975; McTavish 1952) due to the lake’s shallow depth and long fetch, excepting in small isolated bays (Hecky and Ayles 1974a).
The only pre-CRD temperature profile measurements collected under ice are for the winter of 1972/1973, as reported in Cleugh (1974b). With the exception of data for a site in Area 6 (Site 60), data as presented in Cleugh (1974b) are inadequate to determine if thermal stratification occurred in the lake at that time (defined here as a change of 1 °C or more across 1 m of water). However, temperatures reported near the bottom of the water column were higher than near the surface at each of the sites sampled in Areas 1 to 6, which suggests potential stratification. Data for Site 60 indicates thermal stratification occurred in the winter of 1972/1973 in South Bay.
Southern Indian Lake was well-oxygenated in the open water season prior to CRD owing to the lack of thermal stratification, low primary productivity, and low water residence times (Hecky and Ayles 1974a; Figures 5.2.8A-30 and 5.2.8A-31). The large surface area and limited depth of the lake allowed for efficient wind mixing, except in small isolated bays (Hecky and Ayles 1974a).
DO was high in the lake in the spring of 1952 and consistently above the PAL objectives for cool and cold-water aquatic life across the water column (Figure 5.2.8A-30). The lake was also well-oxygenated and above PAL objectives in 1972 at most locations and times (Figures 5.2.8A-31 and 5.2.8A-32). The exception occurred in the winter of 1972/1973 in South Bay (site 60) where DO was below the most stringent PAL objective (9.5 mg/L) for cold-water aquatic life at depth (Figure 5.2.8A-32); as noted above, this site was thermally stratified during this sampling event.
POST-HYDROELECTRIC DEVELOPMENT
Available information indicates that thermal stratification typically did not develop following CRD in SIL. Bodaly et al. (1984) reported that some differences in temperature were observed across the water column but “no persistent stable stratification was observed before or after impoundment.” Hecky et al. (1987b) indicated that “some thermal stratification” was observed in particularly calm, warm summers

REGIONAL CUMULATIVE EFFECTS ASSESSMENT – PHASE II WATER – WATER QUALITY
DECEMBER 2015 5.2-143
post-CRD. Data collected under CAMP, which include temperature depth profiles, indicate that sites located near the centres of Areas 1, 4, and 6 in SIL occasionally thermally stratify in the open water season, notably in Area 4 (Table 5.2.8A-5). Conversely, Opachuanau Lake was not stratified when sampled in 2011/2012 and thermal stratification was only observed upstream in Granville Lake over the period of 2008–2013 in spring of 2008.
Several authors reported that CRD resulted in a reduction in water temperature in all regions of the lake. This occurrence was attributed to increased mean depth, river diversion, increased surface reflectance, and backscattering of incident solar radiation from the turbidity of the water (Bodaly et al. 1984; Hecky 1984; Patalas and Salki 1984). In the northern areas of SIL, the ice cover season was prolonged due to the reduction in riverine heat following diversion (Hecky 1984). In contrast, Giberson et al. (1991) reported that reduced water temperatures in SIL immediately following diversion were due to a combination of CRD and atypically cold years.
Few reports have presented information on effects of CRD on DO in this area; however, available literature indicates effects were negligible. Hecky et al. (1984) indicated that there was “no significant deoxygenation in SIL” post-CRD. Similarly, Hecky et al. (1987a, b) reported that DO concentrations were at or near saturation over the period of 1972–1981 in Areas 4 and 6 and that “impoundment had no detectable effect on oxygen saturation in Southern Indian Lake…” The authors suggested that the lake remained well-oxygenated following impoundment due to the large lake volume and fetches, which promoted mixing.
Data collected near the Missi Falls CS and the community of South Indian Lake (i.e., MCWS data set) indicate that near-surface DO concentrations have been largely above the Manitoba water quality objectives for PAL in the open water season since 1975 (Figure 5.2.8A-33). Three lower DO values, each below the PAL objective for cold-water aquatic life and two below the objective for cool-water aquatic life, were measured in the open water season of 2009 near the community of South Indian Lake (i.e., Area 6). DO has also occasionally been below objectives for cold-water aquatic life upstream in the Granville Lake area. Data collected by DFO and under CAMP also indicate that concentrations have been high across depth in Areas 1, 2, 4, 5 to 6 of the lake since 1972 (Figure 5.2.8A-31). However several measurements of DO (both from 1983 in Areas 1 and 2) indicate oxygen decreased across the water column, with concentrations near the sediments below Manitoba water quality objectives for PAL. The lowest bottom DO measurements recorded occurred in August 1983 and 1984. The lake was thermally stratified during those sampling periods (Figure 5.2.8A-34) – a condition that commonly causes or contributes to oxygen issues in the lower portion of the water column in lakes.
Although there are fewer data for the winter period, MCWS data indicate that near-surface DO concentrations have on occasion been marginally below the PAL objective for cold-water aquatic life, but within the PAL objective for cool-water aquatic life, in Area 6 in winter (Figure 5.2.8A-35). Data collected by DFO also indicate that the upper portion of the water column remained highly oxygenated in winter following CRD (Figure 5.2.8A-32). However, DO concentrations below the PAL objectives for cool-water and/or cold-water aquatic life were observed near the bottom of the water column in Areas 2, 4, 5, and 6 on occasion following impoundment and diversion. These observations suggest that CRD may have caused or contributed to lower oxygen concentrations in winter. Depth profiles measured under CAMP in
REGIONAL CUMULATIVE EFFECTS ASSESSMENT – PHASE II WATER – WATER QUALITY
DECEMBER 2015 5.2-144
Opachuanau Lake and Areas 1, 4, and 6 of SIL indicate that DO has been consistently above Manitoba PAL objectives since monitoring began in 2008 (Table 5.2.8A-5).
Linear regression analysis exploring relationships between DO and hydrological metrics at two sites in SIL (Area 4 and Area 6) for the post-CRD period indicated some significant, though weak, correlations. The concentration of DO is negatively correlated to water level and discharge of the upper Churchill River and percent saturation is negatively correlated to SIL water level in SIL Area 6 (Tables 5.2.8-3 and 5.2.8A-4). No significant correlations were found for Area 4 (Tables 5.2.8-2 and 5.2.8A-3).
5.2.8.3.4 pH, Alkalinity, Hardness, and Specific Conductance
PRE-HYDROELECTRIC DEVELOPMENT
The upper Churchill River had lower levels of specific conductance than many of the local tributaries to SIL prior to CRD (Cleugh 1974b). This difference was manifest as higher specific conductance in Area 6, which was largely isolated from the Churchill River inflow prior to impoundment and diversion (Figure 5.2.8A-36).
Similarly, pH (Figure 5.2.8A-37) and hardness (Figure 5.2.8A-38) were higher in Area 6 prior to impoundment of SIL, though pH was consistently within the PAL guideline range (6.5–9) throughout the lake. Opachuanau Lake and Areas 1 to 5 and 7 of SIL were soft prior to CRD whereas Area 6 was moderately soft/hard.
POST-HYDROELECTRIC DEVELOPMENT
CRD affected specific conductance, alkalinity, and hardness in opposing directions in Areas 4 and 6 of SIL. Area 4, which was largely influenced by the Churchill River inflow prior to CRD, experienced an increase in specific conductance (Figures 5.2.8A-39 and 5.2.8A-40), hardness (Figures 5.2.8A-41 and 5.2.8A-42) and alkalinity (Figure 5.2.8A-43) due to the reduced influence of the river. Conversely, Area 6, which was largely isolated from the Churchill River prior to CRD, experienced a decrease in specific conductance, alkalinity and hardness. Specific conductance, alkalinity and hardness in Area 6 have generally reflected the conditions in the Churchill River upstream of the lake since diversion. Effects in other areas of SIL and in Opachuanau Lake are more difficult to discern due to limitations in the data. However, available data indicate there may have been a slight, temporary increase in hardness in Areas 1 and 2 during the impoundment period (Figure 5.2.8A-42).
pH in Areas 4 and 6 of SIL was largely unaffected by CRD as evidenced by similar conditions during and immediately following impoundment (Figure 5.2.8A-44), although more recent changes have been observed in both areas. Available data for the remaining areas of SIL and Opachuanau Lake are relatively limited but do not indicate substantive changes or trends (Figure 5.2.8A-45). pH has consistently remained within the Manitoba PAL guideline range (6.5–9) over the period of record indicating that any effects of CRD did not result in conditions that are potentially harmful to aquatic life.
These observations are in general agreement with the available literature, including the results of a temporal assessment conducted by Williamson and Ralley (1993). Williamson and Ralley (1993) noted

REGIONAL CUMULATIVE EFFECTS ASSESSMENT – PHASE II WATER – WATER QUALITY
DECEMBER 2015 5.2-145
that decreases in major ions and related variables in Area 6 were “probably a direct result of flow of the diverted Churchill River past this previously relatively protected site.” While specific conductance, hardness, pH and alkalinity were measured during the DFO studies conducted on SIL, these data have not been formally assessed in previous publications.
Linear regression analysis exploring relationships between these water quality metrics and hydrological metrics at two sites in SIL (Area 4 and Area 6) indicated some significant, though weak, correlations for the post-CRD period, notably for SIL Area 4. Specific conductance and hardness in SIL Area 4 are negatively correlated to SIL water level, discharge of the upper Churchill River, and discharge at the Missi Falls CS (Tables 5.2.8-2 and 5.2.8A-3). Total alkalinity is also negatively correlated to SIL water level and discharge of the upper Churchill River. These observations likely reflect the greater influence of the upper Churchill River on water quality in SIL Area 4 under periods of high discharge. Conversely, only pH was significantly correlated (positive relationship) with water level for SIL Area 6 (Tables 5.2.8-3 and 5.2.8A-4).
5.2.8.3.5 Major Ions
PRE-HYDROELECTRIC DEVELOPMENT
Prior to CRD, dominant cations in the upper Churchill River and SIL were calcium followed by magnesium. However, the upper Churchill River contained lower concentrations of both calcium and magnesium, and higher concentrations of sodium and potassium, than local tributaries to SIL prior to CRD (Hecky and Ayles 1974a). These differences resulted in spatial heterogeneity in cation concentrations across the lake. Prior to CRD, Areas 5, 6, and 7 were most isolated from the flow of the Churchill River and the local water quality conditions more closely resembled local inflows (Hecky and Ayles 1974a). This was manifest as lower concentrations of potassium (Figure 5.2.8A-46) and sodium (Figure 5.2.8A-47) in Areas 5 to 7 than Areas 1 to 4. Area 6, which differed in many aspects from other areas of the lake prior to CRD, also exhibited notably higher concentrations of calcium (Figure 5.2.8A-48) and magnesium (Figure 5.2.8A-49) than all other areas of the lake. As discussed in Section 5.2.8.3.4, the higher concentrations of calcium and magnesium in Area 6 were reflected as higher levels of hardness.
Sulphate (Figure 5.2.8A-50) and chloride (Figure 5.2.8A-51) concentrations were low in Opachuanau and Southern Indian lakes prior to CRD. Chloride, which was generally at or near the analytical DL (1 mg/L), was well below the CCME (1999; updated to 2015) PAL guideline (120 mg/L). Sulphate was well below the BCMOE PAL guideline (126–218 mg/L; Meays and Nordin 2013). There are no Manitoba PAL guidelines for these metrics.
REGIONAL CUMULATIVE EFFECTS ASSESSMENT – PHASE II WATER – WATER QUALITY
DECEMBER 2015 5.2-146
POST-HYDROELECTRIC DEVELOPMENT
The spatial pattern of effects of CRD on major ions in SIL was similar to those observed for specific conductance and hardness. Changes in the spatial influence of the Churchill River following diversion resulted in shifts in major cation concentrations. There was a long-term (i.e., permanent) decrease in calcium (Figures 5.2.8A-52 and 5.2.8A-53) and magnesium1 (Figure 5.2.8A-54), and an increase in sodium (Figures 5.2.8A-56 and 5.2.8A-57), while potassium (Figures 5.2.8A-58 and 5.2.8A-59) was largely unchanged in Area 6 after diversion of the Churchill River. Calcium concentrations concurrently decreased in the upper Churchill River upstream of SIL post-1973 (Figure 5.2.8A-52). Major ions in Area 6 have generally reflected the conditions in the Churchill River upstream of the lake since diversion.
Conversely, calcium (Figures 5.2.8A-52 and 5.2.8A-53) and magnesium2 (Figure 5.2.8A-54) increased, while sodium (Figures 5.2.8A-56 and 5.2.8A-57) and potassium (Figures 5.2.8A-58 and 5.2.8A-59) were largely unchanged in Area 4 post-CRD. Magnesium and sodium appear to have experienced a temporary increase during the impoundment period in Areas 1, 2, and 4; data are inadequate to examine trends for Opachuanau Lake and Areas 3 and 7 of SIL.
Chloride concentrations have been low in Opachuanau and Southern Indian lakes over the period of record (1972–2013; Figures 5.2.8A-60 and 5.2.8A-61) and have been consistently below the CCME PAL guideline (120 mg/L) indicating conditions have been suitable for aquatic life since the early 1970s. Some fluctuations in sulphate concentrations have been observed in SIL (Figures 5.2.8A-62 and 5.2.8A-63) over the period of 1972–2013 but there is no evidence of notable or long-term changes when both the MCWS and DFO datasets are considered collectively. In addition, sulphate has been well below the BCMOE PAL guideline (126–309 mg/L; Meays and Nordin 2013) in Opachuanau and Southern Indian lakes over this period.
These observations are in general agreement with the available literature, including the results of a temporal assessment conducted by Williamson and Ralley (1993). Williamson and Ralley (1993) noted that decreases in major ions and related variables in Area 6 were “probably a direct result of flow of the diverted Churchill River past this previously relatively protected site.” While major ions were measured during the DFO studies conducted on SIL, these data have not been formally assessed in previous publications.
Linear regression analysis exploring relationships between these water quality metrics and hydrological metrics at two sites in SIL (Area 4 and Area 6) indicated some significant, though weak, correlations for the post-CRD period, notably for SIL Area 4. A number of major cations (calcium, magnesium, and potassium) in SIL Area 4 are negatively correlated to SIL water level, discharge of the upper Churchill River, and discharge at the Missi Falls CS (Tables 5.2.8-2 and 5.2.8A-3). Some positive correlations were
1 No data for the pre-CRD period were provided in the MCWS (2014) dataset (Figure 5.2.8A-55).
2 MCWS data for the pre-CRD period were inadequate for temporal analysis (Figure 5.2.8A-55).

REGIONAL CUMULATIVE EFFECTS ASSESSMENT – PHASE II WATER – WATER QUALITY
DECEMBER 2015 5.2-147
also observed between sulphate and sodium and hydrological metrics for this area. Like specific conductance hardness, and alkalinity, these observations for major ions likely reflect the greater influence of the upper Churchill River on water quality in SIL Area 4 under periods of high discharge. Few significant correlations were found between major ions and hydrological metrics for Area 6 (Tables 5.2.8-3 and 5.2.8A-4).
5.2.8.3.6 Metals
Few metals were measured prior to CRD in the SIL area and those measurements that were made are of limited utility due to substantive changes in analytical methods. The following provides an overview of available information regarding mercury in water and effects of hydroelectric development, as well as a brief description of recent conditions for other metals measured under CAMP.
PRE-HYDROELECTRIC DEVELOPMENT
Total mercury concentrations were measured in surface water from SIL in 1972 and 1973 (Figure 5.2.8A-64). However, all samples collected prior to 1974 were later deemed to be contaminated and of insufficient quality to be used for assessing changes over time (Rannie and Punter 1987. There are no data documenting methylmercury concentrations in water prior to CRD.
POST-HYDROELECTRIC DEVELOPMENT
Despite data limitations, existing information indicates that total mercury in water was only marginally affected by CRD, while methylmercury in water increased following CRD, as would be expected from the literature (see Section 5.2.2.3.6 for details).
Most measurements of total mercury in surface water collected between 1974 and 2013 were at or near the analytical DLs (DLs varied over time and ranged from 1 to 100 ng/L) in SIL, which precludes a rigorous analysis of temporal trends (Figure 5.2.8A-64). Typically, studies have assessed effects of CRD on mercury in water through comparisons among waterbodies, notably to an upstream waterbody (Granville Lake) which was used as a reference site. Total mercury concentrations measured in plankton, which can be used as a general indicator of abiotic conditions, collected in 1981 showed that mercury concentrations were similar between SIL and Granville Lake, as well as to those measured in uncontaminated sites in Canada and around the world (EC and DFO 1992b). These data suggest either no or negligible increases in mercury in water several years post-diversion and impoundment. Jackson (1988) also reported similar concentrations of total mercury in water from SIL, Notigi, Rat, Mynarski, and Granville lakes in 1981 (Table 5.2.8A-6) and total mercury was similar between SIL and Granville Lake in 1987 (Ramsey 1988) and 1989 (Ramsey 1990; Table 5.2.8A-6). However, studies conducted in 1989 using trace clean sampling techniques and lower DLs indicated that the earlier reported concentrations were substantially inflated due to contamination from sampling equipment (Ramsey 1991b).
More recent monitoring (2008–2013) indicates that total mercury concentrations in water are low (i.e., at or near the DL) in SIL (Figure 5.2.8A-64). All samples analysed at DLs lower than the PAL guideline (26 ng/L; MWS 2011) were below the Manitoba PAL guideline and all measurements of total
REGIONAL CUMULATIVE EFFECTS ASSESSMENT – PHASE II WATER – WATER QUALITY
DECEMBER 2015 5.2-148
mercury analysed at the lowest DL (1 ng/L or one part per trillion) were an order of magnitude below the Manitoba PAL guideline in Southern Indian and Granville lakes (Figure 5.2.8A-65).
Methylmercury data from SIL are only available after 1984 and, outside of the mercury component of FEMP completed in 1986–1989), have only been measured sporadically. In the final report for FEMP, Ramsey (1991b) stated that the nearshore flooded area of Methyl Bay (located in Area 2) in SIL had 55% higher concentrations of methylmercury compared to the reference area (i.e., Granville Lake; Table 5.2.8A-6). Conversely, methylmercury concentrations in the offshore area of this bay were similar to offshore conditions measured in Granville Lake.
Recent monitoring (2008–2013) conducted under CAMP indicates that most other metals are also within PAL objectives and guidelines in Southern Indian and Opachuanau lakes (Table 5.2.8A-5). However, aluminum (Figure 5.2.8A-66) and iron (Figure 5.2.8A-67) occasionally or consistently exceeded PAL guidelines in all of the areas monitored in SIL and Opachuanau Lake from 2008–2013. These occurrences are relatively common in Manitoba lakes and rivers and are also observed in lakes and rivers unaffected by hydroelectric development (CAMP 2014, Ramsey 1991a). Both iron and aluminum are relatively abundant elements (iron and aluminum are the third and fourth most abundant elements in the earth’s crust, respectively) and elevated concentrations occur in ‘pristine’ environments, including waterbodies in Manitoba. For example, Ramsey (1991a) concluded that high concentrations of aluminum, copper, and iron in the Burntwood (above Threepoint Lake), Footprint (above Footprint Lake), and Aiken rivers (all “natural, unregulated rivers”) were “natural”. Aluminum was also, on average, above the PAL guideline in off-system lakes including Assean (Section 5.2.6.3.6), Granville (Figure 5.2.8A-66), and Setting (Section 5.2.3.3.6) lakes and the off-system Hayes River (Section 5.2.6.3.6) over the period of 2008-2013. High concentrations of iron have also been reported across Canada and elevated aluminum concentrations have been reported for the western Canada region (CCREM 1987). Iron is currently notably lower in Area 4 of SIL than Areas 1 or 6 or upstream in Opachuanau or Granville lakes (Figure 5.2.8A-67).
In addition, occasional exceedances of the PAL objective for lead (Figure 5.2.8A-68) and guideline for selenium (Figure 5.2.8A-69) have been observed in the area, though the mean concentrations of both metals are well below the guidelines. Occasional exceedances of Manitoba PAL objectives and guidelines for metals, including lead and selenium, have been observed at numerous sites in the RCEA ROI as well as off-system sites (see Tables 5.2.6A-2 and 5.2.8A-5, CAMP 2014, KHLP 2012, and Ramsey 1991a). For example, Ramsey (1991a) concluded that high concentrations of copper in the Burntwood (above Threepoint Lake), Footprint (above Footprint Lake), and Aiken rivers (all “natural, unregulated rivers”) were “natural”.
5.2.8.4 Cumulative Effects of Hydroelectric Development on Water Quality
A number of changes in water quality have been identified in Opachuanau and Southern Indian lakes since water quality sampling first began in the early 1970s. Prior to CRD, there were distinct spatial differences in water quality in relation to the relative influence of the Churchill River flow. Water quality in the areas located along the main flow path of the river, including Opachuanau Lake and Areas 1 to 4 of
REGIONAL CUMULATIVE EFFECTS ASSESSMENT – PHASE II WATER – WATER QUALITY
DECEMBER 2015 5.2-149
SIL, largely reflected that of the dominant Churchill River inflow. Conversely, water quality in the more isolated areas of SIL, including Areas 5 to 7, differed due to the relatively smaller influence of the Churchill River and inherent differences with the local tributary water quality conditions. In particular, Area 6 (i.e., South Bay) which would receive Churchill River flow post-diversion, had lower water clarity, higher specific conductance , pH, hardness, and some cations (i.e., calcium and magnesium), and lower concentrations of other cations (i.e., potassium and sodium) than other areas of the lake.
Some of the observed changes in water quality in SIL post-CRD differed among areas due to the heterogeneity of the lake prior to CRD, coupled with the shift in the flow path of the Churchill River and changes in physical characteristics of the lake. Areas 4 and 6 were most affected, though in opposing directions, by the diversion of the Churchill River. Area 4 experienced a reduction, while Area 6 experienced an increase, in the influence of the Churchill River inflow. Effects of impoundment on shoreline erosion also differed in the various areas of the lake in relation to fetch and shoreline composition and other changes in lake characteristics.
Southern Indian Lake has been the subject of extensive and intensive study since the early 1970s and a considerable amount of water quality data have been collected over a number of decades. However, data for the pre-CRD period are relatively limited and the conclusions regarding effects of CRD on water quality reported in the literature or based on de novo analysis of available data are not always in agreement. Potential reasons for these discrepancies include differences in datasets evaluated, sampling sites, sampling methods, sampling periods and frequency, and/or analytical methods. Despite these limitations and uncertainties, some effects of CRD and/or temporal changes in water quality are evident from the available information.
Concentrations of key nutrients (nitrogen and phosphorus) changed in some areas of SIL during and/or following impoundment. Available information indicates a temporary increase in nitrogen in areas located along the main flow path of the Churchill River (Areas 1 to 4) during the construction/impoundment period. Flooding and decomposition of terrestrial organic materials, coupled with increased shoreline erosion, would have caused or contributed to increased nutrients in the lake. Following impoundment and opening of the South Bay diversion channel, nitrogen decreased in Area 4 (area near the Missi Falls CS). CRD appears to have had little to no effect on TN in Area 6.
TP did not notably change during and immediately following impoundment in SIL Area 4, but may have in fact decreased over the long-term. Conversely, TP appears to have experienced a temporary increase in Area 6 but recent concentrations are similar to pre-CRD conditions. Regardless of the direction or magnitude of changes in TP over time, concentrations have generally remained within the Manitoba narrative nutrient guideline (0.025 mg/L) for lakes and reservoirs since 1972 in all areas of SIL and in Opachuanau Lake. The primary exception includes the impoundment and immediate post-impoundment/diversion period when TP frequently exceeded the guideline in at least some areas of SIL; exceedances continue to occur on occasion in the lake though this is also observed upstream in the Granville Lake area. Trophic status of Opachuanau Lake and SIL Areas 1 to 7 based on TP has also remained relatively consistent over the period of record (including prior to CRD), having vacillated between mesotrophic to meso-eutrophic status. TN concentrations, on average, have been indicative of oligotrophic to mesotrophic status in both lakes over this same period.
REGIONAL CUMULATIVE EFFECTS ASSESSMENT – PHASE II WATER – WATER QUALITY
DECEMBER 2015 5.2-150
Conclusions regarding changes in chlorophyll a in SIL since the early 1970s vary across the literature and between datasets and effects are difficult to discern with confidence due to large variability in sampling methods and frequency of sampling. Available data indicate chlorophyll a may have decreased in Areas 1 to 4 post-CRD, while Areas 5 and 6 appear to have remained relatively unchanged. Primary productivity has been limited primarily by light in SIL since impoundment and diversion, and possibly prior to CRD. Trophic status of both lakes, based on chlorophyll a, has been typically mesotrophic over the period of record, including prior to impoundment and diversion indicating that any changes in nutrients and/or light conditions did not cause a fundamental shift in trophic status. Chlorophyll a is weakly positively correlated to water level in SIL in Area 4, while no relationship was found for Area 6. This suggests that the overall decreased influence of the upper Churchill River in Area 4 post-CRD may have caused or contributed to a reduction in chlorophyll a.
The most widely reported change to water quality in SIL due to CRD was a reduction in water clarity. Although SIL was reportedly relatively untransparent prior to CRD, impoundment and diversion of the Churchill River increased shoreline erosion and subsequently turbidity and TSS. Effects were observed in most areas of the lake (SIL Areas 1 to 4 and 6), with effects reportedly greatest in SIL Area 4. As discussed in Section 4.4.2.4.2 (Erosion and Sedimentation), large fetches and the prevalence of permafrost-affected lacustrine silt and clay shorelines in the northern part of the lake resulted in severe erosion in Areas 3 and 4, and to a lesser extent in SIL Area 6 (South Bay). A recent study indicated that there is evidence that water clarity began to improve in the northern areas of the lake (Areas 3 and 4) in the 1980s but that effects were still evident in the south up to 1998. Recent data collected in Opachuanau Lake and Areas 1, 4, and 6 of SIL under CAMP indicate lower Secchi disk depths over the period of 2008–2013 relative to 1972, suggesting water clarity effects continue to persist. Turbidity measurements collected by MCWS near the Missi Falls CS and the community of South Indian Lake also indicate significantly higher levels over the period of 1993–2013, relative to 1972–1973. This temporal increase was also observed upstream in the Granville Lake area, though to a lower magnitude, indicating that changes in the inflowing Churchill River may in part have contributed to the observed increase in SIL over this period. Conversely, TSS concentrations recently (2008–2013 period) measured under CAMP at these sites were similar to 1972 values suggesting effects of CRD on this metric may have declined. While TSS and turbidity are typically positively correlated in surface waters, differences in the spatial and temporal trends in these metrics may reflect differences in the proportion of fine materials in water (i.e. which has a greater effect on turbidity) and/or other optical characteristics of the water (e.g., colour). Recent assessment of changes in erosion rates (Erosion and Sedimentation, Section 4.4.2.4.2) indicates that rates have declined since the 1980s and 1990s in SIL. TSS and turbidity are positively correlated to SIL water level in Area 6, while no significant relationships with hydrological metrics were found for Area 4.
Dissolved oxygen was reportedly generally unaffected in Opachuanau and Southern Indian lakes, despite flooding and subsequent decomposition of terrestrial organic materials caused by CRD. The lack of a notable effect on DO has been attributed to the well-mixed conditions in, and large volume of, the lake. Although the lake was generally isothermal before and after impoundment, transient thermal stratification is occasionally observed in the open water season. Some localized effects on DO associated with flooding may have occurred over nearshore flooded habitat and/or in some summers during periods of thermal stratification during the initial years of post-impoundment. The lake was well-oxygenated before

REGIONAL CUMULATIVE EFFECTS ASSESSMENT – PHASE II WATER – WATER QUALITY
DECEMBER 2015 5.2-151
and after CRD and concentrations have, with a few exceptions, been within the Manitoba water quality objectives for PAL over the period of record. A negative relationship between water level and DO (concentrations and percent saturation) were found for the post-CRD period in Area 6, but not in Area 4.
Changes in other water quality metrics, including specific conductance, pH, hardness, and major ions have also been observed in at least some areas of SIL over approximately the last 40 years. As noted above, diversion of the Churchill River into Area 6 caused changes in a number of water quality parameters due to inherent differences in chemistry of the Churchill River and local drainages. Specific conductance, hardness, and some cations (calcium and magnesium) decreased, while sodium increased, in this area following impoundment and diversion, and these changes relative to pre-CRD conditions are permanent. Since diversion, specific conductance, hardness, and major ions in Area 6 have generally reflected the conditions in the Churchill River upstream of the lake. The opposite occurred in Area 4, where the influence of the Churchill River was reduced following diversion; in this area hardness, specific conductance, calcium and magnesium increased post-impoundment and diversion, and these changes persist today. Temporal variability in hardness, specific conductance, alkalinity, and several major cations (calcium, magnesium, and potassium) is affected by hydrological conditions; each of these variables is negatively correlated to both SIL water level and discharge of the upper Churchill River upstream of SIL. These relationships reflect the greater influence of the upper Churchill River on water quality in Area 4 during periods of high discharge.
Due to a lack of pre-CRD data, changes in total mercury and methylmercury in water related to hydroelectric development cannot be directly assessed. However, comparisons of concentrations measured in SIL and Opachuanau Lake to other waterbodies, notably the upstream Granville Lake, indicates that total mercury was either unchanged or negligibly increased in this area following impoundment. This observation is supported by the scientific literature that has established little to no effect on total mercury in water following reservoir creation. Conversely, available information for the area indicates that methylmercury concentrations increased in water post-impoundment. This observation is also supported by the scientific literature where it has been shown that flooding leads to increased methylation of mercury.
Much of the historical mercury data are either not reliable (i.e., due to sample contamination issues) or were measured with a high analytical DL precluding comparison of mercury data to current PAL guidelines. However, recent measurements made with sufficiently low DLs (2009 and 2012/2013 periods) indicate that total mercury was consistently below the PAL guideline in Southern Indian and Granville lakes, and was similar between the two waterbodies.
In general, water quality in Southern Indian and Opachuanau lakes is currently suitable for PAL. The lakes are generally well-oxygenated and pH and most metals consistently remain within PAL objectives and guidelines. Exceptions include aluminum and iron, which exceeded PAL guidelines in some or all areas of SIL over the period of 2008–2013. These occurrences are relatively common in Manitoba lakes and rivers and are also observed in lakes unaffected by hydroelectric development.

REGIONAL CUMULATIVE EFFECTS ASSESSMENT – PHASE II WATER – WATER QUALITY
DECEMBER 2015 5.2-152
5.2.9 Area 3: South Bay Diversion Channel to Notigi Control Structure
This reach of Area 3 includes the upper Rat River lakes and river reaches including Issett, Karsakuwigamak, Pemichigamau, Rat, Mynarski, and Notigi lakes (Map 5.2.9-1). CRD caused diversion of the majority of the upper Churchill River flow into the Rat/Burntwood River system and included construction of a CS at Notigi Lake. A description of the construction and operation of hydroelectric developments in the South Bay Diversion Channel to the Notigi CS reach is found in Part II Hydroelectric Development Project Description in the Region of Interest. A detailed description of effects of hydroelectric development to the water regime is provided in Chapter 4.3 (Water Regime). Key points of the project description and water regime relevant to water quality are summarized below.
Construction activities, including construction of major access roads and development of construction camps for the Notigi CS, were initiated in winter 1972/1973. Discharge from Notigi Lake was stopped over the impoundment period from May 8, 1974 to November 24, 1975. The majority of flooding caused by CRD occurred in this area. Approximately 175 sq mi (453 km2) were flooded which caused an approximate doubling of the surface area of lakes in this reach (Water Regime, Section 4.3.3.4.). The greatest flooding and increase in surface area occurred in the Issett Lake area. Based on limited data before impoundment of Notigi CS forebay, it appears that CRD increased water levels by approximately 50 ft (15.2 m) just upstream from the Notigi CS (Water Regime, Section 4.3.3.4.).
Diversion of the Churchill River was initiated in June 1976, and the cofferdam at the Notigi CS was removed on September 1976. Operation of the Notigi CS regulates both inflows to and outflows from this hydraulic zone. As part of CRD, Manitoba Hydro controls outflow through the Notigi CS, which ultimately affects the amount of water entering and flowing through this hydraulic zone. Inflows to this hydraulic zone originate mainly from SIL through the South Bay Diversion Channel (Water Regime, Section 4.3.3.4).
For the purposes of this discussion, water quality conditions measured prior to 1974 were considered as pre-hydroelectric development (i.e., pre-CRD); however, it is acknowledged that construction activities may have affected water quality in 1973 in some areas. Pre-CRD data are restricted to sampling conducted by the LWCNRSB in 1972 and 1973 (Cleugh 1974a). Water quality data measured post-1976 represent post-diversion and impoundment conditions. Quantity and comparability of data for both the impoundment and post-impoundment period vary between waterbodies. As the most complete data sources for this reach post-1974 are for Rat Lake, Mynarski Lake, and, notably, Notigi Lake, the following discussion includes a detailed analysis of raw water quality data collected from these waterbodies, as well as a summary of published literature.

Water Quality Sampling Sites Downstream of Southern Indian Lake
to Notigi Lake
Province of Manitoba, Government of Canada,North/South Consultants,Manitoba Hydro
North/South Consultants
2.0
27-APR-15 03-DEC-15
Leaf Rapids
Notigi
493
391
280
NewunetanLake
L
Nelson
Wupas
Suwannee
MynarskiLakes
River
RApekakumewsik
RatLake
PemichigamauLake
Issett LakeIsset
Island
NotigiLake
WapisuLake
Rat River
Rat R
iver
Anderson
PecheponakunL
WapisewsisWapayko
Ridge L
L
River
Worm
Karsk-1
Pemich-1
Issett-2Issett-1
Cre
ated
By:
cpa
rker
- B
Siz
e La
ndsc
ape
BTB
- M
AR
201
5
Sca
le: 1
:197
,049
Regional Cumulative Effects Assessment
NAD 1983 UTM Zone 14N
0 4 8 Miles
0 5 10 Kilometres
File
Loc
atio
n: J
:\MY
P\M
H_R
CE
A\W
ater
_Qua
lity\
PH
AS
E_2
\MX
D\R
epor
t_M
aps\
Are
a3\2
0151
203_
RC
EA
_Pha
seII_
AE
_WQ
_Wat
erQ
ualit
ySam
plin
gSite
sDS
ofS
ILto
Not
igiL
ake_
cp.m
xd
DATA SOURCE:
DATE CREATED:
CREATED BY:
VERSION NO:
REVISION DATE:
QA/QC:
COORDINATE SYSTEM:
Water Quality Sampling Sites
MYN-SE-1
MYN-SE-2
MYN-NE
MYN-NW-2
MYN-NW-1
MYN-CENT-2
MYN-CENT-1
0 2 4Kilometres
NotigiNotigi Control Structure
Notig-E-3
Notig-E-2Notig-E-1
Notig-W-4Notig-W-5
Notig-W-2Notig-W-3
Notig-W-1
0 2 4Kilometres
RatL-E
RatL-W-2
RatL-W-1
0 2 4Kilometres
Legend
DFOCAMPMEMP
MCWSLWCNRSB
Wuskwatim
Control StructureHighwayFirst Nation Reserve
0 1 2 Miles
0 1 2 Miles
0 1 2 Miles
NOTES:(DFO) Fisheries and Oceans Canada(CAMP) Coordinated Aquatic Monitoring Program(MEMP) Manitoba Ecological Monitoring Program(MCWS) Manitoba Conservation and Water Stewardship(LWCNRSB) Lake Winnipeg,Churchill and Nelson Rivers Study Board
Hudson Bay
Thompson
Churchill
Map 5.2.9-1
REGIONAL CUMULATIVE EFFECTS ASSESSMENT – PHASE II WATER – WATER QUALITY
DECEMBER 2015 5.2-154
5.2.9.1 Key Published Information The earliest studies of water quality in this area were conducted in the early 1970s, as part of the LWCNRSB environmental studies. Since that time, water quality has been periodically monitored in this area and is currently monitored under CAMP. The key water quality studies or monitoring programs conducted in this area include: • the LWCNRSB conducted water quality sampling in a number of lakes in this area including Issett,
Karsakuwigamak, Pemichigamau, Rat, Mynarski, and Notigi lakes in the early 1970s and the results of these baseline studies were presented, and effects of CRD in this area were predicted in, Hecky and Ayles (1974b), Hecky and Harper (1974), and Cleugh (1974a);
• DFO conducted additional monitoring in lakes in this area prior to and following impoundment and diversion. Some of the results of these studies are presented in Bodaly et al. (1984), Hecky et al. (1987a, b), Jackson and Hecky (1980), and Planas and Hecky (1984). Not all data collected under this program have been published;
• Vitkin and Penner (1979) presented results of TSS monitoring conducted in the area prior to and immediately following CRD (1969–1977);
• Grapentine et al. (1988) assessed changes in several water quality metrics in Karsakuwigamak, Mynarski, Rat and Notigi lakes for the period of 1973–1979;
• Northwest Hydraulic Consultants Ltd. (1987, 1988) assessed potential effects of CRD on water clarity;
• water quality was evaluated at three sites in Rat Lake in 1986 and 1987 under MEMP and results were presented and described in Ramsey et al. (1989). Results were compared to pre-CRD/LWR data collected in Rat Lake by the LWCNRSB. Additional data collected in Rat Lake in 1988–1989 under the MEMP were presented in Green (1990);
• MCWS collected water quality data from Notigi Lake in 1987–1989 (MCWS 2014); • water quality was sampled under the Wuskwatim Generation Project environmental studies program
conducted in 1999–2001 (Bezte and Kroeker 2000; Cooley and Badiou 2004a, b); • water quality is monitored on a three year rotation in Rat, Notigi, and Central Mynarski lakes under
Manitoba/Manitoba Hydro’s CAMP (initiated in 2009 in this area; CAMP 2014); and
• the results of a number of studies on mercury in water have also been published; key reports include Bodaly et al. (1987); Jackson (1988); Ramsey (1991b); EC and DFO (1992b).
5.2.9.2 New Information and/or Re-analysis of Existing Information A number of water quality studies and monitoring programs have been conducted at sites along the Rat River system from downstream of SIL up to and including Notigi Lake. The key studies include:
• the LWCNRSB studies conducted in 1972–1973;
• additional DFO studies conducted from 1974–1988; • MEMP conducted from 1986–1989;
• the Wuskwatim Generation Project environmental studies program conducted in 1999–2001; and • Manitoba/Manitoba Hydro’s CAMP initiated in 2007.

REGIONAL CUMULATIVE EFFECTS ASSESSMENT – PHASE II WATER – WATER QUALITY
DECEMBER 2015 5.2-155
Water quality data collected under these programs were collated and inventoried (Table 5.2.9A-1). A summary of data subject to detailed analysis are provided in Table 5.2.9-1.
Table 5.2.9-1: Water Quality Subject to Detailed Analysis
Waterbody Area Period of Record
Rat Lake Rat Lake West 1973, 1975, 1977, 1986–1989
Rat Lake East 1986–1989, 2010, 2013
Mynarski Lake
Mynarski Lake Central 1973, 1975, 1977, 1981, 2011
Mynarski Lake West 1981–1984
Mynarski Lake East 1977, 1981–1984
Notigi Lake Notigi Lake West 1973–1978, 1981–94, 1999–2001,
2009, 2012
Notigi Lake East 1974–1978, 1981–1983, 2009, 2012
Raw water quality data were compiled (to the extent data could be located) from various sources, integrated, and analysed to provide a description of changes over time and to provide information on recent or contemporary conditions (the most recent primary and grey literature considered data only to the 1980s). Detailed analyses of water quality data for this area included three key lakes for which there is substantive data: Mynarski, Rat, and Notigi lakes (Table 5.2.9-1). Data sources included:
• raw water quality data collected by DFO (2015); • LWCNRSB water quality data (i.e., raw data were obtained from MCWS 2014, the LWCNRSB reports
[Cleugh 1974a], and/or from DFO [2015]);
• raw data from published historical reports (Green 1990); • the MCWS electronic database, including MEMP data (raw data provided by MCWS 2014);
• Manitoba/Manitoba Hydro’s CAMP; and • data collected under various monitoring or sampling programs (e.g., Wuskwatim Generation Project
environmental studies program).
Some of the above data have been analysed and published in a variety of reports, including Cleugh (1974a), Jackson and Hecky (1980), Bodaly et al. (1984), Planas and Hecky (1984), Hecky et al. (1987a, b), Northwest Hydraulic Consultants Ltd. (1987), Ramsey et al. (1989), Cooley and Badiou (2004a, b) and CAMP (2014).
5.2.9.3 Changes in Indicators over Time Potential effects of hydroelectric development on water quality in this area include:

REGIONAL CUMULATIVE EFFECTS ASSESSMENT – PHASE II WATER – WATER QUALITY
DECEMBER 2015 5.2-156
• Flooding: Flooding potentially causes increases in nutrients, metals, and colour, and decreases in pH, DO, and water clarity. Effects of flooding typically decrease over time.
• Diversion: Diversion of the Churchill River could alter water quality conditions in relation to inherent differences between the Churchill River and the pre-existing Rat River system, as well as through changes in velocities and water residence times.
• Hydrological Changes: Changes in flows, velocities, depths, water residence times, hydrological patterns, and/or changes in the ice regime could affect water quality through changes in mixing, settling/resuspension of particulates, reaeration, and or cycling of nutrients and organic materials.
• Erosion/Sedimentation: Increased shoreline erosion due to flooding and/or changes in sedimentation due to changes in hydrology/morphology of the lake (or upstream areas). This pathway could result in increases in TSS, notably in areas of increased erosion, and/or alter rates of sedimentation where water velocities, depths, and/or residence times were affected. Effects would be expected to vary spatially in relation to shoreline characteristics, residence times, depths, and fetch.
5.2.9.3.1 Nutrients and Trophic Status
PRE-HYDROELECTRIC DEVELOPMENT
While there are limited water quality data for this reach prior to impoundment of the Notigi reservoir and diversion of the Churchill River, available data indicate that lakes were moderately nutrient-rich and concentrations were similar across the lakes in the early 1970s (Figures 5.2.9A-1 and 5.2.9A-2). Total nitrogen concentrations were, on average, near the mesotrophic and eutrophic boundary (Figure 5.2.9A-1), and TP concentrations were, on average, in the meso-eutrophic category (Figure 5.2.9A-2). There is some indication that concentrations of TP may have been lower in Notigi Lake than upstream lakes prior to CRD. Average concentrations of TP exceeded the Manitoba narrative guideline for nutrients for lakes, ponds, and reservoirs (i.e., 0.025 mg/L; Figure 5.2.9A-3). No pre-CRD TN or TP data for Issett Lake were located. However, dissolved phosphorus concentrations in Issett Lake were similar to those observed in the downstream lakes in this area (Figure 5.2.9A-4). Both TN and TP concentrations were higher in the Rat River lakes than the upper Churchill River or SIL in the early 1970s.
Like nutrients, chlorophyll a concentrations were reflective of mesotrophic conditions in the lakes prior to CRD (Figure 5.2.9A-5). The furthest upstream lakes (Issett and Karsakuwigamak lakes) had lower levels of chlorophyll a in 1972/1973.
POST-HYDROELECTRIC DEVELOPMENT
Nitrogen (Figure 5.2.9A-6) and phosphorus (Figure 5.2.9A-7) concentrations increased during the impoundment of Notigi Lake (1974–1976), which reflected effects of flooding and decomposition of terrestrial organic materials (Bodaly et al. 1984c) and increases in water residence times. Although there are no pre-impoundment data for the east basin of Notigi Lake, concentrations of both TN and TP were similar in the east and west basins during the impoundment period suggesting similar effects occurred in both areas, though concentrations were somewhat higher in the western basin. TN concentrations increased to eutrophic levels and TP concentrations increased to eutrophic to hyper-eutrophic levels in the 1974–1976 period. TP notably exceeded the Manitoba narrative nutrient guideline in both basins in

REGIONAL CUMULATIVE EFFECTS ASSESSMENT – PHASE II WATER – WATER QUALITY
DECEMBER 2015 5.2-157
1974–1976, whereas concentrations were near, but above on average, the guideline prior to impoundment (Figure 5.2.9A-8).
The increases in nutrients during the impoundment period were accompanied by increases in chlorophyll a (an indicator of algal abundance) in Notigi Lake (Figure 5.2.9A-9). Concentrations increased to the mesotrophic to eutrophic range in the western and eastern basins of the lake.
Following the impoundment period, diversion of the Churchill River into the Rat River system, and removal of the cofferdam at the Notigi CS in 1976, nutrient and chlorophyll a concentrations declined rapidly in Notigi Lake to near pre-CRD concentrations (Figures 5.2.9A-6, 5.2.9A-7, 5.2.9A-9). Hecky et al. (1987a) reported that the relatively rapid decrease in these parameters was due to the high flushing rate of the lake. Furthermore, although the release of nutrients stimulated algal growth, turnover times indicated that phosphorus was not limiting algal growth in Notigi Lake in 1976 (Planas and Hecky 1984). Comparing reservoirs of different ages, Jackson and Hecky (1980) found that the release of humic matter and subsequent binding of trace elements, such as iron, were more likely limiting algal growth than phosphorus. Concentrations have remained similar to pre-1974 levels in Notigi Lake since the initial diversion period.
Due to a lack of data, it is not possible to ascertain what changes in nutrients or chlorophyll a may have occurred during the impoundment period in Rat or Mynarski lakes. However, unlike effects observed in Notigi Lake, available data indicate that nutrients decreased in Rat Lake (Ramsey et al. 1989; Figures 5.2.9A-10, 5.2.9A-11, 5.2.9A-12) and Central Mynarski Lake (Figures 5.2.9A-13, 5.2.9A-14, 5.2.9A-15) after diversion of the Churchill River. Ramsey et al. (1989) also reported that dissolved and suspended fractions of nutrients were lower in 1986 and 1987 than 1973 in Rat Lake. Conversely, chlorophyll a was relatively similar between 1973 and 1987–1989 in the western area of Rat Lake (Figure 5.2.9A-16) and Central Mynarski Lake (Figure 5.2.9A-17), though data for both lakes are limited.
Although there are no pre-CRD data, recently measured concentrations of nutrients and chlorophyll a are relatively similar to conditions measured in the 1980s in the east basin of Rat Lake (Figures 5.2.9A-10, 5.2.9A-11, 5.2.9A-16). Since conditions were relatively similar between the east and west areas of the lake in the 1980s, this observation suggests that the decreases in nutrients observed in the west basin post-CRD are long-term.
Though pre-CRD data are limited to a site in the central basin of Mynarski Lake, some spatial differences in water quality were observed within the lake post-CRD (Figures 5.2.9A-13, 5.2.9A-14, 5.2.9A-17). The west basin was more phosphorus-rich than the other areas of the lake and both the east and west basins had higher concentrations of TN than the central basin in the 1980s. More contemporary data are lacking for the east and west basins.
5.2.9.3.2 Water Clarity
PRE-HYDROELECTRIC DEVELOPMENT
TSS and Secchi disk depth were measured in 1972–1973 as part of the LWCNRSB water quality studies conducted in this area. TSS was on average <10 mg/L in upper Rat River lakes in the open water season
REGIONAL CUMULATIVE EFFECTS ASSESSMENT – PHASE II WATER – WATER QUALITY
DECEMBER 2015 5.2-158
of 1973 (Figure 5.2.9A-18). Measurements collected from Issett Lake in the open water season of 1972 were below the analytical DL (<10 mg/L). Vitkin and Penner (1979) reported similar concentrations (range of 2–15 mg/L and an average of 7 mg/L) at various sites on the upper Rat River system prior to CRD.
Secchi disk depths indicate that water clarity was greater in Mynarski Lake than lakes directly on the flow of the Rat River prior to CRD (Figure 5.2.9A-19). Though data are limited, Secchi disk depths of the Rat River lakes (means of approximately 0.9–1.6 m) were somewhat lower than SIL (means of approximately 1.4–2.0 m). Bodaly et al. (1984) indicated that lakes on the Rat River system were “relatively turbid prior to CRD due to fine-grained glacial sediments in the drainage basin, shallow depths, low residence times, and frequent inter-connecting river reaches”.
POST-HYDROELECTRIC DEVELOPMENT
Available literature indicates that CRD reduced water transparency and increased TSS in most waterbodies along the Rat River system, notably immediately following diversion (e.g., Vitkin and Penner 1979). As discussed in Section 4.4.2.6.2 (Erosion and Sedimentation), flooding in this area caused erosion primarily of organic materials (e.g., wetlands and forests). Rates of erosion generally decreased with distance downstream of SIL, related in part to an increase of bed-rock controlled shorelines.
Vitkin and Penner (1979) reported that TSS concentrations were high in the South Bay diversion channel (approximately 20–100 mg/l) which increased concentrations downstream in Issett Lake (to approximately 20 mg/L) during the fall of 1976 when the channel was first operated. TSS was reportedly less affected downstream of Issett Lake, including sites located at the inflow to Karsakuwigamak Lake and downstream of Rat Lake. By 1977, TSS concentrations had decreased along the Rat River system but remained above pre-CRD levels; the average TSS concentration was 11 mg/L for this area in 1977–1978 (Vitkin and Penner 1979).
Other data sources for Notigi Lake indicate that TSS concentrations have remained similar to pre-impoundment concentrations over the period of record, though TSS may have decreased during the impoundment period (Figure 5.2.9A-20). The latter observation may reflect increases in water residence times, which would have allowed for higher rates of sedimentation.
Secchi disk depth data more strongly indicate that water clarity increased during and immediately following the impoundment period in Notigi Lake (Figure 5.2.9A-21). Hecky et al. (1987a, b) also reported that post-impoundment Secchi disk depths were greater than pre-impoundment values, which was attributed to low rates of shoreline erosion and sedimentation in the reservoir (Northwest Hydraulic Consultants Ltd. 1987). Secchi disk depths appear to have decreased to pre-CRD conditions by the 1980s and have remained similar since.
As described in Section 4.4.2.6.3 (Erosion and Sedimentation), Northwest Hydraulics (1987, 1988) reported that TSS concentrations in Rat Lake seemed to have remained largely unchanged pre- vs. post-development. Due to limited data, no new analysis of TSS data was undertaken for Rat Lake. Ramsey et al. (1989) found that water transparency in Rat Lake in 1986 and 1987 was lower than

REGIONAL CUMULATIVE EFFECTS ASSESSMENT – PHASE II WATER – WATER QUALITY
DECEMBER 2015 5.2-159
pre-CRD conditions. This conclusion was corroborated with addition of data not included in the previous analysis (i.e., data collected in 1988–1989), though the decrease was relatively marginal (mean in 1973 = 1.27 m and mean in 1986–1989 = 1.04 m; Figure 5.2.9A-22). Consideration of more recent data collected from the east basin of Rat Lake to measurements from the 1980s indicates Secchi disk depths remained relatively unchanged (Figure 5.2.9A-22). However, transparency in Rat Lake is lower than Notigi Lake at present (Figure 5.2.9A-23).
Water clarity data for Mynarski Lake are inadequate for an assessment of temporal changes. However, comparison of Secchi disk depths measured in 2011 to 1973 in the central area of the lake indicates clarity is similar, though possibly lower, than pre-CRD (Figure 5.2.9A-24). As it was prior to CRD, Central Mynarski Lake is currently clearer than sites on the mainstream of the Rat River (Figure 5.2.9A-23).
5.2.9.3.3 Dissolved Oxygen
PRE-HYDROELECTRIC DEVELOPMENT
Prior to CRD, diversion route lakes were isothermal during summer and well oxygenated. Some oxygen depletion occurred shortly after ice-out and in some deeper waters during winter (Cleugh 1974a). DO was measured as percent saturation in Rat River lakes in 1972–1973. DO concentrations, calculated from reported saturation values, indicated that all the lakes sampled (Karsakuwigamak, Pemichigamau, Rat, Mynarski, and Notigi lakes) were well-oxygenated in March (Figure 5.2.9A-25), July, August, and September 1973 (Figure 5.2.9A-26). Conversely, DO was low and below current PAL objectives in each of the lakes in June 1973 (Figure 5.2.9A-26). As previously noted, oxygen depletion was also documented by the LWCNRSB at multiple sites on the Churchill, Rat/Burntwood, and upper and lower Nelson rivers during this sampling period (Cleugh 1974a), suggesting that the DO data may be erroneous. The latter observation conflicts with what Bodaly et al. (1984) reported for the same data set (i.e., Cleugh 1974a data); Bodaly et al. (1984) indicated that “prior to impoundment, DO in Notigi Lake was vertically homogeneous with about 75% saturation during the winter and near saturation throughout the open water period.” No DO data for the east basin of Notigi Lake prior to initiation of impoundment could be located.
POST-HYDROELECTRIC DEVELOPMENT
Impoundment of the Notigi Lake in 1974 increased water levels and reduced flushing rates, allowing summer thermal stratification to occur in the western and eastern basins (Bodaly et al. 1984). Bodaly et al. (1984) reported that after the diversion of Churchill River water into the Rat/Burntwood River system was fully implemented, the western basin of Notigi Lake became isothermal once again, while stratification continued to occur in the eastern basin. The east basin of Notigi Lake was “relatively poorly flushed”, while the western basin was “rapidly flushed”, before and after impoundment (Bodaly et al. 1984).
Hecky et al. (1987a) reported “oxygen values were reduced well below saturation during and after the period of reservoir filling” in the east and west basins of the lake. Hecky et al. (1987) further reported that bottom waters were anoxic during the impoundment period and this effect continued “in the more poorly flushed basins even after diversion flow began to improve conditions in the mainstem of the reservoir.” In

REGIONAL CUMULATIVE EFFECTS ASSESSMENT – PHASE II WATER – WATER QUALITY
DECEMBER 2015 5.2-160
winter, the combination of thermal stratification and the presence of flooded terrestrial organic matter caused DO to decrease with depth in the eastern basin of Notigi Lake, while this combination resulted in mid-water oxygen minima in summer (Bodaly et al. 1984).
Some improvement in the severity of oxygen depletion was evident over the period of 1975–1978, though oxygen levels continued to drop to low levels (<10% saturation) in the lower water column over this period in the east basin (Bodaly et al. 1984). Data were not presented for the west basin in the latter report. Data presented in Hecky et al. (1987a, b) indicate that percent saturation of DO had generally increased to near 100% near the water surface by 1981 in both basins. However, measurements made in 1983 indicated that DO concentrations measured in Notigi Lake east (7.5 mg/L) and Notigi Lake west (7.1 mg/L), while above PAL objectives, were lower than concentrations measured during a similar time period in Areas 1, 2, 4, 5, and 6 of SIL (range of 8.0–8.6 mg/L). The authors suggested this observation was a reflection of the greater amount of flooding in Notigi Lake and that effects of impoundment on DO conditions were still evident in 1983.
Examination of raw data from various sampling programs conducted in Notigi Lake, including a subset of data collected by DFO (2015), indicates that while DO concentrations were relatively high near the water surface in both basins over the period of record, concentrations were notably lower near the bottom of the water column during some sampling periods (Figure 5.2.9A-27). Dissolved oxygen was less than 4 mg/L and therefore notably below PAL objectives, at depth on several occasions, including one sampling event in July 2000 (Notigi Lake west). Thermal stratification has been observed in both basins since the 1970s and lower DO concentrations generally coincide with these events (Figures 5.2.9A-28 and 5.2.9A-29). It is also noted that the CAMP sampling site in the east basin is in a shallower site than earlier studies and depth profile measurements did not extend to the sediment-water interface to avoid debris. Therefore, there is no recent information on DO concentrations for the greatest water depths where lower DO was observed historically.
Information on thermal stratification and DO conditions in other waterbodies along the upper Rat River system is more limited. However, thermal stratification has been recently observed during some sampling periods in the open water season in Rat Lake and Central Mynarski Lake under CAMP (Table 5.2.9A-2). In addition, low DO (<4 mg/L) has recently been observed (August 2013) at depth in the open water season in the eastern area of Rat Lake under CAMP (Figure 5.2.9A-30). This occurrence coincided with thermal stratification.
Low DO concentrations (i.e., <4 mg/L) have been observed on a number of occasions at depth and on two occasions at the surface when monitoring has been conducted in Mynarski Lake (Figures 5.2.9A-31 and 5.2.9A-32). Bottom waters have been anoxic on several occasions in this lake including in July 1983 and March 1984 in the east and west basins and nearly anoxic (DO <1 mg/L) in Central Mynarski Lake in September 2011 and East Mynarski Lake in August 1983. Thermal stratification has been observed in both the open water and ice cover seasons in this lake and low DO generally coincides with this occurrence.
There are even fewer DO data for Issett, Karsakuwigamak, and Pemichigamau lakes and information is insufficient to determine effects of CRD on DO. However sampling conducted in 1983-1984 indicates that Issett Lake was thermally stratified throughout most of the open water season and DO concentrations
REGIONAL CUMULATIVE EFFECTS ASSESSMENT – PHASE II WATER – WATER QUALITY
DECEMBER 2015 5.2-161
were below PAL objectives across the majority of the water column during most sampling events (Figure 5.2.9A-33). The single measurements (September 1976) located for Karsakuwigamak and Pemichigamau lakes post-CRD indicate that the former experienced decreases in DO across depth with concentrations falling below PAL objectives. Without more contemporary data it is not known if these lakes currently typically stratify and/or experience DO issues.
5.2.9.3.4 pH, Alkalinity, Hardness, and Specific Conductance
PRE-HYDROELECTRIC DEVELOPMENT
The Rat River lakes were somewhat alkaline (Figure 5.2.9A-34) and soft (Figure 5.2.9A-35), and specific conductance (Figure 5.2.9A-36) ranged between approximately 100–120 µmhos/cm prior to CRD (1972–1973). pH was within the PAL guidelines (6.5-9.0) in all the Rat River lakes in 1972–1973. While pH was similar to the upper Churchill River and SIL, the Rat River system was harder and had a higher specific conductance prior to CRD. Specific conductance was also slightly lower in Mynarski Lake than either Rat or Notigi lakes in 1973.
POST-HYDROELECTRIC DEVELOPMENT
pH (Figure 5.2.9A-37), hardness (Figure 5.2.9A-38), and specific conductance (Figure 5.2.9A-39) were relatively unchanged in Notigi Lake during the impoundment period. However, following diversion of the Churchill River in 1976, Notigi Lake became softer and more dilute (i.e., lower levels of specific conductance) which reflected the chemistry of the diverted Churchill River. The pH levels remained relatively unaffected in Notigi Lake after diversion and have remained with the PAL guideline range over the period of record. Initial changes in these metrics following diversion have persisted to the present day and are expected to be permanent effects related to diversion of the Churchill River, which was characterized by different chemistry than the Rat River prior to CRD.
Effects in Rat Lake over the long-term appear to be similar to Notigi Lake. pH was relatively unaffected (Figure 5.2.9A-40) and hardness decreased relative to pre-CRD conditions (Figure 5.2.9A-41). Effects on specific conductance are uncertain due to limited data though levels were similar between the 1973 and 1986–1989 period (Figure 5.2.9A-42). Given the general difference in specific conductance between the Churchill and Rat river systems prior to CRD, the Rat River lakes likely continue to experience lower levels of specific conductance than they would have in the absence of the diversion.
Conversely, though limited, available data indicate that hardness (Figure 5.2.9A-43), specific conductance (Figure 5.2.9A-44), and possibly pH (Figure 5.2.9A-45) have increased in Mynarski Lake following CRD. The lake was softer and had a lower specific conductance than Rat or Notigi lakes prior to CRD and it is now considerably harder (Figure 5.2.9A-46) and has a higher specific conductance (Figure 5.2.9A-47) than either lake as well as SIL upstream. Due to lack of data, it is not possible to identify when these recently observed changes may have begun or if these limited observations reflect natural variability. However, limited hardness data collected in 1977 and 1981 indicate only slightly higher hardness levels in 1981 relative to 1973, suggesting the increases occurred sometime post–1981. There are insufficient data to assess effects of CRD on total alkalinity.
REGIONAL CUMULATIVE EFFECTS ASSESSMENT – PHASE II WATER – WATER QUALITY
DECEMBER 2015 5.2-162
5.2.9.3.5 Major Ions
PRE-HYDROELECTRIC DEVELOPMENT
Like the upper Churchill River and SIL, dominant cations in the Rat River system prior to CRD were calcium and magnesium. Chloride was well below the CCME PAL guideline (120 mg/L; Table 5.2.9A-3) and sulphate was well below the BCMOE PAL guideline (218–309 mg/L; Meays and Nordin 2013). The Rat River had higher concentrations of calcium and magnesium and slightly lower concentrations of potassium than the upper Churchill River prior to CRD.
POST-HYDROELECTRIC DEVELOPMENT
Major cations have changed over time in Notigi Lake; some of these changes coincided with construction and operation of CRD, while others appear to be longer-term and more recent changes. Calcium (Figure 5.2.9A-48) and potassium (Figure 5.2.9A-49) increased in Notigi Lake during the impoundment period, while magnesium (Figure 5.2.9A-50) and sodium (Figure 5.2.9A-51) were relatively unchanged. Following impoundment and diversion of the Churchill River, there was a rapid decrease in calcium and magnesium due to rapid flushing of the reservoir and the influence of the Churchill River water, which differed from the Rat River prior to CRD. Sodium appears to have experienced an increasing trend over the entire period of record from 1973 to 2013 in Notigi Lake. This apparent trend is not observed upstream in Rat Lake (Figure 5.2.9A-52) or in South Bay of SIL based on the long-term MCWS data set (see Section 5.2.8.3.5). Qualitative examination of chloride (Figure 5.2.9A-53) and sulphate (Figure 5.2.9A-54) data for Notigi Lake indicates negligible, if any changes to these parameters.
Due to limited data, effects on Rat and Mynarski lakes are unclear. However, available data indicate effects may have been similar to those observed in Notigi Lake. Ramsey et al. (1989) concluded that there was no consistent pattern of change in major ions in Rat Lake; some increased (e.g., sodium), while others decreased (e.g., calcium, sulphate). Examination of the overall data set indicates calcium (Figure 5.2.9A-55) and magnesium (Figure 5.2.9A-56) have remained below pre-CRD concentrations, while sodium (Figure 5.2.9A-52) may have slightly increased, and potassium (Figure 5.2.9A-57) appears to have been relatively unaffected. Chloride (Figure 5.2.9A-58) and sulphate (5.2.9A-59) may have decreased marginally in Rat Lake after CRD.
Conversely, available data indicate that all major cations, most notably calcium, have increased in Mynarski Lake since 1973 (Figure 5.2.9A-60, 5.2.9A-61, 5.2.9A-62, and 5.2.9A-63). Concentrations of all of these metrics were also notably higher in 2011 than the 1980s indicating a relatively recent change. Data are limited, however, and it is unknown if results from 2011 are representative of long-term conditions. Like Notigi and Rat lakes, chloride (Figure 5.2.9A-64) and sulphate (5.2.9A-65) do not appear to have changed notably since the 1970s.
Chloride has consistently remained well below the CCME PAL guideline (120 mg/L) and sulphate has consistently remained below the BCMOE PAL guidelines (126–309 mg/L; Meays and Nordin 2013) in Rat, Notigi, and Mynarski lakes indicating conditions have been suitable for aquatic life over the period of record.
REGIONAL CUMULATIVE EFFECTS ASSESSMENT – PHASE II WATER – WATER QUALITY
DECEMBER 2015 5.2-163
5.2.9.3.6 Metals
Few metals were measured prior to CRD in the upper Rat River system and those measurements that were made are of limited utility due to substantive changes in analytical methods. The following provides an overview of available information regarding mercury in water and effects of hydroelectric development, as well as a brief description of recent conditions for other metals measured under CAMP.
PRE-HYDROELECTRIC DEVELOPMENT
No pre-hydroelectric development measurements of mercury in water could be located. As previously noted, data are inadequate to characterize other metals, in surface water prior to CRD.
POST-HYDROELECTRIC DEVELOPMENT
There are limited data to characterize total or methylmercury concentrations downstream of SIL in general, and due to the lack of pre-CRD data there is no direct means for assessing changes over time or effects related to hydroelectric development. Furthermore, no data for total or methylmercury in water were located for Issett, Pemichigamau, or Karsakuwigamak lakes.
Despite these limitations, existing information indicates that total mercury in water was only marginally affected by CRD, while methylmercury increased in water following CRD. Total mercury concentrations measured in plankton, which can be used as a general indicator of abiotic conditions, collected in 1981 showed that levels in Issett, Mynarski, and Notigi lakes were similar to those measured in Granville Lake (i.e., an upstream, reference lake; Bodaly et al. 1987). Jackson (1988) reported similar concentrations of total mercury in water from SIL, Notigi, Rat, Mynarski, and Granville lakes in 1981. However, during stratification, total mercury was higher in the hypolimnion of the east basin of Notigi Lake than the epilimnion (Table 5.2.9A-4). The latter may reflect release of mercury from flooded terrestrial materials. Despite the similarities between surface concentrations, studies conducted in 1989 using trace clean techniques and lower DLs indicated that the earlier concentrations were substantially inflated due to contamination from sampling equipment and that concentrations were actually much lower than reported (Ramsey 1991b). Overall, these data suggest either no or negligible increases in water several years post-diversion and impoundment.
Results of trace-level mercury analyses conducted in Granville Lake, SIL, and Notigi Lake in 1989 also showed that total mercury concentrations in surface waters were similar between these lakes. More recent data indicate that total mercury concentrations in water remained at or near the DL (which ranged from 1 to 300 ng/L) between 2001 and 2013 (Figure 5.2.9A-66). Samples analysed at the lowest DL (i.e., DLs lower than the PAL guideline) were below the Manitoba PAL guideline (26 ng/L; MWS 2011).
Ramsey (1991b) reported that methylmercury concentrations near the outflow of Notigi Lake were approximately 34% higher than those measured in Methyl Bay in SIL (nearshore), where concentrations were 55% higher than those recorded in the nearshore area of Granville Lake (reference lake) in 1989.
Recent monitoring conducted under CAMP indicates that most other metals are also within PAL objectives and guidelines in Rat, Mynarski, and Notigi lakes (Table 5.2.9A-2). However, aluminum (Figure 5.2.9A-67), iron (Figure 5.2.9A-68), lead (Figure 5.2.9A-69), and silver (Figure 5.2.9A-70)
REGIONAL CUMULATIVE EFFECTS ASSESSMENT – PHASE II WATER – WATER QUALITY
DECEMBER 2015 5.2-164
occasionally or consistently exceeded PAL guidelines in some or all of the lakes. These occurrences are relatively common in Manitoba lakes and rivers and are also observed in lakes and rivers unaffected by hydroelectric development (CAMP 2014, Ramsey 1991a). Both iron and aluminum are relatively abundant elements (iron and aluminum are the third and fourth most abundant elements in the earth’s crust, respectively) and elevated concentrations occur in ‘pristine’ environments, including waterbodies in Manitoba. For example, Ramsey (1991a) concluded that high concentrations of aluminum, copper, and iron in the Burntwood (above Threepoint Lake), Footprint (above Footprint Lake), and Aiken rivers (all “natural, unregulated rivers”) were “natural”. Aluminum was also, on average, above the PAL guideline in off-system lakes including Assean (Section 5.2.6.3.6), Granville (Section 5.2.8.3.6), and Setting (Section 5.2.3.3.6) lakes and the off-system Hayes River (Section 5.2.6.3.6) over the period of 2008–2013. High concentrations of iron have also been reported across Canada and elevated aluminum concentrations have been reported for the western Canada region (CCREM 1987).
Occasional exceedances of Manitoba PAL objectives and guidelines for metals other metals are observed at numerous sites in the RCEA ROI as well as off-system sites (see Tables 5.2.6A-2 and 5.2.8A-5, CAMP 2014, KHLP 2012, and Ramsey 1991a). For example, Ramsey (1991a) concluded that high concentrations of copper in the Burntwood (above Threepoint Lake), Footprint (above Footprint Lake), and Aiken rivers (all “natural, unregulated rivers”) were “natural”. Silver were also occasionally above the PAL objective and guideline, respectively, in the Hayes River (Table 5.2.6A-2) over the period of 2008-2013.
5.2.9.4 Cumulative Effects of Hydroelectric Development on Water Quality
Using published literature and de novo data analysis, a number of changes in water quality have been identified in lakes on the upper Rat River system since water quality sampling first began in the early 1970s. The observed changes were not consistent among the three key lakes (Mynarski, Rat, and Notigi lakes) for which there is substantive data.
Notigi Lake experienced a dramatic increase in nutrients and chlorophyll a during the period of impoundment in 1974–1976. These effects are likely attributable to flooding and subsequent decomposition of organic materials coupled with changes in hydrology, such as increased water residence times. These effects were rapidly eliminated following opening of the Notigi CS and the South Bay diversion channel which resulted in a rapid flushing of the lake. Nutrients and chlorophyll a are currently similar to pre-CRD conditions. The Manitoba narrative nutrient guideline (TP = 0.025 mg/L) was substantively exceeded during the impoundment period; post-impoundment, the guideline is only occasionally exceeded.
Rat and Mynarski lakes, on the other hand, experienced a decrease in nutrients due to diversion of the less nutrient-rich Churchill River into the Rat River system; data are inadequate to characterize effects during the impoundment period. These decreases, however, appear to have had little to no effect on chlorophyll a concentrations which suggests that factors other than nutrients (e.g., water clarity), are more limiting to algae. Nutrients continue to be lower in both lakes than prior to CRD and chlorophyll a concentrations have remained relatively similar over the period of record (1973–2013).
REGIONAL CUMULATIVE EFFECTS ASSESSMENT – PHASE II WATER – WATER QUALITY
DECEMBER 2015 5.2-165
Water clarity was also affected by CRD in this area. Immediately following operation of the South Bay diversion channel, TSS increased notably in Issett Lake and to a lesser extent downstream. TSS remained above pre-CRD levels through 1977–1978 in the upstream lakes, when studies were completed. Secchi disk depths indicate that Rat Lake became slightly less transparent following CRD and that this effect continues to the present day. Notigi Lake, on the other hand, experienced an increase in water clarity (measured as Secchi disk depth) during and immediately following the impoundment period, decreasing to pre-CRD levels thereafter beginning in the 1980s. Data are inadequate to assess effects on Mynarski Lake, though currently the lake has a higher clarity than Rat or Notigi lakes.
DO decreased in Notigi Lake, notably in the eastern basin and most notably near the bottom of the water column, during the impoundment period. However, low DO concentrations (i.e., below PAL objectives) have been observed near the bottom of the water column since CRD became operational and these occurrences have generally coincided with thermal stratification – a condition that commonly leads to DO depletion due to the lack of mixing of the bottom waters with the more oxygenated upper water layer. CRD could have affected DO due to decomposition of flooded organic materials (a process that uses oxygen), increases in water depths (which caused stratification of the water column), and a reduction in flushing rate of the lake.
Available data are inadequate to characterize changes in DO over time in Mynarski and Rat lakes. It would be expected that some decrease in DO concentrations may have occurred following impoundment, notably in off-current areas. However, DO depletion, coincident with thermal stratification, has been recently observed in Rat Lake. Mynarski Lake, on the other hand, appears to have commonly experienced low levels of oxygen near the bottom of the water column following CRD; limited pre-CRD data indicate this occurred at least on occasion prior to CRD. Like Notigi and Rat lakes, low DO in Mynarski Lake has generally occurred in association with thermal stratification.
Other indicators of water quality have changed over time in each of Notigi, Rat, and Mynarski lakes, though the nature and direction of change varies among them. Some major ions increased briefly during the impoundment period in Rat and Notigi lakes. However, both of these lakes experienced a reduction in specific conductance, hardness, and major ions following diversion of the Churchill River. These effects, which persist today, were a direct result of introduction of the softer, more dilute Churchill River into the Rat River system. Though limited, available data for Mynarski Lake suggest the lake may have experienced the opposite effect; concentrations of major cations, specific conductance , and hardness were notably higher in 2011 than in all previous sampling periods (including prior to CRD). It is not known if the data collected in 2011 are representative of long-term water quality conditions or an anomalous year.
Data to characterize changes in metals, notably in association with impoundment and immediate post-impoundment/diversion periods, are lacking. However, currently most metals are within PAL objectives and guidelines in Rat, Notigi, and Mynarski lakes. Exceptions include occasional exceedances of PAL guidelines for lead and silver, and more frequent exceedances for iron and aluminum. Iron and aluminum concentrations are generally high in Manitoba waterbodies, including northern Manitoba lakes unaffected by hydroelectric development.

REGIONAL CUMULATIVE EFFECTS ASSESSMENT – PHASE II WATER – WATER QUALITY
DECEMBER 2015 5.2-166
Due to a lack of pre-CRD data, it is not possible to directly assess changes in total or methylmercury in water related to hydroelectric development. However, available information indicates that total mercury was either unchanged or negligibly increased in lakes in this area following impoundment. This observation is supported by the scientific literature that has established little to no effects on total mercury in water following reservoir creation. Conversely, available information for the area indicates that methylmercury concentrations increased in water post-impoundment. This observation is also supported by the scientific literature where it has been shown that flooding leads to increased methylation of mercury.
Much of the historical mercury data are either not reliable (i.e., due to sample contamination issues) or were measured with a high analytical DL precluding comparison of mercury data to current PAL guidelines. However, measurements made with sufficiently low DL s (2009–2013 period) indicate that total mercury is generally below the PAL guideline in Rat, Notigi, and Mynarski lakes at present.
REGIONAL CUMULATIVE EFFECTS ASSESSMENT – PHASE II WATER – WATER QUALITY
DECEMBER 2015 5.2-167
5.2.10 Area 3: Notigi Control Structure to Split Lake This reach of Area 3 includes: the lower Rat River (including Wapisu Lake); Footprint Lake and River; and the upper and lower Burntwood River lakes and river reaches including Threepoint, Kinosaskaw, Sesep, Wuskwatim, Opegano, Birch Tree, and Apussigamasi lakes (Map 5.2.10-1).
A description of the construction and operation of hydroelectric developments affecting the Rat/Burntwood river system between the Notigi CS and Split Lake is found in Part II Hydroelectric Development Project Description in the Region of Interest. A detailed description of effects of hydroelectric development to the water regime is provided in Water Regime, Chapter 4.3. Key points of the project description and water regime relevant water quality are summarized below.
Construction activities, including construction of major access roads and development of construction camps for the Notigi CS, were initiated in winter 1972/1973. Discharge from Notigi Lake was stopped over the impoundment period from May 8, 1974 to November 24, 1975. For the purposes of this discussion, water quality conditions measured prior to 1974 were considered as pre-hydroelectric development (i.e., pre-CRD); however, it is acknowledged that construction activities may have affected water quality in 1973 in some areas.
Diversion of the Churchill River was initiated on June 2, 1976, and the cofferdam at the Notigi CS was removed on September 1, 1976. Water quality data measured post-1976 to 2005 represent post-diversion and impoundment conditions; construction of the Wuskwatim GS occurred between 2006 and 2012.
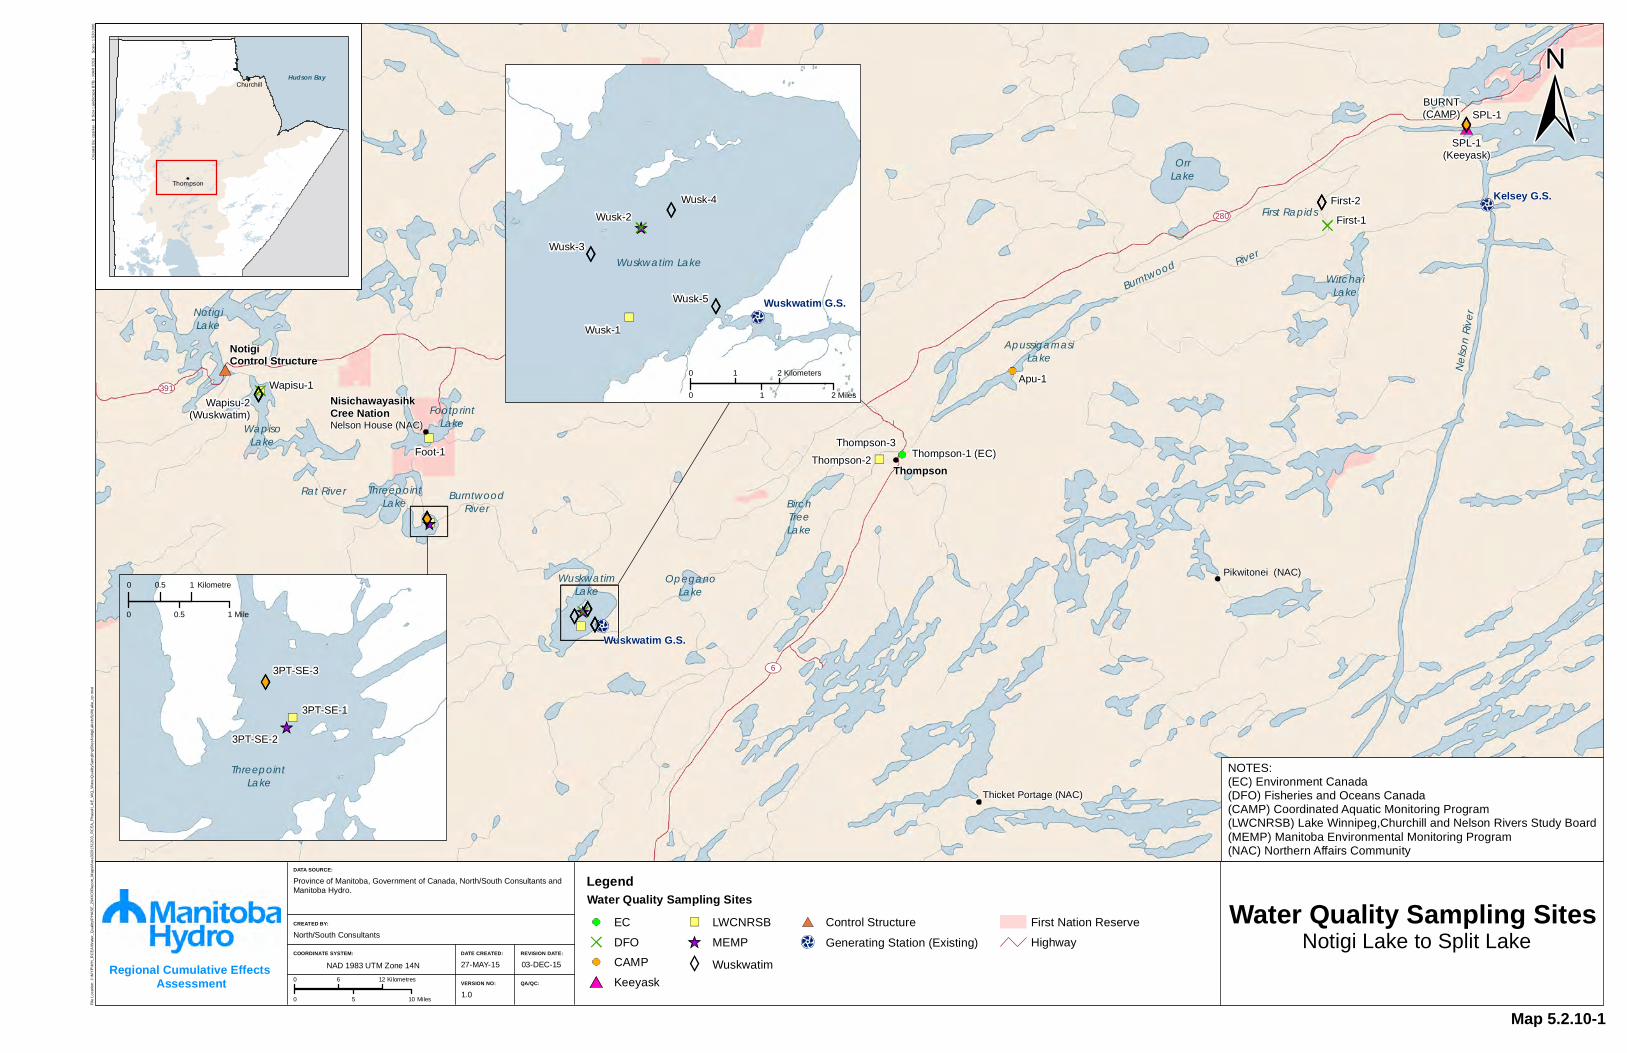
Water Quality Sampling Sites Notigi Lake to Split Lake
Province of Manitoba, Government of Canada, North/South Consultants andManitoba Hydro.
North/South Consultants
1.0
27-MAY-15 03-DEC-15
BURNT(CAMP)
SPL-1(Keeyask)
Apu-1
Foot-1
SPL-1
First-2
First-1
Wapisu-2(Wuskwatim)
Wapisu-1
Thompson-3
Thompson-2 Thompson-1 (EC)Thompson
Notigi Control Structure
L
ROrr
Lake
Rat
First Rapids
Lake
FootprintLake
River
BirchTreeLake
River
Hunter
NotigiLake
WapisoLake
WitchaiLake
OpeganoLake
BurntwoodRiver
Mynarski
Misinagu
Rat River
Burntwood
WuskwatimLake
Nelso
n Rive
r
ThreepointLake
ApussigamasiLake
Kelsey G.S.
Wuskwatim G.S.
Pikwitonei (NAC)
Thicket Portage (NAC)
Nisichawayasihk Cree NationNelson House (NAC)
6
280
391
391
Cre
ated
By:
cpa
rker
- B
Siz
e La
ndsc
ape
BTB
- M
AR
201
5
Sca
le: 1
:520
,000
Regional Cumulative Effects Assessment
NAD 1983 UTM Zone 14N
0 5 10 Miles
0 6 12 Kilometres
File
Loc
atio
n: J
:\MY
P\M
H_R
CE
A\W
ater
_Qua
lity\
PH
AS
E_2
\MX
D\R
epor
t_M
aps\
Are
a3\2
0151
203_
RC
EA
_Pha
seII_
AE
_WQ
_Wat
erQ
ualit
ySam
plin
gSite
sNot
igiL
aket
oSpl
itLak
e_cp
.mxd
DATA SOURCE:
DATE CREATED:
CREATED BY:
VERSION NO:
REVISION DATE:
QA/QC:
COORDINATE SYSTEM:
Water Quality Sampling Sites
Hudson Bay
Thompson
Churchill
3PT-SE-3
3PT-SE-2
3PT-SE-1
Threepoint Lake
Wusk-5
Wusk-4
Wusk-3
Wusk-2
Wusk-1
Wuskwatim G.S.
Wuskwatim Lake
EC
DFO
CAMP
Keeyask
LWCNRSB
MEMP
Wuskwatim
Control Structure
Generating Station (Existing)
First Nation Reserve
Highway
Legend
0 0.5 1 Kilometre
0 0.5 1 Mile
0 1 2 Kilometers
0 1 2 Miles
NOTES:(EC) Environment Canada(DFO) Fisheries and Oceans Canada(CAMP) Coordinated Aquatic Monitoring Program(LWCNRSB) Lake Winnipeg,Churchill and Nelson Rivers Study Board(MEMP) Manitoba Environmental Monitoring Program(NAC) Northern Affairs Community
Map 5.2.10-1
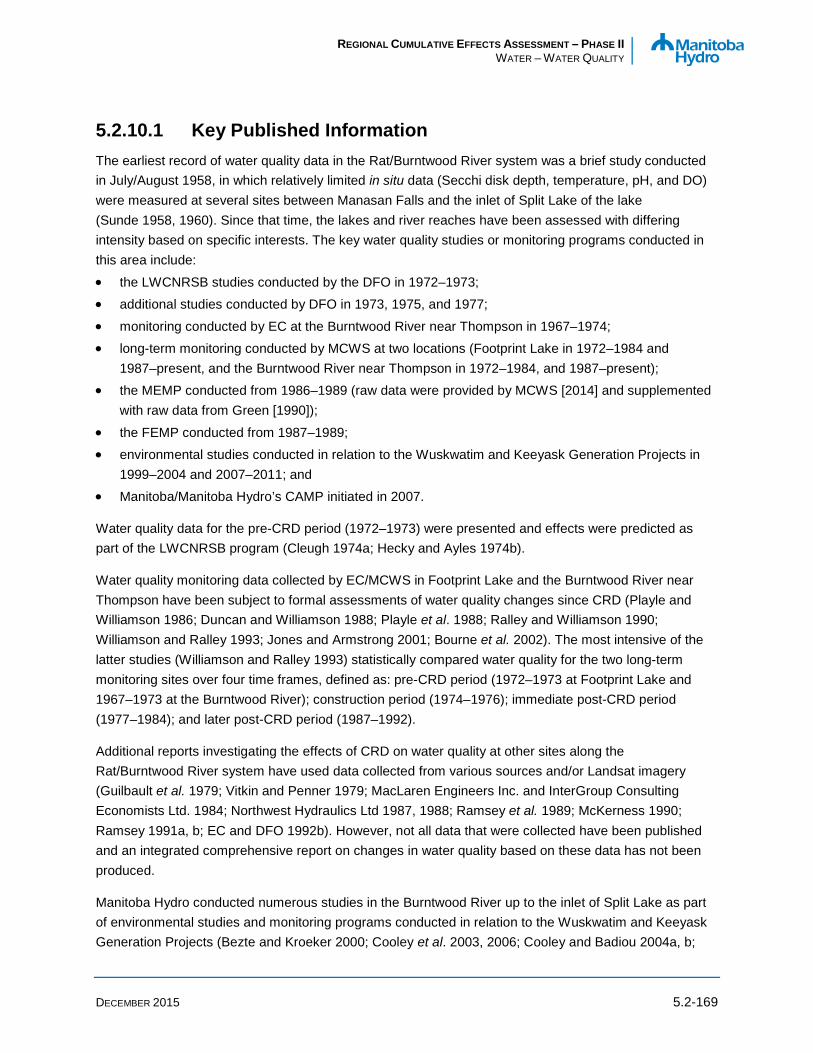
REGIONAL CUMULATIVE EFFECTS ASSESSMENT – PHASE II WATER – WATER QUALITY
DECEMBER 2015 5.2-169
5.2.10.1 Key Published Information The earliest record of water quality data in the Rat/Burntwood River system was a brief study conducted in July/August 1958, in which relatively limited in situ data (Secchi disk depth, temperature, pH, and DO) were measured at several sites between Manasan Falls and the inlet of Split Lake of the lake (Sunde 1958, 1960). Since that time, the lakes and river reaches have been assessed with differing intensity based on specific interests. The key water quality studies or monitoring programs conducted in this area include:
• the LWCNRSB studies conducted by the DFO in 1972–1973; • additional studies conducted by DFO in 1973, 1975, and 1977;
• monitoring conducted by EC at the Burntwood River near Thompson in 1967–1974; • long-term monitoring conducted by MCWS at two locations (Footprint Lake in 1972–1984 and
1987–present, and the Burntwood River near Thompson in 1972–1984, and 1987–present); • the MEMP conducted from 1986–1989 (raw data were provided by MCWS [2014] and supplemented
with raw data from Green [1990]);
• the FEMP conducted from 1987–1989; • environmental studies conducted in relation to the Wuskwatim and Keeyask Generation Projects in
1999–2004 and 2007–2011; and • Manitoba/Manitoba Hydro’s CAMP initiated in 2007.
Water quality data for the pre-CRD period (1972–1973) were presented and effects were predicted as part of the LWCNRSB program (Cleugh 1974a; Hecky and Ayles 1974b).
Water quality monitoring data collected by EC/MCWS in Footprint Lake and the Burntwood River near Thompson have been subject to formal assessments of water quality changes since CRD (Playle and Williamson 1986; Duncan and Williamson 1988; Playle et al. 1988; Ralley and Williamson 1990; Williamson and Ralley 1993; Jones and Armstrong 2001; Bourne et al. 2002). The most intensive of the latter studies (Williamson and Ralley 1993) statistically compared water quality for the two long-term monitoring sites over four time frames, defined as: pre-CRD period (1972–1973 at Footprint Lake and 1967–1973 at the Burntwood River); construction period (1974–1976); immediate post-CRD period (1977–1984); and later post-CRD period (1987–1992).
Additional reports investigating the effects of CRD on water quality at other sites along the Rat/Burntwood River system have used data collected from various sources and/or Landsat imagery (Guilbault et al. 1979; Vitkin and Penner 1979; MacLaren Engineers Inc. and InterGroup Consulting Economists Ltd. 1984; Northwest Hydraulics Ltd 1987, 1988; Ramsey et al. 1989; McKerness 1990; Ramsey 1991a, b; EC and DFO 1992b). However, not all data that were collected have been published and an integrated comprehensive report on changes in water quality based on these data has not been produced.
Manitoba Hydro conducted numerous studies in the Burntwood River up to the inlet of Split Lake as part of environmental studies and monitoring programs conducted in relation to the Wuskwatim and Keeyask Generation Projects (Bezte and Kroeker 2000; Cooley et al. 2003, 2006; Cooley and Badiou 2004a, b;
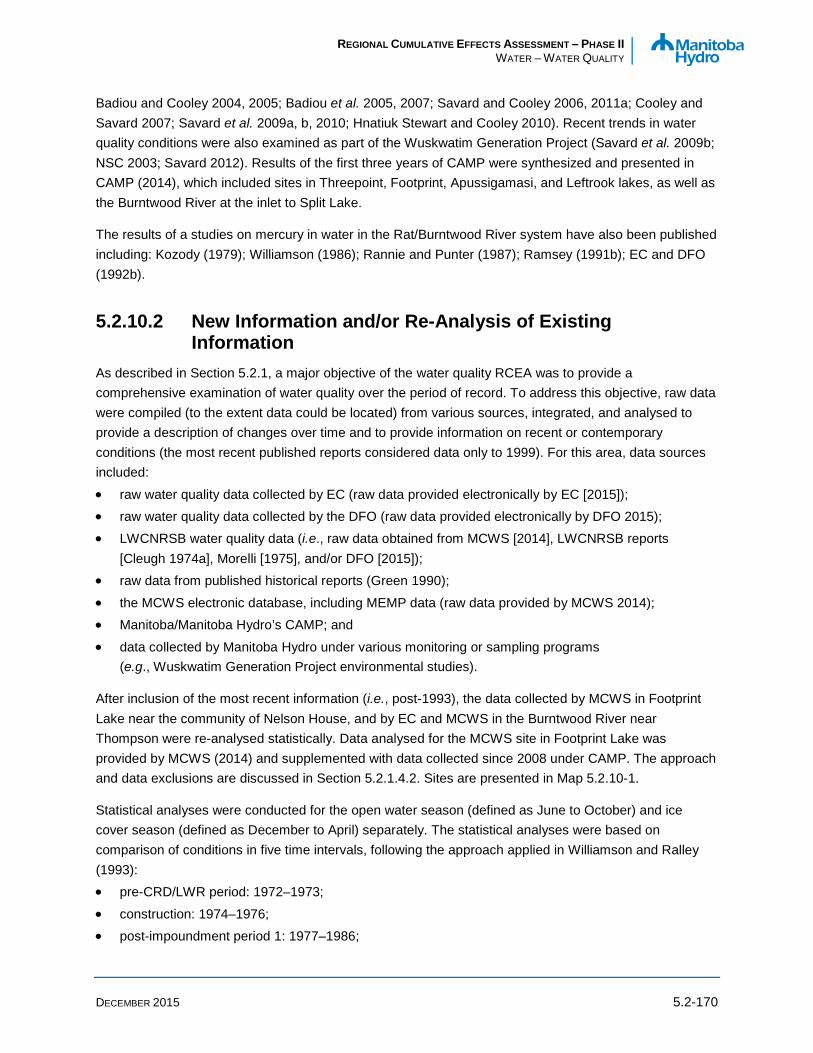
REGIONAL CUMULATIVE EFFECTS ASSESSMENT – PHASE II WATER – WATER QUALITY
DECEMBER 2015 5.2-170
Badiou and Cooley 2004, 2005; Badiou et al. 2005, 2007; Savard and Cooley 2006, 2011a; Cooley and Savard 2007; Savard et al. 2009a, b, 2010; Hnatiuk Stewart and Cooley 2010). Recent trends in water quality conditions were also examined as part of the Wuskwatim Generation Project (Savard et al. 2009b; NSC 2003; Savard 2012). Results of the first three years of CAMP were synthesized and presented in CAMP (2014), which included sites in Threepoint, Footprint, Apussigamasi, and Leftrook lakes, as well as the Burntwood River at the inlet to Split Lake.
The results of a studies on mercury in water in the Rat/Burntwood River system have also been published including: Kozody (1979); Williamson (1986); Rannie and Punter (1987); Ramsey (1991b); EC and DFO (1992b).
5.2.10.2 New Information and/or Re-Analysis of Existing Information
As described in Section 5.2.1, a major objective of the water quality RCEA was to provide a comprehensive examination of water quality over the period of record. To address this objective, raw data were compiled (to the extent data could be located) from various sources, integrated, and analysed to provide a description of changes over time and to provide information on recent or contemporary conditions (the most recent published reports considered data only to 1999). For this area, data sources included:
• raw water quality data collected by EC (raw data provided electronically by EC [2015]); • raw water quality data collected by the DFO (raw data provided electronically by DFO 2015); • LWCNRSB water quality data (i.e., raw data obtained from MCWS [2014], LWCNRSB reports
[Cleugh 1974a], Morelli [1975], and/or DFO [2015]); • raw data from published historical reports (Green 1990);
• the MCWS electronic database, including MEMP data (raw data provided by MCWS 2014); • Manitoba/Manitoba Hydro’s CAMP; and
• data collected by Manitoba Hydro under various monitoring or sampling programs (e.g., Wuskwatim Generation Project environmental studies).
After inclusion of the most recent information (i.e., post-1993), the data collected by MCWS in Footprint Lake near the community of Nelson House, and by EC and MCWS in the Burntwood River near Thompson were re-analysed statistically. Data analysed for the MCWS site in Footprint Lake was provided by MCWS (2014) and supplemented with data collected since 2008 under CAMP. The approach and data exclusions are discussed in Section 5.2.1.4.2. Sites are presented in Map 5.2.10-1.
Statistical analyses were conducted for the open water season (defined as June to October) and ice cover season (defined as December to April) separately. The statistical analyses were based on comparison of conditions in five time intervals, following the approach applied in Williamson and Ralley (1993): • pre-CRD/LWR period: 1972–1973;
• construction: 1974–1976; • post-impoundment period 1: 1977–1986;
REGIONAL CUMULATIVE EFFECTS ASSESSMENT – PHASE II WATER – WATER QUALITY
DECEMBER 2015 5.2-171
• post-impoundment period 2: 1987–1992; and
• post-impoundment period 3: 1993–2013.
An inventory of water quality data that were analysed are indicated in Table 5.2.10A-1 and a summary of the waterbodies and periods subjected to detailed analysis is provided in Table 5.2.10-1.
Table 5.2.10-1: Water Quality Data Subject to Detailed Analysis
Waterbody Period of Record
Wapisu Lake 1973, 1975 (Aug only), 1977 (June only), 1999–2001
Footprint Lake 1972–2013
Threepoint Lake 1973, 1986–1989, 1999–2001, 2008–2013
Wuskwatim Lake 1973, 1977 (June only), 1987–1989, 1999–2004, 2007, 2008, 2010, 2011
Burntwood River near Thompson 1967–2013
Apussigamasi Lake 1976–1978, 2009, 2012
Burntwood River near First Rapids 1972, 1973, 2002–2004, 2007–2011
Burntwood River at the Inlet to Split Lake 2001–2004, 2007–2013
5.2.10.3 Changes in Indicators over Time Potential effects of hydroelectric development on water quality in this area include: • Flooding: Flooding potentially causes increases in nutrients, metals, and colour, and decreases in
pH, DO, and water clarity. Effects of flooding typically decrease over time. • Diversion: Diversion of the Churchill River could alter water quality conditions in relation to inherent
differences between the Churchill River and the pre-existing Rat/Burntwood River system, as well as through changes in velocities and water residence times.
• Hydrological Changes: Changes in flows, velocities, depths, water residence times, hydrological patterns, and/or changes in the ice regime could affect water quality through changes in mixing, settling/resuspension of particulates, reaeration, and or cycling of nutrients and organic materials.
• Erosion/Sedimentation: Increased shoreline erosion due to flooding and/or changes in sedimentation due to changes in hydrology/morphology of the lake (or upstream areas). This pathway could result in increases in TSS, notably in areas of increased erosion, and/or alter rates of sedimentation where water velocities, depths, and/or residence times were affected. Effects would be expected to vary spatially in relation to shoreline characteristics, residence times, depths, and fetch.
REGIONAL CUMULATIVE EFFECTS ASSESSMENT – PHASE II WATER – WATER QUALITY
DECEMBER 2015 5.2-172
5.2.10.3.1 Nutrients and Trophic Status
PRE-HYDROELECTRIC DEVELOPMENT
With the exception of the Burntwood River at Thompson, where data are available since 1967, pre-CRD water quality data for this reach are limited to those collected in the two years immediately prior to impoundment of the Notigi forebay and diversion of the Churchill River. Data from the early 1970s indicate that lakes upstream of Thompson were moderately to highly nutrient-rich with lower TP concentrations occurring in Footprint Lake1 than in the lakes located along the mainstem of the river (Figures 5.2.10A-1 and 5.2.10A-2). On average, the lakes were classified as meso-eutrophic to eutrophic in terms of TN concentrations and meso-eutrophic in terms of TP. Average concentrations of TP exceeded the Manitoba narrative guideline for nutrients for lakes, ponds, and reservoirs (0.025 mg/L; MWS 2011) at Wapisu, Threepoint, and Wuskwatim lakes (Figure 5.2.10A-3). No record of pre-CRD nitrogen or phosphorous data was found for Apussigamasi Lake.
Data also suggest that the Burntwood River at Thompson and First Rapids was moderately nutrient-rich in the early 1970s, and that TP was lower at Thompson than at First Rapids (Figures 5.2.10A-4 and 5.2.10A-5; Table 5.2.10A-2). Additionally, TN at First Rapids was slightly lower than the upstream mainstem lakes but TP was higher. Similar to the upstream sites, the Burntwood River at Thompson was classified at the border of meso-eutrophic to eutrophic in terms of average TP, while First Rapids was categorized as eutrophic based on TP and oligotrophic in terms of TN. The mean TP concentration at First Rapids also exceeded the Manitoba narrative guideline for nutrients for streams and rivers but water at Thompson was within the PAL (0.05 mg/L; MWS 2011; Figure 5.2.10A-6). No record of pre-CRD nitrogen or phosphorous data was found for the Burntwood River at the inlet to Split Lake.
Similar to nutrients, chlorophyll a concentrations were reflective of mesotrophic conditions in the lakes prior to CRD (Figure 5.2.10A-7). Chlorophyll a was not measured in the Burntwood River at Thompson or at the inlet to Split Lake in 1972–1973, but concentrations at First Rapids were lower than those reported for the upstream lakes (Figure 5.2.10A-8).
POST-HYDROELECTRIC DEVELOPMENT
Data collected in Wapisu, Threepoint, Footprint, Wuskwatim, and Apussigamasi lakes and the Burntwood River at Thompson, First Rapids, and the inlet to Split Lake indicate some effects to nutrients occurred in association with CRD but that the effects varied spatially throughout the reach.
1 TN also appears to be higher in Footprint Lake, compared to the mainstem sites. However, the data includes one anomalously high TN value (2.51 mg/L) measured on September 27, 1972. Once this value is excluded, average TN for the lake is similar to the other lakes.

REGIONAL CUMULATIVE EFFECTS ASSESSMENT – PHASE II WATER – WATER QUALITY
DECEMBER 2015 5.2-173
Water quality in Footprint Lake has been monitored since 1972. Analysis of these long-term data considering the open water and ice cover seasons separately indicates that TP was unchanged over the impoundment period (1974–1976), but open water concentrations increased immediately post-impoundment (1977–1983) then returned to near pre-impoundment concentrations for the remainder of the post-CRD period (1987–2013; Figures 5.2.10A-9 and 5.2.10A-10). Although post-CRD TP concentrations were similar to those measured prior to 1973, the recent data exhibit increased variability since 2000. Other analyses of these data, including those collected under ice, indicated that TP increased following impoundment (1977–1984 and 1987–1992) and that concentrations were declining during the 1987–1992 period but had not returned to pre-development levels (Williamson and Ralley 1993). Williamson and Ralley (1993) suggested that the initial rise in TP concentrations in Footprint Lake were due to flooding and shoreline erosion; analysis of erosion near Nelson House indicated the “potential for widespread sediment production” during the post-CRD period (Erosion and Sedimentation, Chapter 4.4). Furthermore, data collected under CAMP also indicate that, in contrast to the pre-development period, the mean TP concentration in Footprint Lake is currently similar to or greater than that measured in the on-current lakes in this river system (Table 5.2.10A-3). Additionally, the mean TP concentration for each period has remained within the meso-eutrophic classification during the post-diversion periods but mean TP concentrations measured during the impoundment and each post-impoundment phase exceeded the Manitoba narrative nutrient guideline for lakes and reservoirs (0.025 mg/L; MWS 2011) whereas the pre-CRD concentration did not. Total phosphorus also occasionally or frequently exceeds this guideline in other lakes and reservoirs in northern areas of the province, including off-system lakes such as Assean, Leftrook, Gauer, and Setting lakes. Furthermore, TP concentrations are occasionally above the guideline upstream of the RCEA ROI in Granville Lake (see Section 5.2.8.3).
Conclusions regarding effects of CRD on TP in the Burntwood River at Thompson vary depending on the data source. Current analysis of data collected over the open water and ice cover periods between 1967 and 2013 indicates that TP in the Burntwood River at Thompson was unchanged over the impoundment period (1974–1976), increased immediately post-impoundment (1977–1983), then open water concentrations returned to pre-impoundment concentrations for all periods thereafter (1987–2013) and ice cover TP increased slightly in 1993–2005 (Figures 5.2.10A-9 and 5.2.10A-10). Ramsey (1991) also indicated that TP nearly doubled immediately following diversion (September 1976 to December 1977) but that concentrations measured during FEMP (1987–1989) were similar to the pre-development period. In contrast, Williamson and Ralley (1993) indicated TP concentrations increased during construction (1974–1976), immediately following diversion (1977–1984), and over the last period examined (1987–1992). Additionally, Jones and Armstrong (2001) conducted regression analysis of the change in flow-adjusted TP between 1975 and 2000 (i.e., these authors did not parse out discrete periods and also conducted the analysis using the construction phase as the starting point) and found an overall decreasing trend through time. All authors agreed that increases immediately following diversion were related to the release of TP from flooded soils, with specific increases in particulate phosphorous (EC and DFO 1992b), and that the system was becoming more stable and releasing less TP by the 1987–1992 period. Regardless of the direction or magnitude of changes through time, TP concentrations in the Burntwood River at Thompson have always been borderline meso-eutrophic to eutrophic, but an increasing number of samples collected during construction, immediately following diversion, and between 1999 and 2009 exceeded the Manitoba narrative nutrient guideline for rivers and streams.

REGIONAL CUMULATIVE EFFECTS ASSESSMENT – PHASE II WATER – WATER QUALITY
DECEMBER 2015 5.2-174
Although TP data for other sites in the reach are limited, most of the open water data suggest that there has either been no change through time, or that TP has decreased since 1972–1973. TP in the single sample collected in Wapisu Lake during the construction period was elevated above the pre-development range for the lake, whereas samples collected in 1999–2001 suggest that concentrations have decreased to below those measured in 1972–1973 (Figure 5.2.10A-11). Concentrations measured in Wuskwatim Lake since 1986 were similar to TP reported prior to CRD, although TP measured in Threepoint Lake in 2009–2013 suggests that concentrations have recently declined (Figures 5.2.10A-12 and 5.2.10A-13). Similarly, data collected in the Burntwood River at First Rapids indicate that concentrations have decreased through time (Figure 5.2.10A-14).
All of the lakes have frequently exceeded the Manitoba narrative nutrient guideline for lakes and reservoirs prior to and following CRD, whereas TP at First Rapids and the inlet to Split Lake has only infrequently exceeded the guideline for rivers and streams since diversion (Figures 5.2.10A-14 and 5.2.10A-15; Table 5.2.10A-4). This difference largely reflects different guidelines for lakes (0.025 mg/L) and rivers (0.050 mg/L), rather than absolute differences in concentrations.
The long-term data collected in Footprint Lake between 1972 and 2013 indicate that TN concentrations decreased as a result of diversion1. The current analysis of TN did not find a significant change immediately following diversion; however, concentrations declined after 1987 and have remained below the pre-development levels through 2013 (Figure 5.2.10A-16). Williamson and Ralley (1993) assessed TKN and nitrate/nitrite (i.e., the components of TN) rather than TN, and concluded that concentrations declined immediately after diversion and reductions were maintained through post-impoundment (1987–1992). Additionally, Jones and Armstrong (2001) conducted regression analysis of the change in flow-adjusted TN between 1975 and 2000 (i.e., these authors did not parse out discrete periods and also conducted the analysis using the construction phase as the starting point) and found an overall decreasing trend in TN through time. TN concentrations also declined in Notigi Lake immediately after diversion, and Hecky et al. (1987a) reported that the reduction was related to the increased flushing rate of the lake. The more recent decline may reflect a permanent change relating to inputs of Churchill River water, which has different chemistry than the Rat/Burntwood River system. Along with the decline in concentrations, the trophic status of Footprint Lake, based on mean TN concentrations measured during each period, changed from eutrophic prior to 1973 to meso-eutrophic after 1977.
Due to the lack of pre-CRD data, changes in TN associated with this project are unknown. Notwithstanding this issue, the relatively consistent TN concentrations measured in the Burntwood River at Thompson after CRD suggests that changes associated with this project were likely minimal. Accordingly, the trophic status of the Burntwood River at Thompson is classified as oligotrophic during each of the construction and post-CRD periods.
1 The data included one anomalously high TN value (2.51 mg/L) in 1972. Even after exclusion of the sample, significant reductions in TN concentrations remained for 1987–2005.
REGIONAL CUMULATIVE EFFECTS ASSESSMENT – PHASE II WATER – WATER QUALITY
DECEMBER 2015 5.2-175
As noted for Footprint Lake, the limited data collected for other sites downstream of Notigi Lake also suggest that TN concentrations in some areas are lower than prior to CRD. TN concentrations measured during post-impoundment/diversion periods in Threepoint Lake and the Burntwood River at First Rapids (1986–2013 and 2002–2012, respectively) show reductions below 1972–1973 levels (Figures 5.2.10A-17 and 5.2.10A-18). In contrast, concentrations in Wapisu and Wuskwatim lakes were relatively similar between 1973, 1977, and the post-1987 periods (Figures 5.2.10A-17 and 5.2.10A-19).
There are limited data to characterize chlorophyll a concentrations in Footprint Lake or the Burntwood River at Thompson; due to the lack of pre-CRD data there is no direct means for assessing changes over time or effects related to hydroelectric development. The sites are currently classified as mesotrophic/eutrophic and oligotrophic, respectively, which is unchanged from sampling conducted in the 1980s (Figure 5.2.10A-20).
Limited data collected prior to (1973) and after (post-1977) CRD in Wapisu and Wuskwatim lakes and the Burntwood River at First Rapids indicate that, despite changes in nutrient concentrations along the stretch of river, chlorophyll a concentrations were relatively unchanged (Figures 5.2.10A-21, 5.2.10A-22, and 5.2.10A-23). Data are insufficient to determine if chlorophyll a was affected by CRD in Threepoint Lake, as only one data point is available for the pre-CRD period; however, the site was classified as mesotrophic since 1986.
Additionally, because of lack of pre-development data, it is not possible to ascertain what changes in nutrients or chlorophyll a may have occurred in Apussigamasi Lake or the Burntwood River at the inlet to Split Lake (Figures 5.2.10A-15, 5.2.10A-24 through 5.2.10A-28; Table 5.2.10A-4). However, Ramsey (1991) concluded that water quality at the inlet to Split was not significantly different from that at Thompson in 1986–1989.
5.2.10.3.2 Water Clarity
PRE-HYDROELECTRIC DEVELOPMENT
Based on Secchi disk depths measured in the Burntwood River in 1958 and 1960, Sunde (1958, 1960) concluded that “it is readily apparent however, that the natural conditions in the waters surveyed are well within the limits of tolerance for aquatic life. Even though the Burntwood River is very turbid, it is highly productive for waters of this area.” This early study of the Burntwood River was conducted in late July and early August, and extended between sites downstream of Birch Tree Lake and the inlet to Split Lake; Secchi disk depths ranged from 0.3–0.7 m.
Water clarity was measured as TSS and Secchi disk depths in the 1972–1973 LWCNRSB water quality studies conducted in this area (Cleugh 1974a). Additionally, turbidity was measured by the Province of Manitoba and/or EC at Footprint Lake in 1972–1973 and in the Burntwood River at Thompson in 1967–1973 (MCWS 2014, EC 2015). Average TSS was below 10 mg/L in the lakes along the lower Rat/Burntwood system, although Threepoint and Wuskwatim lakes had higher mean concentrations than Wapisu and Footprint lakes (Table 5.2.10A-5; Figure 5.2.10A-29). Mean Secchi disk depths measured in 1973 were also lower in Threepoint and Wuskwatim lakes compared to Wapisu Lake and the lakes in the upper reach of the Rat River (Figure 5.2.10A-30).
REGIONAL CUMULATIVE EFFECTS ASSESSMENT – PHASE II WATER – WATER QUALITY
DECEMBER 2015 5.2-176
TSS concentrations in the Burntwood River at Thompson and First Rapids were higher than those measured in the upstream lakes. Particularly high TSS concentrations were reported at Thompson in July 1968–Sept 1969 because of dredging conducted by INCO Mine (now Vale) in Ospawagan Lake (Chekay and Crowe 1972; Figure 5.2.10A-31). Turbidity results also indicated that water clarity of the Burntwood River at Thompson was lower than that of Footprint Lake (Figure 5.2.10A-32). In contrast, Secchi disk depths measured upstream and downstream of Thompson in 1958 and 1960 (Sunde 1958, 1960; Cleugh 1974a) were similar to those measured in Threepoint and Wuskwatim lakes in 1972–1973 (Tables 5.2.10A-2 and 5.2.10A-5).
POST-HYDROELECTRIC DEVELOPMENT
Data are inadequate to assess changes in Secchi disk depth between the Notigi CS and Split Lake, and due to limited data, effects of CRD on changes in turbidity and TSS are unclear.
Analysis of long-term monitoring data from Footprint Lake indicated a temporary decline in turbidity (open water season only) during construction and immediately following diversion (1974–1986), as this was associated with water level reductions during the upstream impoundment (Figures 5.2.10A-33; Williamson and Ralley 1993). Analysis of the ice cover season separately also indicated a significant increase in turbidity in Footprint Lake in 1993–2005, compared to 1972–1974. In contrast, Playle and Williamson (1986) and Playle et al. (1988) concluded that turbidity in the lake significantly increased subsequent to diversion. However, the former study pooled data for the open water and ice cover seasons and the latter analysis was conducted by pooling data collected before and after June 1976 into pre- and post-CRD categories, thus including the construction period in the pre-CRD category. Open water season TSS in Footprint Lake remained unchanged by impoundment and diversion (Figures 5.2.10A-34). Secchi disk depth data were inadequate for assessment of effects of CRD but water clarity was similar, or slightly greater, in 2008–2013 compared to 1987–1989 (Figures 5.2.10A-35). Landsat imagery collected prior to and following (1973–1986) diversion illustrated that Footprint Lake had high water clarity during both periods, despite significant shoreline erosion at the site (Northwest Hydraulics Ltd 1988). Analysis of erosion in Footprint Lake (Erosion and Sedimentation, Chapter 4.4) noted that “the lengths of eroding shoreline increased from four to 40 km” and that erosion of organic material occurred in low energy environments, but qualified that the limited dataset also indicated that overall rates of erosion were relatively low and activity was predominantly localized along the southern shore of the lake.
In contrast to Footprint Lake, the current analysis indicates that turbidity of the Burntwood River at Thompson was initially similar to pre-impoundment conditions but increased after 1987 (ice cover season) or 1993 (open water season; Figure 5.2.10A-33). In comparison to past studies, turbidity was reported to be either unchanged or increasing at this site, depending on the period considered. Various authors reported that turbidity was unaffected by diversion (Guilbault et al. 1979, Playle and Williamson 1986, Playle et al. 1988), although the former study only considered late 1976 and 1977 in the post-CRD analysis and, as mentioned previously, Playle and Williamson (1986) and Playle et al. (1988) pooled pre-diversion and construction into one category. Ramsey (1991) and Williamson and Ralley (1993) also both concluded that water clarity was reduced (i.e., turbidity increased) during construction and post-diversion;

REGIONAL CUMULATIVE EFFECTS ASSESSMENT – PHASE II WATER – WATER QUALITY
DECEMBER 2015 5.2-177
the study of erosion along the Burntwood River indicated “considerable erosion” along the south shore in areas in the direct path of flow (Erosion and Sedimentation, Chapter 4.4).
Similar to results for Footprint Lake, the current analysis indicates that open water TSS in the Burntwood River at Thompson remained unchanged by impoundment and diversion; however, concentrations measured during the ice cover season of 1977–1986 increased significantly over the pre-CRD period (Figure 5.2.10A-34). Williamson and Ralley (1993) documented a temporary increase in TSS in the Burntwood River at Thompson immediately following diversion; the increase was attributed to increased erosion along the diversion route. All studies agreed that TSS returned to pre-development levels after 1987 (Ramsey 1991a, Williamson and Ralley 1993). Similar to the TSS results, Secchi disk depth measured during FEMP (1987–1989; 0.2–0.55 m) also suggested that water clarity had returned to pre-development levels (0.3–0.5 m; Sunde 1958, 1960).
Available data indicate that water clarity is similar or has declined slightly in the downstream reach as a result of bank and shoreline erosion resulting from the diversion (Figures 5.2.10A-36 to 5.2.10A-48; Vitkin and Penner 1979; MacLaren Engineers Inc. and InterGroup Consulting Economists Ltd. 1984; Northwest Hydraulics Ltd 1987, 1988; Ramsey 1991a; EC and DFO 1992b). Hydrologists noted that “sediment concentrations” along the CRD route from Notigi Lake to below Wuskwatim Lake were not qualitatively different after diversion compared to the pre-development period and that sediment mobilized during construction settled in Notigi and Wapisu lakes (Vitkin and Penner 19791; Northwest Hydraulics Ltd 1987, 1988). However, Landsat imagery collected prior to and following diversion (1973–1986) provided a visual depiction of increases in turbidity of the lakes and river reaches along the Burntwood River downstream of Threepoint Lake and increases in turbidity with distance downstream of the Notigi CS (Northwest Hydraulics Ltd 1988). FEMP studies conducted in the late 1980s also found that TSS and turbidity in the Rat and Burntwood rivers above and below Threepoint Lake had tripled and doubled2, respectively, since diversion (McKerness 1990, Ramsey 1991a). The differences upstream and downstream of Threepoint Lake also indicated that particles noticeably settle out in this lake (McKerness 1990). Sediment plumes resulting from increased local erosion have also been documented in Wuskwatim Lake (MacLaren Engineers Inc. and InterGroup Consulting Economists Ltd. 1984) and erosion rates are currently higher than pre-development rates throughout the entire post-CRD period (Physical Environment, Part IV). Overall, it appears that TSS and turbidity are likely more variable since diversion compared to the period prior to development; therefore, analysis of change inherently depends on the period of study and data analysis methods.
1 This analysis removed outliers prior to and during construction of CRD.
2 Based on a single pre-CRD value.
REGIONAL CUMULATIVE EFFECTS ASSESSMENT – PHASE II WATER – WATER QUALITY
DECEMBER 2015 5.2-178
5.2.10.3.3 Dissolved Oxygen
PRE-HYDROELECTRIC DEVELOPMENT
Prior to CRD, lakes along the Rat/Burntwood River system were generally isothermal and well-oxygenated during summer but some oxygen depletion occurred during winter and immediately after ice out (Cleugh 1974a). In 1972–1973, DO in the Rat/Burntwood River lakes was measured as percent saturation; these values were converted to concentrations and indicate that the lakes sampled (Wapisu, Threepoint, and Wuskwatim lakes) were well-oxygenated in July, August, and September 1973 (Figure 5.2.10A-49). In March 1973, DO concentrations at depth in Wuskwatim Lake fell below the current PAL for cold water species (Figure 5.2.10A-50) and concentrations in the surface and deep waters of all lakes were below PAL objectives in June 1973 (immediately after ice out). However, low concentrations were also observed in lakes upstream of the Notigi CS (Section 5.2.9.3.3) and in the Churchill River system (Section 5.2.11.3.3). Widespread DO depletion during the open water season that spans two river systems is an atypical observation for northern Manitoba and suggests that DO data may be erroneous.
DO was measured in Apussigamasi Lake and at riverine sites in the Burntwood River from upstream of Thompson to the inlet of Split Lake in 1958 (Sunde 1958). A single DO value was also located for the Burntwood River at Thompson in July 1972 (MCWS 2014), and multiple measurements were collected at First Rapids in 1972 and 1973 (Cleugh 1974a). These data, though limited, collectively indicate that the river was well oxygenated (7.9–10.5 mg/L; 90–130% saturation) during summers prior to CRD.
POST-HYDROELECTRIC DEVELOPMENT
Surficial oxygen concentrations in Footprint, Threepoint, and Wuskwatim lakes and the Burntwood River downstream of Thompson were near saturation and remained above the Provincial PAL guidelines between 1974 and 1976 (Figure 5.2.10A-51; Table 5.2.10A-6). Immediately following the release of impounded water from the Notigi reservoir, where substantive decreases in DO occurred during the impoundment period, oxygen concentrations declined to levels below the current PAL objectives in lakes and mainstem of the river to the junction with the Odei River (MacLaren Engineers Inc. and InterGroup Consulting Economists Ltd. 1984). Oxygen levels appeared to recover by 1978 after sufficient flushing of the system. Additionally, surface oxygen concentrations in Footprint lake and the Burntwood River at Thompson have remained above the PAL guidelines for the majority of the record (1972–2013 and 1967–2013, respectively; Figure 5.2.10A-51).
Data for Wapisu, Threepoint, Wuskwatim, and Apussigamasi lakes are more limited. However, as was reported prior to CRD, lakes along the mainstem of the Rat/Burntwood River system were well oxygenated and predominantly isothermal throughout the summer during recent studies (Savard et al. 2009a, b; NSC 2003; Figures 5.2.10A-52 to 5.2.10A-54). In contrast, off-current areas (e.g. Wuskwatim Lake-South) occasionally experienced oxygen concentrations below the acute or chronic PAL objectives, and were hypoxic during at least one winter.
Recent data collected under CAMP indicate most waterbodies do not stratify and are generally well-oxygenated. Threepoint and Apussigamasi lakes and the Burntwood River at the inlet to Split Lake were not stratified during any sampling period between 2008 and 2013 (Table 5.2.10A-7 and Table 5.2.10A-3).
REGIONAL CUMULATIVE EFFECTS ASSESSMENT – PHASE II WATER – WATER QUALITY
DECEMBER 2015 5.2-179
Conversely, a site located near the centre of Footprint Lake was occasionally thermally stratified in the open water season (Figure 5.2.10A-55), as was an off-system reference lake (Leftrook Lake; Table 5.2.10A-7). DO concentrations for most CAMP waterbodies in this reach were above PAL objectives near the surface and at depth during every summer of study (Figures 5.2.10A-56 to 5.2.10A-59). In conjunction with the stratification at Footprint and Leftrook lakes, however, data indicate that DO concentrations at depth occasionally drop below the most stringent PAL water quality objective in the ice cover season (i.e., 30-day cold-water objective 9.5 mg/L; Figures 5.2.10A-56; Table 5.2.10A-7).
5.2.10.3.4 pH, Alkalinity, Hardness, and Specific Conductance
PRE-HYDROELECTRIC DEVELOPMENT
Prior to CRD, the reach of the Rat/Burntwood River between the Notigi CS and the inlet to Split Lake was neutral to slightly alkaline (Figures 5.2.10A-60 and 5.2.10A-61) and soft to moderately soft (Figures 5.2.10A-62 and 5.2.10A-63) with mean specific conductance ranging between 120 and 150 µmhos/cm (Figures 5.2.10A-64 and 5.2.10A-65; Sunde 1958, 1960; Cleugh 1974a). Specific conductance and hardness were slightly higher in this reach compared to lakes in the upper Rat River. Also, as with TP, the highest specific conductance was measured at First Rapids and the hardest water occurred in Footprint Lake. All measurements of pH in the Rat/Burntwood River system in 1958–1973 were within the current PAL guidelines.
POST-HYDROELECTRIC DEVELOPMENT
Long-term monitoring conducted at Footprint Lake since 1972 indicates that pH, alkalinity, specific conductance, and hardness changed through time. The open water pH was unchanged in Footprint Lake over the period of study, although pH in the ice cover season decreased slightly during construction and immediately following diversion. Regardless, pH in Footprint Lake remained neutral to slightly alkaline during all sampling periods, and pH also remained within the PAL guidelines (6.5<PAL<9.0) during the pre-CRD, construction, and post-CRD phases (Figure 5.2.10A-66). Reassessment of the MCWS data using data with the open water and ice cover seasons separated indicated that open water alkalinity, specific conductance, and hardness in the lake were unchanged during the construction phase and immediately after diversion, but that all of these metrics increased after 1987 (Figures 5.2.10A-67 to 5.2.10A-69). In contrast, de novo analysis indicated that pH and specific conductance declined temporarily (1974–1986 and 1977–1986, respectively) while ice cover hardness levels declined permanently (1977–2013) but alkalinity was unchanged. Statistical analyses presented in Williamson and Ralley (1993) indicated that pH, specific conductance, and hardness were similar between the pre- and post-CRD phases; however, that analysis pooled all seasons together. Despite the changes, water hardness in the lake was classified as moderately soft/hard during all periods and hardness and specific conductance remained elevated compared to the other lakes in the system.
pH, specific conductance, and hardness of the Burntwood River at Thompson differed between the pre- and post-CRD periods. pH of the Burntwood River at Thompson increased during the open water seasons in the initial diversion period and has remained elevated through most of the post-diversion periods (except 1993–2005; Figure 5.2.10A-66). In contrast, pH measured during the ice cover season

REGIONAL CUMULATIVE EFFECTS ASSESSMENT – PHASE II WATER – WATER QUALITY
DECEMBER 2015 5.2-180
has remained unchanged throughout the period of record. pH has also remained within the PAL guideline range since 1967. The current analysis also indicated that open water and ice cover alkalinity and specific conductance were unchanged during the construction period and that the more recent periods are statistically and/or qualitatively more dilute (i.e., lower specific conductance levels) than during the pre-development period (Figures 5.2.10A-67 and 5.2.10A-68). The de novo analysis yielded the conclusion that decreases in open water hardness were only statistically significant immediately following diversion, although hardness during the ice cover season has been reduced during all post-diversion period (1977–2005; Figure 5.2.10A-69). In contrast, Williamson and Ralley (1993) and Ramsey (1991) reported a temporary increase in specific conductance and/or hardness during construction, followed by reductions below the 1967–1973 levels due to the rapid flushing of the Notigi reservoir and influence of the Churchill River, which was characterized by lower specific conductance and hardness than the Rat/Burntwood River system prior to CRD.
Although data are more limited, recent measurements of open water pH in Wapisu Lake, and pH and alkalinity, in Threepoint and Wuskwatim lakes were similar to those measured prior to, during, and/or immediately after construction (Figures 5.2.10A-70 to 5.2.10A-72). Hardness of Wuskwatim Lake declined after diversion but specific conductance was reduced in 1987–1988 and has since recovered to similar values measured prior to CRD (Figures 5.2.10A-73 and 5.2.10A-74). Data are insufficient to determine whether specific conductance and hardness were affected by CRD in Threepoint Lake, as only one data point is available for the pre-CRD period
Water quality data are lacking for the Burntwood River at First Rapids during the construction and early post-diversion periods; however, contemporary measures of open water pH and alkalinity were similar to, or slightly higher than, those measured in 1972 and 1973 (Figures 5.2.10A-75 and 5.2.10A-76). Specific conductance and hardness measurements at First Rapids were highly variable in 1972–1973, but these metrics appears to have decreased post-diversion (Figures 5.2.10A-77 and 5.2.10A-78).
Pre-CRD data are lacking for Apussigamasi Lake and the Burntwood River at the inlet to Split Lake, although recent pH (Figure 5.2.10A-79), alkalinity (Figure 5.2.10A-80), and hardness (Figure 5.2.10A-81) in Apussigamasi Lake were similar to measurements collected in 1976 during construction. In contrast, similar to the results reported for the Burntwood River at Thompson, specific conductance (Figure 5.2.10A-82) in the lake declined immediately following diversion, reflecting the different chemistry of the Churchill River (i.e., lower specific conductance and hardness) compared to the Rat/Burntwood River system. Further downstream, conditions measured in the Burntwood River at the inlet to Split Lake have been relatively unchanged over the past three decades (Figures 5.2.10A-83 through 5.2.10A-86; Table 5.2.10A-4).
5.2.10.3.5 Major Ions
PRE-HYDROELECTRIC DEVELOPMENT
Like the lakes along the upper reach of the Rat River, the dominant cations in the lakes and riverine reaches along the Rat/Burntwood River system were calcium and magnesium in 1972–1973; the exception was Footprint Lake, which was dominated by calcium and sodium (Tables 5.2.10A-5 and Table 5.2.10A-2). Chloride and sulphate were consistently below the CCME (1999, updated to 2015;

REGIONAL CUMULATIVE EFFECTS ASSESSMENT – PHASE II WATER – WATER QUALITY
DECEMBER 2015 5.2-181
120 mg/L) and BCMOE PAL (126–309 mg/L; Meays and Nordin 2013) guidelines, respectively. Concentrations of most major ions were higher at First Rapids than any other site in the reach. No record of pre-CRD chemistry data was found for the Burntwood River at the inlet to Split Lake. For comparison, water in Granville Lake (i.e., an upstream site along the Churchill River) had approximately 30% lower concentrations of calcium but 50% higher concentrations of potassium, sodium, and chloride (see Section 5.2.8 for further information).
POST-HYDROELECTRIC DEVELOPMENT
Major cations have changed over time in the waterbodies downstream of the Notigi CS; however, effects vary spatially with the influence from other local sources. There was a long-term increase in open water calcium (Figure 5.2.10A-87), potassium (Figure 5.2.10A-88), and sodium (Figure 5.2.10A-89) in Footprint Lake after 1987. Magnesium data are lacking prior to 1974; however, comparison of results from 1987–2013 to 1974–1976 suggest that concentrations may have increased relative to pre-CRD (Figure 5.2.10A-90). Increases in ions in Footprint Lake have been attributed to the influence of the Churchill River water, which differed from the Rat River prior to CRD (Ramsey 1991a, Williamson and Ralley 1993). Erosion studies along the CRD route also indicated that substantial bank recession and mineral erosion occurred in some areas (e.g., including Notigi reservoir) between 1981 and 2001 (Physical Environment, Part IV), which would have contributed to the increasing concentrations of major ions in the water.
Input of Churchill River water and erosion along the Rat/Burntwood River system also changed the chemistry of the Burntwood River at Thompson; these changes were similar to those observed in Notigi Lake. There has been a long-term increase in sodium in the Burntwood River at Thompson (Figure 5.2.10A-89). Open water potassium concentrations increased (Figure 5.2.10A-88) and calcium decreased (Figure 5.2.10A-87) in 1993–2005 and 1987–1992, respectively, compared to pre-CRD conditions, however, both ions have since stabilized somewhat. Magnesium data are lacking prior to 1974; however, comparison of results from each post-CRD period to 1974–1976 results suggest that current magnesium concentrations are similar to, or possibly slightly lower than, historic values (Figure 5.2.10A-90).
Due to limited data, effects of CRD on Wapisu, Threepoint, and Wuskwatim lakes, and the Burntwood River at First Rapids and the inlet to Split Lake are unclear. The evidence suggests that there was a rapid decrease in calcium (Figure 5.2.10A-91) and magnesium (Figure 5.2.10A-92), and an increase in potassium (Figure 5.2.10A-93) and sodium (Figure 5.2.10A-94) in Wapisu Lake in response to the rapid flushing of the Notigi reservoir and influence of the Churchill River water immediately following diversion. Ions have not been measured in Wapisu Lake since 1977; therefore, the long-term effects are unknown. Conversely, data collected sporadically between 1973 and 2011 suggest that trends in Wuskwatim Lake are similar to those observed at Thompson; potassium (Figure 5.2.10A-95) and sodium (Figure 5.2.10A-96) exhibited permanent increases over 1973 levels, but calcium (Figure 5.2.10A-97) and magnesium (Figure 5.2.10A-98) in Wuskwatim Lake are relatively unchanged compared to 1973.
Data in Threepoint Lake are inadequate for an assessment of temporal changes. However, concentrations of major ions measured recently under CAMP (2009–2013) are similar to those reported during the late 1980s (Figures 5.2.10A-95 to 5.2.10A-98). Studies conducted under FEMP concluded that

REGIONAL CUMULATIVE EFFECTS ASSESSMENT – PHASE II WATER – WATER QUALITY
DECEMBER 2015 5.2-182
major ions in Threepoint Lake vary spatially based on the relative inputs from the Rat, Burntwood, and Footprint rivers, and that changes in flows from any of these inputs alters the chemistry near to that inflow (Ramsey 1991a).
Limited data collected in Apussigamasi Lake and the Burntwood River at First Rapids also suggest that the trends in major cations at these locations are similar to those observed at Thompson. Specifically, current (i.e., 2002–2012) calcium (Figures 5.2.10A-99 and 5.2.10A-100), magnesium (Figures 5.2.10A-101 and 5.2.10A-102), potassium (Figures 5.2.10A-103 and 5.2.10A-104), and sodium (Figures 5.2.10A-105 and 5.2.10A-106) concentrations are relatively unchanged from those measured in 1973 (First Rapids) or 1976 (Apussigamasi Lake). No data were collected in the Burntwood River at the inlet to Split Lake prior to 1986; however, data collected in 2001–2005 and 2006–2012 indicate that calcium (Figure 5.2.10A-107; Table 5.2.10A-4) and sodium (Figure 5.2.10A-108) concentrations are similar to the earlier period, whereas magnesium (Figure 5.2.10A-109) and potassium (Figure 5.2.10A-110) increased.
Chloride concentrations have been low (<16 mg/L) in all lake and river sites downstream of the Notigi CS over the period of record (1967–2013; Figures 5.2.10A-111 to 5.2.10A-116) and have consistently been below the CCME PAL guideline (120 mg/L) indicating conditions have consistently been suitable for aquatic life (CCME 1999, updated to 2015). Chloride and sulphate both fluctuated in all waterbodies in this reach, and all sites exhibited a slight reduction in sulphate during the most recent period (2005–2012; Figures 5.2.10A-117 through 5.2.10A-122). Additionally, sulphate has been well below the BCMOE PAL guideline (126–309 mg/L; Meays and Nordin 2013) throughout the period of record.
5.2.10.3.6 Metals
Few metals were measured prior to CRD in the Rat/Burntwood River system and those measurements that were made are of limited utility due to substantive changes in analytical methods. The following provides an overview of available information regarding mercury in water and effects of hydroelectric development, as well as a brief description of recent conditions for other metals measured under CAMP.
PRE-HYDROELECTRIC DEVELOPMENT
Mercury concentrations in tributaries to Threepoint Lake and in the Burntwood River at Thompson were generally <50 ng/L in 1972–1973; however, the data were subsequently rejected by the respective collection agencies because of sampling and contamination issues (Kozody 1979; Ramsey 1991b).
No record of pre-hydroelectric development measurements of mercury in water could be found for Wapisu, Footprint, Threepoint, Wuskwatim, or Apussigamasi lakes.
POST-HYDROELECTRIC DEVELOPMENT
There are very limited data to characterize total or methylmercury concentrations downstream of Notigi Lake in general, and due to the lack of pre-CRD data there is no direct means for assessing changes over time or effects related to hydroelectric development. Since 2001, total mercury in water has been

REGIONAL CUMULATIVE EFFECTS ASSESSMENT – PHASE II WATER – WATER QUALITY
DECEMBER 2015 5.2-183
measured in most lakes and rivers in this reach but methylmercury data were only located for the Burntwood River at Thompson.
Despite these limitations, existing information indicates that total mercury in water has not increased in this area as a result of hydroelectric development. However, due to high and variable analytical DLs, some increases may have occurred but could not be discerned.
Mercury samples collected in Footprint Lake and the Burntwood River at Thompson between 1977 and 1984 were near to or below the DL (generally 20 ng/L) and, despite contamination issues for samples collected prior to 1976, were considered to indicate that no change in mercury concentrations in water occurred between 1971 and 1979 (Kozody 1979; Williamson 1986). The water along the Rat/Burntwood River system is commonly characterized as being “typical of most other natural water without major anthropogenic contamination” and do not exhibit spatial or temporal trends in concentrations (Rannie and Punter 1987).
More recent data indicate that total mercury concentrations in water remained at or near the DL (generally 20 or 50 ng/L) between 2001 and 2013 at Threepoint, Footprint, and Apussigamasi lakes, and the Burntwood River at the inlet to Split Lake (e.g., Tables 5.2.10A-7 and 5.2.10A-3). Samples analysed at the lowest DL (i.e., DLs lower than the PAL guideline) indicated that nearly all samples were below the Manitoba water quality guideline for PAL (PAL = 26 ng/L; MWS 2011).
Methylmercury concentrations measured in 1989 in the Burntwood River at Thompson were similar to those measured in Granville Lake, an upstream reference (Ramsey 1991b). Augmenting these data with information from mercury concentrations in fish, Ramsey (1991) concluded that methylmercury produced in CRD reservoirs is transported downstream at least as far as Wuskwatim Lake but not as far as Thompson.
Recent monitoring conducted under CAMP indicates that most other metals are also within PAL objectives and guidelines in Threepoint, Footprint, and Apussigamasi lakes, and the Burntwood River at the inlet to Split Lake (Tables 5.2.10A-7 and 5.2.10A-3). Exceptions were that PAL guidelines for aluminum (Figures 5.2.10A-123 and 5.2.10A-124) and iron (Figures 5.2.10A-125 and 5.2.10A-126) were exceeded at each lake, as well as the Burntwood River near Split Lake. These occurrences are relatively common in Manitoba lakes and rivers and are also observed in lakes and rivers unaffected by hydroelectric development (CAMP 2014; Ramsey 1991a). Both iron and aluminum are relatively abundant elements (iron and aluminum are the third and fourth most abundant elements in the earth’s crust, respectively) and elevated concentrations occur in ‘pristine’ environments, including waterbodies in Manitoba. For example, Ramsey (1991a) concluded that high concentrations of aluminum, copper, and iron in the Burntwood (above Threepoint Lake), Footprint (above Footprint Lake), and Aiken rivers (all “natural, unregulated rivers”) were “natural”. Aluminum was also, on average, above the PAL guideline in off-system lakes including Assean (Section 5.2.5.3.6), Granville (Section 5.2.8.3.6), and Setting (Section 5.2.3.3.6) lakes and the off-system Hayes River (Section 5.2.5.3.6) over the period of 2008–2013. High concentrations of iron have also been reported across Canada and elevated aluminum concentrations have been reported for the western Canada region (CCREM 1987). In addition, occasional exceedances of PAL guidelines for copper (Figure 5.2.10A-127) and silver (Figure 5.2.10A-128) were observed in the Burntwood River near Split Lake, though the mean concentrations of both metals are well

REGIONAL CUMULATIVE EFFECTS ASSESSMENT – PHASE II WATER – WATER QUALITY
DECEMBER 2015 5.2-184
below the guidelines. Occasional exceedances of Manitoba PAL objectives and guidelines for metals, including copper and silver, are observed at numerous sites in the RCEA ROI as well as off-system sites (see Tables 5.2.6A-2 and 5.2.8A-5, CAMP 2014, and Ramsey 1991a). For example, Ramsey (1991a) concluded that high concentrations of copper in the Burntwood (above Threepoint Lake), Footprint (above Footprint Lake), and Aiken rivers (all “natural, unregulated rivers”) were “natural”. Copper and silver were also occasionally above the PAL objective and guideline, respectively, in the Hayes River (Table 5.2.6A-2) and copper occasionally exceeded the PAL objective in Assean Lake (Table 5.2.6A-2) over the period of 2008–2013.
5.2.10.4 Cumulative Effects of Hydroelectric Development on Water Quality
Using published literature and de novo data analysis, a number of changes in water quality have been identified in lakes and river reaches along the Rat/Burntwood River system since water quality sampling first began in the late 1960s and early 1970s. Notwithstanding these changes, the Rat/Burntwood River system has always been characterized as having moderate to moderately high nutrients, productive, turbid, and well-oxygenated with off-current areas (e.g., Footprint Lake) exhibiting different water quality than on-current areas.
Some of the observed changes in water quality along the Rat/Burntwood River system differed between the key lakes (Footprint, Threepoint, and Wuskwatim lakes) for which there is substantive data; those changes also frequently differed from those that occurred at the Burntwood River at Thompson.
Sources disagree about the duration of changes in nutrients in Footprint Lake and the Burntwood River at Thompson; however, the overall pattern in the current analysis and the majority of historic studies is of a temporary increase in TP immediately following diversion due to inputs from decaying matter in flooded terrestrial soils in local and upstream reaches. Samples collected during the impoundment and each post-impoundment period exceeded the TP Manitoba narrative nutrient guidelines for lakes/reservoirs and rivers/streams more often than during the pre-development period at both sites. In contrast to the trends observed at the long-term monitoring sites, TP concentrations measured periodically in Wapisu and Wuskwatim lakes and the Burntwood River at First Rapids suggest that TP concentrations in the system are currently lower than those measured during the pre-CRD period.
In contrast to the temporary TP increases observed at both long-term monitoring sites, TN concentrations appear to have permanently been reduced in Footprint Lake and the other lakes and river sites in this reach. This reduction in TN in the system may be due to the permanent inputs of Churchill River water, which has different chemistry. Available data are inadequate to evaluate changes in chlorophyll a over time in Footprint and Apussigamasi lakes, the Burntwood River at Thompson, and the inlet to Split Lake. Limited data suggest, however, that despite changes in the nutrient concentrations in the system, that chlorophyll a has been relatively unaffected or reduced in this reach; this discrepancy is likely because primary production is more limited by light than nutrients. However, the lakes and river reaches are currently classified as mesotrophic/eutrophic and oligotrophic, respectively, which is unchanged from the limited sampling conducted prior to 1973 and to the sampling conducted in the 1980s.

REGIONAL CUMULATIVE EFFECTS ASSESSMENT – PHASE II WATER – WATER QUALITY
DECEMBER 2015 5.2-185
The most widely studied effect of CRD on water quality in the Rat/Burntwood River system is changes in water clarity. Although the river system was historically turbid, impoundment and diversion of the Churchill River increased shoreline erosion and increased the variability of TSS and turbidity measurements in this reach. For the reach as a whole, studies have often been contradictory; multiple studies have concluded that development resulted in reduced water clarity downstream of the Notigi CS whereas others reported that conditions were unchanged. Notably, while mean levels may be similar, some sites have experienced more frequent periods of reduced water clarity since diversion. Differences in the trends of these metrics may also reflect differences in the proportion of fine materials in water (i.e., which has a greater effect on turbidity) and/or other optical characteristics of the water (e.g., colour), as these parameters are known to increase with distance along the river. The study of erosion along the Rat/Burntwood system indeed showed highly variable rates of bank recession and sediment generation, with rates varying depending on the type of substrate (e.g., organic material versus bedrock) and flow or energy in each area (Physical Environment, Part IV).
Dissolved oxygen in the lakes and river reaches between the Notigi CS and Split Lake declined temporarily immediately following diversion (1977–1978); however, concentrations have recovered since that time. The lakes and river reaches of the Rat/Burntwood system were generally well-oxygenated prior to impoundment, experiencing only occasional reductions in concentrations and exceedances of the Manitoba PAL objectives. Immediately following diversion, however, DO declined between Wapisu Lake and the confluence of the Burntwood River with the Odei River to near hypoxic levels which were below the current PAL objectives; recovery occurred at some point between August 1977 and August 1978. On-current locations in this reach have reportedly been well-oxygenated throughout the remainder of the post-CRD period. In contrast, off-current locations (e.g., Footprint Lake) periodically stratify and exhibit reductions in DO at depth that drop below the most stringent PAL objectives; this also occurs in off-system reference lakes (e.g., Leftrook Lake).
Changes in other water quality metrics, including pH, specific conductance, hardness, and major ions, have also been observed to differing degrees in the lacustrine and riverine areas of this reach since initiation of hydroelectric development. As noted above, diversion of the Churchill River into the Rat/Burntwood River system caused changes in a number of water quality parameters due to inherent differences in the chemistry of the water compared to the local drainage. Lacustrine areas throughout this reach have not experienced a change in pH over the period of record; however, there has been a slight increase in the pH of the Burntwood River at Thompson and First Rapids during the open water seasons. Alkalinity, specific conductance, hardness, and the major cations (calcium, potassium and sodium) increased in Footprint Lake during the open water seasons following diversion. In contrast, the on-current sites tended to exhibit permanent reductions in open water season alkalinity, specific conductance, temporary reductions in hardness and calcium, and temporary increases in potassium due to inputs of the Churchill River water. Further, hardness of the water in the Rat/Burntwood River system has been classified as soft to moderately soft/hard during all the pre-development, construction, and post-CRD periods, indicating limited and non-permanent changes to the dissolved constituents of surface water.
Due to a lack of pre-CRD data, changes in total or methylmercury in water related to hydroelectric development cannot be directly assessed. However, comparisons of total mercury measured in Footprint Lake and the Burntwood River at Thompson immediately after diversion were at or near the DL and
REGIONAL CUMULATIVE EFFECTS ASSESSMENT – PHASE II WATER – WATER QUALITY
DECEMBER 2015 5.2-186
indicate that concentrations were either unchanged or negligibly increased in this area following impoundment. This observation is supported by the scientific literature that has established little to no effect on total mercury in water following reservoir creation. Conversely, available information for the area indicates that methylmercury concentrations increased in water post-impoundment and that methylmercury produced in CRD reservoirs was transported downstream at least as far as Wuskwatim Lake but not as far as Thompson. The observation that methylmercury increased as a result of CRD is also supported by the scientific literature, where it has been shown that flooding leads to increased methylation of mercury. Methylmercury measured in 1989 in the Burntwood River at Thompson was similar to an upstream reference, indicating that the effect was temporary.
Much of the historical mercury data are either not reliable (i.e., due to sample contamination issues) or were measured with a high analytical DL precluding comparison of mercury data to current PAL guidelines. However, measurements made with sufficiently low DLs (2009 and 2012–2013 periods) indicate that total mercury was almost always below the PAL guideline in Threepoint, Footprint, Wuskwatim, and Apussigamasi lakes, and the Burntwood River at the inlet to Split Lake; concentrations were also similar between the waterbodies.
Few metals were measured prior to CRD in the Rat/Burntwood River system and those measurements that were made are of limited utility due to substantive changes in analytical methods. Recent monitoring conducted under CAMP indicates that most other metals are also generally within PAL objectives and guidelines in Threepoint, Footprint, and Apussigamasi lakes, and the Burntwood River at the inlet to Split Lake. However, aluminum and iron often exceeded PAL guidelines in all areas monitored from 2008–2013 in the Rat/Burntwood River system. In addition, occasional exceedances of PAL guidelines for copper and silver have been observed in the Burntwood River at the inlet to Split Lake, though the mean concentrations of both metals are well below the guidelines. These occurrences are relatively common in Manitoba lakes and rivers and are also observed in lakes unaffected by hydroelectric development.
Overall, water quality between the Notigi CS and Split Lake has been suitable for aquatic life prior to and following hydroelectric development. Current conditions and their comparison to available water quality guidelines and objectives for the protection of freshwater aquatic life indicate that water quality in this area is currently suitable to support aquatic life.
REGIONAL CUMULATIVE EFFECTS ASSESSMENT – PHASE II WATER – WATER QUALITY
DECEMBER 2015 5.2-187
5.2.11 Area 4: Missi Falls Control Structure to the Churchill River Estuary
The Lower Churchill River area extends from the Missi Falls CS at SIL to the Churchill River Estuary and includes a number of lakes (Partridge Breast, Northern Indian, Fidler, and Billard lakes), as well as the Churchill Weir (Maps 5.2.11-1 and 5.2.11-2). A description of the construction and operation of hydroelectric developments in the Miss Falls CS to the Churchill River estuary reach is found in Part II Hydroelectric Development Project Description in the Region of Interest. A detailed description of effects of hydroelectric development to the water regime is provided in Chapter 4.3 (Water Regime). Key points of the project description and water regime relevant to water quality are summarized below.
The Missi Falls CS was constructed between 1973 and 1976. In terms of effects of CRD downstream of SIL on the lower Churchill River, minor effects associated with construction of the Missi Falls CS began in August 1973 (i.e., minor reductions in outflows began at this time). However, major staging of SIL was not initiated until June 1976, at which time discharge from the Missi Falls CS was substantially reduced.
CRD resulted in dewatering of approximately 78.6 sq mi (203.7 km2; Water Regime, Section 4.3.3.3). Despite the reduction in inflows, high flow conditions still occur in some years on the lower Churchill River and operation of CRD sometimes causes rapid flow increases (Water Regime, Section 4.3.3.3). The influence of discharge from local tributaries on the lower Churchill River increased after CRD. Prior to CRD local tributaries contributed on average approximately 17% of discharge, whereas after CRD local tributaries contributed on average approximately 54% of discharge, in the lower Churchill River at Red Head Rapids (Water Regime, Section 4.3.3.3).
Construction activities in the SIL area may have affected water quality in the lake beginning as early as 1972. Changes in some water quality metrics were observed in the Missi Falls CS area over the period of 1974–1976 and these changes could have affected water quality downstream in the lower Churchill River. Therefore, conceptually, effects of CRD may have occurred in the lower Churchill River as early as 1972, or notably, over the 1974–1976 period as observed upstream. Conversely, as large changes in flows in the lower Churchill River associated with CRD were first initiated in 1976, previous assessments have identified data collected prior to 1976 as representative of pre-CRD conditions.
Water quality data for the lower Churchill River are limited for the early 1970s, which affects the ability to evaluate changes associated with multiple time intervals over this period. For the purposes of this assessment, 1976, when large changes in flows were first initiated, has been designated as the period of construction. Data collected after 1976 were considered to represent post-CRD conditions (i.e., operation period). As described in Section 5.2.11.2, where sufficient data exist, separate analyses also considered potential changes during the 1974–1976 period, when some effects related to construction were observed upstream.

Churchill River Weir
Limestone Lake
FidlerLake
River
GauerLake
Red Head Rapids
PelletierLake
RecluseLake
Churc
hill
WaskaiowakaLake
Billard Lake
PartridgeBreast LakeSouthern
IndianLake Thorsteinson
Lake
Churchill
River
HUDSONBAY
Northern Indian Lake
RiverChurchill
Little
Missi Falls
Control Structure
Churchill
Missi Falls Control Structure to Churchill River Estuary
1.0
28-OCT-15
North/South Consultants
04-DEC-15
Province of Manitoba, Government of Canada and Manitoba Hydro.
Water Quality Assessment AreaMissi Falls Control Structure
to Churchill River Estuary RCEA Area 4
LegendRCEA Region of InterestWater Quality Reach BoundaryFirst Nation Reserve
Hudson Bay
Thompson
Churchill
NAD 1983 UTM Zone 14N
DATA SOURCE:
COORDINATE SYSTEM: DATE CREATED:
CREATED BY:
VERSION NO:
REVISION DATE:
QA/QC:
Regional Cumulative Effects Assessment
0 10 20 Miles
0 10 20 Kilometres
Cre
ated
By:
cpa
rker
- B
Siz
e La
ndsc
ape
STD
- M
AR
201
5
Sca
le: 1
:1,2
47,0
00
RCEAArea 4
InfrastructureControl StructureTransmission Line (Existing)RailHighway
Map 5.2.11-1

Water Quality Sampling Sites Southern Indian Lake to Churchill River Estuary
Province of Manitoba, Government of Canada, North/South Consultants andManitoba Hydro.
North/South Consultants
2.0
27-MAY-15 03-DEC-15
100
110
Oldman River
FB0001ECS004
AB0001
FBS002
FAS008
FDS004
FAS007
ABS002
FBS004
FBS003
Gauer River
Little Beaver River
Little Churchill River
W5
W4
River
NorthernIndian
L.
HudsonBay
Lake
Lake
Haye
s
RiverGauerLake
Nelson
Fidler L.
Indian
Churchill
River
Tadoule
Billard L.
Southern
WaskaiowakaLake Kettle G.S.
Limestone G.S.
Long Spruce G.S.
Keeyask G.S.
Conawapa G.S.
280
493
Churchill
Cre
ated
By:
cpa
rker
- B
Siz
e La
ndsc
ape
BTB
- M
AR
201
5
Sca
le: 1
:1,3
17,3
50
Regional Cumulative Effects Assessment
NAD 1983 UTM Zone 14N
0 10 20 Miles
0 10 20 Kilometres
File
Loc
atio
n: J
:\MY
P\M
H_R
CE
A\W
ater
_Qua
lity\
PH
AS
E_2
\MX
D\R
epor
t_M
aps\
Are
a4\2
0151
203_
RC
EA
_Pha
seII_
AE
_WQ
_Wat
erQ
ualit
ySam
plin
gSite
sSIL
ToC
hurc
hillR
iver
Est
uary
_cp.
mxd
DATA SOURCE:
DATE CREATED:
CREATED BY:
VERSION NO:
REVISION DATE:
QA/QC:
COORDINATE SYSTEM:
Water Quality Sampling Sites
FD0002
FDS003
W3
W2
W1
FD0001FDS002
FDS0018049B
CROF
FAS003
FAS006
FAS009
Missi FallsControl Structure
Site 43 Partidge Breast Lake
NOTES:(MH) Manitoba Hydro(EC) Environment Canada(DFO) Fisheries and Oceans Canada(CAMP) Coordinated Aquatic Monitoring Program(MCWS) Manitoba Conservation and Water Stewardship(LWCNRSB) Lake Winnipeg,Churchill and Nelson Rivers Study Board
0 2.5 5 Kilometres
0 1 2 Miles
0 250 500 Metres
0 500 1,000 Feet
0 0.5 1 Kilometres
0 0.25 0.5 Miles Hudson Bay
Thompson
Churchill
RCEAArea 4
Legend
MH
EC
DFO
CAMP
MCWS
LWCNRSB
Generating Station (Existing)
Generating Station (Under Construction)
Generating Station (Potential)
RCEA Region of Interest
First Nation Reserve
Highway
LWCNRSB (unknown co-ordinates)
Churchill Weir
Map 5.2.11-2
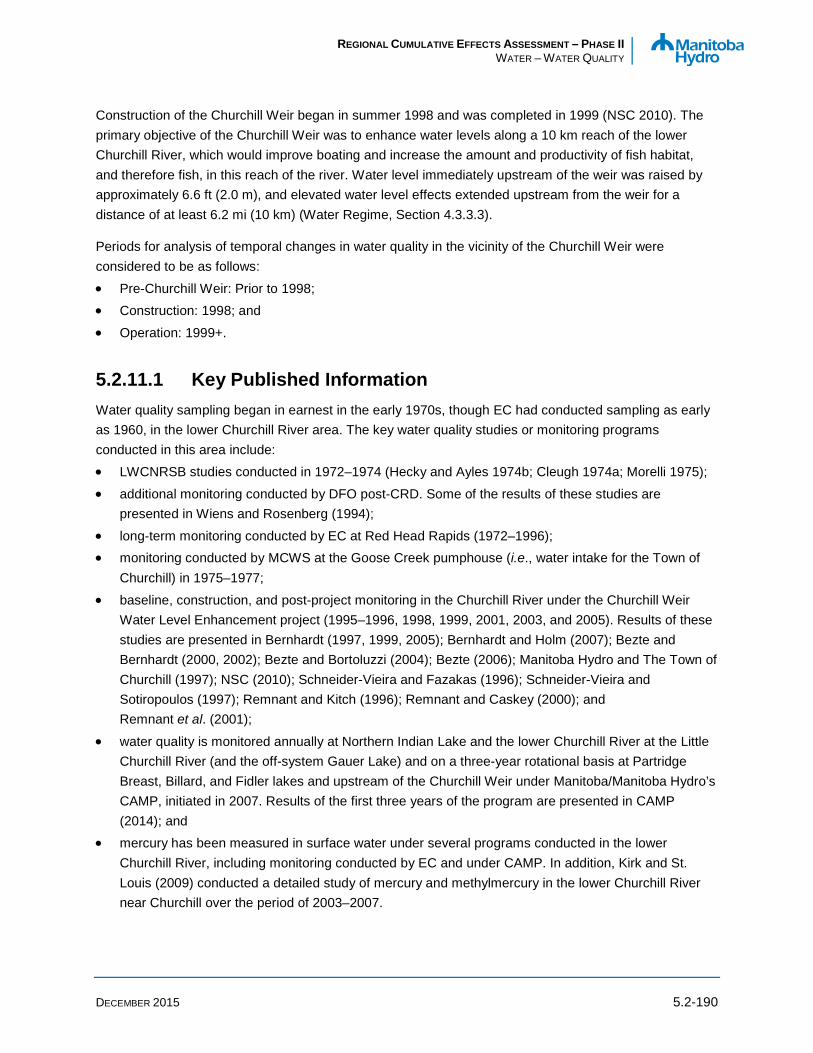
REGIONAL CUMULATIVE EFFECTS ASSESSMENT – PHASE II WATER – WATER QUALITY
DECEMBER 2015 5.2-190
Construction of the Churchill Weir began in summer 1998 and was completed in 1999 (NSC 2010). The primary objective of the Churchill Weir was to enhance water levels along a 10 km reach of the lower Churchill River, which would improve boating and increase the amount and productivity of fish habitat, and therefore fish, in this reach of the river. Water level immediately upstream of the weir was raised by approximately 6.6 ft (2.0 m), and elevated water level effects extended upstream from the weir for a distance of at least 6.2 mi (10 km) (Water Regime, Section 4.3.3.3).
Periods for analysis of temporal changes in water quality in the vicinity of the Churchill Weir were considered to be as follows:
• Pre-Churchill Weir: Prior to 1998; • Construction: 1998; and
• Operation: 1999+.
5.2.11.1 Key Published Information Water quality sampling began in earnest in the early 1970s, though EC had conducted sampling as early as 1960, in the lower Churchill River area. The key water quality studies or monitoring programs conducted in this area include: • LWCNRSB studies conducted in 1972–1974 (Hecky and Ayles 1974b; Cleugh 1974a; Morelli 1975);
• additional monitoring conducted by DFO post-CRD. Some of the results of these studies are presented in Wiens and Rosenberg (1994);
• long-term monitoring conducted by EC at Red Head Rapids (1972–1996); • monitoring conducted by MCWS at the Goose Creek pumphouse (i.e., water intake for the Town of
Churchill) in 1975–1977;
• baseline, construction, and post-project monitoring in the Churchill River under the Churchill Weir Water Level Enhancement project (1995–1996, 1998, 1999, 2001, 2003, and 2005). Results of these studies are presented in Bernhardt (1997, 1999, 2005); Bernhardt and Holm (2007); Bezte and Bernhardt (2000, 2002); Bezte and Bortoluzzi (2004); Bezte (2006); Manitoba Hydro and The Town of Churchill (1997); NSC (2010); Schneider-Vieira and Fazakas (1996); Schneider-Vieira and Sotiropoulos (1997); Remnant and Kitch (1996); Remnant and Caskey (2000); and Remnant et al. (2001);
• water quality is monitored annually at Northern Indian Lake and the lower Churchill River at the Little Churchill River (and the off-system Gauer Lake) and on a three-year rotational basis at Partridge Breast, Billard, and Fidler lakes and upstream of the Churchill Weir under Manitoba/Manitoba Hydro’s CAMP, initiated in 2007. Results of the first three years of the program are presented in CAMP (2014); and
• mercury has been measured in surface water under several programs conducted in the lower Churchill River, including monitoring conducted by EC and under CAMP. In addition, Kirk and St. Louis (2009) conducted a detailed study of mercury and methylmercury in the lower Churchill River near Churchill over the period of 2003–2007.
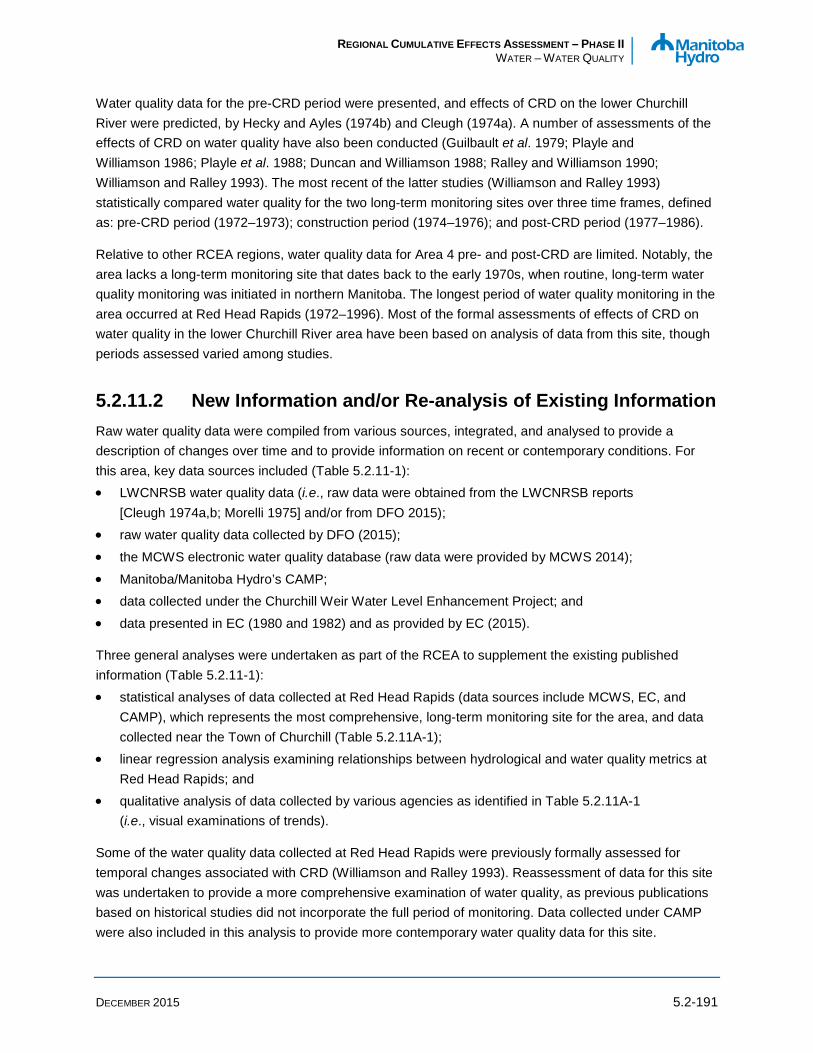
REGIONAL CUMULATIVE EFFECTS ASSESSMENT – PHASE II WATER – WATER QUALITY
DECEMBER 2015 5.2-191
Water quality data for the pre-CRD period were presented, and effects of CRD on the lower Churchill River were predicted, by Hecky and Ayles (1974b) and Cleugh (1974a). A number of assessments of the effects of CRD on water quality have also been conducted (Guilbault et al. 1979; Playle and Williamson 1986; Playle et al. 1988; Duncan and Williamson 1988; Ralley and Williamson 1990; Williamson and Ralley 1993). The most recent of the latter studies (Williamson and Ralley 1993) statistically compared water quality for the two long-term monitoring sites over three time frames, defined as: pre-CRD period (1972–1973); construction period (1974–1976); and post-CRD period (1977–1986).
Relative to other RCEA regions, water quality data for Area 4 pre- and post-CRD are limited. Notably, the area lacks a long-term monitoring site that dates back to the early 1970s, when routine, long-term water quality monitoring was initiated in northern Manitoba. The longest period of water quality monitoring in the area occurred at Red Head Rapids (1972–1996). Most of the formal assessments of effects of CRD on water quality in the lower Churchill River area have been based on analysis of data from this site, though periods assessed varied among studies.
5.2.11.2 New Information and/or Re-analysis of Existing Information Raw water quality data were compiled from various sources, integrated, and analysed to provide a description of changes over time and to provide information on recent or contemporary conditions. For this area, key data sources included (Table 5.2.11-1): • LWCNRSB water quality data (i.e., raw data were obtained from the LWCNRSB reports
[Cleugh 1974a,b; Morelli 1975] and/or from DFO 2015); • raw water quality data collected by DFO (2015);
• the MCWS electronic water quality database (raw data were provided by MCWS 2014);
• Manitoba/Manitoba Hydro’s CAMP; • data collected under the Churchill Weir Water Level Enhancement Project; and
• data presented in EC (1980 and 1982) and as provided by EC (2015).
Three general analyses were undertaken as part of the RCEA to supplement the existing published information (Table 5.2.11-1): • statistical analyses of data collected at Red Head Rapids (data sources include MCWS, EC, and
CAMP), which represents the most comprehensive, long-term monitoring site for the area, and data collected near the Town of Churchill (Table 5.2.11A-1);
• linear regression analysis examining relationships between hydrological and water quality metrics at Red Head Rapids; and
• qualitative analysis of data collected by various agencies as identified in Table 5.2.11A-1 (i.e., visual examinations of trends).
Some of the water quality data collected at Red Head Rapids were previously formally assessed for temporal changes associated with CRD (Williamson and Ralley 1993). Reassessment of data for this site was undertaken to provide a more comprehensive examination of water quality, as previous publications based on historical studies did not incorporate the full period of monitoring. Data collected under CAMP were also included in this analysis to provide more contemporary water quality data for this site.
REGIONAL CUMULATIVE EFFECTS ASSESSMENT – PHASE II WATER – WATER QUALITY
DECEMBER 2015 5.2-192
Furthermore, past assessments separated data into different periods than identified for this analysis. For the present purposes, pre-CRD (defined as prior to 1976) were compared to post-CRD (defined as post-1976); data for the construction period (i.e., 1976) were inadequate for statistical analysis. Where there were sufficient data, statistical comparisons were also conducted between the time frames examined for the upstream Area 3 (i.e., SIL): 1972–1973; 1974–1976; and 1977+. This second analysis was undertaken as some water quality effects were observed upstream in SIL near the Missi Falls CS as early as 1974 (see Section 5.2.8.3).
All raw data analysed and summarized were standardized to consider the open water (defined as June–October) and ice cover (defined as December–April) seasons separately, as seasonal differences exist for a number of water quality metrics. Past assessments of the Red Head Rapids data set analysed all data (regardless of season) collectively.
Data collected at sites located upstream of the study area (i.e., in the vicinity of the outflow of SIL near the Missi Falls CS) presented in Section 5.2.8 were also incorporated into the assessment of water quality in Area 4 to provide context (i.e., inflowing conditions).
Inventories of water quality data that were analysed are indicated in Table 5.2.11A-1 and a summary of the waterbodies and periods subjected to detailed analysis is provided in Table 5.2.11-1.
Table 5.2.11-1: Water Quality Data Subject to Detailed Analysis
Waterbody Period of Record
Southern Indian Lake – near the Missi Falls CS 1972–1989, 2008–2013
Lower Churchill River downstream of Missi Falls 1972–1973
Partridge Breast Lake 1973–1976, 2009/2010; 2012/2013
Northern Indian Lake 1973, 2008–2013/2014
Fidler Lake 1973, 2011/2012
Lower Churchill River below Fidler Lake 1972–1978
Billard Lake 2010/2011; 2013/2014
Lower Churchill River at the Little Churchill River 2008–2013/2014
Lower Churchill River at Red Head Rapids 1972–1996, 2011/2012
Lower Churchill River at Churchill 1972–1977, 1995–1996, 1999, 2001, 2003, 2005
Tributaries
Little Churchill River 1972–1974
Little Beaver River 1972–1974
Gauer River 1972–1974
Oldman River 1972–1974
Note: CS = Control Structure.
REGIONAL CUMULATIVE EFFECTS ASSESSMENT – PHASE II WATER – WATER QUALITY
DECEMBER 2015 5.2-193
5.2.11.3 Changes in Indicators over Time Potential effects of CRD on water quality in the lower Churchill River area, including riverine and lacustrine areas, relate to changes in hydrology, notably reductions in discharge, depths, volumes, and increases in water residence times. Decreased discharge from upstream (i.e., at the Missi Falls CS) directly affected hydrology and morphometry of lakes in this area, but also indirectly affected conditions by altering the relative influence of local tributary inflows on the lower Churchill River. Water quality in local tributaries differed from the Churchill River prior to and following CRD. These differences affected water quality conditions in the lower Churchill River following CRD due to changes in discharge at the Missi Falls CS. Over the period of 1972–1975, prior to major CRD-related changes in hydrology, local streams contributed approximately 17% of the river discharge at Red Head Rapids. Following CRD (i.e., period of 1977–2013) the proportion increased to 54% on average (Water Regime, Section 4.3.3.3).
Water quality could also be affected in the lower Churchill River due to changes in water quality conditions upstream, at the Missi Falls CS. Therefore, effects of CRD on water quality in SIL are of relevance to discussions of water quality in the lower Churchill River.
5.2.11.3.1 Nutrients and Trophic Status
PRE-HYDROELECTRIC DEVELOPMENT
Prior to CRD, the upper Churchill River provided the majority of nutrients (i.e., loads) to the lower Churchill River (Cleugh 1974a). Nitrogen concentrations were relatively similar across lakes located in the upper reaches of the lower Churchill River prior to 1976. Data are inadequate to characterize conditions downstream of Fidler Lake prior to CRD (Figure 5.2.11A-1). Available data, indicate that TP concentrations decreased along the length of the river, possibly owing to the lower concentrations observed in small tributaries relative to the Churchill River proper (Figures 5.2.11A-2 and 5.2.11A-3).
Lakes were oligotrophic to mesotrophic based on TN (Figure 5.2.11A-1) and chlorophyll a (Figure 5.2.11A-4). Riverine sites were generally oligotrophic based on chlorophyll a (data are inadequate for TN for riverine sites). Differences in trophic status reflect, in part, application of different trophic classification schemes for lakes and rivers.
Phosphorus concentrations were indicative of meso-eutrophic conditions in lakes and mesotrophic conditions at riverine sites (Figure 5.2.11A-2). In this instance, the difference in trophic classification is a reflection of lower TP concentrations at the downstream riverine sites. Data collected at lake sites were generally obtained from DFO (2015), whereas data for river sites were provided by MCWS (2014), EC (2014), and Morelli (1975); differences in water quality metrics between these sites may reflect differences in sampling and/or analytical methods rather than true spatial differences.
TP was not significantly correlated to total discharge at Red Head Rapids, the Missi Falls CS, or local tributaries or the relative proportion of local vs. upstream discharge at Red Head Rapids prior to CRD (Table 5.2.11-2). TN data were inadequate for regression analysis.
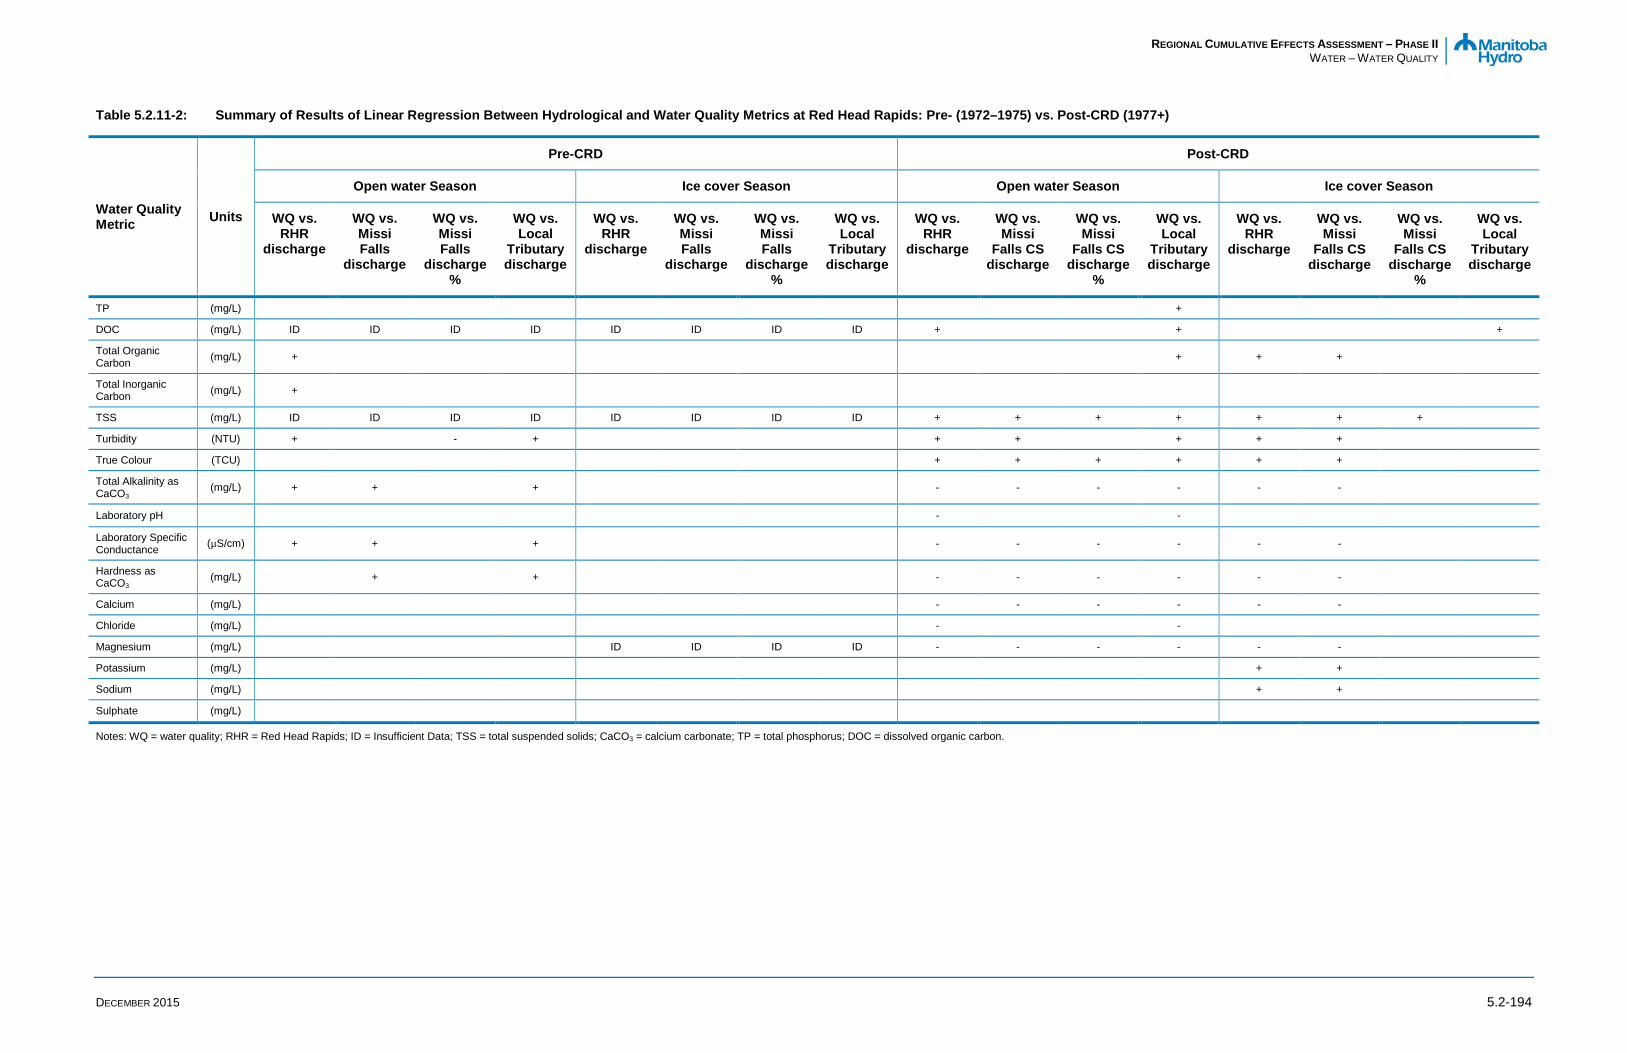
REGIONAL CUMULATIVE EFFECTS ASSESSMENT – PHASE II WATER – WATER QUALITY
DECEMBER 2015 5.2-194
Table 5.2.11-2: Summary of Results of Linear Regression Between Hydrological and Water Quality Metrics at Red Head Rapids: Pre- (1972–1975) vs. Post-CRD (1977+)
Water Quality Metric Units
Pre-CRD Post-CRD
Open water Season Ice cover Season Open water Season Ice cover Season
WQ vs. RHR
discharge
WQ vs. Missi Falls
discharge
WQ vs. Missi Falls
discharge %
WQ vs. Local
Tributary discharge
WQ vs. RHR
discharge
WQ vs. Missi Falls
discharge
WQ vs. Missi Falls
discharge %
WQ vs. Local
Tributary discharge
WQ vs. RHR
discharge
WQ vs. Missi
Falls CS discharge
WQ vs. Missi
Falls CS discharge
%
WQ vs. Local
Tributary discharge
WQ vs. RHR
discharge
WQ vs. Missi
Falls CS discharge
WQ vs. Missi
Falls CS discharge
%
WQ vs. Local
Tributary discharge
TP (mg/L)
+
DOC (mg/L) ID ID ID ID ID ID ID ID +
+
+
Total Organic Carbon (mg/L) +
+ + +
Total Inorganic Carbon (mg/L) +
TSS (mg/L) ID ID ID ID ID ID ID ID + + + + + + +
Turbidity (NTU) +
- +
+ +
+ + +
True Colour (TCU)
+ + + + + +
Total Alkalinity as CaCO3
(mg/L) + +
+
- - - - - -
Laboratory pH
-
-
Laboratory Specific Conductance (µS/cm) + +
+
- - - - - -
Hardness as CaCO3
(mg/L)
+
+
- - - - - -
Calcium (mg/L)
- - - - - -
Chloride (mg/L)
-
-
Magnesium (mg/L)
ID ID ID ID - - - - - -
Potassium (mg/L)
+ +
Sodium (mg/L)
+ +
Sulphate (mg/L)
Notes: WQ = water quality; RHR = Red Head Rapids; ID = Insufficient Data; TSS = total suspended solids; CaCO3 = calcium carbonate; TP = total phosphorus; DOC = dissolved organic carbon.
REGIONAL CUMULATIVE EFFECTS ASSESSMENT – PHASE II WATER – WATER QUALITY
DECEMBER 2015 5.2-195
POST-HYDROELECTRIC DEVELOPMENT
There are limited data available for a temporal assessment of changes in nutrients and trophic status over time in the lower Churchill River. As there are little to no reliable TN data for comparison to post-CRD datasets (see Section 5.2.1.4.2 for details), effects of CRD on this metric cannot be assessed (Figure 5.2.11A-5). Though data are inadequate to quantitatively assess changes in nitrogen associated with CRD, lakes on the lower Churchill River have fluctuated between oligotrophic and mesotrophic status on the basis of TN since the early 1970s (Figure 5.2.11A-6).
While the range of TP concentrations increased at Red Head Rapids after 1976, phosphorus was not significantly different pre- vs. post-CRD at this site (Figure 5.2.11A-7). This observation agrees with the results of an earlier assessment that included data up to 1986 (Williamson and Ralley 1993). TP was also not significantly different near the Missi Falls CS after CRD (Figure 5.2.11A-7). Conversely, available data indicate TP significantly increased near the Town of Churchill following CRD, though the majority of post-CRD data were collected in the 1990s and early 2000s and effects during the initial period of operation are not well defined. Furthermore, there is a lack of recent water quality information on major tributaries in this area and it is not known if conditions have changed over time in these systems. On average, TP concentrations remained within the Manitoba narrative nutrient guideline for streams (0.050 mg/L) prior to and following CRD at both sites (Figure 5.2.11A-8).
A significant positive correlation was found between discharge of local tributaries and TP concentrations following CRD at Red Head Rapids (R2 = 0.143; Tables 5.2.11-2 and 5.2.11A-3), while no significant correlation was found prior to CRD (Tables 5.2.11-2 and 5.2.11A-2). This suggests that local tributaries became a dominant driver of phosphorus conditions post-CRD in at least some portion of the lower Churchill River. However, no significant correlation was found for the ice cover season (Table 5.2.11-2 and 5.2.11A-4). Kirk and St. Louis (1999) also reported nutrients in the lower Churchill River near Churchill “roughly followed the hydrological cycle” in the open water season, peaking during high-flow periods. The latter observation agrees with the conclusion of Playle and Williamson (1986) who reported that TP increased at the Churchill water intake post-CRD; this effect was thought be a reflection of the reduced influence of the Churchill River discharge post-CRD.
Like nitrogen, there are insufficient data to quantitatively assess changes in phosphorus in lower Churchill River lakes associated with CRD. However, available data indicate TP may have decreased in Partridge Breast, Northern Indian, and Fidler lakes after CRD (Figure 5.2.11A-9). A decrease in TP in lakes after CRD could occur due to increased water residence times and/or changes in the relative influence of local tributaries. While average TP concentrations were near or above the Manitoba narrative nutrient guideline (0.025 mg/L) during some years in each of the lakes prior to CRD, average concentrations were consistently below the guideline in years where monitoring was conducted post-CRD (Figure 5.2.11A-10).
There are insufficient data to conduct statistical analyses of changes in chlorophyll a concentrations associated with CRD at Red Head Rapids or near Churchill (Figure 5.2.11A-11). Available data indicate that lakes were typically mesotrophic prior to and following CRD (Figure 5.2.11A-12).
REGIONAL CUMULATIVE EFFECTS ASSESSMENT – PHASE II WATER – WATER QUALITY
DECEMBER 2015 5.2-196
5.2.11.3.2 Water Clarity
PRE-HYDROELECTRIC DEVELOPMENT
Lakes and riverine reaches of the lower Churchill River were relatively clear prior to CRD, as indicated by low concentrations of TSS and turbidity levels (Figures 5.2.11A-13 and 5.2.11A-14). Conditions were also similar along the length of the river in both the open water and ice cover seasons. Similar conditions were measured in small tributaries to the lower Churchill River.
TSS data are insufficient to evaluate correlations with hydrological metrics prior to CRD. However, turbidity was significantly positively correlated with discharge at Red Head Rapids (R2 = 0.445) and discharge of local tributaries (R2 = 0.709), and negatively correlated to the proportion of Churchill River discharge at Red Head Rapids during the open water season (R2 = 0.573; Tables 5.2.11-2 and 5.2.11A-2). This conflicts with the results reported by Duncan and Williamson (1988), where no correlation between discharge and turbidity at Red Head Rapids was found. Differences may be due to analysis of different data sets and/or methods of analysis. Duncan and Williamson (1988) analysed open water and ice cover season data collectively whereas the present analysis examined the two seasons separately.
POST-HYDROELECTRIC DEVELOPMENT
There are limited data available for a temporal assessment of changes in water clarity metrics over time in the lower Churchill River. Data are insufficient for temporal analysis of TSS at Red Head Rapids and turbidity at Churchill (Figures 5.2.11A-15 and 5.2.11A-16). However, TSS and turbidity were not significantly different post-CRD relative to pre-CRD at Churchill and Red Head Rapids, respectively (Figures 5.2.11A-15 and 5.2.11A-16). This generally agrees with assessments of effects observed upstream, where turbidity was found to be unchanged at the Missi Falls CS during the initial years of operation (Section 5.2.8.3.2). Similarly, qualitative comparison of TSS, turbidity, and Secchi disk depth in lower Churchill River lakes prior to and following CRD indicate relatively similar conditions (Figure 5.2.11A-17).
Linear regression analyses indicate that both turbidity and TSS were significantly positively correlated with three of the four hydrological metrics examined (Missi Falls CS, Red Head Rapids, and local tributary discharge) for the open water season following CRD (Tables 5.2.11-2 and 5.2.11A-3). TSS was also positively correlated to the proportion of flow at Red Head Rapids from the upper Churchill River. Positive correlations with total discharge and discharge at the Missi Falls CS were also observed for the ice cover season. Positive correlations with flow are relatively common as shoreline erosion and sediment resuspension typically increase, while sedimentation decreases, with increasing discharge. The strongest correlation for TSS occurred for the discharge at the Missi Falls CS (R2 = 0.448), suggesting that the influence of the major inflow (i.e., the upper Churchill River) to the region is the largest driver. Duncan and Williamson (1988) also reported significant positive correlations between TSS (measured as non-filterable residue) and turbidity and discharge at Red Head Rapids.
The lack of significant increases in turbidity or TSS at the Churchill or Red Head Rapids sites generally agrees with the results of past assessments (e.g., Playle and Williamson 1988; Williamson and Ralley
REGIONAL CUMULATIVE EFFECTS ASSESSMENT – PHASE II WATER – WATER QUALITY
DECEMBER 2015 5.2-197
1993). Conversely, Wiens and Rosenberg (1994) stated that TSS increased post-CRD, notably in Partridge Breast Lake and that Fidler Lake became “highly turbid” due to wave action along the dried former littoral zone. TSS and turbidity data were not presented in Wiens and Rosenberg (1994). Guilbault et al. (1979) reported that turbidity increased in the lower Churchill River (downstream of Fidler Lake) post-CRD, based on data collected between 1961 and 1977. It should be noted, however, that this assessment was based on limited data for the post-CRD period (five to six data points) at a time with above-average Churchill River discharge.
Available data (Figure 5.2.11A-15) and literature (Bernhardt and Holm 2007) indicate TSS was relatively consistent pre- vs. post-Churchill Weir in the lower Churchill River. Higher concentrations of TSS were observed downstream of the Churchill Weir during the construction period and occasionally during the operation period (Bernhardt and Holm 2007). In the latter instance, these increases were believed to be related the extremely high river discharge during that year.
5.2.11.3.3 Dissolved Oxygen
PRE-HYDROELECTRIC DEVELOPMENT
Lakes on the Churchill River were not thermally stratified in the open water or ice cover seasons of 1972 and 1973 (Cleugh 1974a). With the exception of one sampling period (June 1973), DO concentrations were near saturation and above the Manitoba PAL water quality objectives near the surface and at depth (where measured) in the Churchill River (near Missi Falls), and Partridge Breast, Northern Indian, and Fidler lakes in the open water and ice cover seasons of 1972 and 1973 (Figures 5.2.11A-18 and 5.2.11A-19). DO concentrations were below PAL objectives at all four sites in June 1973 (Figure 5.2.11A-18). As previously noted, oxygen depletion was also documented by the LWCNRSB at multiple sites on the Rat/Burntwood and upper and lower Nelson rivers during this sampling period (Cleugh 1974a), suggesting that the DO data may be erroneous. Wiens and Rosenberg (1994) reported that “oxygen depletion was never observed prior to or after diversion in any of the LCR [Lower Churchill River] lakes because of the short water-residence times.” This statement was based on the LWCNRSB and subsequent DFO field programs conducted in the lower Churchill River; however, as data were not presented it is unknown if the authors excluded data collected in June 1973 from their assessment.
POST-HYDROELECTRIC DEVELOPMENT
There is no information available for the initial years of CRD operation to determine if thermal stratification developed in lower Churchill River lakes. Recent monitoring conducted over the period of 2009–2013 under CAMP at Partridge Breast, Northern Indian, Fidler, and Billard lakes and at two riverine sites (near the Little Churchill River inflow and at Red Head Rapids) indicates thermal stratification occurs on occasion in at least one lake. Northern Indian Lake was thermally stratified in spring 2008 and summer 2013 (Table 5.2.11A-5, Figure 5.2.11A-20). Stratification was also observed in spring 2008 in Area 4 of SIL and in spring 2008 and summer 2013 at the off-system Gauer Lake.
Few study programs have measured DO along the lower Churchill River and effects of CRD on this metric, as well as potential trends over time, cannot be discerned with available information. Wiens and Rosenberg (1994) noted that oxygen depletion was not observed prior to or following CRD in lower
REGIONAL CUMULATIVE EFFECTS ASSESSMENT – PHASE II WATER – WATER QUALITY
DECEMBER 2015 5.2-198
Churchill River lakes due to short water residence times, though data were not presented. Monitoring conducted under CAMP over the period of 2008-2013 indicates the lakes and riverine reaches are well-oxygenated in the open water and ice cover seasons currently (Table 5.2.11A-5). All recent measurements of DO have been within the most stringent Manitoba PAL objectives.
Although data for the immediate post-CRD period are lacking, potential effects of CRD on DO in the lower Churchill River area would be related primarily to reductions in discharge. Effects would be expected to be greatest in the ice cover season, when reduced flows and volumes coupled with minimal opportunities for reaeration would have the greatest potential for DO depletion. Furthermore, as noted in Section 4.3.3.3.4 (Water Regime), CRD resulted in an increased area with ice cover due to reduced winter discharge and water velocities. This pathway of effect, unlike effects related to flooding, for example, is permanent and any effects would continue to the present day. That no DO depletion has been observed under CAMP suggests that CRD has not caused notable or critical reductions in DO and that conditions are suitable for aquatic life presently, and likely have been since CRD was initiated. However, low DO concentrations could occur under low flows during winter, notably at relatively shallow riverine sites. Sufficient water for sampling could not be located in the lower Churchill River at the Little Churchill River in March 2014 during the CAMP winter sampling program, suggesting that some areas may experience low water volumes and flows under ice cover; such conditions could lead to critical DO depletion.
5.2.11.3.4 pH, Alkalinity, Hardness, and Specific Conductance
PRE-HYDROELECTRIC DEVELOPMENT
Local tributaries to the lower Churchill River were harder and had higher alkalinity and specific conductance than the lower Churchill River at Missi Falls prior to CRD (Figures 5.2.11A-21, 5.2.11A-22, and 5.2.11A-23, respectively). Lakes and riverine reaches were on average soft year-round, whereas small tributaries were generally moderately soft in the open water season and harder in the ice cover season. pH was similar between the river and small tributaries and was consistently within the PAL guideline range (6.5-9.0; Figure 5.2.11A-24). Alkalinity, hardness, and specific conductance at Red Head Rapids were positively correlated to upper Churchill River discharge (i.e., discharge at Missi Falls) and local tributary discharge prior to CRD (Table 5.2.11-2).
POST-HYDROELECTRIC DEVELOPMENT
Alkalinity, hardness, and specific conductance increased in the lower Churchill River after CRD, which is in general agreement with the results of previous assessments (Playle and Williamson 1986; Williamson and Ralley 1993). Playle and Williamson (1986) attributed these, and other, changes to the reduced influence of the Churchill River discharge post-CRD. The authors also reported that specific conductance and alkalinity measured over the period of July 1976 to December 1977 were higher in three tributaries to the lower Churchill River (Gauer, Oldman, and Little Churchill rivers) than the Churchill River at the Missi Falls CS and at the Churchill water intake prior to CRD.
Statistically significant increases in hardness (Figure 5.2.11A-25), specific conductance (Figure 5.2.11A-26) and alkalinity (Figure 5.2.11A-27) were observed for both the open water and ice

REGIONAL CUMULATIVE EFFECTS ASSESSMENT – PHASE II WATER – WATER QUALITY
DECEMBER 2015 5.2-199
cover seasons after 1976 at Red Head Rapids. Specific conductance was also significantly higher after 1976 at a site located near the Town of Churchill. Although alkalinity and hardness were not statistically different pre- (1972–1975) vs. post-CRD (1977+) at this site, these observations may be a result of the relatively limited dataset. Specific conductance, alkalinity, and hardness began increasing at Red Head Rapids and near Churchill as early as 1974; changes were also observed upstream near the Missi Falls CS prior to 1977. When data for the lower Churchill River were parsed into time periods reflective of activities upstream (i.e., 1972–1973, 1974–1976, and post-1976), significant increases in specific conductance (Figure 5.2.11A-28) and total alkalinity (Figure 5.2.11A-29) were apparent within the 1974–1976 time frame, prior to major hydrological changes in the lower Churchill River. Increases in specific conductance, alkalinity, and hardness were also observed near the Missi Falls CS indicating that changes observed in the lower Churchill River were at least in part due to changes that occurred upstream in SIL. Specific conductance (Figure 5.2.11A-30) and hardness (Figure 5.2.11A-31) also increased in lower Churchill River lakes; data are inadequate to assess changes in alkalinity in lakes. All three water quality metrics appear to have experienced a positive trend at Red Head Rapids over the long-term monitoring period ending in 1996. Data are insufficient to determine if this potential trend continues at present.
Each of these metrics show significant relationships with hydrological conditions, though the direction of the relationships changed between the pre- and post-CRD periods. As noted above, alkalinity, hardness, and specific conductance at Red Head Rapids were positively correlated to upper Churchill River discharge (i.e., discharge at the Missi Falls CS) and local tributary discharge at Red Head Rapids in the open water season prior to CRD (Table 5.2.11-2). Following CRD, each of these metrics was negatively correlated to discharge at Red Head Rapids, the Missi Falls CS, local tributaries, and the proportion of Red Head Rapids discharge from the upper Churchill River in the open water season. Negative correlations were also observed for two of the hydrological metrics in the ice cover season. Each of these water quality metrics was most strongly correlated to total discharge at Red Head Rapids in the open water season post-CRD (alkalinity R2 = 0.558; specific conductance R2 = 0.439; and hardness R2 = 0.373).
Significant negative correlations were also observed upstream in SIL; alkalinity, specific conductance, and hardness in SIL near the Missi Falls CS were negatively correlated to discharge of the upper Churchill River upstream of SIL and at the Missi Falls CS (Table 5.2.11-3). The upper Churchill River, which is softer and has a lower alkalinity and specific conductance than local drainages to SIL, has a greater influence on water chemistry in Area 4 of the lake during periods of higher discharge.
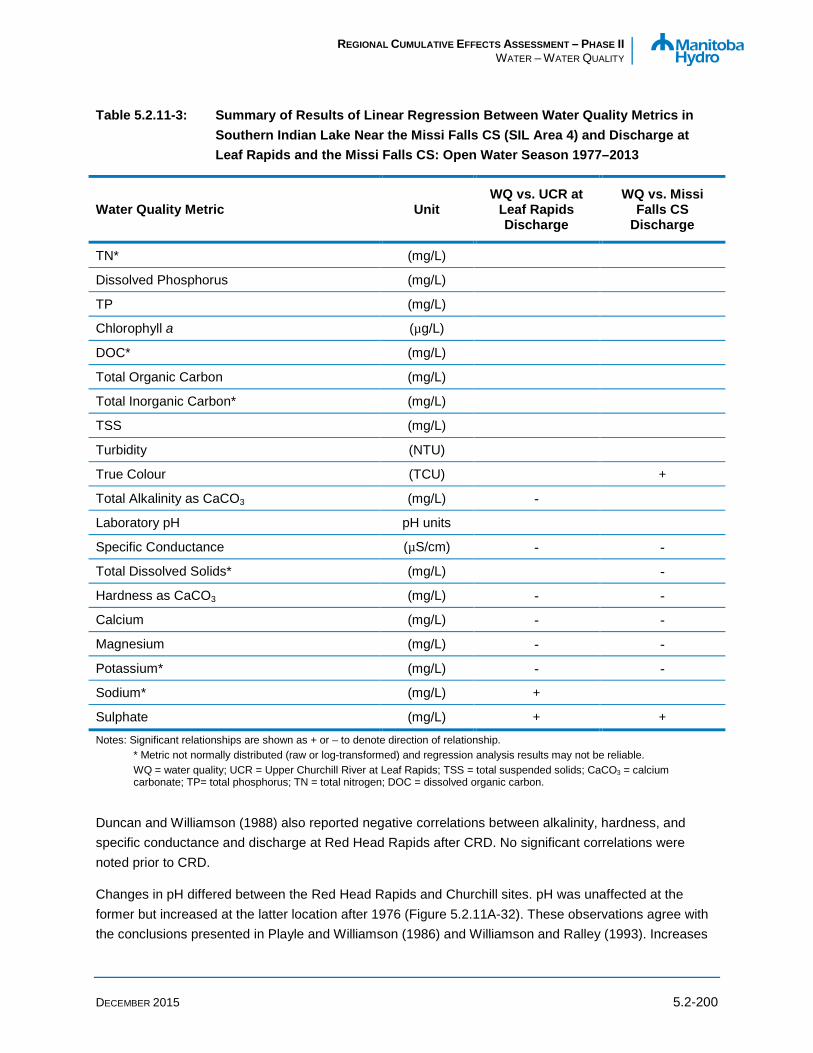
REGIONAL CUMULATIVE EFFECTS ASSESSMENT – PHASE II WATER – WATER QUALITY
DECEMBER 2015 5.2-200
Table 5.2.11-3: Summary of Results of Linear Regression Between Water Quality Metrics in Southern Indian Lake Near the Missi Falls CS (SIL Area 4) and Discharge at Leaf Rapids and the Missi Falls CS: Open Water Season 1977–2013
Water Quality Metric Unit WQ vs. UCR at
Leaf Rapids Discharge
WQ vs. Missi Falls CS
Discharge
TN* (mg/L)
Dissolved Phosphorus (mg/L)
TP (mg/L)
Chlorophyll a (µg/L)
DOC* (mg/L)
Total Organic Carbon (mg/L)
Total Inorganic Carbon* (mg/L)
TSS (mg/L)
Turbidity (NTU)
True Colour (TCU)
+
Total Alkalinity as CaCO3 (mg/L) -
Laboratory pH pH units
Specific Conductance (µS/cm) - -
Total Dissolved Solids* (mg/L)
-
Hardness as CaCO3 (mg/L) - -
Calcium (mg/L) - -
Magnesium (mg/L) - -
Potassium* (mg/L) - -
Sodium* (mg/L) +
Sulphate (mg/L) + +
Notes: Significant relationships are shown as + or – to denote direction of relationship. * Metric not normally distributed (raw or log-transformed) and regression analysis results may not be reliable. WQ = water quality; UCR = Upper Churchill River at Leaf Rapids; TSS = total suspended solids; CaCO3 = calcium carbonate; TP= total phosphorus; TN = total nitrogen; DOC = dissolved organic carbon.
Duncan and Williamson (1988) also reported negative correlations between alkalinity, hardness, and specific conductance and discharge at Red Head Rapids after CRD. No significant correlations were noted prior to CRD.
Changes in pH differed between the Red Head Rapids and Churchill sites. pH was unaffected at the former but increased at the latter location after 1976 (Figure 5.2.11A-32). These observations agree with the conclusions presented in Playle and Williamson (1986) and Williamson and Ralley (1993). Increases
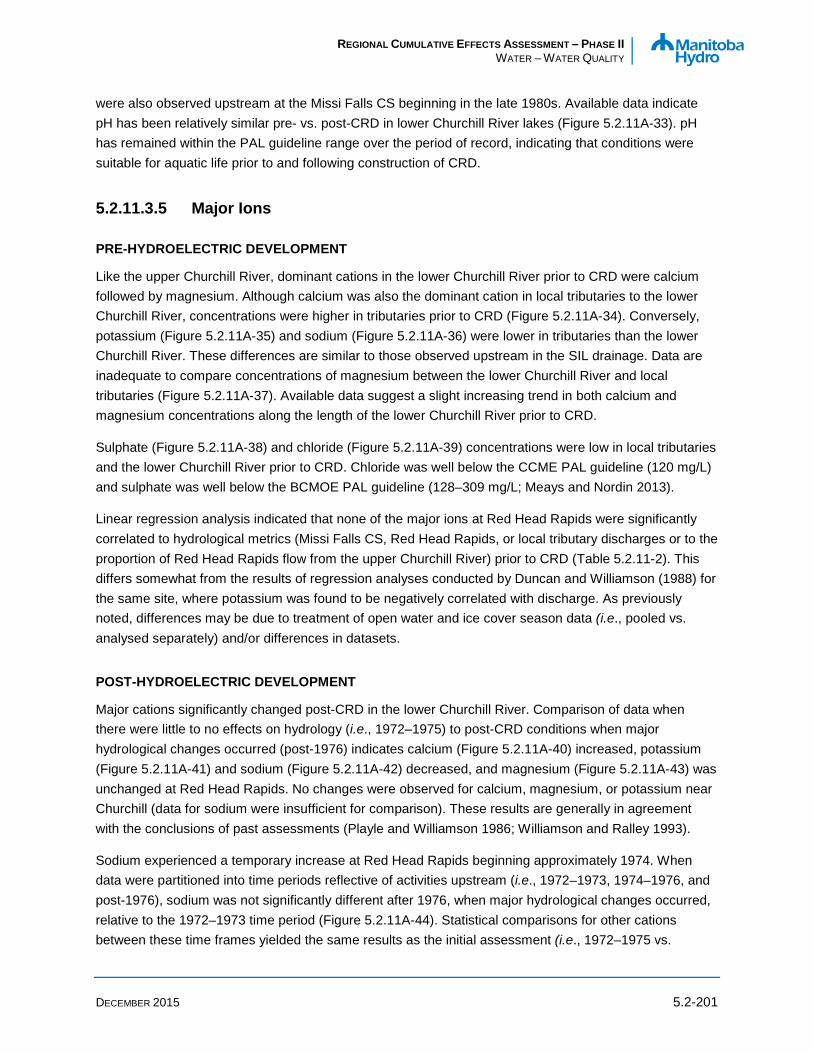
REGIONAL CUMULATIVE EFFECTS ASSESSMENT – PHASE II WATER – WATER QUALITY
DECEMBER 2015 5.2-201
were also observed upstream at the Missi Falls CS beginning in the late 1980s. Available data indicate pH has been relatively similar pre- vs. post-CRD in lower Churchill River lakes (Figure 5.2.11A-33). pH has remained within the PAL guideline range over the period of record, indicating that conditions were suitable for aquatic life prior to and following construction of CRD.
5.2.11.3.5 Major Ions
PRE-HYDROELECTRIC DEVELOPMENT
Like the upper Churchill River, dominant cations in the lower Churchill River prior to CRD were calcium followed by magnesium. Although calcium was also the dominant cation in local tributaries to the lower Churchill River, concentrations were higher in tributaries prior to CRD (Figure 5.2.11A-34). Conversely, potassium (Figure 5.2.11A-35) and sodium (Figure 5.2.11A-36) were lower in tributaries than the lower Churchill River. These differences are similar to those observed upstream in the SIL drainage. Data are inadequate to compare concentrations of magnesium between the lower Churchill River and local tributaries (Figure 5.2.11A-37). Available data suggest a slight increasing trend in both calcium and magnesium concentrations along the length of the lower Churchill River prior to CRD.
Sulphate (Figure 5.2.11A-38) and chloride (Figure 5.2.11A-39) concentrations were low in local tributaries and the lower Churchill River prior to CRD. Chloride was well below the CCME PAL guideline (120 mg/L) and sulphate was well below the BCMOE PAL guideline (128–309 mg/L; Meays and Nordin 2013).
Linear regression analysis indicated that none of the major ions at Red Head Rapids were significantly correlated to hydrological metrics (Missi Falls CS, Red Head Rapids, or local tributary discharges or to the proportion of Red Head Rapids flow from the upper Churchill River) prior to CRD (Table 5.2.11-2). This differs somewhat from the results of regression analyses conducted by Duncan and Williamson (1988) for the same site, where potassium was found to be negatively correlated with discharge. As previously noted, differences may be due to treatment of open water and ice cover season data (i.e., pooled vs. analysed separately) and/or differences in datasets.
POST-HYDROELECTRIC DEVELOPMENT
Major cations significantly changed post-CRD in the lower Churchill River. Comparison of data when there were little to no effects on hydrology (i.e., 1972–1975) to post-CRD conditions when major hydrological changes occurred (post-1976) indicates calcium (Figure 5.2.11A-40) increased, potassium (Figure 5.2.11A-41) and sodium (Figure 5.2.11A-42) decreased, and magnesium (Figure 5.2.11A-43) was unchanged at Red Head Rapids. No changes were observed for calcium, magnesium, or potassium near Churchill (data for sodium were insufficient for comparison). These results are generally in agreement with the conclusions of past assessments (Playle and Williamson 1986; Williamson and Ralley 1993).
Sodium experienced a temporary increase at Red Head Rapids beginning approximately 1974. When data were partitioned into time periods reflective of activities upstream (i.e., 1972–1973, 1974–1976, and post-1976), sodium was not significantly different after 1976, when major hydrological changes occurred, relative to the 1972–1973 time period (Figure 5.2.11A-44). Statistical comparisons for other cations between these time frames yielded the same results as the initial assessment (i.e., 1972–1975 vs.
REGIONAL CUMULATIVE EFFECTS ASSESSMENT – PHASE II WATER – WATER QUALITY
DECEMBER 2015 5.2-202
post-1976 comparisons) for both sites on the lower Churchill River. Qualitative review of data collected at lower Churchill River lakes indicates calcium increased (Figure 5.2.11A-45) and potassium (Figure 5.2.11A-46) and sodium (Figure 5.2.11A-47) were relatively similar prior to and following 1976. Magnesium appears to have increased following CRD in the lower Churchill River lakes (Figure 5.2.11A-48).
Chloride (Figures 5.2.11A-49 and 5.2.11A-50) and sulphate (Figures 5.2.11A-51and 5.2.11A-52) were unchanged, and both anions remained below PAL or BCMOE guidelines, after CRD.
Overall, observed changes in cations in the lower Churchill River were similar to those observed upstream at in the vicinity of the Missi Falls CS, indicating effects were at least in part due to changes that occurred upstream in SIL. Calcium concentrations appear to have experienced a positive trend at Red Head Rapids over the long-term monitoring period ending in 1996. Data are insufficient to determine if this potential trend continued in recent years.
After 1976 when major hydrological changes occurred due to CRD, calcium and magnesium became negatively correlated to all four hydrological metrics (Missi Falls CS, Red Head Rapids, and local tributary discharges and the proportion of Red Head Rapids flow from the upper Churchill River) examined through linear regression (open water season). No relationships with hydrological metrics were observed prior to CRD, suggesting a fundamental shift in mechanisms affecting basic chemistry. The negative correlation to flow variables may be a reflection of a greater influence of the upper Churchill River during high flows, as well as linkages between flows and cations in local drainages. The upper Churchill River contained lower concentrations of calcium and magnesium than local tributaries in the SIL drainage prior to CRD, which may result in relatively lower concentrations of these cations in Area 4 of the lake during periods of high inflows after CRD. This in turn could be translated downstream to the lower Churchill River. Significant negative correlations were also observed between calcium and magnesium in SIL near the Missi Falls CS and discharge of the upper Churchill River upstream of SIL after CRD. Duncan and Williamson (1988) also reported negative correlations between calcium and magnesium and discharge at Red Head Rapids post-CRD.
Williamson and Ralley (1993) stated that “the altered concentration of dissolved ions probably had little effect in the Churchill River since the means of each water quality variable, except turbidity, were below the Manitoba Surface Water Quality Objectives.”1 They further noted that the effects of altered discharge on the lower Churchill River had not been extensively studied.
5.2.11.3.6 Metals
Few metals were measured prior to CRD in the lower Churchill River area and those measurements that were made are of limited utility due to substantive changes in analytical methods. The following provides
1 Water quality guidelines were modified following this publication and currently refer to relative changes in TSS (or turbidity as a surrogate).
REGIONAL CUMULATIVE EFFECTS ASSESSMENT – PHASE II WATER – WATER QUALITY
DECEMBER 2015 5.2-203
an overview of available information regarding mercury in water and effects of hydroelectric development, as well as a brief description of recent conditions for other metals measured under CAMP.
PRE-HYDROELECTRIC DEVELOPMENT
Total mercury concentrations measured in the lower Churchill River prior to CRD are limited to three samples collected in 1973 at Red Head Rapids. Mercury was not detected in any of the samples; however, all samples collected prior to 1974 were later deemed to be contaminated and of insufficient quality to be used for assessing changes over time (Rannie and Punter 1984). No pre-hydroelectric development measurements of methylmercury in water could be located for any areas of the lower Churchill River.
POST-HYDROELECTRIC DEVELOPMENT
Unlike other areas along the CRD/LWR route, where flooding was the key pathway through which mercury concentrations could be affected in surface waters, the lower Churchill River experienced a reduction in flows and water levels as a result of CRD. Therefore the key pathway of effect regarding mercury in water for this area relates to changes in absolute and relative flows, notably the contribution of local drainages to the lower Churchill River. However, mercury could also be affected by changes that may have occurred upstream in SIL, through downstream transport.
There are limited data to characterize total mercury concentrations in the lower Churchill River in general, and due to the lack of reliable pre-CRD data there is no direct means for assessing changes over time or effects related to hydroelectric development. Furthermore, data for total mercury in water for the immediate post-diversion period are limited to samples collected at Red Head Rapids. Other post-CRD data are restricted to data collected near the Town of Churchill as presented in Kirk and St. Louis (1999) and sampling conducted at a number of sites along the river under CAMP (2008–2013).
Though the lack of pre-CRD data prevent a pre-post comparison, available information indicates concentrations of total mercury and methylmercury are low in the lower Churchill River. Total mercury concentrations measured at Red Head Rapids in 1977–1980 were consistently below or slightly above the level of analytical detection (20 ng/L; Figure 5.2.11A-53). Although above the PAL guideline on two occasions in 1980, concentrations were near the analytical DL.
As described in Section 5.2.11.1, a detailed study of mercury and methylmercury in the lower Churchill River near Churchill was conducted over the period of 2003–2007 (Kirk and St. Louis 2009). The key findings of this study were:
• concentrations of total mercury were low (Figure 5.2.11A-54) and well below the PAL guideline (26 ng/L);
• concentrations of methylmercury were low, but higher than those observed over the same period in the lower Nelson River (Figure 5.2.11A-55). Like total mercury, concentrations were well below the PAL guideline (4 ng/L);
• both total mercury and methylmercury were higher at Churchill than near the Missi Falls CS, indicating local drainages contribute measureable quantities of both forms of mercury to the lower Churchill River (Figure 5.2.11A-54);

REGIONAL CUMULATIVE EFFECTS ASSESSMENT – PHASE II WATER – WATER QUALITY
DECEMBER 2015 5.2-204
• mercury was highest in spring, decreasing through summer and fall; and
• total mercury concentrations at Churchill were highest during high flow periods, which were speculated to be a result of increased connectivity between the river and wetlands during high flow periods. However, no significant correlation was found between mercury and discharge.
Recent data collected under CAMP indicate that total mercury concentrations in water remained at or near the analytical DL between 2008 and 2013 (Figure 5.2.11A-53). Samples analysed throughout the lower Churchill River (Partridge Breast, Northern Indian, Fidler, and Billard lakes, the lower Churchill River at the confluence with the Little Churchill River, and the lower Churchill River at Red Head Rapids) at the lowest DL (i.e., DLs lower than the PAL guideline) indicated that all samples were below the Manitoba PAL guideline (26 ng/L; MWS 2011).
Recent monitoring conducted under CAMP indicates that, with one exception (aluminum), other metals were also within PAL objectives and guidelines at lake and riverine sites along the lower Churchill River (Table 5.2.11A-5). Aluminum (Figure 5.2.11A-55) exceeded PAL guidelines on average at all sites monitored on the lower Churchill River from 2008–2013. Aluminum concentrations above the PAL guideline are relatively common in Manitoba lakes and rivers and are also observed at lake and river sites unaffected by hydroelectric development (CAMP 2014). Exceedances of the PAL guideline for aluminum is relatively common in Manitoba lakes and rivers and are also observed in lakes and rivers unaffected by hydroelectric development (CAMP 2014; Ramsey 1991a). Aluminum is a relatively abundant element (fourth most abundant elements in the earth’s crust) and elevated concentrations occur in ‘pristine’ environments, including waterbodies in Manitoba. For example, Ramsey (1991a) concluded that high concentrations of aluminum, copper, and iron in the Burntwood (above Threepoint Lake), Footprint (above Footprint Lake), and Aiken rivers (all “natural, unregulated rivers”) were “natural”. Aluminum was also, on average, above the PAL guideline in off-system lakes including Assean (Section 5.2.6.3.6), Granville (Section 5.2.8.3.6), and Setting (Section 5.2.3.3.6) lakes and the off-system Hayes River (Table 5.2.11A-5) over the period of 2008–2013.
5.2.11.4 Cumulative Effects of Hydroelectric Development on Water Quality
Published literature and de novo data analysis indicate a number of changes in water quality occurred in the lower Churchill River since water quality sampling first began in the early 1970s. The primary pathways through which water quality was affected by CRD in this area are: • changes in water quality upstream in SIL Area 4 (i.e., the Churchill River inflow to the lower Churchill
River area); and • reductions in absolute and relative discharge of the upper Churchill River to the lower Churchill River
area and an increase in the importance of local inflows.
Prior to CRD, there were distinct differences in water quality between the Churchill River inflow and local tributaries. Local tributaries were harder, had higher specific conductance, alkalinity, and calcium, and lower concentrations of potassium and sodium prior to CRD. Available data indicate that TP was slightly lower in local tributaries than the Churchill River prior to 1976. Prior to major changes in hydrology associated with CRD (i.e., 1972–1975), the Churchill River contributed on average approximately 83% of
REGIONAL CUMULATIVE EFFECTS ASSESSMENT – PHASE II WATER – WATER QUALITY
DECEMBER 2015 5.2-205
the discharge of the lower Churchill River at Red Head Rapids. Once major hydrological changes from CRD were implemented (i.e., after 1976), this contribution was reduced to approximately 46% on average (Water Regime, Section 4.3.3.3). The LWCNRSB predicted that the reduced relative discharge of the Churchill River would result in a greater influence of local tributaries on water quality in the lower Churchill River after CRD.
The primary changes in water quality that occurred after 1976 in the lower Churchill River were increases in specific conductance, hardness, alkalinity, and calcium and decreases in potassium (Table 5.2.11-4). These effects were also observed upstream in the vicinity of the Missi Falls CS, indicating that effects of CRD upstream contributed to the observed changes downstream in the lower Churchill River. However, all of these metrics varied between the Churchill River and local tributaries prior to CRD, and the increased influence of local drainages on the lower Churchill River following CRD also contributed to the observed changes.
Effects of CRD on nutrients are less clear. No significant difference in TP concentrations was observed at Red Head Rapids, while TP significantly increased near the Town of Churchill after CRD. TN and chlorophyll a data are inadequate to assess temporal changes. However, the typical trophic status of lakes based on chlorophyll a (mesotrophic) was unchanged pre- to post-CRD.
There are insufficient data to assess how, or if, DO was affected in the lower Churchill River area following CRD. Recent information for several lakes and riverine sites indicates the area is generally well-oxygenated and DO concentrations are above PAL objectives in the open water and ice cover seasons. The primary pathway through which DO could be affected by CRD relates to the reduction in discharge, and subsequent alterations in water residence times, volumes, depths, and the relative influence of local drainages, which is a permanent feature of CRD. Therefore, recent monitoring results that show DO conditions are suitable for PAL may also be considered to be representative of immediate post-CRD conditions. However, decreases in DO may occur in some areas under low flow or extreme climactic events that have not been captured under the contemporary CAMP monitoring program (e.g., low flow in combination with prolonged cold temperature leading to extensive, and/or longer durations of, ice cover).
Available data and literature indicate that measures of water clarity (TSS and turbidity) were relatively unaffected by CRD in this area. However data for upstream lakes are limited and some effects (i.e., increases) may have occurred due to increased resuspension of sediments following substantive reductions in water levels and depths. Short-term events related to wave-induced suspension of bottom sediments may not have been captured by historical or contemporary monitoring programs due to their short duration and because water quality sampling programs are typically not conducted during high wind events, particularly when the programs are conducted by fixed wing aircraft.
Significant relationships between hydrological and water quality metrics were observed pre-CRD and, notably post-CRD, at Red Head Rapids. Water clarity metrics (TSS and turbidity) were positively associated with flow at Red Head Rapids, the Missi Falls CS, and from local tributaries, as well as the proportion of flow from the upper Churchill River. Both parameters are commonly positively associated with discharge due to increases in shoreline erosion and sediment resuspension, and reduced sedimentation, with increasing discharge. Other water quality metrics (alkalinity, hardness, specific

REGIONAL CUMULATIVE EFFECTS ASSESSMENT – PHASE II WATER – WATER QUALITY
DECEMBER 2015 5.2-206
conductance , magnesium and calcium), most of which significantly increased post-CRD and which were higher in local tributaries than the Churchill River prior to CRD, were negatively correlated with all four hydrological metrics after, but not before, CRD. These relationships, and changes in relationships before and after CRD, indicate a fundamental shift in key drivers of water chemistry in the lower Churchill River. These correlations appear to be at least in part due to an increased influence of the upper Churchill River in Area 4 of SIL during periods of high discharge.
Table 5.2.11-4: Overview of statistically significant differences in water quality metrics at Red Head Rapids and near the Town of Churchill between 1972–1975 and 1977–2013
Water Quality Metric Units Significant Differences
Red Head Rapids Churchill
TN (mg/L) Insufficient Data ND
TP (mg/L) ND Increase
Chlorophyll a (µg/L) Insufficient Data Insufficient Data
TSS (mg/L) Insufficient Data ND
Turbidity (NTU) ND Insufficient Data
DO (mg/L) Insufficient Data Insufficient Data
Total Alkalinity as CaCO3 (mg/L) Increase ND 1
Laboratory Specific conductance (µS/cm) Increase Increase
Hardness as CaCO3 (mg/L) Increase ND 1
Laboratory pH pH Units ND Increase
Calcium (mg/L) Increase ND 1
Chloride (mg/L) ND ND
Magnesium (mg/L) ND 2 ND 1,2
Potassium (mg/L) Decrease ND 1
Sodium (mg/L) ND 3 Insufficient Data
Sulphate (mg/L) ND Insufficient Data
Notes: ND = no significant difference; TSS = total suspended solids; DO = dissolved oxygen; CaCO3 = calcium carbonate; TP = total phosphorus; TN = total nitrogen.
1. Data limited for the post-CRD period. 2. Data limited for the pre-CRD period. 3. No statistically significant difference between 1972–1973 and 1977-2013. Temporary increase occurred in 1974–1976 period.
Due to a lack of pre-CRD data, changes in total and methylmercury in water related to hydroelectric development cannot be directly assessed. However, data collected post-CRD, including recent data collected under CAMP and in a focused study on mercury conducted in 2003–2007, indicate concentrations of both forms of mercury are low in the Churchill River and well below the PAL guidelines.
REGIONAL CUMULATIVE EFFECTS ASSESSMENT – PHASE II WATER – WATER QUALITY
DECEMBER 2015 5.2-207
A recent study has shown that both total mercury and methylmercury concentrations increase from the Missi Falls CS to the mouth of the Churchill River, indicating local drainages contribute measureable quantities to the river. There was also some indication of increases associated with high flow events. Collectively, the latter observations suggest that CRD may have increased concentrations of total mercury and methylmercury in the lower Churchill River due to the increased influence of local drainages.
In general, water quality in the lower Churchill River area is currently suitable for PAL. The lakes and riverine reaches are generally well-oxygenated and pH and most metals consistently remain within PAL objectives and guidelines. The exception was aluminum which exceeded PAL guidelines on average at all sites monitored on the lower Churchill River from 2008–2013. Aluminum concentrations above the PAL guideline are relatively common in Manitoba, including at lake and river sites unaffected by hydroelectric development.

REGIONAL CUMULATIVE EFFECTS ASSESSMENT – PHASE II WATER – WATER QUALITY
DECEMBER 2015 5.2-208
5.2.12 Summary of the Effects of Hydroelectric Development in the Region of Interest on Water Quality
• Water quality was affected by hydroelectric development across the RCEA ROI, though the nature, magnitude, and duration of effects varied across areas and among waterbodies. Some effects were short-term and/or relatively localized, while others were wide-spread and permanent. These differences generally reflect different pathways of effects. Key pathways of effects include: flooding; changes in water levels, flows, depths, and water residence times; diversion of flows (either into or away from a river system); and changes in erosion and sedimentation.
• Some areas with substantive flooding, particularly those that are relatively isolated from the main flows of large river systems (e.g., backbays in lakes), experienced changes typically associated with reservoir creation (i.e., increases in nutrients), though effects varied across the RCEA ROI, notably in relation to water residence times (lake flushing rates) and lake and shoreline characteristics. Effects that appear to have been attributable to decomposition of flooded organic matter (e.g., increases in nutrients) were temporary.
• The upper Nelson River area was affected by the Kelsey GS, LWR, and Cross Lake, by construction of a weir. o The Kelsey GS flooded approximately 63.5 sq mi (164.5 km2) of land upstream of the GS,
extending into Sipiwesk Lake and other lakes such as Cauchon Lake. LWR (including the Jenpeg GS) flooded 17.6 sq mi (45.6 km2) of land, created a new outflow from Lake Winnipeg, and altered the seasonal pattern of flows.
o While there are no pre-Kelsey GS data and limited pre-LWR data, available information suggests that few changes in water quality occurred due to hydroelectric development along the main flow path of the upper Nelson River and most temporal changes identified did not show any clear relationship to the Kelsey GS or LWR.
o Water quality does not change notably along the upper Nelson River from the outlet of Lake Winnipeg to the Kelsey GS, and generally reflects the outflow from Lake Winnipeg.
o Water clarity was likely reduced at some locations, notably in the Kelsey GS reservoir, Cross Lake (particularly in the shallow east basin), and the Outlet Lakes during some periods due to increased shoreline erosion and/or sediment resuspension.
o Oxygen depletion was observed in isolated areas of Cross Lake following LWR in winter, and winterkill was observed on at least one occasion; however, it is not known if these conditions occurred prior to LWR.
o Phosphorus increased temporarily at some sites following LWR, though recent increases in this metric have also been observed in some, but not all, waterbodies in this area.
• CRD flooded approximately 293 sq mi (759 km2) of land from Opachuanau and Southern Indian lakes through the Rat/Burntwood river system to the Burntwood River inlet at Split Lake, and increased the flow of the Burntwood River by approximately eight-fold. o This project caused temporary and permanent changes in water quality. Permanent changes
relate to the diversion of the upper Churchill River water, which had a different chemistry

REGIONAL CUMULATIVE EFFECTS ASSESSMENT – PHASE II WATER – WATER QUALITY
DECEMBER 2015 5.2-209
(e.g., softer and more dilute water), into the Rat/Burntwood River system. Temporary effects were generally related to impoundment and flooding (e.g., increases in nutrients).
o Effects in SIL included a shift in some basic water chemistry characteristics (alkalinity, specific conductance, hardness, and some major cations) in relation to a change in the flow path and influence of the upper Churchill River. Data suggest a decrease in chlorophyll a (a measure of productivity) but are not definitive. There is evidence that increased shoreline erosion following CRD caused a reduction in water clarity in the lake and this effect may still be occurring today.
o Downstream of the South Bay Diversion Channel, nutrients (phosphorus) and chlorophyll a increased during and immediately following impoundment/diversion in some waterbodies but then either decreased below, or remained relatively similar to, pre-CRD conditions. Increased erosion reduced water clarity in some waterbodies. Flooding, increases in water residence times, and increased water depth also resulted in low oxygen concentrations at depth in Notigi Lake and to a lesser extent, other nearby lakes. Lakes in this reach continue to experience low DO at depth, but the severity of the effect has decreased. Permanent effects were a direct result of diversion of the Churchill River which had differing water chemistry, and included decreases in specific conductance, hardness, and major ions.
• Effects of hydroelectric development along the lower Nelson River are more difficult to discern due to the absence of pre-project data for some developments and the superimposition of multiple developments in time and space. However, available information is sufficient to generally describe effects for the period of the early 1970s to the present. o The primary change observed after CRD/LWR was a decrease in specific conductance,
hardness, alkalinity, and some major ions, reflecting the chemistry of the Churchill River. Changes in these parameters over the last five decades are a function of the difference between conditions in, coupled with variations in the relative contribution of flows from, the upper Nelson and Burntwood rivers.
o CRD increased inflows to Split Lake by approximately 32%, as well as the load of suspended solids introduced to Split Lake. Water clarity metrics (i.e., turbidity and TSS) were not significantly higher during the initial period of CRD/LWR operation based on analysis of a long-term data set. However, it is recognized that data are limited due to spatial and temporal coverage of monitoring programs which may not have captured effects, notably episodic events.
• The construction of the Kettle GS resulted in approximately 85.3 sq mi (221 km2) of flooding. o While there are no pre-project data, early pre-impoundment and later post-impoundment data
suggest that the flooded, isolated north arm of Stephens Lake experienced responses typically associated with flooding — increases in nutrients and reductions in oxygen.
o Conversely, effects along the main flow of the Nelson River in the southern area of Stephens Lake appear to have been negligible, short-term, and/or not captured in monitoring programs.
• The lower reach of the lower Nelson River includes the Long Spruce GS, which flooded approximately 5.6 sq mi (14.5 km2), and the Limestone GS, which flooded approximate 0.8 sq mi (2.2 km2 ) of land. o Effects of these GSs were negligible, short-term, and/or not captured in monitoring programs.
Effects, or lack thereof, were determined based on the relatively consistent water quality conditions observed over the period of record and along the river.

REGIONAL CUMULATIVE EFFECTS ASSESSMENT – PHASE II WATER – WATER QUALITY
DECEMBER 2015 5.2-210
• The lower Churchill River was affected by CRD — most notably, by decreased flows from the upper Churchill River, though upstream changes in water quality also affected this area. CRD reduced the contribution of the upper Churchill River flow to the lower Churchill from 83% to 46% on average, with a concomitant increase in the influence of local drainages, which had different water chemistry. The primary changes were increases in specific conductance, hardness, alkalinity, and calcium and decreases in potassium. These effects were also observed upstream in the vicinity of the Missi Falls CS, indicating that effects of CRD on the inflow contributed to the observed changes downstream in the lower Churchill River.
• Water quality recorded during the post-development monitoring programs indicated conditions were suitable for aquatic life for most sites and periods, as defined by: (i) PAL objectives and guidelines; and/or (ii) conditions observed in other waterbodies (e.g., off-system lakes) that support a healthy aquatic community. The most notable exception was the occurrence of low oxygen concentrations at some locations (e.g., Notigi Lake). Iron and aluminum are also generally above PAL guidelines in the RCEA ROI, and phosphorus commonly exceeds the narrative nutrient guideline. However, these conditions are also observed in lakes that are not affected by hydroelectric development.

REGIONAL CUMULATIVE EFFECTS ASSESSMENT – PHASE II WATER – WATER QUALITY
DECEMBER 2015 5.2-211
5.2.13 Bibliography
5.2.13.1 Literature Cited and Data Sources Badiou, P.H., and Cooley, H.M. 2004. Water chemistry, phytoplankton, and sediment chemistry data for
the Nelson and Assean river systems, Manitoba, 2001. Gull (Keeyask) Project Environmental Studies Program Report # 01-15. A report prepared for Manitoba Hydro by North/South Consultants Inc., Winnipeg, MB. 190 pp.
Badiou, P.H., and Cooley, H.M. 2005. Water chemistry, phytoplankton, and sediment chemistry data for the Nelson and Assean river systems, Manitoba, 2002. Gull (Keeyask) Project Environmental Studies Program Report # 02-14. A report prepared for Manitoba Hydro by North/South Consultants Inc., Winnipeg, MB. 234 pp.
Badiou, P.H., Cooley, H.M., and Savard, T. 2005. Water chemistry data for the lower Nelson River system, Manitoba, 2003. Keeyask Project Environmental Studies Program Report # 03-05. A report prepared for Manitoba Hydro by North/South Consultants Inc., Winnipeg, MB. 66 pp.
Badiou, P.H., Cooley, H.M., and Savard, T. 2007. Water chemistry and phytoplankton data for the lower Nelson River system, Manitoba, 2004. Keeyask and Conawapa Projects Environmental Studies Programs Report # 04-04 and #04-08. A report prepared for Manitoba Hydro by North/South Consultants Inc., Winnipeg, MB. 227 pp.
Baker, R.F. 1989. An environmental assessment and biological investigation of the Nelson River estuary. A report prepared for Manitoba Hydro by North/South Consultants Inc., Winnipeg, MB. 160 pp.
Baker, R.F. 1990. A fisheries survey of the Limestone forebay, 1989 – year I. A report prepared for Manitoba Hydro by North/South Consultants Inc., Winnipeg, MB. 46 pp.
Baker, R.F. 1991. A fisheries survey of the Limestone forebay, 1990 – year II. A report prepared for Manitoba Hydro by North/South Consultants Inc., Winnipeg, MB. 43 pp.
Baker, R.F. 1992. A fisheries survey of the Limestone forebay, 1991 – year III. A report prepared for Manitoba Hydro by North/South Consultants Inc., Winnipeg, MB. 56 pp.
Baker, R.F. 1996. Abundance and species composition of zooplankton of the Nelson River estuary, Hudson Bay, in relation to depth, tide and location July 1995 – year I. A report prepared for Manitoba Hydro by North/South Consultants Inc., Winnipeg, MB. 61 pp.
Baker, R.F., and Davies, S. 1991. Physical, chemical, and biological effects of Churchill River diversion and Lake Winnipeg regulation on aquatic ecosystems. Canadian Technical Report of Fisheries and Aquatic Sciences 1806: 53 pp.
Bernhardt, W.J. 1995. Cross Lake outlet control weir post-project fish stock assessment 1994, Cross and Pipestone lakes. A report prepared for Manitoba Hydro by North/South Consultants Inc., Winnipeg, MB. 113 pp.

REGIONAL CUMULATIVE EFFECTS ASSESSMENT – PHASE II WATER – WATER QUALITY
DECEMBER 2015 5.2-212
Bernhardt, W.J. 1997. Winter fisheries investigations of the lower Churchill River mainstem, 1996. A report prepared for Manitoba Hydro by North/South Consultants Inc., Winnipeg, MB. 50 pp.
Bernhardt, W.J. 1999. Lower Churchill River water level enhancement weir project, an assessment of water chemistry changes due to 1998 construction activities. A report prepared for Manitoba Hydro by North/South Consultants Inc., Winnipeg, MB. 48 pp.
Bernhardt, W.J. 2005. Lower Churchill River water level enhancement weir project post-project monitoring: Winter fisheries investigations of the lower Churchill River mainstem, 2004. A report prepared for Manitoba Hydro by North/South Consultants Inc., Winnipeg, MB. 32 pp.
Bernhardt, W.J., and Holm, J. 2007. Lower Churchill River water level enhancement weir project post-project monitoring: A synthesis of aquatic environmental 1999-2006. A report prepared for Manitoba Hydro by North/South Consultants Inc., Winnipeg, MB. 107 pp.
Bernhardt, W.J., and Schneider-Vieira, F. 1994. Cross Lake outlet control weir post-project fish stock assessment 1993, Cross and Pipestone lakes. A report prepared for Manitoba Hydro by North/South Consultants Inc., Winnipeg, MB. 110 pp.
Bezte, C.L. 2006. Lower Churchill River water level enhancement weir project post-project monitoring: Assessment of water chemistry and phytoplankton responses to operation of the project-year VII, 2005. A report prepared for Manitoba Hydro by North/South Consultants Inc., Winnipeg, MB. 45 pp.
Bezte, C., and Bernhardt, W.J. 2000. Lower Churchill River water level enhancement weir project post-project monitoring: Assessment of water chemistry and phytoplankton responses to construction and operation of the project year I, 1999. A report prepared for Manitoba Hydro by North/South Consultants Inc., Winnipeg, MB. 38 pp.
Bezte, C., and Bernhardt, W.J. 2002. Lower Churchill River water level enhancement weir project post-project monitoring an assessment of water chemistry and phytoplankton responses to operation of the project-year III, 2001. A report prepared for Manitoba Hydro by North/South Consultants Inc., Winnipeg, MB. 52 pp.
Bezte, C.L., and Bortoluzzi, T. 2004. Lower Churchill River water level enhancement weir project post-project monitoring: assessment of water chemistry and phytoplankton responses to operation of the project - year V, 2003. A report prepared for Manitoba Hydro by North/South Consultants Inc., Winnipeg, MB. 52 pp.
Bezte, C.L., and Kroeker, K. 2000. Water chemistry and phytoplankton data for the Rat/Burntwood and Footprint river systems, Manitoba, 1999. Nisichawayasihk Cree Nation-Manitoba Hydro Joint Environmental Studies Report # 00-01, North/South Consultants Inc., Winnipeg, MB. 74 pp.
Bezte, C.L., Lawrence, M.J., and Schneider-Vieira, F. 1999. Split Lake water quality monitoring requirements for the protection of aquatic life. TEMA Data Report No. 99-01. A report prepared for the Tataskweyak Environmental Monitoring Agency by North/South Consultants Inc., Winnipeg, MB. 94 pp.

REGIONAL CUMULATIVE EFFECTS ASSESSMENT – PHASE II WATER – WATER QUALITY
DECEMBER 2015 5.2-213
Bodaly, R.A., Rosenberg, D.M., Gaboury, M.N., Hecky, R.E., Newbury, R.W., and Patalas, K. 1984. Ecological effects of hydroelectric development in northern Manitoba, Canada: The Churchill-Nelson River diversion. In Effects of pollutants at the ecosystem level. Edited by P.J. Sheehan, D.R. Miller, G.C. Butler, and Ph. Boudreau. John Wiley & Sons Ltd., Mississauga, ON. 273-309 pp.
Bodaly, R.A., Strange, N.E., Hecky, R.E., Fudge, R.J.P., and Anema, C. 1987. Mercury content of soil, lake sediment, net plankton, vegetation, and forage fish in the area of the Churchill River diversion, Manitoba, 1981-82. Canada-Manitoba Agreement on the Study and Monitoring of Mercury in the Churchill River diversion, Technical Appendices to the Summary Report, Volume 1, Section 4. 33 pp.
Bourne, A., Armstrong, N., and Jones, G. 2002. A preliminary estimate of total nitrogen and total phosphorus loading to streams in Manitoba, Canada. Manitoba Conservation Report No. 2002-04, Water Branch, Water Quality Management Section, Manitoba Conservation, Winnipeg, Manitoba. 61 pp.
Bunting, L., Leavitt, P.R., Wissel, B., Laird, K.R., Cumming, B.F., St. Amand, A., and Engstrom, D.R. 2011. Sudden ecosystem state change in Lake Winnipeg, Canada, caused by eutrophication arising from crop and livestock production during the 20th century. 50 pp.
Burt, M., and Neufeld, L. 2007. Zooplankton sampling results from the Long Spruce and Limestone forebays, Manitoba, 2002 and 2004. Conawapa Project Environmental Studies Program Report # 04-10. A report prepared for Manitoba Hydro by North/South Consultants Inc., Winnipeg, MB. 18 pp.
CAMP (Coordinated Aquatic Monitoring Program). 2014. Three year summary report (2008–2010). Report prepared for the Manitoba/Manitoba Hydro MOU Working Group by North/South Consultants Inc., Winnipeg, MB.
CCME (Canadian Council of Ministers of the Environment). 1999. Canadian environmental quality guidelines. Canadian Council of Ministers of the Environment, Winnipeg, MB. Updated to 2015.
CCREM (Canadian Council of Resource and Environment Ministers). 1987. Canadian water quality guidelines. Canadian Council of Resource and Environment Ministers, Winnipeg, MB.
Chekay, D.A., and Crowe, J.M.E. 1972. Biological effects of overburden discharge on the Ospwagan lakes drainage systems, 1967 to 1969. MS Rep. No. 71-7, Research and Development Branch, Manitoba Department of Mines, Resources and Environmental Management, Winnipeg, MB. 29 pp.
Cleugh, T.R. 1974a. Hydrographic survey of lakes on the lower Churchill and Rat-Burntwood rivers and reservoirs and lakes on the Nelson River. Lake Winnipeg, Churchill, and Nelson Rivers Study Board Technical Report, Appendix 5, Volume 1, Section E. 230 pp.

REGIONAL CUMULATIVE EFFECTS ASSESSMENT – PHASE II WATER – WATER QUALITY
DECEMBER 2015 5.2-214
Cleugh, T.R. 1974b. The hydrography of Southern Indian Lake: Present conditions and implications of hydroelectric development. Lake Winnipeg, Churchill and Nelson Rivers Study Board Technical Report, Appendix 5, Volume 1, Section C. 195 pp.
Cooley, H.M., and Badiou, P. 2004a. Water chemistry and phytoplankton data for the Rat/Burntwood and Footprint river systems, Manitoba, 2000. Nisichawayasihk Cree Nation - Manitoba Hydro Joint Environmental Studies Report # 04-01, North/South Consultants Inc., Winnipeg, MB. 178 pp.
Cooley, H.M., and Badiou, P. 2004b. Water chemistry and phytoplankton data for the Rat/Burntwood and Footprint river systems, Manitoba, 2001. Nisichawayasihk Cree Nation - Manitoba Hydro Joint Environmental Studies Report # 04-06, North/South Consultants Inc., Winnipeg, MB. 293 pp.
Cooley, H.M., and Savard, T.G. 2007. Water chemistry data for the Burntwood river system, Manitoba, 2004. Nisichawayasihk Cree Nation - Manitoba Hydro Joint Environmental Studies Report # 07-01, North/South Consultants, Winnipeg, MB. 219 pp.
Cooley, H.M., Badiou, P., and Shipley, E. 2003. Water chemistry and phytoplankton data for the Burntwood River system, Manitoba, 2002. Nisichawayasihk Cree Nation - Manitoba Hydro Joint Environmental Studies Report # 03-12, North/South Consultants Inc., Winnipeg, MB. 337 pp.
Cooley, H.M., Shipley, E.C.M., and Savard, T. 2006. Water chemistry data for the Burntwood river system, Manitoba, 2003. Nisichawayasihk Cree Nation - Manitoba Hydro Joint Environmental Studies Report # 06-02, North/South Consultants Inc., Winnipeg, MB. 193 pp.
Cooley, P.M., Dolce, L., and Larter, J. 2009. The effect of local and regional watersheds on the spectral composition and attenuation of light and water quality parameters in the surface waters of Stephens Lake, Manitoba. Keeyask Project Environmental Studies Program Report # 06-13. A report prepared for Manitoba Hydro by North/South Consultants Inc., Winnipeg, MB. 37 pp.
Cooley, P., Chambers, C., and Gill, G.J. 2014. The response of periphyton to the water regime in the intermittently exposed and predominantly wetted zones of the lower Nelson River, 2006–2007; changes in chlorophyll a, biomass, and taxonomy. Conawapa Project Environmental Studies Program Report # 07-08. A report prepared for Manitoba Hydro by North/South Consultants Inc., Winnipeg, MB. 137 pp.
Crowe, J-A.M.E. 1973. Limnological investigations of Kettle reservoir and the Nelson River above Kelsey. MS Rep. No. 73-06, Research Branch, Manitoba Department of Mines, Resources and Environmental Management, Winnipeg, MB. 34 pp.
DFO (Fisheries and Oceans Canada). 2015. Freshwater Institute, 501 University Crescent, Winnipeg, MB, R3T 2N6.
DFO and EC. 1977. Surface water quality in Canada - an overview. Inland Waters Directorate. Water Quality Branch, Ottawa, ON. 45 pp.
REGIONAL CUMULATIVE EFFECTS ASSESSMENT – PHASE II WATER – WATER QUALITY
DECEMBER 2015 5.2-215
Dodds, W.K., Jones, J.R., and Welch, E.B. 1998. Suggested classification of stream trophic state: Distributions of temperate stream types by chlorophyll, total nitrogen, and phosphorus. Water Research 32: 1455-1462 pp.
Driver, E.A. 1965. Interim report on Cross Lake survey. Fisheries Branch, Manitoba Department of Mines and Natural Resources, Winnipeg, MB. 8 pp
Driver, E.A., and Doan, K.H. 1972. Fisheries survey of Cross Lake (Nelson River), 1965. MS Rep. No. 73-5, Research Branch, Manitoba Department of Mines, Resources and Environmental Management, Winnipeg, MB. 17 pp.
Duncan, D.A., and Williamson, D.A. 1988. Water chemistry/water discharge relationships within the Churchill River diversion and Lake Winnipeg regulation region, Manitoba, Canada. Northern Flood Agreement Manitoba Ecological Report Series 88-5, Water Standards and Studies Section, Manitoba Department of Environment and Workplace Safety and Health, Winnipeg, MB. 57 pp.
EC (Environment Canada). 1980. Detailed surface water quality data, Manitoba 1974-1976. Inland Waters Directorate, Western and Northern Region, Water Quality Branch, Winnipeg, MB. 364 pp.
EC. 1982. Detailed surface water quality data, Manitoba 1977-1979. Inland Waters Directorate, Western and Northern Region, Water Quality Branch, Winnipeg, Manitoba. 253 pp.
EC. 2015. Water Quality Monitoring and Surveillance, ACBIS Database (Aquatic Chemistry and Biology Information System), April 1, 2015.
EC and DFO (Environment Canada and Department of Fisheries and Oceans). 1992a. Federal Ecological Monitoring Program: Summary report. Environment Canada and Department of Fisheries and Oceans, Winnipeg, MB. 15 pp.
EC and DFO. 1992b. Federal Ecological Monitoring Program: Final report, Volume 2. Environment Canada and Department of Fisheries and Oceans, Winnipeg, MB. 120 pp.
EC and DFO. 1992c. Federal Ecological Monitoring Program: Final report, Volume 1. Environment Canada and Department of Fisheries and Oceans, Winnipeg, MB. 120 pp.
EC and MWS (Environment Canada and Manitoba Water Stewardship). 2011. State of Lake Winnipeg: 1999 to 2007. Environment Canada and Manitoba Water Stewardship, Winnipeg, MB. 222 pp.
Gaboury, M.N., and Patalas, J.W. 1981. An interim report on the fisheries impact study of Cross and Pipestone lakes. MS Rep. No. 81-22, Manitoba Department of Natural Resources, Winnipeg, MB. 190 pp.
Gaboury, M.N., and Patalas, J.W. 1982. The fisheries at Cross, Pipestone and Walker lakes, and the effects of hydroelectric development. MS Rep. No. 82-14, Manitoba Department of Natural Resources, Winnipeg, MB. 198 pp.
Giberson, D.J., Rosenberg, D.M., and Weins, A.P. 1991. Changes in abundance of burrowing mayflies in Southern Indian Lake – lessons for environmental monitoring. Ambio 20(3-4): 139-142 pp.

REGIONAL CUMULATIVE EFFECTS ASSESSMENT – PHASE II WATER – WATER QUALITY
DECEMBER 2015 5.2-216
Grapentine, L., Seidl, P., and Chacko, V. 1988. Identification, collation and initial evaluation of historical water quality data from the Northern Flood Agreement area, Manitoba. Northern Flood Agreement Manitoba Ecological Report Series 89-5, Water Quality Branch, Western and Northern Region, Environment Canada, Winnipeg, MB. 52 pp.
Green, D.J. 1990. Physical and chemical water quality data collected from the Rat-Burntwood and Nelson River systems, 1985-1989. MS Rep. No. 90-15, Fisheries Branch, Manitoba Department of Natural Resources, Winnipeg, MB. 242 pp.
Guilbault, R.A., Gummer, W.D., and Chacko, V.T. 1979. The Churchill diversion: Water quality changes in the lower Churchill and Burntwood rivers. Water Quality Interpretive Report No. 2, Inland Waters Directorate, Water Quality Branch, Western and Northern Region, Regina, SK. 9 pp.
Guildford, S.J. 1985. Depression of primary productivity by suspended sediment and dissolved humic material in limnocorral experiments at Southern Indian Lake, northern Manitoba. M.Sc. thesis, Department of Botany, University of Manitoba, Winnipeg, MB. 191 pp.
Hall, B.D., St. Louis, V.L., Rolfhus, K.R., Bodaly, R.A., Beaty, K.G., Paterson, M., and Peech Cherewyk, K.A. 2005. Impacts of reservoir creation on the biogeochemical cycling of methylmercury and total mercury in boreal forest uplands. Ecosystems 8: 248-266 pp.
Hecky, R.E. 1974. Southern Indian Lake: sedimentary environments, recent basin history and implications of inundations and diversion. Lake Winnipeg, Churchill and Nelson Rivers Study Board technical report, Appendix 5, Volume 1, Section D. 60 pp.
Hecky, R.E. 1975. The phytoplankton and primary productivity of Southern Indian Lake (Manitoba), a high latitude, riverine lake. Verhandlungen der Internationalen Vereinigung fur Theoretische und Angewandte Limnologie 19: 599-605 pp.
Hecky, R.E. 1984. Thermal and optical characteristics of Southern Indian Lake before, during, and after impoundment and Churchill River diversion. Canadian Journal of Fisheries and Aquatic Sciences 41: 579-590 pp.
Hecky, R.E., and Ayles, H.A. 1974a. Summary of fisheries-limnology investigations on Southern Indian Lake. Lake Winnipeg, Churchill and Nelson Rivers Study Board Technical Report, Appendix 5, Volume 1, Section A. 26 pp.
Hecky, R.E., and Ayles, H.A. 1974b. Summary of fisheries-limnology investigations on the lower Churchill lakes and on the Rat-Burntwood lakes. Lake Winnipeg, Churchill and Nelson Rivers Study Board Technical Report, Appendix 5, Volume 2, Section C. 25 pp.
Hecky, R.E., and Guildford, S.J. 1984. Primary productivity of Southern Indian Lake before, during, and after impoundment and Churchill River diversion. Canadian Journal of Fisheries and Aquatic Sciences 41: 591-604 pp.
REGIONAL CUMULATIVE EFFECTS ASSESSMENT – PHASE II WATER – WATER QUALITY
DECEMBER 2015 5.2-217
Hecky, R.E., and Harper, R.J. 1974. Phytoplankton and primary productivity of the lower Churchill Lakes, the Rat-Burntwood lakes, and the Nelson River lakes and reservoirs. Lake Winnipeg, Churchill and Nelson Rivers Study Board Technical Report, Appendix 5, Volume 2, Section F. 39 pp.
Hecky, R.E., and McCullough, G.K. 1984a. The landsat imagery of Southern Indian Lake: A remote perspective on impoundment and diversion. Canadian Technical Report of Fisheries and Aquatic Sciences 1266: 20 pp.
Hecky, R.E., and McCullough, G.K. 1984b. Effect of impoundment and diversion on the sediment budget and nearshore sedimentation of Southern Indian Lake. Canadian Journal of Fisheries and Aquatic Sciences 41: 567-578 pp.
Hecky, R.E., and Newbury, R.W. 1977. Predicting the evolution of the Southern Indian Lake impoundment. Canada Department of Fisheries and Environment, Winnipeg, MB. 15 pp.
Hecky, R.E., Harper, R.J., and Kling, H.J. 1974. Phytoplankton and primary production in Southern Indian Lake. Lake Winnipeg, Churchill and Nelson Rivers Study Board Technical Report, Appendix 5, Volume 1, Section E. 90 pp.
Hecky, R.E., Newbury, R.W., Bodaly, R.A., Patalas, K., and Rosenberg, D.M. 1984. Environmental impact prediction and assessment: The Southern Indian Lake experience. Canadian Journal of Fisheries and Aquatic Sciences 41(4): 720-732 pp.
Hecky, R.E., Bodaly, R.A., Ramsey, D.J., Ramlal, P.S., and Strange, N.E. 1987a. Evolution of limnological conditions, microbial methylation of mercury and mercury concentrations in fish in reservoirs of northern Manitoba. Canada-Manitoba Agreement on the Study and Monitoring of Mercury in the Churchill River diversion, Technical Appendices to the Summary Report, Volume 3, Section 9. 1-53 pp.
Hecky, R.E., Bodaly, R.A., Ramsey, D.J., Ramlal, P.S., and Strange, N.E. 1987b. Limnological data for the Southern Indian Lake and Notigi reservoirs. Canada-Manitoba Agreement on the Study and Monitoring of Mercury in the Churchill River diversion, Technical Appendices to the Summary Report, Volume 3, Section 10. 17 pp.
Hnatiuk Stewart, S., and Cooley, M. 2010. Water quality program: Winter 2009. Wuskwatim Generation Project Report # 10-05. A report prepared for the Wuskwatim Power Limited Partnership by North/South Consultants Inc., Winnipeg, MB. 63 pp.
Horne, B.D. 1997. Development of the invertebrate fauna in the Limestone Forebay 1996. A report prepared for Manitoba Hydro by North/South Consultants Inc., Winnipeg, MB. 36 pp.
Horne, B.D., and Baker, R.F. 1993. A fisheries survey of the Limestone forebay, 1992 – year IV. A report prepared for Manitoba Hydro by North/South Consultants Inc., Winnipeg, MB. 45 pp.
Horne, B.D., and MacDonell, D.S. 1995. Lower Nelson River forebay monitoring program 1994, year VI. A report prepared for Manitoba Hydro by North/South Consultants Inc., Winnipeg, MB. 41 pp.
REGIONAL CUMULATIVE EFFECTS ASSESSMENT – PHASE II WATER – WATER QUALITY
DECEMBER 2015 5.2-218
I.D. Systems Ltd. 1993. Investigations of waterfowl use of Playgreen Lake during fall, 1992 migration: Completion report. I.D. Systems Ltd., Winnipeg, MB. 65 pp.
Jackson, T.A. 1988. The mercury problem in recently formed reservoirs of northern Manitoba, Canada: Effects of impoundment and other factors on the production of methyl mercury by microorganisms in sediments. Canadian Journal of Fisheries and Aquatic Sciences 45(1): 97-121 pp.
Jackson, T.A., and Hecky, R.E. 1980. Depression of primary productivity of humic matter in lake and reservoir waters of the boreal forest zone. Canadian Journal of Fisheries and Aquatic Sciences. 37: 2300-2317 pp.
Jansen, W.A., and Cooley, M. 2012. Measurements of total dissolved gas pressure and mercury in water in the vicinity of Gull Rapids and the Kelsey and Limestone generating stations in 2011. Keeyask Project Environmental Studies Program Report # 11-03. A report prepared for Manitoba Hydro by North/South Consultants Inc., Winnipeg, MB. 39 pp.
Jones, G., and Armstrong, N. 2001. Long-term trends in total nitrogen and total phosphorus concentrations in Manitoba streams. Manitoba Conservation Rep. No. 2001-07, Water Branch, Water Quality Management Section, Manitoba Conservation, Winnipeg, MB. 173 pp.
Juliano, K.M., Nelson, P.A., and Zrum, L. 2013. Biotic responses to the lower Nelson River water regime, 2006, 2007. Conawapa Project Environmental Studies Program Report # 07-07. A report prepared for Manitoba Hydro by North/South Consultants Inc. Winnipeg, Manitoba. 213 pp.
KHLP (Keeyask Hydropower Limited Partnership). 2012. Keeyask Generation Project: Environmental impact statement, supporting volume: Aquatic environment. Keeyask Hydropower Limited Partnership, Winnipeg, MB.
Kelly C.A., Rudd, J.W.M., Bodaly, R.A., Roulet, N.P., St. Louis, V.L., Heyes, A., Moore, T.R., Schiff, S., Aravena, R., Scott, K.J., Dyck, B., Harris, R., Warner, B., and Edwards, G. 1997. Increases in fluxes of greenhouse gases and methyl mercury following flooding of an experimental reservoir. Environmental Science and Technology 31: 1334-1344 pp.
Kirk, J.L., and St. Louis, V. 2009. Multiyear total and methyl mercury exports from two major sub-arctic rivers draining into Hudson Bay, Canada. Environmental Science and Technology 43 (7): 2254–2261 pp.
Kiskitto Lake Regulation Committee. 1977. Kiskitto Lake regulation study. Kiskitto Lake Regulation Committee, Winnipeg, MB. 60 pp.
Koshinsky, G.D. 1973. The limnology-fisheries of the Outlet Lakes Area: Present conditions and implications of hydro-electric development. Lake Winnipeg, Churchill and Nelson Rivers Study Board Technical Report, Appendix 5, Volume 2, Section A. 156 pp.

REGIONAL CUMULATIVE EFFECTS ASSESSMENT – PHASE II WATER – WATER QUALITY
DECEMBER 2015 5.2-219
Kozody, L. 1979. A compiling and analysis of all available mercury data for the Southern Indian Lake-Burntwood-Rat river system: September 28, 1979. A working paper for a October 18, 1979 Federal-Provincial Seminar on Mercury in the Environment of the Churchill-Nelson Diversion Route in Manitoba. Manitoba Department of Mines, Resources and Environmental Management, Winnipeg MB. 102pp.
Kroeker, K., and Bernhardt, W.J. 1993. Cross Lake outlet control weir post-project fish stock assessment, 1992. A report prepared for Manitoba Hydro by North/South Consultants Inc., Winnipeg, MB. 83 pp.
Kroeker, K., and Horne, B.D. 1993. A fisheries survey of the Long Spruce forebay, 1992. A report prepared for Manitoba Hydro by North/South Consultants Inc., Winnipeg, MB. 42 pp.
LWCNRSB (Lake Winnipeg, Churchill and Nelson Rivers Study Board). 1975. Lake Winnipeg, Churchill and Nelson Rivers Study Board: Technical report. Lake Winnipeg, Churchill and Nelson Rivers Study Board, Winnipeg, MB. 510 pp.
MacDonell, D.S., and Horne, B.D. 1994. Lower Nelson River forebay monitoring program 1993 – year V. A report prepared for Manitoba Hydro by North/South Consultants Inc., Winnipeg, MB. 110 pp.
MacLaren Plansearch Inc. 1985a. Ecological study of Playgreen Lake, Manitoba – report and technical appendices. A report prepared for Manitoba Hydro by MacLaren Plansearch Inc., Winnipeg, MB. 413 pp.
MacLaren Plansearch Inc. 1985b. Ecological study of Playgreen Lake – addendum. A report prepared for Manitoba Hydro by MacLaren Plansearch Inc., Winnipeg, MB. 49 pp.
MacLaren Plansearch Inc. 1989. Northern Flood Agreement environmental monitoring program: Manitoba/Manitoba Hydro environmental monitoring program: June 1986–June 1988-biannual Report. MacLaren Plansearch Inc., Winnipeg, MB. 32 pp.
MacLaren Engineers Inc. and InterGroup Consulting Economists Ltd. 1984. Burntwood River system environmental overview study: Final report and six technical appendices. Prepared by MacLaren Engineers Inc. and InterGroup Consulting Economists Ltd., Winnipeg, MB.
MacLaren Plansearch Inc. and InterGroup Consultants Ltd. 1986. Limestone Generating Station environmental impact study: Final report. A report prepared for Manitoba Hydro by MacLaren Plansearch Inc. and InterGroup Consultants Ltd., Winnipeg, MB. 167 pp.
Manitoba Conservation and Water Stewardship (MCWS). 2014. Water Quality Management Section, Manitoba Conservation and Water Stewardship, 123 Main Street, Suite 160, Box 20, Winnipeg, MB, R3C 1A5.
Manitoba Hydro. 2014. Lake Winnipeg Regulation: A document in support of Manitoba Hydro’s request for a final licence under the Manitoba Water Power Act, including appendices 1-12. Manitoba Hydro, Winnipeg, MB. 90 pp.

REGIONAL CUMULATIVE EFFECTS ASSESSMENT – PHASE II WATER – WATER QUALITY
DECEMBER 2015 5.2-220
Manitoba Hydro and Department of Mines, Resources and Environmental Management. 1972. Program for regulation of Lake Winnipeg - part 1: Lake Winnipeg regulation as related to Hydro-electric power development on the Nelson River; part 2: Lake Winnipeg regulation - data on water and related resources. Manitoba Hydro and Department of Mines, Resources and Environmental Management, Winnipeg, MB. 98 pp.
Manitoba Hydro and the Town of Churchill. 1997. Lower Churchill River water level enhancement weir project: Environmental impact statement including appendices. Manitoba Hydro, Winnipeg, MB, and the Town of Churchill, Churchill, MB.
MWS (Manitoba Water Stewardship). 2011. Manitoba water quality standards, objectives, and guidelines. MWS Report 2011-01:November 28, 2011,Water Science and Management Branch,. 67 pp.
McCullough GK. 2015. Analysis of inter-laboratory effects on phosphorus concentrations reported for lakes and rivers in Manitoba. Report prepared for Manitoba Conservation and Water Stewardship.
McCullough, G.K., Page, S.J., Hesslein, R.H., Stainton, M.P., Kling, H.J., Salki, A.G., and Barber, D.G. 2012. Hydrological forcing of a recent trophic surge in Lake Winnipeg. Journal of Great Lakes Research 38: 95-105 pp.
McKerness, L. 1990. Federal ecological monitoring program: Annual report 1989-1990. Northern Flood Agreement Manitoba Ecological Report Series 90-4, Environment Canada and Department of Fisheries and Oceans, Ottawa, ON. 82 pp.
McTavish, W.B. 1952. A biological investigation of Southern Indian Lake, summer 1952. Games and Fisheries Branch, Manitoba Department of Mines and Natural Resources, Winnipeg, MB. 97 pp.
Meays, C., and Nordin, R. 2013. Ambient water quality guidelines for sulphate. Technical Appendix: Update April 2013. Water Protection & Sustainability Branch Environmental Sustainability and Strategic Policy Division, British Columbia Ministry of Environment (BCMOE), Victoria, B.C. 55 pp.
Morelli, M. 1973. Water quality progress reports. Research Branch, Manitoba Department of Mines, Natural Resources and Environmental Management, Winnipeg, MB. 12 pp.
Morelli, M. 1975. Results of water sampling program in northern Manitoba 1972–1974. Lake Winnipeg, Churchill and Nelson Rivers Study Board Technical Report, Appendix 2, Volume 2, Section A. 192 pp.
Nelson River Group. 1986. Cross Lake environmental impact assessment study: Volume 1: key issues and impacts. Nelson River Group, Winnipeg, MB. 372 pp.
Newbury, R.W., McCullough, G.K., and Hecky, R.E. 1984. The Southern Indian Lake impoundment and Churchill River diversion. Canadian Journal of Fisheries and Aquatic Sciences 41(4): 548-557 pp.
NSC (North/South Consultants Inc.). 2003. Wuskwatim EIS: Volume 5 Aquatic Environment. A report prepared for Manitoba Hydro by North South Consultants Inc.

REGIONAL CUMULATIVE EFFECTS ASSESSMENT – PHASE II WATER – WATER QUALITY
DECEMBER 2015 5.2-221
NSC. 2006. Wuskwatim Generation Project: Aquatic effects monitoring program. A report prepared for Wuskwatim Power Limited Partnership by North/South Consultants Inc., Winnipeg, MB. 136 pp.
NSC. 2010. Lower Churchill River water level enhancement project: An evaluation of weir performance 1999-2008. A report prepared for Town of Churchill and Manitoba Hydro by North/South Consultants Inc., Winnipeg, MB. 239 pp.
NSC. 2012. Limestone Generating Station: Aquatic environment monitoring programs: A synthesis of results from 1985 to 2003. A report prepared for Manitoba Hydro by North/South Consultants Inc., Winnipeg, MB. 192 pp.
Northwest Hydraulic Consultants Ltd. 1987. Assessment of sediment effects, Churchill River diversion, Manitoba: phase I report. Report # 87-4. A report prepared for Water Resources Branch, Western and Northern Region, Environment Canada by Northwest Hydraulic Consultants Ltd., Edmonton, AB. 29 pp.
Northwest Hydraulic Consultants Ltd. 1988. Assessment of sediment effects, Churchill River diversion, Manitoba: phase II report. IWD-WNR (M)-WRB-SS-88-2, Northwest Hydraulic Consultants Ltd., Edmonton, AB. 48 pp.
Nürnberg, G.K. 1996. Trophic state in clear and colored, soft- and hardwater lakes with special consideration of nutrients, anoxia, phytoplankton and fish. Lake Reservoir Management 12: 432-447 pp.
OECD (Organization for Economic Cooperation and Development). 1982. Eutrophication of waters: Monitoring, assessment and control, final report. OECD cooperative programme on monitoring of inland waters (eutrophication control). Environment Directorate, OECD, Paris, FR. 154 pp.
Patalas, K., and A. Salki. 1984. Effects of impoundment and diversion on the crustacean plankton of Southern Indian Lake. Canadian Journal of Fisheries and Aquatic Sciences 41(4): 613-637 pp.
Planas, D., and Hecky, R.E. 1984. Comparison of phosphorous turnover times in northern Manitoba reservoirs with lakes of the Experimental Lakes Area. Canadian Journal of Fisheries and Aquatic Sciences 41: 605-612 pp.
Playle, R., and Williamson, D.A. 1986. Water chemistry changes associated with hydroelectric development in northern Manitoba: The Churchill, Rat, Burntwood, and Nelson Rivers. Water Standards and Studies Report No. 86-8, Manitoba Environment and Workplace safety and Health, Winnipeg MB. 57 pp.
Playle, R., Williamson, D.A., and Duncan, D.A. 1988. Water chemistry changes following diversion, impoundment and hydroelectric development in northern Manitoba. In Proceedings of the symposium on interbasin transfer of water: Impacts and research needs for Canada, Saskatoon, SK, November 9-10, 1987. Edited by W. Nicholaichuk and F. Quinn. National Hydrology Research Institute, Saskatoon, SK. 337-352 pp.

REGIONAL CUMULATIVE EFFECTS ASSESSMENT – PHASE II WATER – WATER QUALITY
DECEMBER 2015 5.2-222
Ralley, W.E., and Williamson, D.A. 1990. Multivariate analysis of water chemistry changes following hydroelectric development in northern Manitoba, Canada. Water Standards and Studies Report, Northern Flood Agreement Manitoba Ecological Report Series No. 90-1, Environment Canada, Winnipeg, MB. 90 pp.
Ramsey, D.J. 1988. Measurements of methylation balance in Southern Indian Lake, Notigi reservoir, Sipiwesk and Granville lakes, Manitoba, 1987. Northern Flood Agreement Manitoba Ecological Report Series No. 88-1. A report prepared for Environment Canada and Department of Fisheries and Oceans by Agassiz North Associates, Winnipeg, MB. 106 pp.
Ramsey, D.J. 1990. Measurements of methylation balance in Southern Indian Lake, Granville Lake, and Stephens Lake, Manitoba, 1989. Northern Flood Agreement Manitoba Ecological Report Series No. 90-3. Environment Canada and Department of Fisheries and Oceans, Winnipeg, MB. 89 pp.
Ramsey, D.J. 1991a. Federal ecological monitoring program: Final water quality report. Federal Ecological Monitoring Program, Technical Appendix, Volume 2. 320 pp.
Ramsey, D.J. 1991b. Federal ecological monitoring program: Final mercury report. Federal Ecological Monitoring Program, Technical Appendix, Volume 1. 141 pp.
Ramsey, D.J., and Ramlal, P.S. 1986. Appendix 3: Measurements of mercury methylation balance in relation to concentrations of total mercury in northern Manitoba reservoirs and their use in predicting the duration of fish mercury problems in new reservoirs. Canada-Manitoba agreement on the study and monitoring of mercury in the Churchill River Diversion. Technical appendices to the summary report, Volume 3, Section 12. 51 pp.
Ramsey, D.J. Livingston, L., Hagenson, I., and Green, D.J. 1989. Evolution of limnological conditions in lakes of the Nelson and Rat-Burntwood river systems after Churchill River diversion and Lake Winnipeg regulation: An overview. MS Rep. No. 89-15, Fisheries Branch, Manitoba Department of Natural Resources, Winnipeg, MB. 93 pp.
Rannie, W.F., and Punter, E. 1987. Survey of existing data on levels and sources of mercury within the region covered by the Canada-Manitoba mercury agreement. Canada-Manitoba Agreement on the Study and Monitoring of Mercury in the Churchill River diversion, Technical Appendices to the Summary Report, Volume 1, Section 2. 179 pp.
Remnant, R.A., and Caskey, R.R. 2000. Lower Churchill River water level enhancement weir project post-project monitoring: Fish use of the Goose Creek enhancement reach, year I, 1999. A report prepared for Manitoba Hydro by North/South Consultants Inc., Winnipeg, MB. 62 pp.
Remnant, R.A., and Kitch, I. 1996. Fish utilization and habitat classification of the lower Churchill River mainstem, 1995. A report prepared for Manitoba Hydro by North/South Consultants Inc., Winnipeg, MB. 114 pp.

REGIONAL CUMULATIVE EFFECTS ASSESSMENT – PHASE II WATER – WATER QUALITY
DECEMBER 2015 5.2-223
Remnant, R.A., Graveline, P.G., and Funk, H.P. 2001. Lower Churchill River water level enhancement weir project post-project monitoring: Fish use of the Goose Creek enhancement reach, year II, 2000. A report prepared for Manitoba Hydro by North/South Consultants Inc., Winnipeg, MB. 53 pp.
Salki, A., Anema, C., and Hendzel, L. 1999. Limnological conditions in Southern Indian Lake reservoir during 1998 following 22 years of impoundment and diversion of the Churchill River. A report prepared for Manitoba Hydro by the Department of Fisheries and Oceans, Freshwater Institute, Winnipeg, MB.
Savard, T.G. 2012. Wuskwatim Generation Project: Construction monitoring 2011: Water quality program. Wuskwatim Generation Project Report # 12-01. A report prepared for Wuskwatim Power Limited Partnership by North/South Consultants Inc. 95 pp.
Savard, T.G., and Cooley, H.M. 2006. Turbidity monitoring data for Wuskwatim Lake, Wuskwatim Brook, and the Burntwood River, summer/fall, 2004. Nisichawayasihk Cree Nation-Manitoba Hydro Joint Environmental Studies Report # 06-01, North/South Consultants Inc., Winnipeg, MB. 43 pp.
Savard, T., and Cooley, H.M. 2007a. Dissolved oxygen surveys in the Keeyask study area: Winter 2005 and 2006. Keeyask Project Environmental Studies Program Report # 06-03. A report prepared for Manitoba Hydro by North/South Consultants Inc., Winnipeg, MB. 40 pp.
Savard, T.G., and Cooley, H.M. 2007b. Water quality data for the lower Nelson River system: Winter 2006. Conawapa Project Environmental Studies Program Report # 06-06. A report prepared for Manitoba Hydro by North/South Consultants Inc., Winnipeg, MB. 48 pp.
Savard, T.G., and Cooley, M. 2011a. Wuskwatim Generation Project: Construction monitoring 2010: Water quality program. Wuskwatim Generation Project Report # 11-02. A report prepared for Wuskwatim Power Limited Partnership by North/South Consultants Inc., Winnipeg, MB. 111 pp.
Savard, T.G., and Cooley, M. 2011b. Sediment quality data for the Lower Nelson River, Manitoba, 2010. A report prepared for Manitoba Hydro by North/South Consultants Inc., Winnipeg, MB. 41 pp.
Savard, T.G., Hnatiuk Stewart, S., and Cooley, M. 2009a. Wuskwatim Generation Project: Construction monitoring 2008: Water quality program. Wuskwatim Generation Project Report # 09-07. A report prepared for the Wuskwatim Power Limited Partnership by North/South Consultants Inc., Winnipeg, MB. 97 pp.
Savard, T.G., Hnatiuk Stewart, S., and Cooley, M. 2009b. Wuskwatim Generation Project: Baseline synthesis: Water quality. Wuskwatim Generation Project Report # 09-10. A report prepared for the Wuskwatim Power Limited Partnership by North/South Consultants Inc., Winnipeg, MB. 271 pp.
Savard, T., Hnatiuk Stewart, S., and Cooley, H.M. 2010. Water quality data for the lower Nelson River system, Manitoba, 2009. Keeyask and Conawapa Projects Report # 09-04. A report prepared for Manitoba Hydro by North/South Consultants Inc. 240 pp.

REGIONAL CUMULATIVE EFFECTS ASSESSMENT – PHASE II WATER – WATER QUALITY
DECEMBER 2015 5.2-224
Schlick, R.O. 1968a. A survey of Sipiwesk Lake in 1966. MS Report No. 68-5, Fisheries Branch, Manitoba Department of Mines and Natural Resources, Winnipeg MB. 17 pp.
Schlick, R.O. 1968b. A survey of Split Lake in 1966. MS Report No. 68-8. Fisheries Branch, Manitoba Department of Mines and Natural Resources, Winnipeg MB. 21 pp.
Schlick, R.O. 1972. A fisheries survey of Playgreen Lake, 1971. Manitoba Department of Mines, Resources and Environmental Management, Winnipeg, MB. 18 pp.
Schneider-Vieira, F. 1994. Development of the invertebrate fauna in the Limestone forebay 1993. A report prepared for Manitoba Hydro by North/South Consultants Inc., Winnipeg, MB. 34 pp.
Schneider-Vieira, F. 1996. Development of the invertebrate fauna in the Limestone Forebay 1994. A report prepared for Manitoba Hydro by North/South Consultants Inc., Winnipeg, MB. 26 pp.
Schneider, F., and Baker, R. 1993. Summary of lower trophic level studies in the lower Nelson River, 1988 to 1992. A report prepared for Manitoba Hydro by North/South Consultants Inc., Winnipeg, MB. 44 pp.
Schneider-Vieira, F., and Fazakas, C. 1996. Water chemistry and phytoplankton of the lower Churchill River and Goose Creek, year I, 1995. A report prepared for Manitoba Hydro by North/South Consultants Inc., Winnipeg, MB. 16 pp.
Schneider-Vieira, F., and Sotiropoulos, M. 1997. Water chemistry and phytoplankton of the lower Churchill River and Goose Creek, year II-1996. A report prepared for Manitoba Hydro by North/South Consultants Inc., Winnipeg, MB. 18 pp.
Split Lake Cree-Manitoba Hydro Joint Study Group. 1996. Environmental baseline evaluation. Split Lake Cree post-project environmental review, Volume 4. Support from North/South Consultants Inc. 200 pp.
Stantec Consulting Ltd. 2014. Conawapa Generation Project: Stage IV studies – physical environment Conawapa-water temperature and dissolved oxygen study. A report prepared for Manitoba Hydro by Stantec Consulting Ltd., Winnipeg, MB. 71 pp.
Stockner, J.G. 1972. Fish survey: Playgreen and Kiskittogisu lakes. Research Branch, Manitoba Department of Mines, Resources and Environmental Management, Winnipeg, MB. 6 pp.
Sunde, L.A. 1958. Preliminary report on the Burntwood River (pre-pollution survey) July 30 to August 10, 1958. Manitoba Department of Mines and Natural Resources, Winnipeg, MB. 9 pp.
Sunde, L.A. 1960. Interim report Burntwood River pre-pollution survey, July 1960. Manitoba Department of Mines and Natural Resources, Winnipeg, MB. 7 pp.
Swanson, G. 1986. An interim report on the fisheries of the lower Nelson River and the impacts of hydro-electric development, 1985 data. MS Report No. 86-19, Fisheries Branch, Manitoba Department of Natural Resources, Winnipeg MB. 228 pp.

REGIONAL CUMULATIVE EFFECTS ASSESSMENT – PHASE II WATER – WATER QUALITY
DECEMBER 2015 5.2-225
Thomas, J.F.J. 1959. Industrial water resources of Canada: Nelson River drainage basin in Canada, 1953-56. Canada Department of Mines and Technical Surveys, Ottawa, ON. 147 pp.
UMA (Underwood McLellan Ltd.). 1983. Evaluation of Article 6 Northern Flood Agreement, Norway House, phase I report. A report prepared for Indian and Northern Affairs Canada by Underwood McLellan Ltd., Winnipeg, MB. 44 pp.
Vitkin, N., and Penner, F. 1979. 1979 review of suspended sediment sampling in Manitoba. MS Rep. No. 79-22, Water Resources Branch, Planning Division, Manitoba Department of Natural Resources, Winnipeg, MB. 71 pp.
Wiens, A.P., and Rosenberg, D.M. 1994. Churchill River diversion: Effects on benthic invertebrates in lakes along the lower Churchill and the diversion route. Canadian Technical Report of Fisheries and Aquatic Sciences 2001: 29 pp.
Williamson, D.A. 1986. Mercury in water and sediments in the Churchill and Nelson rivers, Manitoba, Canada. Water Standards and Studies Report No. 86-3, Manitoba Department of Environment and Workplace Safety and Health, Winnipeg MB. 17 pp.
Williamson, D.A., and Ralley, W.E. 1993. A summary of water chemistry changes following hydroelectric development in northern Manitoba, Canada. Water Quality Management Section Rep. No. 93-02, Manitoba Environment, Winnipeg, MB. 68 pp.
Zrum, L., and Kennedy, J. 2000. Development of the invertebrate fauna in the Limestone forebay, 1999. A report prepared for Manitoba Hydro by North/South Consultants Inc., Winnipeg, MB. 29 pp.

REGIONAL CUMULATIVE EFFECTS ASSESSMENT – PHASE II WATER – FISH COMMUNITY
DECEMBER 2015 5.3-1
5.3 Fish Community
5.3.1 Introduction Fish play a key role in ecosystem function and are important to First Nations as a domestic and commercial resource. Under the Constitution Act, residents of affected communities have rights to harvest fish for food. Fish are also important to many Manitobans as a recreational resource and to others as a commercial resource. Fish and fish habitat are protected by the Fisheries Act.
The information presented in this section includes all species found within the Regional Cumulative Effects Assessment (RCEA) Region of Interest (ROI), although the discussion focuses on the fish community as a whole and two focal species that were selected on the basis of community, regulatory, and/or scientific concerns: Lake Whitefish (Coregonus clupeaformis) and Walleye (Sander vitreus, commonly known as pickerel). Given its special status to First Nation members and regulators, Lake Sturgeon (Acipenser fulvescens) is discussed in a separate section (Lake Sturgeon, Chapter 5.4).
Lake Whitefish was selected as a focal species because it is important to domestic and commercial fisheries, is sensitive to environmental change, in particular to effects often seen following hydroelectric development, such as changes to water quality and sediment deposition within aquatic habitats, and is a mid-level predator in the food web. Walleye was selected as a focal species because it is important as a domestic, commercial and recreational resource, and is a top-level predator in the food web and thereby would integrate changes to other components of the aquatic food web. Additional information on the fish community and these two species is provided in Section 5.3.1.2.
Three of the four areas defined for the RCEA ROI were subdivided where there were natural differences in overall fish habitat and/or effects of hydroelectric development as follows (Map 5.3.1-1):
• Area 1 o outlet of Lake Winnipeg to Jenpeg Generating Station (GS) — includes the Outlet Lakes, the
reservoir of the Jenpeg GS (constructed in the mid-1970s), and the east channel of the Nelson River to Pipestone Lake; and
o Cross Lake to Kelsey GS — includes the upper Nelson River downstream of the Jenpeg GS, including Cross, Walker, Pipestone, and Sipiwesk lakes.
• Area 2 o Kelsey GS to Kettle GS — includes Split Lake and Stephens Lake (reservoir of the Kettle GS,
completed in 1974). The Keeyask Generation Project (GP) is currently being constructed in this reach; and
o Kettle GS to the Nelson River estuary — includes the lower Nelson River, and the reservoirs of the Long Spruce and Limestone GSs (constructed in the 1970s and 1980s).
• Area 3 o Southern Indian Lake (SIL) — includes SIL to the outlet at the Missi Falls Control Structure
(CS) and the diversion channel at South Bay; and

REGIONAL CUMULATIVE EFFECTS ASSESSMENT – PHASE II WATER – FISH COMMUNITY
DECEMBER 2015 5.3-2
o South Bay Diversion Channel to First Rapids on the Burntwood River — includes the lakes and rivers of the Churchill River Diversion (CRD) route, including the Rat River and Rat, Isset and Notigi lakes upstream of the Notigi CS, and the Burntwood River and Threepoint, Footprint, and Wuskwatim lakes downstream of the Notigi CS. Wuskwatim Lake is the site of the Wuskwatim GP, completed in 2012.
Area 4, Missi Falls CS to the Churchill River estuary, was not subdivided. This area includes the Churchill Weir, constructed in 1998.
5.3.1.1 Pathways of Effect Hydroelectric development, including creation of reservoirs/flooding of terrestrial habitat, alterations in flows and water levels, and water diversion, can affect the fish community in a number of ways. These pathways of effect are illustrated in Figure 5.3.1-1. In brief, hydroelectric development may affect the fish community by: • Changes in the water regime may alter fish habitat, specifically habitats used for spawning, feeding
and rearing, and overwintering. These changes to habitat may affect community structure, recruitment, mortality and movement patterns, and ultimately fish species composition and abundance. The water regime also affects water quality and erosion/sedimentation, which may affect fish habitat as well as fish directly (e.g., mortality due to oxygen depletion).
• The footprint of physical infrastructure within the water (e.g., generating stations, control structures) will eliminate fish habitat and alter fish movements. These changes may also affect fish community structure, recruitment, and mortality.
• Increased human access to a particular area as well as the presence of a workforce may lead to changes in harvesting which can lead to changes in fish mortality. Increased access may also result in the introduction of invasive species, with the potential for effects to the fish community.
Other factors not related to hydroelectric development also affect the fish community, including commercial, domestic and recreational fisheries, extreme weather (floods and droughts), climate, and invasive species.
As discussed in Section 5.3.1.4, the overall approach was to quantify changes to the fish community and focal species based on selected indicators and metrics, and then assess the causes of observed changes in relation to known environmental changes, in particular hydroelectric development. However, the fish community responds to changes in the environment as a whole. Therefore, although an instream development such as impoundment of a river to form a reservoir would likely be the primary cause of an observed change within that reservoir, other developments in the immediate watershed (e.g., road and transmission line crossings of tributary streams, land clearing for municipal developments, mine exploration or forestry) would contribute incrementally to observed changes. Conversely, if little or no change in the fish community is observed or the fish community in regulated waters is similar to that in off-system lakes, then development likely did not have a marked effect.
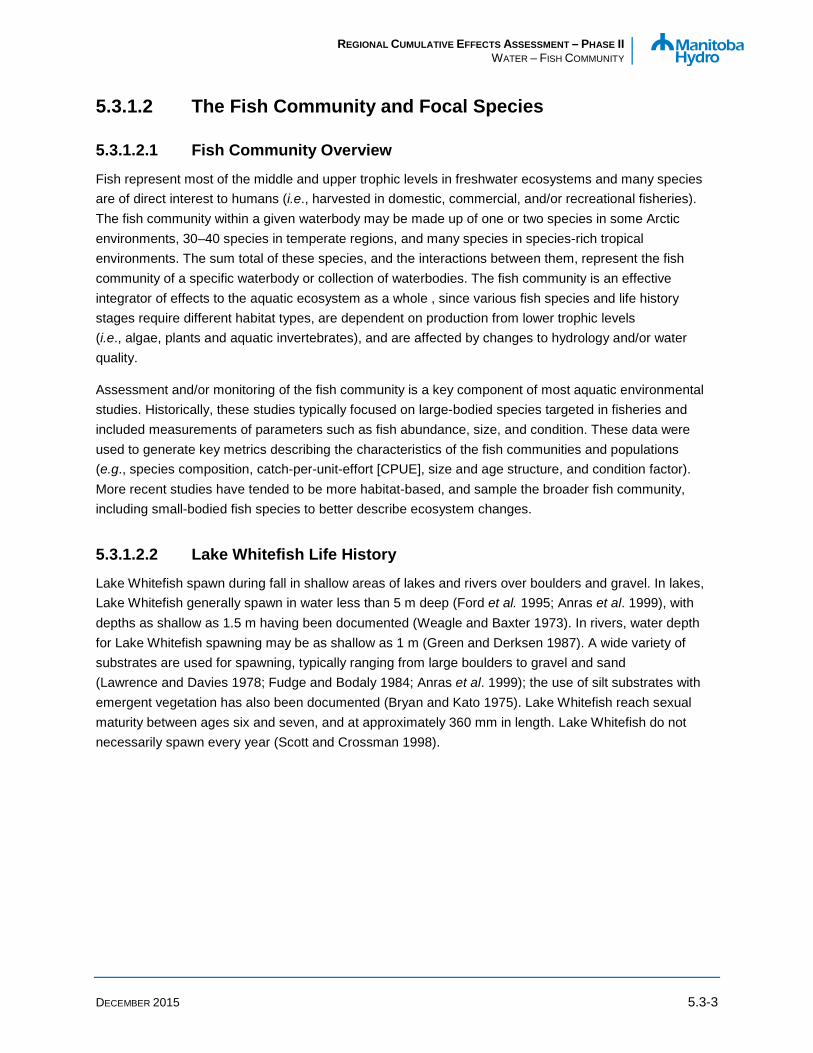
REGIONAL CUMULATIVE EFFECTS ASSESSMENT – PHASE II WATER – FISH COMMUNITY
DECEMBER 2015 5.3-3
5.3.1.2 The Fish Community and Focal Species
5.3.1.2.1 Fish Community Overview
Fish represent most of the middle and upper trophic levels in freshwater ecosystems and many species are of direct interest to humans (i.e., harvested in domestic, commercial, and/or recreational fisheries). The fish community within a given waterbody may be made up of one or two species in some Arctic environments, 30–40 species in temperate regions, and many species in species-rich tropical environments. The sum total of these species, and the interactions between them, represent the fish community of a specific waterbody or collection of waterbodies. The fish community is an effective integrator of effects to the aquatic ecosystem as a whole , since various fish species and life history stages require different habitat types, are dependent on production from lower trophic levels (i.e., algae, plants and aquatic invertebrates), and are affected by changes to hydrology and/or water quality.
Assessment and/or monitoring of the fish community is a key component of most aquatic environmental studies. Historically, these studies typically focused on large-bodied species targeted in fisheries and included measurements of parameters such as fish abundance, size, and condition. These data were used to generate key metrics describing the characteristics of the fish communities and populations (e.g., species composition, catch-per-unit-effort [CPUE], size and age structure, and condition factor). More recent studies have tended to be more habitat-based, and sample the broader fish community, including small-bodied fish species to better describe ecosystem changes.
5.3.1.2.2 Lake Whitefish Life History
Lake Whitefish spawn during fall in shallow areas of lakes and rivers over boulders and gravel. In lakes, Lake Whitefish generally spawn in water less than 5 m deep (Ford et al. 1995; Anras et al. 1999), with depths as shallow as 1.5 m having been documented (Weagle and Baxter 1973). In rivers, water depth for Lake Whitefish spawning may be as shallow as 1 m (Green and Derksen 1987). A wide variety of substrates are used for spawning, typically ranging from large boulders to gravel and sand (Lawrence and Davies 1978; Fudge and Bodaly 1984; Anras et al. 1999); the use of silt substrates with emergent vegetation has also been documented (Bryan and Kato 1975). Lake Whitefish reach sexual maturity between ages six and seven, and at approximately 360 mm in length. Lake Whitefish do not necessarily spawn every year (Scott and Crossman 1998).

RCEAArea 1
RCEAArea 4
RCEAArea 3
RCEAArea 2
Jenpeg G.S. to Kelsey G.S.
Kelsey G.S. to Kettle G.S.
Southern Indian Lake Kettle G.S. to
Nelson River Estuary
Lake Winnipeg Outlet to Jenpeg G.S.
South Bay Diversion Channel
to First Rapids
Missi Falls Control Structure to Churchill River Estuary
Jenpeg G.S.
Kettle G.S.
Kelsey G.S.
Wuskwatim G.S.
Limestone G.S.Long Spruce G.S.Keeyask
G.S.
Conawapa G.S.
Thompson
Churchill
Snow Lake
Cross Lake
Gillam
Bird
York Landing
Norway House
South IndianLake
Split Lake
Ilford
Nelson House
Notigi Control Structure
Missi Falls Control Structure
LAKEWINNIPEG
HUDSONBAY
File
Loc
atio
n: J
:\MY
P\M
H_R
CE
A\F
ish_
Pop
ltns\
PH
AS
E_2
\Mxd
\Ove
rvie
ws\
2015
1203
_RC
EA
_Pha
seII_
AE
_FIS
H_F
ishC
omm
unity
Ass
essm
entA
reas
Ove
rvie
w_c
p.m
xd
1.0
29-OCT-15
North/South Consultants
Cre
ated
By:
cpa
rker
- B
Siz
e La
ndsc
ape
STD
- M
AR
201
5
Sca
le: 1
:2,4
45,0
00
04-DEC-15
Province of Manitoba, Government of Canada,North/South Consultants,ManitobaHydro
Fish Community Assessment Areas
Overview
LegendRCEA Region of Interest
Fish Community Reach Boundary
First Nation Reserve
Hudson Bay
Thompson
Winnipeg
Churchill
NAD 1983 UTM Zone 14N
DATA SOURCE:
COORDINATE SYSTEM: DATE CREATED:
CREATED BY:
VERSION NO:
REVISION DATE:
QA/QC:
Regional Cumulative Effects Assessment
0 20 40 Miles
0 30 60 Kilometres
InfrastructureGenerating Station (Existing)
Generating Station (Under Construction)
Generating Station (Potential)
Control Structure
Highway
Rail
Manito
baOnta
rio
Map 5.3.1-1

REGIONAL CUMULATIVE EFFECTS ASSESSMENT – PHASE II WATER – FISH COMMUNITY
DECEMBER 2015 5.3-5
Arrow width is not an indication of magnitude.
Figure 5.3.1-1: Linkage Diagram Showing Potential Pathways of Effect of Hydroelectric Development and Other Factors on the Fish Community
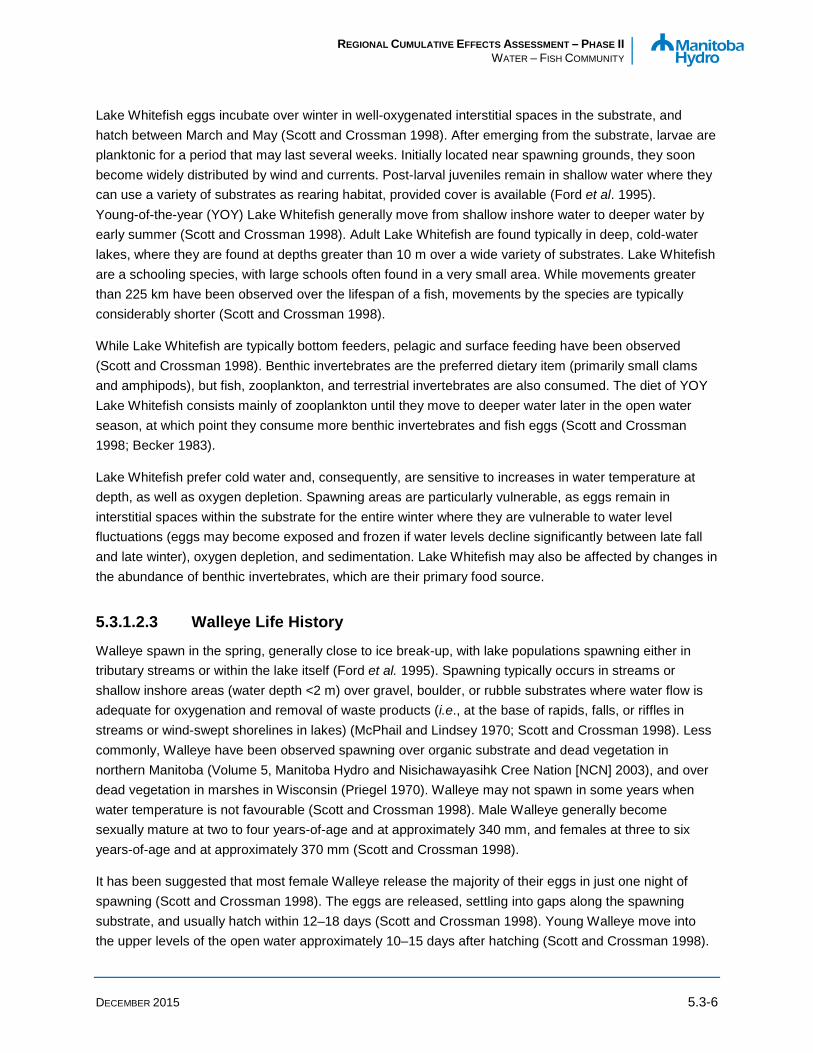
REGIONAL CUMULATIVE EFFECTS ASSESSMENT – PHASE II WATER – FISH COMMUNITY
DECEMBER 2015 5.3-6
Lake Whitefish eggs incubate over winter in well-oxygenated interstitial spaces in the substrate, and hatch between March and May (Scott and Crossman 1998). After emerging from the substrate, larvae are planktonic for a period that may last several weeks. Initially located near spawning grounds, they soon become widely distributed by wind and currents. Post-larval juveniles remain in shallow water where they can use a variety of substrates as rearing habitat, provided cover is available (Ford et al. 1995). Young-of-the-year (YOY) Lake Whitefish generally move from shallow inshore water to deeper water by early summer (Scott and Crossman 1998). Adult Lake Whitefish are found typically in deep, cold-water lakes, where they are found at depths greater than 10 m over a wide variety of substrates. Lake Whitefish are a schooling species, with large schools often found in a very small area. While movements greater than 225 km have been observed over the lifespan of a fish, movements by the species are typically considerably shorter (Scott and Crossman 1998).
While Lake Whitefish are typically bottom feeders, pelagic and surface feeding have been observed (Scott and Crossman 1998). Benthic invertebrates are the preferred dietary item (primarily small clams and amphipods), but fish, zooplankton, and terrestrial invertebrates are also consumed. The diet of YOY Lake Whitefish consists mainly of zooplankton until they move to deeper water later in the open water season, at which point they consume more benthic invertebrates and fish eggs (Scott and Crossman 1998; Becker 1983).
Lake Whitefish prefer cold water and, consequently, are sensitive to increases in water temperature at depth, as well as oxygen depletion. Spawning areas are particularly vulnerable, as eggs remain in interstitial spaces within the substrate for the entire winter where they are vulnerable to water level fluctuations (eggs may become exposed and frozen if water levels decline significantly between late fall and late winter), oxygen depletion, and sedimentation. Lake Whitefish may also be affected by changes in the abundance of benthic invertebrates, which are their primary food source.
5.3.1.2.3 Walleye Life History
Walleye spawn in the spring, generally close to ice break-up, with lake populations spawning either in tributary streams or within the lake itself (Ford et al. 1995). Spawning typically occurs in streams or shallow inshore areas (water depth <2 m) over gravel, boulder, or rubble substrates where water flow is adequate for oxygenation and removal of waste products (i.e., at the base of rapids, falls, or riffles in streams or wind-swept shorelines in lakes) (McPhail and Lindsey 1970; Scott and Crossman 1998). Less commonly, Walleye have been observed spawning over organic substrate and dead vegetation in northern Manitoba (Volume 5, Manitoba Hydro and Nisichawayasihk Cree Nation [NCN] 2003), and over dead vegetation in marshes in Wisconsin (Priegel 1970). Walleye may not spawn in some years when water temperature is not favourable (Scott and Crossman 1998). Male Walleye generally become sexually mature at two to four years-of-age and at approximately 340 mm, and females at three to six years-of-age and at approximately 370 mm (Scott and Crossman 1998).
It has been suggested that most female Walleye release the majority of their eggs in just one night of spawning (Scott and Crossman 1998). The eggs are released, settling into gaps along the spawning substrate, and usually hatch within 12–18 days (Scott and Crossman 1998). Young Walleye move into the upper levels of the open water approximately 10–15 days after hatching (Scott and Crossman 1998).
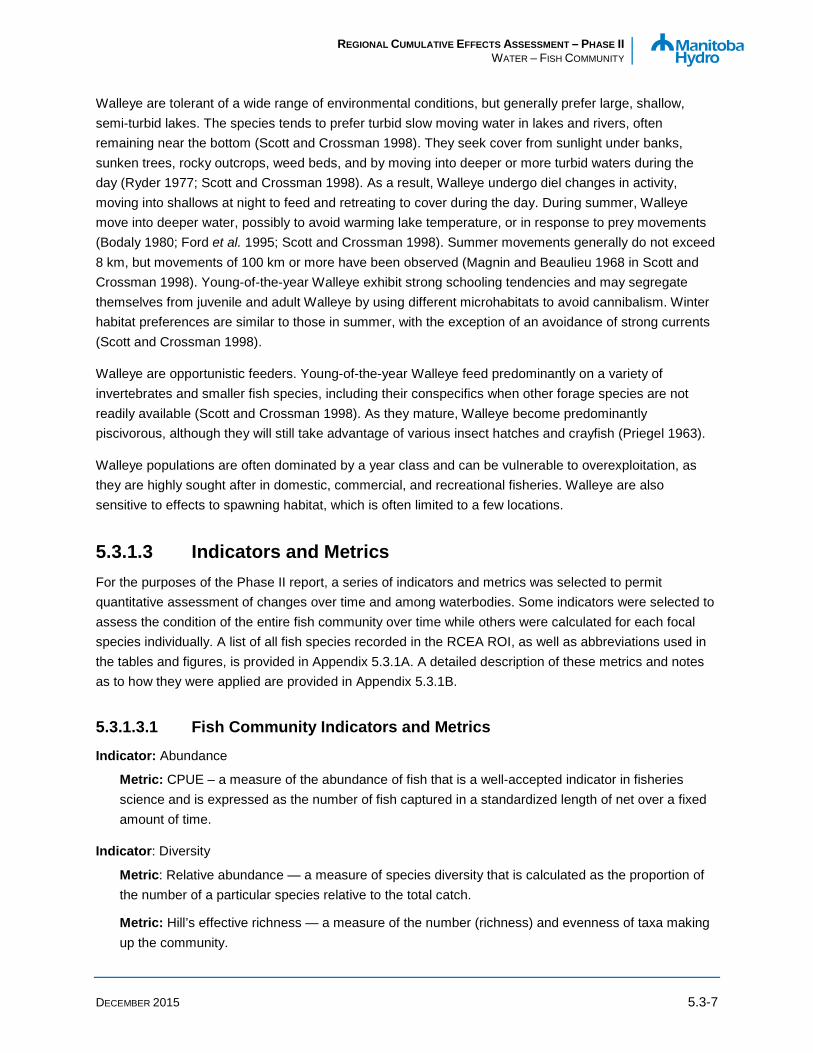
REGIONAL CUMULATIVE EFFECTS ASSESSMENT – PHASE II WATER – FISH COMMUNITY
DECEMBER 2015 5.3-7
Walleye are tolerant of a wide range of environmental conditions, but generally prefer large, shallow, semi-turbid lakes. The species tends to prefer turbid slow moving water in lakes and rivers, often remaining near the bottom (Scott and Crossman 1998). They seek cover from sunlight under banks, sunken trees, rocky outcrops, weed beds, and by moving into deeper or more turbid waters during the day (Ryder 1977; Scott and Crossman 1998). As a result, Walleye undergo diel changes in activity, moving into shallows at night to feed and retreating to cover during the day. During summer, Walleye move into deeper water, possibly to avoid warming lake temperature, or in response to prey movements (Bodaly 1980; Ford et al. 1995; Scott and Crossman 1998). Summer movements generally do not exceed 8 km, but movements of 100 km or more have been observed (Magnin and Beaulieu 1968 in Scott and Crossman 1998). Young-of-the-year Walleye exhibit strong schooling tendencies and may segregate themselves from juvenile and adult Walleye by using different microhabitats to avoid cannibalism. Winter habitat preferences are similar to those in summer, with the exception of an avoidance of strong currents (Scott and Crossman 1998).
Walleye are opportunistic feeders. Young-of-the-year Walleye feed predominantly on a variety of invertebrates and smaller fish species, including their conspecifics when other forage species are not readily available (Scott and Crossman 1998). As they mature, Walleye become predominantly piscivorous, although they will still take advantage of various insect hatches and crayfish (Priegel 1963).
Walleye populations are often dominated by a year class and can be vulnerable to overexploitation, as they are highly sought after in domestic, commercial, and recreational fisheries. Walleye are also sensitive to effects to spawning habitat, which is often limited to a few locations.
5.3.1.3 Indicators and Metrics For the purposes of the Phase II report, a series of indicators and metrics was selected to permit quantitative assessment of changes over time and among waterbodies. Some indicators were selected to assess the condition of the entire fish community over time while others were calculated for each focal species individually. A list of all fish species recorded in the RCEA ROI, as well as abbreviations used in the tables and figures, is provided in Appendix 5.3.1A. A detailed description of these metrics and notes as to how they were applied are provided in Appendix 5.3.1B.
5.3.1.3.1 Fish Community Indicators and Metrics
Indicator: Abundance
Metric: CPUE – a measure of the abundance of fish that is a well-accepted indicator in fisheries science and is expressed as the number of fish captured in a standardized length of net over a fixed amount of time.
Indicator: Diversity
Metric: Relative abundance — a measure of species diversity that is calculated as the proportion of the number of a particular species relative to the total catch.
Metric: Hill’s effective richness — a measure of the number (richness) and evenness of taxa making up the community.

REGIONAL CUMULATIVE EFFECTS ASSESSMENT – PHASE II WATER – FISH COMMUNITY
DECEMBER 2015 5.3-8
5.3.1.3.2 Focal Species (Lake Whitefish, Walleye) Indicators and Metrics Indicator: Abundance
Metric: CPUE – a measure of the abundance of fish that is a well-accepted indicator in fisheries science and is expressed as the number or weight of fish in a given length of net over a given period of time.
Indicator: Condition
Metric: Fulton’s condition factor (KF) — a measure of the condition of the fish (i.e., girth or “fatness”).
Indicator: Growth
Metric: von Bertalanffy growth curves – a method of representing length at age and growth rates within a population.
Metric: Relative Year Class Strength (RYCS) — a method of comparing year class strength (i.e., the proportion of a population born in the same year compared to the total population).
5.3.1.4 Approach and Methods The overall approach to assessing the effects of hydroelectric development on fish communities was to collect the available data, analyze the information for each selected metric, and present the information on each metric for relevant periods. Where pre-hydroelectric development data were available, those data are presented and compared with post-hydroelectric development data. Comparisons were also made among waterbodies where these comparisons would assist in determining the likely causes of observed changes. The information used in the analysis generally fell into one of the following categories:
• published studies documenting fish community metrics within particular waterbodies within one or more periods;
• published studies in which assessments of changes in fish community metrics over time, notably in relation to hydroelectric development, were presented;
• temporal analysis by metric of fish community raw data collected at various locations and times by a variety of agencies and for a variety of purposes;
• description of current fish community metrics using recent fish community data, most notably data collected under Manitoba/Manitoba Hydro’s Coordinated Aquatic Monitoring Program (CAMP);
• spatial comparisons of fish community metrics across waterbodies sampled during similar periods; and
• inferential assessments of potential changes or effects of hydroelectric development on fish community metrics based on information collected from other waterbodies and/or linkages to physical effects (e.g., changes in water levels and/or flows) as well as studies targeting other aspects of fish life history (e.g., larval drift studies, movement studies).
Calculation of the metrics involved reanalysis of historical data that were analysed and presented in the available literature, analysis of historic data that have not been analysed and/or presented previously, or inclusion of new data (e.g., CAMP six-year synthesis report [CAMP unpublished {unpubl.} data]). As many of the published assessments of the fish community were produced a number of years ago, this
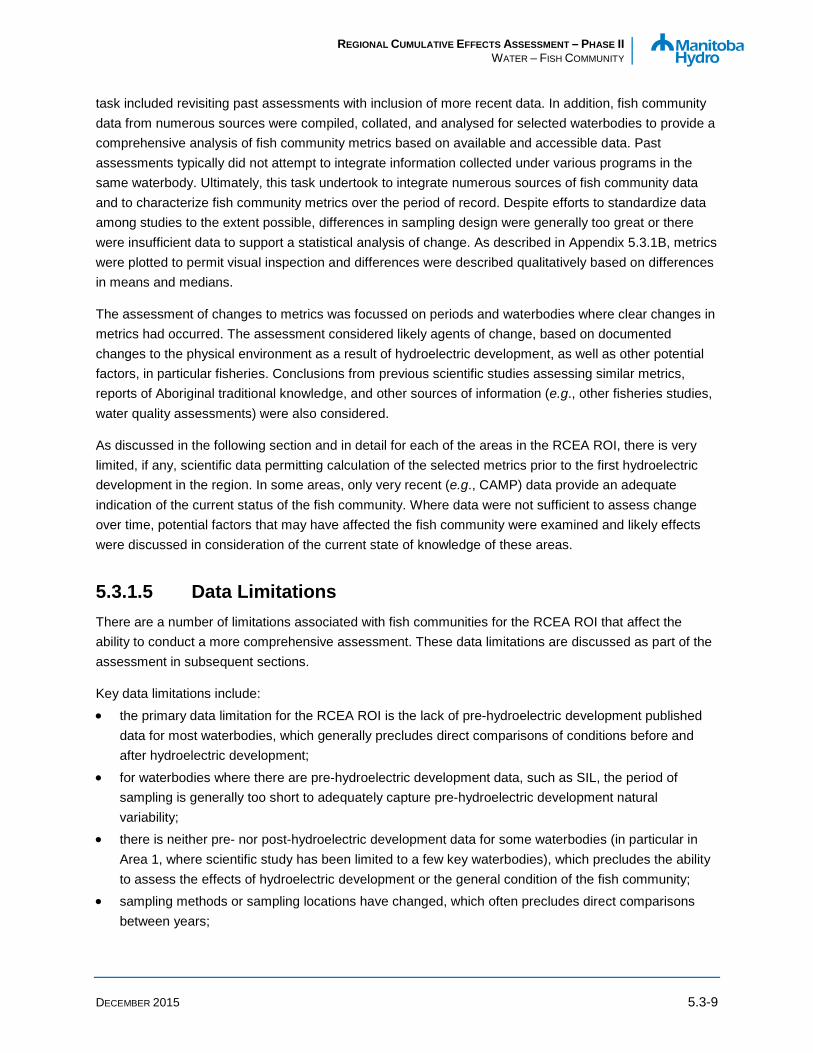
REGIONAL CUMULATIVE EFFECTS ASSESSMENT – PHASE II WATER – FISH COMMUNITY
DECEMBER 2015 5.3-9
task included revisiting past assessments with inclusion of more recent data. In addition, fish community data from numerous sources were compiled, collated, and analysed for selected waterbodies to provide a comprehensive analysis of fish community metrics based on available and accessible data. Past assessments typically did not attempt to integrate information collected under various programs in the same waterbody. Ultimately, this task undertook to integrate numerous sources of fish community data and to characterize fish community metrics over the period of record. Despite efforts to standardize data among studies to the extent possible, differences in sampling design were generally too great or there were insufficient data to support a statistical analysis of change. As described in Appendix 5.3.1B, metrics were plotted to permit visual inspection and differences were described qualitatively based on differences in means and medians.
The assessment of changes to metrics was focussed on periods and waterbodies where clear changes in metrics had occurred. The assessment considered likely agents of change, based on documented changes to the physical environment as a result of hydroelectric development, as well as other potential factors, in particular fisheries. Conclusions from previous scientific studies assessing similar metrics, reports of Aboriginal traditional knowledge, and other sources of information (e.g., other fisheries studies, water quality assessments) were also considered.
As discussed in the following section and in detail for each of the areas in the RCEA ROI, there is very limited, if any, scientific data permitting calculation of the selected metrics prior to the first hydroelectric development in the region. In some areas, only very recent (e.g., CAMP) data provide an adequate indication of the current status of the fish community. Where data were not sufficient to assess change over time, potential factors that may have affected the fish community were examined and likely effects were discussed in consideration of the current state of knowledge of these areas.
5.3.1.5 Data Limitations There are a number of limitations associated with fish communities for the RCEA ROI that affect the ability to conduct a more comprehensive assessment. These data limitations are discussed as part of the assessment in subsequent sections.
Key data limitations include:
• the primary data limitation for the RCEA ROI is the lack of pre-hydroelectric development published data for most waterbodies, which generally precludes direct comparisons of conditions before and after hydroelectric development;
• for waterbodies where there are pre-hydroelectric development data, such as SIL, the period of sampling is generally too short to adequately capture pre-hydroelectric development natural variability;
• there is neither pre- nor post-hydroelectric development data for some waterbodies (in particular in Area 1, where scientific study has been limited to a few key waterbodies), which precludes the ability to assess the effects of hydroelectric development or the general condition of the fish community;
• sampling methods or sampling locations have changed, which often precludes direct comparisons between years;
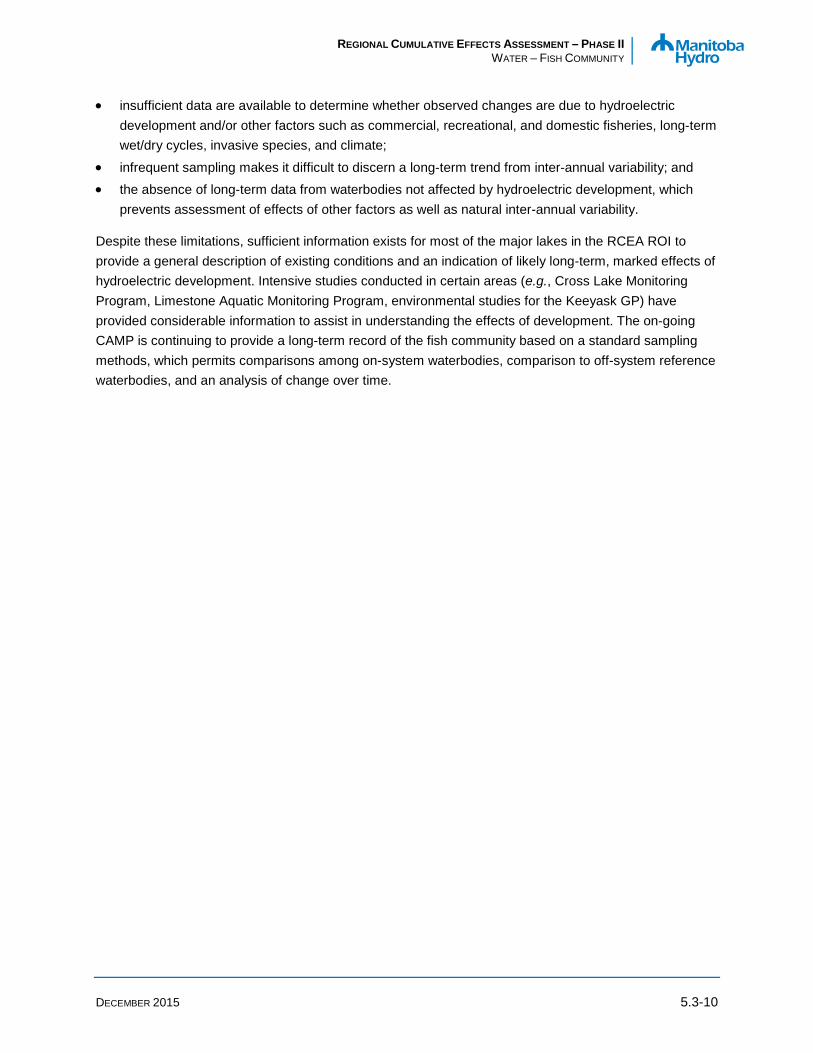
REGIONAL CUMULATIVE EFFECTS ASSESSMENT – PHASE II WATER – FISH COMMUNITY
DECEMBER 2015 5.3-10
• insufficient data are available to determine whether observed changes are due to hydroelectric development and/or other factors such as commercial, recreational, and domestic fisheries, long-term wet/dry cycles, invasive species, and climate;
• infrequent sampling makes it difficult to discern a long-term trend from inter-annual variability; and • the absence of long-term data from waterbodies not affected by hydroelectric development, which
prevents assessment of effects of other factors as well as natural inter-annual variability.
Despite these limitations, sufficient information exists for most of the major lakes in the RCEA ROI to provide a general description of existing conditions and an indication of likely long-term, marked effects of hydroelectric development. Intensive studies conducted in certain areas (e.g., Cross Lake Monitoring Program, Limestone Aquatic Monitoring Program, environmental studies for the Keeyask GP) have provided considerable information to assist in understanding the effects of development. The on-going CAMP is continuing to provide a long-term record of the fish community based on a standard sampling methods, which permits comparisons among on-system waterbodies, comparison to off-system reference waterbodies, and an analysis of change over time.
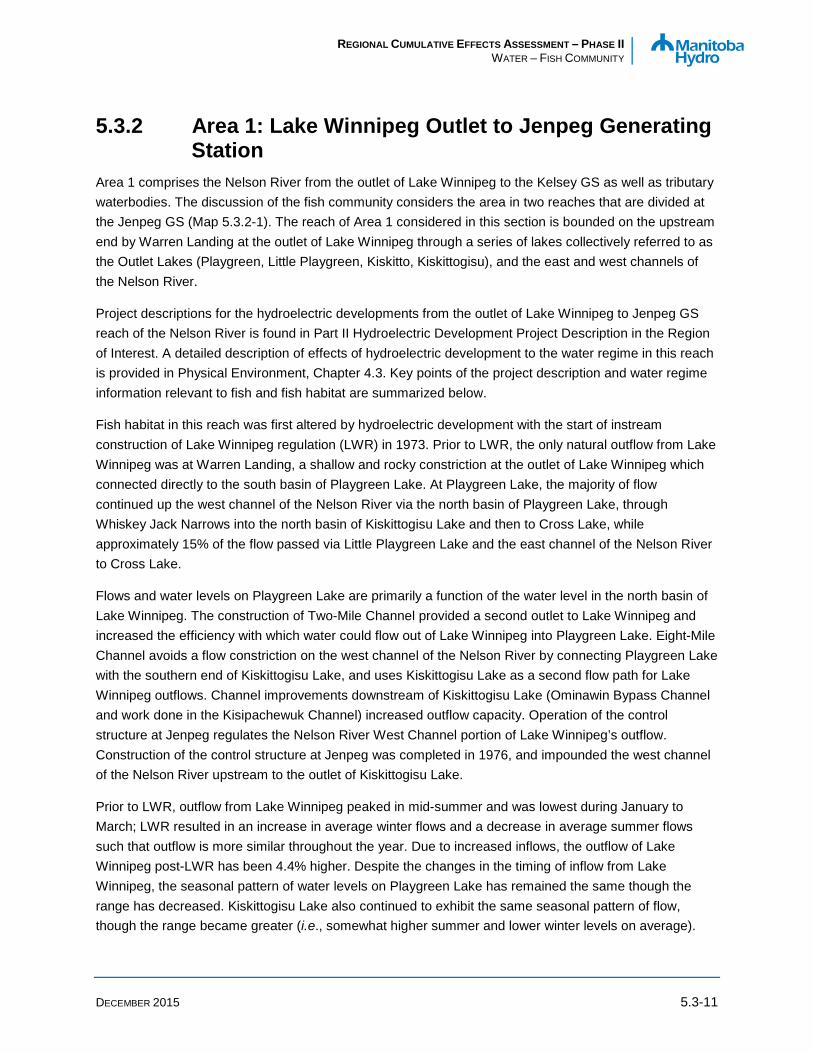
REGIONAL CUMULATIVE EFFECTS ASSESSMENT – PHASE II WATER – FISH COMMUNITY
DECEMBER 2015 5.3-11
5.3.2 Area 1: Lake Winnipeg Outlet to Jenpeg Generating Station
Area 1 comprises the Nelson River from the outlet of Lake Winnipeg to the Kelsey GS as well as tributary waterbodies. The discussion of the fish community considers the area in two reaches that are divided at the Jenpeg GS (Map 5.3.2-1). The reach of Area 1 considered in this section is bounded on the upstream end by Warren Landing at the outlet of Lake Winnipeg through a series of lakes collectively referred to as the Outlet Lakes (Playgreen, Little Playgreen, Kiskitto, Kiskittogisu), and the east and west channels of the Nelson River.
Project descriptions for the hydroelectric developments from the outlet of Lake Winnipeg to Jenpeg GS reach of the Nelson River is found in Part II Hydroelectric Development Project Description in the Region of Interest. A detailed description of effects of hydroelectric development to the water regime in this reach is provided in Physical Environment, Chapter 4.3. Key points of the project description and water regime information relevant to fish and fish habitat are summarized below.
Fish habitat in this reach was first altered by hydroelectric development with the start of instream construction of Lake Winnipeg regulation (LWR) in 1973. Prior to LWR, the only natural outflow from Lake Winnipeg was at Warren Landing, a shallow and rocky constriction at the outlet of Lake Winnipeg which connected directly to the south basin of Playgreen Lake. At Playgreen Lake, the majority of flow continued up the west channel of the Nelson River via the north basin of Playgreen Lake, through Whiskey Jack Narrows into the north basin of Kiskittogisu Lake and then to Cross Lake, while approximately 15% of the flow passed via Little Playgreen Lake and the east channel of the Nelson River to Cross Lake.
Flows and water levels on Playgreen Lake are primarily a function of the water level in the north basin of Lake Winnipeg. The construction of Two-Mile Channel provided a second outlet to Lake Winnipeg and increased the efficiency with which water could flow out of Lake Winnipeg into Playgreen Lake. Eight-Mile Channel avoids a flow constriction on the west channel of the Nelson River by connecting Playgreen Lake with the southern end of Kiskittogisu Lake, and uses Kiskittogisu Lake as a second flow path for Lake Winnipeg outflows. Channel improvements downstream of Kiskittogisu Lake (Ominawin Bypass Channel and work done in the Kisipachewuk Channel) increased outflow capacity. Operation of the control structure at Jenpeg regulates the Nelson River West Channel portion of Lake Winnipeg’s outflow. Construction of the control structure at Jenpeg was completed in 1976, and impounded the west channel of the Nelson River upstream to the outlet of Kiskittogisu Lake.
Prior to LWR, outflow from Lake Winnipeg peaked in mid-summer and was lowest during January to March; LWR resulted in an increase in average winter flows and a decrease in average summer flows such that outflow is more similar throughout the year. Due to increased inflows, the outflow of Lake Winnipeg post-LWR has been 4.4% higher. Despite the changes in the timing of inflow from Lake Winnipeg, the seasonal pattern of water levels on Playgreen Lake has remained the same though the range has decreased. Kiskittogisu Lake also continued to exhibit the same seasonal pattern of flow, though the range became greater (i.e., somewhat higher summer and lower winter levels on average).
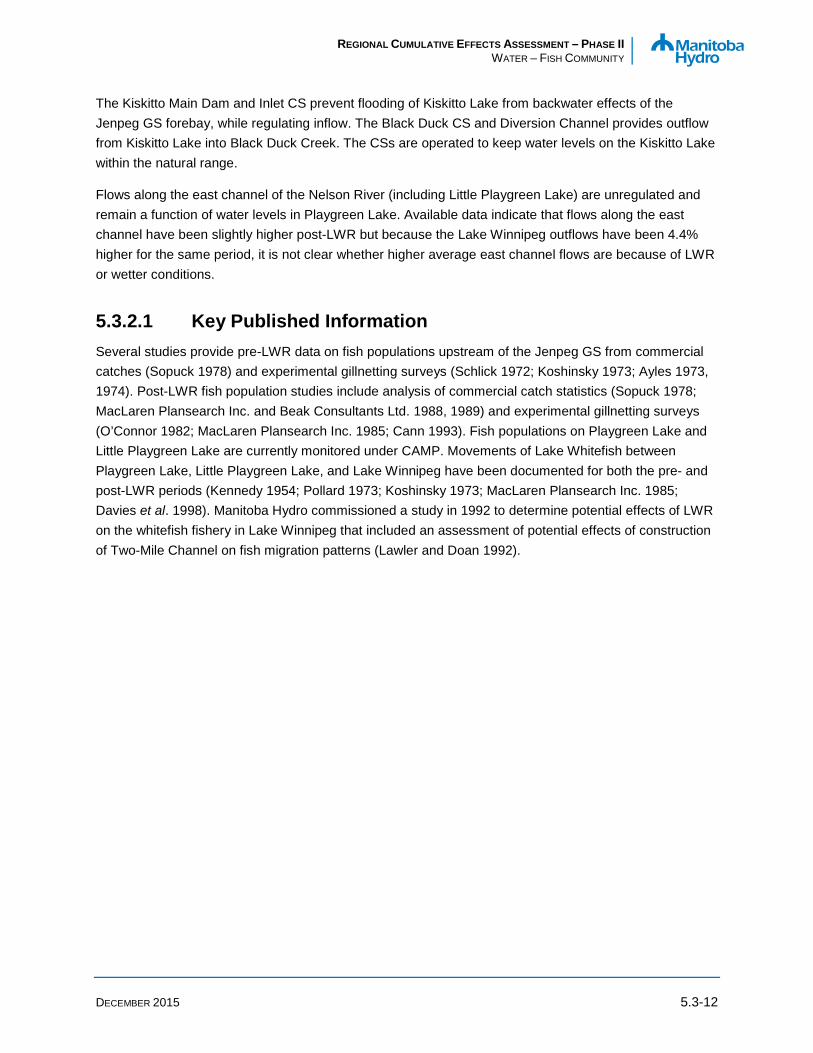
REGIONAL CUMULATIVE EFFECTS ASSESSMENT – PHASE II WATER – FISH COMMUNITY
DECEMBER 2015 5.3-12
The Kiskitto Main Dam and Inlet CS prevent flooding of Kiskitto Lake from backwater effects of the Jenpeg GS forebay, while regulating inflow. The Black Duck CS and Diversion Channel provides outflow from Kiskitto Lake into Black Duck Creek. The CSs are operated to keep water levels on the Kiskitto Lake within the natural range.
Flows along the east channel of the Nelson River (including Little Playgreen Lake) are unregulated and remain a function of water levels in Playgreen Lake. Available data indicate that flows along the east channel have been slightly higher post-LWR but because the Lake Winnipeg outflows have been 4.4% higher for the same period, it is not clear whether higher average east channel flows are because of LWR or wetter conditions.
5.3.2.1 Key Published Information Several studies provide pre-LWR data on fish populations upstream of the Jenpeg GS from commercial catches (Sopuck 1978) and experimental gillnetting surveys (Schlick 1972; Koshinsky 1973; Ayles 1973, 1974). Post-LWR fish population studies include analysis of commercial catch statistics (Sopuck 1978; MacLaren Plansearch Inc. and Beak Consultants Ltd. 1988, 1989) and experimental gillnetting surveys (O’Connor 1982; MacLaren Plansearch Inc. 1985; Cann 1993). Fish populations on Playgreen Lake and Little Playgreen Lake are currently monitored under CAMP. Movements of Lake Whitefish between Playgreen Lake, Little Playgreen Lake, and Lake Winnipeg have been documented for both the pre- and post-LWR periods (Kennedy 1954; Pollard 1973; Koshinsky 1973; MacLaren Plansearch Inc. 1985; Davies et al. 1998). Manitoba Hydro commissioned a study in 1992 to determine potential effects of LWR on the whitefish fishery in Lake Winnipeg that included an assessment of potential effects of construction of Two-Mile Channel on fish migration patterns (Lawler and Doan 1992).

Thompson
PimicikamakCross Lake (NAC)
Norway House Cree NationNorway House (NAC)
Thicket Portage(NAC)
Pikwitonei(NAC)
Wabowden(NAC)
Kelsey G.S.
Jenpeg G.S.
WuskwatimG.S.
Cross Lake Weir
Ominawin ByPassChannel
LAKEWINNIPEG
PlaygreenLake
SipiweskLake
Kiskitto-MinagoDrainage Channel
CrossLake
DrunkenLake
MolsonLake
SettingLake
WalkerLake
Nelso
n Rive
r
CauchonLake
PipestoneLake
Nelso
n Rive
r
LandingLake
DuckLake
KiskittoLake
Little Playgreen
Lake
KiskittogisuLake
Bladder Rapids
Warren Landing
391
391391
373
391
6 Lake Winnipeg Outlet to Jenpeg G.S.
Jenpeg G.S.to Kelsey G.S.
KiskittoInlet Control StructureBlack Duck
Control Structure
Two-MileChannel
Eight-MileChannel
1.0
29-OCT-15
North/South Consultants
Created By: cparker - B Size Portrait BTB - MAR 2015 Scale: 1:928,000
Province of Manitoba, Government of Canada, North/South Consultants andManitoba Hydro.
04-DEC-15
File Location: J:\MYP\MH_RCEA\Fish_Popltns\PHASE_2\Mxd\Area1\20151204_RCEA_PhaseII_AE_FISH_EE_FishCommunityAssessmentAreaLakeWinnipegOutletToKelseyGSRCEAArea1_cp.mxd
Hudson Bay
Thompson
Churchill
Fish Community Assessment Area Lake Winnipeg Outlet to
Kelsey Generating StationRCEA Area 1Regional Cumulative Effects
AssessmentNAD 1983 UTM Zone 14N
0 10 20 Kilometers
0 8.5 17 Miles
DATA SOURCE:
DATE CREATED:
CREATED BY:
VERSION NO:
REVISION DATE:
QA/QC:
COORDINATE SYSTEM:
RCEAArea 1
LegendRCEA Region of InterestFish Community Reach BoundaryFirst Nation Reserve
NOTE: (NAC) Northern Affairs Community
InfrastructureGenerating Station (Existing)Control StructureHighwayRailTransmission Line (Existing)
Map 5.3.2-1

REGIONAL CUMULATIVE EFFECTS ASSESSMENT – PHASE II WATER – FISH COMMUNITY
DECEMBER 2015 5.3-14
5.3.2.2 New Information and/or Re-analysis of Existing Information Fish population information from the published literature1 was supplemented with historic data that had previously not been published and with raw data from previously published reports that were made available for re-analysis to allow direct comparison with recent data collected under CAMP.
Manitoba Fisheries Branch (MFB) conducted index gillnetting surveys in Playgreen Lake in most years between 1981 and 2006 to assess the biological characteristics of the Lake Whitefish (south basin) and Walleye (north basin) populations being harvested by the commercial fishery. Some of this data have been presented previously as part of Cann (1993). The MFB also conducted an index test-netting program to sample Walleye on Kiskitto Lake in 2000 and 2003 and Kiskittogisu Lake in 1995. There are differences in sampling design between the MFB studies (species-focussed sampling) and the CAMP studies (habitat-based sampling). Where possible, the results of the MFB studies have been incorporated into the index gillnetting analyses. To make the MFB data collected from 1981–2006 and CAMP data collected between 2009 and 2013 more comparable, it was necessary to eliminate the data generated from some of the mesh sizes that were not used consistently among programs (i.e., mesh < 2 inch, >5 inch). As well, differences in the structure used to determine ages prevented comparison of some data. For Walleye, data collected by the MFB from 1987–2003 that used dorsal spines and could not be compared to data collected by CAMP, which used otoliths. For Lake Whitefish, data collected from Playgreen Lake by the MFB that used fin rays could not be compared to data collected using otoliths.
Some differences in methods remain between the gillnetting studies that were selected for the quantitative analysis. The MFB studies used slightly different mesh panels (e.g., 4.75 inch instead of 5 inch) that were 50 yards long compared to the standard gangs used by CAMP (2, 3, 3.75, 4.25, and 5 inch) that are 25 yards long. There were differences in the number of sites fished between studies, as well as how those sites were selected.
5.3.2.3 Changes in the Fish Community and Focal Species over Time
The following discussion is based on a combination of the results found in key published information and a reanalysis of novel and selected existing data. The available comparable data were grouped by decade into four periods and analyzed: 1980s; 1990s; 2000s; and 2010s.
1Experimental gillnetting was first conducted in Playgreen, Kiskittogisu, and Kiskitto lakes in the early 1970s as part of baseline studies by the LWCNRSB (summarized in Koshinsky 1973). After regulation, index gill nets were used by the province in 1981 (O’Connor 1982) and in response to Northern Flood Agreement (NFA) Claim 16 in 1987 (MacLaren Plansearch Inc. and Beak Consultants Ltd. 1988). However, these data are not included in the analysis because sufficient data were not available to standardize the metric analyses to be comparable to data collected by MFB and CAMP (i.e., to standardize mesh, season).

REGIONAL CUMULATIVE EFFECTS ASSESSMENT – PHASE II WATER – FISH COMMUNITY
DECEMBER 2015 5.3-15
5.3.2.3.1 Fish Community
Metric: Catch-Per-Unit-Effort
Catch-per-unit-effort was calculated for all species (i.e., the total catch) captured in standard gangs set in each of two lakes upstream of the Jenpeg GS (Figure 5.3.2A-11) The box plots show an increasing trend in total CPUE in Playgreen Lake over time; catches in both basins are considerably higher in the most recent sampling period compared to earlier decades. The mean total CPUE was similar in the north and south basins of Playgreen Lake in the 1980s (32 to 35 fish/100 m/24 h). In the 1990s and 2000s, the mean CPUE was higher in the north basin (32 and 67 fish/100 m/24 h respectively) relative to the south basin (21 and 37 fish/100 m/24 h). Currently (2010–2013), the mean total CPUE is 80 fish/100 m/24 h in the south basin of Playgreen Lake and 67 fish/100 m/24 h in Little Playgreen Lake. The north basin was not sampled in the 2010s. These values are similar to those observed in a nearby off-system lake, Setting Lake, for which CPUE was approximately 75 fish/100 m/24 h in both the 2000s and 2010s. CPUE for Kiskitto and Kiskittogisu lakes could not be calculated because the duration of gill net sets was not recorded.
While efforts were made to standardize the data sets among the surveys (refer to Appendix 5.3.1B for analysis methods), residual differences in methods among studies may have contributed to the observed differences in CPUE over time. For example, studies conducted in Playgreen Lake by the MFB (1980s, 1990s, 2000s) sampled only a few sites that were known to yield larger numbers of two specific fish species (Lake Whitefish in the south basin and Walleye in the north basin), compared to later CAMP studies (2010s), which sampled a larger number of sites scattered in many different areas of the lake (Map 5.3.2A-1). Differences in habitat characteristics, and consequently differences in the species assemblages and productivity associated with these habitats, may have contributed to differences in average CPUE.
INDICATOR: DIVERSITY
Metric: Relative Abundance
Relative abundance was calculated as the percentage contribution of each species to the total catch in each of five lakes upstream of the Jenpeg GS (Figure 5.3.2A-2). In the 1980s and/or 1990s, the most common species captured in the south basin of Playgreen Lake were Cisco (Coregonus artedi), Northern Pike (Esox Lucius) and Lake Whitefish; whereas, in the north basin and Kiskittogisu Lake, it was Walleye, White Sucker (Catostomus commersonii), and Northern Pike. By the 2000s, Rainbow Smelt (Osmerus mordax) were a common component of the catches in the south basin and were also observed in the north basin. The fish community in Kiskitto Lake, which is isolated from the Nelson River flows, was
1 Tables, figures and maps with a letter in their numbers (e.g., A) can be found in the appendices for this chapter.
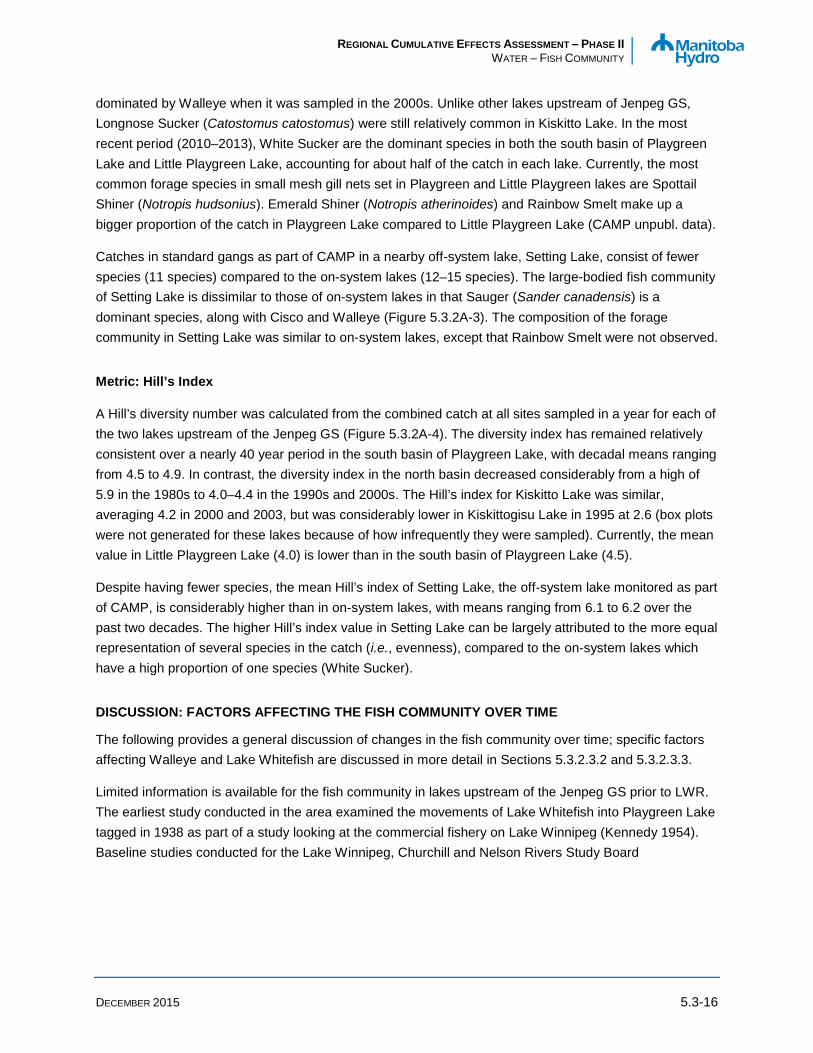
REGIONAL CUMULATIVE EFFECTS ASSESSMENT – PHASE II WATER – FISH COMMUNITY
DECEMBER 2015 5.3-16
dominated by Walleye when it was sampled in the 2000s. Unlike other lakes upstream of Jenpeg GS, Longnose Sucker (Catostomus catostomus) were still relatively common in Kiskitto Lake. In the most recent period (2010–2013), White Sucker are the dominant species in both the south basin of Playgreen Lake and Little Playgreen Lake, accounting for about half of the catch in each lake. Currently, the most common forage species in small mesh gill nets set in Playgreen and Little Playgreen lakes are Spottail Shiner (Notropis hudsonius). Emerald Shiner (Notropis atherinoides) and Rainbow Smelt make up a bigger proportion of the catch in Playgreen Lake compared to Little Playgreen Lake (CAMP unpubl. data).
Catches in standard gangs as part of CAMP in a nearby off-system lake, Setting Lake, consist of fewer species (11 species) compared to the on-system lakes (12–15 species). The large-bodied fish community of Setting Lake is dissimilar to those of on-system lakes in that Sauger (Sander canadensis) is a dominant species, along with Cisco and Walleye (Figure 5.3.2A-3). The composition of the forage community in Setting Lake was similar to on-system lakes, except that Rainbow Smelt were not observed.
Metric: Hill’s Index
A Hill’s diversity number was calculated from the combined catch at all sites sampled in a year for each of the two lakes upstream of the Jenpeg GS (Figure 5.3.2A-4). The diversity index has remained relatively consistent over a nearly 40 year period in the south basin of Playgreen Lake, with decadal means ranging from 4.5 to 4.9. In contrast, the diversity index in the north basin decreased considerably from a high of 5.9 in the 1980s to 4.0–4.4 in the 1990s and 2000s. The Hill’s index for Kiskitto Lake was similar, averaging 4.2 in 2000 and 2003, but was considerably lower in Kiskittogisu Lake in 1995 at 2.6 (box plots were not generated for these lakes because of how infrequently they were sampled). Currently, the mean value in Little Playgreen Lake (4.0) is lower than in the south basin of Playgreen Lake (4.5).
Despite having fewer species, the mean Hill’s index of Setting Lake, the off-system lake monitored as part of CAMP, is considerably higher than in on-system lakes, with means ranging from 6.1 to 6.2 over the past two decades. The higher Hill’s index value in Setting Lake can be largely attributed to the more equal representation of several species in the catch (i.e., evenness), compared to the on-system lakes which have a high proportion of one species (White Sucker).
DISCUSSION: FACTORS AFFECTING THE FISH COMMUNITY OVER TIME
The following provides a general discussion of changes in the fish community over time; specific factors affecting Walleye and Lake Whitefish are discussed in more detail in Sections 5.3.2.3.2 and 5.3.2.3.3.
Limited information is available for the fish community in lakes upstream of the Jenpeg GS prior to LWR. The earliest study conducted in the area examined the movements of Lake Whitefish into Playgreen Lake tagged in 1938 as part of a study looking at the commercial fishery on Lake Winnipeg (Kennedy 1954). Baseline studies conducted for the Lake Winnipeg, Churchill and Nelson Rivers Study Board

REGIONAL CUMULATIVE EFFECTS ASSESSMENT – PHASE II WATER – FISH COMMUNITY
DECEMBER 2015 5.3-17
(LWCNRSB) reported that at least 21 species of fish occurred in the Outlet Lakes, with Playgreen Lake having the highest biomass of fish (Koshinsky 1973). Common species in test netting surveys conducted between 1970 and 1972 on Playgreen, Kiskittogisu, and Kiskitto lakes by MFB (five 50-yard panels of 3 to 5.25 inch mesh; Schlick 1972; Schlick 1973 in Koshinsky 19731) and Manitoba Hydro (seven 50-yard panels of 1.5 to 5 inch mesh; Ayles 1973) were Lake Whitefish, Walleye, White Sucker, Cisco, and Northern Pike. Lake Whitefish were the dominant species in the catches in Playgreen Lake, while Walleye and White Sucker were more common in the other lakes. The LWCNRSB reported that fish exchange occurred between Kiskitto and Kiskittogisu lakes prior to regulation, but that it was unlikely that extensive movements occurred in the channels below Playgreen Lake (Koshinsky 1973).
White Sucker currently account for almost half the catch in index gill nets set in two on-system lakes upstream of the Jenpeg GS, the south basin of Playgreen Lake and Little Playgreen Lake. Northern Pike, Walleye, and Yellow Perch (Perca flavescens) are also common in these lakes. The fish community in Setting Lake, a nearby off-system lake on the Grass River, is dissimilar, with Cisco, Walleye and Sauger dominating catches. As well, the diversity index of the fish community is considerably higher in Setting Lake compared to the on-system lakes. Although the species composition in the lakes differ, fish capture rates in the on-system lakes are similar to those in Setting Lake. In terms of the forage fish community, Emerald Shiner and Spottail Shiner were abundant in both the on-system lakes and Setting Lake. Rainbow Smelt are common in Playgreen Lake, but were not observed in Setting Lake.
Comparison of the metrics over the four decades suggests that there has been a change in the species composition of the fish community in on-system lakes upstream of the Jenpeg GS. While it appears that there has been an increase in the productivity of Playgreen Lake, as indicated by an increasing trend in total CPUE, differences in sampling strategies used by different agencies over time may have contributed to the observed increase. Changes in the fish community in these lakes may be due to many factors, including changes in habitat, redistribution of fish stocks, as well to natural variability or to other stressors such as commercial fishing. The potential effects of climate and the establishment of Rainbow Smelt in the system in the1990s on fish communities is discussed in Area 2, where there is more information available (Section 5.3.4.3.1).
Factor: Effects of Changes to the Water Regime and Other Factors on Fish Habitat
The LWCNRSB (1975) predicted that a decrease in fish productivity in Playgreen Lake due to the effects of increased sedimentation on benthic production would be offset by increases in the productivity in Kiskittogisu and Kiskitto lakes resulting from increased water exchange from Eight-Mile Channel. The destruction of the Kiskittogisu River from the construction of the Eight-Mile Channel was expected to
1 A copy of the Manuscript Report cited by Koshinsky (1973) as in preparation at the time of publishing could not be located in any libraries: Schlick, R.O. 1973. A fisheries survey of Kiskittogisu and Kiskitto lakes, 1972. Manitoba Department of Mines, Resources and Environmental Management.
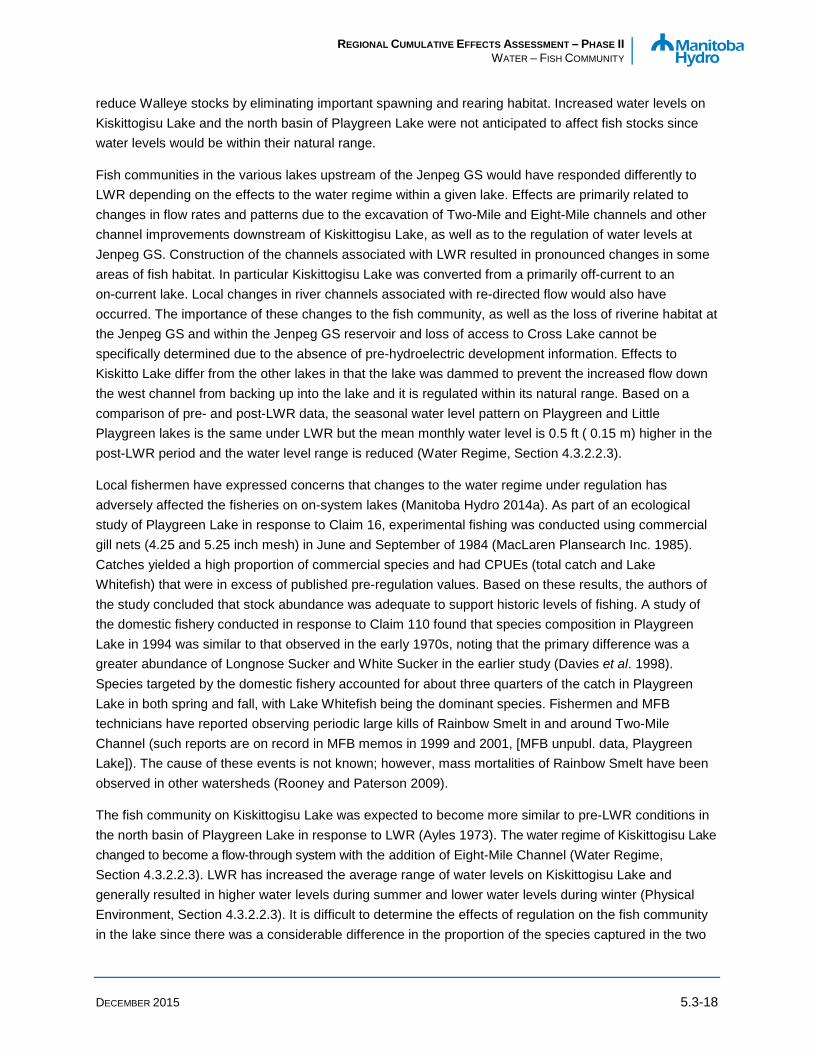
REGIONAL CUMULATIVE EFFECTS ASSESSMENT – PHASE II WATER – FISH COMMUNITY
DECEMBER 2015 5.3-18
reduce Walleye stocks by eliminating important spawning and rearing habitat. Increased water levels on Kiskittogisu Lake and the north basin of Playgreen Lake were not anticipated to affect fish stocks since water levels would be within their natural range.
Fish communities in the various lakes upstream of the Jenpeg GS would have responded differently to LWR depending on the effects to the water regime within a given lake. Effects are primarily related to changes in flow rates and patterns due to the excavation of Two-Mile and Eight-Mile channels and other channel improvements downstream of Kiskittogisu Lake, as well as to the regulation of water levels at Jenpeg GS. Construction of the channels associated with LWR resulted in pronounced changes in some areas of fish habitat. In particular Kiskittogisu Lake was converted from a primarily off-current to an on-current lake. Local changes in river channels associated with re-directed flow would also have occurred. The importance of these changes to the fish community, as well as the loss of riverine habitat at the Jenpeg GS and within the Jenpeg GS reservoir and loss of access to Cross Lake cannot be specifically determined due to the absence of pre-hydroelectric development information. Effects to Kiskitto Lake differ from the other lakes in that the lake was dammed to prevent the increased flow down the west channel from backing up into the lake and it is regulated within its natural range. Based on a comparison of pre- and post-LWR data, the seasonal water level pattern on Playgreen and Little Playgreen lakes is the same under LWR but the mean monthly water level is 0.5 ft ( 0.15 m) higher in the post-LWR period and the water level range is reduced (Water Regime, Section 4.3.2.2.3).
Local fishermen have expressed concerns that changes to the water regime under regulation has adversely affected the fisheries on on-system lakes (Manitoba Hydro 2014a). As part of an ecological study of Playgreen Lake in response to Claim 16, experimental fishing was conducted using commercial gill nets (4.25 and 5.25 inch mesh) in June and September of 1984 (MacLaren Plansearch Inc. 1985). Catches yielded a high proportion of commercial species and had CPUEs (total catch and Lake Whitefish) that were in excess of published pre-regulation values. Based on these results, the authors of the study concluded that stock abundance was adequate to support historic levels of fishing. A study of the domestic fishery conducted in response to Claim 110 found that species composition in Playgreen Lake in 1994 was similar to that observed in the early 1970s, noting that the primary difference was a greater abundance of Longnose Sucker and White Sucker in the earlier study (Davies et al. 1998). Species targeted by the domestic fishery accounted for about three quarters of the catch in Playgreen Lake in both spring and fall, with Lake Whitefish being the dominant species. Fishermen and MFB technicians have reported observing periodic large kills of Rainbow Smelt in and around Two-Mile Channel (such reports are on record in MFB memos in 1999 and 2001, [MFB unpubl. data, Playgreen Lake]). The cause of these events is not known; however, mass mortalities of Rainbow Smelt have been observed in other watersheds (Rooney and Paterson 2009).
The fish community on Kiskittogisu Lake was expected to become more similar to pre-LWR conditions in the north basin of Playgreen Lake in response to LWR (Ayles 1973). The water regime of Kiskittogisu Lake changed to become a flow-through system with the addition of Eight-Mile Channel (Water Regime, Section 4.3.2.2.3). LWR has increased the average range of water levels on Kiskittogisu Lake and generally resulted in higher water levels during summer and lower water levels during winter (Physical Environment, Section 4.3.2.2.3). It is difficult to determine the effects of regulation on the fish community in the lake since there was a considerable difference in the proportion of the species captured in the two
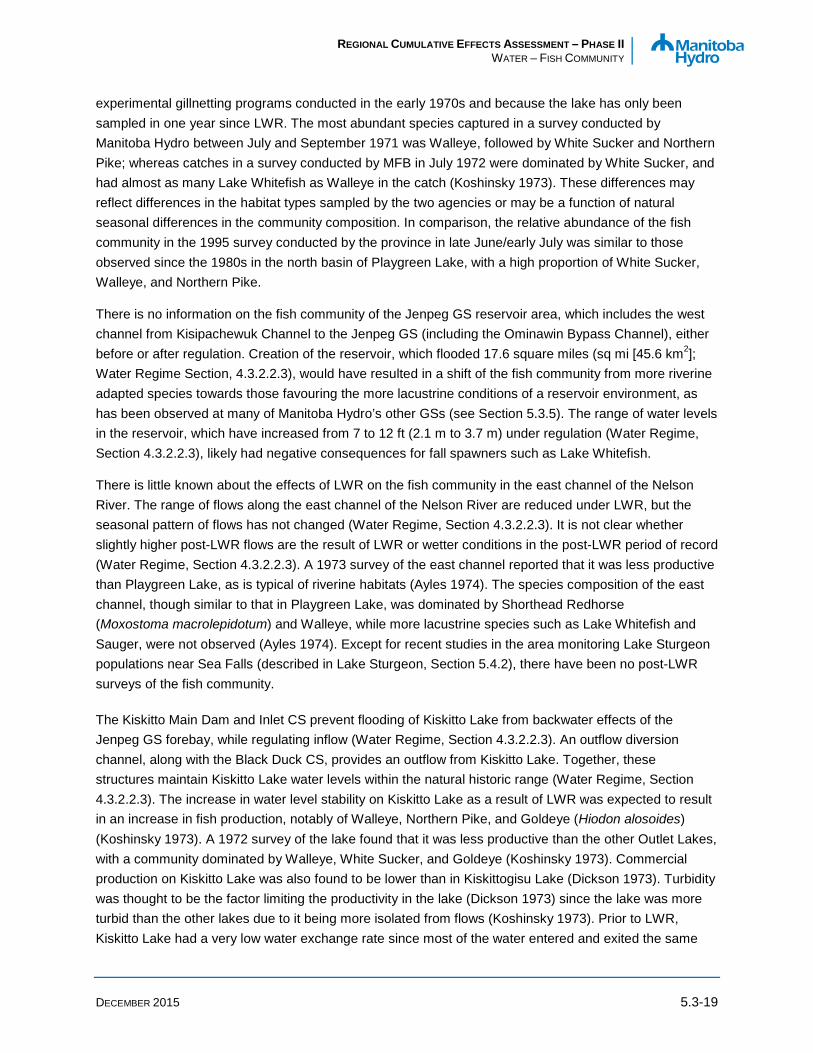
REGIONAL CUMULATIVE EFFECTS ASSESSMENT – PHASE II WATER – FISH COMMUNITY
DECEMBER 2015 5.3-19
experimental gillnetting programs conducted in the early 1970s and because the lake has only been sampled in one year since LWR. The most abundant species captured in a survey conducted by Manitoba Hydro between July and September 1971 was Walleye, followed by White Sucker and Northern Pike; whereas catches in a survey conducted by MFB in July 1972 were dominated by White Sucker, and had almost as many Lake Whitefish as Walleye in the catch (Koshinsky 1973). These differences may reflect differences in the habitat types sampled by the two agencies or may be a function of natural seasonal differences in the community composition. In comparison, the relative abundance of the fish community in the 1995 survey conducted by the province in late June/early July was similar to those observed since the 1980s in the north basin of Playgreen Lake, with a high proportion of White Sucker, Walleye, and Northern Pike.
There is no information on the fish community of the Jenpeg GS reservoir area, which includes the west channel from Kisipachewuk Channel to the Jenpeg GS (including the Ominawin Bypass Channel), either before or after regulation. Creation of the reservoir, which flooded 17.6 square miles (sq mi [45.6 km2]; Water Regime Section, 4.3.2.2.3), would have resulted in a shift of the fish community from more riverine adapted species towards those favouring the more lacustrine conditions of a reservoir environment, as has been observed at many of Manitoba Hydro’s other GSs (see Section 5.3.5). The range of water levels in the reservoir, which have increased from 7 to 12 ft (2.1 m to 3.7 m) under regulation (Water Regime, Section 4.3.2.2.3), likely had negative consequences for fall spawners such as Lake Whitefish.
There is little known about the effects of LWR on the fish community in the east channel of the Nelson River. The range of flows along the east channel of the Nelson River are reduced under LWR, but the seasonal pattern of flows has not changed (Water Regime, Section 4.3.2.2.3). It is not clear whether slightly higher post-LWR flows are the result of LWR or wetter conditions in the post-LWR period of record (Water Regime, Section 4.3.2.2.3). A 1973 survey of the east channel reported that it was less productive than Playgreen Lake, as is typical of riverine habitats (Ayles 1974). The species composition of the east channel, though similar to that in Playgreen Lake, was dominated by Shorthead Redhorse (Moxostoma macrolepidotum) and Walleye, while more lacustrine species such as Lake Whitefish and Sauger, were not observed (Ayles 1974). Except for recent studies in the area monitoring Lake Sturgeon populations near Sea Falls (described in Lake Sturgeon, Section 5.4.2), there have been no post-LWR surveys of the fish community.
The Kiskitto Main Dam and Inlet CS prevent flooding of Kiskitto Lake from backwater effects of the Jenpeg GS forebay, while regulating inflow (Water Regime, Section 4.3.2.2.3). An outflow diversion channel, along with the Black Duck CS, provides an outflow from Kiskitto Lake. Together, these structures maintain Kiskitto Lake water levels within the natural historic range (Water Regime, Section 4.3.2.2.3). The increase in water level stability on Kiskitto Lake as a result of LWR was expected to result in an increase in fish production, notably of Walleye, Northern Pike, and Goldeye (Hiodon alosoides) (Koshinsky 1973). A 1972 survey of the lake found that it was less productive than the other Outlet Lakes, with a community dominated by Walleye, White Sucker, and Goldeye (Koshinsky 1973). Commercial production on Kiskitto Lake was also found to be lower than in Kiskittogisu Lake (Dickson 1973). Turbidity was thought to be the factor limiting the productivity in the lake (Dickson 1973) since the lake was more turbid than the other lakes due to it being more isolated from flows (Koshinsky 1973). Prior to LWR, Kiskitto Lake had a very low water exchange rate since most of the water entered and exited the same

REGIONAL CUMULATIVE EFFECTS ASSESSMENT – PHASE II WATER – FISH COMMUNITY
DECEMBER 2015 5.3-20
channel. Under natural conditions, about 60% of the water was replaced every year, but this exchange was sufficient to provide nutrient and ion loading and maintain winter oxygen levels (Koshinsky 1973). A culvert, known as the Kiskitto Inlet CS, was placed in Kiskitto Main Dam to provide inflows to the lake under regulation (about 100 cfs [2.8 m3/s] of flow). This culvert may allow for fish movements into Kiskitto Lake, but high velocities at the culvert would not likely allow for fish movement out of Kiskitto Lake back into the Jenpeg GS reservoir area. Therefore, the Kiskitto Main Dam and Inlet CS may prevent resident populations from accessing habitat in other waterbodies that may have been necessary to fulfill their life history requirements.
Since closure of the Kiskitto Main Dam in 1973, fishermen reported that it was harder to catch fish and that fish caught were thinner (Kiskitto Lake Regulation Committee 1977). Manitoba Fisheries Branch conducted test netting in Kiskitto Lake in 2000 and 2003, at which time the catch was dominated by Walleye, White Sucker, and Northern Pike. In contrast to the survey conducted prior to regulation, Goldeye were virtually absent and Longnose Sucker had replaced Shorthead Redhorse. Fish kills were observed along the north shore of Kiskitto Lake sometime during the winter/spring of 2002/03 (MFB unpubl. data, Kiskitto Lake). This winterkill was related to a failure of the Kiskitto Lake Inlet CS in 2002, which resulted in it being blocked to protect the dyke, reducing inflow to the lake, and was compounded by 2003 being a drought year (MFB unpubl. data). Spawning habitat was created in the man-made inlet channel as compensation for habitat loss during repair works conducted on the control structure. The results of monitoring conducted between 2004–2006 confirmed that the four boulder clusters are being used for spawning in the spring by suckers (Catostomidae spp.), Walleye/Sauger, and Rainbow Smelt (Shipley 2005; Dyck and Lawrence 2005, 2006).
The construction of the Black Duck CS and Diversion Channel created a direct connection for fish to move from Kiskitto Lake into the Minago River/Drunken Lake. However, any fish that moves into the diversion channel is not able to move back upstream into Kiskitto Lake. A local fisherman observed that the Black Duck CS and Diversion Channel had a 12 ft (3.7 m) drop at the outlet that does not allow fish to re-enter the lake (MFB unpubl. data, Kiskitto Lake).
Factor: Effects of Changes to Sedimentation and Water Quality
It is difficult to determine whether LWR and the construction of channels resulted in a significant increase in erosion and sediment transport and deposition because there were areas of eroding shoreline on Playgreen Lake prior to LWR (Erosion and Sedimentation, Section 4.4.2.1). Increased erosion has been documented along Two- and Eight-Mile channels, both along the banks and the channel bottoms, but the amount this has contributed to the total amount of sediment moving in the system is not known. The LWCNRSB (1975) predicted that LWR would result in some decline in fish productivity in Playgreen Lake because of the effects of increased sedimentation on benthic production. Sedimentation was also predicted to reduce the spawning success of Lake Whitefish in the east channel of the Nelson River and Little Playgreen Lake. The effects of changes to fish habitat on fish communities is discussed in the previous section.
Assessment of water quality did not identify any significant change in turbidity or total suspended solids (TSS) in any period following LWR at any location in the Outlet Lakes Area (Water Quality, Section 5.2.2). However, increases in TSS or turbidity may have occurred but were not captured by monitoring programs.
REGIONAL CUMULATIVE EFFECTS ASSESSMENT – PHASE II WATER – FISH COMMUNITY
DECEMBER 2015 5.3-21
As discussed in Section 5.2.2 (Water Quality), no changes were identified in any pre- versus post-LWR water quality data comparison that would indicate that the water in the Outlet Lakes Area has changed to become unsuitable for aquatic life due to hydroelectric development. Current conditions are generally within water quality objectives and guidelines for the protection of freshwater aquatic life. Exceptions, including iron and aluminum, are relatively common in Manitoba lakes and rivers and are also observed in lakes unaffected by hydroelectric development.
Factor: Effects of Obstructions to Upstream Movements/Alterations to Downstream Movements
Prior to LWR, there was a series of rapids between Kiskittogisu Lake and Cross Lake that had an average water level drop of 31 ft (9.4 m) over a reach of 21 km (based on data introduced in Water Regime, Section 4.3.2). It is not known whether any fish species completed their life history requirements by migrating over these rapids. The construction of the Jenpeg GS would have blocked any upstream movements, if they occurred. One of the recommendations of the LWCNRSB (#30) was that a study be conducted to determine if a fish passage facility was required at Jenpeg GS to allow any upstream migrations that occurred in this reach of the Nelson River. A fish lift was constructed at the Jenpeg GS but has not been in use since the 1980s when MFB determined that fish passage was not warranted at the site (LWR Participant Clean Environment Commission [CEC] Question # CEC_0005, Manitoba Hydro 2015).
Factor: Effects of Fisheries
Domestic, commercial, and recreational fisheries occurred historically and still occur throughout this reach. Quantitative information is only available for the commercial fishery. A detailed description of the fishery is provided in People (Section 3.5.10), and information relevant to changes in the fish community is summarized below.
Domestic fishing has been a historically important resource for many communities on Area 1 waterbodies, with the majority of harvesting in the reach upstream of the Jenpeg GS conducted by Norway House residents. Prior to hydroelectric development, most of the domestic fishing by Norway House occurred primarily on Playgreen and Little Playgreen lakes. Since LWR, several resource users have shifted at least some domestic harvesting to inland lakes such as Molson, Bolton, and Gunisao. Little Playgreen Lake and its tributaries (Jack River and Gunisao River) continues to be an important fishing area for the community of Norway House for domestic purposes.
A commercial fishery has operated on Playgreen Lake since the 1930s (Sopuck 1978; Cann 1993) with the exception of a closure between 1946 and 1953 (Schlick 1972). The main reason for this closure was to protect the domestic fishery in Little Playgreen Lake and the Nelson River channel adjacent to Norway House. This domestic fishery and the commercial fishery on Playgreen and on Mossy Bay, Lake Winnipeg, share at least some of the same fish stock and overexploitation of the commercial stock could have direct effects on the domestic fishery. Commercial production of the three major species (Lake Whitefish, Walleye, Northern Pike) averaged about 26,000 kg annually from the north basin starting in 1954 and increased with the re-opening of the south basin fishery in 1957. For the remainder of the pre-LWR period (1957–1972), commercial production averaged about 124,000 kg annually (Figure 5.3.2A-5). Despite increased costs and effort associated with increased debris experienced
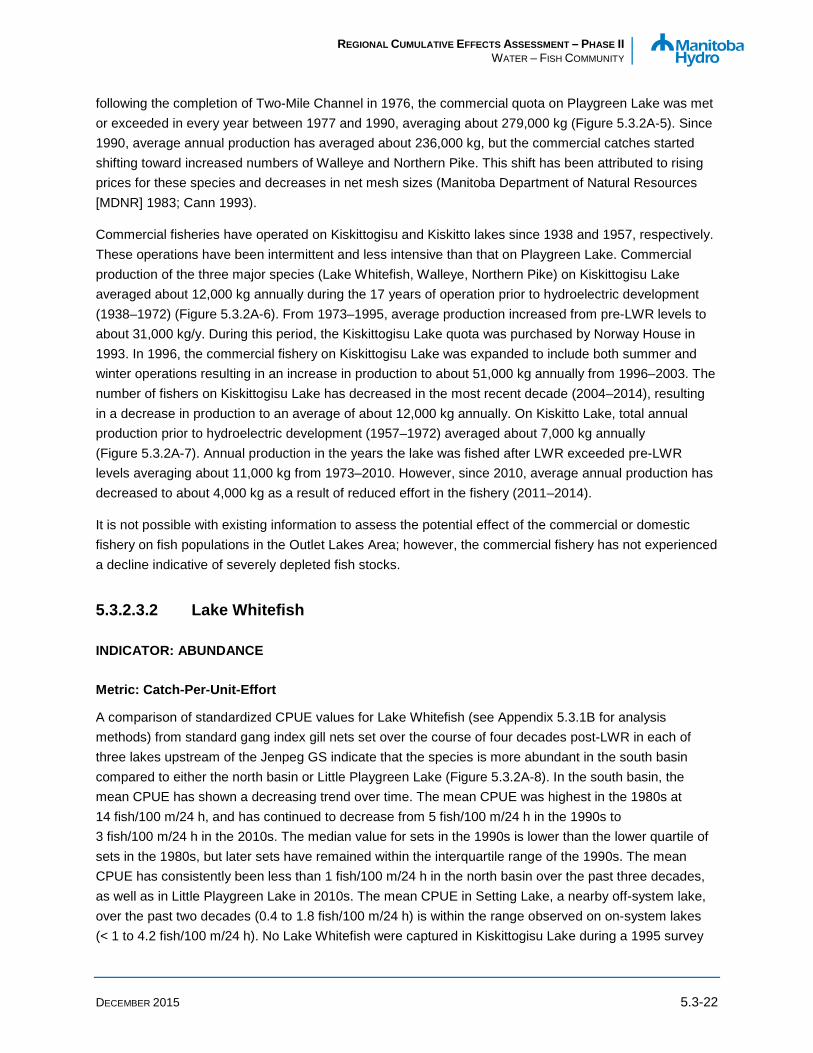
REGIONAL CUMULATIVE EFFECTS ASSESSMENT – PHASE II WATER – FISH COMMUNITY
DECEMBER 2015 5.3-22
following the completion of Two-Mile Channel in 1976, the commercial quota on Playgreen Lake was met or exceeded in every year between 1977 and 1990, averaging about 279,000 kg (Figure 5.3.2A-5). Since 1990, average annual production has averaged about 236,000 kg, but the commercial catches started shifting toward increased numbers of Walleye and Northern Pike. This shift has been attributed to rising prices for these species and decreases in net mesh sizes (Manitoba Department of Natural Resources [MDNR] 1983; Cann 1993).
Commercial fisheries have operated on Kiskittogisu and Kiskitto lakes since 1938 and 1957, respectively. These operations have been intermittent and less intensive than that on Playgreen Lake. Commercial production of the three major species (Lake Whitefish, Walleye, Northern Pike) on Kiskittogisu Lake averaged about 12,000 kg annually during the 17 years of operation prior to hydroelectric development (1938–1972) (Figure 5.3.2A-6). From 1973–1995, average production increased from pre-LWR levels to about 31,000 kg/y. During this period, the Kiskittogisu Lake quota was purchased by Norway House in 1993. In 1996, the commercial fishery on Kiskittogisu Lake was expanded to include both summer and winter operations resulting in an increase in production to about 51,000 kg annually from 1996–2003. The number of fishers on Kiskittogisu Lake has decreased in the most recent decade (2004–2014), resulting in a decrease in production to an average of about 12,000 kg annually. On Kiskitto Lake, total annual production prior to hydroelectric development (1957–1972) averaged about 7,000 kg annually (Figure 5.3.2A-7). Annual production in the years the lake was fished after LWR exceeded pre-LWR levels averaging about 11,000 kg from 1973–2010. However, since 2010, average annual production has decreased to about 4,000 kg as a result of reduced effort in the fishery (2011–2014).
It is not possible with existing information to assess the potential effect of the commercial or domestic fishery on fish populations in the Outlet Lakes Area; however, the commercial fishery has not experienced a decline indicative of severely depleted fish stocks.
5.3.2.3.2 Lake Whitefish
INDICATOR: ABUNDANCE
Metric: Catch-Per-Unit-Effort
A comparison of standardized CPUE values for Lake Whitefish (see Appendix 5.3.1B for analysis methods) from standard gang index gill nets set over the course of four decades post-LWR in each of three lakes upstream of the Jenpeg GS indicate that the species is more abundant in the south basin compared to either the north basin or Little Playgreen Lake (Figure 5.3.2A-8). In the south basin, the mean CPUE has shown a decreasing trend over time. The mean CPUE was highest in the 1980s at 14 fish/100 m/24 h, and has continued to decrease from 5 fish/100 m/24 h in the 1990s to 3 fish/100 m/24 h in the 2010s. The median value for sets in the 1990s is lower than the lower quartile of sets in the 1980s, but later sets have remained within the interquartile range of the 1990s. The mean CPUE has consistently been less than 1 fish/100 m/24 h in the north basin over the past three decades, as well as in Little Playgreen Lake in 2010s. The mean CPUE in Setting Lake, a nearby off-system lake, over the past two decades (0.4 to 1.8 fish/100 m/24 h) is within the range observed on on-system lakes (< 1 to 4.2 fish/100 m/24 h). No Lake Whitefish were captured in Kiskittogisu Lake during a 1995 survey

REGIONAL CUMULATIVE EFFECTS ASSESSMENT – PHASE II WATER – FISH COMMUNITY
DECEMBER 2015 5.3-23
and the CPUE of Lake Whitefish could not be calculated for Kiskitto Lake because duration was not recorded as part of the 2000 and 2003 surveys.
The discussion section that follows looks at the contribution of several potential factors to the observed changes in Lake Whitefish CPUE over time in concert with the results of the other indicators.
INDICATOR: CONDITION
Metric: Fulton’s Condition Factor (KF)
Prior to LWR, Ayles (1973) reported that Lake Whitefish from the south basin of Playgreen Lake were longer and in better condition than those from the north basin.
Over the four decades since regulation, the mean condition of Lake Whitefish in the south basin of Playgreen Lake has ranged from 1.39 in the 1990s to 1.62 in the 2000s (Figure 5.3.2A-9). Very few Lake Whitefish were captured in the other lakes; the few that were captured in the north basin had a condition of 1.64 in the 1980s and 1.24 in the 2000s, and 1.78 in Little Playgreen Lake in the 2010s. The condition measured from fish captured in a nearby off-system lake is within the range observed in the on-system lakes, with a mean of 1.43 in the 2000s and 1.38 in 2010s.
INDICATOR: GROWTH
Metric: von Bertalanffy Model
A sufficient number of Lake Whitefish for the calculation of the von Bertalanffy growth curves were captured only from the south basin of Playgreen Lake. Whitefish from the south basin showed a slight increase in growth between the 1980s and 2010s, with fish taking a shorter time in the 2010s to reach the theoretical maximal length (i.e., higher Brody growth coefficient [k] value) and obtaining a larger maximal length (Figure 5.3.2A-10; Table 5.3.2A-1). Currently, the von Bertalanffy growth curves are generally similar between on-system and off-system lakes (Figure 5.3.2A-11; Table 5.3.2A-1).
Metric: Relative Year Class Strength
The Relative Year Class Strength of Lake Whitefish for the south basin of Playgreen Lake (using the limited data collected by MFB in the early 1980s when they used otoliths to age fish) is shown in Figure 5.3.2A-12. Insufficient numbers of Lake Whitefish were captured under the auspices of CAMP for this type of analysis. The historical year class index from 1983–1985 indicated that the weakest cohort (< 50) occurred in 1977. Strong year classes (> 100) occurred in four out of nine years during construction and early operation of LWR (1973–1981).
DISCUSSION: FACTORS AFFECTING LAKE WHITEFISH OVER TIME
Fishermen have stated that there were movements of Lake Whitefish between Playgreen Lake and the north end of Lake Winnipeg through Warren Landing. Such movements were first documented in the literature when two Lake Whitefish tagged in Lake Winnipeg were recaptured in Playgreen Lake between 1938 and 1954 (Kennedy 1954). Subsequent tagging studies initiated in 1969 confirmed a fall

REGIONAL CUMULATIVE EFFECTS ASSESSMENT – PHASE II WATER – FISH COMMUNITY
DECEMBER 2015 5.3-24
downstream run of Lake Whitefish into Playgreen Lake from Lake Winnipeg for spawning purposes (Pollard 1973).
Prior to LWR, Lake Whitefish were the most frequently captured species during test netting surveys of Playgreen Lake (> 30% of the catch) in 1971 (Schlick 1972; Ayles 1973). More whitefish were captured in the south basin and these fish were larger and in better condition compared to the north basin and Kiskittogisu Lake, which Ayles (1973) attributed to higher productivity of benthos in the south basin from nutrient inputs from Lake Winnipeg. These studies also found a steady increase in Lake Whitefish in the south basin of Playgreen Lake, particularly during October, during which time fish were thought to move out of Lake Winnipeg to spawn (Ayles 1973).
Lake Whitefish currently make up a relatively small proportion of catches (< 5%) in the south basin of Playgreen Lake and Little Playgreen Lake upstream of the Jenpeg GS. Catch-per-unit-effort is higher in the south basin (~3 fish/100 m/24 h) compared to Little Playgreen Lake (< 1 fish/100 m/24 h). The rate of capture in the on-system lakes are comparable to those in Setting Lake, where annual CPUE values range from less than 1–3 fish/100 m/24 h. Seasonal catches on Little Playgreen Lake have been observed to vary from less than 1% in the spring to almost 40% in the fall, suggesting that the lake likely does not support a large resident population (Davies et al. 1998). Since the CAMP studies are conducted in Playgreen Lake and Little Playgreen Lake in June and July, it is expected that the abundance of Lake Whitefish would be higher in the fall when large numbers of fish move into the area.
Changes to Lake Whitefish stocks upstream of the Jenpeg GS may be due to many factors, including changes in habitat and/or seasonal migration patterns resulting from hydroelectric development, natural variability, and/or to other stressors such as commercial fishing. For a description of potential effects of climate and the introduction of Rainbow Smelt into the system refer to the discussion in Area 2 (Section 5.3.4.3.1). The following sections provide discussion of the effects of the key stressors on Lake Whitefish stocks in the area.
Factor: Effects of Changes to the Water Regime and Other Factors on Fish Habitat
One of the main concerns expressed to Manitoba Hydro by the Norway House community was related to the redistribution of fish stocks due to the construction of Two-Mile Channel and reduced stocks due to regulation (Manitoba Hydro 2014a). Completion of Two-Mile Channel in 1976 altered the temporal and spatial pattern of flows through Playgreen Lake, which has the potential to disrupt migration patterns between Lake Winnipeg and the Outlet Lakes. Fishermen have said that the spatial distribution and seasonal movements of Lake Whitefish stocks in Playgreen Lake have changed under regulation. In particular, they felt that migrations were occurring through Two-Mile Channel in addition to Warren Landing.
The use of Two-Mile Channel by Lake Whitefish was assessed by the Department of Fisheries and Oceans (DFO) in the spring (late June) and fall (mid-October) of 1989 using hydro-acoustic methods. Few fish were found to be moving in either direction in the channel at either time (unpubl. report; Federal Ecological Monitoring Program [FEMP] Annual Report 1990 in Davies et al. 1998).

REGIONAL CUMULATIVE EFFECTS ASSESSMENT – PHASE II WATER – FISH COMMUNITY
DECEMBER 2015 5.3-25
Studies have shown that Lake Whitefish continue to move extensively between Lake Winnipeg and Playgreen Lake after regulation, particularly during the spring and fall (Mavros and Bodaly 1992; Davies et al. 1998). Genetic studies have shown that there were at least two distinct populations of Lake Whitefish in Playgreen Lake and Lake Winnipeg prior to regulation and that these populations have remained genetically distinct since LWR became operational (Bodaly et al. 1998; Kristofferson and Clayton 1990; Mavros and Bodaly 1992).
Catches of Lake Whitefish in the south basin have been highly variable during MFB experimental test netting studies conducted from 1981–2006 (Figure 5.3.2A-8). Over the years, MFB technicians have recorded observations about environmental conditions associated with poor catches. A fisheries technician noted that poor catches during the 1986 survey were associated with high flows causing a considerable current through Playgreen Lake, a significant plume of silt in Two-Mile Channel, and noticeable fluctuations in water levels (MFB unpubl. data, Playgreen Lake). In 1991, poor catches occurred in a year when the fisheries technician noted that weed growth had been higher in Playgreen Lake than observed in his previous 10 years of experience (MFB unpubl. data, Playgreen Lake).
Changes to the water regime associated with LWR on waterbodies upstream of the Jenpeg GS, which include an overall increase in mean water levels and a reduction in the range but no change in seasonality (Water Regime, Section 4.3.2.2.3), are not typically associated with adverse effects to the incubation of Lake Whitefish eggs. The RYCS analysis for Playgreen Lake was limited to a three-year sampling period (1983–1985) when otoliths were used to age the catch. The RYCS analysis indicated that the recruitment of cohorts varied considerably during the construction and early operation of LWR. Year class strength was lowest the two years following the removal of the final plug at the Ominawin Bypass Channel in 1975. However, the strength of a year class does not appear to be related to flows since both the highest (1981) and lowest (1977) observed year class strength index values occurred when flows were below the 5th percentile during the egg incubation period (based on information provided in Erosion and Sedimentation, Chapter 4.4). Moreover, large spill events that occurred in 1977 and 1978 from October to December (based on information provided in Water Regime, Chapter 4.3) do not appear to have affected egg incubation since the 1977 cohort was weak (< 50) but the 1978 cohort was strong (> 100).
An assessment of commercial and experimental catch data conducted in response to NFA claims in the 1980s concluded that LWR had not reduced Lake Whitefish stocks in the Norway House Resource Management Area and speculated that changes experienced on Playgreen Lake as a result of regulation were not of the magnitude or nature to have had a measurable effect on the fish community (MacLaren Plansearch Inc. 1985; MacLaren Plansearch Inc. and Beak Consultants Ltd. 1989). The study concluded that the stock abundance was adequate after LWR to support historic levels of fishing since experimental fishing efforts at traditional fishing grounds (near Two-Mile Channel and Warren Landing) yielded catches with a high proportion of Lake Whitefish and were in excess of published pre-LWR values.
In response to continued concerns of commercial fishers, Manitoba Hydro contracted Dr. H. Lawler (the former Regional Director General of DFO) and Dr. K. Doan (the former Director of MFB) in 1991 to examine “the impacts of the Lake Winnipeg whitefish fishery that might be associated with regulation of Lake Winnipeg” (Lawler and Doan 1992). In March 1992, a workshop was held to discuss factors affecting the commercial whitefish fishery of Lake Winnipeg; the workshop was attended by provincial and

REGIONAL CUMULATIVE EFFECTS ASSESSMENT – PHASE II WATER – FISH COMMUNITY
DECEMBER 2015 5.3-26
federal biologists, commercial fishers, and representative from the Freshwater Fish Marketing Corporation and Manitoba Hydro. Based on an extensive literature review and the workshop, Lawler and Doan (1992) concluded that the LWR was unlikely to have had “a measurable impact on the overall status of the whitefish fishery”.
Factor: Effects of Changes to Sedimentation and Water Quality
Refer to earlier discussion for fish community (Section 5.3.2.3.1).
Factor: Effects of Obstructions to Upstream Movements/Alterations to Downstream Movements
Refer to earlier discussion for fish community (Section 5.3.2.3.1).
Factor: Effects of Fisheries
Lake Whitefish is an important species to local harvesters. Fall Lake Whitefish spawning runs were one of the main sources of domestically harvested fish for Norway House residents. Studies have shown that the whitefish stocks being harvested by the Norway House domestic fishery in the Jack River and Little Playgreen Lake are also being harvested by commercial fisheries operating on Playgreen Lake, Mossy Bay, and Grand Rapids (Davies et al. 1998). While overexploitation of the commercial fishery would have led to a direct and immediate effect on the domestic fishery, ongoing success of the commercial fishery suggested that fish remained available to the domestic fishery. The domestic fishery primarily operates on Little Playgreen Lake during fall when Lake Whitefish are present in high numbers. Davies et al. (1998) estimated that to harvest 100 fish for domestic use in 1994, a fisherman would have to set a net for 2.3 days in the Jack River or 4.7 days in Little Playgreen Lake. Harvest pressure on the Gunisao River during the spawning run was found to be heavy with 11.6% of the Floy®-tags being recaptured by the domestic fishery within six weeks of being applied (Davies et al. 1998). The current level of domestic harvest of Lake Whitefish is unknown.
Total whitefish landings from the commercial fishery on Playgreen Lake ranged from an average of approximately 26,000 kg in the 1940s to almost 140,000 kg in the years just prior to completion of LWR (1969–1975) (Figure 5.3.2A-5). Lake Whitefish generally composed the majority of pre-LWR catches on Playgreen Lake, ranging from an average of 55% of production from 1957–1968 to 84% of production from 1969–1975. Sopuck (1978) concluded that an increase in commercial Lake Whitefish catches in Playgreen Lake in the late 1970s was not the result of an influx of fish from Lake Winnipeg due to the construction of Two-Mile Channel since an increasing trend in the catch of Lake Whitefish on Playgreen Lake started around 1967. The author noted that catch records prior to the creation of the Freshwater Fish Marketing Corporation in 1969 likely underestimated actual landings and self-regulation by the Norway House Commercial Fishermen’s Cooperative likely resulted in a substantial decrease in the amount of illegal fishing after the number of fishing licences was limited to 50 in 1968. Although production of Lake Whitefish has remained high post-LWR, averaging about 127,000 kg/y since 1976, Lake Whitefish became increasingly less important to the overall fishery in Playgreen Lake (Figure 5.3.2A-5). This decline has been attributed to a shift in species selection by commercial fishermen as a result of market price.
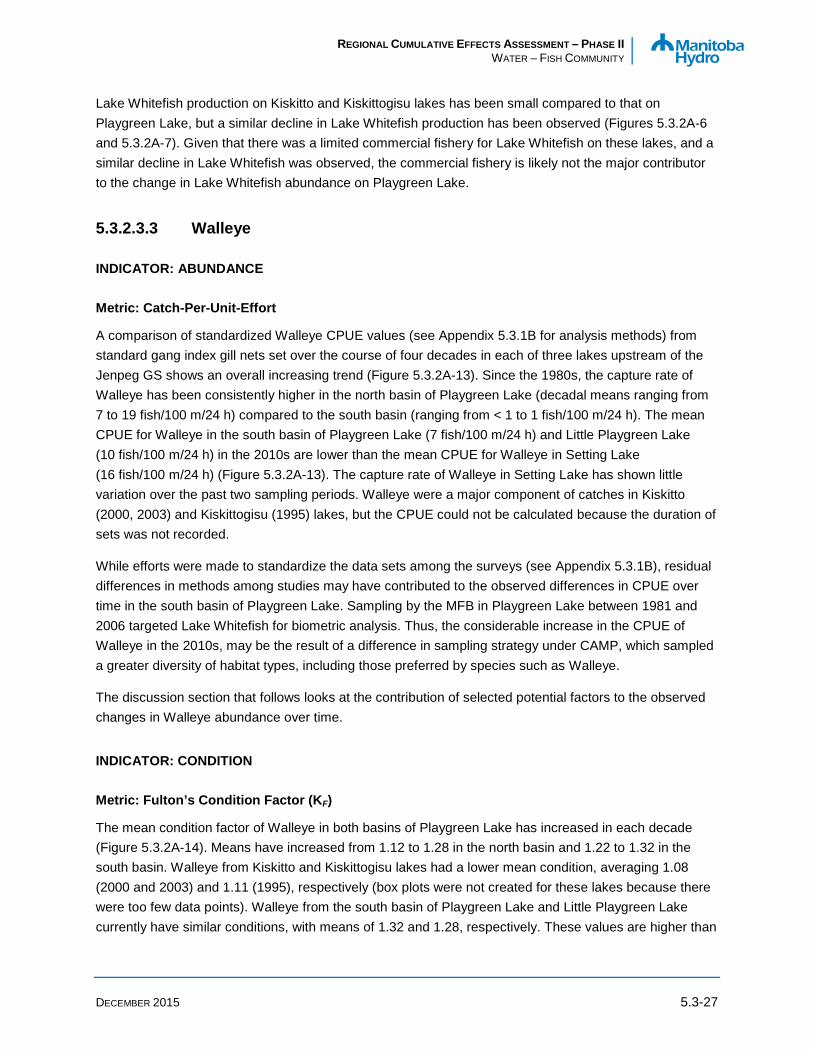
REGIONAL CUMULATIVE EFFECTS ASSESSMENT – PHASE II WATER – FISH COMMUNITY
DECEMBER 2015 5.3-27
Lake Whitefish production on Kiskitto and Kiskittogisu lakes has been small compared to that on Playgreen Lake, but a similar decline in Lake Whitefish production has been observed (Figures 5.3.2A-6 and 5.3.2A-7). Given that there was a limited commercial fishery for Lake Whitefish on these lakes, and a similar decline in Lake Whitefish was observed, the commercial fishery is likely not the major contributor to the change in Lake Whitefish abundance on Playgreen Lake.
5.3.2.3.3 Walleye
INDICATOR: ABUNDANCE
Metric: Catch-Per-Unit-Effort
A comparison of standardized Walleye CPUE values (see Appendix 5.3.1B for analysis methods) from standard gang index gill nets set over the course of four decades in each of three lakes upstream of the Jenpeg GS shows an overall increasing trend (Figure 5.3.2A-13). Since the 1980s, the capture rate of Walleye has been consistently higher in the north basin of Playgreen Lake (decadal means ranging from 7 to 19 fish/100 m/24 h) compared to the south basin (ranging from < 1 to 1 fish/100 m/24 h). The mean CPUE for Walleye in the south basin of Playgreen Lake (7 fish/100 m/24 h) and Little Playgreen Lake (10 fish/100 m/24 h) in the 2010s are lower than the mean CPUE for Walleye in Setting Lake (16 fish/100 m/24 h) (Figure 5.3.2A-13). The capture rate of Walleye in Setting Lake has shown little variation over the past two sampling periods. Walleye were a major component of catches in Kiskitto (2000, 2003) and Kiskittogisu (1995) lakes, but the CPUE could not be calculated because the duration of sets was not recorded.
While efforts were made to standardize the data sets among the surveys (see Appendix 5.3.1B), residual differences in methods among studies may have contributed to the observed differences in CPUE over time in the south basin of Playgreen Lake. Sampling by the MFB in Playgreen Lake between 1981 and 2006 targeted Lake Whitefish for biometric analysis. Thus, the considerable increase in the CPUE of Walleye in the 2010s, may be the result of a difference in sampling strategy under CAMP, which sampled a greater diversity of habitat types, including those preferred by species such as Walleye.
The discussion section that follows looks at the contribution of selected potential factors to the observed changes in Walleye abundance over time.
INDICATOR: CONDITION
Metric: Fulton’s Condition Factor (KF)
The mean condition factor of Walleye in both basins of Playgreen Lake has increased in each decade (Figure 5.3.2A-14). Means have increased from 1.12 to 1.28 in the north basin and 1.22 to 1.32 in the south basin. Walleye from Kiskitto and Kiskittogisu lakes had a lower mean condition, averaging 1.08 (2000 and 2003) and 1.11 (1995), respectively (box plots were not created for these lakes because there were too few data points). Walleye from the south basin of Playgreen Lake and Little Playgreen Lake currently have similar conditions, with means of 1.32 and 1.28, respectively. These values are higher than
REGIONAL CUMULATIVE EFFECTS ASSESSMENT – PHASE II WATER – FISH COMMUNITY
DECEMBER 2015 5.3-28
those observed in an off-system lake, where mean values ranged from 1.12 to 1.14 in the 2000s and 2010s, respectively.
INDICATOR: GROWTH
Metric: von Bertalanffy Model
Growth curves were only calculated for waterbodies and decades in which Walleye were aged using otoliths (Figure 5.3.2A-15). There was little difference in the growth of Walleye from the south basin of Playgreen Lake or the off-system Setting Lake from the 2000s to 2010s. Currently, the von Bertalanffy growth curves are generally similar between the north basin of Playgreen Lake and Little Playgreen Lake, but Walleye from the south basin appear attain a higher L∞ value (i.e., the maximum size reached by the oldest fish) (Figure 5.3.2A-16). Considerably larger Walleye were captured from the south basin (maximum length was 838 mm) compared to the north basin and Little Playgreen Lake (maximum length was 571 mm). The growth curves for off-system lakes were similar to those of on-system lakes in that fish took about the same time to reach L∞ (i.e., had similar k values), but attained a much smaller L∞. The size structure of the catch in Setting Lake was considerably different, with less than 2% of the catch in index gill nets exceeding 450 mm, compared to the on-system lakes where 20–30% of the catch was greater than 450 mm.
Metric: Relative Year Class Strength
Relative year class strength analyses for Walleye were only conducted on waterbodies and decades where otoliths were used to age fish, as such an index was only calculated for the recent sampling program (Figure 5.3.2A-17). Strong cohorts (> 175) occurred in both Playgreen Lake and Setting Lake in 2002 and 2005, with weaker cohorts (< 75) occurring in between. However, the age structure of stocks from the south basin differed from that of Setting Lake in that there were very few Walleye older than six years-of-age in Playgreen Lake. Little Playgreen Lake was not sampled in consecutive years in the most recent period so RYCS analysis is not possible.
DISCUSSION: FACTORS AFFECTING WALLEYE OVER TIME
Walleye were a common component of catches in surveys conducted in Playgreen Lake, Kiskitto Lake, and Kiskittogisu Lake in the 1970s (Schlick 1972; Ayles 1973).The number of Walleye captured per overnight set was higher in Kiskittogisu Lake than in Playgreen Lake (Ayles 1973). The tributary streams of Kiskitto and Kiskittogisu lakes, such as Kiskittogisu River, Minago River, and Black Duck Creek, provided important spawning habitat (Koshinsky 1973).
Currently, Walleye are not a major component of gillnet catches in surveys of the south basin of Playgreen Lake (9%) or Little Playgreen Lake (15%). The mean CPUE for the species was higher over the recent decade in Little Playgreen Lake (10 fish/100 m/24 h) compared to the south basin of Playgreen Lake (7 fish/100 m/24 h). Catch-per-unit-effort values on the on-system lakes were lower than that observed in a nearby off-system lake, Setting Lake (16 fish/100 m/24 h). The mean CPUE on the south basin of Playgreen Lake has increased considerably since the 2000s, when the mean CPUE was about 1 fish/100 m/24 h. However, this observation is likely more a function of different goals of the sampling
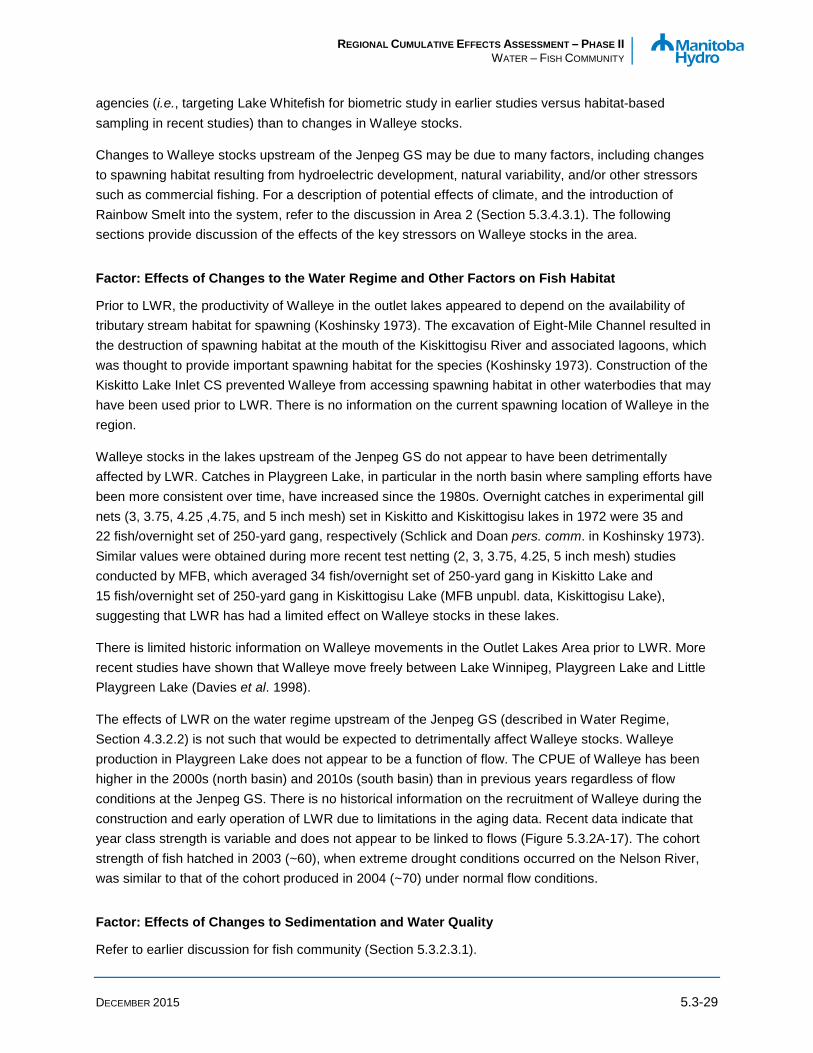
REGIONAL CUMULATIVE EFFECTS ASSESSMENT – PHASE II WATER – FISH COMMUNITY
DECEMBER 2015 5.3-29
agencies (i.e., targeting Lake Whitefish for biometric study in earlier studies versus habitat-based sampling in recent studies) than to changes in Walleye stocks.
Changes to Walleye stocks upstream of the Jenpeg GS may be due to many factors, including changes to spawning habitat resulting from hydroelectric development, natural variability, and/or other stressors such as commercial fishing. For a description of potential effects of climate, and the introduction of Rainbow Smelt into the system, refer to the discussion in Area 2 (Section 5.3.4.3.1). The following sections provide discussion of the effects of the key stressors on Walleye stocks in the area.
Factor: Effects of Changes to the Water Regime and Other Factors on Fish Habitat
Prior to LWR, the productivity of Walleye in the outlet lakes appeared to depend on the availability of tributary stream habitat for spawning (Koshinsky 1973). The excavation of Eight-Mile Channel resulted in the destruction of spawning habitat at the mouth of the Kiskittogisu River and associated lagoons, which was thought to provide important spawning habitat for the species (Koshinsky 1973). Construction of the Kiskitto Lake Inlet CS prevented Walleye from accessing spawning habitat in other waterbodies that may have been used prior to LWR. There is no information on the current spawning location of Walleye in the region.
Walleye stocks in the lakes upstream of the Jenpeg GS do not appear to have been detrimentally affected by LWR. Catches in Playgreen Lake, in particular in the north basin where sampling efforts have been more consistent over time, have increased since the 1980s. Overnight catches in experimental gill nets (3, 3.75, 4.25 ,4.75, and 5 inch mesh) set in Kiskitto and Kiskittogisu lakes in 1972 were 35 and 22 fish/overnight set of 250-yard gang, respectively (Schlick and Doan pers. comm. in Koshinsky 1973). Similar values were obtained during more recent test netting (2, 3, 3.75, 4.25, 5 inch mesh) studies conducted by MFB, which averaged 34 fish/overnight set of 250-yard gang in Kiskitto Lake and 15 fish/overnight set of 250-yard gang in Kiskittogisu Lake (MFB unpubl. data, Kiskittogisu Lake), suggesting that LWR has had a limited effect on Walleye stocks in these lakes.
There is limited historic information on Walleye movements in the Outlet Lakes Area prior to LWR. More recent studies have shown that Walleye move freely between Lake Winnipeg, Playgreen Lake and Little Playgreen Lake (Davies et al. 1998).
The effects of LWR on the water regime upstream of the Jenpeg GS (described in Water Regime, Section 4.3.2.2) is not such that would be expected to detrimentally affect Walleye stocks. Walleye production in Playgreen Lake does not appear to be a function of flow. The CPUE of Walleye has been higher in the 2000s (north basin) and 2010s (south basin) than in previous years regardless of flow conditions at the Jenpeg GS. There is no historical information on the recruitment of Walleye during the construction and early operation of LWR due to limitations in the aging data. Recent data indicate that year class strength is variable and does not appear to be linked to flows (Figure 5.3.2A-17). The cohort strength of fish hatched in 2003 (~60), when extreme drought conditions occurred on the Nelson River, was similar to that of the cohort produced in 2004 (~70) under normal flow conditions.
Factor: Effects of Changes to Sedimentation and Water Quality
Refer to earlier discussion for fish community (Section 5.3.2.3.1).
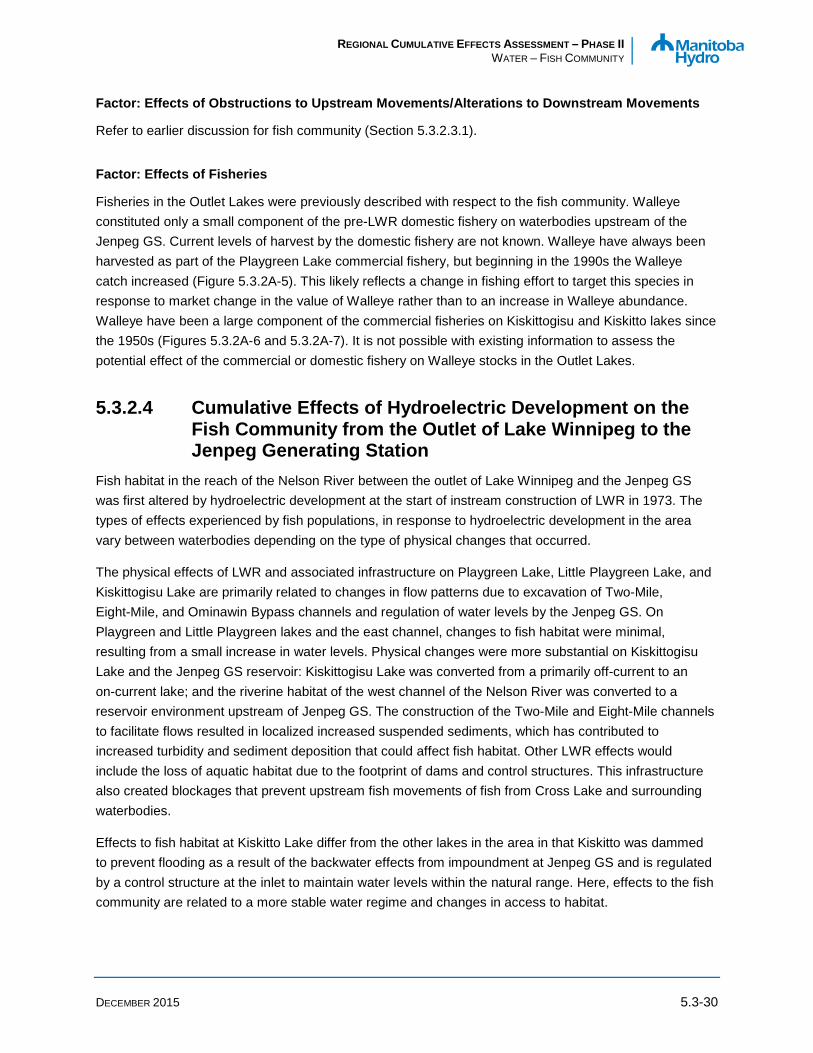
REGIONAL CUMULATIVE EFFECTS ASSESSMENT – PHASE II WATER – FISH COMMUNITY
DECEMBER 2015 5.3-30
Factor: Effects of Obstructions to Upstream Movements/Alterations to Downstream Movements
Refer to earlier discussion for fish community (Section 5.3.2.3.1).
Factor: Effects of Fisheries
Fisheries in the Outlet Lakes were previously described with respect to the fish community. Walleye constituted only a small component of the pre-LWR domestic fishery on waterbodies upstream of the Jenpeg GS. Current levels of harvest by the domestic fishery are not known. Walleye have always been harvested as part of the Playgreen Lake commercial fishery, but beginning in the 1990s the Walleye catch increased (Figure 5.3.2A-5). This likely reflects a change in fishing effort to target this species in response to market change in the value of Walleye rather than to an increase in Walleye abundance. Walleye have been a large component of the commercial fisheries on Kiskittogisu and Kiskitto lakes since the 1950s (Figures 5.3.2A-6 and 5.3.2A-7). It is not possible with existing information to assess the potential effect of the commercial or domestic fishery on Walleye stocks in the Outlet Lakes.
5.3.2.4 Cumulative Effects of Hydroelectric Development on the Fish Community from the Outlet of Lake Winnipeg to the Jenpeg Generating Station
Fish habitat in the reach of the Nelson River between the outlet of Lake Winnipeg and the Jenpeg GS was first altered by hydroelectric development at the start of instream construction of LWR in 1973. The types of effects experienced by fish populations, in response to hydroelectric development in the area vary between waterbodies depending on the type of physical changes that occurred.
The physical effects of LWR and associated infrastructure on Playgreen Lake, Little Playgreen Lake, and Kiskittogisu Lake are primarily related to changes in flow patterns due to excavation of Two-Mile, Eight-Mile, and Ominawin Bypass channels and regulation of water levels by the Jenpeg GS. On Playgreen and Little Playgreen lakes and the east channel, changes to fish habitat were minimal, resulting from a small increase in water levels. Physical changes were more substantial on Kiskittogisu Lake and the Jenpeg GS reservoir: Kiskittogisu Lake was converted from a primarily off-current to an on-current lake; and the riverine habitat of the west channel of the Nelson River was converted to a reservoir environment upstream of Jenpeg GS. The construction of the Two-Mile and Eight-Mile channels to facilitate flows resulted in localized increased suspended sediments, which has contributed to increased turbidity and sediment deposition that could affect fish habitat. Other LWR effects would include the loss of aquatic habitat due to the footprint of dams and control structures. This infrastructure also created blockages that prevent upstream fish movements of fish from Cross Lake and surrounding waterbodies.
Effects to fish habitat at Kiskitto Lake differ from the other lakes in the area in that Kiskitto was dammed to prevent flooding as a result of the backwater effects from impoundment at Jenpeg GS and is regulated by a control structure at the inlet to maintain water levels within the natural range. Here, effects to the fish community are related to a more stable water regime and changes in access to habitat.

REGIONAL CUMULATIVE EFFECTS ASSESSMENT – PHASE II WATER – FISH COMMUNITY
DECEMBER 2015 5.3-31
The main concerns expressed to Manitoba Hydro by residents of Norway House, related to the effects of hydroelectric development on the commercial fishery on Playgreen Lake and the domestic fishery on Little Playgreen Lake, include increased debris in gill nets that result in increased work, loss of nets, and decreased catches, reductions in fish stocks and a change in the relative abundance of key species such as Lake Whitefish, a re-distribution of fish in response to changes in flows following the construction of Two-Mile channel, and changes in the quality of fish harvested (i.e., mercury levels, taste, texture).
It is difficult to separate the effects of hydroelectric development in the area from the effects of other factors also affecting fish populations including socio-economic factors (e.g., fish prices, fishing effort), the introduction of Rainbow Smelt, and climate, among others. As well, an assessment of the effects of LWR and associated infrastructure on fish populations in waterbodies upstream of the Jenpeg GS is confounded by a the limited amount of information on fish populations prior to hydroelectric development, as well as differences in methods that limit the ability to compare to post-LWR data.
In Playgreen Lake, CPUE values in recent years have shown an increasing trend compared to previous decades. Since the 1980s, there has been a shift in the species composition in the south basin from a community dominated by coregonines (Cisco and Lake Whitefish) to one dominated by White Sucker and percids (Walleye, Yellow Perch). The fish community in the south basin more closely resembles the species composition in the north basin, which has generally remained more consistent over time, and continues to be dominated by White Sucker, Northern Pike, and Walleye.
The construction of Two-Mile Channel has not had a measurable effect on Lake Whitefish movement patterns. Studies have shown that Lake Whitefish continue to move extensively between Lake Winnipeg and Playgreen Lake after regulation, particularly during the spring and fall. Likewise, Walleye stocks do not appear to have been measurably affected by LWR. Since the 1980s, experimental catches in Playgreen Lake, in particular in the north basin where sampling efforts have been more consistent over time, have increased.
There is considerably less quantitative information on the other lakes upstream of the Jenpeg GS; surveys of the fish community have been conducted once in Kiskittogisu Lake and twice in Kiskitto Lake since LWR, but have not been conducted in either the east channel or the Jenpeg GS reservoir. An increase in flows through Kiskittogisu Lake under regulation was expected to result in a change in species composition and diversity. A 1995 survey indicated that the lake had a low species diversity and the species composition was similar to that observed in the north basin of Playgreen Lake since the 1980s, with a high proportion of White Sucker, Walleye, and Northern Pike. Test-netting in Kiskitto Lake in the early 2000s indicated that Longnose Sucker, which have become less common in the other lakes upstream of the Jenpeg GS, remain relatively abundant in Kiskitto Lake (which is cut off from the influence of the Nelson River and regulation) and that Goldeye, which were abundant in the lake prior to LWR, had become rare. At the Jenpeg GS reservoir, it is expected that LWR resulted in a shift of the fish community from more riverine adapted species towards those favouring the more lacustrine conditions of a reservoir environment, as has been observed at many of Manitoba Hydro’s other GSs.
The fish communities in Playgreen and Little Playgreen Lake are currently monitored every three years as part of CAMP to determine the overall health of the waterbodies and what changes, if any, are occurring in areas affected by Manitoba Hydro’s operations. The fish assemblage in both lakes is dominated by
REGIONAL CUMULATIVE EFFECTS ASSESSMENT – PHASE II WATER – FISH COMMUNITY
DECEMBER 2015 5.3-32
White Sucker, Northern Pike, and Walleye. Lake Whitefish currently make up a relatively small proportion of catches (< 5%) in the south basin of Playgreen Lake and Little Playgreen Lake during June/July. However, it is expected that the abundance of Lake Whitefish would be higher in the fall. Spottail Shiner is the dominant forage species in both lakes. Rainbow Smelt occur in both lakes, but account for a greater proportion of the catch in Little Playgreen Lake. The CPUE in standard gang index gill nets in Playgreen and Little Playgreen lakes is among the highest as compared to lakes along the upper and lower Nelson River that are monitored as part of CAMP.
Despite the physical changes that have occurred in the area upstream of Jenpeg GS as a result of LWR and associated infrastructure, studies do not indicate that large, negative impacts have occurred to fish populations in most areas. Currently, commercial harvests continue to be high in Playgreen Lake and CAMP data show that Playgreen Lake fish populations are relatively healthy with high fish catches compared to many other waterbodies in the area (including those not affected by Manitoba Hydro).

REGIONAL CUMULATIVE EFFECTS ASSESSMENT – PHASE II WATER – FISH COMMUNITY
DECEMBER 2015 5.3-33
5.3.3 Area 1: Jenpeg Generating Station to Kelsey Generating Station
As discussed in Section 5.3.2, Area 1 comprises the Nelson River from the outlet of Lake Winnipeg to the Kelsey GS as well as tributary waterbodies. The discussion of the fish community considers the area in two reaches that are divided at the Jenpeg GS (Map 5.3.2-1). The reach of Area 1 considered in this section extends from the Jenpeg GS to the Kelsey GS and includes the Nelson River and its major lakes (Cross, Drunken, Walker, Pipestone, Duck, and Sipiwesk). Downstream of Cross Lake the Nelson River passes over a series of rapids to Sipiwesk Lake and then, prior to the construction of the Kelsey GS, through several more rapids to Kelsey Rapids, which is the site of the Kelsey GS.
Project descriptions for the hydroelectric developments from the Jenpeg GS to the Kelsey GS reach of the Nelson River are found in Part II Hydroelectric Development Project Description in the Region of Interest. A detailed description of effects of hydroelectric development to the water regime in this reach is provided in Section 4.3.2 (Water Regime). Key points of the project description and water regime information relevant to fish and fish habitat are summarized below.
The first alteration to fish habitat in this reach from hydroelectric development occurred with the construction of the Kelsey GS at the Kelsey Rapids between 1958 and 1961. The GS caused flooding up to and including Sipiwesk Lake, inundating several major rapids and increasing water levels on Sipiwesk Lake by several metres. Duck Lake was not affected since it is separated from Sipiwesk by Duck Lake Falls (MacKay et al. 1990). While the amount of flooding on the Cauchon-Prud’homme lakes is not known, there is evidence of flooded shorelines on these lakes indicating that, at least at higher elevations, the effects of Kelsey GS extend to these lakes (MacKay et al. 1990).
The Jenpeg GS has regulated outflow from Lake Winnipeg into Cross Lake and altered the flow regime of Cross Lake and downstream waterbodies since 1976. The effects of LWR on Sipiwesk Lake and downstream on the Nelson River are superimposed on the impacts of the Kelsey GS. While Duck Lake was isolated from the effects of the Kelsey GS backwater by Duck Lake Falls, water levels on the lake are impacted by LWR.
Prior to LWR, water levels and flows on Cross Lake followed a typical seasonal pattern and were highest mid-summer and lowest during winter. LWR altered the water regime in the lower flow years post-LWR but prior to construction of the Cross Lake Weir by changing the seasonal timing of water levels and increasing the annual water level range, such that average levels in summer were 4 ft (1.2 m) lower and average levels in winter were 1.5 ft (0.5 m) higher. A weir was constructed at the outlet of Cross Lake in 1991 to raise the mean water level on the lake and reduce the range of water levels. Overall water levels are now higher than pre LWR and the range is reduced. Changes in the frequency, duration and timing of high water level events on Cross Lake due to LWR have affected the water regime on connected lakes. Water levels continue to fluctuate on Pipestone Lake with those on Cross Lake in the post-LWR era. Water levels on Walker Lake are affected by LWR when water levels on Cross Lake are greater than 681 ft (207.6 m), which following construction of the weir occurs when Cross Lake is at or above average levels.
REGIONAL CUMULATIVE EFFECTS ASSESSMENT – PHASE II WATER – FISH COMMUNITY
DECEMBER 2015 5.3-34
5.3.3.1 Key Published Information Pre-Kelsey GS data on fish communities along the upper Nelson River were not located. Population studies were first conducted on Cross Lake in 1965 (Driver and Doan 1972) and on Sipiwesk Lake in 1966 (Schlick 1968a). Gillnetting surveys were conducted on these lakes in 1973 as part of the LWCNRSB (Koshinsky 1973; Ayles et al. 1974). A study was conducted in 1980 and 1981 to assess post-LWR fish populations in Cross, Pipestone, and Walker lakes. Surveys were conducted on Sipiwesk Lake in 1983 as part of the Canada-Manitoba Agreement on the Study and Monitoring of Mercury in the CRD (Patalas 1984a). Studies by the MDNR followed between 1985 and 1989 under the Manitoba Ecological Monitoring Program (MEMP) in response to NFA claim #18 (Mohr and Kirton 1986; Mohr 1987; Green 1988a, b, 1990). In response to the completion of the Cross Lake Weir in 1991, a co-operative project between Pimicikamak Cree Nation and Manitoba Hydro was implemented to monitor fish populations (Kroeker and Bernhardt 1993; Bernhardt and Schneider-Vieira 1994; Bernhardt 1995a, 1996; Kroeker and Bernhardt 1997; Kroeker and Graveline 1998, 1999; Barth et al. 2001; MacDonell and Graveline 2002; MacDonald and MacDonell 2003, 2004; Johnson et al. 2005; Neufeld et al. 2006; Richardson and MacDonell 2007; Gallagher and MacDonell 2008; Caskey and MacDonell 2010). The Cross Lake Weir post-project monitoring program was concluded in 2008, but the west basin of Cross Lake continues to be monitored under CAMP, along with Walker Lake, Sipiwesk Lake, and the upper Nelson River.
Manitoba Hydro and the Split Lake Cree conducted a joint assessment of the effects of hydroelectric development in the Split Lake Resource Management Area in 1996, which includes a portion of the upper Nelson River downstream of Sipiwesk Lake (Volume 3, Split Lake Cree-Manitoba Hydro Joint Study 1996).
5.3.3.2 New Information and/or Re-analysis of Existing Information Fish population information from the published literature1 was supplemented with historic data that had previously not been published as well as published data for which the raw data were made available for re-analysis with data collected under CAMP.
Manitoba Fisheries Branch conducted index gillnetting surveys in Sipiwesk Lake in 1995 to assess the biological characteristics of Walleye stocks and conducted the first year of fish stock assessment in Cross Lake in 1991, at the time the weir was under construction. There are differences in sampling design
1Fish community sampling using index gill nets has been conducted periodically in Cross Lake and Sipiwesk Lake since the 1960s as part of fisheries management surveys by the province (Diver and Doan 1972; Schlick 1968a). This historic data, the pre-LWR index gillnetting data on Cross Lake and Sipiwesk Lake in 1973 (Ayles et al. 1974), and post-LWR data collected on Pipestone Lake in 1986 (Sopuck 1987) are not included in the metric analysis because sufficient raw data were not available to standardize the metric analyses to be comparable to data collected as part of the Cross Lake Weir post-project monitoring and CAMP.
REGIONAL CUMULATIVE EFFECTS ASSESSMENT – PHASE II WATER – FISH COMMUNITY
DECEMBER 2015 5.3-35
between the MFB studies (species-focussed sampling) and the CAMP studies (habitat-based sampling). Where possible, the results of the MFB studies have been incorporated into the index gillnetting analyses.
Over time, there have been differences in the mesh sizes, sampling sites, time of sampling, and sampling design (i.e., habitat-based sampling versus species-focussed sampling). To make the MEMP data collected from 1983–1989, Cross Lake Weir data collected from 1992 to 2007, and CAMP data collected between 2008 and 2013 comparable, it was necessary to eliminate the data generated from some of the mesh sizes that were not used consistently among programs (i.e., mesh ≤ 1.5 inch, mesh > 5 inch).
Some differences in methods remain between the gillnetting studies that were selected for the quantitative analysis. There were differences in the number of sites fished between studies (Maps 5.3.3A-1 and 5.3.3A-2), as well as how those sites were selected. As well, there are differences in the timing of gillnetting studies: the MEMP sampling occurred from early June to early October, the weir project sampling from mid-July to early October, while CAMP studies typically occurred in mid-August to early September in the upper waterbodies (i.e., Cross and Walker lakes) and in late June to early July in the lower waterbodies (i.e., Sipiwesk Lake, upper Nelson River). For Walleye, differences in the structures used to determine ages prevented comparison of data collected from 1998–2007 (dorsal spines) to data collected in other years (otoliths).
5.3.3.3 Changes in the Fish Community and Focal Species over Time
The following discussion is based on a combination of the results found in key published information and a reanalysis of novel and selected existing data. The available comparable data were grouped by decade into four periods and analyzed: 1980s; 1990s; 2000s; and 2010s.
5.3.3.3.1 Fish Community
INDICATOR: ABUNDANCE
Metric: Catch-Per-Unit-Effort
Catch-per-unit-effort was calculated for all species (i.e., the total catch) captured in standard gangs set in each of five waterbodies downstream of the Jenpeg GS (Figure 5.3.3A-1). The mean total CPUE in both the east and west basins of Cross Lake has shown a decreasing trend over time. In the 1980s the mean total CPUE was 95 and 74 fish/100 m/24 h in the east and west basins, respectively. These values decreased by approximately 30% in each basin in the 1990s (68 and 48 fish/100 m/24 h, respectively). By the 2000s, the mean CPUE was lower still in the east basin (56 fish/100 m/24 h), but appeared to have stabilized in the west basin (48 fish/100 m/24 h). The mean value measured in the west basin during the 2010s was the lowest on record (35 fish/100 m/24 h); the east basin was not surveyed in the 2010s. An increase in the mean total CPUE has been observed in Pipestone Lake, where the mean CPUE went from approximately 40 fish/100 m/24 h during the 1980s and 1990s to 54 fish/100 m/24 h in the 2000s. The mean catch in Sipiwesk Lake in 2011 (47 fish/100 m/24 h) was similar to that observed in the 1980s (48 fish/100 m/24 h).

REGIONAL CUMULATIVE EFFECTS ASSESSMENT – PHASE II WATER – FISH COMMUNITY
DECEMBER 2015 5.3-36
The CPUE of individual species in the on-system Nelson River waterbodies monitored under CAMP were generally similar. Notable differences included White Sucker, which had a lower CPUE in Cross Lake compared to the waterbodies upstream of the Jenpeg GS, and Shorthead Redhorse, which were more abundant in waterbodies downstream of Jenpeg GS (CAMP 2014).
The CPUE in a nearby off-system waterbody that is monitored annually as part of CAMP, Setting Lake, was about 74 fish/100 m/24 h in both the 2000s and 2010s. These values are within the range of those measured in Cross Lake during the 1980s. In the other off-system waterbody, Walker Lake, the mean total CPUE measured in the 2010s (31 fish/100m/24 h) is about half the value measured in the 1980s (66 fish/100 m/24 h).
Because of differences in methods (see Section 5.3.3.2), CPUE could not be calculated in the same way for the pre-LWR gillnetting data collected in 1965/1966 and 1973 in Cross Lake and Sipiwesk Lake. A comparison of the number of fish captured per overnight set in Cross Lake (basins combined) shows that the pre-project production of all species (65 fish/overnight set in 1965 and 81 fish/overnight set in 1973) are within the range of values observed from 1980 to 2007 (Figure 5.3.3A-2). Fish production decreased sharply between 1980 (91 fish/overnight set) to 1986 (29 fish/overnight set), after which it increased to 84 fish/overnight set in 1991. Since 1993 (following construction of the weir), fish production has been more stable, ranging from 25 to 50 fish/overnight. Likewise, fish production in Sipiwesk Lake observed prior to LWR (24 fish/overnight set in 1966 and 36 fish/overnight set in 1973) is within the range observed post-project (20 fish/overnight set in 1986 to 38 fish/overnight set in 1987).
INDICATOR: DIVERSITY
Metric: Relative Abundance
Experimental gillnetting in Cross Lake in June/July 1965 captured seven species, Lake Whitefish, Cisco, Walleye, Northern Pike, White Sucker, Burbot (Lota lota), and Yellow Perch (Driver and Doan 1972). There were differences in the species composition between the two basins: catches in the west basin, which is more influenced by the Nelson River, were dominated by Walleye, and to a lesser extent White Sucker, Northern Pike, and Cisco; while catches in the east basin were dominated by Cisco, Walleye, Northern Pike, and Lake Whitefish. Lake Whitefish was not a common species in catches from the west basin. In Sipiwesk Lake, White Sucker was the most frequently captured species in experimental gill nets set in 1966 (Schlick 1968a). Also captured were Goldeye, Northern Pike, Cisco, Walleye, Lake Whitefish, and Sauger.
Relative abundance was calculated as the percentage contribution of each species to the total catch in each of five waterbodies downstream of the Jenpeg GS over the span of four decades (Figure 5.3.3A-3). In the 1980s, the most common large-bodied species in both basins of Cross Lake and Pipestone Lake were Walleye, Northern Pike, and Cisco, while in Sipiwesk Lake, White Sucker and Mooneye (Hiodon tergisus) were the dominant species. By the 1990s, there was a decrease in the relative abundance of Cisco and increases of both White Sucker and Yellow Perch in these lakes. Several changes were observed in the 2000s: the relative abundance of Cisco appeared to rebound to levels observed in the 1980s; the proportion of Lake Whitefish decreased in the catch; and the proportion of Northern Pike increased. Sipiwesk Lake was not sampled in the 2000s. In the current decade, Walleye,
REGIONAL CUMULATIVE EFFECTS ASSESSMENT – PHASE II WATER – FISH COMMUNITY
DECEMBER 2015 5.3-37
Yellow Perch, and Northern Pike are the dominant species in the west basin of Cross Lake, while White Sucker account for about half of the catch in Sipiwesk Lake. White Sucker and Walleye are the dominant species captured in the reach of the upper Nelson River sampled below Sipiwesk Lake.
Compared to the waterbodies upstream of the Jenpeg GS, Burbot and Longnose Sucker were less common in downstream waterbodies (CAMP 2014). Mooneye and Goldeye, which were not observed upstream of the Jenpeg GS, are still observed in many of the downstream waterbodies.
The number of species captured in index gill nets has generally declined over time in on-system lakes downstream of the Jenpeg GS. In the 1980s, 14 species were observed in many of the lakes in the area; this number has decreased by two to five species by the 2010s, although it is felt that this is an artifact of sampling and not the disappearance of species. In the west basin of Cross Lake the number of species captured each decade has been quite variable. Lake Sturgeon have recently been captured in index gill nets set in the west basin and in the reach of the Nelson River below Sipiwesk Lake (discussed further in Lake Sturgeon, Section 5.4.2).
Recent catches in standard gangs in two nearby off-system waterbodies, Walker Lake (a tributary to the east basin of Cross Lake) and Setting Lake (on the Grass River) consist of a similar species assemblage, with an abundance of White Sucker, Walleye, and Northern Pike (Figure 5.3.3A-4). Unlike the on-system lakes, Setting and Walker lakes have a high proportion of Cisco, and Setting Lake also has a higher proportion of Sauger. The fish community in Walker Lake consists of fewer species (eight species) compared to other lakes in this area, but the proportion of these species has generally remained similar from the 1980s to the 2010s (Figure 5.3.3A-3).
The forage community has recently been sampled (2014) as part of CAMP (CAMP, unpubl. data). The most frequently observed species were Spottail Shiner, Emerald Shiner, and Troutperch (Percopsis omiscomaycus). Rainbow Smelt, which were first observed in the upper Nelson River in 1995, are less common in the lakes downstream of the Jenpeg GS compared to those upstream, and are not captured in the off-system lakes. Although not common in small mesh gill nets, Rainbow Smelt were the most common species observed in turbine units during fish salvages conducted during the turbine re-runnering of the Kelsey GS that started in 2006 (Jansen 2009; Schneider-Vieira and Michaluk 2011; Aiken and Schneider-Vieira 2012). Other forage species observed during the salvages included (Troutperch, Spottail Shiner, Emerald Shiner, Longnose Dace [Rhinichthys cataractae], Golden Shiner [Notemigonus crysoleucas], Fathead Minnow [Pimephales promelas]), as well as a few individual large-bodied species (Burbot, Lake Whitefish, White Sucker, Longnose Sucker, Walleye, Common Carp [Cyprinus carpio], Northern Pike, and Sauger), most of which were identified as juveniles based on their length. A more diverse forage community was also sampled in Sipiwesk Lake in June/July 1987 when seines were pulled in conjunction with an index gillnetting program. The main species captured were Emerald Shiner, other species captured included Spottail Shiner, Blacknose Shiner (Notropis heterolepis), Johnny Darter (Etheostoma nigrum), Troutperch, Fathead Minnow, Ninespine Stickleback (Pungitius pungitius), Slimy Sculpin (Cottus cognatus), as well as juvenile Cisco, Northern Pike, and Walleye (MFB unpubl. data, Sipiwesk Lake).
REGIONAL CUMULATIVE EFFECTS ASSESSMENT – PHASE II WATER – FISH COMMUNITY
DECEMBER 2015 5.3-38
Metric: Hill’s Index
A Hill’s diversity number was calculated from the combined catch at all sites sampled in a year for each of five waterbodies downstream of the Jenpeg GS over four decades (Figure 5.3.3A-5). The Hill’s index has remained relatively consistent in both basins of Cross Lake over time, and has been consistently lower in the east basin (decadal mean ranges from 4.2 to 4.9) compared to the west basin (decadal mean ranges from 5.5 to 6.0). In the 1980s, the Hill’s index in Pipestone Lake was considerably higher than in Cross Lake (7.5), but decreased in the 1990s and 2000s to levels seen on Cross Lake (5.1 to 5.2). Likewise, the Hill’s value in Sipiwesk Lake has decreased since the 1980s and 1990s (6.9 to 7.0, respectively), with the mean value for the current decade (4.3) equal to that in the reach of the Nelson River downstream of Sipiwesk Lake. In Sipiwesk Lake, the decrease is likely a result of the large proportion of one species, White Sucker, in the catch.
The Hill’s index on Setting Lake, an off-system waterbody located on the Grass River is generally higher (mean 6.1) than current values on on-system lakes (mean < 5.6). The higher value in Setting Lake is likely the result of the relatively even proportion of many of the fish species (Figure 5.3.3A-4). In contrast, the Hill’s index on Walker Lake (mean 4.4), an off-system tributary lake to Cross Lake, is more similar to values on on-system lakes. Walker Lake has seen a decrease in the mean Hill’s index since the 1980s (5.0) — like Sipiwesk Lake, this is likely the result of the large proportion of White Sucker.
DISCUSSION: FACTORS AFFECTING THE FISH COMMUNITY OVER TIME
The following provides a general discussion of changes in the fish community over time; specific factors affecting Walleye and Lake Whitefish are discussed in more detail in Sections 5.3.3.3.2 and 5.3.3.3.3.
The first published survey of Sipiwesk Lake was by Schlick (1968a) in 1966; therefore, there are no baseline studies in the lake from which to assess effects of Kelsey GS. At that time, Schlick (1968a) described that a good portion of the length of the lake was an expansion of the Nelson River channels. Prior to regulation, baseline studies conducted for the LWCNRSB reported that at least 24 species of fish occurred in both Cross Lake and Sipiwesk Lake (Ayles et al. 1974). Ayles et al. (19741) reported that fish production in terms of catches in experimental gill nets (per overnight set of 3, 3.75, 4.25, 4.75, and 5.25 inch 50-yard panels) set in Sipiwesk Lake and Cross Lake in 1973 was higher than in studies conducted by the province in 1965 and 1966, respectively. In particular, the increase in CPUE was due to an increase in Goldeye and White Sucker in Cross Lake and Walleye and Goldeye in Sipiwesk Lake. Prior to regulation, aquatic vegetation in Cross Lake was scarce and was primarily limited to shallow bays that were less than 5 ft (1.5 m) deep (Driver and Doan 1972).
1 Ayles et al. (1974) present CPUE values in Table 3.2 - they were not included in the metric analysis because duration was not recorded and they were missing two inch panels used in later studies.
REGIONAL CUMULATIVE EFFECTS ASSESSMENT – PHASE II WATER – FISH COMMUNITY
DECEMBER 2015 5.3-39
Currently, the most common species captured in standard gang index gill nets in on-system waterbodies downstream of the Jenpeg GS are Walleye, White Sucker, and Northern Pike, with the proportion varying in each waterbody. White Sucker are particularly abundant in Sipiwesk Lake, where they account for about half the catch, as do Walleye in the Nelson River. Sauger are relatively uncommon in many of the lakes, except in Sipiwesk Lake. Likewise, Yellow Perch are particularly abundant in the west basin of Cross Lake. Fish CPUEs are typically higher in lacustrine waterbodies (35 to 41 fish/100 m/24 h), compared to the riverine waterbody (23 fish/100 m/24 h). In the 2010s, the diversity index of the fish community is higher in the west basin of Cross Lake (5.6) compared to Sipiwesk Lake and the Nelson River (4.3). In terms of forage fish, the most common small-bodied species are Yellow Perch and Spottail Shiner in the west basin of Cross Lake, Emerald Shiner and Troutperch in Sipiwesk Lake, and Spottail Shiner in the Nelson River (CAMP unpubl. data).
The index gillnetting catches in two off-system waterbodies in the recent decade consist of a similar species composition as on-system waterbodies, but the proportion of several species differ. In particular, Cisco are more abundant in the index catches in both Walker Lake and Setting Lake, and Sauger is more abundant in Setting Lake. There was considerable variability in the diversity index among the off-system waterbodies. The most recent diversity index in Walker Lake (4.4) is similar to that observed in Sipiwesk Lake, while that in Setting Lake (6.1) is higher than any of the on-system waterbodies.
Comparison of the metrics over the four decades suggests that there has been a decrease in the capture rate of fish in Cross Lake, as indicated by a decreasing trend in total CPUE. There also appears to have been a change in the relative abundance of certain species in the lakes downstream of the Jenpeg GS over time, and an overall decrease in the evenness of the fish community, as indicated by a decrease in the Hill’s diversity index. Changes in the fish community in the waterbodies downstream of the Jenpeg GS may be due to many factors, including changes in habitat, redistribution of fish stocks, and emigration of fish due to hydroelectric development (LWR, Kelsey GS), natural variability, and other stressors such as commercial fishing. The potential effects of climate and the establishment of Rainbow Smelt in the system in the1990s on fish communities are discussed in Area 2, where there is more information available (Section 5.3.4.3.1). The following sections provide discussion of the effects of the key stressors on fish communities in the area.
Factor: Effects of Changes to the Water Regime and Other Factors on Fish Habitat
The Kelsey GS has affected water levels on the Nelson River and surrounding lakes up to and including Sipiwesk Lake since its completion in 1960 (Water Regime, Section 4.3.2.4). Kelsey GS-related flooding made Bruneau Lake contiguous with Sipiwesk Lake, but Duck Lake remained separate due to the presence of a set of impassable rapids. Impoundment of the Kelsey GS increased water levels by approximately 30 ft (9.1 m) and flooded 63.5 sq mi (164.5 km2) of land (Water Regime, Section 4.3.2.4). This flooding created more lacustrine habitat and increased aquatic habitat available to fish communities in Sipiwesk Lake, but fragmented riverine habitat (Volume 3, Split Lake Cree-Manitoba Hydro Joint Study Group 1996). MacKay et al. (1990) noted that there was flooding on Cauchon-Prud’homme Lake resulting from the Kelsey GS. Operations at Kelsey GS did not affect flows from 1960 to 1976, during which time it was operated as a run-of-the-river plant. In response to energy demands, water levels on the Kelsey
REGIONAL CUMULATIVE EFFECTS ASSESSMENT – PHASE II WATER – FISH COMMUNITY
DECEMBER 2015 5.3-40
reservoir are typically drawn down during the late winter and the reservoir is typically refilled in the spring; this pattern is generally the same under drought and flood conditions (Water Regime, Section 4.3.2.4.3).
Ayles et al. (1974) reported that there was a shift in the dominant commercial species in Sipiwesk Lake from Lake Whitefish to Northern Pike since becoming a reservoir and that Goldeye stocks appeared to have increased. An increase in experimental gillnet catches (particularly of Northern Pike and Walleye) in Sipiwesk Lake between the 1966 and 1973 surveys was attributed to both habitat changes resulting from impoundment at the Kelsey GS as well as a decrease in exploitation (Ayles et al. 1974). The Split Lake Cree noted that Lake Whitefish, Lake Sturgeon, Northern Pike, and Walleye were harder to find in the upper Nelson River as a result of hydroelectric developments (Volume 3, Split Lake Cree-Manitoba Hydro Joint Study Group 1996). The effects to the other lakes impounded to some degree by the Kelsey GS (e.g., Prud’homme, Bruneau) are not known.
The LWCNRSB predicted that there would be reduction in the reproductive success of Northern Pike and Lake Whitefish in Cross Lake due to the increase in the frequency and severity of water level declines during spring and fall under LWR. Because Sipiwesk Lake had already been affected by Kelsey GS, the LWCNRSB did not include the lake in their assessment. Koshinsky (1973) predicted that reduced discharge in the east channel of the Nelson River under regulation would reduce nutrient and algal loading into Pipestone Lake and subsequently reduce fish production on the lake.
Lake Winnipeg Regulation alters the water regime on Cross Lake by changing the seasonal timing of water levels and increasing the range of water level fluctuations (Water Regime, Section 4.3.2.3.3). Under regulation, there are higher average flows and water levels in winter, and lower average flows and water levels during summer compared to pre-LWR conditions (Water Regime, Section 4.3.2.3.3). In particular, significant environmental effects, including impacts to fish populations on Cross Lake, were associated with the November cutback program1 (Nelson River Group 1986).
Reports of catch declines by commercial and domestic fishers on Cross Lake prompted studies by the province in 1980 (Gaboury and Patalas 1981, 1982, 1984). Gaboury and Patalas (1981) reported on the summer drawdown of 1980, which reduced the volume of Cross Lake and Pipestone Lake to 47% of their average historic volume and decreased the mean water depth by 1.9 m (20% lower) in west and 0.7 m (50% lower) in east Cross Lake, resulted in a reduction of available habitat for fish, a reduction in the availability of food, and resulted in a lower standing crop of fish, particularly of Lake Whitefish, but also of Northern Pike and Walleye. Gaboury and Patalas (1984) speculated that the decrease in standing stocks on Cross Lake in 1980 and 1981 would have been greater than shown by CPUE because of the
1 The original November cutback program, though never fully implemented, involved a substantial reduction of outflows over a two to three week span during freeze up to assist with formation of an earlier, stable ice cover on lakes and channels downstream of Jenpeg GS. After 1983, the program was replaced by a managed ice stabilization program that has included a number of improvements of the years to allow required flow cuts to be reduced in magnitude and duration (described in Water Regime, Section 4.3.2.2.4).
REGIONAL CUMULATIVE EFFECTS ASSESSMENT – PHASE II WATER – FISH COMMUNITY
DECEMBER 2015 5.3-41
substantial decrease in the volume of the lake during summer drawdowns, thereby concentrating fish stocks. Observed declines were attributed to water level drawdowns that reduced fish habitat during summer, reduced spawning success and recruitment of fall spawning species (e.g., Lake Whitefish) through dewatering of spawning habitat prior to ice break-up and desiccation of eggs, and prevented spring spawning species (e.g., Walleye) from accessing habitat (e.g., Minago and Pickerel rivers) (Gaboury and Patalas 1984; Nelson River Group 1986). Fishermen also stated that the road crossing the Minago River affected fish movements (Nelson River Group 1986).
An unusually early and rapid drawdown in March 1981 (1.4 m) resulted in severe winterkill in Cross Lake (Gaboury and Patalas 1984). Die-offs of species including White Sucker, Walleye, and Lake Whitefish were observed in shallow bays and channels that were dewatered under drawdown (Gaboury and Patalas 1984). The winterkill was worse in the east basin because of a lack of deep-water habitat (maximum depth of 1.9 m) for overwintering and because of relatively low oxygen concentrations in areas that are more isolated from Nelson River flows. An increase in the proliferation of aquatic vegetation during summer in response to lower summer water levels was also thought to have contributed to winterkill conditions as decomposition of vegetation reduces oxygen levels during the ice cover season. Dissolved oxygen (DO) levels measured in some off-current areas of Cross Lake in March of 1981 were below the PAL objectives for the protection of cool and/or cold water species (Water Quality, Section 5.2.3.3.3). The winterkill contributed to the dramatic decline in fish CPUE from 1980 to 1981. In winter 1988 and 1989, water levels in Cross Lake were also below pre-LWR 5th percentiles associated with the 1981 winterkill (based on information provided in Water Regime, Chapter 4.3) and DO levels in the middle and east basins were similarly low (Water Quality, Section 5.2.3.3.3), but there is no record of winterkills occurring in these years. Low DO conditions were also recorded in winter 1987 (the only other year for which measurements of DO were collected during winter in the middle or east basins, suggesting that DO depletion occurred in certain areas of Cross Lake even under higher water levels. However, due to a lack of pre-LWR data, it is not known if LWR caused or contributed to these conditions.
Between 1980 and 1989, the total CPUE fluctuated annually on Cross Lake. The same pattern was observed on both basins, with CPUE decreasing from a high in 1980 of 167 (east) and 107 (west) fish/100 m/24 h, to a low in 1986 of 32 (east) and 41 (west) fish/100 m/24 h, and increasing by 1988 to 133 (east) and 108 (west) fish/100 m/24 h. In 1989, fish production in the west basin decreased to 46 fish/100 m/24 h, and no fishing was conducted on the east basin because the basin was deemed too shallow to fish (MFB unpubl. data, Cross Lake). It appears that years with higher CPUE values were associated with flows below the 5th percentile for more than two weeks (1980, 1981, 1987, 1988) compared to years with normal flows (1985, 1986) (based on data provided in Water Regime, Section 4.3.2.3). A contributing factor to the observed increase in CPUE may be an increase in the capture efficiency of gill nets under lower flow conditions.
During this period the proportion of Cisco decreased, while that of Northern Pike (east) and Walleye (west) increased. The diversity indices for the west basin decreased considerably in the period, while that in the east basin remained relatively unchanged.
As in Cross Lake, coregonine populations declined in Pipestone Lake from 1980 through 1986. Sopuck (1987) attributed these declines to decreases in water levels from fall to spring. During this time, Northern Pike and White Sucker stocks increased, and Goldeye, which had previously not been a major

REGIONAL CUMULATIVE EFFECTS ASSESSMENT – PHASE II WATER – FISH COMMUNITY
DECEMBER 2015 5.3-42
component of the fish community, were virtually eliminated (Sopuck 1987). Sopuck (1987) reported that the year class strength of Walleye fluctuated in response to changes in water levels on Pipestone Lake. For example, a poor Walleye year class in 1977 coincided with low spring water levels, while the strong 1979-year classes coincided with high May/June water levels in Pipestone Lake.
Less is known about the effect of LWR on the fish community of Sipiwesk Lake. In low to average flow years, LWR reversed the seasonal water level pattern on Sipiwesk Lake, increasing winter flows at Kelsey GS, and on average, decreasing flows during the open water season (Water Regime, Section 4.3.2.4.3). MacLaren Plansearch (1989) speculated that fluctuations in the annual abundance of fish populations in Sipiwesk Lake in the post-LWR period may have been related to differences in water levels. MacKay et al. (1990) concluded that observed changes in the relative abundance of fish species in Sipiwesk Lake from 1966 to 1989 could not be assigned specifically to either the Kelsey GS or LWR since long-term effects of Kelsey GS were still manifesting themselves in the post-LWR period. Between 1983 and 1989, there were increases in the relative abundance of Northern Pike and Mooneye in experimental catches and decreases in Lake Whitefish and Cisco. The total CPUE fluctuated during this period, increasing from 46 fish/100 m/24 h in 1985 to 65 fish/100 m/24 h in 1987 and back down to 40 fish/100 m/24 h in 1989.
Habitat on Duck Lake was affected by LWR; similar to Cross Lake, seasonal flow patterns have changed and the range of water level fluctuations have increased under regulation (Water Regime, Section 4.3.2.3). There is no information on the fish community of the lake other than data from the commercial fishery (refer to People, Section 3.5.17 for more information). To mitigate the effects of LWR on fish populations in Cross Lake, a weir was constructed to raise the mean water level on Cross Lake (and Pipestone Lake) and reduce the range of water level fluctuations by allowing more water out of Cross Lake at higher flows. After completion of the weir, the mean monthly water level on Cross Lake increased to 1.8 ft (0.5 m) above the pre-LWR average and the seasonality of water levels more closely resembles natural conditions, although a seasonal flow reversal still occurs in low to average flow years (Water Regime, Section 4.3.2.3.3). Improved environmental conditions from the weir were predicted to result in a substantial increase in stock levels for all major species, in particular those important to the commercial and domestic fisheries, Northern Pike, Lake Whitefish, Walleye, and Cisco (Kroeker and Bernhardt 1993). A supplemental stocking program was initiated by MFB to supplement natural recruitment; Lake Whitefish were stocked annually from 1992 to 2004 (except in 1995 and 2002) and Walleye were stocked in 1991 and 1992. In total 163.7 million Lake Whitefish fry, 30.5 million eyed Lake Whitefish eggs, and 16.5 million Walleye fry were stocked in Cross Lake. Increases in Lake Whitefish were not expected to show up in the commercial or domestic harvests for at least five to seven years after construction of the weir and accompanying stocking program (Kroeker and Bernhardt 1993).
Post-weir monitoring has shown that overall fish populations in Cross Lake have remained relatively stable since the weir was constructed, but Lake Whitefish and Cisco populations are still very low and have not returned to historic levels. The abundance of Cisco in Pipestone Lake was substantially higher in fall samples (2004, 2006, 2007) compared to summer samples, indicating that the lake continues to provide important spawning habitat for the species (Gallagher and MacDonell 2008). The effects of the weir on Lake Whitefish and Walleye are discussed below in more detail (Sections 5.3.3.3.2 and 5.3.3.3.3).

REGIONAL CUMULATIVE EFFECTS ASSESSMENT – PHASE II WATER – FISH COMMUNITY
DECEMBER 2015 5.3-43
Total CPUE has continued to fluctuate annually on Cross Lake since the weir was constructed in 1991. In the east basin, the highest values (~100 fish/100 m/24 h) occurred in 1993 and 2006 and lowest values (~30 fish/100 m/24 h) in 2000 and 2007. There was less variation in the annual catches in the west basin, with values ranging from 30 to 58 fish/100 m/24 h. For the past five years (2009–2013), the total CPUE has consistently been in the lower range, which corresponds to a wetter period compared to studies conducted in the 1980s, which were conducted during a prolonged dry period. Since 2009, flows in the Nelson River as recorded at the Jenpeg GS have been above the 95th percentile for at least two weeks during or in close proximity to index gillnetting sampling studies (based on information provided in Water Regime, Chapter 4.3). It is not known to what extent changes in the capture rate of fish in gill nets is due to changes in flow since other factors (e.g., differences in methods that have not been identified) may also be important.
While the relative abundance of other species has fluctuated considerably since construction of the weir, the proportion of Northern Pike has increased in both basins of Cross Lake and in Pipestone Lake. The fish community in Pipestone Lake is considerably less diverse since the weir as indicated by a decrease in the diversity index. In the east basin of Cross Lake, the last two survey years (2006 and 2007) had the lowest diversity values on record. In contrast, there has been little change in the diversity of the west basin since the construction of the weir.
As described in Water Regime, Section 4.3.2.3.1, water levels on Walker Lake have been influenced by water levels on Cross Lake more frequently since LWR began – water levels on Walker Lake are only influenced by LWR when water levels on Cross Lake exceed 681 ft (207.6 m). Catch-per-unit-effort on Walker Lake was 66 fish/100 m/24 h in 1981 when water levels were unaffected by Cross Lake. In 2010 and 2013 Walker Lake was affected by water levels on Cross Lake; CPUE was 31 fish/100 m/24 h. It is not known to what extent changes in fish abundance on Walker Lake have been affected by LWR, the weir, or wetter conditions in the post-LWR period.
Factor: Effects of Changes to Sedimentation and Water Quality
As described in Erosion and Sedimentation (Section 4.4.2), impoundment of the Kelsey GS in 1960 increased shoreline erosion and nearshore sedimentation on Sipiwesk Lake. Extreme water level fluctuations on the lake resulted in peatland disintegration throughout the lake. No erosion problems were reported on Cross Lake following LWR. Considerable erosion impacts occurred on Cross Lake in 2011 resulting from record high water levels due to high runoff in the drainage basin. Construction of the weir, which increased average water levels on Cross Lake, may have increased erosion rates on shorelines that are susceptible to erosion at high water levels (Erosion and Sedimentation, Section 4.4.3.2.2).The 2011 flood also resulted in the formation of a new channel at the outlet of Duck Lake that was expected to result in the introduction of a considerable amount of sediment and debris into Sipiwesk Lake. The effects of changes to fish habitat on fish stocks is discussed in the previous section.
A downward trend was observed in both TSS and turbidity at the outlet of Sipiwesk Lake between the initiation of sample collection in 1972 and the early 1990s and TSS was significantly lower in two post-LWR periods (1977–1986 and 1987–1992) relative to pre-LWR. This temporal trend may be a reflection of changes in shoreline erosion over time, though information is insufficient to assign cause to this observation. Significant and increased rates of erosion in Sipiwesk Lake have been documented after
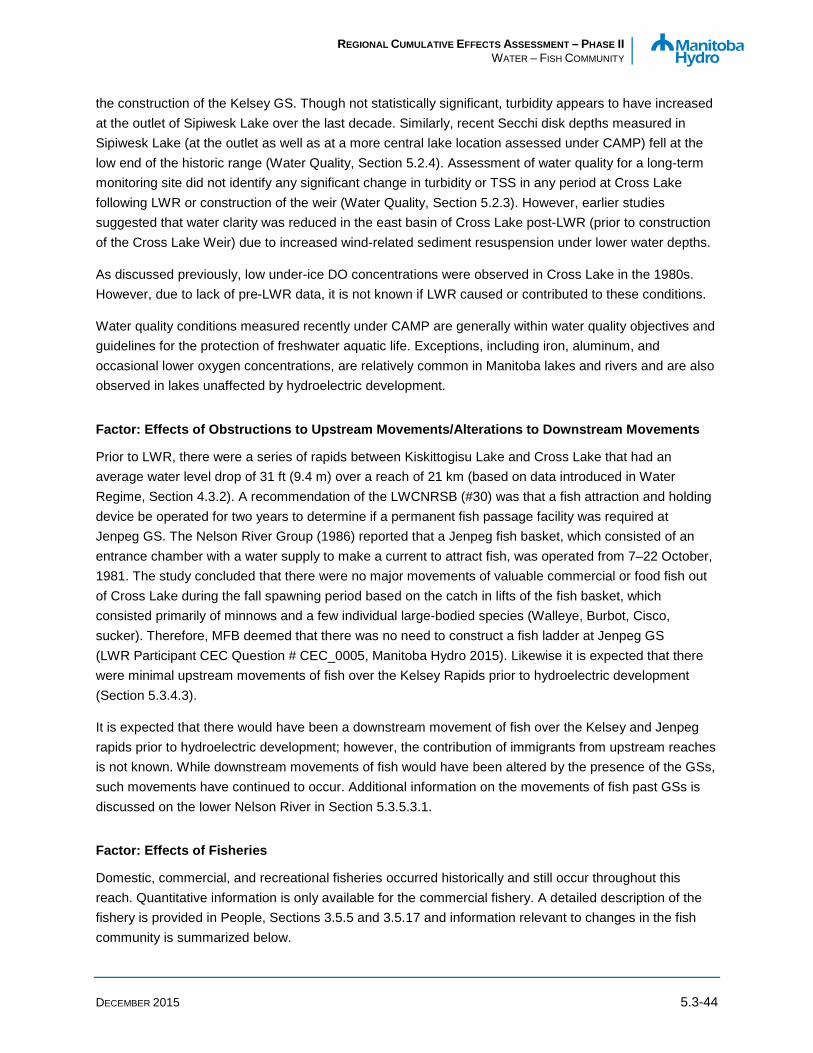
REGIONAL CUMULATIVE EFFECTS ASSESSMENT – PHASE II WATER – FISH COMMUNITY
DECEMBER 2015 5.3-44
the construction of the Kelsey GS. Though not statistically significant, turbidity appears to have increased at the outlet of Sipiwesk Lake over the last decade. Similarly, recent Secchi disk depths measured in Sipiwesk Lake (at the outlet as well as at a more central lake location assessed under CAMP) fell at the low end of the historic range (Water Quality, Section 5.2.4). Assessment of water quality for a long-term monitoring site did not identify any significant change in turbidity or TSS in any period at Cross Lake following LWR or construction of the weir (Water Quality, Section 5.2.3). However, earlier studies suggested that water clarity was reduced in the east basin of Cross Lake post-LWR (prior to construction of the Cross Lake Weir) due to increased wind-related sediment resuspension under lower water depths.
As discussed previously, low under-ice DO concentrations were observed in Cross Lake in the 1980s. However, due to lack of pre-LWR data, it is not known if LWR caused or contributed to these conditions.
Water quality conditions measured recently under CAMP are generally within water quality objectives and guidelines for the protection of freshwater aquatic life. Exceptions, including iron, aluminum, and occasional lower oxygen concentrations, are relatively common in Manitoba lakes and rivers and are also observed in lakes unaffected by hydroelectric development.
Factor: Effects of Obstructions to Upstream Movements/Alterations to Downstream Movements
Prior to LWR, there were a series of rapids between Kiskittogisu Lake and Cross Lake that had an average water level drop of 31 ft (9.4 m) over a reach of 21 km (based on data introduced in Water Regime, Section 4.3.2). A recommendation of the LWCNRSB (#30) was that a fish attraction and holding device be operated for two years to determine if a permanent fish passage facility was required at Jenpeg GS. The Nelson River Group (1986) reported that a Jenpeg fish basket, which consisted of an entrance chamber with a water supply to make a current to attract fish, was operated from 7–22 October, 1981. The study concluded that there were no major movements of valuable commercial or food fish out of Cross Lake during the fall spawning period based on the catch in lifts of the fish basket, which consisted primarily of minnows and a few individual large-bodied species (Walleye, Burbot, Cisco, sucker). Therefore, MFB deemed that there was no need to construct a fish ladder at Jenpeg GS (LWR Participant CEC Question # CEC_0005, Manitoba Hydro 2015). Likewise it is expected that there were minimal upstream movements of fish over the Kelsey Rapids prior to hydroelectric development (Section 5.3.4.3).
It is expected that there would have been a downstream movement of fish over the Kelsey and Jenpeg rapids prior to hydroelectric development; however, the contribution of immigrants from upstream reaches is not known. While downstream movements of fish would have been altered by the presence of the GSs, such movements have continued to occur. Additional information on the movements of fish past GSs is discussed on the lower Nelson River in Section 5.3.5.3.1.
Factor: Effects of Fisheries
Domestic, commercial, and recreational fisheries occurred historically and still occur throughout this reach. Quantitative information is only available for the commercial fishery. A detailed description of the fishery is provided in People, Sections 3.5.5 and 3.5.17 and information relevant to changes in the fish community is summarized below.
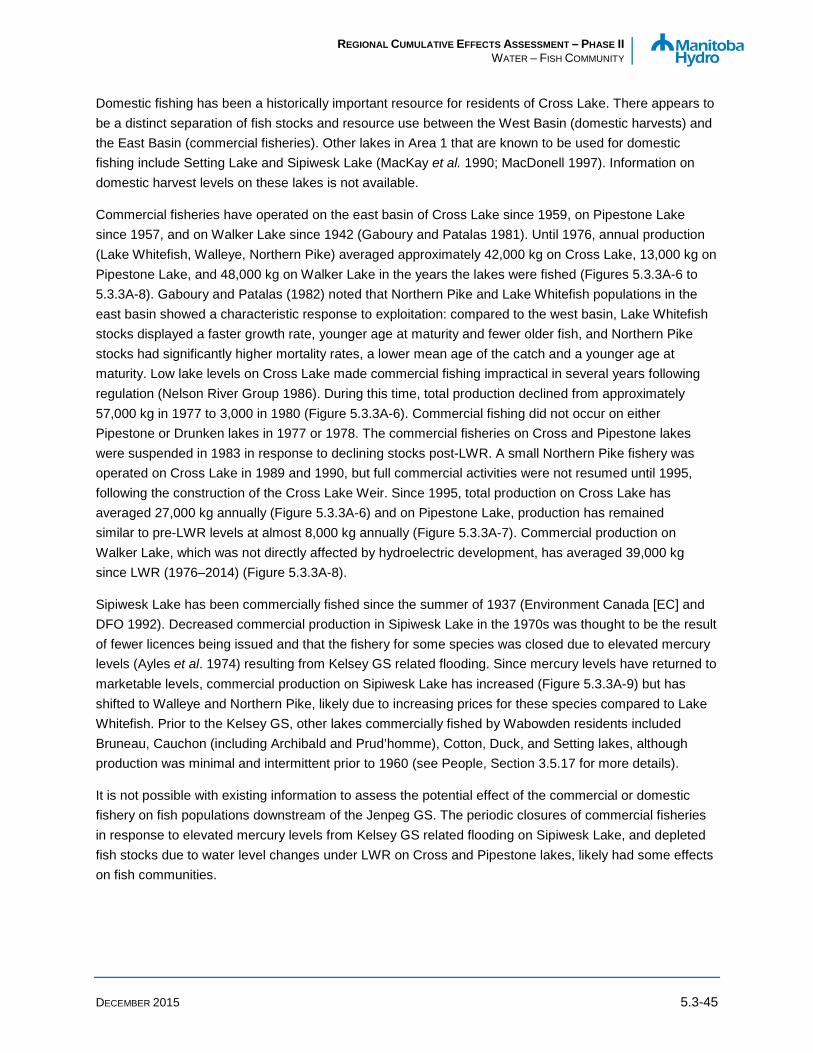
REGIONAL CUMULATIVE EFFECTS ASSESSMENT – PHASE II WATER – FISH COMMUNITY
DECEMBER 2015 5.3-45
Domestic fishing has been a historically important resource for residents of Cross Lake. There appears to be a distinct separation of fish stocks and resource use between the West Basin (domestic harvests) and the East Basin (commercial fisheries). Other lakes in Area 1 that are known to be used for domestic fishing include Setting Lake and Sipiwesk Lake (MacKay et al. 1990; MacDonell 1997). Information on domestic harvest levels on these lakes is not available.
Commercial fisheries have operated on the east basin of Cross Lake since 1959, on Pipestone Lake since 1957, and on Walker Lake since 1942 (Gaboury and Patalas 1981). Until 1976, annual production (Lake Whitefish, Walleye, Northern Pike) averaged approximately 42,000 kg on Cross Lake, 13,000 kg on Pipestone Lake, and 48,000 kg on Walker Lake in the years the lakes were fished (Figures 5.3.3A-6 to 5.3.3A-8). Gaboury and Patalas (1982) noted that Northern Pike and Lake Whitefish populations in the east basin showed a characteristic response to exploitation: compared to the west basin, Lake Whitefish stocks displayed a faster growth rate, younger age at maturity and fewer older fish, and Northern Pike stocks had significantly higher mortality rates, a lower mean age of the catch and a younger age at maturity. Low lake levels on Cross Lake made commercial fishing impractical in several years following regulation (Nelson River Group 1986). During this time, total production declined from approximately 57,000 kg in 1977 to 3,000 in 1980 (Figure 5.3.3A-6). Commercial fishing did not occur on either Pipestone or Drunken lakes in 1977 or 1978. The commercial fisheries on Cross and Pipestone lakes were suspended in 1983 in response to declining stocks post-LWR. A small Northern Pike fishery was operated on Cross Lake in 1989 and 1990, but full commercial activities were not resumed until 1995, following the construction of the Cross Lake Weir. Since 1995, total production on Cross Lake has averaged 27,000 kg annually (Figure 5.3.3A-6) and on Pipestone Lake, production has remained similar to pre-LWR levels at almost 8,000 kg annually (Figure 5.3.3A-7). Commercial production on Walker Lake, which was not directly affected by hydroelectric development, has averaged 39,000 kg since LWR (1976–2014) (Figure 5.3.3A-8).
Sipiwesk Lake has been commercially fished since the summer of 1937 (Environment Canada [EC] and DFO 1992). Decreased commercial production in Sipiwesk Lake in the 1970s was thought to be the result of fewer licences being issued and that the fishery for some species was closed due to elevated mercury levels (Ayles et al. 1974) resulting from Kelsey GS related flooding. Since mercury levels have returned to marketable levels, commercial production on Sipiwesk Lake has increased (Figure 5.3.3A-9) but has shifted to Walleye and Northern Pike, likely due to increasing prices for these species compared to Lake Whitefish. Prior to the Kelsey GS, other lakes commercially fished by Wabowden residents included Bruneau, Cauchon (including Archibald and Prud’homme), Cotton, Duck, and Setting lakes, although production was minimal and intermittent prior to 1960 (see People, Section 3.5.17 for more details).
It is not possible with existing information to assess the potential effect of the commercial or domestic fishery on fish populations downstream of the Jenpeg GS. The periodic closures of commercial fisheries in response to elevated mercury levels from Kelsey GS related flooding on Sipiwesk Lake, and depleted fish stocks due to water level changes under LWR on Cross and Pipestone lakes, likely had some effects on fish communities.

REGIONAL CUMULATIVE EFFECTS ASSESSMENT – PHASE II WATER – FISH COMMUNITY
DECEMBER 2015 5.3-46
5.3.3.3.2 Lake Whitefish
INDICATOR: ABUNDANCE
Metric: Catch-Per-Unit-Effort
A comparison of standardized CPUE values for Lake Whitefish (see Appendix 5.3.1B for analysis methods) from standard gang index gill nets set over the course of four decades in each of five waterbodies downstream of the Jenpeg GS shows a decreasing trend (Figure 5.3.3A-10). The median values for sets in the past two decades are considerably lower than the lower quartile of sets in the 1980s. In the 1980s, the mean CPUE of Lake Whitefish varied from about 1 fish/100 m/24 h in Pipestone and Sipiwesk lakes, 3 fish/100 m/24 h in the west basin of Cross Lake, to 6 fish/100 m/24 h in the east basin of Cross Lake. By the 2000s/2010s, these means were 1.5 in the east basin of Cross Lake, and less than 0.5 in the west basin and Pipestone Lake. No Lake Whitefish were captured in index gill nets set in Sipiwesk Lake or the upper Nelson River in 2011. Annual mean CPUE values in Walker Lake have shown a similar decline as observed in on-system lakes, with means decreasing from 1.5 fish/100 m/24 h in the 1980s to 0.1 fish/100 m/24 h in the 2010s. In Setting Lake, the mean CPUE of Lake Whitefish has ranged from 0.4 fish/100 m/24 h in the 2000s to 1.8 fish/100 m/24 h in the 2010s.
Because of differences in methods (see Section 5.3.3.2), CPUE could not be calculated in the same way for the pre-project gillnetting data collected in 1965/1966 and 1973 in Cross Lake and Sipiwesk Lake. A comparison of the number of Lake Whitefish captured per overnight set in both Cross Lake (basins combined) and Sipiwesk Lake shows that the production of the species has declined over time (Figure 5.3.3A-2). In Cross Lake, whitefish production averaged nine fish/overnight sets over the early sampling years (1966, 1973, 1980), three to four fish/overnight set in the 1980s and 1990s, to one fish in the 2000s. Whitefish production in Sipiwesk Lake ranged from about one to three fish/overnight set from 1966–1988, but have been particularly low in the two more recent sampling years at 0.3 fish/overnight set in 1989 and zero fish/overnight set in 2011.
The discussion section that follows looks at the contribution of several potential factors to the observed changes in Lake Whitefish CPUE over time in concert with the results of the other indicators.
INDICATOR: CONDITION
Metric: Fulton’s Condition Factor (KF)
The annual condition of Lake Whitefish captured in lakes downstream of the Jenpeg GS has varied considerably over a period of four decades (Figure 5.3.3A-11). The condition of Lake Whitefish from Cross and Pipestone lakes has been relatively consistent over time, with KF values being slightly higher in the east basin of Cross Lake and Pipestone Lake (decadal mean ranged from 1.65–1.77) compared to the west basin (range 1.50–1.67). The mean condition of Lake Whitefish in Sipiwesk Lake was 1.68 in the 1980s; but no fish were captured in standard gangs with which to compare condition in more recent surveys. Lake Whitefish from Walker Lake have shown a decrease in condition over time with mean condition values of 1.73 in the 1980s and 1.32 in the 2010s. The condition of Lake Whitefish captured in Setting Lake in the 2000s and 2010s was similarly low at 1.43 and 1.38, respectively.
REGIONAL CUMULATIVE EFFECTS ASSESSMENT – PHASE II WATER – FISH COMMUNITY
DECEMBER 2015 5.3-47
The discussion section that follows looks at potential factors to explain the observed changes in Lake Whitefish condition over time in concert with the results of the other indicators such as growth.
INDICATOR: GROWTH
Metric: von Bertalanffy Model
Insufficient numbers of Lake Whitefish were captured in waterbodies sampled under CAMP to compare the recent growth of fish from on-system to off-system lakes. A plot of the von Bertalanffy growth curves shows that there was little difference among lakes sampled in the 1980s (Figure 5.3.3A-12). It appears that whitefish from Cross Lake took longer time to reach the theoretical maximal length (i.e., had lower k values) in the 1990s and 2000s compared to the 1980s (Figure 5.3.3A-13; Table 5.3.3A-1).
The discussion section that follows looks at potential factors to the observed changes in Lake Whitefish size at age over time in concert with the results of the other indicators.
Metric: Relative Year Class Strength
The RYCS of Lake Whitefish in three lakes downstream of the Jenpeg GS, where sufficient numbers were collected, is shown in Figure 5.3.3A-14. Since construction of LWR started (1973), stronger year classes (> 100) occurred in Cross Lake in five of 12 (east basin) and six of 16 (west basin) years. Weak year classes (< 50) occurred in the west basin in 1975, and 1980; the 1980 year class was also weak in the east basin, as were the 1984 and 1985 year classes. In Sipiwesk Lake, strong year classes (> 100) occurred in four out of nine years and a particularly weak year class (< 50) occurred in 1984. The 1983 cohort was particularly strong for all three lakes.
DISCUSSION: FACTORS AFFECTING LAKE WHITEFISH OVER TIME
Lake Whitefish were not a common component of the catch in experimental gill nets set in Sipiwesk Lake in 1966, when they accounted for 3% of the total catch (Schlick 1968a). Studies conducted in 1973 showed that Lake Whitefish production (per overnight set of 3, 3.75, 4.25, 4.75, and 5.25 inch 50-yard panels) was higher in Cross Lake (23 fish per overnight set) compared to Sipiwesk Lake (six fish per overnight set) prior to LWR (from Table 3.2 in Ayles et al. 1974). Catches in both lakes were higher in the 1973 survey than in those conducted by the province in Cross Lake in 1965 (15 fish per overnight set) and in Sipiwesk Lake in 1966 (two fish per overnight set).
Current monitoring programs on waterbodies downstream of the Jenpeg GS show that Lake Whitefish are not a common component of the fish community. Lake Whitefish account for less than 0.5% of annual catches in the west basin of Cross Lake and Walker Lake, and were not captured in either Sipiwesk Lake or downstream in the Nelson River in 2011. The CPUE is considerably higher in Setting Lake (2 fish/100 m/24 h), a nearby off-system lake on the Grass River, compared to Walker Lake (0.1 fish/100 m/24 h) or the west basin of Cross Lake (<0.1 fish/100 m/24 h). Only a single juvenile Lake Whitefish (90 g) has been captured in small mesh gillnets set by CAMP; this fish was captured in Setting Lake (CAMP unpubl. data).

REGIONAL CUMULATIVE EFFECTS ASSESSMENT – PHASE II WATER – FISH COMMUNITY
DECEMBER 2015 5.3-48
Changes to Lake Whitefish stocks in waterbodies downstream of the Jenpeg GS may be due to many factors, including changes to spawning habitat, spawning success, forage production, and/or seasonal migration patterns resulting from hydroelectric development, natural variability and/or other stressors such as commercial fishing. For a description of potential effects of climate and the introduction of Rainbow Smelt into the system, refer to the discussion in Area 2 (Section 5.3.4.3.1). The following sections provide discussion of the effects of the major stressors on Lake Whitefish stocks in the area.
Factor: Effects of Changes to the Water Regime and Other Factors on Fish Habitat
An assessment of the effects of the Kelsey GS on Lake Whitefish stocks in on-system waterbodies is hindered by the lack of the pre-hydroelectric development data (i.e., pre-1960) and early post-development data prior to LWR (i.e., 1960–1976).
The LWCNRSB predicted that under LWR there would be a reduction in the reproductive success of Lake Whitefish in Cross Lake due to the increase in the frequency and severity of water level declines during the spring and fall. Ayles et al. (1974) reported that commercial production had shifted away from Lake Whitefish to other species in Sipiwesk Lake since 1962. However, catches in experimental gangs were found to have increased between the 1966 and 1973 surveys to 9% of the total catch (percentage of comparative catch summarized in Table 3.2 in Ayles et al. 1974).
Studies conducted by the province in response to reports of catch declines by commercial and domestic fishers calculated that the production of Lake Whitefish on Cross Lake in 5.25 inch gillnets had declined from 35 fish/91 m/night in 1977 to nine in 1980 to four in 1981 (Gaboury and Patalas 1982). Likewise, catches in experimental gangs (1.5 to 5.25 inch panels) showed a 50% decline in the CPUE between the 1980 and 1981 surveys (Gaboury and Patalas 1982). These studies found an inverse relationship between the strength of Lake Whitefish year classes produced from 1971–1980 and water level drawdown on Cross Lake between spawning (late October) and hatching (end of May). Weak year classes were produced in years with marked winter or spring drawdown (e.g., 1977, 1980, 1981) and strong year classes in years with little drawdown (e.g., 1974, 1979) (Gaboury and Patalas 1984). The authors noted that these conditions did not occur on Walker since the lake’s water levels are regulated by a shallow rapids at its outlet (Gaboury and Patalas 1982). The Nelson River Group (1986) reported that drawdowns in excess of 2.5 ft (0.8 m) during the incubation period, which has been associated with whitefish egg mortality, occurred in five of the seven years between 1977 and 1983. However, the RYCS analysis indicates that over this period poor year classes were only produced in 1980 (Figure 5.3.3A-14).
Comparison of the metrics in the 1980s suggests Lake Whitefish stocks declined over the short-term in response to LWR. In the east basin, the CPUE was 12 fish/100 m/24 h in 1980, decreased to 3 fish/100 m/24 h in 1985 and 1986, and was 6 fish/100 m/24 h in 1987 and 1988. MFB noted that the east basin was too shallow to fish in 1989. In the west basin, the CPUE was 8 fish/100 m/24 h in 1980, ranged from 2 to 5 fish/100 m/24 h from 1981 to 1988, and was less than 1 fish/100 m/24 h in 1989. The RYCS analysis differs from earlier studies by the province (Gaboury and Patalas 1984) in which of the cohorts are identified as strong or weak. The separation of the basins in the current analysis may account for at least some of the differences among year class strength analyses. The 1980 cohort in both the east and west basins were particularly weak (< 50). Weak year classes were also produced in 1984 and 1985 in the east basin and in 1975 in the west basin. Strong cohorts (<100) were produced in the east basin in
REGIONAL CUMULATIVE EFFECTS ASSESSMENT – PHASE II WATER – FISH COMMUNITY
DECEMBER 2015 5.3-49
1974, 1975, 1979, 1981, and 1983, and in the west basin in 1970, 1974, 1976, 1982, 1983, and 1986. Despite drier conditions during the 1980s, strong cohorts were produced in at least five of the 10 years for which there is aging data (Figure 5.3.3A-14). Variations in year class strength does not appear to be related to extreme flow events as flows in the Nelson River at Jenpeg GS between 1970 and 1986 were not under the 5th or over the 95th percentile for a period of two weeks during the spawning or incubating period (based on data provided in Water Regime, Chapter 4.3).
Post-weir monitoring has shown that Lake Whitefish stocks in Cross Lake showed a marginal increase in both basins from 1995 to 1998, but otherwise have generally remained at levels observed at the start of monitoring. Only a few individual Lake Whitefish have been captured in Pipestone Lake since construction of the weir. Since construction of the weir, maximum CPUEs were observed in Cross Lake in 1997 and 1998 when CPUE was 5 to 6 fish/100 m/24 h in the east basin and 3 to 4 fish/100 m/24 h in the west basin, and less than 0.5 fish/100 m/24 h in Pipestone Lake. After 1998, CPUE values have been less than 3 fish/100 m/24 h in the east basin, with a record low of 0.1 fish/100 m/24 h observed in 2007 (the last survey year), less than 2 fish/100 m/24 h in the west basin, and less than 0.1 fish/100 m/24 h in Pipestone Lake. Kroeker and Graveline (1998) concluded that immigration of fish from locations upstream of the Jenpeg GS was not a major contributor to Lake Whitefish populations in Cross Lake. They determined that the pulse of Lake Whitefish in Cross Lake that occurred in late 1990s was not the result of fish being flushed in to Cross Lake via the Jenpeg GS spillway by summer spills of record magnitude that occurred in 1996 and 1997, since no Lake Whitefish were captured in the basins closest to the Jenpeg GS in these years.
The distribution of Lake Whitefish in the west basin of Cross Lake appears to have changed in response to the weir. Prior to 1995, most Lake Whitefish were captured from Whiskey Jack basin (west Cross Lake), which is a relatively deep part of the lake (Kroeker and Bernhardt 1993). Since this time, the proportion of Lake Whitefish has increased in the Middle Basin (west Cross Lake), suggesting that the weir may have improved conditions for the species in this part of the lake (Barth et al. 2001).
Larval fish sampling was conducted on Cross Lake in the spring of 1995 shortly after ice break up to determine if Lake Whitefish had spawned the previous fall (Bernhardt 1996a). The capture of larval whitefish indicated that successful spawning had occurred in the fall and that overwintering conditions were suitable for successful incubation. The majority of the larvae were captured in an area of channel and bays west of the community of Cross Lake, as well as in a channel downstream of the Jenpeg GS and the northern portion of the Jenpeg GS basin (Map 5.3.3A-3). No larvae were captured in Whiskey Jack, middle, or east basins.
Smaller mesh nets (0.7 to 4.7 inch panels) made with a finer material were set to target juvenile Lake Whitefish in Cross Lake from 1995 to 2006 (Bernhardt 1996a; Kroeker and Bernhardt 1997; Kroeker and Graveline 1998, 1999; Barth et al. 2001; MacDonell and Graveline 2002; MacDonald and MacDonell 2003, 2004; Johnson et al. 2005; Neufeld et al. 2006; Richardson and MacDonell 2007). Juvenile whitefish were only observed in small numbers in 1995 and 1996. Bernhardt (1996a) speculated that the low recruitment of Lake Whitefish post-weir could be a result of stocking rates and natural recruitment being too low to be detected in gillnet catches, or that spawning habitat affected by LWR was not restored by the weir. The author also indicated that high levels of predation on young Lake Whitefish could be occurring prior to recruitment to the fishery; however, dietary studies of Northern Pike and Walleye at the

REGIONAL CUMULATIVE EFFECTS ASSESSMENT – PHASE II WATER – FISH COMMUNITY
DECEMBER 2015 5.3-50
time did not indicate that Lake Whitefish were a significant component of either species’ diet (Kroeker and Bernhardt 1997). More recently, small mesh nets (16, 20, 25 mm) set as part of CAMP in west Cross Lake have failed to yield any juvenile Lake Whitefish, which suggests that there is still little recruitment occurring in the lake (Caskey and MacDonell 2010).
The continued low capture rate of Lake Whitefish suggests that the stocking program has not measurably increased the population and the increase in water levels generated by the weir do not appear to be overriding other factors (e.g., introduction of Rainbow Smelt, the re-opening of the commercial fishery). Although mitigation efforts have not contributed to a recovery of Lake Whitefish stocks on Cross Lake, they may be contributing to the maintenance of stocks in the face of continued fishing pressure.
Factor: Effects of Changes to Sedimentation and Water Quality
Refer to earlier discussion for fish community (Section 5.3.3.3.1).
Factor: Effects of Obstructions to Upstream Movements/Alterations to Downstream Movements
Refer to earlier discussion for fish community (Section 5.3.3.3.1).
Factor: Effects of Fisheries
Lake Whitefish is an important species to local harvesters; however, there is limited information on domestic harvesting levels (refer to People, Sections 3.5.5 and 3.5.17 for more information). Lake Winnipeg Regulation detrimentally impacted the domestic fishery on the west basin of Cross Lake by reducing Lake Whitefish stocks and reducing fishing efficiency (e.g., increasing gill net fouling and reducing shoreline access). Even after effects on Cross Lake were mitigated by the construction of the weir, there continues to be a shortage of Lake Whitefish for domestic consumption.
The commercial fisheries on Walker, Cross, and Pipestone lakes produced an average of 35,000 kg, 34,000 kg, and 5,000 kg of Lake Whitefish, respectively, in the years they were fished from their commencement until 1975 (Figures 5.3.3A-6 to 5.3.3A-8). Lake Whitefish accounted for greater than 70% of the catches at Walker and Cross Lake catches during this period, while the Pipestone fishery alternated between Walleye dominant winter and Lake Whitefish dominant summer seasons. Gaboury and Patalas (1982) noted that Lake Whitefish populations in the east basin of Cross Lake showed a characteristic response to exploitation compared to the west basin; stocks from the east basin displayed a faster growth rate, younger age at maturity and fewer older fish. As discussed previously for fish communities, commercial production on Cross Lake decreased sharply after LWR and the fishery was suspended in 1983 in response to declining stocks, particularly Lake Whitefish. Since commercial fishing has resumed following construction of a weir on Cross Lake, production of Lake Whitefish has averaged approximately 3,000 kg annually (1995–2014), with the species accounting for approximately 10% of the total harvest (Figure 5.3.3A-6). As discussed earlier, a significant reduction of stocks in the east basin of Cross Lake coincided with increased commercial harvests. In Pipestone Lake, approximately 5,000 kg of Lake Whitefish were harvested in 1995 when the commercial fishery resumed, but the species has essentially disappeared from commercial catches since that year (Figure 5.3.3A-7). While commercial harvests on Walker Lake remained relatively consistent after LWR, the production of Lake Whitefish
REGIONAL CUMULATIVE EFFECTS ASSESSMENT – PHASE II WATER – FISH COMMUNITY
DECEMBER 2015 5.3-51
decreased considerably, averaging approximately 6,000 kg annually (1976–2014), as catches of Walleye and Northern Pike have increased (Figure 5.3.3A-8).
Lake Whitefish production has declined in Sipiwesk Lake since the commercial fishery commenced in 1945. Whitefish production on Sipiwesk Lake (and surrounding lakes) averaged 9,000 kg annually prior to the construction of the Kelsey GS (1945–1959) and 16,000 kg prior to LWR (1960–1975) (Figure 5.3.3A-9). The closure of the fishery on Sipiwesk Lake in the 1970s due to mercury contamination from Kelsey GS related flooding did not apply to Lake Whitefish. Once mercury levels returned to marketable levels in the 1980s to the early 1990s, production in Sipiwesk Lake shifted in favour of Walleye and Northern Pike, likely in response to increasing prices for these species. Since 2000, the total Lake Whitefish harvest from Sipiwesk Lake has averaged less than 1,000 kg annually despite increases in total harvests (Figure 5.3.3A-9). A similar decline in Lake Whitefish production has occurred in Cauchon, Duck, and Bruneau lakes (refer to People, Section 3.5.17 for more information).
It is not possible with existing information to assess the potential effect of the commercial or domestic fishery on Lake Whitefish stocks downstream of the Jenpeg GS. It is not known how changes in fishing pressure (e.g., closures, shifts in species targeted) have interacted with environmental changes to fish habitat, resulting from hydroelectric development, to affect whitefish stocks.
5.3.3.3.3 Walleye
INDICATOR: ABUNDANCE
Metric: Catch-Per-Unit-Effort
A comparison of standardized CPUE values for Walleye (see Appendix 5.3.1B for analysis methods) from standard gang index gill nets set over the course of four decades in each of five waterbodies downstream of the Jenpeg GS is shown in Figure 5.3.3A-15. The capture rate of Walleye was highest in the east and west basins of Cross Lake in the 1980s (32 and 22 fish/100 m/24 h, respectively), after which the mean CPUE has shown a decreasing trend. The capture rate of Walleye in the west basin has been relatively stable since the 1990s, with mean decadal values ranging from 11 to 14 fish/100 m/24 h. In the 2000s the mean CPUE in the east basin declined sharply to 9 fish/100 m/24 h; Walleye stocks have not been assessed in the east basin more recently. In contrast, Walleye capture rates in Pipestone Lake have been relatively constant, with decadal means increasing slightly from 9 fish/100 m/24 h in the 1980s to 11 fish/100 m/24 h in the 2000s. Walleye CPUE in Sipiwesk Lake was the lowest of the on-system lakes examined, ranging from 6 fish/100 m/24 h in the 1980s to 2 fish/100 m/24 h in 2011. Walleye are more abundant in the reach of the Nelson River downstream of Sipiwesk Lake, where the mean CPUE in 2011 was 11 fish/100 m/24 h. The mean CPUE for Walleye in the on-system waterbodies in the most recent decade falls within the range of the mean CPUE in two off-system lakes, Walker Lake (6 fish/100 m/24 h) and Setting Lake (16 fish/100 m/24 h) (Figure 5.3.3A-15).
Because of differences in methods (see Section 5.3.3.2), CPUE could not be calculated in the same way for the pre-project gillnetting data collected in 1965/1966 and 1973 in Cross Lake and Sipiwesk Lake. A comparison of the number of Walleye captured per overnight set in Cross Lake (basins combined) shows that the pre-project production of Walleye (19 fish/overnight set in 1965 and 14 fish/overnight set in 1973)

REGIONAL CUMULATIVE EFFECTS ASSESSMENT – PHASE II WATER – FISH COMMUNITY
DECEMBER 2015 5.3-52
are within the range of values observed from 1980 to 2007 (Figure 5.3.3A-2). Walleye production was particularly high in 1988 and 1991 (33 and 44 fish/overnight set), after which it declined sharply and has remained between 6 and 14 fish/overnight set since 1994. Likewise, fish production in Sipiwesk Lake observed prior to LWR (2 fish/overnight set in 1966 and 5 fish/overnight set in 1973) is within the range observed post-project (1 fish/overnight set in 2011 to 6 fish/overnight set in 1985).
The discussion section that follows looks at the contribution of selected potential factors to the observed changes in Walleye abundance over time.
INDICATOR: CONDITION
Metric: Fulton’s Condition Factor (KF)
There was considerable variation in the annual condition of Walleye in Cross Lake and Pipestone Lake over four decades; however, the decadal means were generally similar, ranging from 1.13 to 1.22 (Figure 5.3.3A-16). The condition of Walleye from Sipiwesk Lake was considerably higher in 2011 (1.33) than it was in the 1980s and 1990s (1.12, 1.14), and is similar to values observed downstream in the Nelson River (1.32). The mean condition factors for Walleye captured in the 2010s in nearby off-system lakes, Walker Lake (1.12) and Setting Lake (1.14) are within the range of those in Cross and Pipestone lakes.
INDICATOR: GROWTH
Metric: von Bertalanffy Model
Growth curves were calculated only for decades in which Walleye were aged using otoliths. There was little difference in the growth of Walleye from the west basin of Cross Lake from the 1980s to 2010s, but there were considerable differences in the growth of Walleye from Sipiwesk Lake over this period (Figure 5.3.3A-17). The difference in the curves between decades could be a function of the small sample size of Walleye captured in 2011, or a function of differences in the age structure of the catch. In 2011, none of the Walleye captured were older than eight years; whereas, in the 1980s Walleye as old as 29 years were captured, with approximately 10% of the catch older than 15 years.
A plot of the von Bertalanffy growth curves shows that there were a few differences among lakes sampled in the 1980s (Figure 5.3.3A-18). It appears that Walleye from Walker Lake took a longer time to reach the theoretical maximal length (i.e., had lower k values) compared to the other lakes and obtained a larger L∞ (Table 5.3.3A-1). Walleye from Sipiwesk Lake attained a smaller L∞ compared to the lakes farther upstream. There continues to be variation in the von Bertalanffy growth curves for Walleye stocks sampled by CAMP (Figure 5.3.3A-18). The growth of Walleye in Walker Lake is similar to that in the west basin of Cross Lake and the upper Nelson River. However, compared to the lakes, the Nelson River stocks consist of more older fish (> 15 years). As observed in lakes upstream of the Jenpeg GS, Walleye from Setting Lake are smaller at a given age during the early years compared to fish from on-system lakes. Although the model predicts a considerably higher L∞ (i.e., maximal length) for Setting Lake, compared to on-system waterbodies where Walleye between 500 and 600 mm were reasonably well
REGIONAL CUMULATIVE EFFECTS ASSESSMENT – PHASE II WATER – FISH COMMUNITY
DECEMBER 2015 5.3-53
represented in the catch, the maximum size of Walleye captured in Setting Lake was 510 mm, with very few fish exceeding 475 mm.
Metric: Relative Year Class Strength
An index of the relative year class strength of Walleye for four lakes downstream of the Jenpeg GS is shown in Figure 5.3.3A-19. In Cross Lake, the historical year class index determined from fish captured from 1980–1989 indicated that particularly weak year classes (< 50) occurred in the west basin in 1976, 1977, and 1979, and in the east basin in 1977 and 1978. Particularly strong year classes (~200) occurred in alternating years over the subsequent 5-year period. Strong cohorts (~100 or greater) were produced in Sipiwesk Lake in each year from 1973 to 1977, after which the strength of year classes alternated, as observed in Cross Lake.
The more recent data shows a similar pattern of RYCS in the west basin of Cross Lake and Setting Lake, whereby strong cohorts (> 100) have been produced in four year out of eight. Weaker year classes occurred in both lakes in 2003, 2004, 2006, and 2007.
DISCUSSION: FACTORS AFFECTING WALLEYE OVER TIME
Walleye were not a common component of the catch in experimental gill nets set in Sipiwesk Lake in 1966, accounting for 6% of the total catch (Schlick 1968a). Walleye captured were quite large, averaging 1.5 pounds (680 g). Ayles et al. (1974) reported that there has been a shift in commercial production toward Walleye since 1962. Walleye catches in experimental gangs1 were found to have increased by 250% between the 1966 and 1973 surveys, which they felt was at least partly attributed to a reduction in fishing pressure (Ayles et al. 1974) after the closure of the commercial Walleye fishery in the early 1970s and 1980s due to increased mercury levels in response to Kelsey GS flooding (refer to Fish Quality, Section 5.6.2 for more information). Baseline studies conducted in 1973 show that Walleye production (per overnight set of 3, 3.75, 4.25, 4.75, and 5.25 inch panels) was higher in Cross Lake (27 fish per overnight set) compared to Sipiwesk Lake (11 fish per overnight set) prior to LWR (see Table 3.2 in Ayles et al. 1974). Catches in Sipiwesk Lake had increased since a 1966 survey (three fish per overnight set), but had decreased in Cross Lake (38 fish per overnight set). The mean weight of Walleye captured in the 1973 survey (1.4 pounds [635 g]) was similar to that observed in the previous survey.
The results of monitoring programs conducted in the 2010s indicate that Walleye are a common species in several waterbodies downstream of the Jenpeg GS, accounting for 30% of the index gill net catch in the west basin of Cross Lake and 50% of catches in the upper Nelson River; however, they are infrequently captured in Sipiwesk Lake (< 5%). Catch-per-unit-effort for the species in the west basin and the Nelson River (11 fish/100 m/24 h) are within the range observed in two off-system lakes in the area,
1 Ayles et al. (1974) present CPUE values in Table 3.2 for the same mesh sizes — they were not included in the metric analysis because duration was not recorded and were missing 2 inch panel used in later studies.

REGIONAL CUMULATIVE EFFECTS ASSESSMENT – PHASE II WATER – FISH COMMUNITY
DECEMBER 2015 5.3-54
Walker Lake (6 fish/100 m/24 h) and Setting Lake (16 fish/100m/24 h), while those in Sipiwesk Lake are lower (2 fish/100 m/24 h). Juvenile Walleye (> 120 mm, 75 g) have been captured in small mesh gill nets set in the west basin of Cross Lake and the two off-system lakes, but not in Sipiwesk Lake or the Nelson River (CAMP unpubl. data).
Changes in Walleye stocks in waterbodies downstream of the Jenpeg GS may be due to many factors, including changes to spawning habitat, spawning success, forage production, and/or seasonal migration patterns resulting from hydrological development, natural selection and/or other stressors such as commercial fishing. For a description of potential effects of climate and the introduction of Rainbow Smelt into the system refer to the discussion in Area 2 (Section 5.3.4.3.1). The following sections provide discussion of the effects of the major stressors on Walleye stocks in the area.
Factor: Effects of Changes to the Water Regime and Other Factors on Fish Habitat
An assessment of the effects of the Kelsey GS on Walleye stocks in on-system waterbodies is hindered by the lack of the baseline data.
The LWCNRSB anticipated that the impacts of LWR on Walleye stocks in Cross Lake would include a small positive effect from increased winter water levels, and a small negative effect from increased water level fluctuations. In addition, the Black Duck Creek CS and Diversion Channel was predicted to have negative effects to Walleye populations in Drunken Lake and the Minago River system as a result of alterations of the water regime of Black Duck Creek and erosion and sedimentation in the creek and Drunken Lake (Koshinsky 1973).
Studies conducted by the province in response to reports of catch declines by commercial and domestic fishers reported that water level drawdown in the summer and a severe winterkill from an early and unusually rapid drawdown in March 1981 had reduced the standing crop of Walleye in Cross Lake (Gaboury and Patalas 1984). Walleye were also observed congregating below known spawning tributaries in May 1981 that were made inaccessible by low water levels (Gaboury and Patalas 1984).
Comparison of the annual CPUE in the 1980s suggests that there were changes to Walleye stocks over the short-term in response to LWR. In the east basin, the mean CPUE decreased from 56 fish/100 m/24 h in 1980 to 15 fish/100 m/24 in 1981, presumably in response to the March winterkill, and remained low through to 1987 (range 12–28 fish/100 m/24 h), when the CPUE rebounded to 57 fish/100 m/24 h in 1988. MFB technicians noted that the east basin was too shallow to fish in 1989 (MFB unpubl. data). Weak year classes produced in 1977 and 1978 may have contributed to low CPUE in the mid-1980s since they would be of size to be recruited into the gear. Despite the winterkill experienced in 1981, the 1981 cohort was particularly strong. On the west basin, the annual CPUE ranged from 20 to 26 fish/100 m/24 h in 1980 and 1981, decreasing to 11 fish/100 m/24 h in 1985 and 1986, after which it rebounded, ranging from 21 to 40 fish/100 m/24 h between 1987 and 1989. As observed in the east basin, the decline in the mid-1980s may have been a result of the winterkill or to weak cohorts produced in 1976, 1977, and 1979. The response of Walleye to the construction of the weir in 1991 is discussed in the following section.

REGIONAL CUMULATIVE EFFECTS ASSESSMENT – PHASE II WATER – FISH COMMUNITY
DECEMBER 2015 5.3-55
Farther downstream in Sipiwesk Lake, the CPUE of Walleye was lower in 2011 (2 fish/100 m/24 h) compared to values in the 1980s (annual means ranging from 3 to 8 fish/100 m/24 h). The MFB technicians conducting the gillnetting in 2011 believed that catches were skewed because fish were accessing flooded bush habitat resulting from record high flows that year that were impossible to fish (MFB unpubl. data). There has also been a considerable change in biometric parameters over the long-term. The condition of Walleye captured was higher in 2011 (KF = 1.33) compared to previous decades (annual means ranging from 1.09 to 1.16). The average weight of Walleye captured was considerably higher (1,002 g) compared to earlier studies (635–680 g; Ayles et al. 1974; Schick 1968a). There are fewer larger, older fish in recent catches compared to catches shortly after LWR came into operation. It is difficult to partition the contribution of LWR to these changes compared to other concurrently acting factors such as the ongoing impacts from the Kelsey GS, effects from the commercial fishery (discussed below) and an increase in Rainbow Smelt in the diet.
It is difficult to assess the effects of construction of the weir in 1991 on Walleye stocks in Cross and Pipestone lakes because of other factors that were co-occurring. At the same time Walleye were responding to habitat changes brought about by the weir, stocks were being affected by an increase in commercial harvesting in the east basin following a 12-year suspension (as discussed in People, Section 3.5.5) and the effects of the establishment of Rainbow Smelt, which are particularly abundant in the west basin.
Post-weir monitoring in the east basin of Cross Lake reported consistent catches of Walleye over the short term (1993–1996) as were observed the previous decade (1980–1988), with average CPUE of 32 fish/100 m/24 h. However, in 1997 there was a sharp decline in the CPUE of Walleye, after which catches remained low. The mean CPUE declined from 28 fish/100 m/24 h in the 1990s to 9 fish/100 m/24 h in the 2000s. These declines have been attributed to poor reproduction of weak 1991 and 1992 year classes, combined with the re-opening of the Walleye fishery on the east basin in 1995 (Gallagher and MacDonell 2008). Because surveys were not conducted in the east basin in the 2010s, it is not known whether this trend has continued.
In comparison, Walleye catches on the west basin of Cross Lake and Pipestone Lake have been relatively stable over the course of the post-weir monitoring. On the west basin, CPUE averaged 13 fish/100 m/24 h in the 1990s, 14 fish/100 m/24 h in the 2000s, and 11 fish/100 m/24 h in the 2010s, with annual average values ranging from 7 to 20 fish/100 m/24 h over this period. The CPUE of Walleye in the west basin does not appear to be related to flows in a given year since the average CPUE was the same (8-9 Walleye/100 m/24 h) when extreme drought and flood conditions occurred on the Nelson River in 2003 and 2011 (Water Regime, Chapter 4.3). On Pipestone Lake, the mean CPUE was 10 fish/100 m/24 h in the 1990s and 11 fish/100 m/24 h in the 2000s, with annual values ranging from 7 to 16 fish/100 m/24 h over this period. It is not known how much immigration from Playgreen Lake via the east channel of the Nelson River may be contributing to Walleye stocks in Pipestone and Cross lakes. The strength of year classes produced after 2001 in the west basin of Cross Lake has been similar to those produced in Setting Lake, an off-system lake. This suggests that effects of LWR on Walleye recruitment have likely been mitigated by the weir and that differences in year class strength are attributable to other factors.
REGIONAL CUMULATIVE EFFECTS ASSESSMENT – PHASE II WATER – FISH COMMUNITY
DECEMBER 2015 5.3-56
Factor: Effects of Changes to Sedimentation and Water Quality
Refer to earlier discussion for fish community (Section 5.3.3.3.1).
Factor: Effects of Obstructions to Upstream Movements/Alterations to Downstream Movements
Refer to earlier discussion for fish community (Section 5.3.3.3.1).
Factor: Effects of Fisheries
Fisheries in waterbodies downstream of the Jenpeg GS were previously described with respect to the fish community. Walleye were less important historically to the domestic fishery than were Lake Whitefish. There is little information on harvest levels of Walleye for domestic purposes.
Prior to hydroelectric development, Walleye typically composed a smaller proportion of the total commercial production on Cross, Pipestone (summer season only), Bruneau, Duck, and Sipiwesk lakes, but were a more important component on Walker, Pipestone (winter season only), and, in particular, Cauchon lakes. The fisheries on Walker, Cross (east basin), and Pipestone lakes produced an annual average of approximately 10,000 kg, 6,000 kg, and 1,000 kg of Walleye, respectively, from their commencement until 1975 (Figures 5.3.3A-6 to 5.3.3A-8). As discussed previously for fish communities, commercial production on Cross Lake decreased sharply after LWR; on Cross Lake, Walleye production declined from approximately 12,000 kg in 1976 to less than 2,000 kg in 1980 (Figure 5.3.3A-6). The fisheries on Cross and Pipestone lakes were suspended in 1983 in response to declining stocks. Commercial fishing resumed in 1995, four years after the construction of a weir on Cross Lake, after which production has averaged approximately 12,000 kg of Walleye annually (1995–2014) (Figure 5.3.3A-6). Decreases in the CPUE of Walleye on the east basin of Cross Lake in the 2000s have likely been influenced by the re-opening of the commercial fishery in 1995. Similar results have been noted for Pipestone Lake (Figure 5.3.3A-6). While commercial harvests on Walker Lake remained relatively consistent after LWR, the production of Walleye has increased considerably, averaging approximately 17,000 kg annually (1976–2014) (Figure 5.3.3A-8). Increasing prices for Walleye have been a major factor in changing commercial fishing targets in lakes (MDNRc 1991).
Prior to the completion of the Kelsey GS in 1960, commercial production of Walleye on Sipiwesk Lake averaged about 4,000 kg annually (Figure 5.3.3-9) and production was minimal and intermittent on other nearby lakes (see People, Section 3.5.17 for more details on these lakes). Decreased commercial production in Sipiwesk Lake over the period from 1968 to 1973 was the result of fewer licences being issued and the closure of the fishery for Walleye due to elevated mercury levels during the 1970s (Ayles et al. 1974). The closure of the fishery may account for higher CPUE values in the 1980s, as well as differences in biological characteristics such as the increased age of fish. Periodic restrictions due to mercury levels were also placed on the Walleye caught and the size of fish taken from other lakes in the area, including Duck, Bruneau lakes (MacKay et al. 1990), and Cauchon Lake (Derksen 1978). Once mercury levels returned to marketable levels in the 1980s to the early 1990s, production in Sipiwesk Lake shifted in favour of Walleye, likely in response to increasing prices. Since 1980, the total Walleye harvest from Sipiwesk Lake has averaged less than 22,000 kg annually (Figure 5.3.3A-9).
REGIONAL CUMULATIVE EFFECTS ASSESSMENT – PHASE II WATER – FISH COMMUNITY
DECEMBER 2015 5.3-57
As with Lake Whitefish, it is not possible with existing information to assess the potential effect of the commercial or domestic fishery on Walleye stocks downstream of the Jenpeg GS. It is not known how changes in fishing pressure (e.g., closures, shifts in species targeted) have interacted with environmental changes to fish habitat, resulting from hydroelectric development, to affect these stocks.
5.3.3.4 Cumulative Effects of Hydroelectric Development on the Fish Community from the Jenpeg Generating Station to the Kelsey Generating Station
Fish habitat in the reach of the Nelson River between the Jenpeg GS and the Kelsey GS was first altered by hydroelectric development with the construction of the Kelsey GS between 1958 and 1961. The types of effects experienced by fish populations in response to hydroelectric development in the area vary between waterbodies depending on the type of physical changes that occurred.
The effects of LWR on the fish community of Cross, Pipestone, and Drunken lakes are primarily related to the alteration of seasonal flows (i.e., increased winter flows and decreased average summer flows) and an increase in the range of water level fluctuations. A weir was constructed at the outlet of Cross Lake in 1991 to raise the average water level on Cross Lake and Pipestone Lake and reduce the range of water levels. Farther downstream, fish stocks were affected by the combined effects of the Kelsey GS and associated infrastructure, which increased water levels on the upper Nelson River and its associated lakes up to and including Sipiwesk Lake, and a seasonal reversal of flows caused by regulation in low to average flow years. Duck Lake was isolated from the effects of the Kelsey GS backwater by the presence of Duck Lake Falls, but water levels on the lake are impacted by LWR. Hydroelectric development on the upper Nelson River also resulted in a loss of aquatic habitat in the footprint of the generating stations and created a barrier to upstream fish movements through the Jenpeg and Kelsey GSs, although it is not known to what extent fish were able to ascend the rapids at either of these two sites prior to hydroelectric development.
The main concerns expressed to Manitoba Hydro by residents of Cross Lake related to the effects of hydroelectric development are related to a reduction in fish populations, particularly Lake Whitefish that are the preferred fish for domestic use by Elders, decreased access in summer and winter (particularly prior to the weir), fish kills in winter (prior to the weir), and a decline in the quality of fish harvested (taste, texture, mercury).
It is difficult to separate the effects of hydroelectric development in the area from the effects of other factors also affecting fish populations, including socio-economic factors (e.g., fish prices, fishing effort), the introduction of Rainbow Smelt, and climate, among others. As well, an assessment of the effects of LWR on fish populations in several waterbodies downstream of the Jenpeg GS is confounded by the limited amount of information on fish populations prior to hydroelectric development. Where there is a good record of survey data (e.g., Cross Lake, Pipestone Lake), differences in methods limit the ability to make comparisons among studies.
Cross Lake was one of the lakes most negatively affected by LWR prior to the construction of the weir. After LWR, fish populations, particularly Lake Whitefish (and Cisco) declined substantially. The effects on

REGIONAL CUMULATIVE EFFECTS ASSESSMENT – PHASE II WATER – FISH COMMUNITY
DECEMBER 2015 5.3-58
Pipestone Lake are thought to have been similar, but to a lesser extent. The declines in fish abundance were attributed to a number of factors: • water level drawdowns under regulation that reduced fish habitat during summer;
• the timing of periodic dewatering of spawning areas resulted in reduced spawning success and recruitment of fall spawning species (e.g., Lake Whitefish);
• fish kills that occurred when water levels were particularly low, such as occurred during March 1981; and
• low water levels during spring that prevented spring spawning species (e.g., Walleye) from accessing spawning habitat.
Construction of the weir substantially reduced the water level effects on Cross and Pipestone lakes and stocking of Lake Whitefish and, to a limited extent, Walleye, was conducted between 1992 and 2004 to supplement natural recruitment. Post-weir monitoring has shown that the overall fish community in Cross Lake has stabilized since the weir was constructed; however, Lake Whitefish populations continue to be low relative to those pre-LWR. Aside from a marginal increase in both basins in 1996–1998, Whitefish stocks have otherwise remained at levels observed immediately following completion of the weir. Despite over 20 years of post-weir monitoring on Cross and Pipestone lakes, and the examination of numerous potential factors inhibiting the recovery of Lake Whitefish, the reason that populations did not recover remains unknown and may be a combination of several factors (e.g., effects on spawning habitat, predator barriers, pressure from commercial fishing etc.). Walleye populations in the east basin declined sharply in 1997, after which catches have remained low. These declines may be attributable to poor reproduction of a weak 1991 and 1992 year class combined with re-opening of the Walleye fishery on east Cross Lake in 1995. By comparison, catches in the west basin of Cross Lake and Pipestone Lake have been relatively stable over this period.
Because Sipiwesk Lake has been affected by both LWR and Kelsey GS, it is difficult to distinguish the effects of each project on the fish community. Flooding of Sipiwesk and surrounding lakes from Kelsey GS increased the amount of lacustrine habitat and fragmented available riverine habitat. Based on surveys conducted shortly after Sipiwesk became a reservoir, there appears to have been a shift in the dominant commercial species from Lake Whitefish to Northern Pike and an increase in the abundance of Goldeye. In low to average flow years, LWR results in a reversal of the seasonal water level pattern on the lake, increasing winter flows at Kelsey GS, and on average, decreasing flows during the open water season. The mean CPUE measured in Sipiwesk Lake in 2011 is similar to that observed in the 1980s, with White Sucker dominating the catches in both periods. However, compared to earlier studies, species such as Mooneye/Goldeye, Lake Whitefish, and Cisco are virtually absent from catches in the recent survey.
The fish community in the west basin of Cross Lake is currently monitored annually and Sipiwesk and Walker lakes are monitored on a rotational basis as part of CAMP to determine the overall health of the waterbodies and what changes, if any, are occurring in areas affected by Manitoba Hydro’s operations. At present, the large-bodied fish assemblage in both Cross and Walker lakes is dominated by White Sucker, Walleye, and Northern Pike. Cisco are also common in Walker Lake. Catches in standard gang index gill nets set in Sipiwesk Lake comprise about half White Sucker, followed by Sauger and Northern Pike. Spottail Shiner and Yellow Perch are the dominant forage species in Cross and Walker lakes, while

REGIONAL CUMULATIVE EFFECTS ASSESSMENT – PHASE II WATER – FISH COMMUNITY
DECEMBER 2015 5.3-59
Emerald Shiner and Troutperch are common in Sipiwesk Lake. Rainbow Smelt are uncommon in small mesh nets set in Cross Lake and Sipiwesk Lake and were not detected in Walker Lake. The CPUE in standard gang index gill nets in Cross, Walker, and Sipiwesk lakes are similar, but are lower compared to those in Playgreen and Little Playgreen lakes.

REGIONAL CUMULATIVE EFFECTS ASSESSMENT – PHASE II WATER – FISH COMMUNITY
DECEMBER 2015 5.3-60
5.3.4 Area 2: Kelsey Generating Station to Kettle Generating Station including the Burntwood River downstream of First Rapids Reach
Area 2 comprises the Nelson River from downstream of the Kelsey GS to the estuary at Hudson Bay, as well as tributary waterbodies: the discussion of the fish community considers this area in two reaches, divided at the Kettle GS (Map 5.3.4-1). The reach of Area 2 considered in this section is bounded on the upstream end by the Kelsey GS and extends through Split Lake, Clark Lake, Gull Lake, and Stephens Lake (the reservoir of the Kettle GS) to the Kettle GS (Map 5.3.4A-1). Construction of the Keeyask GP, just downstream of Gull Lake, began in 2014. This reach also includes the Burntwood River below First Rapids to Split Lake. Other major tributaries in this reach (which are not directly affected by hydroelectric development) include the Aiken River, which flows into the southern portion of Split Lake, the Assean River, which flows from Assean Lake to the eastern portion of Split Lake, and the North and South Moswakot rivers, which flow into the north arm of Stephens Lake. Prior to the mid-1960s, the Butnau River flowed into the Nelson River upstream of Kettle Rapids, but it was diverted as part of the development of the Kettle GS.
A description of the construction and operation of hydroelectric developments in the Kelsey GS to Kettle GS reach of the Nelson River is found in Part II Hydroelectric Development Project Description in the Region of Interest. A detailed description of effects of hydroelectric development to the water regime is provided in Water Regime (Chapter 4.3). Key points of the project description and water regime information relevant to fish and fish habitat are summarized below.
The first effects of hydroelectric development in this area occurred as a result of the construction of the Kelsey GS at Kelsey Rapids on the Nelson River (1958–1961). Flooding extended upstream to Sipiwesk Lake. Habitat downstream of Kelsey Rapids was altered because the GS bypassed a section of the existing river channel and changed the direction of flow in comparison to natural conditions. Until 1976, the GS passed all inflow as it was received and did not typically affect downstream water levels or velocities. Beginning in 1977, the GS began cycling 10–15% of the time, typically when flows were lower. Cycling typically results in about a 1.5 ft (0.5 m) variation in water level immediately downstream of the GS, with the largest variations up to 2.5 ft (0.8 m). Effects are reduced farther downstream and by Split Lake effects are typically reduced to about 0.1 ft (0.03 m). During 1994–2014, cycling has occurred less than 5% of the time. The Kelsey GS was re-runnered during the period 2006–2013. Re-runnering reduced the required amount of spill at the GS by increasing the capacity of the turbines.
Lake Winnipeg Regulation (LWR) affected inflows to Split Lake via the Nelson River. Construction activities (e.g., instream work on cofferdams) are not expected to have affected Split Lake due to the number of lakes between the construction work and Split Lake. The reduction in outflow from Lake Winnipeg due to the construction of cofferdams in the west channel of the Nelson River during summer and fall 1973 would have reduced the inflow to Split Lake during this time, and potentially affected habitat downstream of the Kelsey GS.
REGIONAL CUMULATIVE EFFECTS ASSESSMENT – PHASE II WATER – FISH COMMUNITY
DECEMBER 2015 5.3-61
With the opening of the Two-Mile Channel in mid-1976, regulation of flows out of Lake Winnipeg began. The monthly average discharge at the Kelsey GS pre- and post-LWR shows that LWR increased winter flows. Although LWR can also increase flows during the open water season under flood conditions, the available record indicates that, on average, LWR decreased open water flow. Long-term average flow, which is not affected by hydroelectric development, is approximately 89,000 cfs (2,520 cms) in the pre-LWR period (1951–1976) and 78,000 cfs (2,210 cms) in the post-LWR period (1977–2013).
The CRD affected inflows to Split Lake via the Burntwood River. Changes during construction are not expected to have notably affected Split Lake, though the blocking of the Rat River in May 1974 to November 1975 at the Notigi CS reduced inflows and potentially affected habitat in the Burntwood River below First Rapids. Average flows in the Burntwood River downstream of First Rapids would have been temporarily reduced by about 30%. Diversion of the Churchill River began in mid-1976 and increased flows would have reached Split Lake several weeks later.
The CRD has increased flows in the Burntwood River from a long-term average of approximately 4,000 cfs to 30,000 cfs (110 cms to 850 cms). The CRD increased the total inflow to Split Lake by about 32% and also changed flow patterns due to the large increase in inflow from the Burntwood River. Operation of the CRD underwent testing and annual adjustments and was not consistent until the Augmented Flow Program was fully established by 1986.
The average Split Lake water level was 547.4 ft (166.8 m) pre-CRD/LWR. Post-CRD/LWR, the average Split Lake water level is 1.2 ft (0.4 m) higher at 548.6 ft (167.2 m). Water levels on average are approximately four feet higher during winter while average levels during summer are similar pre- and post-regulation. The seasonal pattern was changed post-CRD/LWR as average winter water levels are now typically higher than average summer water levels. However, during flood years peak water levels still occur during the summer, resulting in highly variable conditions during summer. The change in seasonal flow distribution and the increase in flow also occurred in the waterbodies downstream of Split Lake to the Kettle GS.
The Kettle GS was the second station built on the Nelson River and the first on the lower Nelson River. It affected fish habitat in the reach of the river extending to Gull Rapids and possibly affected upstream movements of fish over Gull Rapids, but effects are not expected to have extended farther upstream. It flooded 221 km2 (85.3 sq mi) in the reach of the Nelson River and tributaries between Gull Rapids and Kettle Rapids. The Butnau control dam was built in the mid-1960s to block the inflow of the Butnau River into the future reservoir. Flow was redirected into the Kettle River and discharged downstream of the Kettle GS. Construction of the GS began in 1966 and was completed in 1974. Impoundment occurred prior to the first unit in service in December 1970. Operation of the GS causes daily and weekly water level changes on the reservoir (Stephens Lake) within an operating range of 3 m, though typically water levels vary within 2 m annually and less than 1 m within a week. Effects to the Nelson River downstream of the Kettle GS, as well as effects to the Kettle and Butnau watersheds, are discussed in Section 5.3.5.
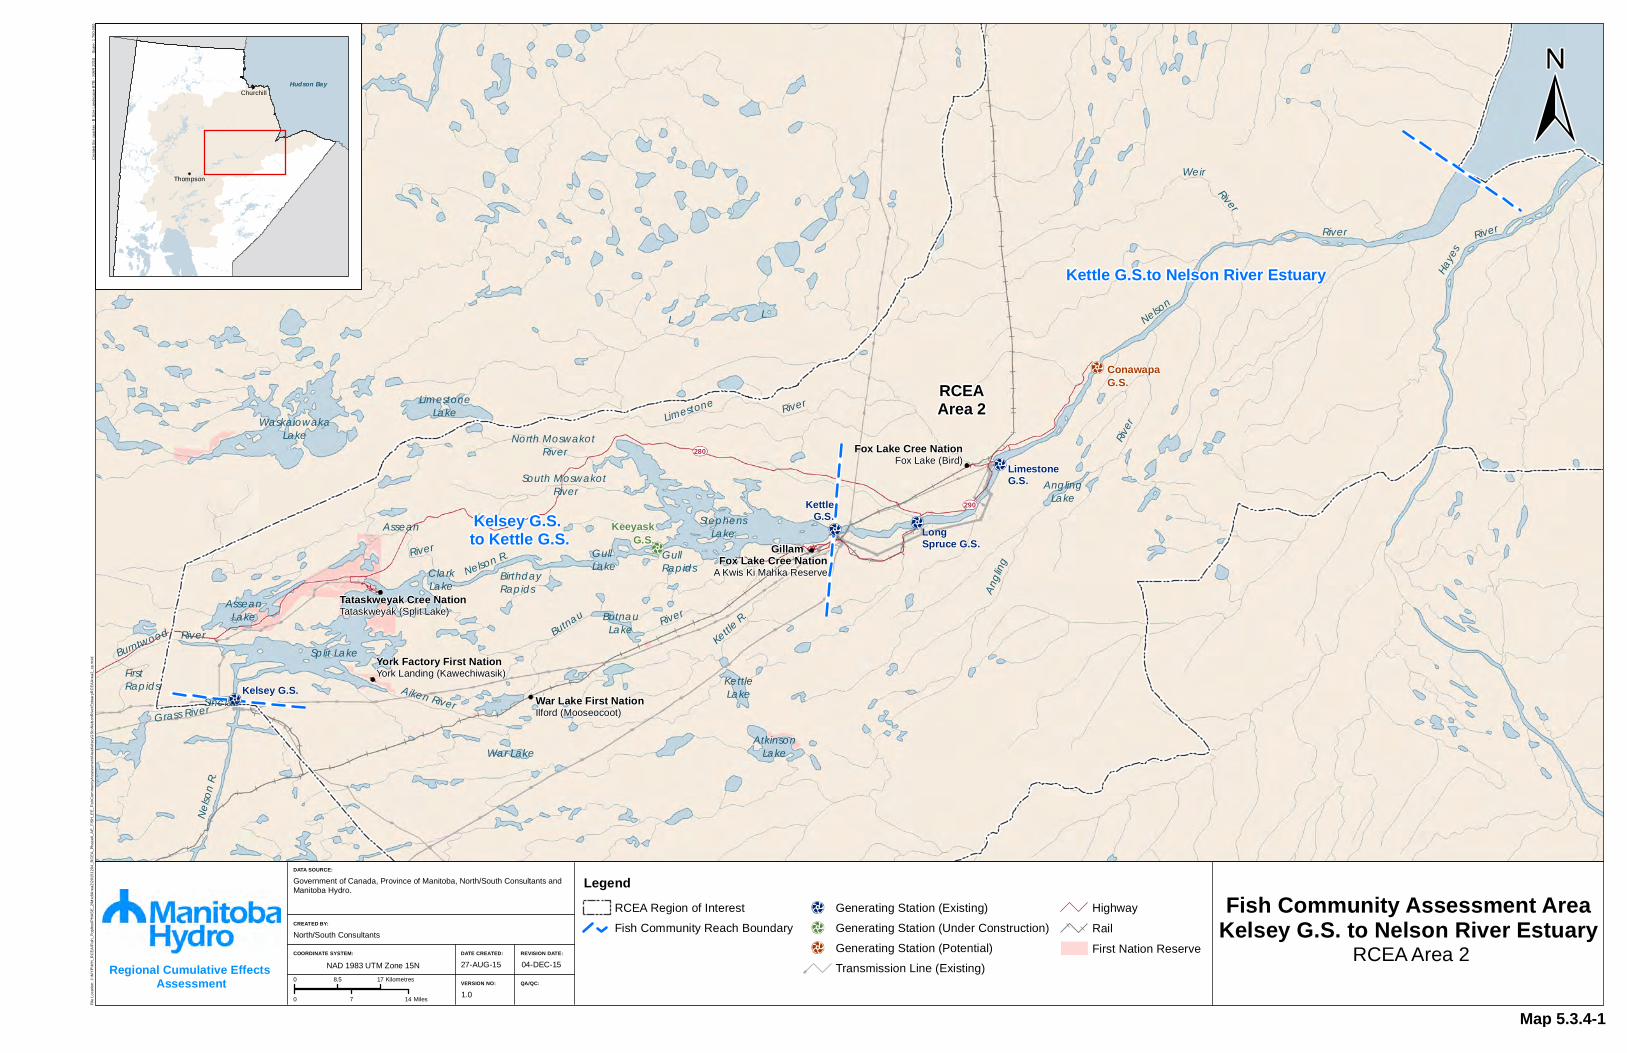
Fish Community Assessment AreaKelsey G.S. to Nelson River Estuary
RCEA Area 2
Government of Canada, Province of Manitoba, North/South Consultants andManitoba Hydro.
North/South Consultants
1.0
27-AUG-15
LegendRCEA Region of Interest
Fish Community Reach Boundary
Generating Station (Existing)
Generating Station (Under Construction)
Generating Station (Potential)
Transmission Line (Existing)
Highway
Rail
First Nation Reserve04-DEC-15
Kelsey G.S.
LongSpruce G.S.
LimestoneG.S.
KettleG.S.
KeeyaskG.S.
ConawapaG.S.
290
280
Fox Lake Cree NationA Kwis Ki Mahka Reserve
York Factory First NationYork Landing (Kawechiwasik)
Fox Lake Cree NationFox Lake (Bird)
War Lake First NationIlford (Mooseocoot)
Tataskweyak Cree NationTataskweyak (Split Lake)
Lake
SetteeLake
ChristieL
First Rapids
AsseanLake
LakeThomas
LHolmes
South Moswakot River
WaskaiowakaLake
River
SinclairAiken River
Split Lake
Assean
ClarkLake
LimestoneLake
Nelson R.BirthdayRapids
Kettle R.
War Lake
Burntwood
Nelso
n R.
ButnauLakeButnau
GullLake
North Moswakot River
LL
Limestone
StephensLake
River
Grass River
AtkinsonLake
KettleLake
River
Weir
Angli
ng
GullRapids
River
AnglingLake
River
River
Haye
s
Nelson
River
River
Gillam
Kettle G.S.to Nelson River Estuary
Kelsey G.S. to Kettle G.S.
Cre
ated
By:
cpa
rker
- B
Siz
e La
ndsc
ape
BTB
- M
AR
201
5
Sca
le: 1
:750
,000
Regional Cumulative Effects Assessment
NAD 1983 UTM Zone 15N
0 7 14 Miles
0 8.5 17 Kilometres
File
Loc
atio
n: J
:\MY
P\M
H_R
CE
A\F
ish_
Pop
ltns\
PH
AS
E_2
\Mxd
\Are
a2\2
0151
204_
RC
EA
_Pha
seII_
AE
_FIS
H_E
E_F
ishC
omm
unity
Ass
essm
entA
reaK
else
yGS
toN
elso
nRiv
erE
stua
ryR
CE
AA
rea2
_cp.
mxd
DATA SOURCE:
DATE CREATED:
CREATED BY:
VERSION NO:
REVISION DATE:
QA/QC:
COORDINATE SYSTEM:
RCEAArea 2
Hudson Bay
Thompson
Churchill
Map 5.3.4-1

REGIONAL CUMULATIVE EFFECTS ASSESSMENT – PHASE II WATER – FISH COMMUNITY
DECEMBER 2015 5.3-63
5.3.4.1 Key Published Information No scientific data for the Split Lake fish community are available prior to the construction of the Kelsey GS. Manitoba Fisheries Branch collected the earliest data available for Split Lake in 1966 (Schlick 1968b). Scientific data collection did not begin downstream of Split Lake until after the construction of the Kettle GS. The LWCNRSB conducted fish population studies in Split Lake and the newly formed Stephens Lake (reservoir of the Kettle GS) in 1973 (Crowe 1973; Ayles et al. 1974). Post-CRD/LWR studies were conducted in Split and Stephens lakes during the 1980s under the MEMP (Patalas 1984a; Kirton 1986; Hagenson 1987a, b, 1988, 1989, 1990; Derksen et al. 1988).
A large number of studies were conducted in Split Lake and its major tributaries during the 1990s and 2000s. Studies in 1997 and 1998 were conducted by the Tataskweyak Environmental Monitoring Agency (TEMA) (Fazakas and Lawrence 1998; Fazakas 1999; Kroeker 1999; Lawrence et al. 1999; Lawrence and Cooley 1999; Mota and MacDonell 2000; Volume 3, Split Lake Cree-Manitoba Hydro Joint Study Group 1996) and later work was conducted by Manitoba Hydro and the Keeyask Hydropower Limited Partnership (KHLP) (Barth and Mochnacz 2004; Dunmall et al. 2004; Holm and Remnant 2004; Remnant et al. 2004; Johnson 2005; Holm 2005; Maclean and Holm 2005; Maclean and Pisiak 2005; Mochnacz et al. 2004; Johnson and Maclean 2007a, b; KHLP 2012a). These studies were compiled to form the environmental baseline for the Split Lake area for the Keeyask GP and are collectively referred to as the Keeyask studies.
Manitoba Hydro and the KHLP have conducted numerous fish community studies in the Nelson River downstream of Clark Lake and in Stephens Lake and its tributaries since 1999 as part of environmental assessment studies for the Keeyask GP (Remnant and Barth 2003; Barth et al. 2003a, b, 2004; Pisiak et al. 2004; Hartman and Bretecher 2004; Remnant et al. 2004; Holm et al. 2005; Kroeker and Jansen 2005; Pisiak 2005a, b; Pisiak and Hartman 2005; Richardson and Holm 2005; Johnson and Parks 2005; Murray et al. 2005; Holm 2006, 2007a, b, c, 2009, 2010a, b, 2011, 2013; Bretecher et al. 2007; Johnson 2007; MacDonald 2007; Murray and Barth 2007; Cassin and Remnant 2008; Michaluk et al. 2011; KHLP 2012a) and supporting infrastructure (Mazur and Savard 2008; KHLP 2009; Koga 2013). These studies are also collectively referenced as the Keeyask GP studies. Studies have continued in the Kelsey GS to Kettle GS reach as part of the on-going monitoring related to the Keeyask GP.
Both Split and Stephens lakes are currently monitored as part of Manitoba/Manitoba Hydro’s CAMP. Split Lake is monitored annually and Stephens Lake is monitored on a three year rotational basis. Results of the pilot program (2008–2010) were reported in 2014 (CAMP 2014) and a report summarizing results of the first three years of full monitoring (2011–2013) is currently being prepared. Wherever relevant, raw data from CAMP monitoring to 2013 has been incorporated into this assessment.
5.3.4.2 New Information and/or Re-analysis of Existing Information Although there were some differences in sample site selection and timing of programs, the MEMP studies in the mid-1980s, the Keeyask GP studies from the late 1990s/early 2000s, and the current CAMP work are sufficiently similar to provide the basis for a comparative analysis spanning almost three decades.

REGIONAL CUMULATIVE EFFECTS ASSESSMENT – PHASE II WATER – FISH COMMUNITY
DECEMBER 2015 5.3-64
Differences in methods between gillnetting studies conducted in 1966 and 1973 and later studies prevent full comparison. The 1966 and 1973 studies used a different mesh size configuration (3, 3.75, 4.25, 4.75, and 5.25 inch) and 50 yard long panels while the standard gangs used in later studies were 25 yard long panels with mesh sizes of 2, 3, 3.75, 4.25, and 5 inch. In order to compare the studies, an additional metric was calculated in which the MEMP, Keeyask GP, and CAMP data were modified to include only the 3, 3.75, 4.25 and 5 inch mesh sizes. The 5 inch mesh catch was doubled to account for the 4.75 and 5.25 inch used in 1966 and 1973. Duration was not taken into account for this comparison as the earlier studies were overnight set; therefore, any of the more recent data for which sets were beyond 24 hours were removed from the analysis. The sets were standardized to 100 m and values were calculated for total, Lake Whitefish and Walleye catch per overnight set.
The comparative analysis of data to determine the changes in the fish community over time focussed on Split and Stephens lakes as these are the largest lakes in the region, support (in particular Split Lake) commercial, domestic, and recreational fisheries, and have fish community information collected over several decades. Data from Assean Lake were used where available to represent an off-system reference lake. The reach of the Nelson River between Clark Lake and Gull Rapids (where the Keeyask GP is currently being constructed) was not subject to detailed analysis due to its small size. Substantial information was collected during the environmental studies for the Keeyask GP and this reach is the focus of an environmental effects monitoring program to address effects of the Keeyask GP.
5.3.4.3 Changes in the Fish Community and Focal Species over Time
Available data were grouped into three periods: 1983–1989; 1997–2002, and 2009–2013. As noted in the following discussion, not all years in each interval are represented in each analysis (e.g., the Assean Lake fish community is represented by sampling from 2001 and 2002).
As discussed in the preceding section, a limited comparison was conducted to data collected in 1966 and 1973.
5.3.4.3.1 Fish Community
INDICATOR: ABUNDANCE
Metric: Catch-Per-Unit-Effort
Catch-per-unit-effort was calculated for all species (i.e., the total catch) captured in standard gangs set in Split, Stephens, and Assean lakes (Maps 5.3.4A-2, 5.3.4A-3, 5.3.4A-4, and 5.3.4A-5).
An overnight catch per set was calculated using the modified mesh sizes described in Section 5.3.4.2 for all available Split Lake data, to compare to the limited data from 1966 and 1973 (Figure 5.3.4A-1). Overnight catch per set for both 1966 and 1973 were nearly identical (28 and 27 respectively). During 1983–1989, the mean overnight catch per set was 36 and ranged from 23 in 1983 to 51 in 1988. The mean overnight catch per set for data during 1997–2002 was 28, however, it ranged from 16 in 1998 to 51 in 1999. Currently (2009–2013), the mean overnight catch per set is 32, ranging from 28 to 36. Based
REGIONAL CUMULATIVE EFFECTS ASSESSMENT – PHASE II WATER – FISH COMMUNITY
DECEMBER 2015 5.3-65
on this analysis, which used very limited data from 1966 and 1973, and only a portion of the data from later periods, there was no marked change in the total numbers of fish in Split Lake.
Catch-per-unit-effort was calculated for the 1980s, late 1990s/early 2000s, and current conditions for total catch; however, due to durations not being recorded in 1997 and 1998 those years were omitted. In the1980s, the mean total CPUE was 61 fish/100 m/24 h and ranged from a minimum of 40 fish/100 m/24 h in 1984 to a maximum of 86 fish/100 m/24 h in 1988 (Figure 5.3.4A-2). During 1999-2002, the mean total CPUE was 72 fish/100 m/24 h, varying from 66 fish/100 m/24 h in 1999 to 79 fish/100 m/24 h fish in 2001. Currently, the mean total CPUE is 33 fish/100 m/24 h and the annual mean CPUE ranged from 24 fish/100 m/24 h in 2013 to 39 fish/100 m/24 h in 2011 and 2012. Current catches are notably lower than those in the 1980s and late 1990s/early 2000s.
To determine whether the difference in sampling design between MEMP (1983–1989) and later studies was biasing results1, a subset of 12 MEMP sites per year was selected, based on proximity to sites in either the Keeyask GP or CAMP studies (Map 5.3.4A-3). CPUE for all the original sites and the reduced sites was compared and found to be very similar (Figure 5.3.4A-3); therefore, the difference in sampling design does not appear to be causing a large bias in the total CPUE.
During a limnological survey of Stephens Lake in 1972, a single gill net consisting of seven 25-yard panels yielded an overnight catch of 24 fish (Crowe 1973). Another study conducted in 1973 (Ayles et al. 1974) consisting of eight experimental gillnets, six in the “Kettle reservoir” and two in the north basin (referred to as Moose Lake in the study), resulted in an overnight catch per set of around 28 fish (Manitoba Hydro 2014a); however, the methods were not comparable to later studies.
In 1983–1989, the mean total CPUE was 38 fish/100 m/24 h and ranged from a minimum of 32 fish/100 m/24 h in 1986 to a maximum of 46 fish/100 m/24 h in 1987 (Figure 5.3.4A-2). Gill net duration was not available for data collected in 1984 and 1985 preventing the calculation of CPUE for those years. In 2001–2003, the mean total CPUE was 21 fish/100 m/24 h. Currently, the mean total CPUE is 20 fish/100 m/24 h. Catches during the mid-1980s were markedly higher than during more recent studies.
Assean Lake, the off-system reference waterbody in the CAMP program for this region, was also sampled as part of the Keeyask GP environmental studies (2001–2002). The mean total CPUE for both periods was similar (55 fish/100 m/24 h versus 50 fish/100 m/24 h), although a wider range of annual mean CPUEs was observed during current studies (Figure 5.3.4A-2). Catch-per-unit-effort in Assean Lake was lower than in Split Lake during the early 2000s but higher under current conditions. Catches in Stephens Lake are lower than either Split or Assean lakes during comparable periods.
1 Sample site selection in the MEMP program may have been based on maximum fish catches rather than the habitat criteria used in later programs.

REGIONAL CUMULATIVE EFFECTS ASSESSMENT – PHASE II WATER – FISH COMMUNITY
DECEMBER 2015 5.3-66
INDICATOR: DIVERSITY
Metric: Relative Abundance
Relative abundance was calculated as the percentage contribution of each species to the total catch; since this metric is not dependent on gang length or net set duration, a larger data set was available for comparison than for calculation of CPUE.
The earliest scientific survey in 1966 found that White Sucker and Goldeye made up the majority of the catch (~60%) followed by Lake Whitefish and then Cisco (Schlick 1968b)1. In the 1980s, Mooneye and Lake Whitefish were the most abundant species in Split Lake, closely followed by White Sucker, Cisco, Sauger, and Walleye (Figure 5.3.4A-4). In contrast, in the late 1990s/early 2000s and under current conditions, Walleye and, to a lesser extent, White Sucker, Northern Pike, and Sauger are the predominant large-bodied species.
Similarly in Stephens Lake, in the 1980s, Mooneye, Lake Whitefish, and Cisco were relatively abundant, but in the two more recent studies, Walleye and Northern Pike were the most abundant species. Longnose Sucker and Sauger were also relatively abundant in the 1980s.
As discussed for the total CPUE, these differences in species composition between studies could in part be related to differences in study design, most notably the locations of net sets or differences in the time of sampling. For example, a survey of the Stephens Lake immediately upstream of the Kettle GS found a community dominated by Longnose Sucker, followed by Lake Whitefish and Cisco in mid-July 1993, while a survey of the same area in August 1996 found a community dominated by Sauger, Walleye, and Northern Pike (KHLP 2012a).
Fewer species were captured from Assean Lake, and Walleye were the dominant species in the catch (Figure 5.3.4A-4). The relative abundance of Lake Whitefish, Northern Pike, White Sucker, and Cisco varied between sampling periods but each of these five species consistently comprised from 5–20% of the catch for each program.
It should be noted that Rainbow Smelt, an invasive species, were not present in the 1980s, and increased in relative abundance between the late 1990s/early 2000s and the current conditions in Split and Stephens lakes. Rainbow Smelt have not been recorded in Assean Lake to date.
Metric: Hill’s Index
Hill’s diversity index was calculated for the combined catch at all sites sampled in a year for Split and Stephens lakes (Figure 5.3.4A-5). For comparable periods, diversity was marginally greater in Split Lake
1 The lack of Mooneye identified in the 1966 study and the small proportion of Goldeye in subsequent studies suggests that the 1966 study did not distinguish between the two species or misidentified Mooneye as Goldeye.
REGIONAL CUMULATIVE EFFECTS ASSESSMENT – PHASE II WATER – FISH COMMUNITY
DECEMBER 2015 5.3-67
than Stephens Lake, and diversity appeared to have declined from the 1980s to the current period. Diversity in Assean Lake was constant and less than Split Lake but comparable to the lower values in Stephens Lake. The decrease in the on-system lakes is related to the increasing dominance of Walleye and Northern Pike.
DISCUSSION: FACTORS AFFECTING THE FISH COMMUNITY OVER TIME
The following provides a general discussion of changes in the fish community over time; specific factors affecting Walleye and Lake Whitefish are discussed in more detail in Sections 5.3.4.3.2 and 5.3.4.3.3.
The KHLP (2012a) described the biodiversity of the fish community of the Kelsey GS to Kettle GS reach in context of other northern waters, as follows:
A total of 37 fish species are known to occur in the study area. The principal large-bodied species include walleye, sauger, northern pike, yellow perch, burbot, lake whitefish, cisco, longnose sucker, white sucker, and lake sturgeon, while the most common small-bodied species include spottail shiner, emerald shiner, troutperch, and the recently introduced rainbow smelt. The area is similar to the aquatic environment in much of the northern boreal forest of Manitoba, Ontario, and western Québec. From a biodiversity and conservation perspective, the aquatic environment of the study area is not unique despite its traditional and cultural values to the local Cree Nations. No species are listed on Schedule 1 of the Species At Risk Act (SARA), but lake sturgeon in the Nelson River have been assessed by the Committee on the Status of Endangered Wildlife in Canada (COSEWIC) and are currently being assessed for listing under SARA.
Results from CAMP (2014) indicated that total CPUE in Split Lake and the southern portion of Stephens Lake was lower than lakes along the upper Nelson River but greater than riverine sites on the lower Nelson River. With respect to off-system sites, the total CPUEs in Assean and Setting lakes (the off-system reference sites for the lower and upper Nelson River lakes, respectively) were higher, and the CPUE on the Hayes River (an off-system riverine reference site) was lower.
Manitoba Hydro (2014a) reported that residents of Split Lake and York Factory First Nation have expressed several concerns to Manitoba Hydro regarding fish populations and fishing (particularly domestic fishing), specifically a decrease in the number of fish and difficulties with fishing related to increases in debris in nets and issues with access. As scientific data were not available for the 1950s, the effects of construction of the Kelsey GS cannot be assessed through comparison of changes in metrics over time; the ability to assess the effects of CRD/LWR and the impoundment of the Nelson River at Kettle Rapids is very limited due to the paucity of data for the 1960s and early 1970s. Based on very limited data from 1966 and 1973, and standardization among studies conducted during MEMP (1983–1989), Keeyask GP environmental studies (1997–2002) and CAMP (2009–2013), the total abundance of fish was similar in Split Lake over these periods (Figure 5.3.4A-1). When the comparison is limited to the period after the 1980s and uses the larger data set with the full range of mesh sizes (i.e., MEMP, Keeyask GP environmental studies and CAMP), a substantial decline in total fish CPUE is evident between the 1980s and the current period (Figure 5.3.4A-2).
The species composition in both lakes appears to have changed over time. In Split Lake, White Sucker and Goldeye/Mooneye made up the majority of the catch totalling around 60% in 1966, while in the mid-1980s Mooneye and Lake Whitefish made up the majority of the catch. By the late 1990s, Walleye, Northern Pike, and Sauger comprised the majority of the catch. No pre-impoundment scientific data for

REGIONAL CUMULATIVE EFFECTS ASSESSMENT – PHASE II WATER – FISH COMMUNITY
DECEMBER 2015 5.3-68
Moose Nose Lake (which was inundated and became part of the north arm of Stephens Lake) and the Nelson River between Gull Rapids and Kettle Rapids was located. Ayles (1974) sampled shortly after impoundment and related the high catches of Lake Whitefish in the north arm of Stephens Lake to the existence of a strong population of this species in the former Moose Nose Lake. The river section prior to impoundment was likely similar to that of the lower Nelson River downstream of the Limestone GS, with a substantial number of Longnose Sucker, and fewer White Sucker, Walleye, Northern Pike, Lake Whitefish, and Lake Sturgeon (note that Lake Sturgeon in this reach are discussed in Chapter 5.4). In the mid-1980s, species composition in Stephens Lake was similar to that recorded in Split Lake during the same period, though total abundance was lower. In the subsequent decades, a change similar to that in Split Lake was observed with a decline in total abundance, and a reduction in Lake Whitefish, Mooneye, and Cisco and an increase in the relative abundance of Walleye and Northern Pike.
The fish community in Split Lake, which is situated at the confluence of the Nelson and Burntwood rivers and thus experiences the combined effects of flow regulation as a result of LWR and CRD, is potentially affected by a wide range of factors, both related to and independent of hydroelectric development. Stephens Lake experiences many of the same effects as Split Lake, with the addition of the effects of impoundment and flooding after construction of the Kettle GS and the on-going weekly water level changes as a result of the operation of the Kettle GS. Given that data were collected during distinct time periods, it is not possible to determine whether observed differences between the 1980s (MEMP), the early 2000s (Keeyask GP environmental studies), and current conditions (CAMP) represent a long-term trends or short- to medium-term variability among years. The following discussion considers some of the key factors that may have resulted in changes to the fish community.
Factor: Effects of Changes to the Water Regime and Other Factors on Fish Habitat
The CRD increased the amount of flow to Split and Stephens lakes and regulation has resulted in increased rates of change in the inflows. The change in abundance and species compositions since the 1980s corresponds with a change in flow, though the extent to which this contributed to the observed differences in fish capture rates is not known since other factors (e.g., differences in methods that have not been identified) may also be important. It is also not known the extent to which the results of the MEMP studies (1983–1989) were affected by being conducted during a prolonged dry period or the extent to which recent CAMP results (2009–2013) are affected by the current wet period.
Construction of the Kettle GS flooded approximately 40 km of channel habitat in the Nelson River, which included areas of rapids, swiftly flowing smooth water, and slower water, as well as tributary streams, including the river connecting to Moose Nose Lake, which formed much of the current north arm of Stephens Lake. Denis and Challies (1916) described the pre-hydroelectric development habitat in present day Stephens Lake as a series of rapids and swift areas interspersed with areas of fairly smooth water until the seven miles downstream of Gull Rapids, which was quiet water. The Split Lake Cree reported in the Post-Project Environmental Review that they felt different currents and lake bottom debris resulting from CRD resulted in disturbance to fish habitat and migration patterns in Stephens Lake (Volume 3, Split Lake Cree-Manitoba Hydro Joint Study Group 1996).
No scientific data collection was conducted prior to construction of the Kettle GS, but due to the abundance of fast water habitat, the fish fauna in the river reach between Gull and Kettle rapids may have
REGIONAL CUMULATIVE EFFECTS ASSESSMENT – PHASE II WATER – FISH COMMUNITY
DECEMBER 2015 5.3-69
been similar to that of the Nelson River below the Limestone GS, which is dominated by Longnose Sucker, with lesser numbers of White Sucker, Walleye, Northern Pike, Lake Whitefish, and Lake Sturgeon. Based on catches shortly after impoundment, Moose Nose Lake may have been dominated by Lake Whitefish.
Under current conditions, the fish communities of the riverine portion of Stephens Lake and the north arm still differ: Walleye, Northern Pike, and White Sucker are the most abundant species and all are markedly more abundant in the north arm but substantial numbers of Lake Whitefish were only caught in the north arm during summer. However, species composition is markedly different from that observed in the lower Nelson River.
Flow regulation, in particular changes to seasonal flow patterns, may also have more subtle effects on fish habitat. For example, Split Lake and Manitoba Hydro (1996), hypothesized that juvenile rearing habitat may have become less abundant in Split Lake due to the decrease in average summer water levels. This may affect species that use shallow nearshore habitat as rearing habitat. Fisheries surveys in Split Lake found that Walleye, Lake Whitefish, and Northern Pike adults and juveniles all used both nearshore and offshore habitat, though Northern Pike were somewhat more abundant in nearshore habitat (KHLP 2012a).
The reach of the Nelson River between the Kelsey GS and Split Lake, the Burntwood River downstream of First Rapids, Assean River, and the Aiken River have all been identified as spawning habitat for Walleye and Lake Whitefish in Split Lake. These species also use riverine habitat in Stephens Lake for spawning, including the Nelson River downstream of Gull Rapids, Looking Back Creek, and the North and South Moswakot rivers. Flow regulation along the Nelson and Burntwood rivers, in particular low flows during spring and fall, may affect the suitability of these areas for use as spawning habitat; potential effects, however, cannot be assessed due to an absence of site-specific data. It is possible that due to the size of these rivers, some habitat is always available and/or sufficient habitat is available at other locations, as available year class data do not show evidence of missing year classes.
Factor: Effects of Changes to Sedimentation and Water Quality
The LWCNRSB (1975) predicted that the first ten years of operation of CRD/LWR could result in a silting of Split Lake due to erosion along the diversion route and, to a lesser extent, shoreline erosion on Split Lake. The report noted that siltation could result in a decrease in benthos production for fish species such as Lake Whitefish, Cisco and Walleye, as well as a decrease in reproductive success for Walleye and Northern Pike. An increase in turbidity was also expected to reduce the feeding abilities of juvenile fish such as Cisco, Walleye, and Lake Whitefish.
As discussed in Erosion and Sedimentation, Chapter 4.4, shoreline erosion and associated inputs of sediment for much of Split Lake has been of limited magnitude, though the high water levels beginning in 2005 have resulted in higher rates of erosion at some locations. The CRD also increased the sediment load entering Split Lake from the Burntwood River; due to the higher flows on the river, the load was estimated to increase about seven-fold compared to pre-hydroelectric development conditions. The increased sediment load resulted in a marked increase in local turbidity during some periods and the formation of a delta at the mouth of the Burntwood River. Apart from such local areas of high deposition,

REGIONAL CUMULATIVE EFFECTS ASSESSMENT – PHASE II WATER – FISH COMMUNITY
DECEMBER 2015 5.3-70
sedimentation rates in much of the lake were found to be low (Volume 3, Split Lake Cree-Manitoba Hydro Joint Study Group 1996).
Due to deposition in the western portion of the lake, no significant changes in TSS and turbidity were observed at a long-term water quality monitoring station in the eastern portion of the lake until post-1993. Turbidity was higher in 1993–2013 relative to pre-CRD/LWR which is believed to reflect upstream increases in the Burntwood River as well as higher rates of erosion in the latter part of this interval (i.e., 2005+) (Water Quality, Section 5.2.5.3.2). Prior to the recent period of prolonged high flows, the shoreline of Split Lake was largely stable (Chapter 4.4). Spawning habitat of species such as Lake Whitefish and Walleye, which use coarse substrates in rivers or along lakeshores, is sensitive to increased sedimentation. The spawning habitats currently known to be used by fish in the Split Lake are in rivers immediately upstream of the lake (KHLP 2012a, Sections 5.3.4.3.2 and 5.3.4.3.3).
Sediment deposition was widespread in Stephens Lake following impoundment (Erosion and Sedimentation Chapter 4.4). The shoreline around the north arm experienced extensive degradation of peatlands with more limited erosion of mineral shorelines. In the southern portion of the lake along the former river channel there was extensive erosion of mineral shorelines and sediment deposition over former coarse substrates (KHLP 2012a). Today, both Lake Whitefish and Walleye have spawning habitat both within Stephens Lake and in tributaries, as well as the mainstem of the Nelson River (KHLP 2012a). It is not known whether the decline in Lake Whitefish abundance from the mid-1980s to present was related to on-going habitat changes in Stephens Lake or other factors.
Available information suggests that water quality in the north arm of Stephens Lake was affected by impoundment (Water Quality, Section 5.2.6.3). In particular, lower DO concentrations were observed in the north arm of the lake in the early 1970s, notably in winter, relative to areas on the main flow path of the lower Nelson River. Under current conditions, offshore areas are generally well-oxygenated year-round in this area, but targeted monitoring programs conducted over the last decade have demonstrated that isolated nearshore areas of the north arm of the lake have lower DO concentrations. Water quality in the southern areas of the lake is like the main flow of the Nelson River and there is no clear evidence of a marked change following impoundment or CRD/LWR. Although over-winter oxygen depletion in the early years after impoundment would have affected the suitability of the north arm of Stephens Lake as fish habitat, in particular for sensitive species such as Lake Whitefish, there are insufficient data to determine whether a temporary change occurred.
Factor: Effects of Obstructions to Upstream Movements/Alterations to Downstream Movements
The extent of upstream movement of fish at Kelsey and Kettle rapids prior to hydroelectric development is not known. However, both these rapids were steep with high water velocities (Denis and Challies 1916), and it is expected that upstream movements, if any, would have been minimal. Genetic studies of Lake Sturgeon have demonstrated that Lake Sturgeon populations in the Nelson River were naturally restricted to one-way gene flow by geomorphic control points at Kelsey GS (Kelsey Rapids 6.1 m drop) and Kettle Rapids (23.8 m drop), indicating that upstream movements did not occur or were extremely rare and did not affect the genetic structure of the population (Chapter 5.4). Other fish species in the Kelsey GS to Kettle GS reach of the Nelson River likely do not display more of a tendency to move upstream over rapids than do Lake Sturgeon.

REGIONAL CUMULATIVE EFFECTS ASSESSMENT – PHASE II WATER – FISH COMMUNITY
DECEMBER 2015 5.3-71
It is expected that there would have been downstream movement of fish at both Kelsey and Kettle rapids, prior to hydroelectric development, primarily as drifting larvae and fry but also as juveniles and, to a much lesser extent, adults. Genetic studies of Lake Sturgeon have demonstrated that some downstream movement of fish occurred prior to hydroelectric development (i.e., downstream gene flow), but given that Lake Sturgeon populations upstream of both the Kettle and Kelsey rapids are genetically distinct from existing populations immediately downstream, movements would have been minimal (Lake Sturgeon, Chapter 5.4). Whether other fish species displayed the same minimal amount of downstream movement at the Kelsey and Kettle rapids prior to hydroelectric development is not known. With respect to the results of fish movement studies at Gull Rapids, situated within the Kelsey GS to Kettle GS reach of the Nelson River, the KHLP (2012) stated that:
All fish species are vulnerable to entrainment but the relative frequencies and magnitudes of entrainment will be largely species specific and be affected by factors such as habitat use, life stage, spawning season, and swimming capacity. For example, extrapolating from drift net catches of ten to hundreds of thousand fish over approximately two- to four-week long periods in early summer and that sampled only a very small portion of the Nelson River cross-sectional area (Pisiak 2005; Bretecher et al. 2007; MacDonald 2007), it can be assumed that millions of fish pass downstream over Gull Rapids annually. However, the vast majority of these fish are larvae and juveniles of catostomids (likely white sucker) and, less so, freshwater drum, sculpins, rainbow smelt, emerald shiner, and troutperch.
Movement studies conducted during the environmental studies for the Keeyask GP found that adults of three study species (Lake Whitefish, Walleye, and Northern Pike) moved downstream over Gull Rapids but in very low numbers (KHLP 2012a).
The extent to which construction of the Kelsey and Kettle GSs changed the downstream movement of fish at the former rapids cannot be determined. Creation of the reservoir may have reduced the number of larval and juvenile fish with limited swimming ability being carried downstream in the current; conversely, creation of deeper water and lower velocity habitat may have resulted in more fish being present immediately upstream of the GSs and vulnerable to entrainment through the GSs. Based on the results of recent studies applying detection and imaging sonar techniques at Manitoba Hydro’s Great Falls GS on the Winnipeg River (North/South Consultants Inc. [NSC] and Hydroacoustic Technologies Inc. 2015), several hundred thousand fish are entrained during the open water period, with approximately 95% being smaller than 200 mm in length. Except for Lake Whitefish, the fish species at Great Falls comprised most of the other species known to occur in this reach of the Nelson River. Fish population estimates for the reach of the river in the immediate forebay, in combination with entrainment estimates, suggested that 11-83% of the fish in this reach passed through the Great Falls GS, indicating that there is a constant movement of fish from upstream to downstream in each reservoir. This movement is largely driven by small-bodied fish (< 100 mm) that disperse and enter the mainstem flow and then passively move with the main current flowing through the GS.
Fish salvages conducted during the turbine re-runnering project at the Kelsey GS provide a direct measure of fish that were moving within the turbine units when they were shut down. The salvage was conducted to remove fish that became trapped when the turbine units were dewatered during the retrofitting process. The majority of fish observed in the turbines were Rainbow Smelt (Jansen 2009; Schneider-Vieira and Michaluk 2011; Aiken and Schneider-Vieira 2012). Several other species of forage fish were also observed (Troutperch, Spottail Shiner, Emerald Shiner, Longnose Dace, Golden Shiner,

REGIONAL CUMULATIVE EFFECTS ASSESSMENT – PHASE II WATER – FISH COMMUNITY
DECEMBER 2015 5.3-72
Fathead Minnow), as well as a few individual large-bodied species (Burbot, Lake Whitefish, White Sucker, Longnose Sucker, Walleye, Common Carp, Northern Pike, and Sauger), most of which were identified as juveniles based on their length.
After the GSs were constructed, fish moving downstream would be subject to injury from the turbines. The KHLP (2012) reported the following with respect to turbine effects:
Turbine passage can result in mortality of fish directly through a variety of mechanisms (e.g., pressure changes, shear stress, turbulence, striking, grinding) or indirectly through increased susceptibility to disease and predation. Among other factors, the survival of fish entrained in turbines depends on the size, species, and health of the fish (Cada 2001). … Turbine passage studies conducted at the Kelsey G.S. found the following:
The survival rate of walleye (mean length of 428 mm) experimentally introduced to a re-runnered turbine at the Kelsey GS was 88% and 75% for northern pike (greater than 450 mm) (NSC 2009); and
About two thirds of the walleye passed through the turbines without injury (cuts/scrapes, scale loss, loss of equilibrium, mortality). The incidence of northern pike that passed through the turbines without injury decreased with northern pike length. The proportion of injury-free subadult northern pike (150–450 mm) was 72% compared to 38% for their adult con-specifics…
Forage and larval fish will also be susceptible to turbine mortality. While there are few studies of ichthyoplankton mortality through turbines, particularly specific to boreal fish species, mortality due to contact with blades, shear, and pressure was estimated to be less than 5% at low-head (less than 30 m), propeller-type facilities (Cada 1990).
Similarly, based on a review of the literature, NSC and Hydroacoustic Technologies Inc. (2015) reported that mortality for fish less than 200 mm is estimated to be in the range of 3-5%.
The effect of the construction of the Kelsey GS on the fish population of the Kelsey GS to Kettle GS reach of the Nelson River, in particular Split Lake, as a result of potential changes in the number and survival of fish moving downstream cannot be definitely determined. Given that more fish habitat is available in Split Lake and adjoining tributaries in comparison to habitat in the riverine reach of the Nelson River immediately upstream of the former Kelsey Rapids, it seems unlikely that any reduction in the number of fish moving downstream following construction of the GS would have had a major effect on the Split Lake fish population.
The change in downstream movements at the Kettle GS would have potentially affected fish populations in the Kettle to Nelson River estuary reach and is discussed in Section 5.3.5.
Factor: Effects of Fisheries
Domestic, commercial, and recreational fisheries occurred historically and still occur throughout this reach. Quantitative information is only available for the commercial fishery. A detailed description of the fishery is provided in Summary of Community Information (People, Section 3.5.14.4) and information relevant to changes in the fish community is summarized below.
The first commercial fishing records for Split Lake date back to the 1950s, but in the early years harvests were small and variable. In the late 1970s, the commercial fishery increased substantially following the introduction of freight subsidies and construction of the Odei River fish packing station and an all-weather
REGIONAL CUMULATIVE EFFECTS ASSESSMENT – PHASE II WATER – FISH COMMUNITY
DECEMBER 2015 5.3-73
road to Split Lake. Harvests have continued to increase over time (Figure 5.3.4A-18). Fishers have reported issues with debris, in particular in high flow years, and the fishery did not operate in some of the greatest flood years (e.g., 1979). Commercial fishing was also affected by closure of the fishery due to concerns with mercury levels in fish, which affected overall production, as well as species that were harvested1. Over time, there has been a shift in the commercial fishery from Lake Whitefish to Walleye, which is thought to be related to the price increase for Walleye rather than a reduction in the abundance of Whitefish; Walleye prices rose by 196% between 1973 and 1980 and have remained higher relative to other species through 2013. Few data on domestic fishing are available for the years immediately following the CRD, though the Tataskweyak Cree Nation (Volume 1, Split Lake Cree First Nation 1996) have noted that a decline in domestic fishing on Split Lake took place during the 1980s due to the extra effort required to catch fish and concerns about water quality. Like the commercial fishery, lower domestic fish harvests have also been linked to high water years.
It is not possible with existing information to assess the potential effect of the commercial or domestic fishery on fish populations in Split Lake; however, the commercial fishery has not experienced a decline indicative of severely depleted fish stocks.
Assean Lake has been commercially fished since 1965, though production has varied notably over time, with no production recorded for the majority of years (Figure 5.3.4A-18). Members of Tataskweyak Cree Nation also conduct a domestic fishery on Assean Lake. It is not possible with existing information to assess the potential effect of the commercial or domestic fishery on the fish community in Assean Lake.
Prior to construction of the Kettle GS, there was no commercial fishery for species other than Lake Sturgeon in the area impounded by the Kettle GS. Stephens Lake was commercially fished for a five-year period (1979–1984) following construction of the Kettle GS. Whitefish, Walleye, Northern Pike, and suckers were also harvested under experimental commercial fishing permits over the period of 1978-1980. In addition, a resident of Gillam conducted a fishery (targeting Walleye) under a commercial fishing licence in Stephens Lake since the early 2000s; the production of this fishery is not published in Freshwater Fish Marketing Corporation records. Domestic fishing of Stephens Lake reported by Tataskweyak Cree Nation identified harvests of a number of fish species including Lake Whitefish, Walleye, Northern Pike, sucker, Goldeye, and baitfish from the north arm of the lake. Fox Lake Cree Nation members describe fishing at numerous locations within the area prior to construction of the Kettle GS. Following flooding, domestic fishing was much more limited.
It is not possible with existing information to assess the potential effect of the commercial or domestic fishery on Lake Whitefish and Walleye populations in Stephens Lake.
1 Note that as discussed in Section 5.5.3.4.1, mercury levels in Split Lake were not elevated in the early 1970s. Rather the closure was as a result of an insufficient understanding of the natural range in mercury levels in fish, as well as analysis of only a few large fish.
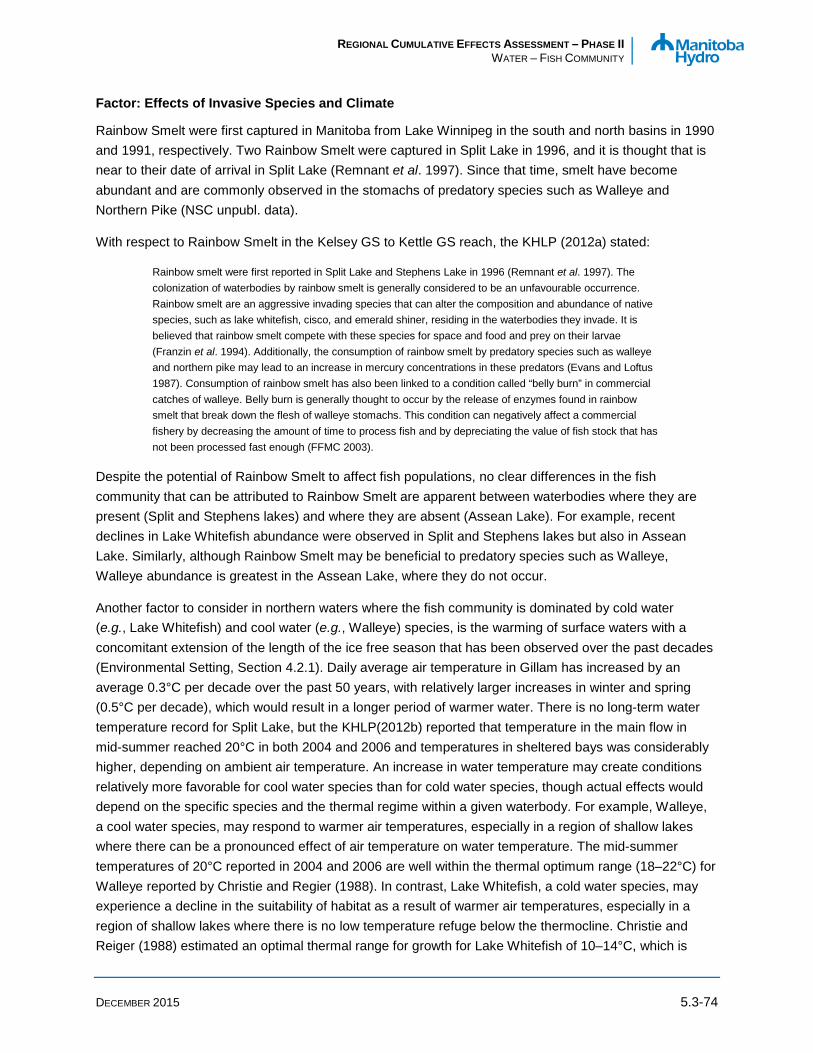
REGIONAL CUMULATIVE EFFECTS ASSESSMENT – PHASE II WATER – FISH COMMUNITY
DECEMBER 2015 5.3-74
Factor: Effects of Invasive Species and Climate
Rainbow Smelt were first captured in Manitoba from Lake Winnipeg in the south and north basins in 1990 and 1991, respectively. Two Rainbow Smelt were captured in Split Lake in 1996, and it is thought that is near to their date of arrival in Split Lake (Remnant et al. 1997). Since that time, smelt have become abundant and are commonly observed in the stomachs of predatory species such as Walleye and Northern Pike (NSC unpubl. data).
With respect to Rainbow Smelt in the Kelsey GS to Kettle GS reach, the KHLP (2012a) stated:
Rainbow smelt were first reported in Split Lake and Stephens Lake in 1996 (Remnant et al. 1997). The colonization of waterbodies by rainbow smelt is generally considered to be an unfavourable occurrence. Rainbow smelt are an aggressive invading species that can alter the composition and abundance of native species, such as lake whitefish, cisco, and emerald shiner, residing in the waterbodies they invade. It is believed that rainbow smelt compete with these species for space and food and prey on their larvae (Franzin et al. 1994). Additionally, the consumption of rainbow smelt by predatory species such as walleye and northern pike may lead to an increase in mercury concentrations in these predators (Evans and Loftus 1987). Consumption of rainbow smelt has also been linked to a condition called “belly burn” in commercial catches of walleye. Belly burn is generally thought to occur by the release of enzymes found in rainbow smelt that break down the flesh of walleye stomachs. This condition can negatively affect a commercial fishery by decreasing the amount of time to process fish and by depreciating the value of fish stock that has not been processed fast enough (FFMC 2003).
Despite the potential of Rainbow Smelt to affect fish populations, no clear differences in the fish community that can be attributed to Rainbow Smelt are apparent between waterbodies where they are present (Split and Stephens lakes) and where they are absent (Assean Lake). For example, recent declines in Lake Whitefish abundance were observed in Split and Stephens lakes but also in Assean Lake. Similarly, although Rainbow Smelt may be beneficial to predatory species such as Walleye, Walleye abundance is greatest in the Assean Lake, where they do not occur.
Another factor to consider in northern waters where the fish community is dominated by cold water (e.g., Lake Whitefish) and cool water (e.g., Walleye) species, is the warming of surface waters with a concomitant extension of the length of the ice free season that has been observed over the past decades (Environmental Setting, Section 4.2.1). Daily average air temperature in Gillam has increased by an average 0.3°C per decade over the past 50 years, with relatively larger increases in winter and spring (0.5°C per decade), which would result in a longer period of warmer water. There is no long-term water temperature record for Split Lake, but the KHLP(2012b) reported that temperature in the main flow in mid-summer reached 20°C in both 2004 and 2006 and temperatures in sheltered bays was considerably higher, depending on ambient air temperature. An increase in water temperature may create conditions relatively more favorable for cool water species than for cold water species, though actual effects would depend on the specific species and the thermal regime within a given waterbody. For example, Walleye, a cool water species, may respond to warmer air temperatures, especially in a region of shallow lakes where there can be a pronounced effect of air temperature on water temperature. The mid-summer temperatures of 20°C reported in 2004 and 2006 are well within the thermal optimum range (18–22°C) for Walleye reported by Christie and Regier (1988). In contrast, Lake Whitefish, a cold water species, may experience a decline in the suitability of habitat as a result of warmer air temperatures, especially in a region of shallow lakes where there is no low temperature refuge below the thermocline. Christie and Reiger (1988) estimated an optimal thermal range for growth for Lake Whitefish of 10–14°C, which is
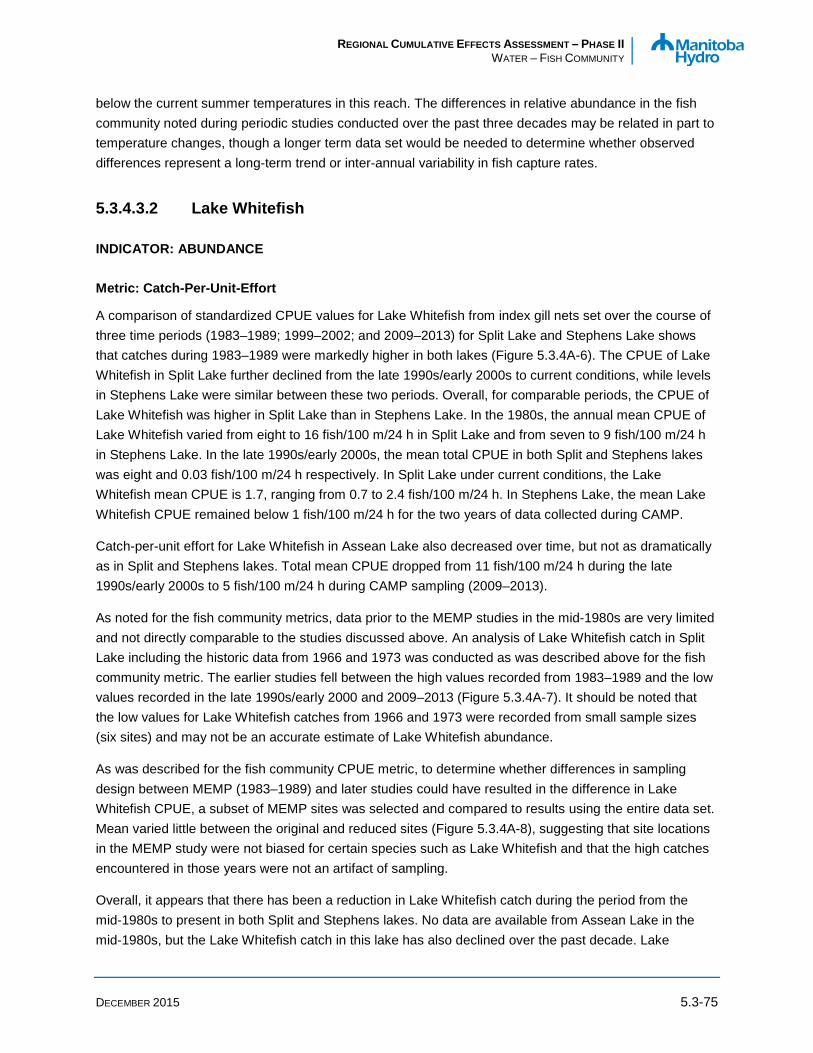
REGIONAL CUMULATIVE EFFECTS ASSESSMENT – PHASE II WATER – FISH COMMUNITY
DECEMBER 2015 5.3-75
below the current summer temperatures in this reach. The differences in relative abundance in the fish community noted during periodic studies conducted over the past three decades may be related in part to temperature changes, though a longer term data set would be needed to determine whether observed differences represent a long-term trend or inter-annual variability in fish capture rates.
5.3.4.3.2 Lake Whitefish
INDICATOR: ABUNDANCE
Metric: Catch-Per-Unit-Effort
A comparison of standardized CPUE values for Lake Whitefish from index gill nets set over the course of three time periods (1983–1989; 1999–2002; and 2009–2013) for Split Lake and Stephens Lake shows that catches during 1983–1989 were markedly higher in both lakes (Figure 5.3.4A-6). The CPUE of Lake Whitefish in Split Lake further declined from the late 1990s/early 2000s to current conditions, while levels in Stephens Lake were similar between these two periods. Overall, for comparable periods, the CPUE of Lake Whitefish was higher in Split Lake than in Stephens Lake. In the 1980s, the annual mean CPUE of Lake Whitefish varied from eight to 16 fish/100 m/24 h in Split Lake and from seven to 9 fish/100 m/24 h in Stephens Lake. In the late 1990s/early 2000s, the mean total CPUE in both Split and Stephens lakes was eight and 0.03 fish/100 m/24 h respectively. In Split Lake under current conditions, the Lake Whitefish mean CPUE is 1.7, ranging from 0.7 to 2.4 fish/100 m/24 h. In Stephens Lake, the mean Lake Whitefish CPUE remained below 1 fish/100 m/24 h for the two years of data collected during CAMP.
Catch-per-unit effort for Lake Whitefish in Assean Lake also decreased over time, but not as dramatically as in Split and Stephens lakes. Total mean CPUE dropped from 11 fish/100 m/24 h during the late 1990s/early 2000s to 5 fish/100 m/24 h during CAMP sampling (2009–2013).
As noted for the fish community metrics, data prior to the MEMP studies in the mid-1980s are very limited and not directly comparable to the studies discussed above. An analysis of Lake Whitefish catch in Split Lake including the historic data from 1966 and 1973 was conducted as was described above for the fish community metric. The earlier studies fell between the high values recorded from 1983–1989 and the low values recorded in the late 1990s/early 2000 and 2009–2013 (Figure 5.3.4A-7). It should be noted that the low values for Lake Whitefish catches from 1966 and 1973 were recorded from small sample sizes (six sites) and may not be an accurate estimate of Lake Whitefish abundance.
As was described for the fish community CPUE metric, to determine whether differences in sampling design between MEMP (1983–1989) and later studies could have resulted in the difference in Lake Whitefish CPUE, a subset of MEMP sites was selected and compared to results using the entire data set. Mean varied little between the original and reduced sites (Figure 5.3.4A-8), suggesting that site locations in the MEMP study were not biased for certain species such as Lake Whitefish and that the high catches encountered in those years were not an artifact of sampling.
Overall, it appears that there has been a reduction in Lake Whitefish catch during the period from the mid-1980s to present in both Split and Stephens lakes. No data are available from Assean Lake in the mid-1980s, but the Lake Whitefish catch in this lake has also declined over the past decade. Lake
REGIONAL CUMULATIVE EFFECTS ASSESSMENT – PHASE II WATER – FISH COMMUNITY
DECEMBER 2015 5.3-76
Whitefish abundance for comparable periods is greatest in the off-system reference lake (Assean Lake), intermediate in Split Lake and lowest in Stephens Lake.
INDICATOR: CONDITION
Metric: Fulton’s Condition Factor (KF)
Ayles (1974) found that Lake Whitefish from Stephens Lake, in particular the northern Moose Lake1 region had higher condition values than the other water bodies in the study, which included Split Lake. The condition of Lake Whitefish in Split Lake, Stephens Lake, and Assean Lake is generally comparable (Figure 5.3.4A-9). In Stephens Lake, the mean condition of Lake Whitefish has increased slightly over time. These slight increases occurred in Stephens Lake as the Lake Whitefish catch decreased.
INDICATOR: GROWTH
Metric: von Bertalanffy Model
Ayles (1974) reported that Lake Whitefish from the Kettle GS reservoir (Stephens Lake) had one of the best growth rates of the waterbodies studied while Split Lake fish exhibited the slowest growth rates.
Growth curves (von Bertalanffy) were calculated for all Lake Whitefish that had otoliths collected (Figure 5.3.4A-10; Table 5.3.4A-1). The curves were generally quite similar among lakes and study periods. For the two periods where data were available for Assean Lake (1999–2003 and 2009–2013), it appears that Lake Whitefish from the reference waterbody achieve a greater theoretical maximal length (i.e., had higher L∞ values) than those from Split or Stephens lakes (Figure 5.3.4A-10; Table 5.3.4A-1).
Metric: Relative Year Class Strength
The relative year class strength of Lake Whitefish from Split and Assean lakes, when consecutive years of sampling occurred, is shown in Figure 5.3.4A-11. The historical year class index determined from MEMP data (1983–1989) indicated that there was a weak year class (< 50) in 1975 and some average year classes in 1976 and from 1980 to 1983. From 1977 to 1979 there were strong year classes (> 100) and then again in 1984. The Keeyask GP data were split into two sampling periods (1997–1998 and 2001-2002) due to non-consecutive year studies. The data indicate a weak year class for 1997 while the remaining years from 1988 to 1998 indicated average to strong cohorts (50–150). The most recent data collected from 2009 to 2013 (CAMP) indicated a very weak year class for 2001 (21.2) and a weak year class for 2006 (< 50). Two very strong cohorts were found: one in 2002, which had an index greater than 250, and another in 2008 that was just under 250. The years between the two peaks (2003–2007) ranged from 62 to 96 with the exception of the previously noted value in 2006.
1 This lake is also referred to as Moose Nose Lake.

REGIONAL CUMULATIVE EFFECTS ASSESSMENT – PHASE II WATER – FISH COMMUNITY
DECEMBER 2015 5.3-77
In Assean Lake, the 2001-2002 data set shows an unusually weak year class for Lake Whitefish in 1997, and the CAMP data for Assean Lake indicate a very weak year class for 2001 (Figure 5.3.4A-11). While the strongest year classes in Assean Lake also occurred during CAMP sampling, these year classes were not as strong as those observed in Split Lake (< 200), and they occurred in different years (2004 and 2005).
DISCUSSION: FACTORS AFFECTING LAKE WHITEFISH OVER TIME
When considering all available index gillnetting data, Lake Whitefish numbers in Split Lake have varied over time but no long-term trend from the 1960s to present is evident; in fact, the highest catches were recorded in the 1980s (Figure 5.3.4A-7). However, as noted above, data from the late 1960s and early 1970s are very limited. There does appear to be a downward trend in Lake Whitefish numbers on both Split and Stephens lakes over the past three decades and, based on a limited period of record, Assean Lake, which is off-system (Figure 5.3.4A-6). There is a possibility that changes in sampling methods between the MEMP and later studies contributed to the difference observed between studies, but comparisons of catches among similar sites does not show a difference related to sampling design (Figure 5.3.4A-8). No pronounced trends in growth, condition factor, or year class strength are evident (Figures 5.3.4A-9 to 5.3.4-11).
Many of the same factors that may affect the fish community are also relevant to Lake Whitefish and potentially key factors are discussed below.
Factor: Effects of Changes to the Water Regime and Other Factors on Fish Habitat
As discussed for the fish community, the MEMP studies were conducted during a prolonged dry period in the 1980s and the current CAMP studies are being conducted during a prolonged wet period. Lake Whitefish catch tends to be lower with higher flows but whether this is an artifact of other differences between study periods is not known. Based on information presented in Erosion and Sedimentation (Chapter 4.4), low flows occurred in the Split Lake area in April 1981, and late summer/fall of 1988, 1991, and 2003 but these do not correspond to extremely weak year classes (Figure 5.3.4A-11). Conversely, the strong year classes in Split Lake in 2002 and 2008 also do not correspond to particularly high water years.
As discussed for the fish community metric, construction of the Kettle GS flooded habitat in Moose Nose Lake that supported Lake Whitefish. Lake Whitefish occur in Stephens Lake under current conditions but are less abundant than in Split Lake, though relative abundance is similar; it is not known whether the total production of Lake Whitefish is currently greater or lesser than that prior to impoundment. Given that the decline in Lake Whitefish that occurred from the mid-1980s to present occurred in both Split and Stephens lakes, a direct link to habitat changes in Stephens Lake does not appear to be a factor.
Flow regulation, in particular the changed seasonal flow patterns, may also have more subtle effects on fish habitat. For example, Split Lake and Manitoba Hydro (1996), hypothesized that juvenile rearing habitat may have become less abundant in Split Lake due to the decrease in average summer water levels following CRD/LWR. This may affect species that use shallow nearshore habitat as rearing habitat. Fisheries surveys in Split Lake found that Walleye, Lake Whitefish, and Northern Pike adults and

REGIONAL CUMULATIVE EFFECTS ASSESSMENT – PHASE II WATER – FISH COMMUNITY
DECEMBER 2015 5.3-78
juveniles all used both nearshore and offshore habitat (KHLP 2012a), but whether this resulted in a decline in Lake Whitefish post CRD/LWR is not known. The decline in Lake Whitefish between the 1980s and current conditions occurred in conjunction with high summer water levels, though it could be argued that high water levels could also adversely affect juvenile habitat.
The Burntwood River at First Rapids, the Assean River, and the Aiken River have all been identified as spawning habitat for Lake Whitefish in Split Lake (KHLP 2012a). Lake Whitefish in Stephens Lake also use riverine habitat for spawning, including the Nelson River at Gull Rapids, Looking Back Creek, and the North and South Moswakot rivers (KHLP 2012a). Flow regulation along the Nelson and Burntwood rivers, in particular periods of low flow in late fall to early spring when eggs are in the substrate, may affect the suitability of these areas for use as spawning habitat; potential effects, however, cannot be assessed due to an absence of site-specific data.
Factor: Effects of Changes to Sedimentation and Water Quality
The LWCNRSB (1975) predicted that increased siltation in Split Lake following CRD could result in decreased benthos production affecting food availability for species such as Lake Whitefish. Spawning habitat for Lake Whitefish, which use coarse substrates in rivers or along lakeshores, is sensitive to increased sedimentation. Given the paucity of data prior to CRD, it is not known whether there was a decrease in Lake Whitefish abundance in Split Lake related to a reduction in the benthic invertebrate food supply following the CRD. The spawning habitats currently known in Split Lake are in rivers (KHLP 2012a), though it is not known whether prior to CRD/LWR Lake Whitefish spawned in Split Lake and whether any such habitat was lost due to sediment deposition following CRD.
Sedimentation after construction of the Kettle GS was widespread in Stephens Lake, in particular in the north arm where Lake Whitefish were reportedly abundant in Moose Nose Lake prior to flooding (Ayles 1974). The KHLP (2012a) reported that Lake Whitefish currently spawn in Ferris Bay in Stephens Lake, as well as the north bank of the mainstem of the Nelson River and Gull Rapids, and the North and South Moswakot rivers. Whether sediment deposition following the impoundment of Stephens Lake eliminated other spawning habitat is not known. Similarly, it is not known whether feeding habitat in Stephens Lake as a whole is of lower quality than prior to impoundment. Given that the condition of Lake Whitefish in Stephens Lake is currently comparable to or marginally better than those in nearby off-system reference lakes, the food supply in Stephens Lake currently appears to be adequate.
The decrease in Lake Whitefish abundance observed in Spit and Stephens lakes over the past three decades does not appear to be directly related to increased sediment deposition, since a similar trend appears to be occurring in the off-system reference lake. Under current conditions, the condition factor of Lake Whitefish in Split and Stephens lakes is not lower than in Assean Lake, which suggests that the food supply in Split and Stephens lakes is currently not markedly lower than in Assean Lake. Spawning habitat has been documented under current conditions in Split and Stephens lakes. The occurrence of normal, low, and high year classes in Split Lake is not markedly different from Assean Lake, once again suggesting that factors such as on-going sediment deposition are not contributing to a decline in Lake Whitefish in Split Lake.

REGIONAL CUMULATIVE EFFECTS ASSESSMENT – PHASE II WATER – FISH COMMUNITY
DECEMBER 2015 5.3-79
Factor: Effects of Obstructions to Upstream Movements/Alterations to Downstream Movements
As discussed for the fish community as a whole, it is likely that Lake Whitefish did not move upstream past Kelsey Rapids or Kettle Rapids prior to the construction of the Kelsey and Kettle GSs. Conversely, there likely was downstream movement of Lake Whitefish prior to GS construction, in particular as larvae of this species drift in surface waters for several weeks in spring and are vulnerable to entrainment. However, the amount of larvae moving downstream would likely have depended on the proximity of spawning habitat to the present day sites of the GSs. In addition, the importance of larval drift to downstream populations would depend on the amount of larval fish production within the receiving waterbody. Spawning habitat for Lake Whitefish is present in several of the tributaries of Split Lake; therefore, inputs of drifting larval Lake Whitefish from upstream of Kelsey Rapids may not have been a major contribution to the population.
The amount of downstream movement of adult and juvenile Lake Whitefish prior to the construction of the Kelsey GS is not known, nor is there information on current rates of movement.
Factor: Effects of Fisheries
Fisheries on Split and Stephens lakes were previously described with respect to the fish community metric. Lake Whitefish formed a substantial part of the total commercial catch on Split Lake through to the early 1990s, after which the catch declined. It is not known whether this represents a change in fishing effort to target other species such as Walleye and/or a decline in Lake Whitefish abundance. Conversely, Lake Whitefish populations may have declined beginning in the mid-1980s as a result of increased fishing pressure through the late 1970s and 1980s. However, given that there was no commercial fishery for Lake Whitefish on Stephens Lake, and a similar decline in Lake Whitefish was observed, the commercial fishery is likely not the major contributor to the change in Lake Whitefish abundance.
5.3.4.3.3 Walleye
INDICATOR: ABUNDANCE
Metric: Catch-Per-Unit-Effort
A comparison of Walleye CPUE values from index gill nets set over the course of three time periods (1983–1989; 1999–2002; and 2009–2013) for Split and Stephens lakes shows that catches during 1983-1989 were markedly lower than in the two more recent time periods (Figure 5.3.4A-12). Walleye CPUE during 1999–2002 in Split Lake was notably higher and more variable than it is currently, while CPUE in Stephens Lake was intermediate in 2001–2003 and is the highest currently. Walleye CPUE in Assean Lake, the off-system reference lake, was generally higher than in Split and Stephens lakes except in 1999–2002, when values in Split Lake were comparable. The mean value for Split Lake Walleye data collected during the 1980s was 6 fish/100 m/24 h, and ranged from 4 to 10 fish/100 m/24 h. For Stephens Lake, the mean CPUE for the same period was 3 fish/100 m/24 h. In the late 1990s/early 2000s, Split Lake had a mean CPUE of 24 fish/100 m/24 h while the mean CPUE for Stephens Lake was 7 fish/100 m/24 h. The mean CPUE for Split Lake currently is 11 fish/100 m/24 h, ranging from five to 13 fish. Two years of sampling in Stephens Lake (2009 and 2012) resulted in a mean CPUE of 11

REGIONAL CUMULATIVE EFFECTS ASSESSMENT – PHASE II WATER – FISH COMMUNITY
DECEMBER 2015 5.3-80
fish/100 m/24 h. The CPUE of Walleye in Assean Lake was similar between 2001–2002 and 2009–2013, with mean values of 27 and 25, respectively.
An analysis of overnight catch per set of Walleye in Split Lake, including the historic data from 1966 and 1973, found that mean values from the earlier studies fell within the range of CPUEs recorded during later studies (Figure 5.3.4A-13). It should be noted that the 1966 and 1973 studies had small sample sizes (six sites) and may not accurately reflect Walleye abundance.
As was described for the fish community CPUE metric, to determine whether differences in sampling design between MEMP (1983–1989) and later studies could have resulted in the observed changes in Walleye CPUE, a subset of MEMP sites was selected and compared to results using the entire data set. Mean CPUE for Walleye generally varied little between the original and reduced sites (Figure 5.3.4A-14). This suggests that site locations in the MEMP study were not biased against species such as Walleye and that the low catches encountered in those years were not an artifact of sampling.
Overall, it appears that there has been an increase in Walleye catch since the mid-1980s to present in both Split and Stephens lakes. Catches during 1999–2002 in Split Lake were variable and appeared somewhat higher than current conditions. No data are available from Assean Lake in the mid-1980s, but numbers have remained constant over the past decade. Walleye abundance for comparable periods did not vary consistently among lakes, though abundance was generally greater in Assean Lake and least in Stephens Lake, with Split Lake varying between the two.
INDICATOR: CONDITION
Metric: Fulton’s Condition Factor (KF)
Ayles (1974) reported that the condition of Walleye from Split Lake based on regressions of fork lengths and weights were far superior to those from other waterbodies in the study including the Kettle GS reservoir (Stephens Lake).
The condition of Walleye captured from Split Lake was comparable across all sampling periods (Figure 5.3.4A-15). For Stephens Lake there was a slight trend to increasing condition factor over time. Data from Assean Lake indicate no change over time. Condition factor in Assean Lake was marginally lower than that observed in Split and Stephens lakes.
INDICATOR: GROWTH
Metric: von Bertalanffy Model
Ayles (1974) found that Walleye captured from Spilt Lake and the Kettle GS reservoir region of Stephens Lake had similar rates of growth.
Growth curves were calculated for all Walleye that had otoliths collected using the von Bertalanffy method (Figure 5.3.4A-16; Table 5.3.4A-1). The curves were generally comparable among lakes and study periods.
REGIONAL CUMULATIVE EFFECTS ASSESSMENT – PHASE II WATER – FISH COMMUNITY
DECEMBER 2015 5.3-81
Metric: Relative Year Class Strength
The relative year class strength of Walleye for Split and Assean lakes is shown in Figure 5.3.4A-17. The historical year class index determined from MEMP data (1983–1989) indicated that there were two weak year classes in a row (< 50) in 1977 and 1978. Two extremely strong (> 200) year classes occurred during the MEMP period: one in 1979 (212) and another in 1983 (288). The Keeyask GP data were split into two sampling periods (1997–1998 and 2001–2002) due to non-consecutive year studies. The data showed that the year class strength during this period was relatively stable, with no weak year classes. The most recent data collected from 2009 to 2013 (CAMP) similarly found no weak year classes; however, several strong cohorts (> 100) were observed (2002, 2003, 2007, and 2008).
Year class strength was also relatively stable during the Keeyask GP environmental studies conducted in Assean Lake; the exception was a strong year class in 1996 (150) (Figure 5.3.4A-17). The strong year classes observed in Split Lake during CAMP sampling were not detected in Assean Lake, where year class strength generally ranged from 74–119 except for a particularly weak year class in 2004 (36).
DISCUSSION: FACTORS AFFECTING WALLEYE OVER TIME
When considering all available index gillnetting data, Walleye numbers in Split Lake from the late 1960s to present did not display a consistent trend (Figure 5.3.4A-13); however, as noted above, data from the late 1960s and early 1970s are very limited. The highest catches were recorded since the late 1990s.
In the past three decades, it appears that there has been an increase in Walleye in both Split and Stephens lakes (Figure 5.3.4A-12). Catches during 1999–2002 in Split Lake were variable and appeared somewhat higher than current conditions. Numbers in Assean Lake appear constant over the past decade (no earlier data are available). Walleye abundance for comparable periods did not vary consistently among lakes, though CPUE was generally lowest in Stephens Lake and highest in Assean Lake.
As was discussed for Lake Whitefish, changes in sampling methods between the MEMP and later studies may have contributed to the difference observed between studies, but comparisons of catches among similar sites does not show a difference related to sampling design (Figure 5.3.4A-14). No pronounced trends in growth, condition factor or year class strength are evident (Figures 5.3.4A-15 to 5.3.4A-17).
Many of the same factors that may affect the fish community are also relevant to Walleye and potentially key factors are discussed below.
Factor: Effects of Changes to the Water Regime and Other Factors on Fish Habitat
As discussed for Lake Whitefish, the MEMP studies were conducted during a prolonged dry period and the current CAMP studies are being conducted during a prolonged wet period. Walleye catch increased with flow but whether this is an artifact of other differences between study periods is not known. Based on data discussed in Chapter 4.4, very low flows (< 5th percentile) occurred for at least two weeks in the spring/early summer of 1977, 1981, 1988, 1989, and 1993. With the exception of 1977, these did not correspond to weak Walleye year classes. Similarly, there was no consistent relationship between high
REGIONAL CUMULATIVE EFFECTS ASSESSMENT – PHASE II WATER – FISH COMMUNITY
DECEMBER 2015 5.3-82
flows and strong year classes (> two weeks of flow above the 95th percentile occurred in spring/early summer of 1979, 1986, 1997, 2005, and 2006).
As discussed for Lake Whitefish, construction of the Kettle GS caused a large change in the upstream habitat. Since the abundance of Walleye prior to impoundment was not recorded, the magnitude and direction of change cannot be definitely determined. However, Walleye often do well in reservoir environments (see KHLP 2012a and references therein) and the CPUE of Walleye currently in Stephens Lake is higher than in the Nelson River or Gull Lake, which may have been more similar to the habitat in the reach between Gull and Kettle Rapids prior to 1970.
As with Lake Whitefish, Walleye are known to spawn in numerous river reaches (KHLP 2012a). Flow regulation along the Nelson and Burntwood rivers, in particular when periods of low flow occur in spring, may affect the suitability of these areas as spawning habitat; potential effects, however, cannot be assessed due to the absence of site-specific data.
Factor: Effects of Changes to Sedimentation and Water Quality
As discussed for the fish community, the LWCNRSB (1975) predicted that increased sedimentation in Split Lake following CRD would negatively affect feeding and spawning habitat for Walleye. The KHLP (2012a) recorded numerous spawning areas in tributaries to Split Lake, including the Nelson River at the Grass River downstream of the Kelsey GS, the Burntwood River at First Rapids, the Aiken River, the Mistuska River, and the Assean River. Spawning may also occur in Split Lake itself, but it is not known whether sediment deposition as a result of CRD eliminated some Walleye spawning habitat.
In Stephens Lake, the KHLP (2012a) reported evidence of Walleye spawning in Looking Back Creek, Gull Rapids, the north and south shores of the Nelson River below Gull Rapids, the North and South Moswakot rivers, and Ferris Bay. Walleye may also spawn in other areas of Stephens Lake. It is expected that impoundment of Stephens Lake eliminated spawning habitat in other tributaries that were flooded or diverted.
However, given that Walleye abundance in both Split and Stephens lakes appears to be increasing, sufficient spawning and foraging habitat appears to be available.
Factor: Effects of Obstructions to Upstream Movements/Alterations to Downstream Movements
As discussed for the fish community as a whole, it is likely that Walleye did not move upstream past Kelsey Rapids or Kettle Rapids prior to the construction of the Kelsey and Kettle GSs. Conversely, there was likely downstream movement prior to GS construction, primarily as larval or juvenile fish, though the frequency of such movements is not known.
The amount of downstream movement of adult and juvenile Walleye prior to the construction of the Kelsey GS is not known, nor is there information on current rates of movement.

REGIONAL CUMULATIVE EFFECTS ASSESSMENT – PHASE II WATER – FISH COMMUNITY
DECEMBER 2015 5.3-83
Factor: Effects of Fisheries
Fisheries on Split and Stephens lakes were previously described with respect to the fish community metric. Walleye have always been harvested as part of the Split Lake fishery, but beginning in the late 1990s the catch increased (Figure 5.3.4A-18). Whether this reflects a change in fishing effort to target this species, or reflects the increase in Walleye abundance in the late 1990s/early 2000s is not known. Similarly, it is not known whether the recent decline of Walleye in Split Lake (Figure 5.3.4A-12) is due to increased fishing pressure, in particular since a similar change was not seen in Stephens Lake or Assean Lake, where the commercial fishery has not increased.
REGIONAL CUMULATIVE EFFECTS ASSESSMENT – PHASE II WATER – FISH COMMUNITY
DECEMBER 2015 5.3-84
5.3.4.4 Cumulative Effects of Hydroelectric Development on the Fish Community from the Kelsey Generating Station to the Kettle Generating Station including the Burntwood River Downstream of First Rapids
Using published literature and de novo data analysis, a number of changes in fish community metrics in the reach of the Nelson River between the Kelsey GS and the Kettle GS have been identified over the past three decades. As scientific data were not available for the 1950s, the effects of construction of the Kelsey GS cannot be directly assessed. The ability to directly assess the effects of CRD/LWR and the impoundment of the Nelson River at Kettle Rapids is very limited due to the paucity of data for the 1960s and early 1970s. However, as summarized below, potential changes can be inferred from more recent trends in fish abundance and an understanding of the environmental changes caused by the developments. The current analysis focussed on data collected during MEMP (1983–1989), the Keeyask GP environmental studies (1997–2002), and CAMP (2009–2013).
There was a substantial decline in total fish numbers in Split Lake between the 1980s and the current period (2009–2013) with a concomitant change in the fish community from one dominated by Mooneye and Lake Whitefish in the 1980s, to predominantly Walleye, Northern Pike, and Sauger by the late 1990s to present. In the mid-1980s, species composition in Stephens Lake was similar to that recorded in Split Lake, though total abundance was lower. In the subsequent decades, a change similar to that in Split Lake was observed with a decline in total abundance, and a reduction in Lake Whitefish, Mooneye, and Cisco with an increase in the relative abundance of Walleye and Northern Pike.
Overall, it appears that there has been a reduction in Lake Whitefish catch from the mid-1980s to present in both Split and Stephens lakes. No data are available from Assean Lake, the off-system reference waterbody, in the mid-1980s, but the Lake Whitefish catch in this lake also declined over the past decade. Lake Whitefish abundance for comparable periods is greatest in Assean Lake, intermediate in Split Lake, and lowest in Stephens Lake.
In contrast to Lake Whitefish, it appears that there has been an increase in Walleye in both Split and Stephens lakes. Catches during 1999–2002 in Split Lake were variable and appeared somewhat higher than current conditions. Numbers in Assean Lake appear constant over the past decade. Walleye abundance for comparable periods did not vary consistently among lakes, though numbers were generally lowest in Stephens Lake and highest in Assean Lake.
The fish community in Split Lake, which is situated at the confluence of the Nelson and Burntwood rivers and thus experiences the combined effects of flow regulation by LWR and CRD, is potentially affected by a wide range of factors, both related to and independent of hydroelectric development. Stephens Lake experiences many of the same effects as Split Lake, with the addition of the effects of impoundment and flooding after construction of the Kettle GS, associated infrastructure, transmission lines, and on-going weekly water level changes resulting from operation of the Kettle GS.
The CRD increased the load of sediment entering Split Lake from the Burntwood River, as well as erosion on Split Lake, in particular during recent high water years. Impoundment of Stephens Lake was associated with extensive erosion and sediment deposition. Although spawning habitats for Walleye and
REGIONAL CUMULATIVE EFFECTS ASSESSMENT – PHASE II WATER – FISH COMMUNITY
DECEMBER 2015 5.3-85
Lake Whitefish may have been affected, recent studies have documented numerous areas of spawning habitat for both species, in particular in river habitats that would not have been affected by sediment deposition.
The CRD increased the amount of flow to Split Lake and together with LWR has altered the seasonal flow pattern. The change in abundance and species composition between the 1980s and current conditions is correlated with increased flow; however, it is not known whether observed differences reflect the prolonged dry period versus the prolonged wet period. No obvious link in year class strength of Walleye and Lake Whitefish to either floods or droughts was observed. Numerous areas of river habitat, including the reach of the Nelson River between the Kelsey GS and Split Lake, the Burntwood River downstream of First Rapids, and the Aiken River have been identified as spawning habitat for Lake Whitefish and Walleye. Flow regulation along the Nelson and Burntwood rivers, in particular low flows during spring and fall, may affect the suitability of these areas for spawning. Potential effects, however, cannot be assessed due to an absence of site-specific data.
Construction of the Kettle GS and associated infrastructure resulted in substantial habitat changes in Moose Nose Lake and the Nelson River mainstem and tributary streams, which were flooded to form Stephens Lake. The fish community prior to impoundment was not documented in a scientific study, but the lake may have been dominated by Walleye and Lake Whitefish, as Assean Lake is today, and the river may have been similar to the downstream environment, where Longnose Sucker are the most abundant, but Lake Sturgeon, Lake Whitefish, and Northern Pike occur as well. Walleye often do well in reservoir environments, and likely increased in abundance. Whether Lake Whitefish abundance changed after impoundment is not known; however, the decline in Lake Whitefish observed after the 1980s is not likely linked to impoundment since the same trend was observed in Split Lake.
The extent of movements upstream over Kelsey or Kettle rapids is not known; however, it is expected that movements, if any, would have been minimal. It is expected that fish did move downstream, primarily as drifting larvae and fry but also as juveniles, and to a lesser extent, adults. Changes in downstream movements of fish cannot be assessed. However, the contribution to the fish community in Split Lake of drift from the Nelson River immediately upstream of Kelsey Rapids is expected to be small in comparison to the fish population in Split Lake.
The Split Lake commercial fishery increased substantially in the mid-1970s and harvests have continued to increase over time. It is not possible with existing information to assess the potential effect of the fishery on Lake Whitefish and Walleye populations in Split Lake (e.g., decline in Lake Whitefish from the 1980s to present, decline in Walleye since the late 1990s/early 2000s); however, the fishery has not experienced a decline indicative of severely depleted fish stocks. There is not a good quantitative estimate of the commercial fishery harvest on Stephens Lake; therefore potential effects to Walleye cannot be assessed.
Rainbow Smelt, an invasive species, arrived in Split Lake around 1996. Rainbow Smelt have been associated with declines in Lake Whitefish in other waterbodies. However, it is unlikely that Rainbow Smelt caused the observed decline in Lake Whitefish, given that numbers were already reduced in the late 1990s and a decline was also observed in a lake where Rainbow Smelt do not occur (Assean Lake). Conversely, Rainbow Smelt may have a positive effect on Walleye abundance, as they can form a large
REGIONAL CUMULATIVE EFFECTS ASSESSMENT – PHASE II WATER – FISH COMMUNITY
DECEMBER 2015 5.3-86
part of the Walleye diet. There is no information from this area to determine whether Rainbow Smelt have increased Walleye populations; Walleye have increased in one lake where smelt are present (Stephens Lake) and decreased in another (Split Lake) but the highest catches are still recorded where they are absent (Assean Lake).
Increasing water temperature is another factor that may affect the suitability of habitat for species such as Lake Whitefish and Walleye. Average air temperature in Gillam has increased 1.5–2.5°C over the past 50 years. There is no long-term water temperature record but increased air temperature likely increased water temperature. Warmer temperatures may create less favourable conditions for cold water species such as Lake Whitefish and more favourable conditions for cool water species such as Walleye.
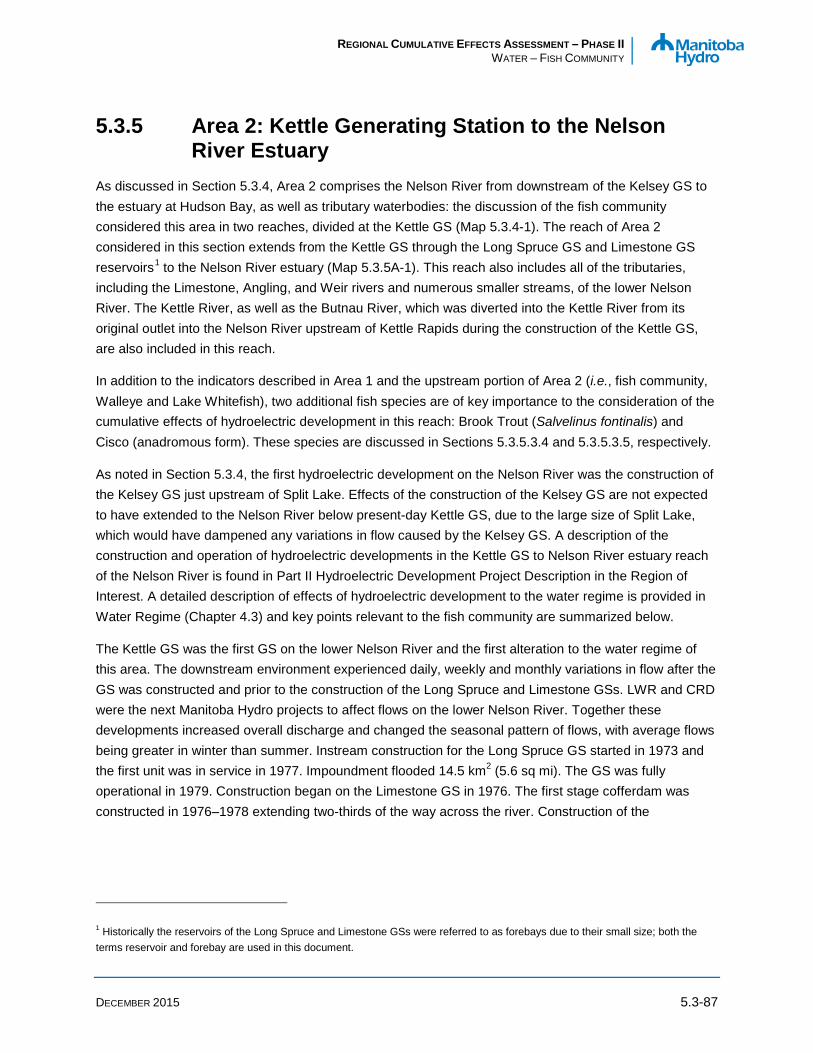
REGIONAL CUMULATIVE EFFECTS ASSESSMENT – PHASE II WATER – FISH COMMUNITY
DECEMBER 2015 5.3-87
5.3.5 Area 2: Kettle Generating Station to the Nelson River Estuary
As discussed in Section 5.3.4, Area 2 comprises the Nelson River from downstream of the Kelsey GS to the estuary at Hudson Bay, as well as tributary waterbodies: the discussion of the fish community considered this area in two reaches, divided at the Kettle GS (Map 5.3.4-1). The reach of Area 2 considered in this section extends from the Kettle GS through the Long Spruce GS and Limestone GS reservoirs1 to the Nelson River estuary (Map 5.3.5A-1). This reach also includes all of the tributaries, including the Limestone, Angling, and Weir rivers and numerous smaller streams, of the lower Nelson River. The Kettle River, as well as the Butnau River, which was diverted into the Kettle River from its original outlet into the Nelson River upstream of Kettle Rapids during the construction of the Kettle GS, are also included in this reach.
In addition to the indicators described in Area 1 and the upstream portion of Area 2 (i.e., fish community, Walleye and Lake Whitefish), two additional fish species are of key importance to the consideration of the cumulative effects of hydroelectric development in this reach: Brook Trout (Salvelinus fontinalis) and Cisco (anadromous form). These species are discussed in Sections 5.3.5.3.4 and 5.3.5.3.5, respectively.
As noted in Section 5.3.4, the first hydroelectric development on the Nelson River was the construction of the Kelsey GS just upstream of Split Lake. Effects of the construction of the Kelsey GS are not expected to have extended to the Nelson River below present-day Kettle GS, due to the large size of Split Lake, which would have dampened any variations in flow caused by the Kelsey GS. A description of the construction and operation of hydroelectric developments in the Kettle GS to Nelson River estuary reach of the Nelson River is found in Part II Hydroelectric Development Project Description in the Region of Interest. A detailed description of effects of hydroelectric development to the water regime is provided in Water Regime (Chapter 4.3) and key points relevant to the fish community are summarized below.
The Kettle GS was the first GS on the lower Nelson River and the first alteration to the water regime of this area. The downstream environment experienced daily, weekly and monthly variations in flow after the GS was constructed and prior to the construction of the Long Spruce and Limestone GSs. LWR and CRD were the next Manitoba Hydro projects to affect flows on the lower Nelson River. Together these developments increased overall discharge and changed the seasonal pattern of flows, with average flows being greater in winter than summer. Instream construction for the Long Spruce GS started in 1973 and the first unit was in service in 1977. Impoundment flooded 14.5 km2 (5.6 sq mi). The GS was fully operational in 1979. Construction began on the Limestone GS in 1976. The first stage cofferdam was constructed in 1976–1978 extending two-thirds of the way across the river. Construction of the
1 Historically the reservoirs of the Long Spruce and Limestone GSs were referred to as forebays due to their small size; both the terms reservoir and forebay are used in this document.

REGIONAL CUMULATIVE EFFECTS ASSESSMENT – PHASE II WATER – FISH COMMUNITY
DECEMBER 2015 5.3-88
Limestone GS was suspended in 1978. Construction was re-started in 1985 and completed in 1992. The first of 10 units began producing power in September 1990; the reservoir was fully impounded during the following winter at which time it flooded 2.2 km2 (0.8 sq mi). The reservoir is typically operated within a 1 m range. The Conawapa Access Road was constructed from 1990–1992. It provided access to the lower Nelson River, thereby potentially increasing harvest in this area, and stream crossings affected several tributaries.
For the purposes of this section, 1970 (in-service date for first unit of the Kettle GS) was selected as the beginning of effects to the water regime of the lower Nelson River as a result of hydroelectric development. Construction of the Kettle GS, and subsequently the Long Spruce and Limestone GSs, resulted in daily and weekly cycling of flows in both the impounded areas and in the river downstream (Water Regime, Chapter 4.3). Depending on local conditions, large areas of the riverbed downstream of the Limestone GS are dewatered and wetted on a daily or weekly basis.
Prior to hydroelectric development, ice cover generally progressed upstream from the Nelson River estuary, as ice accumulated at the leading edge, shoving and thickening with ice generated from the fast flowing upstream open water river sections. The process resulted in a very thick and rough ice cover and typically caused water level increases of about 33 ft (10 m) and ice scouring. This process still occurs downstream of the Limestone GS but within the reservoirs, a stable, relatively thin ice cover is formed.
5.3.5.1 Key Published Information Historical descriptions of the fisheries resources of the lower Nelson River date back to the early 1900s (Comeau 1915; Skaptason 1926; Bickle 1995). Studies conducted in the late 1940s and early 1950s by the province focused largely on Brook Trout and provide data on the ecology and distribution of the species in the area (Doan 1948; Kooyman 1951). Around the time construction began on the Limestone GS, the MFB conducted studies that described the basic biology and life history requirements of Brook Trout and other fisheries aspects, including some surveys that extended to the Nelson River estuary (e.g., Gaboury 1978, 1980a, b; Gaboury and Spence 1981; Swanson 1986; Swanson and Kansas 1987; Swanson et al. 1988, 1990). When major construction re-started on the Limestone GS, the MFB undertook aquatic monitoring studies during the period of 1985 to 1989 (Swanson 1986; Swanson and Kansas 1987; Swanson et al. 1988, 1990, 1991). The scope of the Limestone GS aquatic monitoring studies on the lower Nelson River area was expanded in 1988 in anticipation of the construction of the potential Conawapa GP.
More than 75 fisheries reports have been produced for Manitoba Hydro since 1990 as part of the Limestone GS /potential Conawapa GP programs. These studies included monitoring of the Limestone GS and Long Spruce GS reservoirs (Baker 1990, 1991, 1992; Baker et al. 1990; Horne and Baker 1993a; Kroeker and Horne 1993; MacDonell and Horne 1994; Horne and MacDonell 1995; Horne 1996; Bretecher and Horne 1997; Bretecher and MacDonell 1998a, 1999a, 2000a; Johnson et al. 2004; Pisiak and Barth 2006; Murray et al. 2007; Koga and MacDonell 2009; Pisiak 2009), continued studies of Brook Trout populations, tributary use, and mainstem use with focus on coregonine populations (Bernhardt et al. 1992; Remnant and Baker 1993; MacDonald et al. 2006; Mandzy et al. 2007, 2008, 2009, 2010, 2011; Milot et al. 2007; Nelson and MacDonell 2007; Caskey and MacDonell 2009; MacDonald et al. 2009;
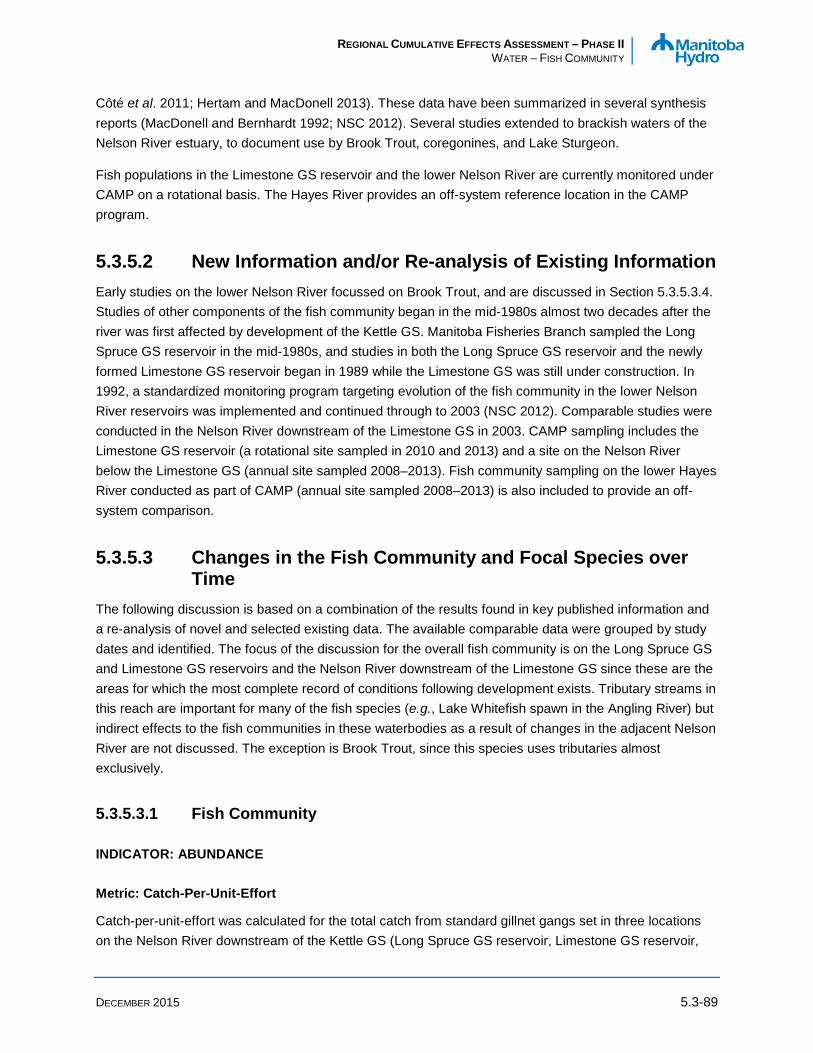
REGIONAL CUMULATIVE EFFECTS ASSESSMENT – PHASE II WATER – FISH COMMUNITY
DECEMBER 2015 5.3-89
Côté et al. 2011; Hertam and MacDonell 2013). These data have been summarized in several synthesis reports (MacDonell and Bernhardt 1992; NSC 2012). Several studies extended to brackish waters of the Nelson River estuary, to document use by Brook Trout, coregonines, and Lake Sturgeon.
Fish populations in the Limestone GS reservoir and the lower Nelson River are currently monitored under CAMP on a rotational basis. The Hayes River provides an off-system reference location in the CAMP program.
5.3.5.2 New Information and/or Re-analysis of Existing Information Early studies on the lower Nelson River focussed on Brook Trout, and are discussed in Section 5.3.5.3.4. Studies of other components of the fish community began in the mid-1980s almost two decades after the river was first affected by development of the Kettle GS. Manitoba Fisheries Branch sampled the Long Spruce GS reservoir in the mid-1980s, and studies in both the Long Spruce GS reservoir and the newly formed Limestone GS reservoir began in 1989 while the Limestone GS was still under construction. In 1992, a standardized monitoring program targeting evolution of the fish community in the lower Nelson River reservoirs was implemented and continued through to 2003 (NSC 2012). Comparable studies were conducted in the Nelson River downstream of the Limestone GS in 2003. CAMP sampling includes the Limestone GS reservoir (a rotational site sampled in 2010 and 2013) and a site on the Nelson River below the Limestone GS (annual site sampled 2008–2013). Fish community sampling on the lower Hayes River conducted as part of CAMP (annual site sampled 2008–2013) is also included to provide an off-system comparison.
5.3.5.3 Changes in the Fish Community and Focal Species over Time
The following discussion is based on a combination of the results found in key published information and a re-analysis of novel and selected existing data. The available comparable data were grouped by study dates and identified. The focus of the discussion for the overall fish community is on the Long Spruce GS and Limestone GS reservoirs and the Nelson River downstream of the Limestone GS since these are the areas for which the most complete record of conditions following development exists. Tributary streams in this reach are important for many of the fish species (e.g., Lake Whitefish spawn in the Angling River) but indirect effects to the fish communities in these waterbodies as a result of changes in the adjacent Nelson River are not discussed. The exception is Brook Trout, since this species uses tributaries almost exclusively.
5.3.5.3.1 Fish Community
INDICATOR: ABUNDANCE
Metric: Catch-Per-Unit-Effort
Catch-per-unit-effort was calculated for the total catch from standard gillnet gangs set in three locations on the Nelson River downstream of the Kettle GS (Long Spruce GS reservoir, Limestone GS reservoir,

REGIONAL CUMULATIVE EFFECTS ASSESSMENT – PHASE II WATER – FISH COMMUNITY
DECEMBER 2015 5.3-90
and the Nelson River mainstem downstream of the Limestone GS). The Hayes River, an off-system reference site in the CAMP program, is also presented (Maps 5.3.5A-2 to 5.3.5A-5).
Sampling conducted in the reservoirs during 1989–2003 utilized gillnet gangs including the 1.5 inch mesh size and, either because the raw data were not available and/or catches were not identified to mesh size, the 1.5 inch for all but 2003 could not be removed. The mean CPUEs for both these reservoirs were calculated including the 1.5 inch mesh (Figure 5.3.5A-1). The CPUEs of the 1985–1986 period was very close to those of the 1993–2003 period for Long Spruce GS reservoir, however, average CPUE was slightly higher during 1989–1992. Values from the Limestone GS reservoir (1992–2003) were similar to the Long Spruce GS reservoir for the same period (Figure 5.3.5A-1). It should be noted that CPUE data collected for the Limestone GS reservoir prior to 1992 was not included in this analysis because the reservoir was not completely impounded and sampling did not include all of the later sites.
When examining data with 1.5 inch mesh removed, there was only one year (2003) of data available for the Long Spruce GS reservoir, which had a similar mean total CPUE to 2003 for the Limestone GS reservoir (25 and 23 respectively). A comparison of calculated metrics using 2003 data with and without the 1.5 inch mesh indicated that total CPUE was marginally higher (29 versus 25 in the Long Spruce GS reservoir and 26 versus 23 in the Limestone GS reservoir) when 1.5 inch mesh was included.
Approximately a decade later, mean CPUE in the Limestone GS reservoir was somewhat lower at 12 fish/100 m/24 h. However, this value is based on two years of sampling (2010 and 2013), and mean annual CPUEs were within or close to the lower end of the range of values observed during 1992–2003.
Mean annual CPUEs in the lower Nelson River mainstem in 2003 and 20041 were 35 and 30 fish/100 m/24 h, respectively, for a total mean CPUE of 33 fish/100 m/24 h. Mean annual CPUEs during CAMP (2008–2013) in the lower Nelson River mainstem were more variable, ranging from 19 to 36 fish/100 m/24 h, but no marked temporal trend was apparent. Under the CAMP program, mean total CPUE on the Hayes River (10 fish/100 m/24 h) was somewhat lower than CPUE in the Limestone GS forebay and was considerably lower than the CPUE for the lower Nelson River below the Limestone GS. It should be noted that the CPUEs in the lower Nelson River represent areas where gill nets can be set, including back eddies, tributary confluences and other sites with lower current and so are not necessarily representative of the river as a whole.
Values reported for the reservoirs are comparable to those recorded in the 1980s when Swanson and Kansas (1987) reported a total CPUE of 16.4 for the Long Spruce GS reservoir. The CPUE of 13.1 for the lower Nelson River at the location of the potential Conawapa GP reservoir in 1988 was considerably lower than that recorded in 2003 and 2004 as well as for CAMP.
1 The 2004 program included only limited sites and primarily targeted Lake Whitefish and Cisco.

REGIONAL CUMULATIVE EFFECTS ASSESSMENT – PHASE II WATER – FISH COMMUNITY
DECEMBER 2015 5.3-91
INDICATOR: DIVERSITY
Metric: Relative Abundance
To determine whether the inclusion of the 1.5 inch mesh had a marked effect on relative abundance, values for the 2003 sampling program were calculated with and without this mesh. No or minimal differences were observed for the relative abundance of species in both the Long Spruce GS and Limestone GS reservoirs; therefore the discussion below does not distinguish among samples collected with or without the 1.5 inch mesh though these are shown separately on Figure 5.3.5A-2.
The relative abundance of species varied over time in the Long Spruce GS reservoir but the fish community is generally dominated by White Sucker, Walleye, Northern Pike, Mooneye, Longnose Sucker and Lake Whitefish (Figure 5.3.5A-2). The continued presence of species such as Longnose Sucker, which are typical of riverine environments, indicates the diverse range of habitats available in the reservoir.
Longnose Sucker, Northern Pike, and Walleye were the most abundant species captured in the Limestone GS reservoir during 1992–2003, 2010, and 2013 (Figure 5.3.5A-2). Other species that consistently comprised small proportions (< 10%) of the catch during both programs included Lake Whitefish, Freshwater Drum, Mooneye, Sauger, and White Sucker.
As in the Limestone GS reservoir, Longnose Sucker was also the most abundant species captured from the lower Nelson River 2003–2004, comprising 49% of the catch (Figure 5.3.5A-2). During CAMP sampling on the lower Nelson River (2008–2013), Northern Pike were captured in the highest numbers (comprising 32% of the catch), followed by Longnose Sucker (which comprised 24% of the catch). Other species that accounted for at least 10% of the catch included Lake Sturgeon, Lake Whitefish, and Walleye (Figure 5.3.5A-2). Walleye was the most abundant species (32%) in the Hayes River CAMP (2008–2013) catch, followed by Lake Sturgeon (26%). Other species that comprised at least 10% of the catch included Longnose Sucker (12%) and White Sucker (11%).
Metric: Hill’s Index
A Hill’s diversity number was calculated from the combined catch at all sites sampled in a year in the Long Spruce GS reservoir, the Limestone GS reservoir, the lower Nelson River below the Limestone GS, and the Hayes River (Figure 5.3.5A-3). The Limestone GS reservoir had the lowest average Hill’s Index values. Hill’s Index values calculated for the two sampling programs conducted on the lower Nelson River and on the Hayes river were comparable.
DISCUSSION: FACTORS AFFECTING THE FISH COMMUNITY OVER TIME
Based on the over 75 fisheries reports completed as part of the Limestone GS/potential Conawapa GP aquatic study programs since 1990 (see references in Section 5.3.5.1), a total of 38 fish species have been captured in the lower Nelson River. These species are the same as those captured upstream in the Kelsey GS to Kettle GS reach with the exception of Brook Trout, which are only found downstream of the Kettle GS. All of these species are classified as freshwater species, carrying out all important life history functions, such as reproduction, rearing, feeding, and growth, in a freshwater environment. However,
REGIONAL CUMULATIVE EFFECTS ASSESSMENT – PHASE II WATER – FISH COMMUNITY
DECEMBER 2015 5.3-92
several species, such as Cisco, Lake Whitefish, Lake Sturgeon, Brook Trout, Ninespine Stickleback, and Longnose Sucker are tolerant of brackish water and use the nearshore estuarine zone to varying degrees.
The aquatic environment in this reach is similar to much of the northern boreal forest of Manitoba, Ontario, and western Québec. From a biodiversity and conservation perspective, the aquatic environment is not unique. Brook Trout and Lake Sturgeon have been deemed “heritage species” in Manitoba due to their unique life history characteristics, limited distribution, and economic, social, and historical significance in the province. Lake Sturgeon in the lower Nelson River have also been designated as “Endangered” by COSEWIC.
The studies conducted as part of the Limestone GS/potential Conawapa GP programs have provided a good understanding of the fish community of the lower Nelson River. The fish community is adapted to a large and shallow river environment with considerable variation in water levels and flows. Construction of the Limestone GS added to the variability of this environment by causing incremental changes to the magnitude and duration of water level fluctuations. Tag returns suggest that emigration out of the Limestone GS reservoir may have contributed to a short-term increase in fish abundance downstream of the GS immediately after impoundment. However, monitoring of fish movements in tributaries downstream of the GS and periodic sampling in the Nelson River mainstem has provided little evidence of any substantial long-term change in abundance or composition for most species downstream of the Limestone GS since its construction. Although unrelated to the construction of the GS, the abundance of Rainbow Smelt has increased since its arrival in the mid-1990s.
In the past decade, the principal large-bodied species in the Nelson River mainstem include Longnose Sucker, Northern Pike, Lake Whitefish, White Sucker, Walleye, and Lake Sturgeon, while Emerald Shiner, Rainbow Smelt, Troutperch, Lake Chub, and Longnose Dace are the most abundant small-bodied species. The fish community reflects the predominance of river and stream habitat in the system.
The abundance of certain fish species changes substantially in the lower Nelson River and its tributaries during the spring and fall as a result of spawning migrations. In the spring, suckers and Northern Pike enter tributary streams to spawn before returning to the mainstem, while coregonines return from the estuary to the mainstem and enter upstream tributaries to spawn during fall. The larger tributary streams, such as the Limestone, Angling, and Weir rivers provide important habitat for spawning, rearing, foraging, and overwintering for most of the predominant fish species. The smaller tributaries also provide protection from predatory fish and enhance feeding opportunities for juveniles. Several species take advantage of the productive marine waters of the Hudson Bay for foraging during summer. Others use the headwater lakes as off-current refuges and for overwintering.
The Limestone GS aquatic environment monitoring program (NSC 2012) was conducted to monitor the evolution of the aquatic environment following impoundment. Data collected as impoundment was occurring suggested that species such as Longnose Sucker, Lake Whitefish, Cisco, Brook Trout, and Lake Sturgeon moved downstream during the first year of impoundment. CPUEs were relatively stable after that time, though there was evidence that Longnose Sucker experienced a marked reduction in recruitment. At the end of the program, an increase in Walleye catches and reduction in Longnose Sucker catches suggested that a long-term change in relative abundance was occurring. However, under current
REGIONAL CUMULATIVE EFFECTS ASSESSMENT – PHASE II WATER – FISH COMMUNITY
DECEMBER 2015 5.3-93
conditions (2010–2013), the relative community composition is similar to that seen during the final years of the Limestone GS environmental monitoring program, suggesting that observed changes may have been related to inter-annual variation.
The fish community downstream of the Kettle GS experienced overall changes in the amount and timing of flow as a result of CRD/LWR in addition to local changes as a result of impoundment of successive reaches of the river and on-going daily and weekly water level changes as the result of station operation. At present, it is not possible to determine whether changes observed over the past three decades in the fish community inhabiting the mainstem environment and the Long Spruce GS and Limestone GS reservoirs represents long-term trends or short- or medium- term variability between years. Many of the same factors that would have affected the fish community in the Kelsey GS to Kettle GS reach of the Nelson River would also have affected the fish community downstream of the Kettle GS. As discussed in Section 5.3.4.3.1, Rainbow Smelt1 and warming temperatures may have affected the fish community; similar effects may have occurred in this reach but are not discussed further due to the limited availability of site-specific data. The following discussion considers some of the key factors that may have affected the fish community.
Factor: Effects of Changes to the Water Regime and Other Factors on Fish Habitat
Denis and Challies (1916) described the Nelson River between Kettle and Limestone rapids as an almost continuous series of swiftly flowing water and rapids; the profile of the Nelson River illustrated the rapid descent of the river in this reach compared to a somewhat less steep gradient upstream between Gull and Kettle rapids and below the last Limestone Rapids to the Nelson River estuary. There is no information on the fish community of the impounded reaches prior to hydroelectric development but studies on the lower Nelson River downstream of the Limestone GS provide an indication of the likely fish community. As indicated previously, index gillnetting studies likely over-estimate the diversity in this reach since nets can only be set at sites sheltered from the current. Electrofishing studies have demonstrated that Longnose Sucker are the predominant species in the river (Nelson and MacDonell 2007). Habitat in the reservoirs is still riverine, but offers low velocity habitat that is more suitable for species such as Northern Pike and Walleye. The emigration of Longnose Sucker, Lake Whitefish, Cisco, and Lake Sturgeon from the Limestone reservoir after impoundment may have been a response to a rapid decline in water velocity, habitat that was unsuitable, and/or a seasonal downstream migration to the estuary or other areas in the Nelson River.
The major effect to fish habitat downstream of the GSs is the large daily changes in water levels and flows when the GSs are cycling, which below the Limestone GS can result in substantial dewatering of the riverbed. Nelson and MacDonell (2007) conducted electrofishing surveys in the Nelson River
1 As with the upstream reach, Rainbow Smelt have been recorded downstream of the Kettle GS (NSC 2012). Rainbow Smelt were first observed in the diet of Walleye in the Limestone GS forebay in 1998 and by 2003 comprised over 80% of the diet.

REGIONAL CUMULATIVE EFFECTS ASSESSMENT – PHASE II WATER – FISH COMMUNITY
DECEMBER 2015 5.3-94
downstream of the Limestone GS and found that fish moved into areas of habitat that were dewatered on a daily or weekly basis as it became wetted again, indicating that the habitat could remain productive even if dewatered periodically for short durations. Comparison to the Hayes River, which has not been affected by hydroelectric or other development, does not indicate a clear adverse effect of flow regulation in the Nelson River, since the overall abundance of fish in the Nelson River is higher and the species composition and overall diversity of the fish community is similar.
Factor: Effects of Changes to Sedimentation and Water Quality
Surveys of shorelines of the lower Nelson River showed that pre-hydroelectric development there was minimal erosion but following development extensive erosion occurred at some locations. The average recession rates for both forebays was less than 1 m/y (Erosion and Sedimentation, Chapter 4.4). Analysis of erosion of the river downstream of the Limestone GS suggests that erosion rates at the most highly erodible banks have not changed substantially since the 1970s, despite the construction of the CRD/LWR and the Limestone and Long Spruce GSs. The existing Nelson River is noted as being stable and having not experienced large morphological changes in the past 50 years.
Analysis of available water quality data shows a lack of notable spatial differences in water quality along the length of the lower Nelson River over the period of record, suggesting that past effects either were relatively small or were not captured by the studies conducted in the area (Water Quality, Section 5.2.7.3). The lower Nelson River downstream of the Kettle GS has been generally well mixed (i.e., does not stratify) and well-oxygenated (i.e., DO above the protection of aquatic life objectives) since monitoring was initiated in the area (i.e., 1972).
None of the differences observed in the fish community appear related to changes in either sediment deposition or water quality; effects appear to be more related to effects of the water regime on habitat, which are discussed below.
Factor: Effects of Obstructions to Upstream Movements/Alterations to Downstream Movements
As noted with respect to the Kelsey GS to Kettle GS reach of the Nelson River (Section 5.3.4), the extent of upstream movement of fish over Kettle Rapids is not known, but the large drop at Kettle Rapids (23.8 m) likely precluded upstream movement of fish. Indirect evidence that the Kettle Rapids were a barrier to upstream movement is the absence of Brook Trout in the Nelson River upstream of the Kettle Rapids (Section 5.3.5.3.4) and contemporary differences in the genetic structure of Lake Sturgeon populations upstream and downstream of the Kettle GS (Lake Sturgeon, Chapter 5.4).
It is expected that there would have been downstream movement of fish at Kettle Rapids. As was discussed in Section 5.3.5.3.1, the amount of downstream movement is not known but given that Lake Sturgeon populations upstream and downstream of the Kettle GS are genetically distinct, movements for Lake Sturgeon would have been minimal (Chapter 5.4). Whether other fish species displayed the same minimal amount of downstream movement prior to hydroelectric development is not known.
Construction of each of the GSs in the Kettle to Nelson River estuary reach may have resulted in the downstream movement of adult fish, though movements during the operation phase are lower. The
REGIONAL CUMULATIVE EFFECTS ASSESSMENT – PHASE II WATER – FISH COMMUNITY
DECEMBER 2015 5.3-95
KHLP (2012), in considering potential effects in the future Keeyask GP reservoir based on observed changes in other reservoirs stated:
Changes in aquatic habitat in the Keeyask reservoir could result in increased fish movements out of the reach. In particular, there could be a mass emigration of fish out of the reach in the first year of impoundment as fish move away from disturbed habitat. Emigration out of the Limestone reservoir, Manitoba (NSC 2012) and the Desaulniers River, Québec (Boucher 1982) during impoundment was linked with a sudden decrease in the abundance of fish. It is anticipated that some fish will move upstream away from disturbed areas in the Keeyask reservoir, but will quickly re-colonize the reservoir once water quality conditions stabilize. Those fish that do move downstream past the Keeyask GS would be lost to the reservoir as the barrier created by the GS will prevent them from returning upstream.
The number of fish moving out of the reservoir through the Keeyask GS over the long-term via the spillway (when it is in operation) and the turbines would be small based on telemetry studies conducted in the Limestone reservoir (Pisiak 2009). Less than 3% of the walleye (n = 34 fish) and approximately 14% of the northern pike (29) and lake whitefish (14) marked with acoustic transmitters and released into the reservoir potentially passed downstream through the GS or spillway during the open water seasons of 2005–2007. During this time, the majority of the walleye, northern pike, and lake whitefish that remained in the reservoir showed a preference for the upper reach, which minimizes the potential of these species passing downstream through the Limestone GS.
Fish moving downstream would be vulnerable to turbine effects, as discussed in Section 5.3.4.3.1.
The contemporary abundance, relative species composition and diversity of the fish communities in the Limestone GS reservoir, the Nelson River downstream of the Limestone GS, and the Hayes River do not indicate a clear adverse effect of the loss of fish moving downstream through successive generating stations. Fish abundance in the Nelson River is higher than immediately upstream (Limestone GS reservoir) and in the Hayes River (an unregulated system). Diversity in the Nelson River is slightly greater than in the Limestone GS reservoir and comparable to the Hayes River. Differences between these three areas are more likely related to differences in habitat than as a result of the effects of the GSs on downstream movements.
Factor: Effects of Fisheries
The only known commercial fishery prior to hydroelectric development on the lower Nelson River was for Lake Sturgeon (Summary of Community Information, Section 3.5.6.4; Lake Sturgeon, Chapter 5.4). Domestic harvest by Fox Lake Cree Nation members focussed on Brook Trout (Section 5.3.5.3.4) and Lake Sturgeon (Chapter 5.4). Recreational harvest targeted Brook Trout (Section 5.3.5.3.4).
5.3.5.3.2 Lake Whitefish
INDICATOR: ABUNDANCE
Metric: Catch-Per-Unit-Effort
The mean CPUE for Lake Whitefish was below one for both the Long Spruce GS and Limestone GS reservoirs during the 2003–2004 monitoring period, and during CAMP monitoring in 2010 and 2013, the CPUE for Lake Whitefish was only 0.1 and 0.2 fish/100 m/24 h, respectively (Figure 5.3.5A-4). The mean annual CPUE for Lake Whitefish captured during sampling conducted in the lower Nelson River below the

REGIONAL CUMULATIVE EFFECTS ASSESSMENT – PHASE II WATER – FISH COMMUNITY
DECEMBER 2015 5.3-96
Limestone GS was generally higher than in the reservoirs but also more variable, ranging from 6 fish/100 m/24 h in 2003 to only 1 fish/100 m/24 h in 2004. Sampling in this area resumed in 2008 with CAMP, and from 2008 to 2013 the mean annual CPUE for Lake Whitefish ranged from 1-3 fish/100 m/24 h. The CPUE for Lake Whitefish in the Hayes River, which serves as the reference waterbody in this part of Area 2, was within the lower end of the range seen in the lower Nelson River below the Kettle GS and comparable to values seen in the reservoirs.
INDICATOR: CONDITION
Metric: Fulton’s Condition Factor (KF)
Annual mean condition factor was generally comparable among the reservoirs and the lower Nelson River (Figure 5.3.5A-5). Condition factor in the Hayes River was comparable to the lower values recorded on the Nelson River.
INDICATOR: GROWTH
Metric: von Bertalanffy Model
Sufficient data for calculation of von Bertalanffy growth curves were only collected from sites within the lower Nelson River downstream of the Limestone GS (Figure 5.3.5A-6; Table 5.3.5A-1). Growth was similar between the two time periods.
Metric: Relative Year Class Strength
Sufficient data for year class comparisons between sampling periods was only available for the lower Nelson River below the Limestone GS. All year classes are represented (Figure 5.3.5A-7). Based on the 2003–2004 data the 1998 year class had the strongest cohort while the 2008–2013 data found 1997 to be the strongest.
DISCUSSION: FACTORS AFFECTING LAKE WHITEFISH OVER TIME
No trend in Lake Whitefish abundance is evident when comparing catches in the reservoirs or the lower Nelson River over time. However, as noted above, Lake Whitefish are thought to have moved downstream out of the Limestone GS forebay immediately after impoundment. In this area of the Nelson River, Lake Whitefish appear to favour riverine rather than lacustrine environments and abundance in the reaches impounded by the GSs likely decreased. Effects to movements of Lake Whitefish are discussed in conjunction with the fish community above.
REGIONAL CUMULATIVE EFFECTS ASSESSMENT – PHASE II WATER – FISH COMMUNITY
DECEMBER 2015 5.3-97
5.3.5.3.3 Walleye
INDICATOR: ABUNDANCE
Metric: Catch-Per-Unit-Effort
Sampling conducted in 2003–2004 indicated that mean CPUE for Walleye was highest in the Long Spruce GS reservoir (8 fish/100 m/24 h), intermediate in the Limestone GS forebay (5 fish/100 m/24 h), and lowest in the Nelson River downstream (Figure 5.3.5A-8). During 2010 and 2013, however, CPUE in the Limestone GS reservoir was very low (1 fish/100 m/24 h) and the CPUE in both river environments was higher (average of 3 fish/100 m/24 h).
INDICATOR: CONDITION
Metric: Fulton’s Condition Factor (KF)
Mean condition factor for Walleye captured on the lower Nelson River downstream of the Kettle GS was fairly consistent (between 1.20 and 1.30) across areas and sampling programs (Figure 5.3.5A-9). Mean condition factor for Walleye within the Hayes River during CAMP sampling (2008–2013) was lower (1.08).
INDICATOR: GROWTH
Metric: von Bertalanffy Model
Sufficient data for calculation of von Bertalanffy growths was collected from all sites within the lower Nelson River downstream of the Limestone GS and the reference waterbody (Figure 5.3.5A-10; Table 5.3.5A-1).
Metric: Relative Year Class Strength
Data collected from the lower Nelson River below the Limestone GS from 2008 to 2013 indicated that 2003 and 2008 had stronger than usual year classes, and the 2006 year class was the weakest (Figure 5.3.5A-11).
DISCUSSION: FACTORS AFFECTING WALLEYE OVER TIME
During the Limestone GS monitoring program (1985-2003), an upward trend in Walleye abundance in the Limestone GS reservoir was observed. This was attributed to more favorable habitat conditions for this species based on the comparatively greater CPUE of Walleye in the Long Spruce GS reservoir than in the Nelson River below the Limestone GS (NSC 2012). The decline in Walleye CPUE recorded during the recent CAMP sampling programs, in particular in comparison to relatively constant CPUEs observed downstream in the Nelson River, cannot be explained. Effects to movements of Walleye are discussed in conjunction with the fish community above.

REGIONAL CUMULATIVE EFFECTS ASSESSMENT – PHASE II WATER – FISH COMMUNITY
DECEMBER 2015 5.3-98
5.3.5.3.4 Brook Trout Brook Trout, is endemic only to northeastern North America and is naturally found in Manitoba within tributaries to Hudson Bay. This species is considered of special importance due to its unique life history characteristics, limited distribution, and cultural and recreational significance. Brook Trout are important in the diet of local First Nations, and are highly prized by the recreational fishery.
Brook Trout in the lower Nelson River primarily inhabit the tributaries, using the mainstem as a transit corridor between tributaries and the estuary. A small proportion of Brook Trout in this area move into the Hayes River system and to locations as far away as Churchill, Manitoba, but effects of past hydroelectric development are expected to have caused noticeable effects only within the Nelson River.
BROOK TROUT LIFE HISTORY
Brook Trout are typically found in riverine habitats. Preferred habitat includes: clear, cold water (range: 14–16 °C); a silt-free, rocky substrate in riffle-run areas; an approximate 1:1 pool-riffle ratio with areas of slow, deep water; well-vegetated stream banks and abundant instream cover; and relatively stable water flow, temperature regimes, and stream banks (Raleigh 1982). Groundwater (i.e., cold water) discharge is an important component for all Brook Trout life history stages (Power et al. 1999).
Brook Trout spawn during fall in areas of coarse substrate and significant groundwater input. Following emergence from their redds, YOY drift downstream and then migrate into shallow nearshore areas that are moderated by groundwater flow or into small groundwater-fed streams that provide year-round habitat with plenty of cover and food. Immature trout typically remain in their natal streams during winter or in nursery streams with suitable overwintering habitat, including deep, slow flowing areas, groundwater inputs, and overhead cover. Groundwater seepage is particularly important overwintering habitat in northern streams that may freeze to the bottom (Power et al. 1999). Adult Brook Trout are opportunistic foragers and are known to exploit a wide variety of food items including drifting and benthic invertebrates, fish, and even small mammals. A portion of the population may undertake downstream movements to exploit food resources in larger waterbodies, and even into marine environments when anadromy has developed within whole or in portions of the population (Curry et al. 2010).
DISTRIBUTION AND ABUNDANCE
Comeau (1915) provided the first government documented account of Brook Trout in the lower Nelson River. He described a migration of Brook Trout from the river into Hudson Bay immediately following ice-out in the spring (June) and returning during late July and August. Kettle Rapids was reported as the westerly limit of Brook Trout distribution in the Nelson River by Doan (1948). In an account of the construction of the Hudson Bay railroad, Bickle (1995) indicated that trout formed an important source of food for railway workers.
Historically, Brook Trout were reported in the Nelson River and its tributaries from the Kettle River downstream to Woodcock and Sam (Noochewaywun) creeks in the Nelson River estuary, and also from French and Ten Shilling creeks in the mouth of the Hayes River (Map 5.3.5A-6). Brook Trout distribution extended to the headwater lakes of the Weir River and to as far as 50 miles (80.5 km) up the Limestone River (Kooyman 1951) and into McMillan Lake (Gaboury 1978). Gaboury (1978) reported catching
REGIONAL CUMULATIVE EFFECTS ASSESSMENT – PHASE II WATER – FISH COMMUNITY
DECEMBER 2015 5.3-99
25 Brook Trout in brackish water in the Nelson River estuary in June 1977 and an additional 11 adult trout on the tidal flats between Woodcock and Blackbear creeks in 1979 (Gaboury 1980a).
Use of tributaries varied depending on the size and habitat characteristics of the stream (in particular, the location of groundwater inputs). Spawning was documented in several rivers and creeks including: the Kettle River and its tributaries (including Creek 324, Kettle Camp Creek, and Nine Mile Hole Creek), Wilson Creek (including Horseshoe Creek), Sky Pilot Creek, Leslie Creek, Moondance Creek, the Weir River, and the Limestone River and its tributaries (i.e., McMillan, Twelve Mile, Nine Mile, Bird, Three mile, and CN creeks) (Gaboury 1978, 1980a; Swanson 1986; Swanson et al. 1988) (Map 5.3.5A-7). Kooyman (1951) reported that trout in the smaller tributaries to the Nelson, Limestone, and Weir rivers were primarily YOY to three years-of-age. Very few fingerlings and none of the other lower age groups were found in the larger rivers. Swanson (1986) found no evidence of spawning in north shore tributaries to the potential Conawapa GP reservoir; these streams provided nursery and overwintering habitat for Brook Trout that had drifted out of their natal streams and then migrated into these nursery streams. Based on radio tagging studies, the majority of adult fish tagged in the Limestone River remained there though some moved to the estuary or the Lower Limestone Rapids (Swanson 1986, Swanson and Kansas 1987). Gaboury (1980a, b) found that 23% of 121 trout from Wilson Creek, and the Limestone, Weir, and Nelson rivers had strontium concentrations that suggested they were anadromous1.
Brook Trout populations in the lower Nelson River have generally declined, with the greatest decreases occurring in the tributaries farthest upstream on the Nelson River. As noted previously, the Kettle River historically had a substantial Brook Trout population. In the fall of 1984, as many as 20 Brook Trout may still have been using the spawning pool in the Kettle River (R. Glennon pers. comm. in Swanson 1986). However, by 1985 just four Brook Trout were captured at the spawning site (Swanson 1986) and no Brook Trout were captured in Nine Mile Hole Creek, 324 Creek, or in three other tributaries of the Kettle River sampled with Rotenone. No Brook Trout were captured in 29 gillnet sets during a two week survey of the Long Spruce GS reservoir in 1985 (Swanson 1986) nor in 28 gillnet sets in 1986 (Swanson and Kansas 1987), and no predation on Brook Trout by Northern Pike was noted. According to Swanson and Kansas (1987), the low abundance of Brook Trout in the Kettle River/Long Spruce GS reservoir area in 1985 and 1986 was consistent with information supplied by local Natural Resources personnel and a local commercial fisherman at the time. Recent fisheries investigations conducted in the Kettle River have yielded no captures of Brook Trout (Johnson and Barth 2007; Lavergne 2011; 2012a) and the Kettle River is assumed to no longer support a Brook Trout population.
Brook Trout numbers also declined in tributaries of the Limestone GS reservoir, although some populations remain. Brook Trout numbers in Wilson Creek are thought to have already been reduced
1 Strontium is an element that is several hundred times more concentrated in marine waters than in fresh water, which is reflected in the bony structures of fish feeding in these environments. Therefore, strontium concentrations can be used to infer whether an individual fish captured in fresh water has spent time in the marine environment.

REGIONAL CUMULATIVE EFFECTS ASSESSMENT – PHASE II WATER – FISH COMMUNITY
DECEMBER 2015 5.3-100
prior to habitat changes associated with impoundment of the Limestone GS reservoir. Gaboury (1980a) reported capturing 14 Brook Trout from the spawning pool in Wilson Creek in 1979 after unsuccessful attempts to capture trout there in 1977 and 1978. A total of 10 brook trout were captured by Swanson (1986) in Wilson Creek in 1985. Brook Trout catches in a two-way fish fence in Wilson Creek totalled 103 in 1987 (Swanson et al. 1988) and 47 in 1988 (Swanson et al. 1990). Three Brook Trout larvae were captured in Wilson creek in 1987 (Swanson et al. 1988) and 14 in 1988 (Swanson et al. 1990). Today Brook Trout are thought to have been extirpated from Wilson Creek.
Despite its position at the upstream end of the Limestone GS reservoir, a population of Brook Trout continues to persist in Sky Pilot Creek. Eleven Brook Trout were captured at the Sky Pilot Creek spawning site in 1979, but none were recaptures from previous years (Gaboury 1980a). A total of 100 Brook Trout were sampled at the Sky Pilot Creek spawning pool in 1985, yielding an estimate of approximately 200 spawners (Swanson 1986). Brook Trout catches in a two-way fish fence in Sky Pilot Creek during fall totalled 24 in 1987 and 31 in 1988 (Swanson et al. 1988, 1990). Larval Brook Trout catches in Sky Pilot Creek ranged from six to 26 fish annually from 1986 to 1989. Ten years after Limestone GS reservoir impoundment in 1990, monitoring results suggested there was little change in Brook Trout abundance in the creek compared to immediately before impoundment. Two of the three highest trout capture totals from two-direction fish fences set in the creek between 1987 and 2004 occurred after impoundment. This included 87 fish in 1991 and 77 fish in 1998 (Bernhardt and MacDonell 1992; Bretecher and MacDonell 1999b). More recent visual surveys, conducted at a known spawning site between the years 2006 and 2014, indicated a relatively stable abundance of Brook Trout spawners. The maximum number of trout counted at any one time ranged from 10 fish in 2008 to 20 fish in 2013 (Lavergne and MacDonell 2010; Lavergne 2014).
As of 2008, 19 years post-impoundment, Brook Trout were still present in Leslie Creek, albeit in extremely low numbers. Whereas 27 trout were captured in the creek in 1991, the second year after impoundment, sexually mature trout have since been captured on only three occasions, including one trout in 1992, two trout in 1999, and two more trout in 2008 (Horne and Baker 1993b; Bretecher and MacDonell 2000b; Lavergne and MacDonell 2010). Confirmed evidence of Brook Trout spawning in Leslie Creek was last provided by a drift survey conducted in 1998 (Bretecher and MacDonell 1999b). Eight trout larvae were sampled that year, the highest capture total since 1992. No trout larvae were captured in drift traps set in the creek the following year in 1999. Backpack electrofishing surveys conducted during the 1990s captured an additional 13 immature trout (including 11 YOY) in Leslie Creek (Schneider-Vieira 1994; Bretecher and MacDonell 1998b, 2000b). These catches provided further evidence of Brook Trout spawning activity in the creek during at least the first ten years after reservoir impoundment. Since that time, however, electrofishing surveys conducted between 2004 and 2014 combined to capture only one YOY specimen in 2006 (Kroeker and MacDonell 2006; Lavergne et al. 2008; Lavergne 2012b).
Brook Trout are not thought to occur in the Long Spruce GS reservoir and do not utilize habitat within the Limestone GS reservoir. Sixteen index gillnetting surveys, conducted from 1989 to 2013 and yielding more than 14,200 fish, have failed to capture a single Brook Trout in either reservoir.
Downstream of the Limestone GS, Brook Trout are currently found in the Nelson River and its tributaries from the Limestone GS downstream to the Nelson River estuary, and are known to move into the Hayes River and north along the Hudson Bay coast to at least Churchill. Turbid waters, characteristic of the
REGIONAL CUMULATIVE EFFECTS ASSESSMENT – PHASE II WATER – FISH COMMUNITY
DECEMBER 2015 5.3-101
lower Nelson River mainstem, are generally avoided by trout, although Lower Limestone Rapids and the mouths of creeks provide important foraging habitat for larger-sized individuals. The Nelson River mainstem is used by trout as a corridor between stream habitats important for different life history stages. Brook Trout (number [n] = 99) comprised ~ 1% of fish records from the lower Nelson River from 2004 to 2014.
Downstream of the Limestone GS, Brook Trout are known to inhabit over 20 streams, including 10 tributaries where spawning is known to occur (Map 5.3.5A-7). The spawning tributaries vary in size, with five being relatively small (Bird, CN, Moondance, Sundance, and Goose creeks); three moderate in size (McMillan, Nine Mile, and Twelve Mile creeks); and two considered large (the Limestone and Weir rivers). Two more moderately sized spawning tributaries (Ten Shilling and French creeks) are known in the lower reach of the Hayes River system near York Factory.
The spawning population of Brook Trout at Five Mile Hole in the Limestone River in 1979 was estimated at 75–100 fish (Gaboury 1980a). Gaboury (1980a, b) sampled 322 trout and 195 trout, 60–322 mm in length, from CN and Three Mile creeks, respectively, during early fall of 1979. It was estimated that 600 YOY and 50 yearling Brook Trout inhabited a 400 m reach of the lower portion of CN creek in 1987 (Swanson et al. 1988). Less than half as many juvenile trout (n = 282) were estimated to use the lower reaches of CN Creek in 1988 than in 1987 (Swanson et al. 1990). In 1985, the spawning population in Nine Mile Creek was estimated at 38 trout (Swanson 1986). A total of 82 Brook Trout were sampled from the Limestone River and tributaries. Annual population estimates for CN and Moondance creeks from 1987 to 2011 have ranged from tens of fish to over 800 (Table 5.3.5A-2). In Sundance and Goose creeks, population estimates have ranged from none or just a few trout to over 1,200 fish. This variability is likely related to spawning which, based on surveys of juvenile abundance, does not appear to occur on an annual basis in these two creeks. Numbers of Brook Trout captured in fish fences appear relatively constant from 1989–2006 though there may have been a decline in the Limestone River (Table 5.3.5A-3).
Gaboury (1980a) captured 168 Brook Trout at the Weir River spawning pool in 1978. In 1979, 19 trout were captured at the spawning pool, seven of which were recaptures from the previous year and one that had been tagged at Five Mile Hole in the Limestone River in 1978 (Gaboury 1980a).
SIZE AND WEIGHT AT AGE
Comeau (1915) sampled Brook Trout ranging from 250–2,500 g in weight. Brook Trout sampled from a number of lower Nelson River tributaries during the 1940s ranged from 175 to 530 mm in length, with most being around 400 mm (Doan 1948). One of the larger trout (565 mm) was taken from Sky Pilot Creek in 1947 (Doan 1948). Adult trout sampled from Nine Mile Creek during summer were between 0.5 and 1.5 kg in weight (Gaboury 1978). Gaboury (1978) noted that larger trout could be found near the mouth of Nine Mile Creek during summer but did not enter the creek until fall. Doan (1948) reported that Brook Trout ages ranged up to six years, but fish were most commonly less than four years-of-age. Gaboury (1980a) reported the maximum age as nine years.
Both Comeau (1915) and Doan (1948) noted that the trout that remained in smaller tributaries year-round did not attain the same size as the trout that migrated seaward. These fish also took longer to reach similar sizes. According to Didiuk (1975), Sky Pilot and Wilson creeks were known for their large numbers
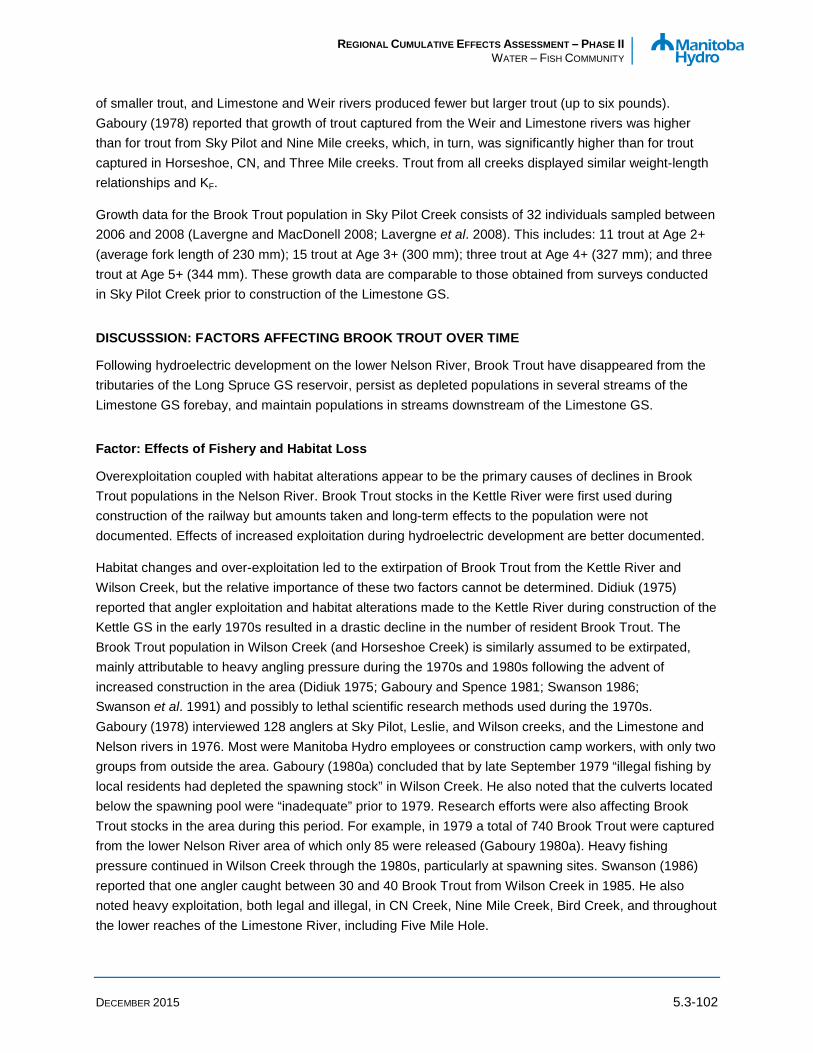
REGIONAL CUMULATIVE EFFECTS ASSESSMENT – PHASE II WATER – FISH COMMUNITY
DECEMBER 2015 5.3-102
of smaller trout, and Limestone and Weir rivers produced fewer but larger trout (up to six pounds). Gaboury (1978) reported that growth of trout captured from the Weir and Limestone rivers was higher than for trout from Sky Pilot and Nine Mile creeks, which, in turn, was significantly higher than for trout captured in Horseshoe, CN, and Three Mile creeks. Trout from all creeks displayed similar weight-length relationships and KF.
Growth data for the Brook Trout population in Sky Pilot Creek consists of 32 individuals sampled between 2006 and 2008 (Lavergne and MacDonell 2008; Lavergne et al. 2008). This includes: 11 trout at Age 2+ (average fork length of 230 mm); 15 trout at Age 3+ (300 mm); three trout at Age 4+ (327 mm); and three trout at Age 5+ (344 mm). These growth data are comparable to those obtained from surveys conducted in Sky Pilot Creek prior to construction of the Limestone GS.
DISCUSSSION: FACTORS AFFECTING BROOK TROUT OVER TIME
Following hydroelectric development on the lower Nelson River, Brook Trout have disappeared from the tributaries of the Long Spruce GS reservoir, persist as depleted populations in several streams of the Limestone GS forebay, and maintain populations in streams downstream of the Limestone GS.
Factor: Effects of Fishery and Habitat Loss
Overexploitation coupled with habitat alterations appear to be the primary causes of declines in Brook Trout populations in the Nelson River. Brook Trout stocks in the Kettle River were first used during construction of the railway but amounts taken and long-term effects to the population were not documented. Effects of increased exploitation during hydroelectric development are better documented.
Habitat changes and over-exploitation led to the extirpation of Brook Trout from the Kettle River and Wilson Creek, but the relative importance of these two factors cannot be determined. Didiuk (1975) reported that angler exploitation and habitat alterations made to the Kettle River during construction of the Kettle GS in the early 1970s resulted in a drastic decline in the number of resident Brook Trout. The Brook Trout population in Wilson Creek (and Horseshoe Creek) is similarly assumed to be extirpated, mainly attributable to heavy angling pressure during the 1970s and 1980s following the advent of increased construction in the area (Didiuk 1975; Gaboury and Spence 1981; Swanson 1986; Swanson et al. 1991) and possibly to lethal scientific research methods used during the 1970s. Gaboury (1978) interviewed 128 anglers at Sky Pilot, Leslie, and Wilson creeks, and the Limestone and Nelson rivers in 1976. Most were Manitoba Hydro employees or construction camp workers, with only two groups from outside the area. Gaboury (1980a) concluded that by late September 1979 “illegal fishing by local residents had depleted the spawning stock” in Wilson Creek. He also noted that the culverts located below the spawning pool were “inadequate” prior to 1979. Research efforts were also affecting Brook Trout stocks in the area during this period. For example, in 1979 a total of 740 Brook Trout were captured from the lower Nelson River area of which only 85 were released (Gaboury 1980a). Heavy fishing pressure continued in Wilson Creek through the 1980s, particularly at spawning sites. Swanson (1986) reported that one angler caught between 30 and 40 Brook Trout from Wilson Creek in 1985. He also noted heavy exploitation, both legal and illegal, in CN Creek, Nine Mile Creek, Bird Creek, and throughout the lower reaches of the Limestone River, including Five Mile Hole.
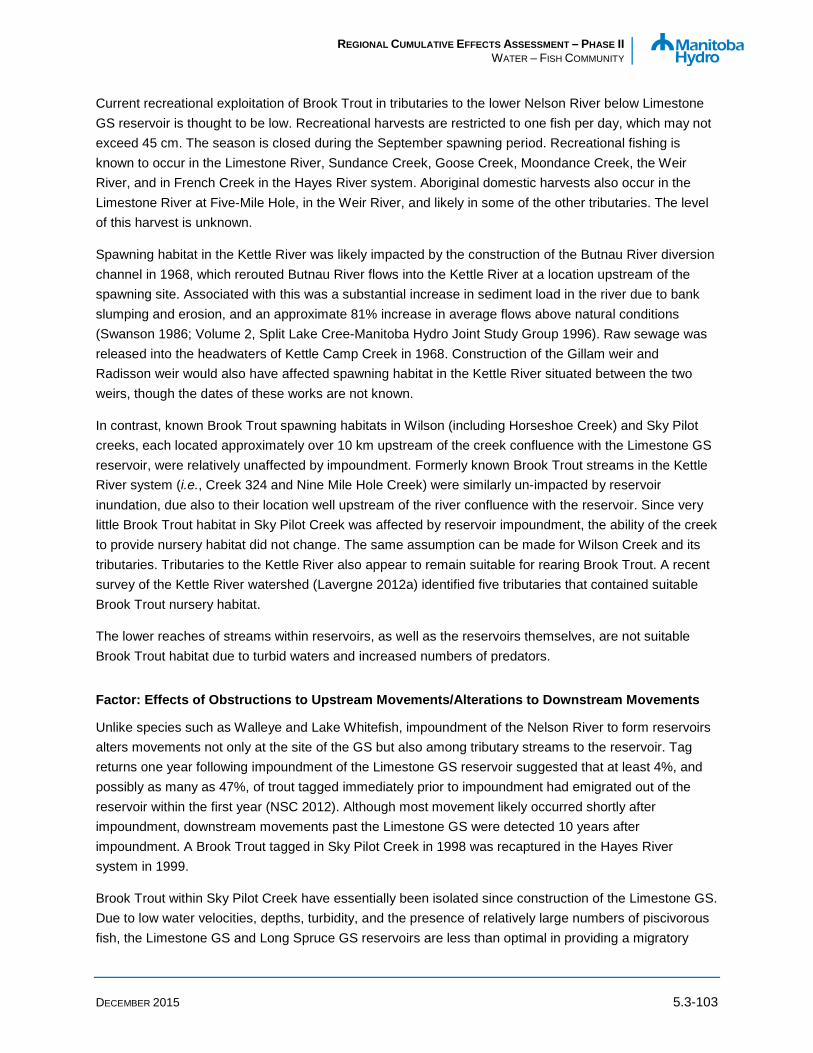
REGIONAL CUMULATIVE EFFECTS ASSESSMENT – PHASE II WATER – FISH COMMUNITY
DECEMBER 2015 5.3-103
Current recreational exploitation of Brook Trout in tributaries to the lower Nelson River below Limestone GS reservoir is thought to be low. Recreational harvests are restricted to one fish per day, which may not exceed 45 cm. The season is closed during the September spawning period. Recreational fishing is known to occur in the Limestone River, Sundance Creek, Goose Creek, Moondance Creek, the Weir River, and in French Creek in the Hayes River system. Aboriginal domestic harvests also occur in the Limestone River at Five-Mile Hole, in the Weir River, and likely in some of the other tributaries. The level of this harvest is unknown.
Spawning habitat in the Kettle River was likely impacted by the construction of the Butnau River diversion channel in 1968, which rerouted Butnau River flows into the Kettle River at a location upstream of the spawning site. Associated with this was a substantial increase in sediment load in the river due to bank slumping and erosion, and an approximate 81% increase in average flows above natural conditions (Swanson 1986; Volume 2, Split Lake Cree-Manitoba Hydro Joint Study Group 1996). Raw sewage was released into the headwaters of Kettle Camp Creek in 1968. Construction of the Gillam weir and Radisson weir would also have affected spawning habitat in the Kettle River situated between the two weirs, though the dates of these works are not known.
In contrast, known Brook Trout spawning habitats in Wilson (including Horseshoe Creek) and Sky Pilot creeks, each located approximately over 10 km upstream of the creek confluence with the Limestone GS reservoir, were relatively unaffected by impoundment. Formerly known Brook Trout streams in the Kettle River system (i.e., Creek 324 and Nine Mile Hole Creek) were similarly un-impacted by reservoir inundation, due also to their location well upstream of the river confluence with the reservoir. Since very little Brook Trout habitat in Sky Pilot Creek was affected by reservoir impoundment, the ability of the creek to provide nursery habitat did not change. The same assumption can be made for Wilson Creek and its tributaries. Tributaries to the Kettle River also appear to remain suitable for rearing Brook Trout. A recent survey of the Kettle River watershed (Lavergne 2012a) identified five tributaries that contained suitable Brook Trout nursery habitat.
The lower reaches of streams within reservoirs, as well as the reservoirs themselves, are not suitable Brook Trout habitat due to turbid waters and increased numbers of predators.
Factor: Effects of Obstructions to Upstream Movements/Alterations to Downstream Movements
Unlike species such as Walleye and Lake Whitefish, impoundment of the Nelson River to form reservoirs alters movements not only at the site of the GS but also among tributary streams to the reservoir. Tag returns one year following impoundment of the Limestone GS reservoir suggested that at least 4%, and possibly as many as 47%, of trout tagged immediately prior to impoundment had emigrated out of the reservoir within the first year (NSC 2012). Although most movement likely occurred shortly after impoundment, downstream movements past the Limestone GS were detected 10 years after impoundment. A Brook Trout tagged in Sky Pilot Creek in 1998 was recaptured in the Hayes River system in 1999.
Brook Trout within Sky Pilot Creek have essentially been isolated since construction of the Limestone GS. Due to low water velocities, depths, turbidity, and the presence of relatively large numbers of piscivorous fish, the Limestone GS and Long Spruce GS reservoirs are less than optimal in providing a migratory

REGIONAL CUMULATIVE EFFECTS ASSESSMENT – PHASE II WATER – FISH COMMUNITY
DECEMBER 2015 5.3-104
corridor for Brook Trout moving between foraging, rearing and spawning habitats. Since impoundment of the Limestone GS reservoir in 1989, a total of 384 Brook Trout have been tagged and released in Sky Pilot Creek, of which less than 3% (n = 11) have been recaptured downstream of the Limestone GS. Such downstream movement represents a permanent loss to the Sky Pilot Creek population since fish cannot move back upstream past the GS. To this point in time, the effects of such downstream emigration does not appear to have substantially affected Brook Trout numbers in Sky Pilot Creek. However, these downstream movements may have had a much more substantial effect on Brook Trout numbers in Leslie Creek. The long-term viability of the Brook Trout population in isolated streams such as Sky Pilot Creek is not known.
Construction of the Limestone and Long Spruce GSs has also resulted in the loss of anadromous Brook Trout upstream of the GSs. In 1987, Swanson et al. (1988) concluded that 2.5% of 121 trout captured from Sky Pilot and Wilson creeks and 1.7% of 174 trout (over 150 mm) captured from the Limestone River were anadromous. In 1988, only one of 151 trout (0.7%) captured from Sky Pilot, Wilson, Leslie, Nine Mile, and Twelve Mile creeks was considered anadromous. In 1989, three of 359 fish (0.84%) sampled from Goose Creek and tributaries farther upstream were considered anadromous (Swanson et al. 1991). It was concluded that the proportion of anadromous trout was likely higher historically when populations were larger and may have been as high as 24% at Five Mile Hole in the Limestone River (Swanson et al. 1988). Swanson and Kansas (1987) found a higher degree of anadromy in streams in closer proximity to Hudson Bay.
5.3.5.3.5 Cisco
Cisco (formerly known as Lake Cisco) has the most extensive North American distribution of any member of this genus. Although there is only a limited domestic fishery for Cisco in the lower Nelson River area, the species is considered ecologically important and displays an anadromous life history strategy that is particularly vulnerable to effects from hydroelectric development.
CISCO LIFE HISTORY
In general, Cisco are a cool water pelagic species with limited tolerance to higher temperatures and water velocities (Scott and Crossman 1998). While most populations remain in lakes throughout their life cycle, Cisco in tributaries of Hudson and James bays have adopted an anadromous life cycle, migrating to the ocean to feed during summer and returning to freshwater in fall to spawn and overwinter.
Cisco spawn in fall during declining water temperatures. Spawning generally occurs over sandy, gravel or cobble substrates in water less than 3 m deep, but is known to occur at greater depths in the Great Lakes. Cisco eggs develop slowly over the winter and hatch just prior to or during ice breakup. Following emergence from the spawning bed, Cisco larvae will move up in the water column to feed. When emerging in rivers, the larvae will drift passively downstream to rearing areas. Juvenile Cisco are found in abundance in mid-waters of lakes and also in the estuaries of rivers in Northern Quebec (Morin et al. 1982; Kemp et al. 1989). In eastern Hudson Bay, juvenile Cisco are typically pelagic, schooling feeders and are abundant in coastal bays and estuaries during summer (Morin et al. 1982; Kemp et al. 1989). Cisco typically overwinter in pelagic environments or in estuaries.
REGIONAL CUMULATIVE EFFECTS ASSESSMENT – PHASE II WATER – FISH COMMUNITY
DECEMBER 2015 5.3-105
DISTRIBUTION AND ABUNDANCE
There is little historical information on Cisco in the lower Nelson River. Comeau (1915) reported on “whitefish” from the lower Nelson River and coastal areas but did not distinguish Lake Whitefish from Cisco.
Cisco catches in both the Long Spruce and Limestone GS reservoirs have been consistently low during gillnet studies. For both areas, Cisco comprised less than one percent of the catch each year (Johnson et al. 2004). North/South Consultants Inc. (2012) noted that after impoundment, which excluded anadromous Cisco, any Cisco in the reservoirs would be pelagic lake dwellers likely originating from upstream lakes (e.g., Stephens Lake). The habitat within the reservoirs is expected to be too riverine to support a substantial population of pelagic Cisco and so Cisco are expected to persist in low numbers.
From 2004 to 2010, 1,749 Cisco occurrences were documented in the mainstem Nelson River comprising 7.0% of the fish records. Abundance and distribution of Cisco in the lower Nelson River varies seasonally. Habitat-based electrofishing studies throughout the Nelson River mainstem have demonstrated dramatic seasonal variations in Cisco numbers, from a few sporadic individuals during July and August to hundreds in September. In 1992, for example, relatively low Cisco catches were obtained during electrofishing across all habitat types and seasons (1.7% of overall CPUE). In the fall, however, catches of Cisco were five times greater than in spring or summer (Remnant and Baker 1993). Similarly, in 1991 Cisco comprised less than 1% of the large-bodied fish species gillnet catch in the Nelson River at the Angling River in spring and summer, but almost 9% of the catch during fall (MacDonell 1992). Seasonal boat electrofishing studies in the Nelson River in 2004 and 2005 (Nelson and MacDonell 2007) found that Cisco were only sporadically captured during July and August, with low CPUEs in all habitat types. During September, however, Cisco numbers increased dramatically, with the highest catches at the Lower Limestone Rapids.
Beginning in early fall, Cisco migrate from Hudson Bay up the lower Nelson River mainstem to their spawning grounds in the Limestone and Weir rivers. In 1990, it was estimated that at least 18,000 Cisco moved upstream into the Nelson River, of which over 90% migrated up the Limestone River while less than 10% migrated up the Weir River (MacDonell 1991; MacDonell 1992; MacDonell 1993). Since 1990, the number of Cisco moving up the Limestone River during fall has been declining (Table 5.3.5A-4). It is estimated that less than 400 migrated into the river in 2009 (Mandzy et al. 2011). In contrast, the numbers moving into the Weir River during fall are estimated to have increased to over 8,800 by fall 2009 (Mandzy et al. 2011). Recent electrofishing catches suggest that the number of Cisco moving upstream past the Weir River is substantially lower than the numbers that may reach the Weir River. Electrofishing CPUEs from the Angling River to Limestone River reach in fall 2013 (0.05 fish per minute; Ambrose et al. 2014) and 2014 (0.04 fish per minute; Ambrose and MacDonell 2015) were approximately ten times lower than from the Gillam Island to Weir River reach in fall 2009 (0.53 fish per minute; Mandzy et al. 2009).
Although Cisco are uncommon in the Nelson River proper in all seasons except fall, the species is commonly found in the estuary during the entire open water season (Baker 1990). Cisco comprised 37% of the catch in a nearshore gillnetting survey of the estuary in fall, 2009 (Bernhardt et al. 2012). The majority of Cisco captured were juveniles and most were encountered east of the Hayes River and north of Port Nelson including at the mouths of the coastal tributaries.

REGIONAL CUMULATIVE EFFECTS ASSESSMENT – PHASE II WATER – FISH COMMUNITY
DECEMBER 2015 5.3-106
Similar to Cisco in the Nelson River, Cisco in the Hayes and Churchill rivers are anadromous, travelling into Hudson Bay. Anadromous migrations of Cisco also occur in tributaries of Hudson and James bays in Quebec (Kemp et al. 1989). Genetic analysis of tissue samples collected from the Churchill, Hayes, and Nelson rivers during the open water seasons of 2004, 2005, and 2006 (Milot et al. 2007) indicate that Cisco from the three rivers do not represent a single interbreeding population. A marked genetic difference exists between Churchill River Cisco and Cisco from both the Hayes and Nelson rivers, suggesting that there has been little demographic exchange between the northern and southern areas. A significant difference, albeit weaker, also exists between Cisco from the Hayes and Nelson rivers indicating that these two populations do not completely interbreed.
DISCUSSSION: FACTORS AFFECTING CISCO OVER TIME
The reason for the decline in Cisco is not known and, as discussed below, none of the explanations considered to date appear to be likely candidates.
Available data do not indicate whether the anadromous form of Cisco moved farther up the Nelson River than the Limestone River prior to construction of the Limestone GS. However, there are no large tributaries upstream until the Kettle River, which could only have been reached after ascending the Limestone Rapids. The overall abundance of Cisco appears to have declined in the lower Nelson River over the past three decades, based on the reduction in number of upstream migrants in the Limestone River.
Studies conducted in the early 1990s indicated that the Limestone River supported the largest upstream migration of Cisco. Although construction and operation of the Limestone GS has not had an obvious effect to the ability of fish to access the Limestone River, or created conditions unsuitable for larvae drifting out of the river, it is possible that some as yet undetermined factor has made the environment less suitable. Cisco are thought to not spawn every year and are relatively short-lived (NSC 2012), so adverse effects to spawning and recruitment would result in a fairly rapid reduction in population numbers.
As was discussed with respect to the fish community as a whole, other factors apart from hydroelectric development may affect the fish community. As with the upstream reach, Rainbow Smelt were recorded downstream of the Kettle GS after 1996. In the lower Nelson River, Rainbow Smelt comprised 29% of the catch in small mesh gillnets during the period 2008–2010 (CAMP 2014). Whether the increase in Rainbow Smelt has had a negative effect on Cisco populations, as has been documented for coregonines in other waterbodies, is not known; however, the initial decline in the Cisco migration up the Limestone River occurred prior to the arrival of Rainbow Smelt.
The effects of climate in this reach would be similar to those in the upstream environment, in that conditions would generally become more suitable for cool water species and less suitable for cold water species. Cisco are intolerant of warm water temperature but whether conditions have become less suitable in either the Limestone River of the Nelson River mainstem is not known.
Finally, it should be noted that Cisco spend a substantial portion of their lives in Hudson Bay, and it is possible that changes in the estuarine or marine environment have affected the number of Cisco.

REGIONAL CUMULATIVE EFFECTS ASSESSMENT – PHASE II WATER – FISH COMMUNITY
DECEMBER 2015 5.3-107
5.3.5.4 Cumulative Effects of Hydroelectric Development on the Fish Community from the Kettle Generating Station to the Nelson River Estuary
Using published literature and de novo data analysis, changes to the fish community in the reach of the Nelson River downstream of the Kettle GS were examined. As described in Section 5.3.5.1, in addition to the indicators described in Area 1 and the upstream portion of Area 2, Brook Trout and Cisco, which are of key importance in this reach, were examined. Scientific studies began in the mid-1980s, after construction of the Kettle and Long Spruce GSs, the initial cofferdams for the Limestone GS, and CRD/LWR. Therefore, it is not possible to conduct a pre/post-hydroelectric development assessment. Potential changes were inferred from changes observed after development of the Limestone GS, as well as on-going monitoring of tributary streams and the mainstem of the Nelson River. The current analysis focussed on data collected during the Limestone GS aquatic monitoring program (1985–2003) and CAMP (2008–2013).
The Nelson River downstream of the Kettle GS to the estuary experienced numerous changes as a result of hydroelectric development. Effects to the water regime included changes in water levels and flows downstream of the Kettle, Long Spruce, and Limestone GSs, increased flows in winter, and changed seasonal flow patterns as a result of CRD/LWR. Other effects included increased erosion and sediment deposition in each of the reservoirs, habitat change in the reaches impounded by each of the GSs, and more dewatering of the riverbed downstream of the GSs, depending on cycling at the GS. Fish movements were also affected by the GSs.
Impoundment by the GSs has resulted in shifts in species composition and abundance in the reservoirs, but effects are difficult to quantify due to difficulty in sampling the reservoirs and the un-impounded river in a comparable manner. At impoundment, species such as Longnose Sucker, Lake Whitefish, and Lake Sturgeon appeared to move downstream out of the reservoirs. Riverine species such as Longnose Sucker are less prevalent in the reservoirs than in the mainstem environment downstream. Walleye numbers were markedly higher than in the mainstem of the river approximately a decade ago but have recently declined. Lake Whitefish tend to be more abundant in the river downstream of the GSs but their abundance varies seasonally and among locations.
A decrease in fish productivity as a result of periodic dewatering of the river caused by cycling at the GSs is not readily apparent, as fish move into and out of areas as they become wetted on a daily basis.
Brook Trout, which inhabit primarily tributary streams, were adversely affected by increased angling pressure, infrastructure (e.g., diversions to the Kettle River), flooding of stream habitat, and loss of a movement corridor both within the reservoirs and past the GSs. Populations affected by multiple stressors were extirpated, while those affected by flooding of habitat and loss of movement corridors have persisted but may not be viable in the long-term. Anadromous trout, which migrated to coastal waters, are no longer present upstream of the GSs.
Cisco occur primarily in the anadromous form in the lower Nelson River. The overall Cisco population in the lower Nelson River has declined, but the reasons for this decline are not clear and may be related to events independent of hydroelectric development.

REGIONAL CUMULATIVE EFFECTS ASSESSMENT – PHASE II WATER – FISH COMMUNITY
DECEMBER 2015 5.3-108
5.3.6 Area 3: Southern Indian Lake This reach of Area 3 is bounded on the upstream end by Leaf Rapids on the Churchill River and extends through Opachuanau Lake and all of SIL with its outlets at the Missi Falls CS and the South Bay Diversion Channel (Map 5.3.6-1). Southern Indian Lake was divided into eight Historical Geographic Areas (HGAs) by DFO, including Opachuanau Lake (Newbury et al. 1984).
The CRD was constructed between 1973 and 1976 (Hydroelectric Development from 1950 to 1976, Section 2.2.4). The CRD has three main components:
• the Missi Falls CS at the natural outflow of SIL, which raises the level of SIL by approximately 3 m;
• the South Bay Diversion Channel from South Bay of SIL to Issett Lake, which creates a new outlet that allows water to flow from the Churchill River into the Rat/Burntwood River system; and
• the Notigi CS located on the Rat River at the outlet of Notigi Lake which regulates the flow into the Burntwood/Nelson River system.
The CRD is operated under a mode of operation known as the Augmented Flow Program (Water Regime, Section 4.3.3.1).
5.3.6.1 Key Published Information Prior to CRD, the fish community of SIL was first described by McTavish (1952) and then as part of pre-project studies for the LWCNRSB (Weagle and Baxter 1973; Ayles and Koshinsky 1974). Ayles (1976) reported on the spawning and population characteristics of Lake Whitefish in SIL prior to impoundment. Department of Fisheries and Oceans presented experimental gillnet data collected on SIL from 1972 and other years leading up to the construction and operation of CRD until 1982 to determine Lake Whitefish production (Bodaly et al. 1980, 1983a, 1984a).

SILArea 1
SILArea 7 SIL
Area 3
Leaf Rapids
Thompson
O-Pipon-Na-Piwin Cree NationSouth Indian Lake
Nisichawayasihk Cree NationNelson House (NAC)
KelseyG.S.
Wuskwatim G.S.
493
280
6
391
BigSandLake
WuskwatimL.
Notigi Lake
IssettLake
OpachuanauLake
Lake
Rat River
MynarskiLakes
Southern
Indian
Leaf Rapids
LeftrookLake
PemichigamauLake
First Rapids
SouthBay
BaldockLake
ThreepointLake
WapisuLake
Rat Lake
BirchTreeLake
ApussigamasiL
BarringtonLake
GranvilleLake
Gauer Lake
Burntwood R.
FootprintL.
South Bay Diversion Channel
SILArea 4
SILArea 6
SILArea 5
SILArea 2
Southern Indian Lake
South BayDiversion Channel to First Rapids
Missi Falls
Control Structure
Notigi Control Structure
Manasan Control Structure
1.0
22-OCT-15
North/South Consultants
Province of Manitoba, Government of Canada, North/South Consultants andManitoba Hydro.
04-DEC-15
Hudson Bay
Thompson
Churchill
Regional Cumulative Effects Assessment
NAD 1983 UTM Zone 14N
0 10 20 Kilometres
0 10 20 Miles
DATA SOURCE:
DATE CREATED:
CREATED BY:
VERSION NO:
REVISION DATE:
QA/QC:
COORDINATE SYSTEM:
RCEAArea 3
Legend
Fish Community Assessment AreaSouthern Indian Lake to First Rapids
RCEA Area 3
NOTE: (NAC) Northern Affairs Community
RCEA Region of InterestFish Community Reach BoundarySouthern Indian Lake (SIL) Historical Geographic Area
Generating Station (Existing)Control StructureTransmission Line (Existing)
HighwayRailFirst Nation Reserve
Map 5.3.6-1
REGIONAL CUMULATIVE EFFECTS ASSESSMENT – PHASE II WATER – FISH COMMUNITY
DECEMBER 2015 5.3-110
A number of studies have examined the spawning success of fish species since CRD. Fudge and Bodaly (1984) presented information on the potential effects of increased erosion and sedimentation on Lake Whitefish spawning success. Bodaly and Lesack (1984) documented the short-term effects of flooding of a bay in SIL on Northern Pike reproduction and recruitment. Strange et al. (1991), under FEMP, expanded on this work and presented a longer time series on Northern Pike reproductive success within the same bay following CRD. More recent work funded by the South Indian Lake Environmental Steering Committee (SILESC) has focused on the identification of Lake Whitefish spawning habitat through the collection of eggs and larvae between 2003 and 2009 (Johnson and Remnant 2004; Graveline and Remnant 2005; Caskey and Remnant 2006, 2008, 2009; NSC 2010a). Because sedimentation has been linked to decreased survival of Lake Whitefish eggs, the SILESC requested information be collected on current rate of sediment deposited in SIL during winter (NSC 2013).
The movements of fish within and out of SIL have also been a focus of study. Bodaly (1980) reported on pre- and post-spawning movements of Walleye in two tributaries to SIL from 1975 to 1978. Barnes (1990) and Barnes and Bodaly (1990, 1994) investigated the origin of Lake Whitefish pooled below the Missi Falls CS in the mid-1980s. Graveline and Remnant (1999, 2004) reported on movements of Lake Whitefish and other species tagged in SIL during the fall of 1998. Gurney and Remnant (2005) reported on movements of spawning Walleye and other species in four streams flowing into SIL during spring 2004. Mota and Remnant (2006) documented the use of Sandhill Stream and Waddie River by spawning fish during early spring 2005. The preliminary results of a Walleye spawn camp are summarized in Manitoba Hydro 2014b. Manitoba Hydro funded studies to monitor the movements of fish through the Missi Falls CS between 2007 and 2010 (NSC and Biosonics Inc. 2008, 2009, 2010, 2011).
In 2013, the SILESC commissioned a study to determine the possible cause(s) for the collapse of the whitefish fishery and make recommendations for its recovery (Bodaly 2013a, b; Hesslein 2013; McCullough 2012).
Three distinct areas of SIL continue to be monitored as part of CAMP. Additional index gillnetting surveys and benthos studies were conducted at the request of the SILESC in 2011, 2012, and 2013 in areas of SIL that were not being monitored by CAMP (Aiken 2014; Aiken and Remnant 2013; Michaluk and Remnant 2012; Capar et al. 2012). North/South Consultants Inc. (2014) summarized the environmental monitoring conducted on SIL between 1998 and 2014 on behalf of the SILESC.
5.3.6.2 New Information and/or Re-analysis of Existing Information Fish population information from the published literature was supplemented with historic data that had previously not been published as well as published data for which the raw data were made available for re-analysis with data collected under CAMP.
Fish community sampling has been conducted on SIL and its tributaries since 1952. Although a variety of different sampling methods have been employed, many of the studies have used standard gang index gillnets as the primary means of sampling the large-bodied fish community. Over time, there have been differences in the mesh sizes used, sampling sites, time of sampling, and sampling design (i.e., habitat-based sampling versus Lake Whitefish-focussed sampling).
REGIONAL CUMULATIVE EFFECTS ASSESSMENT – PHASE II WATER – FISH COMMUNITY
DECEMBER 2015 5.3-111
Most of the pre- and immediate post-CRD index gillnetting data on SIL was conducted by DFO between 1972 and 1982 (Bodaly et al. 1980, 1983a). To make the DFO data comparable to the CAMP data collected between 2008 and 2013, it was necessary to eliminate the data generated from some of the mesh sizes used by DFO (e.g., 1.5 inch mesh) that were not used in subsequent studies and some of the data collected by CAMP (i.e., small mesh nets) that were not collected in previous studies.
Manitoba Fisheries Branch conducted index gillnetting surveys in SIL Area 4 in most years between 1981 and 2007 to assess the biological characteristics of the Lake Whitefish population being harvested by the commercial fishery. This work was also carried out in SIL Area 1 in some years. In most years the work was conducted in summer or fall, but in some years winter sampling was conducted. There were also differences in sampling design between the MFB studies (Lake Whitefish-focussed sampling) and the CAMP studies (habitat-based sampling). Where possible, the results of the MFB studies have been incorporated into the relevant metric analyses.
Additional unpublished. information on the fish community of SIL that has been uncovered, including the identification of pre-CRD Walleye spawning streams and areas cleared as potential Lake Whitefish spawning habitat, have been incorporated into the discussion of factors affecting Walleye and Lake Whitefish over time.
Some differences in methods remain between the gillnetting studies that were selected for the quantitative analysis. The DFO studies used slightly different mesh panels (2, 2.75, 3.5, 4.25, and 5.25 inch) that were 50 yards long compared to typical standard gangs (2, 3, 3.75, 4.25, and 5 inch) that are 25 yards long. There were differences in the number of sites fished between studies, as well as how those sites were selected. In addition, there are differences in the timing of gillnetting studies; the DFO sampling occurred from June to October, while CAMP studies occurred in August, and the studies by SILESC occurred between August and late-September. The MFB gillnetting program has considerable design differences from those conducted by the other agencies, so the data are not directly comparable. Where appropriate, the data have been selected using these same standards but they are presented as a separate analysis.
5.3.6.3 Changes in the Fish Community and Focal Species over Time
The following discussion is based on a combination of the results found in key published information and a reanalysis of novel and selected existing data. The available comparable data were grouped into three time periods and analyzed: pre-diversion (1972–1975), immediate post-diversion (1976–1982), and current post-diversion (2008–2013).
REGIONAL CUMULATIVE EFFECTS ASSESSMENT – PHASE II WATER – FISH COMMUNITY
DECEMBER 2015 5.3-112
5.3.6.3.1 Fish Community
INDICATOR: ABUNDANCE
Metric: Catch-Per-Unit-Effort
Catch-per-unit-effort was calculated for all species (i.e., the total catch) captured in standard gangs set in each of six HGAs of SIL (Figure 5.3.6A-1). Because Opachuanau Lake was only sampled once in each of two periods it has not been included in the box plots. Pre-diversion (1972–1975), the mean total CPUE varied from 54 fish/100 m/24 h in SIL Area 6 to 103 fish in SIL Area 2. The value in Opachuanau Lake in 1972 was similar to that in SIL Areas 1 and 2 (94 fish/100 m/24 h). Immediately after diversion (1976–1982), the mean total CPUE varied from approximately 40 fish/100 m/24 h in SIL Area 6 to 69 fish /100 m/24 h in SIL Area 5. There were no data available for this period for SIL Areas 1, 2, 3, or Opachuanau Lake. In the most recent period (2008–2013), mean total CPUE varied from approximately 25 fish/100 m/24 h in SIL Area 3, to 55 fish in SIL Area 5. The mean value in Opachuanau Lake was slightly higher at 63 fish/100 m/24 h. The box plots show a decreasing trend in total CPUE from the pre-diversion period to the recent period in all HGAs of SIL and Opachuanau Lake. In all HGAs of SIL, the median values for sets in the recent post-CRD period are considerably lower than the lower quartile of sets in the pre-period. The median values for the early post- and recent-post periods are more similar, with the median of the recent post-period overlapping the lower quartile of the early post-period.
Currently, annual mean CPUE values in the lake are generally higher in the northern areas of SIL, SIL Areas 4 and 5 (range 54 to 58 fish/100 m/24 h) compared to those areas to the south, SIL Areas 1 to 3, (range 25 to 37 fish/100 m/24 h), with CPUE values in South Bay, SIL Area 6, lying between the north and south (41 fish/100 m/24 h). The CPUE in two nearby off-system waterbodies (Granville and Gauer lakes) that are monitored annually as part of CAMP was about 80 fish/100 m/24 h, approximately a third higher than in SIL Areas 4 and 5 of SIL and twice that in SIL Areas 1 and 6. Historically, CPUEs in SIL were within the range of, or in the case of SIL Areas 1 to 3, even higher than those currently observed in off-system waterbodies. However, there is no historical information to confirm whether CPUEs in the off-system waterbodies have varied over time.
Because of differences in methods (Appendix 5.3.1B), CPUE could not be calculated in the same way for the gillnetting data collected over an almost 30 year period (1981 to 2007) by MFB in SIL Areas 1 and 4. A comparison of the number of fish captured per overnight set in SIL Area 4 shows that the median value during the 2000s (120 fish/set) is lower than the lower quartile of the 1980s and 1990s (146 and 164 fish/set, respectively) suggesting that there has likely been a decrease in the abundance of fish (Figure 5.3.6A-2). A decreasing trend was not observed in SIL Area 1 with the median value during the 2000s (89 fish/set) falling in the range of those measured during the 1980s (79 fish/set) and 1990s (131 fish/set) (Figure 5.3.6A-2).
While efforts were made to standardize the data sets among the surveys (Appendix 5.3.1B), residual differences in methods among studies may have contributed to the observed differences in CPUE over time. For example, the inclusion of sampling sites that are not expected to produce high yields in order to sample a greater diversity of available habitat types can result in lower average CPUEs. As one can observe from Map 5.3.6A-1, the study by DFO sampled only a few sites in each of the SIL areas

REGIONAL CUMULATIVE EFFECTS ASSESSMENT – PHASE II WATER – FISH COMMUNITY
DECEMBER 2015 5.3-113
compared to later studies, which sampled a larger number of sites scattered in many different areas of the lake.
INDICATOR: DIVERSITY
Metric: Relative Abundance
The number of species captured in index gill nets was consistent among sampling periods. The same nine species were captured in all three time periods throughout SIL and Opachuanau Lake: Burbot, Cisco, Longnose Sucker, Northern Pike, Sauger, Yellow Perch, Lake Whitefish, Walleye, and White Sucker. Goldeye were only captured in small numbers in SIL Areas 2 and 6 in the pre- and early post-CRD periods. Only one additional species, Troutperch, was captured in the recent post-CRD surveys. The observation of Troutperch in more recent standard gang surveys is not unexpected since the species is native to the region with a wide distribution.
Relative abundance was calculated as the percentage contribution of each species to the total catch in each of six HGAs of SIL and Opachuanau Lake (Figure 5.3.6A-3). Immediately pre-diversion, the most common large-bodied species were Lake Whitefish, White Sucker, Longnose Sucker, and Northern Pike. Longnose Sucker were particularly abundant in catches from SIL Areas 3 and 4 (> 30%), while Cisco and Walleye were more dominant in catches from South Bay (SIL Area 6, > 20%). Lake Whitefish accounted for > 20% of the catch in all areas except for SIL Area 1 and Opachuanau Lake. White Sucker dominated the catch in Opachuanau Lake. In the early post-diversion period, there was an increase in the relative abundance of Cisco in both SIL Areas 4 and 5 and decreases of both Walleye and White Sucker. This pattern was reversed in SIL Area 6. The relative abundance of Lake Whitefish remained comparable to pre-diversion catches. There are no data for this period for SIL Areas 1, 2, 3, or Opachuanau Lake. More recently, there has been a general decline in the proportion of Lake Whitefish in the catch in all areas of SIL except for SIL Area 1 and Opachuanau Lake, where proportions were low historically. White Sucker and Walleye have also shown a decreased abundance in catches in several areas. Both Sauger and Cisco have increased in relative abundance, particularly the proportion of Sauger in SIL Area 6.
Recent catches in standard gangs in two nearby off-system waterbodies, Granville Lake on the upper Churchill River and Gauer Lake (on a tributary to the lower Churchill River) consist of a similar species assemblage, with a few notable differences (Figure 5.3.6A-4). The fish community of Granville Lake is similar to that of much of SIL in that it is dominated by White Sucker (> 60%) and, to a lesser extent, Walleye and Sauger (each 11%), but unlike SIL, had a low proportion of coregonines (< 6%) and Longnose Sucker (< 3%) in the catch. An additional species, Shorthead Redhorse, has only been observed in Granville Lake. Catches in Gauer Lake are most similar to those from SIL Area 5, and are dominated by White Sucker, Walleye and Northern Pike (combined accounting for >60%) with a low representation of Cisco (5%) and Sauger (none), but differed from SIL Area 5 in that Lake Whitefish was well-represented (> 20%) and Longnose Sucker were rare (< 2%).
Surveys conducted by MFB in SIL Area 4 between 1981 and 2007 show how the relative abundance of species differs seasonally. The proportion of Lake Whitefish in the catch was lower during the winter (range of 7–32%) compared to the open water season (range 19–79%). Longnose Sucker were virtually absent from catches during the winter, whereas Burbot accounted for a greater portion of the winter

REGIONAL CUMULATIVE EFFECTS ASSESSMENT – PHASE II WATER – FISH COMMUNITY
DECEMBER 2015 5.3-114
catch. A comparison of the open water catches in SIL Area 4 over three decades shows a decrease in Lake Whitefish since the 1980s and an increase in Longnose Sucker and Northern Pike in the 2000s (Figure 5.3.6A-5). Although not constituting a large proportion of the catch, Walleye, White Sucker and Yellow Perch showed a concomitant increase in relative abundance over the time series. Catches in SIL Area 1 over the same time period are more consistent among decades (Figure 5.3.6A-5). It should be noted that because the objective of the MFB study was to maximize the capture rate of Lake Whitefish rather than sampling the fish community, it is not surprising that trends in relative abundance differ from those observed as part of the DFO and CAMP studies discussed previously.
The relative abundance of fish species captured in standard gangs is a function of the type of aquatic habitat sampled. Prior to CRD, McTavish (1952) reported that Walleye and White Sucker were common along reefs and rocky shorelines of the mainland and islands and in the long bays of the southwestern portion of SIL, and in the central area north of the narrows to Long Point. Cisco, Longnose Sucker, and Burbot were abundant in deeper waters, while White Sucker were very abundant in shallower water in the bays. Changes in habitat resulting from the impoundment of SIL has undoubtedly affected the relative abundance of particular species in gill nets.
For example, SIL Area 6, also known as South Bay, was converted under diversion from an off-current bay that did not receive Churchill River flow to a flowing system. The relative abundance of Sauger captured in recent gillnetting surveys in SIL Area 6 is much higher than in pre- and early post-CRD surveys. At the same time there has been a decrease in the representation of a number of species typically associated with lacustrine environments, such as Northern Pike, Walleye, Yellow Perch, and White Sucker, and an increase of more typically riverine species such as Longnose Sucker.
Differences in methods could be contributing to observed differences in the relative abundance of the gillnetting catch over time, as discussed above for CPUE. The sampling of different habitat types during the different surveys (Map 5.3.6A-1) may have contributed to some of the differences observed in the relative abundances of species in catches over time. For example the DFO studies in the 1970s and 1980s focused on primarily deeper waters (”shallow sites” ranged from 3–7 m before flooding and 6–10 m after flooding; “deep sites” were greater than 8 m prior to flooding and greater than 11 m after; Bodaly et al. 1980) compared to later studies by SILESC/CAMP that sampled a wider variety of habitats (depths ranged from 1–30 m; Table 6-1 in NSC 2014).
Metric: Hill’s Index
A Hill’s diversity number was calculated from the combined catch at all sites sampled in a year for each of six HGAs in SIL (Figure 5.3.6A-6). Because Opachuanau Lake was only sampled once in each of two periods it has not been included in the box plots. Pre-diversion, the average index values ranged from 4.5 (SIL Area 4) to 5.8 (SIL Area 6). Opachuanau Lake had a diversity score of 5.0 in 1972. Over time, the index values have increased for all areas, with the exception of SIL Area 6 and Opachuanau Lake. Since the number of species captured in standard gang index gill nets has remained consistent over time, the observed increase in the Hill’s number likely reflects an increase in the evenness of species representation. In SIL Area 6 and Opachuanau Lake, the mean value is considerably lower in the most recent period; this decrease is likely a result of the large proportion of one species, Sauger and White Sucker (respectively), in the catch.
REGIONAL CUMULATIVE EFFECTS ASSESSMENT – PHASE II WATER – FISH COMMUNITY
DECEMBER 2015 5.3-115
In the current period, there is considerable variation in the Hill’s Index among six HGAs of SIL. The Hill’s index is highest in SIL Areas 1 and 2 (mean of 7.1 and 7.7, respectively), lower in SIL Areas 3 and 5 (mean of 6.0 and 5.8, respectively), and lowest in SIL Areas 4 and 6, and Opachuanau Lake (mean of ~5). The fish communities of South Bay (SIL Area 6) and the Missi Falls CS area (SIL Area 4) are less diverse than other regions of the lake. An increase in the Hill’s index is a movement away from the pre-diversion conditions in the lake, except in South Bay.
The Hill’s index on Granville Lake, an off-system waterbody located upstream on the upper Churchill River is considerably lower (mean 3.8) than values currently (mean > 4.9) and historically (mean > 4.5) observed throughout SIL. The low value in Granville Lake is likely the result of the large proportion of White Sucker. In contrast, the Hill’s index on Gauer Lake (mean 5.5), an off-system waterbody located on a tributary to the lower Churchill River, is similar to values throughout much of SIL (mean of SIL Areas 4, 5, 6 is 4.9 to 5.8), but lower than SIL Areas 1, 2 and 3 (mean 6.0 to 7.7).
DISCUSSION: FACTORS AFFECTING THE FISH COMMUNITY OVER TIME
Currently, the fish community in SIL consists of at least 15 fish species. Several species of large-bodied fish are common throughout the lake; the most common species captured in standard gang index gill nets are Longnose Sucker, White Sucker, Cisco, and Northern Pike, with the dominant species varying by area and year. Walleye are relatively uncommon in the lake except in SIL Area 5, while Sauger are only common in SIL Area 6. Fish CPUEs are typically higher in northern areas of the lake (SIL Areas 4–5), compared to the more southern areas (SIL Areas 1–3), but the diversity index of the fish community is higher in the south (SIL Areas 1–2) compared to the rest of the lake. In terms of forage fish, the most common small-bodied species throughout the lake are Spottail Shiner, Emerald Shiner, and Troutperch. South Bay (SIL Area 6), as well as SIL Areas 2 and 5, is particularly productive in terms of forage fish (NSC 2014). Juvenile Cisco and Sauger are frequently captured in small mesh nets set in SIL Areas 1 and 4. The lake currently supports commercial and domestic fisheries.
The index gillnetting catches in two off-system waterbodies near SIL consist of the same large-bodied fish species as observed in SIL. Only one additional species, Shorthead Redhorse was observed in low numbers in Granville Lake. However, the proportion of different species in the catches in the off-system lakes varied. Both off-system lakes generally have a lower proportion of Longnose Sucker, Cisco, and Burbot and a higher proportion of Yellow Perch compared to SIL. Gauer Lake and SIL Area 5, neither of which receive through flow from the Churchill River, have high proportions of White Sucker, Walleye, and Northern Pike, whereas Sauger are more abundant in areas influenced by the Churchill River, such as Granville Lake and SIL Areas 1, 2, 3, and 6. Current CPUE values throughout SIL are lower, by a third to a half, compared to either off-system waterbody. There was considerable variability in the diversity index among the off-system waterbodies. Diversity in Granville Lake was considerably lower than in either Gauer Lake and SIL, while that of Gauer Lake was within the range of those in SIL Areas 4 to 6, but lower than in SIL Areas 1–2.
The species composition in SIL has not varied considerably over time. A similar composition of large-bodied species was observed in fish community investigations conducted in 1952, in which ten species of fish were netted: Lake Whitefish; Cisco (which was identified as two separate species); Northern Pike; Walleye; Sauger; Burbot; Longnose Sucker; White Sucker; and Yellow Perch (McTavish 1952). At that
REGIONAL CUMULATIVE EFFECTS ASSESSMENT – PHASE II WATER – FISH COMMUNITY
DECEMBER 2015 5.3-116
time, the author noted that while Goldeye were not observed in any of the catches, there were likely some present in SIL since they had been reported in the commercial catch from Opachuanau Lake. Since then studies by LWCNRSB and DFO captured Goldeye in SIL Areas 2 and 6 both just prior to and immediately after diversion (Ayles et al. 1974; Bodaly et al. 1980, 1983a).
Bodaly and Lesack (1984) and Strange et al. (1991) concluded that the flooding of Wupaw Bay in SIL initially improved reproductive success for Northern Pike, but ultimately negatively affected the quality of the spawning habitat and, consequently, negatively impacted the local Northern Pike population. However, some of the available relative abundance data collected over time do not suggest that this effect was felt on a lake-wide basis nor over a long time period. Figure 5.3.6A-3 shows that in southern regions of SIL (SIL Areas 1, 2, and 6) the relative abundance of Northern Pike has increased somewhat from the pre-diversion period to the current post-CRD period, while the relative abundance of Northern Pike has decreased somewhat over the same time period in SIL Areas 3–5. MFB studies conducted in SIL Area 4 show that the relative abundance of Northern Pike increased from ~2% of the catch in summer 1981–1986 and summer 1992–1998 to ~12.5% in summer 2000–2007 (Figure 5.3.6A-5). Figure 5.3.6A-4 shows that Northern Pike constitute roughly 10% of the fish community in SIL Areas 1, 3, 4, and 6 and roughly 20% of the fish community in SIL Areas 2 and 5 in the current post-CRD period, similar to that of Granville Lake (~10%) and Gauer Lake (~20%). It should be noted that differences in methods between the study periods may explain some of the variability.
Common forage species captured in seine hauls conducted in 1952 throughout SIL included Emerald Shiner and Ninespine Stickleback, and, to a lesser extent, Johnny Darter, Spottail Shiner, and Slimy Sculpin (McTavish 1952). Small mesh gill nets have only been used in more recent studies of SIL to study the forage fish community. These studies report that Troutperch, along with Emerald and Spottail Shiner, are among the most common species that occur throughout the lake (NSC 2014). Other species that have been observed in small mesh nets include Slimy, Spoonhead, and Mottled Sculpin, Northern Pearl Dace, and Logperch. Juvenile Cisco and Sauger are also captured frequently in SIL Areas 1 and 4. Differences in the forage community sampled in 1952 and the recent period are likely an artifact of the sampling gear used. Small mesh nets set in SIL Areas 5 and 6 produce the highest CPUEs (41.0 to 145.5 fish/30 m/24 h) compared to other SIL areas (10.5 to 66.4 fish/30 m/24 h; Table 6-4 in NSC 2014). In contrast, McTavish (1952) described the extreme northern portion of SIL as being relatively unproductive in terms of forage species.
Comparison of the metrics over the three periods suggests that there has been a decrease in the capture rate of fish in SIL, as indicated by a decreasing trend in total CPUE. There also appears to have been a change in the relative abundance of certain species, and an overall increase in the evenness of the fish community, as indicated by an increase in the Hill’s diversity index. Changes in the fish community in SIL may be due to many factors, including changes in habitat, redistribution of fish stocks, and emigration of fish due to hydroelectric development, other stressors such as commercial fishing, and natural variability. The potential effects of climate on fish communities is discussed in Area 2, where there is more information available (Section 5.3.4.3.1). Rainbow Smelt have not been observed in SIL.

REGIONAL CUMULATIVE EFFECTS ASSESSMENT – PHASE II WATER – FISH COMMUNITY
DECEMBER 2015 5.3-117
Factor: Effects of Changes to the Water Regime and Other Factors on Fish Habitat
Churchill River Diversion increased the average water level on SIL by 2.7 m and flooded approximately 140 km2 (Water Regime, Section 4.3.3.2.3). The post-CRD water level pattern of SIL is similar to that of pre-CRD conditions, with highest water levels during summer, and lowest water levels during spring (Water Regime, Section 4.3.3.2.3). Between 1978 and 2014, the average annual drawdown was 3.3 ft (1.0 m), while the minimum and maximum drawdowns were 1.1 ft (0.3 m) and 4.7 ft (1.4 m), respectively (Water Regime, Section 4.3.3.2.3). Because changes in outflows at Notigi CS and Miss Falls CS are typically staged with weekly adjustments occurring over a period of several weeks, CRD does not typically cause large hourly or daily water level variations on SIL (Water Regime, Section 4.3.3.2.3).
Pre-CRD, all Churchill River flows exited SIL at the natural outlet at Missi Rapids. Post-CRD, the majority of the outflow typically flows south via the South Bay Diversion Channel. CRD also affected flow patterns within SIL and changed water residence times within the various SIL areas considerably (Water Regime, Table 4.3.3-2). Pre-CRD residence times ranged from 0.012 to 4.2 years among the eight HGAs of SIL (Water Regime, Section 4.3.3.2.3). While the average water exchange time for the lake as a whole increased from 0.51 to 0.72 years because of the increased volume of the lake, the post-CRD residence times were found to range between 0.021 and 2.8 years among the eight HGAs (Water Regime, Section 4.3.3.2.3). HGAs 0 (Opachuanau Lake), 1, 2, 5, and 7 changed by the least amount since these HGAs were mainly only affected by impoundment. Residence times in HGAs 3 and 4 increased the most since much less Churchill River water typically now flows through these HGAs, while residence time in HGA 6 decreased substantially because the majority of the flow now exits via the South Bay Diversion Channel (Water Regime, Section 4.3.3.2.3).
Flow patterns within SIL vary considerably when large spill events occur at the Missi Falls CS (Water Regime, Section 4.3.3.2.3). These large spills vary in duration depending on inflows and other factors and can result in fairly quick increases or decreases in discharge at the Missi Falls CS. These large discharges through Missi Falls CS change flow patterns within the lake considerably (Water Regime, Section 4.3.3.2.3).
With the CRD in place (including the Augmented Flow Program), the allowable minimum water level of SIL is 843 ft (256.9 m) and the allowable maximum water level is 847.5 ft (258.3 m), with a maximum permissible drawdown of 4.5 ft (1.4 m) (Water Regime, Section 4.3.3.1). The Augmented Flow Program allowed for an increase in maximum allowable drawdown from 3 ft (0.9 m) to 4.5 ft (1.4 m) (Water Regime Section 4.3.3.1). Shawinigan et al. 1987 concluded that it was not feasible to conduct a comprehensive, retrospective environmental impact assessment of the hydraulic deviations from the Interim License on either the region of SIL or the community of South Indian Lake. They reached this conclusion due to a lack of historic information on most ecosystem components (e.g., fish) and the difficulties of separating the effects of the Augmented Flow Program from the larger effects of CRD itself on several ecosystem components (Shawinigan et al. 1987). Although the potential for further studies was discussed in the report, the studies do not appear to have been conducted. Consequently, no attempt has been made to differentiate the effects of the Augmented Flow Program from those of CRD for this discussion.
REGIONAL CUMULATIVE EFFECTS ASSESSMENT – PHASE II WATER – FISH COMMUNITY
DECEMBER 2015 5.3-118
Factor: Effects of Changes to Sedimentation and Water Quality
Impoundment and diversion of the Churchill River at SIL increased shoreline erosion and subsequently affected both turbidity and TSS (Water Quality, Section 5.2.8). Effects were observed in most areas of the lake (SIL Areas 1–4 and 6), with effects reportedly greatest in SIL Area 4. Large fetches and the prevalence of permafrost-affected lacustrine silt and clay shorelines in the northern part of the lake resulted in severe erosion in SIL Areas 3 and 4, and to a lesser extent in SIL Area 6 (Erosion and Sedimentation, Section 4.4.2.4.2). Air photo analysis showed that erosion rates in SIL have generally declined since the 1980s and 1990s. However, rates are still generally elevated above pre-CRD values and several sites were found where erosion rates have remained constant or increased over the three decades since impoundment, with rates as high as 5–10 m/y observed between 1984 and 2006 at some sites (Erosion and Sedimentation, Section 4.4.2.4.2).
Recent data collected in Opachuanau Lake and SIL Areas 1, 4, and 6 under CAMP indicate lower Secchi disk depths over the period of 2008–2013 relative to 1972, suggesting that water clarity effects continue to persist (Water Quality, Section 5.2.8). Turbidity measurements collected by Manitoba Conservation and Water Stewardship (MCWS) near the Missi Falls CS and the community of South Indian Lake also indicate significantly higher levels over the period of 1993–2013, relative to 1972–1973. This temporal increase was also observed upstream in the Granville Lake area, though to a lower magnitude, suggesting that changes in Churchill River inflows may in part have contributed to the observed increase in SIL over this period (Water Quality, Section 5.2.8). Conversely, TSS concentrations recently (2008–2013 period) measured under CAMP at these sites were similar to 1972 values suggesting effects of CRD on this metric may have declined. While TSS and turbidity are typically positively correlated in surface waters, differences in the spatial and temporal trends in these metrics may reflect differences in the proportion of fine materials in water (i.e. which has a greater effect on turbidity) and/or other optical characteristics of the water (e.g., colour). Total suspended solids are typically lower in the ice cover season than the open water season (Water Quality, Section 5.2.8).
Deposition of eroded materials has predominantly occurred in the nearshore area and these sediment deposits are subject to erosion and re-suspension, which could prolong the length of time that nearshore turbidity remains elevated after shorelines stabilize (Erosion and Sedimentation, Section 4.4.2.4.3).
As discussed in Section 5.2.8 (Water Quality), DO was reported to be generally unaffected in Opachuanau and Southern Indian lakes, despite flooding and subsequent decomposition of terrestrial organic materials caused by CRD. The lack of a notable effect on DO has been attributed to the well-mixed conditions in, and large volume of, the lake. Although SIL was generally isothermal before and after impoundment, short-term thermal stratification is occasionally observed in the open water season (Water Quality, Section 5.2.8). Some localized effects on DO associated with flooding may have occurred over nearshore flooded habitat and/or in some summers during periods of thermal stratification during the initial years of post-impoundment. The lake was well-oxygenated before and after CRD and concentrations have, with a few exceptions, been within the Manitoba water quality objectives for the protection of aquatic life over the period of record (Water Quality, Section 5.2.8).

REGIONAL CUMULATIVE EFFECTS ASSESSMENT – PHASE II WATER – FISH COMMUNITY
DECEMBER 2015 5.3-119
Factor: Effects of Obstructions to Upstream Movements/Alterations to Downstream Movements
Commercial fishers have expressed concerns about the loss of fish from SIL through the Missi Falls CS since its completion in 1976. Fish can emigrate into the lower Churchill River and its lakes via the Missi Falls CS, but cannot return to SIL once they have passed through as the structure does not provide upstream fish passage. There was no published information available discussing the magnitude of pre-CRD movements of fish between SIL and Partridge Breast Lake.
A tagging study was conducted starting in 1998 at the request of the SIL Commercial Fisherman’s Association in response to concerns that water levels and flows experienced in the late-summer and fall of 1997, (when high wind and extreme inflow conditions prompted Manitoba Hydro to increase discharges at Notigi CS to licence maximums and increased spills at Missi Falls CS), had resulted in the redistribution of fish stocks in SIL. While many of the Floy®-tags returned were recaptured in the same SIL area in which they were tagged, the study did confirm that there is some movement of fish out of SIL either into the Burntwood/Rat river system through the South Bay diversion channel, or upstream into the Churchill River (Graveline and Remnant 2004). The report by a commercial fisher of one tagged Lake Whitefish recaptured in Partridge Breast Lake, approximately 10 km downstream of Missi Falls CS, suggested that some movement of fish out of SIL may occur. An analysis of the proportion of fish that emigrate versus immigrate is confounded by the discrepancy in fishing effort directed at SIL compared to neighbouring waterbodies (NSC 2014).
Hydro-acoustic studies conducted at the Missi Falls CS from 2007 to 2010 under a variety of flow conditions indicated that under relatively high flows, there are fewer fish in the intake channel, but those present are passed through the CS at higher rates than under low flows. At lower flows, larger fish have the swimming capacity to avoid entrainment.
Factor: Effects of Fisheries
The history of commercial and domestic fisheries operating within the SIL reach of Area 3 are reviewed in detail in Section 3.5.11 (People) as it relates to resource use. The information presented below relates recorded harvests and associated information to the fish population, both as a potential factor affecting the population and as an approximate indicator of the population size.
Waterbodies in this reach of Area 3 include, among many others, Southern Indian and Opachuanau lakes in the SIL RTL and nearby reference waterbodies (Gauer and Granville lakes). Historically, fish were a staple food in the region (Hrenchuk 1991). Although several fish species were used for domestic consumption, Lake Whitefish harvested through the commercial fishery was important for domestic consumption (Peristy 1989). In the early 1950s, it was estimated that over 500,000 kg of fish were harvested annually by the community of SIL for both human consumption and dog food (MDMNR 1953). Domestic harvest began to decline in the late 1950s as people began to use snowmobiles instead of dog teams, and purchase of store-bought meat increased (Collinson et al. 1974a). Usher and Weinstein (1991) estimated that 24.2 kg per person were consumed in 1973, which is a tenth of the consumption from two decades previous.
Although domestic fishing persisted post-CRD, resource users noted that the fisheries on SIL had been substantially affected. Fish populations redistributed within the lake and fishers were forced to relocate

REGIONAL CUMULATIVE EFFECTS ASSESSMENT – PHASE II WATER – FISH COMMUNITY
DECEMBER 2015 5.3-120
from traditional fishing sites to compensate (Peristy 1989; Hrenchuk 1991). Increased flooding and debris levels also changed shorelines and damaged fishing gear. Consequently there was a decrease in the number of fish caught per net, an increase in the amount of time required to clean nets, and a decrease in the quality of Lake Whitefish due to an increased number of Triaenophorus crassus cysts in the muscle. Concerns about elevated levels of mercury in fish also surfaced following CRD. The combination of these effects further reduced the domestic consumption of fish captured in SIL.
Commercial fishing on SIL began with a winter fishery in the early 1940s followed by summer fishing in 1950 (Figure 5.3.6A-7). Commercial fishing grew to become a major source of income to the community (Collinson et al. 1973). The SIL winter commercial fishery on SIL began in earnest in 1941–1942 averaging 90,319 kg of production per year for the first five years (Weagle and Baxter 1973). In 1971, the road between Lynn Lake and Leaf Rapids was completed to service the newly established Ruttan Mine (Weagle and Baxter 1973). This link provided economical access to the railhead at Lynn Lake for both winter and summer catches. This link was even more advantageous to the summer fishery because deliveries could now be accomplished by boat to Leaf Rapids instead of plane.
For the period from 1960–1961 to 1965–1966, the community was self-supporting with 80–125 licenced fishers active for about 6.5 months per year on Southern Indian and Opachuanau lakes (Van Ginkel and Associates 1967). By 1973, most of the community labour force was engaged in fishing (110 fishers), packing and transport (22 people) and 15 additional people worked at the Leaf Rapids plant (Collinson et al. 1973). Average annual production of the commercial fishery from 1941 to 1973 was 358,649 kg (round weight), of which 92% was Lake Whitefish, 7% was Walleye, and 3% was Northern Pike (MCWS unpubl. data). Quota for the fishery averaged 533,647 kg (for 1966/1967 to 1972/1973 seasons), much higher than actual production in most years (adapted from Collinson et al. 1973). The general conclusion was that lake productivity was high enough to meet quotas, but that fishing effort was limiting production. Therefore, it was expected that pre-CRD harvesting levels could be maintained or even increased well into the future barring any changes to the lake ecosystem (Weagle and Baxter 1973; Hecky and Ayles 1974; Ayles 1976).
In the pre-CRD period, fishing on other lakes was intermittent (one to four years fished per lake) and minor (<10,000 kg). Only Opachuanau Lake, which had a lucrative pre-CRD Walleye fishery, was fished consistently (Hrenchuk 1991) with production ranging from 33,000–47,000 kg annually.
In the years following CRD, there were several changes to the commercial fishery on SIL. There was a decrease in fish populations attributed to a redistribution of fish from SIL Area 4 to other areas of SIL and to nearby waterbodies, which reduced CPUE of the fishery (Bodaly et al. 1984a; Barnes 1990; Barnes and Bodaly 1990, 1994). Fishers commented on the additional effort required to maintain SIL catches at this time, including the need to change fishing locations to previously unknown areas, set additional nets, and to manage debris caught in the nets (Shawinigan et al. 1987; Peristy 1989). The Commercial Fisherman’s Assistance Program also replaced damaged equipment (e.g., boats and motors) from increased debris levels in the lake.
However, despite these changes, average production in SIL from 1976 to 1980 exceeded pre-CRD averages at 474,495 kg annually (MCWS unpubl. data). This brief increase likely occurred for several reasons, including increased effort by the fishers coupled with the Manitoba Hydro incentive program and

REGIONAL CUMULATIVE EFFECTS ASSESSMENT – PHASE II WATER – FISH COMMUNITY
DECEMBER 2015 5.3-121
the reduced effort during construction (as many of the commercial fishers were employed by Manitoba Hydro for construction of the CRD), which may have caused a temporary boost to fish stocks.
Opachuanau Lake, which was the most commercially productive lake (aside from SIL) pre-CRD, saw large decreases in catches following CRD. As in SIL, decreases were likely the result of flooding and redistribution of fish populations. Average annual catches of the three quota species from 1997–2014 was less than 5,000 kg total, an approximately seven to nine-fold decrease from pre-CRD levels. Walleye continue to be the most valuable component of the fishery on this lake, particularly with Lake Whitefish being downgraded from continental to cutter in 2001.
Due to the negative post-CRD impacts to the SIL and Opachuanau fisheries, and with aid from the Northern Fishermen’s Freight Assistance Program (reducing transport costs for marginal fisheries), commercial fisheries expanded on other lakes within this reach of Area 3 and in outlying regions (Peristy 1989; MCWS 2013). Some of the largest and most persistent fisheries are found on Gauer (primarily Walleye) and Granville (relatively equal proportions of all three quota species) lakes, which averaged 18,000 and 75,000 kg annually from 1997–2014, though both have shown small decreases in recent years. Lake Whitefish average only about 9% and 40% of the annual Gauer and Granville lakes quota species catches.
5.3.6.3.2 Lake Whitefish
INDICATOR: ABUNDANCE
Metric: Catch-Per-Unit-Effort
Prior to CRD, Ayles (1976) reported that Lake Whitefish were captured more frequently in areas of SIL along the main flow of the Churchill River (SIL Areas 2 and 4; 42.6 and 29.4 kg/net night, respectively) compared to SIL Areas 6 and 7 (5.9 and 9.9 kg/net night, respectively). The exception was SIL Area 5, which was relatively productive (29.4 kg/net night) despite being off the main flow. The author reported that population density in the main basin of SIL showed a seasonal pattern, likely indicative of a spawning movement, with the number of fish captured in SIL Area 2 decreasing over the summer and sharply increasing in SIL Area 4 in early fall.
Shortly after impoundment, Bodaly et al. (1983b) and Bodaly et al. (1984a) documented severe declines in the CPUE of the SIL whitefish fishery (using 4.25 and 5.25 inch panel gangs that are used by the commercial fishery). Bodaly et al. (1984a) reported that post-impoundment (1979–1981) Lake Whitefish CPUE on traditional fishing grounds north of Long Point (7.5–15.5 kg/standard net/24 h) was substantially lower than pre-impoundment (1972) CPUE (23.1 kg/standard net/24 h). Total catch was maintained for a few years by increases in total fishing effort, including effort on non-traditional fishing grounds (the area north of Sand Point) (Bodaly et al. 1984a). At the time of publishing, the authors suggested that these declines were the result of stock redistributions between SIL and adjoining waterbodies. Bodaly et al. (1980, 1983a) conducted experimental gillnetting surveys with standard gang index gill nets in SIL over this time period and confirmed decreases observed in the fishery.

REGIONAL CUMULATIVE EFFECTS ASSESSMENT – PHASE II WATER – FISH COMMUNITY
DECEMBER 2015 5.3-122
A comparison of standardized CPUE values for Lake Whitefish (Appendix 5.3.1B) from standard gang index gill nets set over the course of three time periods (pre-, early post-, and recent post-CRD) in each of six SIL areas shows a decreasing trend (Figure 5.3.6A-8). The median values for sets in the recent post-CRD period are considerably lower than the lower quartile of sets in the pre- and early post-period in all six SIL areas. Pre-diversion (1972–1975), the mean CPUE of Lake Whitefish varied from about five in SIL Area 6, to 30 fish/100 m/24 h in SIL Area 2. Immediately post-diversion (1976–1982), the limited data available show a fairly comparable mean CPUE ranging from 6–21 Lake Whitefish/100 m/ 24 h in SIL Areas 4, 5, and 6. More recently (post–2008), the mean CPUE ranges from approximately 5 fish/100 m/24 h in SIL Areas 2, 3, 5, and 6 to 13 fish/100 m/24 h in SIL Area 4. In contrast, CPUE values in Opachuanau Lake showed a slight increase from 1972 (4.0 fish/100 m/24 h) to 2011 (5.9 fish/100 m/24 h).
Currently, annual mean CPUE values in the lake are higher in the Missi Falls CS area (SIL Area 4; range of 7–28 fish/100 m/24 h) compared to other SIL areas (range of 1–11 fish/100 m/24 h). The values in SIL Areas 4 and 5 are similar to those in Gauer Lake, where CPUE ranges from 11 to 21 fish/100 m/24 h (mean 18 fish/100 m/24 h). Values measured upstream in Granville Lake are within the range of other SIL areas, ranging from two to six fish/100 m/24 h (mean 3.1 fish/100 m/24 h; Figure 5.3.6A-8).
The surveys conducted in SIL Areas 1 and 4 by MFB between 1981 and 2007 specifically targeted Lake Whitefish. Because of this and other differences in methods, CPUE is not directly comparable to the studies described previously. A comparison of the number of Lake Whitefish captured per overnight set in SIL Area 4 in each decade shows a decline in the median value from 101 fish/set during the 1980s, to 78 fish/set in the 1990s, to 41 fish/set in the 2000s (Figure 5.3.6A-9). No such decline was observed in SIL Area 1, where the median values were 36, 59, and 40 fish/set in the 1980s, 1990s, and 2000s, respectively (Figure 5.3.6A-9). In both areas, there is a lot of inter-annual variation between catches for all decades, as indicated by a large range of values for each decade (60 to 100 fish/set).
The discussion section that follows looks at the contribution of several potential factors to the observed changes in Lake Whitefish CPUE over time in concert with the results of the other indicators.
INDICATOR: CONDITION
Metric: Fulton’s Condition Factor (KF)
In a 1952 survey by the Manitoba Game and Fisheries Branch, McTavish (1952) reported “the whitefish found in SIL are in excellent condition, with respect to general appearance, degree of fatness, and eating qualities”. Condition factors calculated from length and weights recorded during this survey showed little variation among SIL areas sampled. The mean KF value was 1.54 for fish captured in the southwestern and central portions (the narrows from Opachuanau Lake to Long Point) and 1.51 in the northern portion (north of Long Point) and South Bay. However, these values are not directly comparable to those calculated from the standard gang programs described below because the gill nets used were not comparable (single mesh size sets of 2.88, 4.5, 4.75, 5.25 or 5.5 inch) and the precision of the equipment used to measure weight is unknown. Ayles (1976) reported that KF values for Lake Whitefish captured in 1972 and 1974 in the main lake averaged 1.89 (Areas 2 and 4). Noting that younger fish are generally not
REGIONAL CUMULATIVE EFFECTS ASSESSMENT – PHASE II WATER – FISH COMMUNITY
DECEMBER 2015 5.3-123
in as good condition as older fish, Ayles (1976) concluded that observed differences in KF values between sampling years was primarily a function of differences in age classes.
Lake Whitefish from standard gangs were first measured for biometric data as part of the DFO studies starting in 1978, but only for SIL Areas 4–6. Condition of Lake Whitefish captured in SIL Areas 4 and 5 have decreased from immediate post-diversion (mean 1.34–1.37) to the more recent periods (mean 1.27–1.29), while the condition of Lake Whitefish in SIL Area 6 appears to have increased (1.42 to 1.53) (Figure 5.3.6A-10). The condition of Lake Whitefish captured by MFB in experimental gill nets set in SIL Area 4 between 1981 and 2007 has risen and fallen over time. Mean condition factor from index gillnetting conducted in the summer increased from 1.44 in the 1980s to 1.56 during the 1990s and then fell substantially to 1.34 in the 2000s (Figure 5.3.6A-11). Condition of Lake Whitefish from SIL Area 1 have shown a similar pattern, although the fall during the 2000s was not as pronounced (Figure 5.3.6A-11). The condition of fish in the most recent decade was considerably higher in SIL Area 1 compared to SIL Area 4.
Currently, the mean KF of Lake Whitefish captured in standard gang index gill nets is lowest in SIL Areas 3, 4 and 5 (1.26, 1.29 and 1.27, respectively), moderate in SIL Area 2 (1.38), and highest near the inflows of the Churchill River (Opachuanau Lake and SIL Area 1; 1.49–1.52) and outflow at the Diversion Channel (SIL Area 6; 1.53) (Figure 5.3.6A-10). Condition factors measured from fish captured in two nearby off-system waterbodies were similar to those in SIL Areas 1 and 6, averaging 1.50 in Granville Lake and 1.47 in Gauer Lake.
Because KF is often highly dependent on length, with condition increasing with increasing length (Rennie and Verdon 2008), observed differences in KF may be a consequence of differences in size rather than differences in physiological or ecological condition of the stocks. Normally, it would be expected that the oldest, and therefore longest, fish would have the highest condition values, but this is not what is observed in SIL Area 4. Fish in SIL Area 4 are the oldest (see Indicator: Growth below), but are also smaller at age (both in terms of length and weight) and have the lowest KF values.
Changes in the abundance or types of benthic invertebrates, which are the preferred prey for Lake Whitefish, can contribute to changes in fish condition. The discussion section that follows looks at potential factors to the observed changes in Lake Whitefish condition over time in concert with the results of the other indicators such as growth.
INDICATOR: GROWTH
Metric: von Bertalanffy Model
Recent monitoring studies in SIL indicated that there are differences in the age structure of Lake Whitefish populations among areas of the lake (Aiken 2014). Lake Whitefish captured in index gangs set in SIL Area 6 are the youngest, with a mean age of only 4.5 years. The annual mean age of fish captured in SIL Area 1 ranges from 5.5 to 6.6 years and those in SIL Areas 2 and 5 ranges from 7.5 to 10.1. Fish from SIL Area 4 are considerably older, and the average age has increased over time from 9.1 years in 2008 to 11.9 years in 2013. von Bertalanffy curves show faster growth for Lake Whitefish from SIL Areas 1 and 6 compared to the other SIL areas (Figure 5.3.6A-12). Although the length/weight infinity
REGIONAL CUMULATIVE EFFECTS ASSESSMENT – PHASE II WATER – FISH COMMUNITY
DECEMBER 2015 5.3-124
(the theoretical maximum length/weight of very old fish) is similar among fish from SIL Areas 2 to 5 (Table 5.3.6A-1), those from SIL Areas 3 and 4 have a slower growth rate and take longer to attain this size compared to fish from SIL Areas 2 and 5. In contrast, Ayles (1976) reported that prior to CRD, Lake Whitefish in the main regions of SIL (SIL Areas 2 and 4) had similar growth rates, but those from South Bay (SIL Area 6) grew more slowly.
There was variation in the growth rates of Lake Whitefish from two nearby off-system waterbodies (Figure 5.3.6A-12). The von Bertalanffy curve for fish from Granville Lake was in between curves of fish from areas of SIL that also receive through flow from the Churchill River (SIL Areas 1 and 6). The growth rate of fish from Gauer Lake, which is isolated from Churchill River flows, was considerably lower, but was higher than other SIL areas.
Comparisons to historical data are limited since no Lake Whitefish were aged as part of the DFO study (1972–1982) and although MFB did age Lake Whitefish captured in experimental gill nets set between 1981 and 2007, they used fin rays rather than otoliths to age fish in all years except for 1983–1984 (SIL Areas 1 and 4) and 1985 (SIL Area 4). Ages determined from fin rays cannot be compared directly with those obtained from otoliths, but ages derived from otoliths can be compared among themselves over time. Due to the unreliability of fin-derived ages in Lake Whitefish, particularly at older ages, it was determined that an assessment of growth during the 1980s, 1990s, and 2000s using fin-derived ages would not be meaningful. A plot of the von Bertalanffy growth curves for SIL Area 4 show that there is little difference between the growth rates in terms of fork length of fish in the early 1980s and the recent period (Figure 5.3.6A-13). This suggests that the rate of growth in Lake Whitefish from Area 4 has not changed from the 1980s to the current time period. Although fish from Area 1 currently show a faster growth rate before reaching maturity, the von Bertalanffy curves predict that they attain a smaller maximum size than they did historically (Figure 5.3.6A-13). The difference in the curves in SIL Area 1 may be a factor of fewer large fish (> 500 mm/2000 g) being captured in more recent surveys than were in the 1980s.
The minimum age at which Lake Whitefish attain the size required for the commercial harvest (medium classification of ≥ 825 g) was considerably higher in SIL Area 4, approximating 11 years, compared to 5–6 years in SIL Areas 1, 5 and 6 (Aiken 2014). The author noted that less than 20% of the SIL Area 4 catch in 4.25 and 5 inch mesh were classified as “medium”, compared to more than 50% in the other areas.
Aiken (2014) postulated that differences in growth in Lake Whitefish among SIL areas were established at an early life stage based on his observation that young whitefish increased in length and weight at a similar rate in SIL Areas 4 and 5 up to age five, after which fish from SIL Area 5 increase in size at a faster rate. In this case, habitat and food sources used by young whitefish could be an important factor in the differences in growth between areas.
Aiken (2014) describes a relationship between size at maturity and growth rates of Lake Whitefish in SIL based on the theory that whitefish populations that exhibit higher early growth rates mature at a younger age and those that exhibit lower early growth rates mature at an older age (Beauchamp et al. 2004). Aiken (2014) reported that the fastest growing populations in SIL Areas 1 and 6 had the lowest average

REGIONAL CUMULATIVE EFFECTS ASSESSMENT – PHASE II WATER – FISH COMMUNITY
DECEMBER 2015 5.3-125
age at maturity, while the slowest growing populations in SIL Areas 4 and 5 had the highest age at maturity (Table 5.3.6A-3).
The discussion section that follows looks at potential factors to the observed changes in Lake Whitefish size at age over time in concert with the results of the other indicators.
Metric: Relative Year Class Strength
Prior to CRD, Ayles (1976) reported that Lake Whitefish populations in SIL exhibited differences in the strength of year classes and suggested that these differences were responsible for differences observed in the mean age, size, and condition among years.
The RYCS of Lake Whitefish for three SIL areas, where consecutive years of sampling occurred, is shown in Figure 5.3.6A-14. Because Lake Whitefish were not aged as part of the DFO study, RYCS analysis was only conducted for the current period data collected under the auspices of CAMP and SILESC and with the limited data collected by MFB in the early 1980s when they used otoliths to age fish. The historical year class index determined from Lake Whitefish captured in SIL Area 4 from 1983–1985 indicated that the weakest cohort occurred in 1975, when staging on SIL for CRD commenced, and that the strongest year class occurred in 1977, the year after CRD was operating at full capacity. Similarly, fish sampled from 1983–1984 in SIL Area 1 showed a weak year class in 1974, followed by strong year classes in 1978 and 1979 (Figure 5.3.6A-14).
An examination of the more recent data indicates that two markedly different age-class structures are occurring on SIL (Figure 5.3.6A-14). In SIL Area 4, there is evidence for strong 1999 and 2000 year classes (index value > 150). Strong 1999 and 2000 year classes were also observed in both Granville and Gauer lakes. The next strong year class observed in the off-system lakes was the 2006 cohort, but this trend did not occur in SIL Area 4. More equal representation of several year classes is apparent for both SIL Areas 1 and 5. Strong cohorts (> 100) were observed in 2001, 2003, 2005 in SIL Area 5, and in 2005, 2006, and 2007 in SIL Area 1. Weak year classes (< 50) were observed in SIL Area 4 in 1998, 2004 and 2005. The 2004 cohort was also the weakest observed in SIL Areas 1 and 5 (~70–80), but not in the off-system lakes.
Relative year class strength may be correlated to one or more hydrologic variables. Factors such as high or low water level drawdown during winter may affect the overwintering survival of Lake Whitefish eggs which in turn would influence RYCS. However, no strong correlation is apparent between years of strong and weak year classes discussed above and annual estimated exposure zones in SIL (Table 5.3.6A-2). The 1999 and 2000 strong year classes in SIL Area 4 coincided with relatively high estimated exposure zones. While weak year classes in 2004 and 2005 in SIL Area 4 coincided with relatively high exposure zones (but comparable to those 1999 and 2000), the poor 1998 year class coincided with a relatively average exposure zone (Table 5.3.6A-2). While hydrologic variables undoubtedly influence RYCS to some degree, there appear to be other factors involved as well (Figure 5.3.6A-15).
The dominance of the 1999 and 2000 year classes in SIL Area 4 may explain the increase in the average age observed in recent studies (Aiken 2014). The continual increase in mean age in a population is an indicator that the recruitment of young fish into the population is low (Salmon and von Ogtrop 1996).

REGIONAL CUMULATIVE EFFECTS ASSESSMENT – PHASE II WATER – FISH COMMUNITY
DECEMBER 2015 5.3-126
Explanations for the strength of the 1999 and 2000 year classes are not understood but may include relationship to hydrological variables, climate, fishing pressure and natural variability.
DISCUSSION: FACTORS AFFECTING LAKE WHITEFISH OVER TIME
Current monitoring programs on SIL show that Lake Whitefish are captured in gill nets throughout SIL (accounting for >8% of the catch), and are one of the dominant species captured in SIL Areas 3 and 4 (> 20%). Catch-per-unit-effort for the species is highest in the Missi Falls CS area (SIL Area 4; 13 fish/100 m/24 h) and in the area receiving inflows of the Churchill River (SIL Area 1; 7.5 fish/100 m/24 h) compared to SIL areas (<5 fish/100 m/24 h). Only a few one-year old Lake Whitefish (137–160 mm in fork length) have been captured in small mesh gill nets set in SIL Area 5 of SIL. The lake currently supports commercial and domestic fisheries. Despite having the highest CPUE in experimental gill nets, the commercial fishery in SIL Area 4 was recently closed and commercial fishing effort has moved to SIL Area 1 and Opachuanau Lake.
Catch-per-unit-effort values on SIL were within the range observed in two nearby off-system waterbodies; CPUE was considerably higher in Gauer Lake (mean 18 fish/100 m/24 h), an off-current lake on a tributary to the lower Churchill River compared to Granville Lake (3 fish/100 m/ 24 h), an upstream lake receiving through-flow from the upper Churchill River. This pattern suggests that the Churchill River continues to be a factor in the productivity of Lake Whitefish in SIL and surrounding waterbodies. Prior to CRD, Ayles (1976) reported on the spawning and population characteristics of Lake Whitefish in SIL prior to impoundment and found that the flow of the Churchill River through the lake had a strong influence on the productivity of SIL and on the availability of whitefish for the commercial fishery. The lake’s high biological productivity was the result of the input of nutrient rich waters from the Churchill River and high flushing rates on areas within the main flow.
Commercial fishers in SIL have expressed concerns over poor catches of Lake Whitefish in SIL and have linked poor catches to a number of potential factors, including changes in the water regime (e.g., drawdown), sedimentation over whitefish eggs and food, and loss of fish over the Missi Falls CS and the South Bay Diversion Channel (Bodaly 2013a, b; NSC 2014). The effect of hydroelectric development on Lake Whitefish in SIL will be examined further in the following sections by examining potential factors.
McTavish (1952) reported that the extensive underwater reefs in SIL that provided spawning habitat for Lake Whitefish were abundant in the central and northern portions of the lake, particularly in the Missi Falls CS area and other locations where there were clusters of numerous small islands. Studies by the LWCNRSB conducted in the 1970s observed ripe Lake Whitefish over areas of broken rock and boulders, and occasionally over sand and gravel, at depths of 1.5–2.5 m, and less frequently up to 6.75 m (Weagle and Baxter 1973; Ayles 1976). Lake Whitefish were thought to spawn throughout the lake, but the prime spawning areas were identified as north of Long Point.
To provide suitable spawning reefs after CRD, Manitoba Hydro implemented pre-flood clearing of timber at a number of locations in SIL as directed by the MFB and the Timber Salvage and Clearing Committee (Timber and Salvage Clearing Committee 1974). Sites identified for clearing for the purposes of Lake Whitefish spawning habitat included six islands north of Long Point at the request of the MFB and an

REGIONAL CUMULATIVE EFFECTS ASSESSMENT – PHASE II WATER – FISH COMMUNITY
DECEMBER 2015 5.3-127
additional 35 islands between Long Point and Moose Point recommended by the Committee. In a letter to Mr. A. Murray (Director Development & Extension Branch, Manitoba Department of Mines, Resources and Environmental Management) dated July 3, 1974, Dr. G.H. Lawler proposed a five-year commitment to monitoring of the experimental clearing program by the Freshwater Institute (in Timber and Salvage Clearing Committee 1974). No report of monitoring of these sites was located in the published literature.
Recent work funded by the SILESC has attempted to identify Lake Whitefish spawning habitat in SIL and examined the relationship between Lake Whitefish spawning success and physical stressors (e.g., water drawdown during the winter egg incubation period and sedimentation). These studies have demonstrated that Lake Whitefish spawn successfully in several areas of SIL (NSC 2014). The preferred habitat for spawning was identified based on the capture of large numbers of spawning whitefish and is described as over rocky substrate at depths of 2–5 m (Johnson and Remnant 2004). Based on the capture of large numbers of Lake Whitefish larvae in neuston tows, four areas between Long Point and Sand Point were identified as spawning habitat: the northeast side of Strawberry Island; Anchor Island; a small island north of Zuba Island; and on the south side of Zuba Island Whitefish eggs were first collected in fall 2007, and again in 2008 and 2009, in a spawning area located approximately 7 km north of the Missi Falls CS. Too few eggs have been collected to define the spatial extent of spawning habitat or the proportion, if any, of the spawning area that is exposed during the incubation period. A map showing the location of potential Lake Whitefish spawning habitat is presented in Map 5.3.6A-2.
Factor: Effects of Changes to the Water Regime and Other Factors on Fish Habitat
Commercial and domestic fishers have expressed concerns about the impacts of winter drawdown under CRD on Lake Whitefish eggs. Since eggs are deposited along the shorelines and reefs in the fall, their concern was that the eggs may become dewatered and frozen or covered in sediment prior to hatching in the spring.
It is possible that some Lake Whitefish eggs could be at risk of exposure in some years based on the depth that eggs have been observed in SIL and the estimated exposure zone during winter (NSC 2010a). The minimum depth at which Lake Whitefish are known to spawn in SIL (1.5 m) is below the maximum ice thickness on SIL (estimated at 1.4 m), but is within the annual exposure zone (i.e., winter drawdown combined with ice thickness, estimated between 1.5 and 2.6 m since 1972 [Table 5.3.6A-2]).
Caskey and Remnant (2009) predicted that whitefish eggs collected in 2007, which were collected at a depth of 3 m, would have been safe from exposure since the exposure zone during the winter of 2007/2008 was estimated at 2.4 m; whereas some proportion of the eggs collected in fall 2008 at depths as shallow as 2.2 m would have been at risk of exposure since the exposure zone during that winter was estimated at 2.4 m (Table 5.3.6A-2). Unlike SIL Area 4 (discussed above), this prediction is supported by the results of the RYCS analysis for SIL Area 1 that shows a strong year class for 2007 (123) compared to 2008 (67).
Bodaly (2013a) concluded that it was unlikely that drawdown in SIL under CRD was causing a direct, significant effect on the survival of Lake Whitefish eggs incubating in the shallow zones of SIL since there was no apparent relationship between drawdown in the lake and year class strength. As mentioned

REGIONAL CUMULATIVE EFFECTS ASSESSMENT – PHASE II WATER – FISH COMMUNITY
DECEMBER 2015 5.3-128
previously, the 1999 and 2000 strong year classes in SIL Area 4 coincided with relatively high estimated exposure zones.
Factor: Effects of Changes to Sedimentation and Water Quality
It is possible that sedimentation from eroding shorelines may continue to be affecting Lake Whitefish egg survival on spawning beds in SIL. Sedimentation rates during the winter of 2011/12 ranged from 0.025 to 0.339 g/cm2, which is within the range measured in 1978–1981 (NSC 2013). The estimated depth of sediment that accumulated over winter at Sandhill Bay (0.6–0.9 mm) and Loon Narrows (1.3–1.6 mm) in 2011/12 (NSC 2013) was at the lower end of the range that was measured in 1978–1981 (1–4 mm; Fudge and Bodaly 1984). However, it is likely that the sediment depths reported for 2011/2012 were underestimated and that the actual depths were more similar to those reported in 1978–1981 since the dry weight of the sediment that accumulated in 2011/12 was similar to that of the earlier study (NSC 2013). The thickness of material that accumulated over the winter of 2011/12 near Missi Falls CS at known spawning locations was the highest of the sites examined averaging between 4.1 and 4.6 mm. This amount of siltation on spawning beds was found be sufficient to reduce the survival of whitefish eggs during incubation experiments conducted by Fudge and Bodaly (1984).
Fudge and Bodaly (1984) demonstrated that under post-impoundment conditions in SIL, significant sedimentation occurred on Lake Whitefish spawning beds over the winter egg incubation period and that observed levels of sedimentation were sufficient to cause decreased egg survival. Silt deposited on eggs acted to inhibit oxygen uptake and dispersion of carbon dioxide and other metabolic wastes.
The capture of substantial numbers of larval Lake Whitefish in spring 2004 indicates that, at least in some years, whitefish eggs deposited in SIL successfully overwinter and hatch (NSC 2010a).
Another potential concern regarding sedimentation is changes in the abundance, distribution, and composition of benthic invertebrates and their availability as food for Lake Whitefish. Since benthic invertebrates are the preferred food source for Lake Whitefish, changes in the abundance and types of benthic invertebrates in response to CRD may be a factor in limiting Lake Whitefish stocks in SIL. Prior to CRD, McTavish (1952) described the best feeding habitat for Lake Whitefish as occurring over much of the northern and southwestern portions of SIL, particularly north of Long Point (i.e., SIL Area 4). He noted that a substrate consisting of “grey muck overlain with thick brown organic material” was rich in food items for the species. The stomachs of Lake Whitefish captured in the vicinity of Long Point were filled primarily with amphipods (Pontoporeia spp.) and molluscs (Musculium spp., Physa spp.).
Ayles (1976) described regional trends in the Lake Whitefish diet in the 1970s. Amphipods were a common component by weight in the diet throughout much of the lake (SIL Areas 2, 4, and 5), chironomids were an important component near the inflow of Churchill River (SIL Area 1) as well as at the outflow (SIL Area 4), and gastropods and fingernail clams were an important component of the diet in other areas (SIL Areas 3, 6, and 7). Ayles (1976) noted that areas of SIL along the main flow of the Churchill River had higher primary productivity than areas not affected by the Churchill River (Hecky et al. 1974) and that zoobenthos production in SIL was higher than would be expected for a northern lake of its size (Hamilton 1974). Ayles (1976) noted that three times as many Lake Whitefish were captured from areas with flow-through compared to South Bay, which did not receive Churchill River

REGIONAL CUMULATIVE EFFECTS ASSESSMENT – PHASE II WATER – FISH COMMUNITY
DECEMBER 2015 5.3-129
water. The exception was SIL Area 5, which had similar numbers of Lake Whitefish, but the area was off the main flow of the Churchill River.
Wiens and Rosenberg (1984) observed a considerable increase in the abundance of benthic invertebrates immediately after diversion. This upsurge was likely in response to the additions of nutrients and organic matter from newly flooded terrestrial habitat, and is typically followed by a return to near or below pre-impoundment levels (Baxter 1977).
Recently, information on benthic communities has been collected from SIL Areas 4 and 5 as part of studies for CAMP and SILESC. Substrates in SIL Areas 4 and 5 had very low organic content (< 1%). In nearshore areas, insects made up greater than 85% of the benthic invertebrates collected with the dominant taxa being chironomids in SIL Area 4 and corixids in SIL Area 5. Insects made up a smaller proportion of the benthos (34–51%) in offshore areas, with chironomids and amphipods the dominant taxa in both areas. Capar et al. (2012) concluded that current composition of benthic invertebrates in SIL Areas 4 and 5 appears to provide a suitable food source for Lake Whitefish, although it appears that the abundance of benthic invertebrates has declined somewhat in SIL Areas 4 and 5 since the early 1980s.
Michaluk and Remnant (2012), Aiken and Remnant (2013) and Aiken (2014) all found evidence for potential facultative spawning of Lake Whitefish in SIL (i.e., fish not spawning every year). Weagle and Baxter (1973) also collected evidence to suggest that at least some female Lake Whitefish did not spawn every year. Aiken (2014) suggested that Lake Whitefish in SIL Areas 4 and 5 might be not be acquiring sufficient energy for annual maturation (Siems and Sikes 1998 and Henderson and Wong 1998 in Beauchamp et al. 2004). It has also been suggested that differences in growth rates of Lake Whitefish among SIL areas may be related to changes in the composition and abundance of food items (Bodaly 2013a; Aiken 2014).
Factor: Effects of Obstructions to Upstream Movements/Alterations to Downstream Movements
Commercial fishers have expressed concerns about the loss of fish from SIL through the Missi Falls CS since its completion in 1976. Lake Whitefish can emigrate into the lower Churchill River and its lakes via the Missi Falls CS, but cannot return to SIL once they have passed through as the structure does not provide upstream fish passage. There was no published information available discussing the magnitude of pre-CRD movements of Lake Whitefish between SIL and Partridge Breast Lake.
A Fisheries Branch officer reports observing thousands of Lake Whitefish congregating below the Missi Falls CS in 1981 in a provincial Inter-Departmental Memo (MFB unpubl. data, SIL). The fish were described as being in poor condition, “possibly starving to death”, so local fisherman were permitted to harvest the fish under the Partridge Breast Lake quota. The officer reported that flow conditions at the time were 1,000 cfs (28 cms) flowing through the Missi Falls CS. Studies conducted by DFO (Barnes 1990; Barnes and Bodaly 1994) reported that most of the Lake Whitefish observed congregating downstream of the Missi Falls CS in 1986 originated from SIL and were attempting to return to the lake. Flow through the CS that year was high and similar to pre-CRD flows. The following year, fewer Lake Whitefish were captured below the Missi Falls CS in a year when flows through Missi Falls CS were more typical of post-CRD conditions, and these fish were believed to have moved upstream from Partridge Breast Lake. The authors speculated that these fish may have been attracted to the CS by local
REGIONAL CUMULATIVE EFFECTS ASSESSMENT – PHASE II WATER – FISH COMMUNITY
DECEMBER 2015 5.3-130
environmental conditions such as cool water temperatures. It is also possible that the fish congregating below the Missi CS were part of the resident stocks from the lower Churchill River and its lakes that made spawning migrations to SIL Area 4 as part of their life history. These fish, though not part of the resident SIL stocks, would have contributed to the late-summer and fall catches by the commercial fishery
A tagging study was conducted starting in 1998 at the request of the SIL Commercial Fisherman’s Association in response to concerns that water levels and flows experienced in the late-summer and fall of 1997, (when high wind and extreme inflow conditions prompted Manitoba Hydro to increase discharges at Notigi CS to licence maximums and increased spills at Missi Falls CS), had resulted in the redistribution of whitefish stocks in SIL. While many of the Floy®-tags returned were recaptured in the same SIL area in which they were tagged, the study did confirm that there is some movement of Lake Whitefish out of SIL either into the Burntwood/Rat river system through the South Bay diversion channel, or upstream into the Churchill River (Graveline and Remnant 2004). The report by a commercial fisher of one tagged Lake Whitefish recaptured in Partridge Breast Lake, approximately 10 km downstream of Missi Falls CS, suggested that some movement of fish out of SIL may occur. An analysis of the proportion of fish that emigrate versus immigrate is confounded by the discrepancy in fishing effort directed at SIL compared to neighbouring waterbodies (NSC 2014).
Hydro-acoustic studies conducted at the Missi Falls CS from 2007 to 2010 under a variety of flow conditions indicated that under relatively high flows, there are fewer fish in the intake channel, but those present are passed through the CS at higher rates than under low flows. At lower flows, larger fish species such as Lake Whitefish have the swimming capacity to avoid entrainment.
Factor: Effects of Fisheries
A summary of the domestic fishery on SIL was provided in Section 5.3.6.3.1, that was based on a more complete description in Section 3.5.11 (People). Although harvest was not separated by species, Lake Whitefish were reported to be an important component of the domestic fishery (Peristy 1989).
Lake Whitefish has been commercially fished since 1941 and was the primary component of the pre-CRD commercial fishery on SIL, accounting for 92% of the total average annual production (358,649 kg) of the commercial fishery from 1941 to 1973 (Figure 5.3.6A-7; MCWS unpubl. data). Peak production occurred in the 1960s and early 1970s when more than 421,000 kg of Lake Whitefish were harvested annually from the lake.
Prior to CRD, Ayles (1976) noted that local commercial fishers concentrated their efforts in the more southern part of the lake in spring and summer and moved to Area 4 during the late summer and winter. Ayles (1976) speculated that the low fishing pressure on Lake Whitefish populations in Area 5 could potentially explain why this area was as productive as other areas on the main lake in terms of numbers and age/size despite lower nutrient loading from the Churchill River and lower production of benthic invertebrates.
As Lake Whitefish is the primary component of the commercial fishery on SIL, its profitability was (and is) tied to capturing high quality or export grade Lake Whitefish. Export grade whitefish have very low T. crassus infestation rates and are higher value than the more heavily infested continental and cutter
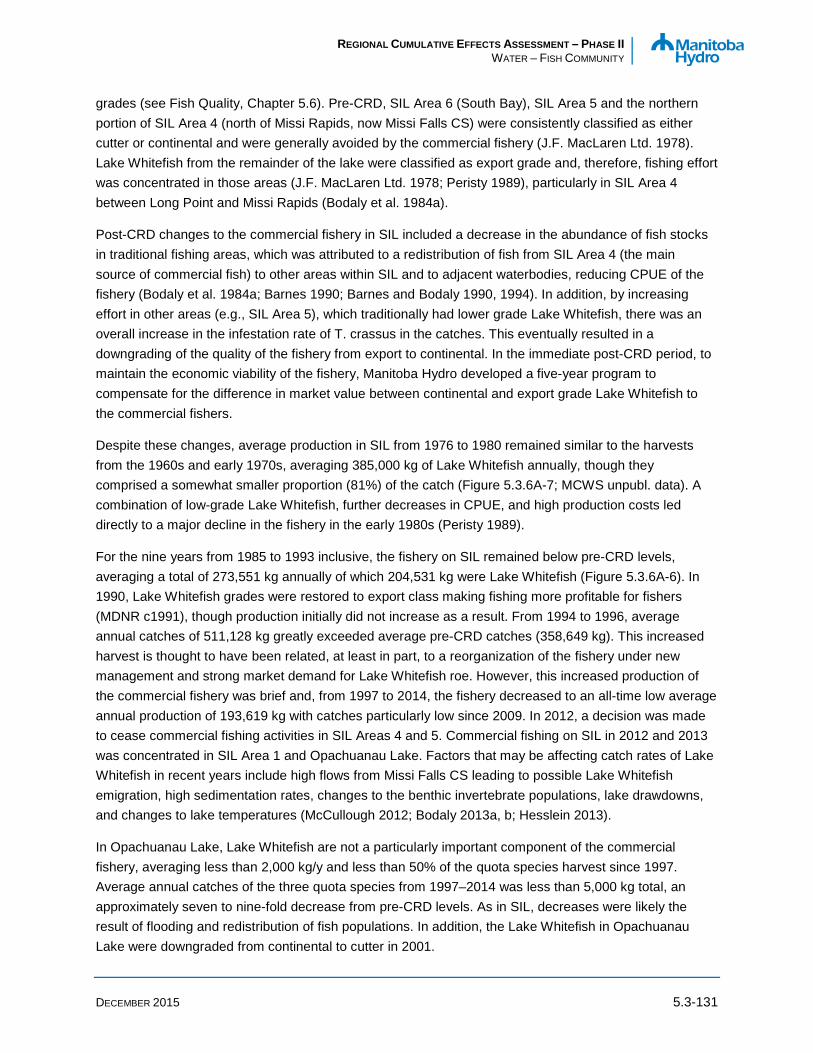
REGIONAL CUMULATIVE EFFECTS ASSESSMENT – PHASE II WATER – FISH COMMUNITY
DECEMBER 2015 5.3-131
grades (see Fish Quality, Chapter 5.6). Pre-CRD, SIL Area 6 (South Bay), SIL Area 5 and the northern portion of SIL Area 4 (north of Missi Rapids, now Missi Falls CS) were consistently classified as either cutter or continental and were generally avoided by the commercial fishery (J.F. MacLaren Ltd. 1978). Lake Whitefish from the remainder of the lake were classified as export grade and, therefore, fishing effort was concentrated in those areas (J.F. MacLaren Ltd. 1978; Peristy 1989), particularly in SIL Area 4 between Long Point and Missi Rapids (Bodaly et al. 1984a).
Post-CRD changes to the commercial fishery in SIL included a decrease in the abundance of fish stocks in traditional fishing areas, which was attributed to a redistribution of fish from SIL Area 4 (the main source of commercial fish) to other areas within SIL and to adjacent waterbodies, reducing CPUE of the fishery (Bodaly et al. 1984a; Barnes 1990; Barnes and Bodaly 1990, 1994). In addition, by increasing effort in other areas (e.g., SIL Area 5), which traditionally had lower grade Lake Whitefish, there was an overall increase in the infestation rate of T. crassus in the catches. This eventually resulted in a downgrading of the quality of the fishery from export to continental. In the immediate post-CRD period, to maintain the economic viability of the fishery, Manitoba Hydro developed a five-year program to compensate for the difference in market value between continental and export grade Lake Whitefish to the commercial fishers.
Despite these changes, average production in SIL from 1976 to 1980 remained similar to the harvests from the 1960s and early 1970s, averaging 385,000 kg of Lake Whitefish annually, though they comprised a somewhat smaller proportion (81%) of the catch (Figure 5.3.6A-7; MCWS unpubl. data). A combination of low-grade Lake Whitefish, further decreases in CPUE, and high production costs led directly to a major decline in the fishery in the early 1980s (Peristy 1989).
For the nine years from 1985 to 1993 inclusive, the fishery on SIL remained below pre-CRD levels, averaging a total of 273,551 kg annually of which 204,531 kg were Lake Whitefish (Figure 5.3.6A-6). In 1990, Lake Whitefish grades were restored to export class making fishing more profitable for fishers (MDNR c1991), though production initially did not increase as a result. From 1994 to 1996, average annual catches of 511,128 kg greatly exceeded average pre-CRD catches (358,649 kg). This increased harvest is thought to have been related, at least in part, to a reorganization of the fishery under new management and strong market demand for Lake Whitefish roe. However, this increased production of the commercial fishery was brief and, from 1997 to 2014, the fishery decreased to an all-time low average annual production of 193,619 kg with catches particularly low since 2009. In 2012, a decision was made to cease commercial fishing activities in SIL Areas 4 and 5. Commercial fishing on SIL in 2012 and 2013 was concentrated in SIL Area 1 and Opachuanau Lake. Factors that may be affecting catch rates of Lake Whitefish in recent years include high flows from Missi Falls CS leading to possible Lake Whitefish emigration, high sedimentation rates, changes to the benthic invertebrate populations, lake drawdowns, and changes to lake temperatures (McCullough 2012; Bodaly 2013a, b; Hesslein 2013).
In Opachuanau Lake, Lake Whitefish are not a particularly important component of the commercial fishery, averaging less than 2,000 kg/y and less than 50% of the quota species harvest since 1997. Average annual catches of the three quota species from 1997–2014 was less than 5,000 kg total, an approximately seven to nine-fold decrease from pre-CRD levels. As in SIL, decreases were likely the result of flooding and redistribution of fish populations. In addition, the Lake Whitefish in Opachuanau Lake were downgraded from continental to cutter in 2001.

REGIONAL CUMULATIVE EFFECTS ASSESSMENT – PHASE II WATER – FISH COMMUNITY
DECEMBER 2015 5.3-132
Aiken (2014) reported that the current characteristics of the Lake Whitefish population in SIL Area 1, which is primarily composed of young, fast growing fish that mature at a young age and few old large mature fish, generally fit the description of how fish typically respond to exploitation. The removal of older (and consequently larger) fish leads to a decrease in the average age, and reduced competition leads to increased growth rates and a decrease in age at maturity (Gangl and Pereira 2003; Handford et al. 1977; Healey 1975, 1980). In contrast, the characteristics in SIL Area 4, with a high mean age, low growth rates, smaller mean size, and low condition factor, are more similar to Lake Whitefish populations of Lesser Slave Lake, AB in the 1970s, which Handford et al. (1977) suggested were the effects of a long-term highly selective fishery. A number of fisheries have exhibited responses that contradict those observed by Healy (1974, 1975), including increased mean age (versus decreased mean age), decreased size-at-age (versus increased size-at-age), and a loss of genetic diversity (Kennedy 1954; Tallman and Friesen 2007; Jorgensen et al. 2007).
5.3.6.3.3 Walleye
INDICATOR: ABUNDANCE
Metric: Catch-Per-Unit-Effort
A comparison of standardized Walleye CPUE values (Appendix 5.3.1B) from standard gang index gill nets set over the course of three time periods (pre-, early post-, and recent post-CRD) in each of six HGAs of SIL and Opachuanau Lake shows an overall decreasing trend (Figure 5.3.6A-16). Because Opachuanau Lake was only sampled once in each of two periods it has not been included in the box plots. Prior to CRD, the highest capture rates of Walleye occurred in SIL Areas 5 and 6 and Opachuanau Lake (mean CPUEs of 23, 13, and 19 fish/100 m/24 h, respectively). Immediately post-diversion, the limited data available show a decrease in the mean CPUE in SIL Areas 4, 5, and 6 to 3–5 fish/100 m/ 24 h. More recently, the mean CPUE is <1 fish/100 m/24 h in all areas of SIL except for SIL Area 5, where the mean is 12 fish/100 m/24 h. In Opachuanau Lake, the CPUE is 4 walleye/100 m/24 h. A box plot comparison of pre-diversion and recent data suggests that there has been a decrease in the CPUE of Walleye in all SIL areas as indicated by the lack of overlap between the upper (post) and lower (pre) quartiles.
The mean CPUE for Walleye in SIL Area 5 in the recent post-CRD time period falls between the mean CPUE for Walleye for Granville Lake (9 fish/100 m/24 h) and that of Gauer Lake (19 fish/100 m/24 h) (Figure 5.3.6A-16).
The discussion section that follows looks at the contribution of selected potential factors to the observed changes in Walleye abundance over time.
INDICATOR: CONDITION
Metric: Fulton’s Condition Factor (KF)
In a 1952 survey by the Manitoba Game and Fisheries Branch, McTavish (1952) reported that the Walleye found in SIL varied in condition among areas captured. They were recorded as being in excellent
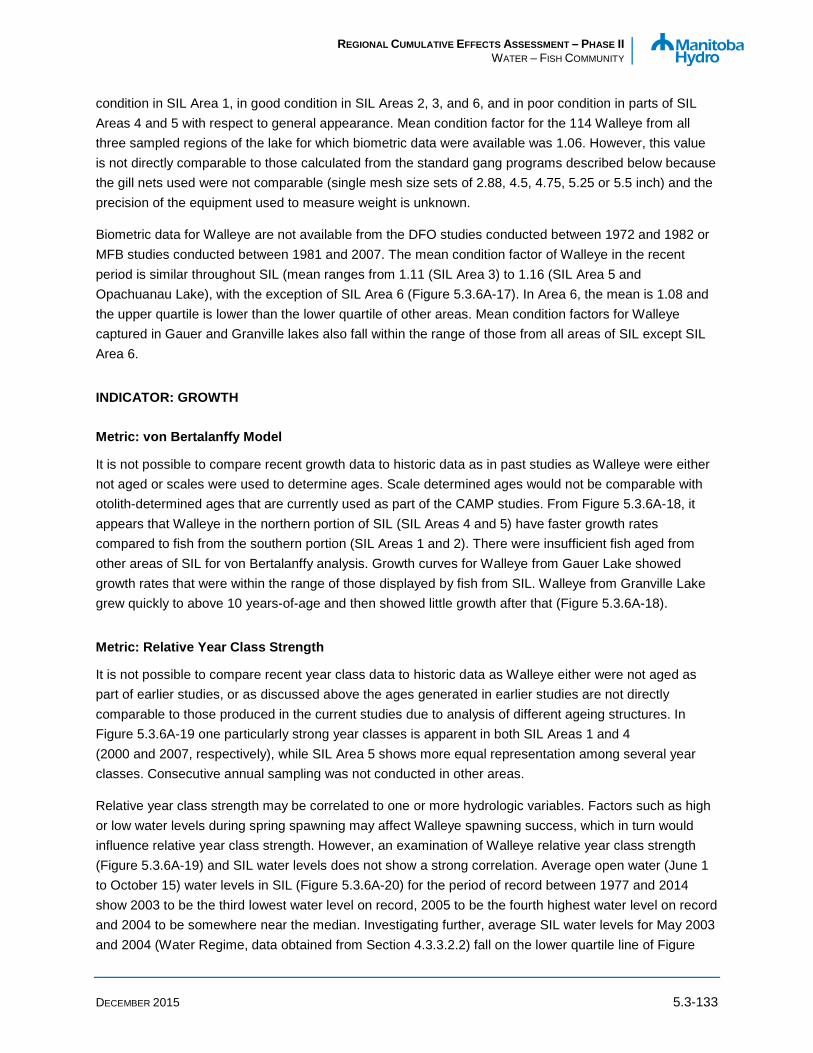
REGIONAL CUMULATIVE EFFECTS ASSESSMENT – PHASE II WATER – FISH COMMUNITY
DECEMBER 2015 5.3-133
condition in SIL Area 1, in good condition in SIL Areas 2, 3, and 6, and in poor condition in parts of SIL Areas 4 and 5 with respect to general appearance. Mean condition factor for the 114 Walleye from all three sampled regions of the lake for which biometric data were available was 1.06. However, this value is not directly comparable to those calculated from the standard gang programs described below because the gill nets used were not comparable (single mesh size sets of 2.88, 4.5, 4.75, 5.25 or 5.5 inch) and the precision of the equipment used to measure weight is unknown.
Biometric data for Walleye are not available from the DFO studies conducted between 1972 and 1982 or MFB studies conducted between 1981 and 2007. The mean condition factor of Walleye in the recent period is similar throughout SIL (mean ranges from 1.11 (SIL Area 3) to 1.16 (SIL Area 5 and Opachuanau Lake), with the exception of SIL Area 6 (Figure 5.3.6A-17). In Area 6, the mean is 1.08 and the upper quartile is lower than the lower quartile of other areas. Mean condition factors for Walleye captured in Gauer and Granville lakes also fall within the range of those from all areas of SIL except SIL Area 6.
INDICATOR: GROWTH
Metric: von Bertalanffy Model
It is not possible to compare recent growth data to historic data as in past studies as Walleye were either not aged or scales were used to determine ages. Scale determined ages would not be comparable with otolith-determined ages that are currently used as part of the CAMP studies. From Figure 5.3.6A-18, it appears that Walleye in the northern portion of SIL (SIL Areas 4 and 5) have faster growth rates compared to fish from the southern portion (SIL Areas 1 and 2). There were insufficient fish aged from other areas of SIL for von Bertalanffy analysis. Growth curves for Walleye from Gauer Lake showed growth rates that were within the range of those displayed by fish from SIL. Walleye from Granville Lake grew quickly to above 10 years-of-age and then showed little growth after that (Figure 5.3.6A-18).
Metric: Relative Year Class Strength
It is not possible to compare recent year class data to historic data as Walleye either were not aged as part of earlier studies, or as discussed above the ages generated in earlier studies are not directly comparable to those produced in the current studies due to analysis of different ageing structures. In Figure 5.3.6A-19 one particularly strong year classes is apparent in both SIL Areas 1 and 4 (2000 and 2007, respectively), while SIL Area 5 shows more equal representation among several year classes. Consecutive annual sampling was not conducted in other areas.
Relative year class strength may be correlated to one or more hydrologic variables. Factors such as high or low water levels during spring spawning may affect Walleye spawning success, which in turn would influence relative year class strength. However, an examination of Walleye relative year class strength (Figure 5.3.6A-19) and SIL water levels does not show a strong correlation. Average open water (June 1 to October 15) water levels in SIL (Figure 5.3.6A-20) for the period of record between 1977 and 2014 show 2003 to be the third lowest water level on record, 2005 to be the fourth highest water level on record and 2004 to be somewhere near the median. Investigating further, average SIL water levels for May 2003 and 2004 (Water Regime, data obtained from Section 4.3.3.2.2) fall on the lower quartile line of Figure
REGIONAL CUMULATIVE EFFECTS ASSESSMENT – PHASE II WATER – FISH COMMUNITY
DECEMBER 2015 5.3-134
4.3.3-2 (Water Regime, Section 4.3.3) while May 2005 data fall on the upper quartile line of the same figure. Figure 5.3.6A-19 shows that in 2003 there were moderately good Walleye year classes in Area 5 but not in Areas 4 and 1. In 2004 there were poor to fair year classes in all three areas, while in 2005 there was a very strong year class in Area 5 but poor year classes in Areas 1 and 4. This information suggests that while water level may have some effect on relative year class strength, there are other factors involved including the abundance of spawning Walleye in each area.
DISCUSSION: FACTORS AFFECTING WALLEYE OVER TIME
McTavish (1952) observed that SIL provided spawning habitat for Walleye, particularly in the long bays that were prominent in the southwestern portion of the lake, at river confluences in the west, in the eastern end of South Bay, and in the Missi Falls CS area. Weagle and Baxter (1973) identified tributaries to SIL and Opachuanau Lake used by spawning Walleye. The McBride River (a tributary to the Barrington River) and the Muskwesi River were identified as major spawning streams. Other spawning streams that were identified by Weagle and Baxter (1973) included the Barrington River, Cousins Creek, Sandhill Stream, and the Waddie River. Weagle and Baxter (1973) also stated that the majority of the spawning in these streams occurs at the first set of rapids above Southern Indian or Opachuanau lakes, habitat that would be flooded by CRD. Ayles and Koshinsky (1974) noted that the majority of spawning Walleye that use the streams noted above, as well as streams in South Bay, remain in the streams for a period of time before moving back into SIL in early July.
Bodaly (1980) reported on pre- and post-spawning movements of Walleye in Sandhill Stream and Poplar Stream (a small stream flowing into South Bay) from 1975 to 1978. Fish were concentrated after spawning in shallow bays adjacent to spawning streams in late spring and early summer. Rates of dispersal away from spawning streams were highly variable between individual fish but the greatest overall degree of dispersal occurred in late summer, when Walleye were captured by the commercial fishery in open, deeper areas of the lake.
During the first fish community survey of SIL, McTavish (1952) found Walleye to be abundant in SIL, particularly in SIL Areas 1 and 6. Pre-diversion (1972–1975) standard gang index gillnetting studies found that the relative abundance of Walleye ranged from a low of about 4% of the catch in SIL Area 1 to 26% of the catch in SIL Area 5 (Figure 5.3.6A-3). Immediate post-diversion (1976–1982) relative abundance of Walleye was 4% in SIL Area 4, 6% in Area 6, and 9% in SIL Area 5. Current (2008–2013) relative abundance of Walleye ranges from less than 10% of the catch in SIL Areas 1–4 and 6 to approximately 25% in SIL Area 5 (Figure 5.3.6A-4). As discussed previously, standard gang index gillnetting data show that prior to CRD there were fairly high capture rates of Walleye in SIL Areas 5 and 6, while currently Walleye CPUE is low in all areas of the lake except SIL Area 5.
A decline in Walleye abundance is also shown by the spring spawning studies conducted in selected tributaries between 1975 and 1978 and then again in 2004 and 2005. Numbers of Walleye captured moving upstream ranged from greater than 8,263 in 1975 to 1,870 in 1978 in Sandhill Stream, and from 1,904 in 1976 to 617 in 1978 in Poplar Stream (Bodaly 1980). Gurney and Remnant (2005) revisited these same streams in 2004 and felt that they captured most of the upstream Walleye migrants that year. A total of 285 and five Walleye were captured in Poplar Stream and Sandhill Stream, respectively (Gurney and Remnant 2005). Sandhill Stream was revisited in 2005 and no upstream Walleye migrants

REGIONAL CUMULATIVE EFFECTS ASSESSMENT – PHASE II WATER – FISH COMMUNITY
DECEMBER 2015 5.3-135
were captured, although the sampling program (and likely any upstream movements of fish) was interrupted by inclement weather (Mota and Remnant 2006).
Factor: Effects of Changes to the Water Regime and Other Factors on Fish Habitat
CRD increased the average water level on SIL by 2.7 m (Water Regime, Section 4.3.3.2.3). Bodaly (1980) reported that the most downstream set of rapids in both Poplar and Sandhill streams were inundated as a result of impoundment of SIL and speculated that spawning habitat for Walleye in the most downstream reaches of these tributaries, as well as other tributaries, was affected by CRD. Gurney and Remnant (2005) reported on movements of spawning Walleye and other species in Poplar and Sandhill streams during spring 2004. They found considerably fewer Walleye using these streams compared to numbers reported by Bodaly (1980). Mota and Remnant (2006) documented the use of Sandhill Stream and the Waddie River by spawning fish during early spring 2005. No Walleye ascended Sandhill Stream; Walleye in spawning condition were captured ascending Waddie River.
Factor: Effects of Changes to Sedimentation and Water Quality
Although Walleye are known to be lake spawners as well as stream spawners in much of their native range (Scott and Crossman 1998; Stewart and Watkinson 2004), little appears to be known about lake spawning by Walleye in SIL. McTavish (1952) reported that non-riverine habitat in many areas of the lake was suitable for Walleye spawning, but there was no documentation of successful spawning in these areas. All work conducted to date appears to have been focussed on stream spawning. Ongoing sedimentation would not be expected to be affecting Walleye spawning habitat in tributaries as the spring freshet would clean out any sediment deposited the previous winter. If lake spawning was occurring, it is possible that some of this habitat would be affected by sedimentation during winter.
Factor: Effects of Obstructions to Upstream Movements/Alterations to Downstream Movements
Fish movement studies conducted in SIL focussed on Lake Whitefish; however, some information was obtained on movements of Walleye both within SIL and between SIL and other waterbodies. A total of 33 Walleye were tagged as part of the Floy®-tagging study (Graveline and Remnant 2004). A total of 10 Walleye were recaptured; nine of which were recaptured in SIL, and one of which was recaptured in the Rat River. A Walleye that was tagged in Notigi Lake was recaptured in SIL, indicating that fish will also move upstream into SIL via the South Bay Diversion Channel (Graveline and Remnant 2004). Gillnetting studies conducted in support of the hydro-acoustic study conducted at Missi Falls CS captured small numbers of Walleye over the four years of the study (NSC 2014). The presence of small numbers of Walleye in the area of the Missi Falls CS suggests that some Walleye may move downstream out of SIL.
Factor: Effects of Fisheries
A summary of the domestic fishery on SIL was provided in Section 5.3.6.3.1, that was based on a more complete description in Section 3.5.11 (People). Although harvest was not separated by species, Walleye were reported as one of the most commonly consumed species by SIL residents following CRD (Campbell et al. 1997).

REGIONAL CUMULATIVE EFFECTS ASSESSMENT – PHASE II WATER – FISH COMMUNITY
DECEMBER 2015 5.3-136
Although Walleye have been commercially fished in SIL since 1941, it accounted for only 7% of the total quota catch for an average annual harvest of about 26,000 kg from 1941 to 1973 (Figure 5.3.6A-7). Peak pre-CRD production occurred in the 1960s and early 1970s when more than 35,000 kg of Walleye were harvested annually from the lake. Opachuanau Lake had a lucrative pre-CRD Walleye fishery with production ranging from 33,000–47,000 kg annually (Hrenchuk 1991).
In the years immediately following the completion of the CRD, additional effort was put into commercial fishing to keep the Lake Whitefish harvest at pre-CRD levels. As a result, Walleye harvest increased somewhat. From 1976 to 1980 inclusive annual Walleye catches exceeded 40,000 kg (Figure 5.3.6A-7). Due primarily to decreased CPUE and lowered prices for Lake Whitefish, in combination with high production costs, there was a decline in the Lake Whitefish fishery in the early 1980s (Peristy 1989). SIL Walleye production also decreased, measuring a relatively consistent 20,000 kg annually (7.5% of the total quota catch) from 1981–2007 or almost half of harvest levels in previous years (Figure 5.3.6A-7).
Although Lake Whitefish harvests have continued to decline since 2007 (see Section 5.3.6.3.2), annual harvests of Walleye have remained relatively stable and the species now accounts for more than 30% of the catches (Figure 5.3.6A-7).
Walleye mark and recapture studies conducted in selected tributaries to SIL in the mid-1970s and the mid-2000s showed that the number of Walleye moving into these tributaries had declined considerably over the approximately 30 years between studies (Bodaly 1980; NSC 2014). It is also known that a large proportion of the tagged Walleye were captured by commercial fishers as they moved back into the lake. Bodaly (1980) documented annual exploitation rates as high as 0.48 for fish tagged in Sandhill and Poplar streams. Gurney and Remnant (2005) found that 56% of the 298 Floy®-tags applied to Walleye in Poplar and Sandhill streams in June 2004 had been returned by the commercial fishery by early 2005.
In response to an assessment of low Walleye abundance in SIL, made by MCWS, the SILESC started a program in 2006 to identify potential brood stock within nearby waterbodies for stocking of Walleye into selected tributaries in SIL (Manitoba Hydro 2014c). Between 2011 and 2014, a total of approximately three million Walleye fry were introduced into Sandhill Bay and approximately one million Walleye fry were introduced in Cousins Creek (NSC 2014).
Opachuanau Lake, which was a commercially productive lake for Walleye pre-CRD, saw large decreases in catches post-CRD. As in SIL, decreases were likely the result of flooding and redistribution of fish populations. Average annual catches of the three quota species from 1997–2014 was less than 5,000 kg total of which Walleye comprised about 43%. Without species-specific pre-CRD values, it is unknown if the proportion of the catch comprised by Walleye remains similar, but it continues to be the most valuable component of the fishery on this lake, particularly with Lake Whitefish being downgraded from continental to cutter in 2001.
Walleye are an important component of the commercial fisheries in Gauer and Granville Lakes. Walleye comprise about 50% of the commercial catch in Gauer Lake and about 30% of the commercial catch in Granville Lake (MCWS unpubl. data).

REGIONAL CUMULATIVE EFFECTS ASSESSMENT – PHASE II WATER – FISH COMMUNITY
DECEMBER 2015 5.3-137
5.3.6.4 Cumulative Effects of Hydroelectric Development on the Fish Community of Southern Indian Lake
Unlike some other areas/reaches, there is a fairly substantial amount of data on the fish community of SIL. The primary sources of data include the LWCNRSB studies (1970s), DFO studies (1970s and 1980s), MFB studies (1980s–2000s), SILESC studies (2000s and 2010s), CAMP (2008–2013), and the commercial fishery. However, not all the data were directly comparable due to differences in methodologies, the timing of studies, or the selected metrics. Where possible, data were compared over three general time periods: pre-CRD (1972–1975), immediate post-CRD (1976–1982), and current (2008–2013).
Domestic fishing was always important to people living around SIL, and in 1941 commercial harvesting was initiated. Commercial fishing grew to become a major source of income to the community. Average annual production of the commercial fishery from 1941 to 1973 was 358,649 kg, of which 92% was Lake Whitefish, 7% was Walleye, and 3% was Northern Pike. By 1966 the quota for the fishery was 533,647 kg, higher than actual production in most years. The general conclusion at that time was that lake productivity was high enough to meet quotas, but that fishing effort was limiting production. At its height, prior to CRD, the SIL fishery was the largest in northern Manitoba (Peristy 1989). Presently, the SIL commercial fishery has gone through several years of declining production, and since 2012 there has been no commercial fishing in SIL Areas 4 and 5.
Pre-CRD, the most common species were Lake Whitefish, White Sucker, Longnose Sucker, and Northern Pike. Lake Whitefish accounted for greater than 20% of the catch in all SIL areas except for SIL Area 1 and Opachuanau Lake. Fish capture rates (mean CPUE for total catch) varied from 54 fish/100 m/24 h in SIL Area 6 to 103 fish in SIL Area 2. The CPUE (95 fish) in Opachuanau Lake in 1972 was similar to that in SIL Areas 1 and 2. Pre-CRD, the mean CPUE of Lake Whitefish varied from about 5 fish/100 m/24 h in SIL Area 6 to 30 fish in SIL Area 2 and the species tended to prefer those areas along the main flow of the river. The exception was SIL Area 5, which was relatively productive despite being off the main flow. Pre-CRD studies found that the proportion of Walleye in the catch ranged from a low of about 4% in SIL Area 1 to 26% in SIL Area 5, with high capture rates of Walleye in SIL Areas 5 and 6.
Construction of the Missi Falls and the Notigi CSs regulated the natural outlet of the lake, and resulted in an increase in the average water level on SIL by 2.7 m and flooded approximately 140 km2. CRD also affected flow patterns within SIL and changed water residence times considerably within the various SIL areas. Post-CRD, the majority of the outflow typically flows south via the South Bay Diversion Channel to the Rat-Burntwood river system. Median monthly flows through the Missi Falls CS showed a flow reduction of up to ten-fold. The exception to this is when large spill events occur at the Missi Falls CS. These large discharges through Missi Falls CS change flow patterns within the lake considerably.
Immediately post-CRD (1976–1982), total catch CPUE varied from approximately 40 fish/100 m/24 h in SIL Area 6 to 69 fish in SIL Area 5. In the early post-diversion period, there was an increase in the proportion of Cisco in the catch in SIL Areas 4 and 5 and decreases of Walleye and White Sucker. This pattern was reversed in SIL Area 6. Immediately post-CRD (1976–1982), the proportion of Lake Whitefish in the catch within SIL remained similar to that of pre-CRD catches. Lake Whitefish CPUE
REGIONAL CUMULATIVE EFFECTS ASSESSMENT – PHASE II WATER – FISH COMMUNITY
DECEMBER 2015 5.3-138
ranged from 6–21 fish/100 m/ 24 h in SIL Areas 4, 5, and 6. The proportion of Walleye in the catch was 4% in SIL Area 4, 6% in Area 6, and 9% in SIL Area 5.
Domestic and commercial fishing continued post-CRD; however, fishers noted that the fisheries on SIL had been substantially affected. There was a decrease in the abundance of Lake Whitefish in traditional commercial fishing areas attributed to a redistribution of fish which reduced the harvests in these areas. Average production from 1976 to 1980 inclusive exceeded pre-CRD averages at 474,495 kg annually. This may have occurred for several reasons including increased effort by the fishers coupled with the Manitoba Hydro incentive program.
In the current period (2008–2013), total catch CPUE varied from approximately 25 fish/100 m/24 in SIL Area 3 to 55 fish in SIL Area 5. The mean value in Opachuanau Lake was slightly higher at 63 fish. Comparison of the fish community metrics over the three periods suggests that there has been a decrease in the total catch CPUE in SIL, a change in the proportion of certain species in the catch, and an overall increase in the evenness of the fish community. The current (2008–2013) proportion of Walleye in the catch ranged from less than 10% in SIL Areas 1–4 and 6–25% in SIL Area 5. Currently, Walleye capture rates are low in all areas of the lake except SIL Area 5.
Lake Whitefish CPUE in the current period ranged from approximately 5 fish/100 m/24 h in SIL Areas 2, 3, 5, 6, and Opachuanau Lake to 13 fish in SIL Area 4. Additional information on the CPUE of Lake Whitefish in SIL Areas 1 and 4 is available from MFB studies that specifically targeted the collection of Lake Whitefish between 1981 and 2007. The median number of Lake Whitefish captured per overnight set in SIL Area 4 showed a decline from 101 fish/set during the 1980s, to 78 fish/set in the 1990s, to 41 fish/set in the 2000s. No such decline was observed in SIL Area 1, where the median values were 36, 59, and 40 fish/set in the 1980s, 1990s, and 2000s, respectively. Despite the decline, Lake Whitefish remain one of the dominant species captured in SIL Areas 3 and 4 (> 20% of the catch) and overall account for greater than 8% of the standard index gill net catch in the lake. Lake Whitefish capture rates in SIL Areas 4 and 5 are similar to those of the off-system reference, Gauer Lake and capture rates in the other SIL areas are comparable to the other reference waterbody, Granville Lake.
For the nine years from 1985 to 1993 inclusive, the fishery on SIL remained below pre-CRD levels, averaging a total of 273,551 kg annually of which 204,531 kg were Lake Whitefish. In 1990, Lake Whitefish grades were restored to export class making fishing more profitable for fishers, although production initially did not increase as a result. From 1994 to 1996, average annual catches of 511,128 kg exceeded average pre-CRD catches (358,649 kg). This increased harvest is thought to have been related, at least in part, to a reorganization of the fishery under new management and strong market demand for Lake Whitefish roe. However, this increased production of the commercial fishery was brief and, from 1997 to 2014, the fishery decreased to an all-time low average annual production of 193,619 kg with catches particularly low since 2009. In 2012, a decision was made to cease commercial fishing activities in SIL Areas 4 and 5. Although Lake Whitefish harvests have continued to decline since 2007, annual harvests of Walleye have remained relatively stable and the species now accounts for more than 30% of the SIL catch.
Information provided by SIL fishers, scientific evidence, and the closure of much of the SIL commercial fishery suggests that Lake Whitefish capture rates are continuing to decline in all areas of the lake. There

REGIONAL CUMULATIVE EFFECTS ASSESSMENT – PHASE II WATER – FISH COMMUNITY
DECEMBER 2015 5.3-139
are other characteristics of the Lake Whitefish population in SIL Area 4 that have led to concern, which include: old, slow growing fish that are dominated by two older year classes; small maximum size; poor condition factor; and evidence for non-annual spawning.
A number of concerns have been expressed regarding the changes observed in the SIL fish community, particularly with respect to populations of Lake Whitefish and Walleye. These concerns have been broadly categorized into four factors, including: changes to spawning habitat; change in emigration; change in food availability; and effects of the commercial fishery.
Concerns have been expressed regarding CRD-related effects of winter drawdown and sedimentation on Lake Whitefish eggs. The minimum depth at which Lake Whitefish are known to spawn in SIL (1.5 m) is less than the maximum ice thickness on SIL (estimated at 1.4 m), but is within the annual exposure zone (estimated at between 1.5 and 2.6 m since 1972). The depth of winter drawdown or the exposure zone may affect the overwintering survival of Lake Whitefish eggs which in turn may influence relative year class strength. However, although exposure zone may influence relative year class strength to some degree, no strong correlation was found between years of strong and weak year classes and annual estimated exposure zones in SIL.
Work conducted in the late 1970s/early 1980s found that sedimentation over Lake Whitefish spawning beds during the period of egg incubation was occurring, and that observed levels of sedimentation were sufficient to cause decreased egg survival. Repetition of the previous study during 2011/2012 found similar rates of sedimentation, suggesting that in at least some areas of the lake sedimentation may still be affecting egg survival.
Studies conducted under FEMP reported that most of the Lake Whitefish observed congregating downstream of the Missi Falls CS in 1986 originated from SIL and were attempting to return to the lake. Flow through the CS that year was high and similar to pre-CRD flows. The following year, fewer Lake Whitefish were captured below the Missi Falls CS in a year when flows through Missi Falls CS were more typical of post-CRD conditions, and these fish were believed to have moved upstream from Partridge Breast Lake. A tagging study conducted between 1998 and 2003 found that most tagged Lake Whitefish and other species were recaptured within SIL, although a few fish moved down the Diversion Channel or upstream into the Churchill River, and one tagged Lake Whitefish was reported to have been captured in Partridge Breast Lake. Hydro-acoustic studies conducted at the Missi Falls CS from 2007 to 2010 under a variety of flow conditions indicated that under relatively high flows, there are fewer fish in the intake channel, but those present are passed through the CS at higher rates than under low flows. At lower flows, larger fish species such as Lake Whitefish have the swimming capacity to avoid entrainment.
It has been suggested that differences in growth rates of Lake Whitefish among SIL areas may be related to changes in the composition and abundance of food items. The results of current studies showed that the composition of benthic invertebrates in SIL Areas 4 and 5 appear to provide a suitable food source for Lake Whitefish, although it appears that the abundance of benthic invertebrates has declined somewhat in SIL Areas 4 and 5 since the early 1980s.
The effect of the fishery on fish populations in SIL is difficult to assess. Lake Whitefish CPUE as measured in index gill nets has generally decreased over the three time periods in all SIL areas.
REGIONAL CUMULATIVE EFFECTS ASSESSMENT – PHASE II WATER – FISH COMMUNITY
DECEMBER 2015 5.3-140
Commercial harvest has also declined substantially, particularly in recent years. Continued harvest of fewer and fewer fish, particularly in SIL Area 4, would intuitively affect the size of the fish population. Current characteristics of the Lake Whitefish population in SIL Area 1, which is primarily composed of young, fast growing fish that mature at a young age and few old large mature fish, generally fit the description of how fish typically respond to exploitation. The removal of older, larger fish leads to a decrease in the average age, and reduced competition leads to increased growth rates and a decrease in age at maturity. In contrast, based on a comparison with available literature, the characteristics of the Lake Whitefish population in SIL Area 4, with a high mean age, low growth rates, smaller mean size, and low condition factor, are suggestive of the effects of a long-term highly selective fishery.
REGIONAL CUMULATIVE EFFECTS ASSESSMENT – PHASE II WATER – FISH COMMUNITY
DECEMBER 2015 5.3-141
5.3.7 Area 3: South Bay Diversion Channel to First Rapids on the Burntwood River
As discussed in Section 5.3.6, Area 3 comprises the Churchill River from Leaf Rapids to the outlet of SIL at the Missi Falls CS and the Rat/Burntwood River from the South Bay Diversion Channel to First Rapids as well as tributary waterbodies (Map 5.3.6-1). The discussion of the fish community considers the area in two reaches that are divided at the South Bay Diversion Channel. The reach of Area 1 considered in this section includes the Rat River lakes and river reaches including Issett, Karsakuwigamak, Pemichigamau, Rat, Mynarski, Notigi, and Wapisu lakes, Footprint Lake and River, and the upper and lower Burntwood River lakes and river reaches including Threepoint, Kinosaskaw, Sesep, Wuskwatim, Opegano, Birch Tree, and Apussigamasi lakes. CRD caused diversion of the majority of the upper Churchill River flow into the Rat/Burntwood River system and included construction of a CS at Notigi Lake.
Project descriptions for hydroelectric developments in the South Bay Diversion Channel to First Rapids on the Burntwood River reach of Area 3 are found in Part II, Hydroelectric Development Project Description in the Region of Interest. A detailed description of the effects of hydroelectric development on the water regime in this reach is provided in Section 4.3.3 (Water Regime). Key points of the project description and water regime information relevant to fish and fish habitat are summarized below.
Construction activities, including construction of major access roads and development of construction camps for the Notigi CS, were initiated in winter 1972/1973. Discharge from Notigi Lake was stopped over the impoundment period from May 8, 1974 to November 24, 1975. Diversion of the Churchill River was initiated on June 2, 1976, and the cofferdam at the Notigi CS was removed on September 1, 1976. Manitoba Hydro’s operation of the Notigi CS regulates both inflows to this hydraulic zone through the South Bay Diversion Channel and outflows from this hydraulic zone through the Notigi CS. The majority of flooding caused by CRD occurred in this reach. Approximately 453 km2 were flooded, which caused an approximate doubling of the surface area of lakes in this reach. The greatest flooding and increase in surface area occurred in the Issett Lake area, which increased from about 4.6 to 118.7 km2, and Rat Lake which increased from about 93.6 to 241 km2. Based on limited data before impoundment of Notigi Lake, it appears that CRD increased water levels by approximately 50 ft (15.2 m) just upstream from the Notigi CS.
5.3.7.1 Key Published Information The earliest published study of fish populations in the Burntwood River (from a point 8 km upstream of Thompson downstream to its mouth) was by Sunde (1958, 1960, 1961). Pre-CRD studies of several lakes on the Rat-Burntwood River system (including Issett, Pemichigamau, Karsakuwigamak, Rat, Mynarski, Wapisu, Threepoint, and Wuskwatim lakes) were conducted as part of the LWCNRSB studies (Ayles et al. 1974).
Following CRD, the province conducted several experimental gillnetting investigations in Notigi, Rat, Karsakuwigamak, Pemichigamau, Mynarski, Wapisu, Threepoint, Footprint, Wuskwatim, Osik, Macheewin, and Apussigamasi lakes between 1983 and 1984 (as part of the Canada-Manitoba
REGIONAL CUMULATIVE EFFECTS ASSESSMENT – PHASE II WATER – FISH COMMUNITY
DECEMBER 2015 5.3-142
Agreement on the Study and Monitoring of Mercury in the CRD) and from 1985 to 1989 as part of the MEMP (Patalas 1984b; Kirton 1985, 1987; Kirton and Mohr 1987; Green 1987a, b, 1989; Hagenson 1987a).
Prior to the development of the Wuskwatim GP, Manitoba Hydro assessed effects of potential hydroelectric development options for a reach of the Burntwood River between Notigi and Split lakes on factors including the fisheries resources (MacLaren Engineers Inc. and InterGroup Consulting Economists Ltd. 1984). In 1996, Manitoba Hydro and the Split Lake Cree conducted a joint assessment of the effects of hydroelectric development in the Split Lake Resource Management Area, which includes a portion of the Burntwood River downstream of Apussigamasi Lake (Volume 3, Split Lake Cree-Manitoba Hydro Joint Study Group 1996). Since 1998, experimental gillnetting studies have been conducted in several waterbodies in the Wuskwatim GP study area (including Notigi, Wapisu, Threepoint, Footprint, Osik, Wuskwatim, Opegano, and Birch Tree lakes, and portions of the Rat and Burntwood rivers) as part of the licensing process for the Wuskwatim GP (Fazakas 2000b; Bernhardt and Mota 2003; Caskey and Mota 2003a, b, c, d, e; Caskey et al. 2003; Holm and Mota; 2003a, b; Kroeker and Holm 2003; Kroeker et al. 2003a, b, c; Kroeker and Mota 2003; Mota 2003a, b, c, 2005a, b; Mota and Fazakas 2000; Mota and Heuring 2003; Mota and Jansen 2003; Volume 5, Manitoba Hydro and NCN 2003). Spawning investigations (Mota et al. 2000; Mota 2005c), as well as movement studies of selected species (Walleye, Cisco, Lake Whitefish, and Northern Pike) tagged in the Rat-Burntwood system, including Notigi Lake, have been studied during the 1999–2002 period (Fazakas 2000a; Fazakas and Mota 2000; Eddy and Fazakas 2001; Jansen et al. 2005; Mota and Remnant 2003). Aquatic effects monitoring, including a fish populations component, has been conducted since the start of construction of the Wuskwatim GP (Mota 2009a, b, c, d, e, 2010a, b; Mota and Barth 2014; Mota and Remnant 2015) and of supporting infrastructure (Fazakas and Remnant 2003; Manitoba Hydro 2008; Hudd 2009; NSC 2010b).
Notigi, Rat, West and Central Mynarski, Threepoint, Apussigamasi, and Footprint lakes continue to be monitored under CAMP.
5.3.7.2 New Information and/or Re-analysis of Existing Information Fish population information from the published literature1 was supplemented with historic data that had previously not been published as well as published data for which the raw data were made available for re-analysis with data collected under CAMP.
Although a variety of different sampling methods have been employed, many of the studies have used standard gang index gillnets as the primary means of sampling the large-bodied fish community. Over time, there have been differences in the mesh sizes used, sampling sites, time of sampling, and sampling
1The pre-CRD index gillnetting data on diversion route lakes in 1973 (Ayles et al. 1974) are not included in the analysis because sufficient data were not available to standardize the metric analyses to be comparable to data collected as part of the Wuskwatim GS EIS studies and CAMP.
REGIONAL CUMULATIVE EFFECTS ASSESSMENT – PHASE II WATER – FISH COMMUNITY
DECEMBER 2015 5.3-143
design (i.e., habitat-based sampling versus Lake Whitefish stock assessment). To make the MEMP data collected from 1983–1989, Wuskwatim GP data collected from 1998–2007, and CAMP data collected between 2008 and 2013 comparable, it was necessary to eliminate the data generated from some of the mesh sizes that were not used consistently among programs (i.e., mesh ≤ 1.5 inch).
Some differences in methods remain between the gillnetting studies that were selected for the quantitative analysis. There were differences in the number of sites fished between studies, as well as how those sites were selected. As well, there are differences in the timing of gillnetting studies: the MEMP sampling occurred from the end of May to early September, the Wuskwatim GP sampling from mid-July to mid-September, while CAMP studies typically occurred in July and August. Differences in the structure used to determine ages prevented comparison of data collected from Lake Whitefish and Walleye using fin rays (SIL 1981–2007) and dorsal spines (Wuskwatim GP area 1998–2007), respectively, to data collected using otoliths.
5.3.7.3 Changes in the Fish Community and Focal Species over Time
The following discussion is based on a combination of the results found in key published information and a reanalysis of novel and selected existing data. The available comparable data were grouped into three periods and analyzed: early post-CRD (1983–1989); late post-CRD (1998–2002); and recent post-CRD (2007–2013).
5.3.7.3.1 Fish Community
INDICATOR: ABUNDANCE
Metric: Catch-Per-Unit-Effort
Catch-per-unit-effort was calculated for all species (i.e., the total catch) captured in standard gangs set in each of nine diversion route lakes (Figure 5.3.7A-1). In the early post-diversion period (1983–1989), the mean total CPUE varied from 30 fish/100 m/24 h in Notigi Lake to 110 fish in Footprint Lake. Approximately two decades after diversion (1998–2002), the mean total CPUE varied from approximately 16 fish/100 m/24 h in Notigi Lake to 90 fish in Footprint Lake. In the most recent period (2007–2013), mean total CPUE varied from approximately 28 fish/100 m/24 h in Notigi Lake to 59 fish in Wuskwatim Lake. The scattergram plots show that the total CPUE in most of the lakes are similar over all three periods since CRD (Rat, Notigi, Wapisu, Opegano, Apussigamasi lakes). Three lakes in the vicinity of Nelson House showed a decreasing trend; Wuskwatim Lake in the second period; and Threepoint and Footprint lakes in the most recent period.
Currently, annual mean CPUE values on lakes located on the main flow of the Rat/Burntwood rivers are generally consistent, ranging from approximately 30 fish/100 m/24 h in Notigi, Threepoint, Opegano, and Rat lake to 40 fish in Apussigamasi Lake. The exception is Wuskwatim Lake where the annual CPUE was higher (about 60 fish/100 m/24 h) and is more similar to values observed in Footprint Lake which is on a tributary to Threepoint Lake (about 50 fish/100 m/24 h). The CPUE in a nearby off-system lake,

REGIONAL CUMULATIVE EFFECTS ASSESSMENT – PHASE II WATER – FISH COMMUNITY
DECEMBER 2015 5.3-144
Leftrook Lake, is currently 90 fish/100 m/24 h, approximately two to three times higher than in on-system lakes (Figure 5.3.7A-1). As with other lakes in the vicinity of Nelson House, the mean CPUE in Leftrook Lake has also shown a decrease between the early 2000s (115 fish/100 m/24 h) and recent period (90 fish/100 m/24 h).
While efforts were made to standardize the data sets among the surveys (refer to Appendix 5.3.1B for analysis methods), residual differences in methods among studies may have contributed to the observed differences in CPUE over time. For example, the inclusion of sampling sites that are not expected to produce high yields in order to sample a greater diversity of available habitat types can result in lower average CPUEs. As one can observe from Maps 5.3.7A-1 to 5.3.7A-9, there is a considerable discrepancy in the number and location of sites sampled by the different agencies in each of the lakes.
INDICATOR: DIVERSITY
Metric: Relative Abundance
Relative abundance was calculated as the percentage contribution of each species to the total catch in each of nine lakes along the diversion route (Figure 5.3.7A-2). Immediately post-diversion, Lake Whitefish and/or Cisco accounted for the majority of the catch in Rat, Notigi, Footprint, Wuskwatim, Birch Tree, and Apusigamassi lakes, while White Sucker and Walleye were particularly abundant in catches in Wapisu, Threepoint, and Apussigamasi lakes. In second period, Walleye and/or White Sucker accounted for the majority of the catch in all waterbodies sampled. There was a decrease in the relative abundance of Lake Whitefish and Cisco in Notigi, Threepoint, Footprint, Wuskwatim, and Birch Tree lakes. In the most recent period, White Sucker and Walleye continued to be well represented in catches in all lakes sampled, and the abundance of Sauger has increased in all lakes. Goldeye and Mooneye have not been captured in Threepoint or Footprint lakes since the early post-CRD period. Farther downstream, Mooneye account for 3% of recent catches in Apussigamasi Lake and Goldeye are periodically captured in Opegano Lake and Apussigamasi Lake (small mesh nets, CAMP 2014). Longnose Sucker and Sauger, which now account for 3 and 9% of the catch, respectively, first appeared in catches in Notigi Lake in 1999, as did Yellow Perch in Wapisu Lake, where they now account for 2% of the catch. Shorthead Redhorse has increased in proportion over time in Threepoint, Opegano, Birch Tree, and Apussigamasi lakes, where it now accounts for 1 to 13% of the catch, and has been observed periodically in Wapisu and Footprint lakes since 1999 and 2010, respectively.
Recent catches in standard gangs in a nearby off-system lake, Leftrook Lake, consist of fewer species (seven species) compared to on-system lakes (9–12 species). Longnose Sucker and Sauger have not been observed in Leftrook Lake. The fish community of Leftrook Lake is similar to that of on-system lakes in that it is dominated by White Sucker and Walleye (Figure 5.3.7A-3). The proportion of fish species in the catch was relatively constant between the 1999–2001 and 2009–2013 sampling periods (Figure 5.3.7A-2).
Riverine reaches of the diversion route were sampled with standard gang index gill nets as part of baseline studies for the Wuskwatim GP. Ten species of fish were observed in the mainstems of the Rat River downstream of Wapisu Lake and in the Burntwood River downstream of Taskinigup Falls in August/September of 2001, 2002, 2004, and 2007 (Volume 5, Manitoba Hydro and NCN 2003;
REGIONAL CUMULATIVE EFFECTS ASSESSMENT – PHASE II WATER – FISH COMMUNITY
DECEMBER 2015 5.3-145
Mota 2005a, 2009e). The species composition of the rivers is similar to that observed in the lakes with Walleye(≥ 30%) and, and to a lesser extent, White Sucker (> 15%) dominating the catch), with the remaining species including Burbot, Cisco, Lake Whitefish, Longnose Sucker, Shorthead Redhorse, Northern Pike, Sauger, and Yellow Perch.
Metric: Hill’s Index
A Hill’s diversity number was calculated from the combined catch at all sites sampled in a year for each of nine lakes along the diversion route (Figure 5.3.7A-4). Shortly post-diversion, the average index values ranged from 3.4 to 4.4 in Notigi, Rat, Footprint, and Wuskwatim lakes, and 5.5 to 7.0 in Wapisu, Threepoint, Birch Tree, and Apussigamasi lakes. Over time, the index values increased for lakes with lower values in the earlier period and decreased in Wapisu and Threepoint lakes. In contrast there has been little change in the index values for the most downstream lakes, Birch Tree and Apussigamasi lakes, over time. In the current period, the Hill’s Index is highest in lakes downstream of Early Morning Rapids (mean index values 6.6 to 7.2), lowest in Footprint, which is connected to Threepoint Lake by a tributary (4.7), and interim in lakes upstream of Early Morning Rapids (5.2 to 5.7). The index values indicate that the fish communities in the upper reaches are less diverse than those farther downstream.
The observed increase in the Hill’s value can be largely attributed to an increase in the number of species in lakes such as Notigi and a movement to more than one dominant species in the catch in lakes such as Rat and Footprint (i.e., increase in evenness). Conversely, in lakes like Threepoint and Wapisu the decrease in the index value resulted from a decrease in the number of species and an increase in the abundance of only a few species (i.e., decrease in evenness).
The mean Hill’s index of Leftrook Lake, the off-system lake monitored as part of CAMP, showed little variation over time, ranging from 4.7 (last post-CRD period) to 4.8 (recent post-CRD period), and was most similar to recent values in Footprint Lake. Both Leftrook and Footprint lakes do not receive through-flow from the Rat-Burntwood rivers.
DISCUSSION: FACTORS AFFECTING THE FISH COMMUNITY OVER TIME
Limited information is available on the fish community in lakes along the diversion route prior to CRD. The earliest survey in the area was a gillnetting study conducted from 1958–1960 over a 75 mile (120 km) stretch of the Burntwood River, including a site on Apussigamasi Lake. Twelve species of large-bodied fish were captured over the course of this study: Mooneye; Goldeye; Lake Whitefish; Cisco; Longnose Sucker; White Sucker; Shorthead Redhorse; Northern Pike; Yellow Perch; Walleye; Sauger; and Burbot (Sunde 1958, 19601). The most common species in catches from Apussigamasi Lake were Lake Whitefish and White Sucker, while Mooneye, Longnose Sucker, and Walleye dominated the catches in the Burntwood River between Birch Tree Lake and First Rapids.
1A copy of the 1959 interim report and final report cited by Sunde (1960) could not be located.
REGIONAL CUMULATIVE EFFECTS ASSESSMENT – PHASE II WATER – FISH COMMUNITY
DECEMBER 2015 5.3-146
During the early 1970s several diversion route lakes were sampled as part of baseline studies, including eight lakes on the Rat-Burntwood mainstems for the LWCNRSB (Ayles et al. 1974), and Mystery Lake for nickel mining operations (Hughes 1973). The most common commercial species present were Walleye, and, to a lesser extent, Lake Whitefish and Northern Pike. Goldeye and Mooneye were not observed in any of the lakes on the upper Rat/Burntwood rivers, but were observed in Mystery Lake. Longnose Sucker were only captured in Rat and Mystery lakes. Ayles et al. (1974) observed that the Mynarski lakes on Reading River were considerably more productive than lakes on the Rat-Burntwood mainstems. They attributed the high fish production in the Mynarski lakes to high nutrient input and low flows, characteristics that allow for high primary production.
The current fish community on diversion route lakes generally consists of 10 large-bodied species and is fairly typical of relatively shallow, turbid, northern waterbodies. The fish community in on-system lakes is more diverse than in Leftrook Lake, an off-system lake where the fish community consists of only seven species of large-bodied fish. Walleye and White Sucker dominate the catches in all of the lakes sampled. Total catch CPUE is currently within the range of 30 to 40 fish/100 m/24 h for many of the lakes along the diversion route (Rat, Notigi, Threepoint, Opegano, and Apussigamasi). Higher CPUEs occur in Wuskwatim Lake and Footprint Lake (50–60 fish/100 m/24 h) and the off-system Leftrook Lake (90 fish/100 m/24 h). The diversity index shows that the fish community of lakes downstream of Early Morning Rapids are more diverse (i.e., have a higher index value) than those located upstream of the rapids. The lowest diversity values occurred in Footprint and Leftrook lakes, which are located off the main flows. Over time there has been a decrease in the variability in the index scores among on-system lakes.
In terms of forage fish, rotenone poison trials conducted in 1960 at two sites along the Burntwood River downstream of Birch Tree Lake yielded Spottail Shiner and Troutperch, as well as larval Northern Pike and percids, and juvenile Burbot (Sunde 1960). More recently, forage fish surveys have been conducted as part of baseline line studies for the Wuskwatim GP using small mesh gill nets (Volume 5, Manitoba Hydro and NCN 2003; Mota 2005b, 2009e). The most frequently captured small-bodied species included Spottail Shiner, Emerald Shiner, Troutperch, Mottled Sculpin, and Slimy Sculpin. The juvenile forms of several of the large-bodied species are also common in the small mesh gill nets, including Walleye, Sauger, Cisco, Lake Whitefish, White Sucker, Shorthead Redhorse, Northern Pike, and Yellow Perch. There was a large variation in the site-specific CPUE in the lakes sampled, which Mota (2009e) attributed to the schooling behaviour of many of the forage and juvenile fish targeted by the gear. Several other forage species have been observed in other sampling programs or in the stomachs of predatory species including Ninespine Stickleback, Fathead Minnow, and Northern Pearl Dace (Volume 5, Manitoba Hydro and NCN 2003).
Changes in the fish communities along the diversion route may be due to many factors, including changes in habitat, redistribution of fish stocks, and emigration of fish due to hydroelectric development, natural variability, and or to other stressors such as commercial fishing. The potential effects of climate on fish communities is discussed in Area 2, where there is more information available (Section 5.3.4.3.1). Rainbow Smelt have not been observed in this reach.

REGIONAL CUMULATIVE EFFECTS ASSESSMENT – PHASE II WATER – FISH COMMUNITY
DECEMBER 2015 5.3-147
Factor: Effects of Changes to the Water Regime and Other Factors on Fish Habitat
The LWCNRSB predicted that an increase in the amount of wetted habitat would result in an increase in fish production in the Rat/Burntwood lakes, with an increase in species such as Northern Pike and White Sucker and a decrease in species such as Lake Whitefish and Cisco (Ayles et al. 1974). In a preliminary comparison of pre- and post-diversion CPUEs, Derksen et al. (1988) suggested there was a decrease in fish abundance in the waterbodies monitored by MEMP following CRD (i.e., Rat, Threepoint); however, based on the age structures of fish populations in the study lakes, the authors tentatively suggested that Lake Whitefish populations had been enhanced by CRD. In contrast, the Bilateral (Northern Flood Committee-Hydro) Management Panel (1989) concluded that CRD generally had a positive effect on fish abundance, and that the effects to fish species and composition were neutral based on their evaluation of available information and professional judgment. The authors attributed positive effects to the increased quantity of fish habitat in the enlarged lakes and reservoirs and the enhanced levels of aquatic production. With respect to augmented flow, the authors concluded that in most cases the incremental effects associated with the Augmented Flow Program in the context of CRD were not significant. However, they noted that the potential for increased drawdown over the winter, which could cause exposure and winterkill of whitefish eggs, was identified as a potentially significant effect, particularly upstream of the Notigi CS. As an example, the authors remarked that whitefish eggs placed in the littoral zone of Notigi Lake in October from 1985 to 1988 would have been subject to greater risk of being exposed to freezing or drying resulting from the greater water level drawdown under the Augmented Flow Program.
Increased flows in the Rat/Burntwood rivers and associated lakes resulting from CRD altered fish habitat and fish community structure. Comparison of the metrics over the three periods suggests that there have been changes to fish communities in response to habitat changes under CRD.
Ayles et al. (1974) predicted that species that were not common or not present in the diversion route lakes but were present in SIL would become introduced and established in the lakes after diversion. While changes in the relative abundance of many species in the diversion route lakes has occurred over time, there are still several differences between the fish communities of SIL and the diversion route lakes. The proportion of Walleye and White Sucker was historically, and continues to be, higher than in most areas of SIL, and the proportion of Lake Whitefish, Longnose Sucker, and Burbot remains lower than in SIL.
Changes in the species composition in on-system lakes is expected to have occurred in response to habitat changes associated with increased flows and increased water levels, particularly in the lakes upstream of the Notigi CS where considerable flooding occurred as a result of impoundment (Water Regime, Section 4.3.3.4.3). The proportion of Lake Whitefish and Cisco declined considerably after the 1980s. However, it is not known whether differences in habitat types sampled by the province as part of MEMP compared to more recent programs by other agencies are a factor in observed differences. Walleye and White Sucker have become the dominant species in all of the diversion route lakes sampled. In many of the lakes, the proportion of Sauger and Longnose Sucker have increased, particularly above the Notigi CS where they had previously been rare. Neither species have been captured in Leftrook Lake. It also appears that Shorthead Redhorse have increased their range to include the reach between Kepuche Falls up to the Notigi CS, where they were previously not recorded. Goldeye and Mooneye are

REGIONAL CUMULATIVE EFFECTS ASSESSMENT – PHASE II WATER – FISH COMMUNITY
DECEMBER 2015 5.3-148
currently only observed in very small numbers in the most downstream lakes, Opegano and Apussigamasi. MacLaren Plansearch Inc. (1989) presented sonar data from Notigi and Rat lakes in 1987 and showed that fish were using the aquatic habitat created by diversion, in particular Northern Pike were using habitat created by the large expansion of the littoral zone and Lake Whitefish were using the pelagic open basin habitat.
The variation in the Hill’s Index has decreased among lakes indicating that the fish communities have become more similar. Despite changes in the fish assemblage, the capture rate of fish, as evidenced by CPUE values, has remained relatively consistent in many of the diversion route lakes over time, except in the lakes surrounding Nelson House (Wuskwatim, Threepoint, and Footprint lakes), where there has been a decrease in the capture rate of fish.
The presence of juveniles in small mesh nets (Volume 5, Manitoba Hydro and NCN 2003; Mota 2005b, 2009e) indicates that successful spawning has occurred in the system since CRD. Mota (2003b) noted that the backwater inlets created by the flowing of the Burntwood River under diversion are productive in terms of forage fish.
The effects of the Manasan Falls CS, which resulted in an impoundment upstream of the structure up to and including Birch Tree Lake, are not known since there is no information on the fish community in the Burntwood River near the structure either before or after its construction.
Linkages to CRD are discussed in more detail for the species of interest in Sections 5.3.7.3.2 and 5.3.7.3.3.
Factor: Effects of Changes to Sedimentation and Water Quality
As described in Section 4.4.2 (Erosion and Sedimentation), the erosion that occurred along the diversion route was predominantly associated with peatland disintegration in low-gradient shore areas that were partially flooded by impoundment of the Notigi reservoir or diversion of the Churchill River. The rates of bank recession and sediment generation have been highly variable along the Rat/Burntwood system, with rates varying depending on the type of substrate (e.g., organic material versus bedrock) and flow or energy in each area. Increased shoreline erosion has resulted in decreased water clarity in some waterbodies (see discussion in Water Quality, Sections 5.2.9 and 5.2.10).
Some lakes in the upper Rat River have experienced low concentrations of DO over the period of record. Dissolved oxygen decreased in some waterbodies, notably Notigi Lake, during the impoundment period and while the severity of DO depletion in Notigi Lake has decreased over time, periods of low DO continue to occur in this and other waterbodies in the upper Rat and Burntwood river systems.
Factor: Effects of Obstructions to Upstream Movements/Alterations to Downstream Movements
There is no published information on fish movements over the rapids at the Notigi CS site prior to CRD. The Notigi CS acts a barrier to fish movements on the Rat River; once fish pass downstream through the Notigi CS, they cannot return upstream as the facility does not provide fish passage. It is expected that there would have been a downstream movement of fish over the Notigi Rapids prior to hydroelectric development, particularly of drifting larvae and small-bodied species. However, the contribution of

REGIONAL CUMULATIVE EFFECTS ASSESSMENT – PHASE II WATER – FISH COMMUNITY
DECEMBER 2015 5.3-149
immigrants from upstream reaches into the downstream system prior to hydroelectric development is not known. While downstream movements of fish would have been altered by the presence of the control structure and altered habitat conditions in the immediate forebay, such movements continue to occur. Tagging studies have also shown that Lake Whitefish and Walleye are capable of moving downstream through the Notigi CS and survive (Jansen et al. 2005; Volume 5, Manitoba Hydro and NCN 2003). Fish that survive passage would contribute to the stocks in the lower diversion route, as the CS blocks upstream movements, preventing return to the upper lakes.
Factor: Effects of Construction of the Wuskwatim Generation Project
Construction of the Wuskwatim GP on the Burntwood River at Taskinigup Falls occurred between 2006 and 2012. The predicted effects of the Wuskwatim GP and its infrastructure are described in the Environmental Impact Statement (EIS) for the project (Volume 5, Manitoba Hydro and NCN 2003). In brief, the project was predicted to have a local effect on fish during the construction period through the loss of aquatic habitat from instream works and at stream crossings, blasting, and harvest pressure from the workforce. Operation of the project over the long-term was predicted to benefit fish in Wuskwatim Lake by increasing production of forage by stabilizing water levels and increasing the amount of permanently wetted habitat, but have detrimental effects on spawning habitat through increased erosion and sedimentation. The project was predicted to have a negative effect on fish downstream of the GS resulting from a reduction in the quality of fish habitat and forage production due to increased water level fluctuations and a decrease in the number of migrants from upstream reaches. As part of the project’s federal and provincial licensing requirements, environmental monitoring programs are being conducted during the construction and operation of the Wuskwatim GP as outlined in the project’s Aquatic Effects Monitoring Program (NSC 2006). Data from operation monitoring are not yet available.
Fish passage was monitored for three years (2007–2009; Manitoba Hydro 2008; Hudd 2009; NSC 2010b) after construction of the nine stream crossings along the Mile 17 Access Road, which was constructed as part of the infrastructure for the Wuskwatim GP in 2006. Evidence for successful passage of White Sucker, Northern Pike, and Burbot through the culverts during the spring freshet was observed at R5 and R6 (both are headwater tributaries of Birch Tree Lake). Few or no large-bodied species were captured at other crossings, likely due to a combination of low flows or the presence of downstream barriers. Few impediments to fish passage were observed at any of the crossings. Culverts at sites R1 (a tributary of the Odei River) and R9 (a tributary of the Burntwood River between Taskinigup Falls and Opegano Lake) became perched at low flows that typically occurred later in the summer, and could have impeded fish passage had any fish been in the vicinity of the crossings. Large numbers of minnows and stickleback were observed near crossing R2 (another headwater tributary of Birch Tree Lake) during September 2010 when water backed up on the downstream side due to a beaver dam.
In compliance with Section 32 of the Fisheries Act, live fish were removed from isolated pools upstream of the Stage I and II cofferdams prior to dewatering in August/September 2008 and October 2010 and released downstream in the Burntwood River (Mota 2009b, 2010b). Fourteen species were salvaged from the pools, many of which were juvenile forms of large-bodied species that were thought to have drifted from upstream.
REGIONAL CUMULATIVE EFFECTS ASSESSMENT – PHASE II WATER – FISH COMMUNITY
DECEMBER 2015 5.3-150
To examine for sublethal effects of potential increases in TSS during the major instream work, large-bodied fish (primarily Walleye, and a few Cisco and Lake Whitefish) were sampled from the Burntwood River in August 2008 shortly after the Stage I cofferdams were closed and examined for signs of physical stress using a modified Fish Health Assessment Index (Mota 2009a). All of the fish appeared healthy both externally and internally (Mota 2009a).
Several enhancement works have been undertaken starting in 2010 to compensate for fish habitat lost as a result of the project. Enhancement works include constructing spawning reefs, constructing boulder gardens, removing woody debris from stream mouths, armouring a peninsula, and planting aquatic vegetation on Wuskwatim, Threepoint, and Wapisu lakes (Manitoba Hydro 2013). Enhancement works were conducted on Threepoint and Wapisu lakes to improve habitat diversity in the lower reaches of small streams and associated embayments where the littoral zone and riparian areas were adversely affected by CRD. Monitoring has shown that a diverse fish assemblage is using boulder gardens constructed to diversify aquatic habitat in the nearshore zone of Wuskwatim Lake and in the immediate forebay. In particular, the habitat is being used by juveniles of several large-bodied species (e.g., Cisco, Lake Whitefish, Northern Pike, Sauger, White Sucker, Longnose Sucker, and Walleye) as well as several species of forage fish, and sucker and percid species appear to be spawning at or near the site in the lake (Mota and Barth 2014; Mota and Remnant 2015). The removal of rafted debris was identified as a key factor in increasing fish use of tributaries at Wapisu, Threepoint, and Wuskwatim lakes. No large-bodied fish were observed at these sites prior to enhancement and it was thought this was because large rafted debris piles at the mouth were preventing access (Mota 2009d, 2010a). Additional works at these sites included the addition of aquatic vegetation to the embayment areas and the armouring of a peninsula on Wuskwatim Lake to protect the existing sheltered embayment at the tributary mouth from wave action. Spawning White Sucker have since been captured in the upper reaches of the tributary to Wapisu Lake. High water prevented sampling to confirm the use of the other tributaries, but several species of large-bodied fish in spawning condition have been observed in the embayment areas.
Factor: Effects of Fisheries
Domestic, commercial, and recreational fisheries occurred historically and still occur throughout this reach. Quantitative information is only available for the commercial fishery. A detailed description of the fishery is provided in People, Section 3.5.9 and information relevant to changes in the fish community is summarized below.
Domestic fishing has been a historically important resource for Nelson House (Usher and Weinstein 1991). Prior to hydroelectric development, the majority of the domestic harvest came from Footprint, Wapisu, Leftrook, and Wuskwatim lakes. Domestic fishing effort has shifted to Leftrook Lake in response to concerns about mercury levels following CRD (NCN Trust 2015).
Commercial fishing has occurred in this reach since at least 1945, when a winter fishery operated on Notigi Lake (MDMNR 1949). Prior to CRD, small-scale, intermittent commercial fisheries operated on Rat, Notigi, East and West Mynarski, Wapisu, Osik, Macheewin, and Wuskwatim lakes (Weagle 1974; MacLaren Plansearch Inc. and Beak Consultants Ltd. 1988). The combined average production (Lake Whitefish, Northern Pike, Walleye) from on-system lakes (West Mynarski, Notigi, Rat, Wapisu, and Wuskwatim lakes) pre-CRD is estimated at 41,000 kg/y (Figure 5.3.7A-5). On-system lakes that have

REGIONAL CUMULATIVE EFFECTS ASSESSMENT – PHASE II WATER – FISH COMMUNITY
DECEMBER 2015 5.3-151
been fished intermittently post-CRD include Karsakuwigamak, Notigi, Rat, West Mynarski, Threepoint, Wapisu, and Wuskwatim. Mercury sampling of the commercial catches in fish captured from the diversion route lakes in 1977/1978 led to periodic restrictions on Northern Pike and Walleye (reviewed in People, Section 3.5.9). Commercial fishing efforts from Rat Lake (the largest of the operations prior to CRD) were redirected toward the Mynarski lakes in response to the closure of Rat Lake due to mercury contamination (MacLaren Plansearch Inc.1989). During the initial two decades post-CRD (1976–1995), the combined annual production from on-system lakes increased from pre-CRD levels to approximately 58,000 kg due primarily to increased effort in West Mynarski (Figure 5.3.7A-5). From 1996–2014, the combined production decreased to about 30,000 kg/y (Figure 5.3.7A-5).
It is not possible with existing information to assess the potential effect of the commercial or domestic fisheries on fish populations in the diversion route lakes; however, the commercial fishery has not experienced a decline indicative of severely depleted fish stocks.
5.3.7.3.2 Lake Whitefish
INDICATOR: ABUNDANCE
Metric: Catch-Per-Unit-Effort
A comparison of standardized CPUE values for Lake Whitefish (see Appendix 5.3.1B for analysis methods) from standard gang index gill nets set over the course of three time periods (early, mid, and recent post-CRD) in each of nine lakes along the diversion route generally shows a decreasing trend (Figure 5.3.7A-6). Shortly after diversion (1983–1989), the mean CPUE of Lake Whitefish varied from about 4 to 8 fish/100 m/24 h in Wapisu, Birch Tree, and Apussigamasi lakes, 11 to 19 fish/100 m/24 h in Threepoint, Notigi Lake, and Rat lakes, to 30 fish/100 m/24 h in Footprint Lake. In the mid post-CRD period (1998–2001), the CPUE was low in all lakes sampled, with mean CPUE ranging from 1 to 2 fish/100 m/24 h in Notigi, Footprint, and Wapisu lakes, and 4 fish/100 m/24 h in Threepoint, Wuskwatim, Opegano, and Birch Tree lakes. More recently (post-2008), the mean CPUE ranges from lows of less than 0.5 fish/100 m/24 h in Footprint and Rat lakes, 1 to 3 fish/100 m/24 h in Notigi, Threepoint, Opegano, and Apussigamasi lakes, to 7 fish/100 m/24 h in Wuskwatim Lake. Catches in Threepoint Lake were unusually high in 2011 (8 fish/100 m/24 h) compared to other years (< 1.5).
Currently, annual mean CPUE values are lower in lakes upstream of Early Morning Rapids (range of 0.1 to 2 fish/100 m/24 h) compared to downstream lakes (range of 2 to 7 fish/100 m/24 h). The values in all on-system lakes are considerably lower than in Leftrook Lake, an off-system waterbody located on a tributary to Threepoint Lake, where CPUE ranges from 7 to 18 fish/100 m/24 h (mean of 12 fish/100 m/24 h). The CPUE in Leftrook Lake has been constant over period 2 and 3; however, there were no data from early post-CRD period.
The discussion section that follows looks at the contribution of several potential factors to the observed changes in Lake Whitefish CPUE over time in concert with the results of the other indicators.

REGIONAL CUMULATIVE EFFECTS ASSESSMENT – PHASE II WATER – FISH COMMUNITY
DECEMBER 2015 5.3-152
INDICATOR: CONDITION
Metric: Fulton’s Condition Factor (KF)
Sunde stated that many of the fish captured in 1958 and 1960 in the Burntwood River downstream of Birch Tree Lake (including Apussigamasi Lake) were large and “in excellent condition” (Sunde 1958, 1960). Lake Whitefish captured1 had a mean length of 434 mm and a mean weight of 1,393 to 1,418 g. The average condition factor for Lake Whitefish from lakes on the Rat/Burntwood river in 1973 ranged from 1.39 in East Mynarski to 2.19 in Notigi Lake (Ayles et al. 1974). However, these values are not directly comparable to those calculated from the standard gang programs described below because of differences in gillnetting methods.
Condition of Lake Whitefish in lakes upstream of the Notigi CS (i.e., Rat and Notigi lakes) have increased from the early-post-diversion (mean 1.47 and 1.58, respectively) to the most recent period (mean 1.74 and 1.85, respectively), while the mean condition of Lake Whitefish from downstream lakes has shown less variability over time (Figure 5.3.7A-7).
Currently, the mean condition factor of Lake Whitefish captured in standard gang index gill nets is highest in lakes above the Notigi CS (1.85 in Rat Lake and 1.74 in Notigi Lake), moderate in the most downstream lake (1.67 in Apussigamasi Lake), and lowest in lakes between the Notigi CS and Early Morning Rapids (range 1.40 to 1.53) (Figure 5.3.7A-7). Condition factors measured from fish captured in a nearby off-system lake were similar to others below Notigi Lake, averaging 1.52. The range of annual mean values measured in the current period in Leftrook Lake overlaps with values measured in the previous period, but the mean is lower (mean 1.59).
The discussion section that follows looks at potential factors to the observed changes in Lake Whitefish condition over time in concert with the results of the other indicators such as growth.
INDICATOR: GROWTH
Metric: von Bertalanffy Model
Prior to diversion, Ayles et al. (1974) reported that Lake Whitefish from diversion route lakes displayed similar growth rates, with the exception of the Mynarski lakes. Whitefish from Mynarski Lake were reported to mature at a more rapid rate, followed by a slower growth rate. The authors noted that the mean age of Lake Whitefish from diversion route lakes was considerably higher than those from SIL.
A plot of von Bertalanffy growth curves shows that growth patterns have changed over the three sampling periods (Figures 5.3.7A-8 and 5.3.7A-9). It appears that Lake Whitefish sampled from Rat and Birch Tree lakes during the early pre-CRD period (1983–1989) took longer time to reach the theoretical maximal
1 These values include fish captured between First Rapids and Split Lake, which is not included in Area 3.

REGIONAL CUMULATIVE EFFECTS ASSESSMENT – PHASE II WATER – FISH COMMUNITY
DECEMBER 2015 5.3-153
length (i.e., had lower k values) compared to the other lakes and obtained a larger L∞, while those from Notigi Lake obtained a much smaller L∞ at a much faster rate (i.e., had higher k value) (Table 5.3.7A-1). The von Bertalanffy growth curves are more similar among waterbodies in the two subsequent sampling periods (1998–2002; 2007–2013). Lake Whitefish from Notigi Lake showed a considerable increase in growth between the early post-CRD and later periods compared to other lakes (Figure 5.3.7A-8). It is expected that if sufficient fish had been captured from Rat Lake for comparison to historical data, a similar pattern would be observed.
The von Bertalanffy curve from a nearby off-system lake (Leftrook Lake) obtained a similar maximum size and took about the same time to approach this L∞ as fish from the on-system lakes (Figure 5.3.7A-8).
The discussion section that follows looks at potential factors to the observed changes in Lake Whitefish size at age over time in concert with the results of the other indicators.
Metric: Relative Year Class Strength
The relative year class strength of Lake Whitefish for two lakes along the diversion route where consecutive years of sampling occurred is shown in Figure 5.3.7A-10. The historical year class index determined from 1983–1989 indicated that there were weak years classes (< 50) in both Rat and Threepoint lakes in 1974 and 1975, followed by 4–5 consecutive years of strong year classes (> 100). Particularly strong cohorts occurred in 1977 in Rat Lake (260) and in 1981 in Threepoint Lake (211). The weakest cohort occurred in 1975 and that strong year classes occurred in 1977 and 1978 (> 100).
An examination of the more recent data for Threepoint Lake indicates a series of weak or missing year classes from 1996 to 1998. Strong cohorts (> 150) occurred in 1995, 1999, and 2005. Rat Lake was not sampled in consecutive years in the most recent period so RYCS analysis is not possible. Lake Whitefish cohorts in Leftrook Lake showed less variation than in Threepoint Lake, with only one year class having an index value of less than 50 (2004). Particularly strong year classes occurred in 1993 and 1994, which were followed by four consecutive years of weaker year classes.
The discussion section that follows looks at potential factors to the observed changes in Lake Whitefish recruitment over time in concert with the results of the other indicators.
DISCUSSION: FACTORS AFFECTING LAKE WHITEFISH OVER TIME
Prior to CRD, Lake Whitefish was a common component in gillnetting surveys of the lower Burntwood River, including Apussigamasi Lake from 1958–1960 (Sunde 1958, 1960). In 1973, the Mynarski lakes (on the Reading River) and Issett Lake were more productive in terms of Lake Whitefish (32.6 to 91.3 pounds [14.8 to 41.4 kg]) compared to several other lakes on the diversion route (3.6 to 17.0 pounds [1.6 to 7.7 kg]) (from Table 2.2 in Ayles et al. 1974). Lake Whitefish from the diversion route lakes had a similar rate of growth, with the exception of West Mynarski Lake, where Lake Whitefish had an early, rapid growth rate and attained a longer length at age (Ayles et al. 1974). Lake Whitefish were only captured incidentally in Mystery Lake prior to diversion, but the few fish captured had an average length of 363 mm and weight of 824 g (Hughes 1973).
REGIONAL CUMULATIVE EFFECTS ASSESSMENT – PHASE II WATER – FISH COMMUNITY
DECEMBER 2015 5.3-154
Current monitoring programs show that Lake Whitefish are captured in gill nets in all of the diversion route lakes, but typically account for a greater proportion of the catch in lakes downstream of Early Morning Rapids (6 to 12% of the catch) compared to upstream (<1 to 4%). The same pattern is observed in the river mainstem; the proportion of Lake Whitefish was higher in the Burntwood River (8%) compared to the Rat River (2%) (Mota 2005a). Catch-per-unit-effort for the species is highest in Wuskwatim Lake (7 fish/100 m/24 h) and lowest in Rat and Footprint lakes (<0.5 fish/100 m/24 h). Habitat preferences for the species include offshore habitat in Wuskwatim Lake and flooded terrestrial habitat in Opegano Lake (Volume 5, Manitoba Hydro and NCN 2003). Catch-per-unit-effort values on diversion route lakes are considerably lower than observed in a nearby off-system lake; CPUE in Leftrook Lake averaged 12 fish/100 m/24 h.
Changes to Lake Whitefish stocks along the diversion route may be due to many factors, including changes resulting from hydroelectric development to spawning habitat, spawning success, forage production, seasonal migration patterns, to natural variation, as well as to other stressors such as commercial fishing. The potential effects of climate on fish communities is discussed in Area 2, where there is more information available (Section 5.3.4.3.1). Rainbow Smelt have not been observed in this reach. The following sections provide discussion of the effects of the major stressors on Lake Whitefish stocks in the area.
Factor: Effects of Changes to the Water Regime and Other Factors on Fish Habitat
The diversion of the Churchill River into the Rat-Burntwood system and the impoundment at the Notigi CS resulted in considerable alteration of the Lake Whitefish stocks and their habitat. The LWCNRSB predicted that there would be a reduction in Lake Whitefish along the diversion route in response to diversion (Ayles et al. 1974). The authors cited that the main effects of diversion would be limited spawning habitat and a decrease in primary productivity until shorelines stabilized, but that new spawning habitat would become established and growth rates and condition would increase in response to increased benthic invertebrate, primarily amphipod, production (Ayles et al. 1974).
Comparison of the metrics over the three periods suggests that there have been changes to Lake Whitefish stocks in response to habitat changes under CRD. CRD resulted in increased flows and increased water levels along the diversion route, as well as a reversal of seasonal flow patterns downstream of the Notigi GS and a backwater effect up the Footprint River to Osik Lake (water levels are now typically higher during winter) (Water Regime, Section 4.3.3). There has been a considerable decrease in the CPUE of Lake Whitefish since the provincial studies in the 1980s in all of the lakes sampled. The decrease is particularly pronounced in Rat and Footprint lakes; Lake Whitefish are virtually absent from catches (mean < 0.5 fish/100 m/24 h) when historically they were the highest observed in the system (annual mean ranging from 13 to 30 fish/100 m/24 h). Shortly after CRD, many of the lakes had CPUE values in the range currently observed in Leftrook Lake and higher (mean in Footprint Lake was 30 fish/100 m/24 h in the 1980s). However, no sampling occurred in Leftrook Lake prior to CRD so it is unclear whether the CPUE has changed in the lake over time. To some extent, differences in the habitat types sampled by the agencies in early and more recent studies may have contributed to the observed decrease in the capture rate of Lake Whitefish as the provincial studies likely focused on sites that would produce fish to meet their minimum targets for biometric analysis.

REGIONAL CUMULATIVE EFFECTS ASSESSMENT – PHASE II WATER – FISH COMMUNITY
DECEMBER 2015 5.3-155
Unusually higher catches of Lake Whitefish were recorded in Threepoint Lake in 2011 (8 fish/100 m/24 h). This sampling year coincided with a record flood on the Nelson River (Water Regime, Section 4.3). Because outflows at the Notigi CS are reduced to avoid aggravating flood conditions on the Nelson River, water levels on lakes in the hydraulic zone downstream of the Notigi CS during the 2011 flood were similarly low as observed during the 2003 drought, reaching post-CRD record low levels during part of the open water season (based on information presented in Water Regime, Section 4.3.3.5). A contributing factor to the observed increase in CPUE may be an increase in the capture efficiency of gill nets under lower flow conditions.
The LWCNRSB reported that Lake Whitefish productivity would be dependent on the availability of spawning habitat after diversion (Ayles et al. 1974). The Bilateral (NFC-Hydro) Management Panel (1989) concluded that the potential for increased drawdown over the winter under Augmented Flow could cause exposure and winterkill of whitefish eggs, particularly upstream of the Notigi CS. As an example, the authors remarked that whitefish eggs placed in the littoral zone of Notigi Lake in October from 1985 to 1988 would have been subject to greater risk of being exposed to freezing or drying resulting from the greater water level drawdown under the Augmented Flow Program. Aboriginal traditional knowledge collected as part of the Wuskwatim GP EIS (Volume 5, Manitoba Hydro and NCN 2003) indicated that Lake Whitefish had spawned immediately downstream of Early Morning Rapids prior to CRD, but no evidence was found of whitefish using it in the recent period.
Spawning of Lake Whitefish has been documented in several areas along the diversion route as part of environmental studies conducted as part of environmental studies for the Wuskwatim GP, indicating that whitefish have found suitable spawning habitat after CRD. Fish larvae were sampled with neuston sampler from Notigi, Wapisu, Threepoint, Footprint, Wuskwatim (and adjacent waterbodies), and Opegano lakes after ice-off from 1999–2001 and again in 2004 and 2007 (Jansen et al. 2005; Mota 2005c, 2009c). The distribution of the larvae and the movement of acoustic tagged Lake Whitefish suggest that the species spawns at several locations in these lakes (Jansen et al. 2005). Larvae have been captured in low numbers on areas of main flow on Notigi Lake (see Figure 9 in Jansen et al. 2005), in large numbers in the central portions of Wapisu and Footprint lakes (see Figures 15 and 20 in Jansen et al. 2005), and in very high numbers in the Threepoint Lake in the vicinity of the outflow of the Burntwood River. Small numbers of larvae captured in Kinosaskaw Lake were likely transported out of Threepoint Lake in Burntwood River flow. In Wuskwatim Lake, larvae were captured at numerous inshore areas and fish in spawning condition have been observed around the periphery of Wuskwatim Lake, particularly along the western shore. Larval Lake Whitefish captured in Opegano Lake are likely the result of the fish drifting down the Burntwood River from upstream spawning areas. Telemetry studies showed that whitefish spawned at several locations in diversion route lakes and that suitable spawning habitat was widely distributed (Jansen et al. 2005).
The year class strength index indicated that particularly poor cohorts were produced in Threepoint Lake in 1974 and 1975, which coincided with a flow stoppage during the construction of CRD and resulted in a decrease in the average flows in the Burntwood River by about 30% (Water Regime, Section 4.3.3.1). In a preliminary comparison of pre- and post-diversion CPUEs for MEMP, Derksen et al. (1988) suggested that Lake Whitefish populations had been enhanced by CRD and observed that strong cohorts of whitefish originated in Rat and Threepoint lakes during the initial years of the diversion of the Churchill
REGIONAL CUMULATIVE EFFECTS ASSESSMENT – PHASE II WATER – FISH COMMUNITY
DECEMBER 2015 5.3-156
River. The RYCS analysis showed that strong year classes (> 100) were produced in these lakes from 1977 to 1979 but the strength of cohorts produced showed a decreasing trend from 1982 to 1984. More recently, year class strength in Threepoint Lake has been more variable, with exceptionally high index values (> 200) occurring in 1995, 1999, and 2005 and particularly weak (< 20) or missing year classes occurring from 1996 to 1999 and again in 2000. The strength of year classes in a nearby off-system lake, Leftrook Lake, has shown similar variations. It is not known whether year class strength have improved in Rat Lake.
Whitefish stocks in Notigi and Rat lakes have shown a notable increase in condition, as well as an increase in the size attained by the largest fish in Notigi Lake as predicted by the von Bertalanffy growth model. The LWCNRSB predicted that the diversion of nutrient rich water from the Churchill River into the on-system diversion route lakes would result in an increase in the availability of benthic invertebrates, particularly amphipods, which would subsequently result in an increase in the growth and condition of Lake Whitefish (Ayles et al. 1974). Prior to diversion, the predominant food source for Lake Whitefish in many of the diversion route lakes was fingernail clams, which reflected the greater abundance of fingernail clams (as opposed to amphipods) in the environment (Hamilton and McRae 1974 in Ayles et al. 1974). A few exceptions were noted: ostracods were the dominant food source in Wapisu Lake; gastropods in Karsakuwigamak Lake; and chironomids in Issett and East Mynarski lakes. More recently, environmental studies for the Wuskwatim GP (1999–2002) showed that fingernail clams continued to be an important constituent of the whitefish diet in all lakes sampled, along with snails in Threepoint, Opegano, and Birch Tree lakes (Fazakas et al. 1999; Mota 2001; Volume 5, Manitoba Hydro and NCN 2003; Mota and Heuring 2001; Caskey and Mota 2003b, c, d), as well a nearby off-system lake (Leftrook Lake; Fazakas 2000c; MacDonald 2003), amphipods in Notigi and Wuskwatim lakes (Volume 5, Manitoba Hydro and NCN 2003; Mota and Fazakas 2000), and chironomids in Footprint Lake (Fazakas 2000b; Holm and Mota 2003b).
Construction of the diversion channel between SIL and the Rat River and the Notigi CS as part of the CRD project has the potential to alter Lake Whitefish movement patterns. The diversion channels allows for movement of Lake Whitefish between SIL and the Rat-Burntwood systems, which prior to CRD were separate stocks. Tagging studies conducted by SIL Commercial Fisherman’s Association have shown that these movements are occurring with the recapture of a Lake Whitefish tagged in SIL downstream of South Bay in Issett Lake (NSC 2014).
Factor: Effects of Changes to Sedimentation and Water Quality
Refer to earlier discussion for fish community (Section 5.3.7.3.1).
Factor: Effects of Obstructions to Upstream Movements/Alterations to Downstream Movements
Refer to earlier discussion for fish community (Section 5.3.7.3.1).
Factor: Effects of Construction of the Wuskwatim Generation Project
Prior to construction of the Wuskwatim GP, Lake Whitefish were not a major component of index gillnetting catches in Wuskwatim Lake and adjacent waterbodies, or in Opegano Lake (Volume 5, Manitoba Hydro and NCN 2003). Lake Whitefish were observed to move downstream through

REGIONAL CUMULATIVE EFFECTS ASSESSMENT – PHASE II WATER – FISH COMMUNITY
DECEMBER 2015 5.3-157
Wuskwatim Falls and Taskinigup Falls into the Burntwood River. No Lake Whitefish were captured at any of the stream crossings for the 17 Mile access road.
The Wuskwatim GP is predicted to result in a decrease in Lake Whitefish spawning habitat for the first five years due to sedimentation, but over the long-term whitefish stocks in Wuskwatim Lake would benefit from an increase in the quantity of spawning and feeding habitat and a decrease in loss of migrants due to the stabilization of water level at upper range. However stocks downstream of the GS would have a reduction in the quantity and quality of spawning and feeding habitat due to increased frequency of water level fluctuations and reduced immigrants (including larvae) from upstream reaches due to reduced water velocities at the inlet and turbine mortalities.
In compliance with Section 32 of the Fisheries Act, live fish, including 112 Lake Whitefish, were removed from isolated pools upstream of the Stage I and II cofferdams prior to dewatering in August/September 2008 and October 2010 and released downstream in the Burntwood River (Mota 2009b, 2010b). Most of the Lake Whitefish salvaged from the cofferdams were in the size range considered to be YOY.
Several enhancement works have been undertaken starting in 2010 to compensate for fish habitat lost as a result of the project. Boulder garden sites on Wuskwatim Lake and in the immediate forebay are being used by juvenile Lake Whitefish (Mota and Barth 2014; Mota and Remnant 2015). To date, monitoring has not found evidence of whitefish spawning at these sites.
Factor: Effects of Fisheries
Fisheries on the diversion route lakes were previously described with respect to the fish community. Harvest rates of Lake Whitefish for domestic consumption are not known. It is believed that Lake Whitefish accounted for the majority of the approximately 41,000 kg in on-system lakes and 50,000 kg in off-system lakes harvested annually by commercial fisheries prior to CRD. Since 1977, increased mercury levels after diversion resulted in intermittent closures to Lake Whitefish in several lakes including Wapisu, Notigi, Rat, Mynarski, Threepoint, and Wuskwatim (reviewed in People, Section 3.5.9). During the first two decades post-CRD (1976–1995), production in on-system lakes increased relative to pre-CRD levels (58,000 kg/y), with Lake Whitefish accounting for more than 70% of the catch (Figure 5.3.7A-5). Since 1996, commercial production has decreased (30,000 kg/y), with Lake Whitefish accounting for a lower proportion of the catch (35%) (Figure 5.3.7A-5). High costs of the fisheries combined with the higher market price of Walleye have contributed to this shift. Given that the commercial fishery for Lake Whitefish in diversion route lakes has been limited and intermittent, and a decline in Lake Whitefish was observed on Rat Lake, where commercial efforts for the species have declined considerably over the past two decades, the commercial fishery is likely not the major contributor to changes in Lake Whitefish abundance.

REGIONAL CUMULATIVE EFFECTS ASSESSMENT – PHASE II WATER – FISH COMMUNITY
DECEMBER 2015 5.3-158
5.3.7.3.3 Walleye
INDICATOR: ABUNDANCE
Metric: Catch-Per-Unit-Effort
There were fluctuations in the annual standardized Walleye CPUE values (see Appendix 5.3.1B for analysis methods) from standard gang index gill nets set over the course of three time periods (early post-, mid post-, and recent post-CRD) in each of nine lakes along the diversion route (Figure 5.3.7A-11). Shortly after diversion, the mean CPUE was highest in Rat and Threepoint lakes (11 and 15 fish/100 m/24 h, respectively), moderate in Footprint, Wapisu, and Wuskwatim lakes (8 to 9 fish/100 m/24 h), and lowest in the Birch Tree and Apussigamasi lakes (2 and 5 fish/100 m/24 h). Several lakes showed an increase in the rate of capture of Walleye during the post-CRD period (Footprint, Wapisu, Birch Tree), while CPUE in other lakes generally remained within the range of the previous period (Notigi, Threepoint, Wuskwatim). The increase was most pronounced in Footprint Lake, where the mean value was 43.4 fish/100 m/24 h. In the most recent sampling period, the mean CPUE for many of the lakes has remained within the range observed in previous sample periods (Rat, Wuskwatim, Opegano). Capture rates in Apussigamasi and Notigi lakes are higher than the upper range of previous sample periods. The most recent annual CPUEs on Footprint Lake are still considerably higher than observed in the first period but have decreased below the range observed in the mid post-CRD period. A consistent decreasing trend in the mean CPUE has occurred at Threepoint Lake over the three sampling periods.
As observed on Footprint Lake, there has been considerable variation in the annual mean CPUE in the nearby off-system lake, Leftrook Lake, over the mid and recent post-CRD periods (Figure 5.3.7A-11). While there is overlap in the range of annual values in both periods, the mean in the most recent period (26 fish/100 m/24 h) is lower than the previous period (39 fish/100 m/24 h). Because there are no data for Leftrook Lake in the early post-CRD period it is unclear whether increases in Walleye observed between the first and second periods occurred regionally or was limited to on-system lakes.
The discussion section that follows looks at the contribution of selected potential factors to the observed changes in Walleye abundance over time.
INDICATOR: CONDITION
Metric: Fulton’s Condition Factor (KF)
In a 1972 survey by the province, Hughes (1973) reported that Walleye from Mystery Lake varied in condition among age groups, averaging 1.15 from one to three years and 1.23 from four to seven years. The mean condition of Walleye captured in gill nets set in several diversion route lakes above Thompson in 1973 ranged from 0.91 in Wuskwatim Lake to 1.15 in West Mynarski Lake (Ayles et al. 1974). However, these values are not directly comparable to those calculated from the standard gang programs described below because of differences in methods.
REGIONAL CUMULATIVE EFFECTS ASSESSMENT – PHASE II WATER – FISH COMMUNITY
DECEMBER 2015 5.3-159
The mean condition factor of Walleye in the early post-CRD period was lowest in Footprint Lake (1.02), highest in Apussigamasi and Notigi lakes (1.16 and 1.23, respectively), and ranged from 1.10–1.11 in the other diversion route lakes (Figure 5.3.7A-12). In the second sampling period, average condition factors showed a decline, ranging from 1.02–1.10 in the lakes sampled. The mean condition factor of Walleye in the recent period is similar throughout the diversion route, with means ranging from 1.05–1.09. These values are similar to values observed in an off-system lake, where mean values were 1.07 in the mid period and 1.04 in the recent period.
INDICATOR: GROWTH
Metric: von Bertalanffy Model
A plot of the von Bertalanffy growth curves shows that there were a few differences among lakes sampled in the 1980s (Figure 5.3.7A-13). It appears that Walleye from Footprint and Wuskwatim lakes took longer time to reach the theoretical maximal length (i.e., had lower k values) compared to the other lakes, while fish from Notigi and Apussigamasi lakes obtained a larger L∞ (Table 5.3.7A-1). Walleye from Footprint Lake attained a smaller L∞ compared to the lakes on the main flow. There continues to be variation in the von Bertalanffy growth curves for Walleye stocks sampled by CAMP (Figure 5.3.7 A-13). The model predicts lower L∞ for Footprint and Threepoint lakes that are similar to the off-system Leftrook Lake (Table 5.3.7A-1). Compared to the other lakes, Walleye from Apussigamasi Lake take longer to reach the theoretical maximal size (i.e., lower k value).
There was considerable difference in the growth of Walleye in several of the lakes from the 1980s to 2010s (Figure 5.3.7A-14). Walleye from Rat, Notigi, and Apussigamasi lakes now have a more rapid rate of growth during the early years (i.e., k has increased), followed by a slower rate for mature fish compared to the early post-CRD period, and the maximal size attained in Notigi and Apussigamasi lakes has decreased. The difference in the curves between sampling periods reflects differences in the age/size structure of the catch. There were few larger, older Walleye captured in the recent period compared the 1980s. Walleye as old as 31 years and 642 mm were captured in the 1980s, compared to recently, when the oldest fish was 18 years and 545 mm.
Metric: Relative Year Class Strength
An index of the relative year class strength of Walleye for two lakes along the diversion route where consecutive years of sampling occurred is shown in Figure 5.3.7A-15. The historical year class index determined from 1983–1989 indicated that particularly weak year classes (< 50) occurred in Rat Lake in 1977 and 1978, and in Threepoint Lake in 1978. Strong cohorts (> 150) were observed in Threepoint Lake in 1976, and in both lakes in 1983.
The more recent data show a strong cohort occurred in Threepoint Lake in 1996 (~200) and weak year classes (< 50) occurred in 1999 and 2008. Rat Lake was not sampled in consecutive years in the most recent period so RYCS analysis is not possible. Walleye stocks in Leftrook Lake had more strong year classes (> 100; nine out of 14 years) than observed in Threepoint Lake (six out of 14 years). The year class index value was below 100 over a four year period starting in 2003.
REGIONAL CUMULATIVE EFFECTS ASSESSMENT – PHASE II WATER – FISH COMMUNITY
DECEMBER 2015 5.3-160
The discussion section that follows looks at potential factors to the observed changes in Walleye recruitment over time in concert with the results of the other indicators.
DISCUSSION: FACTORS AFFECTING WALLEYE OVER TIME
Walleye were a common component of catches in pre-hydroelectric development surveys in the areas, including the Burntwood River and Apussigamasi Lake (Sunde 1958, 1960), Mystery Lake (Hughes 1973), and 11 lakes in the reach between South Bay and Wuskwatim Falls (Ayles et al. 1974). The species continues to be a major component in gillnet catches in recent surveys in of diversion route lakes (> 20%), as well as in the Rat and Burntwood river mainstems (> 30%; Mota 2005a). Catch-per-unit-effort for the species is highest in Footprint Lake (20 fish/100 m/24 h) and lowest in Notigi Lake (5 fish/100 m/24 h). With the exception of Footprint Lake, the mean CPUE values on diversion route lakes were lower than observed in a nearby off-system lake, Leftrook Lake (26 fish/100 m/24 h). The mean CPUE on both Footprint and Leftrook Lake have decreased considerably since the late 1990s and early 2000s, when the mean CPUE was about 40 fish/100 m/24 h.
Changes in Walleye stocks along the diversion route may be due to many factors, including changes resulting from hydroelectric development to spawning habitat, spawning success, forage production, and/or seasonal migration patterns, to natural variation, as well as to other stressors such as commercial fishing. The potential effects of climate on fish communities is discussed in Area 2, where there is more information available (Section 5.3.4.3.1). Rainbow Smelt have not been observed in this reach. The following sections provide discussion of the effects of the major stressors on Walleye stocks in the area.
Factor: Effects of Changes to the Water Regime and Other Factors on Fish Habitat
The LWCNRSB predicted that Walleye stocks along the diversion route would be impacted, particularly in the short-term, by a loss of spawning habitat at streams known to be important for spawning such as the Reading River, which was to be entirely inundated, and Suwanee River, in which rapids and riffle habitat was inundated, but would benefit from more turbid condition and an increase in benthic production (Ayles et al. 1974). Weagle (1974) recommended that the Suwannee River area should be cleared as part of mitigative efforts in order to maintain Walleye populations.
Studies conducted as part of the Wuskwatim GP EIS indicate that Walleye are successfully spawning in the diversion route lakes. Surveys in the Wuskwatim GP study area found evidence that Walleye spawn at the base of the north channel of Taskinigup Falls, near the base of Little Jackpine Rapids, and just upstream of Opegano Lake, and that suitable spawning habitat was also identified in the lower Muskeseu River, lower velocity areas of the Burntwood River upstream of Cranberry lakes, and along the east shore of Wuskwatim Lake north of Wuskwatim Falls (Volume 5, Manitoba Hydro and NCN 2003). Traditional Knowledge provided as part of the Wuskwatim GP EIS identified Wuskwatim Brook as currently providing important spawning habitat for Walleye, but also that the species no longer uses sites downstream of Early Morning Rapids on the Burntwood River for spawning like they did prior to CRD (Volume 5, Manitoba Hydro and NCN 2003).
Walleye may have benefited from habitat changes resulting from changes to the water under CRD. CRD resulted in increased flows and increased water levels along the diversion route, as well as a reversal of

REGIONAL CUMULATIVE EFFECTS ASSESSMENT – PHASE II WATER – FISH COMMUNITY
DECEMBER 2015 5.3-161
seasonal flow patterns downstream of the Notigi GS and a backwater effect up the Footprint River to Osik Lake (water levels are now typically higher during winter; Water Regime, Section 4.3.3). Walleye capture rates in several of the lakes on the diversion route have shown an increasing trend since the early post-CRD period, including Wapisu, Birch Tree, Footprint and Apussigamasi Lake. In the other lakes sampled, the annual CPUE values are within the range of those measured in the early post-CRD period. However, the mean CPUE in two tributary lakes, Footprint Lake (on-system) and Leftrook Lake (off-system), and, to a lesser extent, in the lake into which they drain, Threepoint Lake, has decreased considerably in the most recent period.
Walleye recruitment in Threepoint Lake does not appear to have been detrimentally affected by the flow stoppage that occurred in 1975 and 1975 during construction of CRD, resulting in a decrease in the average flows in the Burntwood River by about 30% (Water Regime, Section 4.3.3.1). The year class strength index in the pre- and early post-diversion period were similar in Rat and Threepoint lakes, with particularly weak year classes (< 75) occurring in both lakes in 1977, 1978 during the initial operation of CRD and particularly strong year classes (> 175) produced in 1973 and 1983. The 1976 cohort was predominant in Threepoint Lake, but not in Rat Lake. MacLaren Plansearch Inc. (1989) also identified the 1973 and 1983 cohorts as being particularly prominent in their preliminary of age compositions under the auspices of MEMP. More recently (1995–2008), only one cohort, the 1996 year class, was produced in Threepoint Lake with an index value greater than 175 between 1995 and 2008. Particularly weak year classes (< 50) occurred in 1999 and 2008. The strength of year classes in a nearby off-system lake, Leftrook Lake, has consistently produced cohorts with an index of about 100 with the exception of a series of weaker year classes from 2003 to 2006.
Currently the condition of Walleye is similar throughout the diversion route lakes and in a nearby off-system lake, with means ranging from 1.04 to 1.09. Since the early post-CRD period, there has generally been a decline in condition, particularly in Notigi and Apussigamasi lakes. The exception is at Footprint Lake, where stocks have a shown a gradual increase in mean KF. Changes in condition are likely related to differences in the age structure of Walleye captured since older, larger fish typically have larger condition factors. For example, in Rat and Notigi lakes the maximum age of Walleye captured has decreased from 21–31 years in the 1980s to 14–18 years in the 2010s; whereas, in Footprint Lake a greater proportion of the catch in the 2010s was older than 15 years (11%) compared to the catch in the 1980s (3%).
Prior to CRD, Ayles et al. (1974) reported that the growth of Walleye was relatively uniform throughout the diversion route lakes samples, but that fish from Wuskwatim, Threepoint, and Wapisu lakes had better growth rates compared to lakes in the upper reaches. The von Bertalanffy growth curves indicate that there has generally been an increase in the rate at which Walleye approach the maximum predicted length; this is particularly evident in the lakes upstream of the Notigi CS. Compared to the other on-system lakes, Walleye from Threepoint Lake and Footprint Lake obtain a smaller maximal size in a shorter amount of time, which is similar to the growth of Walleye from an off-system, tributary lake (Leftrook Lake). As diet information has not been collected in the most recent sampling period, an assessment of whether changes in growth are related to differences in food production resulting from diversion-related effects to aquatic habitat cannot be completed.
REGIONAL CUMULATIVE EFFECTS ASSESSMENT – PHASE II WATER – FISH COMMUNITY
DECEMBER 2015 5.3-162
Little is known about the movements of Walleye in the Rat-Burntwood system prior to diversion. Currently, there is some movement of Walleye between the upper Rat River and SIL, which prior to construction of the Diversion Channel were separate stocks. One Walleye was observed to have moved into South Bay from Notigi Lake, where it had been Floy®-tagged as part of studies in support of the Wuskwatim GP (Eddy and Fazakas 2001) and one Walleye tagged in South Bay by SIL Commercial Fisherman’s Association was recaptured about 20 km downstream in the Rat River (NSC 2014). Manitoba Fisheries Branch reported that submerged box culverts at the PR 391 crossing on the Suwanee River do not appear to be effective at passing fish and may be blocking Walleye from accessing rapid habitat upstream of the crossing (MFB, unpubl. data).
Factor: Effects of Changes to Sedimentation and Water Quality
Refer to earlier discussion for fish community (Section 5.3.7.3.1).
Factor: Effects of Obstructions to Upstream Movements/Alterations to Downstream Movements
Refer to earlier discussion for fish community (Section 5.3.7.3.1).
Factor: Effects of Construction of the Wuskwatim Generation Project
Prior to construction of the Wuskwatim GP, Walleye were a major component of index gillnetting catches in Wuskwatim Lake and adjacent waterbodies, as well as downstream in the Burntwood River and Opegano Lake (Volume 5, Manitoba Hydro and NCN 2003). Tagging studies indicate that Walleye remain in Wuskwatim Lake for much of the open water season. Wuskwatim Brook was identified as an important spawning location for the species. Walleye were observed to move downstream through Wuskwatim Falls and Taskinigup Falls into the Burntwood River. No Walleye were captured at any of the stream crossings for the 17 Mile access road.
The Wuskwatim GP is predicted to result in an increase of Walleye spawning and feeding habitat in Wuskwatim Lake and a decrease in the loss of migrants due to the stabilization of water level at upper range. Increased water level fluctuations downstream of the GS would result in decreased areas of spawning, feeding, and overwintering habitats, and reduced immigrants (including larvae) from upstream reaches due to reduced water velocities at the inlet and turbine mortalities.
In compliance with Section 32 of the Fisheries Act, live fish, including 128 Walleye, were removed from isolated pools upstream of the Stage I and II cofferdams prior to dewatering in August/September 2008 and October 2010 and released downstream in the Burntwood River (Mota 2009b, 2010b). Most of the Walleye salvaged from the cofferdams were of lengths typical of mature fish.
Several enhancement works have been undertaken starting in 2010 to compensate for fish habitat lost as a result of the project. Boulder garden sites on Wuskwatim Lake and in the immediate forebay are being used by juvenile Walleye as foraging habitat and there is evidence that percids are spawning in the vicinity of the site (Mota and Barth 2014; Mota and Remnant 2015). Walleye appear to be using habitat in embayments enhanced at Wapisu, Threepoint, and Wuskwatim lakes, but have only been captured in spawning condition at the site on Wapisu Lake.
REGIONAL CUMULATIVE EFFECTS ASSESSMENT – PHASE II WATER – FISH COMMUNITY
DECEMBER 2015 5.3-163
Factor: Effects of Fisheries
Fisheries on the diversion route lakes were previously described with respect to the fish community. Harvest rates by domestic fisheries specific to Walleye are not known. The production of Walleye by commercial fisheries that operated on diversion route lakes prior to CRD is not known, but it is thought that these operations were focused on Lake Whitefish. Although commercial production increased (to about 60,000 kg) relative to pre-CRD during the first two decades post-CRD (1976–1995), Walleye comprised less than 20% of the total catch (Figure 5.3.7A-5). Since 1996, commercial production from the diversion route lakes has decreased (30,000 kg), with Walleye accounting for a greater proportion of the catch (50%) (Figure 5.3.7A-5). High costs of the fisheries combined with the higher market price of Walleye contributed to the shift. This increase in Walleye harvests has occurred despite the intermittent closure of some Walleye fisheries due to high mercury levels starting in the late 1970s. Given that the commercial fishery for Walleye in diversion route lakes has been limited and intermittent, the commercial fishery is likely not a major contributor to changes in Walleye stocks.
5.3.7.4 Cumulative Effects of Hydroelectric Development on the Fish Community from the South Bay Diversion Channel to First Rapids on the Burntwood River
Hydroelectric development on the reach of the Rat-Burntwood River from the South Bay channel to First Rapids includes the CRD and the Wuskwatim GP and their associated infrastructure and transmission lines. Construction of the CRD started in 1972/73, with the diversion of flows from the Churchill River commencing in June 1976. CRD resulted in an increase in flows and water levels throughout the reach, with the majority of flooding occurring in Issett Lake and Rat Lake upstream of the Notigi CS. Downstream of the Notigi CS, CRD results in a seasonal reversal of water levels in which water levels are typically higher over the winter rather than during the summer. Construction of the Wuskwatim GP occurred between 2006 and 2012 and resulted in minimal flooding between Wuskwatim Lake and the GS. Operations at Wuskwatim GP create a backwater effect as far upstream as Early Morning Rapids and results in increased fluctuations downstream of the station to Birch Tree Lake.
A number of changes in the fish communities of waterbodies located along the diversion route have been identified since fish community data collection first began in the 1950s. Total CPUE in most of the lakes has remained relatively consistent over the sampling periods since CRD (Rat, Notigi, Wapisu, Opegano, Birch Tree, Apussigamasi lakes), except for three lakes in the vicinity of Nelson House where there appears to be a decreasing trend (Wuskwatim Lake, Threepoint Lake, Footprint Lake).
While the species composition of the diversion route waterbodies has not varied considerably over time, there appears to have been a change in the fish diversity and the relative abundance of certain species in some waterbodies over time. In the sampling period shortly after CRD, Lake Whitefish and/or Cisco accounted for the majority of the catch in Rat, Notigi, Footprint, Wuskwatim, and Birch Tree lakes, while White Sucker and Walleye were particularly abundant in catches in Wapisu, Threepoint, and Apussigamasi lakes. In the more recent sampling periods, however, Walleye and/or White Sucker accounted for the majority of the catch in the diversion route lakes sampled. As well, Shorthead Redhorse and Sauger have generally increased in all waterbodies sampled; in particular, Shorthead Redhorse in waterbodies on the Rat River below the Notigi CS and Footprint Lake where they were previously not recorded, and Sauger upstream of the Notigi CS. Diversity, as measured by Hill’s Index, increased in
REGIONAL CUMULATIVE EFFECTS ASSESSMENT – PHASE II WATER – FISH COMMUNITY
DECEMBER 2015 5.3-164
lakes along the diversion route over time, either because of an increase in the number of species (e.g., Notigi Lake), or a movement to a more even fish community (e.g., Rat and Footprint lakes). Conversely, in lakes like Threepoint and Wapisu, a decrease in the diversity index value was associated with a decrease in the number of species and an increase in the abundance of only a few species (i.e., decrease in evenness).
Lake Whitefish and Walleye stocks appear to have responded differently to the effects of hydroelectric developments, with Whitefish generally declining and Walleye generally remaining consistent or increasing since diversion. There has been a considerable decrease in the CPUE of Lake Whitefish since the 1980s in all of the lakes sampled. The decrease is particularly pronounced in Rat and Footprint lakes; Lake Whitefish are virtually absent from catches (mean < 0.5 fish/100 m/24 h) when historically they were the highest observed in the system (annual mean ranging from 13 to 30 fish/100 m/24 h). However, the capture rate of Walleye in several of the lakes on the diversion route have shown an increasing trend since the early post-CRD period, including Wapisu, Birch Tree, Footprint and Apussigamasi Lake. In the other lakes sampled, the annual CPUE values are within the range of those measured in the early post-CRD period. The mean CPUE in two tributary lakes, Footprint Lake (on-system) and Leftrook Lake (off-system), and, to a lesser extent, in the lake into which they drain, Threepoint Lake, has decreased considerably in the most recent period.
The potential effects of the Wuskwatim GP and its infrastructure on the fish community are described in greater detail in the project EIS (Volume 5, Manitoba Hydro and NCN 2003). In brief, the project was predicted to have a local effect on fish during the construction period through the loss of aquatic habitat from instream works, stream crossing installations, blasting, as well as harvest pressure from the workforce. Operation of the project over the long-term was predicted to benefit fish in Wuskwatim Lake by increasing production of forage, stabilizing water levels, and increasing the amount of permanently wetted habitat, but have detrimental effects on spawning habitat through increased erosion and sedimentation. The project was predicted to have a negative effect on fish downstream of the GS resulting from a reduction in the quality of fish habitat and forage production due to increased water level fluctuations and a decrease in the number of migrants from upstream reaches. As part of the project’s federal and provincial licensing requirements, environmental monitoring programs are being conducted during the construction and operation of the Wuskwatim GP as outlined in the project’s Aquatic Effects Monitoring Program (NSC 2006). Post-project monitoring is ongoing, but due to the limited amount of time since its operation began, conclusive results on the long-term effects of the project on the fish community cannot be made at this time.
Instream infrastructure associated with CRD and the Wuskwatim GP has the potential to alter fish movement patterns in the reach. Construction of the South Bay Diversion Channel connecting SIL and the Rat-Burntwood River system allows for the movement of fish between SIL and the Rat-Burntwood system, which prior to the CRD were separate stocks. Tagging studies conducted by SIL Commercial Fishermen’s Association have shown that these downstream movements do occur, as evidenced by a Lake Whitefish tagged in SIL later being recaptured downstream in Issett Lake, and a Walleye tagged in SIL later being recaptured 20 km downstream of South Bay in the Rat River. Conversely, one Walleye was observed to have moved upstream into South Bay from Notigi Lake, where it had been Floy®-tagged as part of studies in support of the Wuskwatim GP. While the South Bay Diversion Channel appears to
REGIONAL CUMULATIVE EFFECTS ASSESSMENT – PHASE II WATER – FISH COMMUNITY
DECEMBER 2015 5.3-165
increase fish movements, the Notigi CS acts as a barrier to upstream fish movement on the Rat River, although it is not known whether fish movements upstream over the site of the existing CS were ever possible. Fish movements upstream over Taskinigup Falls on the Burntwood River were not possible prior to construction of the Wuskwatim GP.
The fish communities in Threepoint Lake are currently monitored annually, and Rat, Mynarski, Notigi, Footprint, and Apussigamasi lakes are monitored on a rotational basis as part of CAMP to determine the overall health of the waterbodies and what, if any, changes are occurring. At present, catches in standard gangs set in all of the lakes are dominated by Walleye and White Sucker. The fish assemblage in Apussigamasi Lake, the lake furthest downstream, was more diverse than in other lakes and was the only lake in which Goldeye and Mooneye were observed. The most frequently captured forage species included Spottail Shiner and Emerald Shiner, except in Apussigamasi Lake, where Troutperch were more common. Rainbow Smelt were not observed in any of the lakes. The CPUE in standard gangs set in the lakes located on the main flow of the Rat-Burntwood rivers above Early Morning Rapids (Notigi, Threepoint, Rat lakes) were generally consistent and were slightly higher at Footprint Lake, a tributary lake to Threepoint Lake, and at Apussigamasi Lake, which is located farther downstream.
REGIONAL CUMULATIVE EFFECTS ASSESSMENT – PHASE II WATER – FISH COMMUNITY
DECEMBER 2015 5.3-166
5.3.8 Area 4: Missi Falls Control Structure to the Churchill River Estuary
The lower Churchill River flows for approximately 450 km from the Missi Falls CS at the northeastern outflow of SIL to the Churchill River estuary. It includes a number of lakes (Partridge Breast, Northern Indian, Fidler, and Billard), as well as the waterbody created by the Lower Churchill River Water Level Enhancement Weir Project (Churchill Weir) (Map 5.3.8-1).
The Missi Falls CS was constructed between 1973 and 1976 (Hydroelectric Development Project Description, Appendix 2F). In terms of effects of CRD downstream of SIL on the lower Churchill River, minor effects associated with construction of the Missi Falls CS began in August 1973 (i.e., minor reductions in outflows began at this time). However, major staging of SIL was not initiated until June 1976, at which time discharge from the Missi Falls CS was substantially reduced.
For the purposes of this assessment, 1976, when large changes in flows were first initiated, has been designated as the period of construction, data collected prior to 1976 are considered as pre-CRD, and data collected after 1976 were considered to represent post-CRD conditions (i.e., operation period). This is consistent with data presented in Water Regime (Section 4.3.3.3).
In 1994, Manitoba Hydro and the Town of Churchill (‘the Town”) initiated the Lower Churchill River Water Level Enhancement Study, a collaborative effort to investigate mitigation options intended to address the lower water levels experienced in the Churchill River near Churchill due to CRD (NSC 2010c). Following an extensive screening process, the Town and Manitoba Hydro agreed upon a project design that included the construction of a weir across the Churchill River and other ancillary components. Together, these components comprised the Lower Churchill River Water Level Enhancement Weir Project (the Churchill Weir). The primary objective of the Churchill Weir was to enhance water levels along a 10 km reach of the lower Churchill River, which would improve boating and increase the amount and productivity of fish habitat, and therefore fish, in this reach of the river.
Construction of the Churchill Weir was initiated in summer 1998 and completed in 1999 (NSC 2010c). Water level immediately upstream of the weir was raised by approximately 2.0 m, and elevated water level effects extended upstream from the weir for a distance of 10 km (Water Regime, Section 4.3.3.3.3). The increase in water level upstream of the Churchill Weir resulted in approximately 1,800 ha of permanently wetted fish habitat at a Churchill River discharge of approximately 400 m3/s (NSC 2010c; Larter and Bernhardt 2009).

Warkworth L.
Churchill River Weir
Seal
Limestone Lake
Mountain Rapids(The Fours)
River
Haye
s
Herriot
Red Head Rapids
Beaver R.
Heppell Ck.
River
Running LandingPlace Rapids
Nelson
Alston Ck.
Gods Rapids
River
Limestone Rapids
GooseCk
Kirkness Rapids
Crosswell
WaskaiowakaLake
Warkworth
Kilnabad Rapids
Ck.
Long Island
FidlerLake
Ck.
Billard Lake
PartridgeBreast
L.
Munk
River
ManitousRapids
Swallow Rapids
Deer R.Chur
chill Riv
er
Little
HUDSONBAY
NorthernIndianLake
River
WilsonRapids
GauerLake
SouthernIndianLake
Bad Cache Rapids
Little Churchill
River
Missi Falls
Control Structure
Churchill
1.0
30-SEP-15
North/South Consultants
04-DEC-15
Province of Manitoba, Government of Canada and Manitoba Hydro.
Fish Community Assessment AreaMissi Falls Control Structure to
Churchill River Estuary RCEA Area 4
LegendRCEA Region of InterestFish Community Reach BoundaryFalls/RapidsFirst Nation Reserve
Hudson Bay
Thompson
Churchill
NAD 1983 UTM Zone 14N
DATA SOURCE:
COORDINATE SYSTEM: DATE CREATED:
CREATED BY:
VERSION NO:
REVISION DATE:
QA/QC:
Regional Cumulative Effects Assessment
0 10 20 Miles
0 10 20 Kilometres
Cre
ated
By:
cpa
rker
- B
Siz
e La
ndsc
ape
STD
- M
AR
201
5
Sca
le: 1
:1,2
47,0
00
RCEAArea 4
InfrastructureControl StructureTransmission Line (Existing)RailHighway
Missi Falls Control Structure toChurchill River Estuary
Map 5.3.8-1

REGIONAL CUMULATIVE EFFECTS ASSESSMENT – PHASE II WATER – FISH COMMUNITY
DECEMBER 2015 5.3-168
5.3.8.1 Key Published Information There is virtually no pre-CRD quantitative published fish community data for any Area 4 waterbodies that generated metrics that could be compared with post-CRD data.
Prior to CRD, studies were conducted by the LWCNRSB on the lower Churchill River lakes, including Partridge Breast, Northern Indian, and Fidler (Ayles et al. 1974; Hecky and Ayles 1974b). No pre-CRD data are available for the Churchill River mainstem downstream of Fidler Lake.
Following CRD, Barnes (1990) and Barnes and Bodaly (1994) assessed the number and origin of Lake Whitefish observed congregating immediately downstream of the Missi Falls CS under FEMP. Mark/recapture studies were conducted on fish sampled in 1986 and 1987, comparisons of morphological characteristics were made among populations, and fish were examined for signs of physiological stress (Barnes 1990; Barnes and Bodaly 1994).
In 1996, Manitoba Hydro and the Split Lake Cree conducted a joint assessment of the effects of hydroelectric development in the Split Lake Cree study area, which includes a portion of the Churchill River from just upstream of Fidler Lake to approximately Kilnabad Rapids (Volumes 2, 3, 4, Split Lake Cree-Manitoba Hydro Joint Study Group 1996).
A large amount of data has been collected on fish abundance, species composition, and movements as part of the environmental impact assessment and post-project monitoring for the Churchill Weir (Manitoba Hydro and the Town of Churchill 1997). While the majority of the work was conducted in the area directly affected by the Churchill Weir, some work was conducted as far upstream as the Crosswell River. These studies have examined fish use of tributaries (Remnant and Bernhardt 1994; Bernhardt 1995b, 1996b, 1997a; Remnant and Kitch 1996a; Fazakas and Bernhardt 1997); fish populations in the vicinity of the Churchill Weir (Remnant 1995; Remnant and Kitch 1996b; Bernhardt 1997b; Fazakas and Remnant 1997; Bernhardt 2000, 2001, 2002a, b, 2005a; Bernhardt and Holm 2003; Bernhardt and Pisiak 2006; Bernhardt and Caskey 2009; Hertam et al. 2014); fish passage at the Goose Creek road crossings (Remnant and Bernhardt 1994; Remnant and Kitch 1996a; Bernhardt 2011; Bernhardt and Pisiak 2011; Remnant and Caskey 2011; Bernhardt and Johnson 2012; Koga et al. 2013; Johnson and Bernhardt 2013; Johnson et al. 2015), fish passage at the Churchill Weir (Peake and Remnant 2000; Peake 2001; 2003, 2004; Peake and Bernhardt 2002; Bernhardt 2003a; Murray et al. 2010; Murray and Caskey 2010); and fish use of the Goose Creek habitat enhancement reach (Remnant and Bernhardt 1997; Remnant and Caskey 2000; Remnant et al. 2001; Caskey and Remnant 2002; MacDonald and Remnant 2003; MacDonald et al. 2004; Bernhardt and Holm 2005). Several synthesis reports have compared fish population responses to the project to predictions in the EIS (Bernhardt 2003b; Bernhardt and Holm 2007; NSC 2010c).
Northern Indian, Partridge Breast, and Billard lakes, as well as the Churchill River at its confluence with the Little Churchill River are currently monitored under CAMP. Fish populations on Fidler Lake and the Churchill River at Red Head Rapids were also monitored in 2011. A report summarizing results of the first three years of monitoring was produced (CAMP 2014) and a report summarizing the results of the first six

REGIONAL CUMULATIVE EFFECTS ASSESSMENT – PHASE II WATER – FISH COMMUNITY
DECEMBER 2015 5.3-169
years of monitoring is currently being prepared. Wherever relevant, data from the second report has been incorporated into this assessment (CAMP unpubl. data).
5.3.8.2 New Information and/or Re-analysis of Existing Information Detailed data analysis methods are provided in Appendix 5.3.1B. The two primary data sources available from which to generate metrics were data collected as part of CAMP (2008–2013) and data collected as part of the environmental impact assessment and post-project monitoring for the Churchill Weir (1994–2013). Raw data collected from Northern Indian Lake in 1981 were obtained from MFB. The pre-CRD index gillnetting data from the lower Churchill River lakes collected in 1973 (Ayles et al. 1974) were not included in the analyses because sufficient data were not available to standardize the metric analyses to be comparable to data collected as part of CAMP and the Churchill Weir studies. All data collected under CAMP was considered as one time period. Data collected as part of the Churchill Weir studies were grouped into three time periods: pre-Churchill Weir (1994–1996); immediate post-Churchill Weir (1999–2006); and current (CAMP; 2008–2013). The separation between the post-Churchill Weir and current periods was made to be keep the current period consistent within all Area 4 waterbodies.
To make CAMP and Churchill Weir data comparable, it was necessary to eliminate the data generated from some of the mesh sizes that were not used consistently between programs (i.e., mesh ≤ 1.5 inch). Further, for some years, mesh sizes were not recorded for Churchill Weir gillnetting programs. Consequently, a second set of analyses specific to the Churchill Weir data was conducted in which the 1.5 inch mesh data were retained in the data set to allow comparability among the three time periods for Churchill Weir data. Some differences in methods remain between the gillnetting studies that were selected for the quantitative analysis. There were differences in the number of sites fished between studies, as well as how those sites were selected.
5.3.8.3 Changes in the Fish Community and Focal Species over Time
Although the lower Churchill River and its tributaries flows through a large expanse of Area 4, the majority of the fish community studies conducted in Area 4 fall within two general areas: the upstream lakes; and the lower 10 km of the river immediately upstream of the Churchill Weir. Between Billard Lake and the upstream end of Long Island (Map 5.3.8-1), the lower Churchill River is a fairly narrow, fast flowing river characterized by several sets of rapids. This reach of the Churchill River has not received much use, nor has it received much study. There is virtually no pre-CRD quantitative published fish community data for any Area 4 waterbodies that generated metrics that could be compared with post-CRD data.
5.3.8.3.1 Fish Community Standard fish community metrics (e.g., CPUE, relative abundance, growth) were calculated to examine differences among waterbodies and, where possible, changes over time within a waterbody. The following data sets were used: Partridge Breast Lake - 2009 and 2012; Northern Indian Lake - 1981 and 2008–2013; Fidler Lake (2011); Billard Lake (2010 and 2013), the Churchill River at the confluence with the Little Churchill River (the Confluence - 2008–2013); the Churchill River at Red Head Rapids
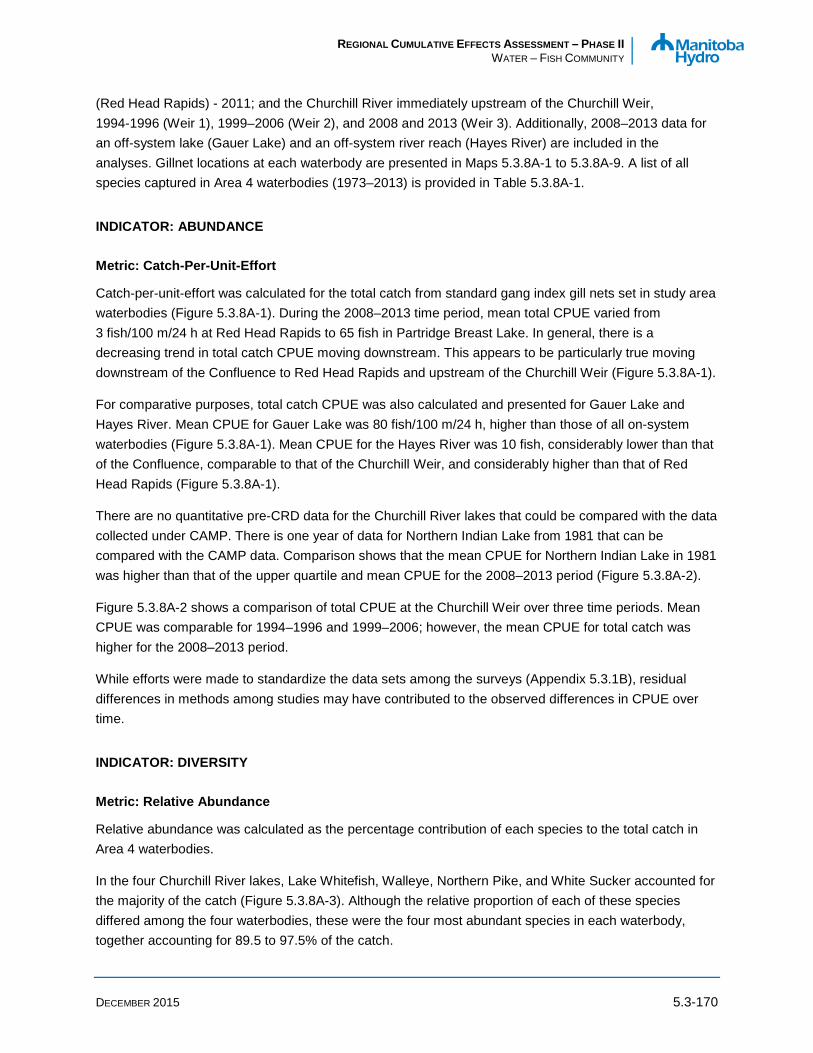
REGIONAL CUMULATIVE EFFECTS ASSESSMENT – PHASE II WATER – FISH COMMUNITY
DECEMBER 2015 5.3-170
(Red Head Rapids) - 2011; and the Churchill River immediately upstream of the Churchill Weir, 1994-1996 (Weir 1), 1999–2006 (Weir 2), and 2008 and 2013 (Weir 3). Additionally, 2008–2013 data for an off-system lake (Gauer Lake) and an off-system river reach (Hayes River) are included in the analyses. Gillnet locations at each waterbody are presented in Maps 5.3.8A-1 to 5.3.8A-9. A list of all species captured in Area 4 waterbodies (1973–2013) is provided in Table 5.3.8A-1.
INDICATOR: ABUNDANCE
Metric: Catch-Per-Unit-Effort
Catch-per-unit-effort was calculated for the total catch from standard gang index gill nets set in study area waterbodies (Figure 5.3.8A-1). During the 2008–2013 time period, mean total CPUE varied from 3 fish/100 m/24 h at Red Head Rapids to 65 fish in Partridge Breast Lake. In general, there is a decreasing trend in total catch CPUE moving downstream. This appears to be particularly true moving downstream of the Confluence to Red Head Rapids and upstream of the Churchill Weir (Figure 5.3.8A-1).
For comparative purposes, total catch CPUE was also calculated and presented for Gauer Lake and Hayes River. Mean CPUE for Gauer Lake was 80 fish/100 m/24 h, higher than those of all on-system waterbodies (Figure 5.3.8A-1). Mean CPUE for the Hayes River was 10 fish, considerably lower than that of the Confluence, comparable to that of the Churchill Weir, and considerably higher than that of Red Head Rapids (Figure 5.3.8A-1).
There are no quantitative pre-CRD data for the Churchill River lakes that could be compared with the data collected under CAMP. There is one year of data for Northern Indian Lake from 1981 that can be compared with the CAMP data. Comparison shows that the mean CPUE for Northern Indian Lake in 1981 was higher than that of the upper quartile and mean CPUE for the 2008–2013 period (Figure 5.3.8A-2).
Figure 5.3.8A-2 shows a comparison of total CPUE at the Churchill Weir over three time periods. Mean CPUE was comparable for 1994–1996 and 1999–2006; however, the mean CPUE for total catch was higher for the 2008–2013 period.
While efforts were made to standardize the data sets among the surveys (Appendix 5.3.1B), residual differences in methods among studies may have contributed to the observed differences in CPUE over time.
INDICATOR: DIVERSITY
Metric: Relative Abundance
Relative abundance was calculated as the percentage contribution of each species to the total catch in Area 4 waterbodies.
In the four Churchill River lakes, Lake Whitefish, Walleye, Northern Pike, and White Sucker accounted for the majority of the catch (Figure 5.3.8A-3). Although the relative proportion of each of these species differed among the four waterbodies, these were the four most abundant species in each waterbody, together accounting for 89.5 to 97.5% of the catch.
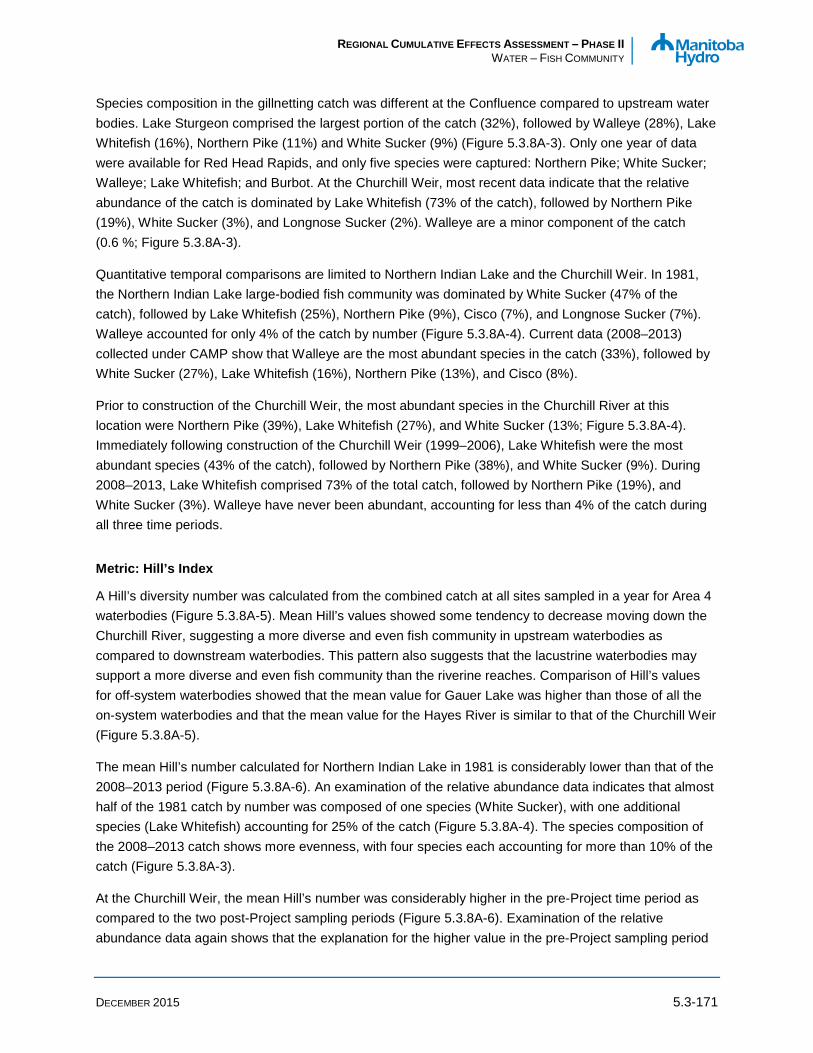
REGIONAL CUMULATIVE EFFECTS ASSESSMENT – PHASE II WATER – FISH COMMUNITY
DECEMBER 2015 5.3-171
Species composition in the gillnetting catch was different at the Confluence compared to upstream water bodies. Lake Sturgeon comprised the largest portion of the catch (32%), followed by Walleye (28%), Lake Whitefish (16%), Northern Pike (11%) and White Sucker (9%) (Figure 5.3.8A-3). Only one year of data were available for Red Head Rapids, and only five species were captured: Northern Pike; White Sucker; Walleye; Lake Whitefish; and Burbot. At the Churchill Weir, most recent data indicate that the relative abundance of the catch is dominated by Lake Whitefish (73% of the catch), followed by Northern Pike (19%), White Sucker (3%), and Longnose Sucker (2%). Walleye are a minor component of the catch (0.6 %; Figure 5.3.8A-3).
Quantitative temporal comparisons are limited to Northern Indian Lake and the Churchill Weir. In 1981, the Northern Indian Lake large-bodied fish community was dominated by White Sucker (47% of the catch), followed by Lake Whitefish (25%), Northern Pike (9%), Cisco (7%), and Longnose Sucker (7%). Walleye accounted for only 4% of the catch by number (Figure 5.3.8A-4). Current data (2008–2013) collected under CAMP show that Walleye are the most abundant species in the catch (33%), followed by White Sucker (27%), Lake Whitefish (16%), Northern Pike (13%), and Cisco (8%).
Prior to construction of the Churchill Weir, the most abundant species in the Churchill River at this location were Northern Pike (39%), Lake Whitefish (27%), and White Sucker (13%; Figure 5.3.8A-4). Immediately following construction of the Churchill Weir (1999–2006), Lake Whitefish were the most abundant species (43% of the catch), followed by Northern Pike (38%), and White Sucker (9%). During 2008–2013, Lake Whitefish comprised 73% of the total catch, followed by Northern Pike (19%), and White Sucker (3%). Walleye have never been abundant, accounting for less than 4% of the catch during all three time periods.
Metric: Hill’s Index
A Hill’s diversity number was calculated from the combined catch at all sites sampled in a year for Area 4 waterbodies (Figure 5.3.8A-5). Mean Hill’s values showed some tendency to decrease moving down the Churchill River, suggesting a more diverse and even fish community in upstream waterbodies as compared to downstream waterbodies. This pattern also suggests that the lacustrine waterbodies may support a more diverse and even fish community than the riverine reaches. Comparison of Hill’s values for off-system waterbodies showed that the mean value for Gauer Lake was higher than those of all the on-system waterbodies and that the mean value for the Hayes River is similar to that of the Churchill Weir (Figure 5.3.8A-5).
The mean Hill’s number calculated for Northern Indian Lake in 1981 is considerably lower than that of the 2008–2013 period (Figure 5.3.8A-6). An examination of the relative abundance data indicates that almost half of the 1981 catch by number was composed of one species (White Sucker), with one additional species (Lake Whitefish) accounting for 25% of the catch (Figure 5.3.8A-4). The species composition of the 2008–2013 catch shows more evenness, with four species each accounting for more than 10% of the catch (Figure 5.3.8A-3).
At the Churchill Weir, the mean Hill’s number was considerably higher in the pre-Project time period as compared to the two post-Project sampling periods (Figure 5.3.8A-6). Examination of the relative abundance data again shows that the explanation for the higher value in the pre-Project sampling period

REGIONAL CUMULATIVE EFFECTS ASSESSMENT – PHASE II WATER – FISH COMMUNITY
DECEMBER 2015 5.3-172
is a more evenly distributed fish community, featuring a smaller proportion of a great number of species. The immediate post-Project time period and, particularly the 2008–2013 time period, are characterized by the dominance of two species (Lake Whitefish and Northern Pike). In the 2008–2013 time period Lake Whitefish make up 73% of the catch (Figure 5.3.8A-3).
DISCUSSION: FACTORS AFFECTING THE FISH COMMUNITY OVER TIME
Limited information is available regarding the fish community in Area 4 prior to CRD.
In 1973, three of the upstream lakes (Partridge Breast, Northern Indian, and Fidler) were sampled as part of baseline studies for the LWCNRSB (Hecky and Ayles 1974b; Ayles et al. 1974). A total of 10 species were captured in Partridge Breast Lake, 12 species in Northern Indian Lake, and 10 species in Fidler Lake (Ayles et al. 1974). The fish fauna was found to be fairly typical of Churchill River lakes (including SIL and lakes farther upstream in Saskatchewan). Numerically, the catch in the three study lakes was found to be dominated by Lake Whitefish, Northern Pike, and suckers, with Lake Whitefish and Northern Pike accounting for nearly equal proportions of the catch by weight (Ayles et al. 1974). Walleye, Cisco, Yellow Perch, and Lake Trout were present, but were not common in the catches (Ayles et al. 1974). Overall, CPUE was similar to those of SIL and lakes farther upstream in the Churchill River (Ayles et al. 1974). Some of the more common small-bodied species included Troutperch, Spottail Shiner, and Ninespine Stickleback (Ayles et al. 1974).
No pre-CRD fish community data are available for the Churchill River mainstem downstream of Fidler Lake. Walker (1931) and Keleher (1953) documented at least 13 species in the Churchill River estuary between Mosquito Point and the mouth. Catches of Cisco, Lake Whitefish, and Northern Pike were reported in both studies; other freshwater or anadromous species included trout, Arctic Char (Salvelinus alpinus), Longnose Sucker and Ninespine Stickleback.
Currently, the fish community in the upstream lakes is characterized by a large-bodied fish community that is typical of shallow, turbid, northern waterbodies. The communities tend to be dominated by Lake Whitefish, Walleye, Northern Pike, and White Sucker, with smaller numbers of Longnose Sucker, Cisco, Burbot, and Yellow Perch. The relative abundance of each species differs somewhat by waterbody. Some of the more abundant small-bodied species in these lakes include Emerald Shiner, Spottail Shiner, Lake Chub (Couesius plumbeus), and Troutperch. Moving downstream, the major difference at the Confluence is that the most abundant species is Lake Sturgeon. The remainder of the large- and small-bodied fish community is fairly similar to that of the upstream lakes. The large-bodied fish community upstream of the Churchill Weir is currently dominated by Lake Whitefish and Northern Pike, with smaller numbers of White Sucker, Longnose Sucker, and Cisco. Walleye are a very minor component of the fish community. Troutperch, Spottail Shiner, and Lake Chub are some of the more abundant small-bodied species (Hertam et al. 2014).
The large-bodied fish community of Gauer Lake is also dominated by Lake Whitefish, Walleye, Northern Pike, and White Sucker, with smaller numbers of Cisco and Yellow Perch. Some of the more common small-bodied species include Spottail Shiner, Emerald Shiner, and Troutperch. The most common large-bodied fish species captured in the Hayes River are Walleye and Lake Sturgeon (similar to that of

REGIONAL CUMULATIVE EFFECTS ASSESSMENT – PHASE II WATER – FISH COMMUNITY
DECEMBER 2015 5.3-173
the Confluence), with smaller numbers of Longnose Sucker and White Sucker. Very few small-bodied species are captured in the Hayes River.
Currently, fish capture rates among the on-system waterbodies range from 60 to 65 fish/100 m/24 h at the upstream end of Area 4 (Partridge Breast and Northern Indian lakes), 45 to 55 fish at Fidler and Billard lakes, 45 fish at the Confluence, less than five fish at Red Head Rapids, and 10 to 15 fish at the Churchill Weir. Fish capture rates in the off-system waterbodies are 80 fish/100 m/24 h for Gauer Lake and 10 fish in the Hayes River. Similar to fish capture rate, the Hill’s diversity index shows some tendency to decrease with movement down the Churchill River.
Changes in the fish communities along the lower Churchill River may be due to many linkages to hydroelectric development, including reductions and changes in flows, reductions in open water and overwintering habitat, impediments to fish movements, changes in sedimentation rates, changes in water quality, changes in habitat, redistribution of fish stocks, other stressors such as commercial fishing, and natural variability.
Factor: Effects of Changes to the Water Regime and Other Factors on Fish Habitat
Diversion and regulation of Churchill River flow was expected to seriously affect the majority of fish species within the upstream lakes, particularly the commercial species (Hecky and Ayles 1974b; Ayles et al. 1974). The area of the upstream lakes was expected to be reduced by as much as 76%, thereby affecting production within each lake (Ayles et al. 1974). Annual flow regulation was expected to create water level drawdowns of up to 3 m, as compared to the pre-CRD fluctuations of 1.0–1.5 m, which would preclude the development of a littoral zone (Ayles et al. 1974; Hecky and Ayles 1974b). Fall and winter drawdowns were expected to affect the availability of spawning habitat for Lake Whitefish and Cisco and expose and freeze some proportion of the eggs that were deposited (Ayles et al. 1974).
As predicted, CRD has resulted in major reductions in flow down the lower Churchill River during both the open water period and winter. CRD is reported to have diverted an average of approximately 735 m3/s from the Churchill River, equivalent to about 79% of the river’s average pre-CRD flows at Missi Falls CS (Volume 2, Split Lake Cree-Manitoba Hydro Joint Study Group 1996). Median monthly pre-CRD flows at the outlet of Fidler Lake (1960–1975) reached a low of approximately 870 m3/s in March, increasing through April to June reaching a peak of approximately 1,400 m3/s in July before declining over the rest of the year (Water Regime, Figure 4.3.3-4). Median monthly post-CRD flows at the outlet of Fidler Lake (1978–2012) showed a decline from January to a low of approximately 70 m3/s in April, rising to a peak of slightly more than 200 m3/s in June before declining in July and remaining relatively constant over the rest of the year except for a short pulse in November (Water Regime, Figure 4.3.3-4). Using median monthly values obtained from Water Regime Figure 4.3.3-4, the proportion of post-CRD/pre-CRD flows at the outlet of Fidler Lake ranges from a low of 7% in April to a high of 17% in May.
Median monthly pre-CRD flows above Redhead Rapids (1971–1975) showed a decline from January to a low of approximately 1,057 m3/s in April, increasing through May to June reaching a peak of approximately 1,679 m3/s in August before declining over the rest of the year (Water Regime, Figure 4.3.3-5). Median monthly post-CRD flows above Redhead Rapids (1978–2014) showed a decline from January to a low of approximately 97 m3/s in April, rising markedly over the spring and summer reaching
REGIONAL CUMULATIVE EFFECTS ASSESSMENT – PHASE II WATER – FISH COMMUNITY
DECEMBER 2015 5.3-174
a peak of approximately 525 m3/s in June before declining over the rest of the year (Water Regime, Figure 4.3.3-5). Using median monthly values obtained from Water Regime Figure 4.3.3-5, the proportion of post-CRD/pre-CRD flows above Red Head Rapids ranges from a low of approximately 9% in March and April to a high of approximately 37% in June.
In addition to changes in flows, there have been variations in the timing of peak flows. Pre-CRD, median monthly flows peaked in July at the outlet of Fidler Lake (Water Regime, Figure 4.3.3-4) and July to September at Red Head Rapids (Water Regime, Figure 4.3.3-5). Post-CRD, median monthly flows are shown to peak during June at the outlet of Fidler Lake (Water Regime, Figure 4.3.3-4) and at Red Head Rapids (Water Regime, Figure 4.3.3-5). The earlier peaks in discharge in the post-CRD environment are likely due to the influence of inputs from major tributaries (e.g., Gauer River, Little Churchill River, and Little Beaver River).
Although flows down the lower Churchill River have been reduced substantially as a result of CRD, flood events, where post-CRD 95%ile flows at Missi Falls CS have been exceeded for a period of more than two weeks, do occur on the lower Churchill River. These events happened during July to November 2005, August 2006, July to August 2009, and August to September 2011 (Water Regime, Section 4.3.3.3.3).
Reductions in water level as a result of CRD vary along the lower Churchill River, depending on gradient and width. It is estimated that the average water levels of Partridge Breast, Northern Indian, Fidler, and Billard lakes have dropped approximately 4.1, 2.3, 4.6, and 2.8 m, respectively (Water Regime, Section 4.3.3.3).
Reductions in flow and water level have resulted in a decrease in the amount of wetted river channel and, consequently, a decrease in the amount of aquatic habitat. Based on an examination of pre- and post-CRD air photos at four locations along the lower Churchill River, it is estimated that there has been a reduction in channel width of approximately 30% (Erosion and Sedimentation, Section 4.4.2.5.2). Estimates of the amount of river channel exposed as a result of CRD vary and likely reflect differences in water level when the area exposed was calculated. The dewatered area between Missi Falls CS and Mosquito Point was estimated at 78.6 sq mi (204 km2; Water Regime, Table 4.3.1-1). Bodaly et al. (1984b) stated that pre-diversion lake areas were halved as a result of CRD, exposing a total of 96 km2 of former lake bottom in the upper three lakes (Partridge Breast, Northern Indian, and Fidler) along the lower Churchill River. Split Lake Cree-Manitoba Hydro Joint Study Group (Volume 2,1996) estimated that 69 km2 of previously wetted shoreline had been exposed as a result of CRD in the reach of the lower Churchill River within the Split Lake Cree study area (just upstream of Fidler Lake to approximately Kilnabad Rapids [Map 5.3.8-1]).
It is not possible to make a direct correlation between the reduction of flow and a reduction in the amount of fish habitat. However, the diversion of 83 to 93% of the median monthly flows at the outlet of Fidler Lake, combined with a decrease in water depth of up 4.6 m at some locations, indicates that there has been a substantial reduction in the amount of available fish habitat.
There are no quantitative pre-CRD data from any locations along the lower Churchill River from which to make comparisons pre- and post-CRD using the presented metrics. However, data collected from 1973 suggests that the fish fauna in Partridge Breast, Northern Indian, and Fidler lakes was dominated by Lake