silfsoil f f iliertility - texas a&m...
TRANSCRIPT

S il FS il FSoil FSoil F
Dale RDale RDale RDale R
Colorado County Colorado County Texas Texas AgrilifeAgrilife ExEx
F iliF iliFertilityFertility
RankinRankinRankinRankin
Extension AgentExtension AgentExtension ServiceExtension Service
CredCredCredCredAnd SpeciAnd Speci
•• Dr. Mark McFarland TeDr. Mark McFarland TeService, Professor andService, Professor and,,Specialist Specialist
•• Dr SamDr Sam FeagleyFeagley TexasTexasDr. Sam Dr. Sam FeagleyFeagley Texas Texas Service, Professor, andService, Professor, andEnvironmental SpecialisEnvironmental SpecialisEnvironmental SpecialisEnvironmental Specialis
dits:dits:dits:dits:ial Thanksial Thanksexas exas AgrilifeAgrilife Extension Extension
d Extension Soil Fertility d Extension Soil Fertility yy
AgriliFeAgriliFe ExtensionExtensionAgriliFeAgriliFe Extension Extension d State Soil d State Soil ststst st
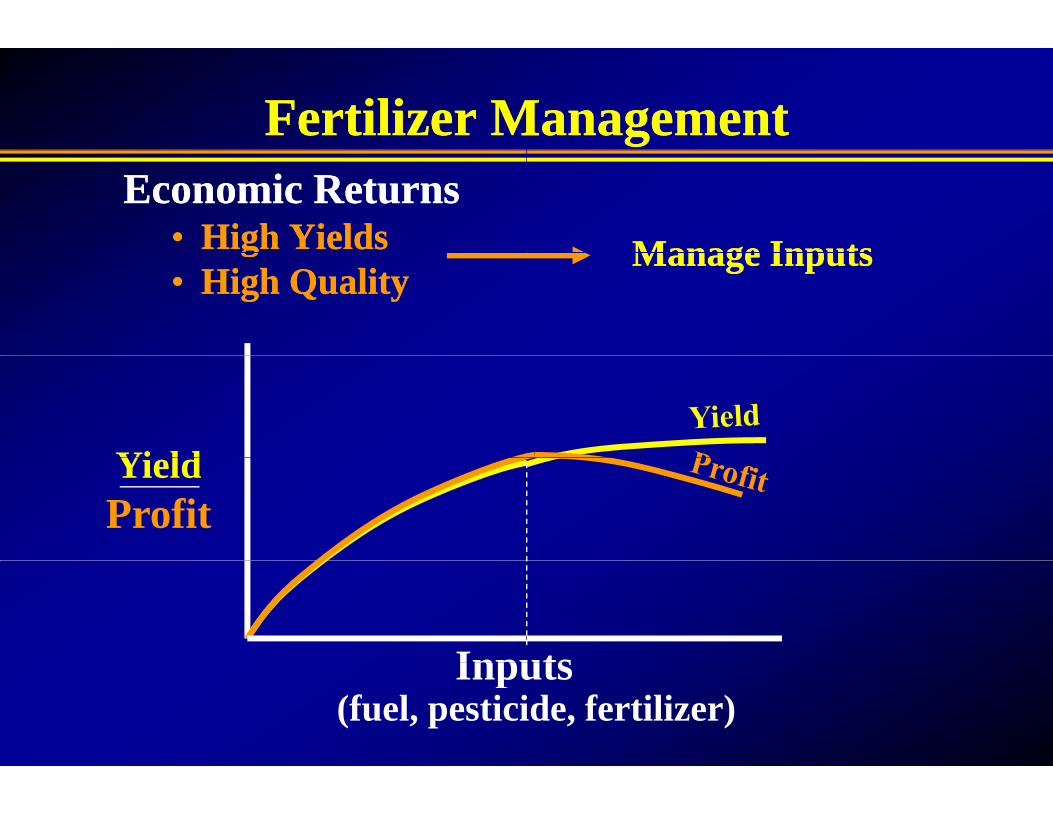
Fertilizer MFertilizer MEconomic ReturnsEconomic Returns
•• High YieldsHigh Yieldsgg•• High Quality High Quality
Yi ldYieldProfit
InpuInpu(fuel, pestici
ManagementManagement
Manage InputsManage InputsManage InputsManage Inputs
utsutside, fertilizer)
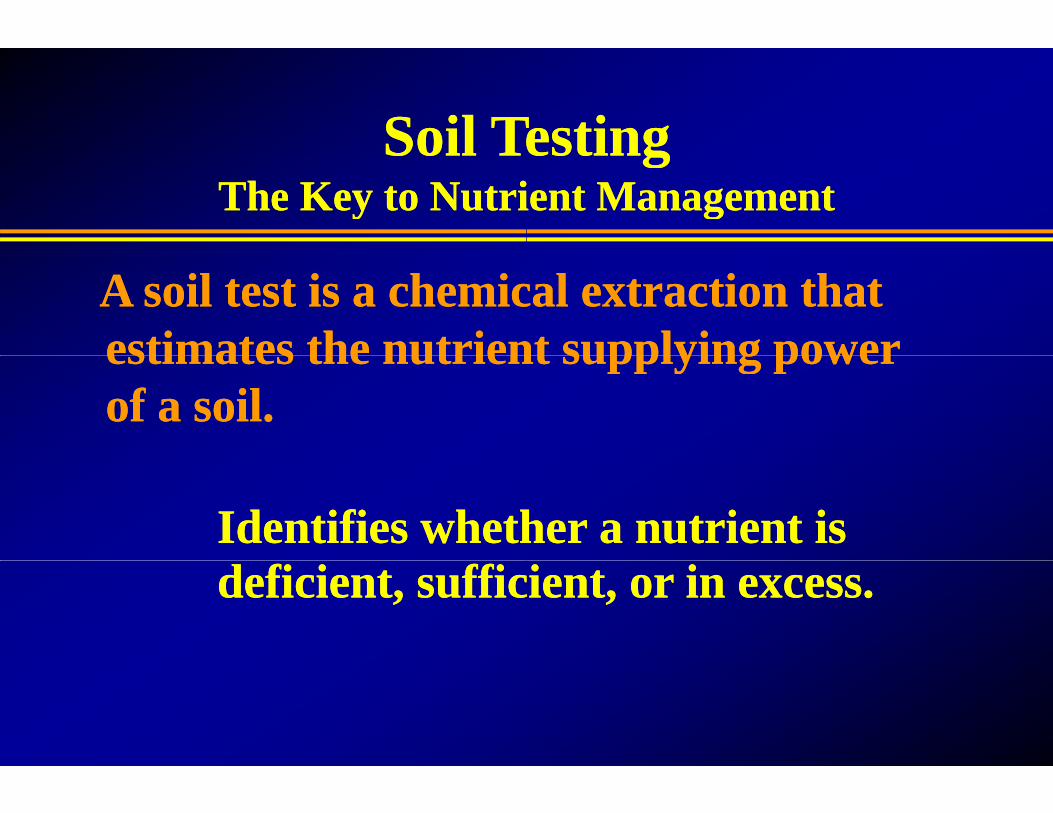
Soil TeSoil TeSoil TeSoil TeThe Key to NutriThe Key to Nutri
A soil test is a chemicA soil test is a chemicestimates the nutrienestimates the nutrienestimates the nutrienestimates the nutrienof a soil.of a soil.
Identifies whethIdentifies whethdeficient, sufficdeficient, suffic
TestingTestingTestingTestingient Managementient Management
cal extraction that cal extraction that nt supplying powernt supplying powernt supplying power nt supplying power
her a nutrient is her a nutrient is cient, or in excess.cient, or in excess.
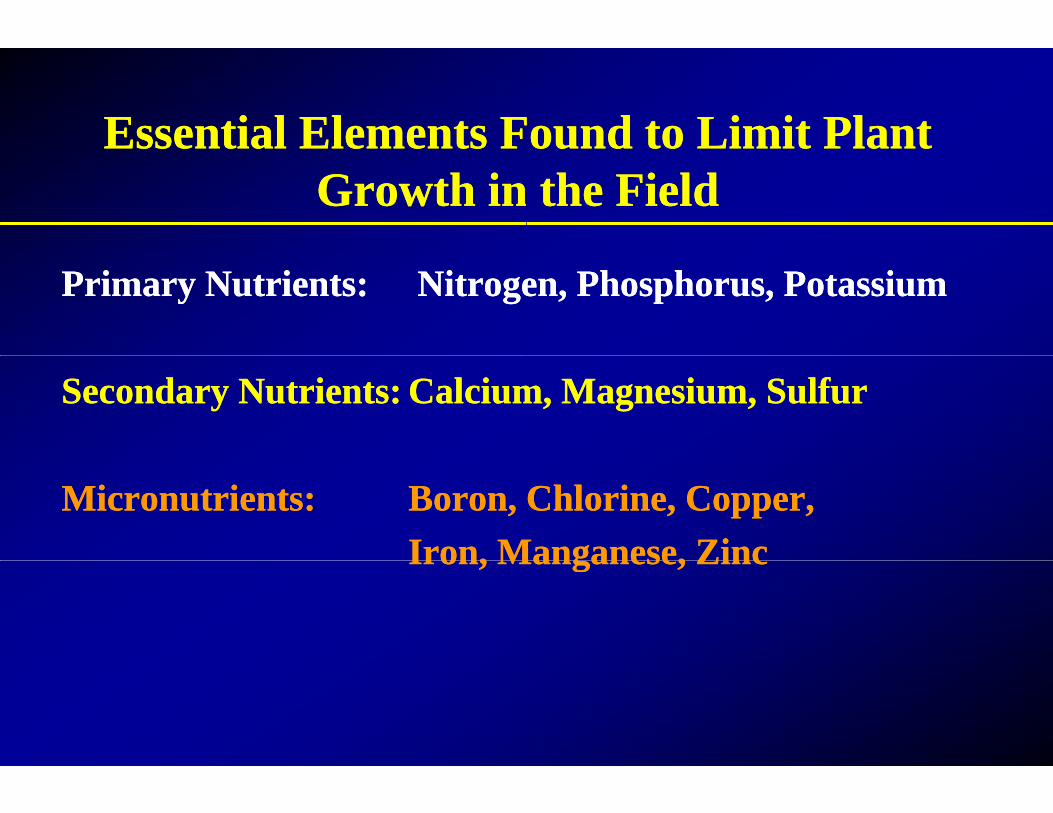
Essential Elements FEssential Elements FGrowth inGrowth in
Primary Nutrients:Primary Nutrients: NitrogeNitroge
Secondary Nutrients:Secondary Nutrients: CalciumCalcium
Micronutrients:Micronutrients: Boron, Boron, Iron, MIron, MIron, MIron, M
Found to Limit Plant Found to Limit Plant the Field the Field
en, Phosphorus, Potassiumen, Phosphorus, Potassium
m, Magnesium, Sulfurm, Magnesium, Sulfur
Chlorine, Copper,Chlorine, Copper,Manganese, ZincManganese, ZincManganese, ZincManganese, Zinc

Nutrient UpNutrient UpBermudaBermudaBermudaBermuda
NutrientNutrientNutrientNutrientNitrogenNitrogen
PrimaryPrimary PhosphorusPhosphorusPrimaryPrimary PhosphorusPhosphorusPotassiumPotassium
CalciumCalciumCalciumCalciumSecondarySecondary MagnesiumMagnesium
SulfurSulfur
CopperCopperMicro’sMicro’s ManganeseManganese
ZincZinc
ptake by Coastal ptake by Coastal agrass (2 T/A)agrass (2 T/A)agrass (2 T/A)agrass (2 T/A)
Pounds/AcrePounds/Acre P d /TPounds/AcrePounds/Acre100100
ss 2828
Pounds/Ton5014ss 2828
8484
1515
1442
1515mm 66
88
0.050.050.050.050.100.10

Balanced NutritionBalanced Nutrition

Improved BeImproved BeImproved BeImproved BeSoil Test vs. FertilizeSoil Test vs. Fertilize
Soil Test (Soil Test (Yield GoalYield Goal N PN PYield Goal Yield Goal N P N P GrazingGrazing 11 1 1 1 Cutting + Grazing1 Cutting + Grazing 11 111 Cutting + Grazing1 Cutting + Grazing 11 1 1 3 Cuttings hay 3 Cuttings hay 1 1 1 1 44--6 Cuttings hay6 Cuttings hay 1 11 144 6 Cuttings hay6 Cuttings hay 1 1 1 1
* Split applications of N and K.* Split applications of N and K.
ermudagrassermudagrassermudagrassermudagrasser Recommendationer Recommendation
(ppm) Annual Rate (lb/A) (ppm) Annual Rate (lb/A) KK NN ** PP22OO55 KK22OO ** K K N N PP22OO55 KK22O O
1 1 60 50 9060 50 9011 160 50 150160 50 150 11 160 50 150 160 50 150
1 1 300 100 300300 100 30011 400 130 400400 130 400 11 400 130 400400 130 400

GrazingGrazingvs.vs.vs.vs.
HayHay
Most of the nutrientsMost of the nutrientsrecycled through the recycled through the and back to the soil.and back to the soil.
s ares areanimalsanimals

Coastal BerCoastal BerS i i iS i i iSoil Test vs. FertilizeSoil Test vs. Fertilize
Soil Test (Soil Test (Yield GoalYield Goal N PN PYield GoalYield Goal N P N P 3 Cuttings 1 1 3 Cuttings 1 1
5 225 225 22 5 22 10 44 110 44 1
**Split applications of N and KSplit applications of N and K
rmudagrassrmudagrassiier Recommendationer Recommendation
ppm)ppm) Annual Rate (lbs/A)Annual Rate (lbs/A)KK NN ** PP OO KK OO ** K K N N PP22OO55 KK22O O 1 300 100 300 1 300 100 30075 290 50 15075 290 50 15075 290 50 15075 290 50 150
105 280 25 70105 280 25 70
K.K.

FertilizerFertilizerFertilizer Fertilizer
SpSpSpSpFertilizer N Fertilizer N
Source rate (lb/a) 100Source rate (lb/a) 100Source rate (lb/a) 100Source rate (lb/a) 100
18 18 --18 18 -- 18 55518 555 100100
24 24 -- 8 8 -- 16 417 10016 417 100
SelectionSelectionSelectionSelection
pring rate (lbs/A)pring rate (lbs/A)pring rate (lbs/A)pring rate (lbs/A) P P22OO55 KK22OO CostCost
0 100 1000 100 100 $/acre$/acre0 100 1000 100 100 $/acre$/acre
00 100 100100 100 $68$68
0 33 670 33 67 $51$51

FertilizerFertilizerFertilizer Fertilizer
SpSpSpSpFertilizer N Fertilizer N
Source rate (lb/a)Source rate (lb/a) 100100Source rate (lb/a) Source rate (lb/a) 100100
18 18 --18 18 -- 18 55518 555 100100
24 24 -- 8 8 -- 16 417 10016 417 100
SelectionSelectionSelectionSelection
pring rate (lbs/A)pring rate (lbs/A)pring rate (lbs/A)pring rate (lbs/A) P P22OO55 KK22OO CostCost
0 25 700 25 70 $/acre$/acre0 25 700 25 70 $/acre$/acre
00 100 100100 100 $68$68
0 33 670 33 67 $51$51
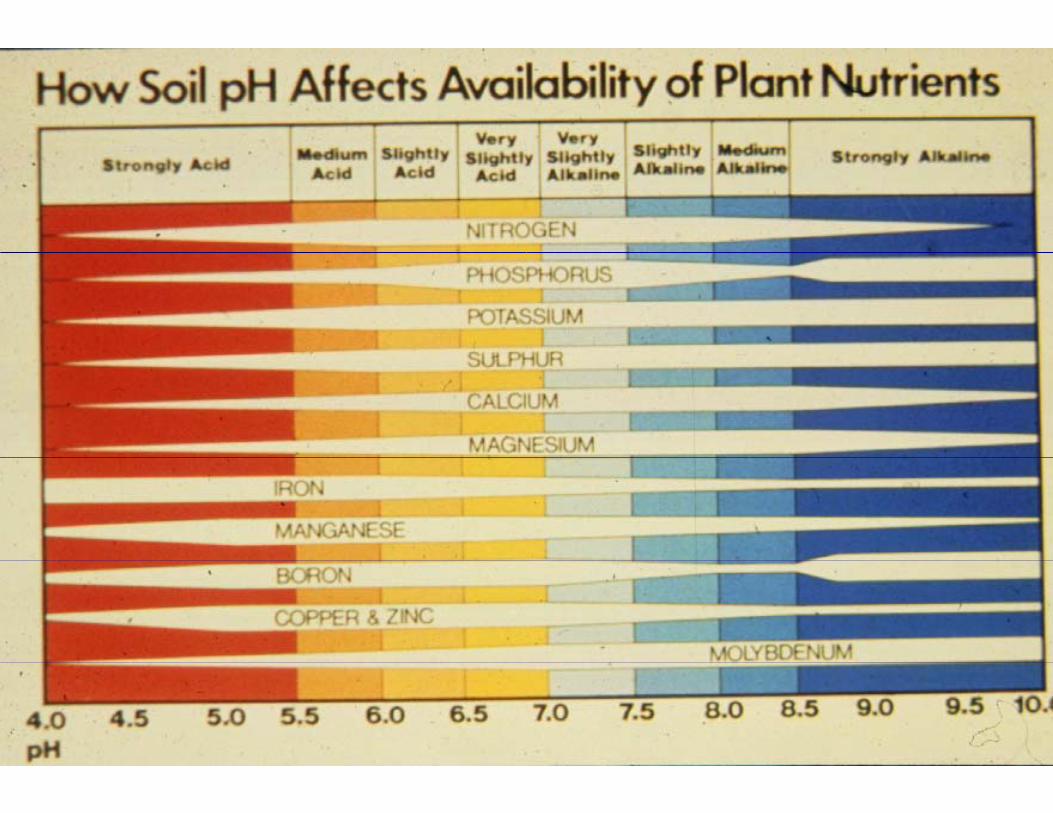

Effect of Soil pH onEffect of Soil pH onEffect of Soil pH onEffect of Soil pH on
pHpH Nitrogen PNitrogen PpHpH Nitrogen PNitrogen P7.07.0 70706.0 6.0 63635.55.5 52525.05.0 38384 54 5 21214.54.5 2121
Below 5.5 can begin to haBelow 5.5 can begin to haggand manganese toxicityand manganese toxicity
n Nutrient Recoveryn Nutrient Recoveryn Nutrient Recoveryn Nutrient Recovery
Phosphorus PotashPhosphorus PotashPhosphorus PotashPhosphorus Potash3030 60601515 60601515 45451010 303088 212188 2121
ave problems with aluminumave problems with aluminumpp
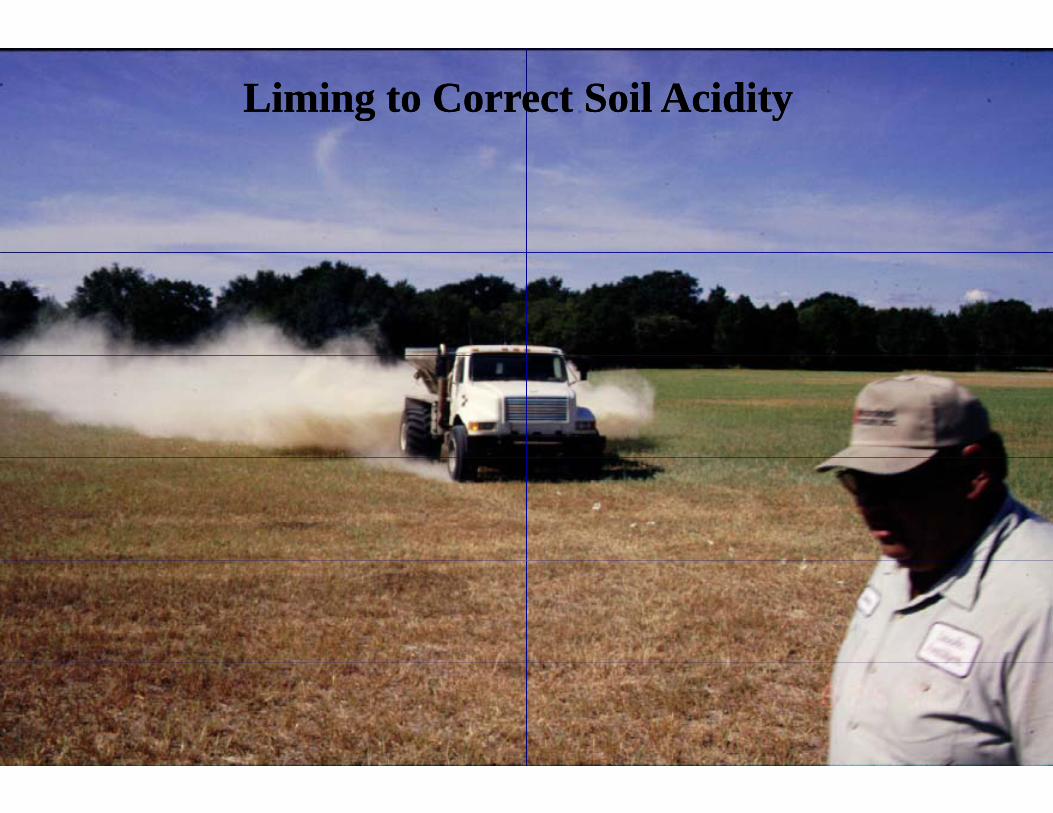
Liming to CorreLiming to Correect Soil Acidityect Soil Acidity

LimestoneLimestoneLimestoneLimestone Neutralizing ValueNeutralizing Value
•• Calcium carbonate equCalcium carbonate equ Particle size (efficiency rParticle size (efficiency r
•• Smaller particles react Smaller particles react •• Fine materials last justFine materials last just
i ti tmixture.mixture.
CCE x ER =CCE x ER = ECCEECCE CCE x ER = CCE x ER = ECCEECCE((EEffective ffective CCalcium alcium CCarar
ee QualityQualitye e QualityQuality
uivalence (CCE)uivalence (CCE)rating, ER)rating, ER)faster and more completely.faster and more completely.
t as long or longer than a t as long or longer than a
bonate bonate EEquivalence)quivalence)
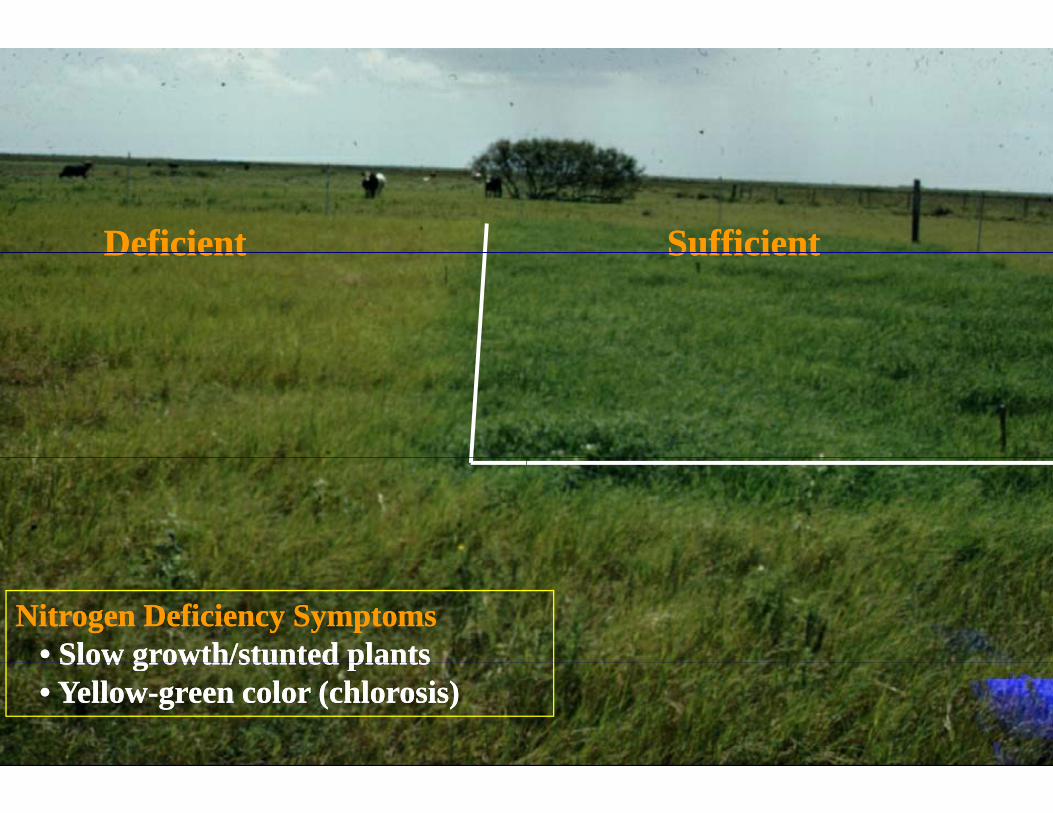
DeficientDeficientDeficientDeficient
Nitrogen Deficiency SymptomsNitrogen Deficiency Symptoms• Slow growth/stunted plants• Slow growth/stunted plants Slow growth/stunted plants Slow growth/stunted plants• Yellow• Yellow--green color (chlorosis)green color (chlorosis)
SufficientSufficientSufficientSufficient

Effect of NitEffect of NitEffect of NitEffect of Niton Yield and Con Yield and C
Annual N Rate Yie(lbs/A) (ton
0 20 100 200
2.4.5.
400 8.
trogen Ratetrogen Ratetrogen Ratetrogen RateCrude ProteinCrude Protein
eld Crude Proteins/A) (%)
7 8 0.7.4 .9
8.0 9.1 10.5
.6 11.7

Nitrogen FNitrogen F
Anhydrous AmmoniaAnhydrous AmmoniaAnhydrous AmmoniaAnhydrous AmmoniaAmmonium NitrateAmmonium NitrateA i S lfA i S lfAmmonium SulfateAmmonium SulfateUreaUreaUrea Ammonium NitrateUrea Ammonium Nitrate* Equally effective if prop* Equally effective if prop Equally effective if prop Equally effective if prop
Fertilizers*Fertilizers*
Formula GradeFormula GradeNHNH33 8282--00--00NHNH33 8282 00 00
NHNH44NONO33 3434--00--00(NH(NH )) SOSO 2020 00 00(NH(NH44))22SOSO4 4 2020--00--00(NH(NH22))22COCO 4646--00--00
3232--00--00perly applied.perly applied.perly applied.perly applied.
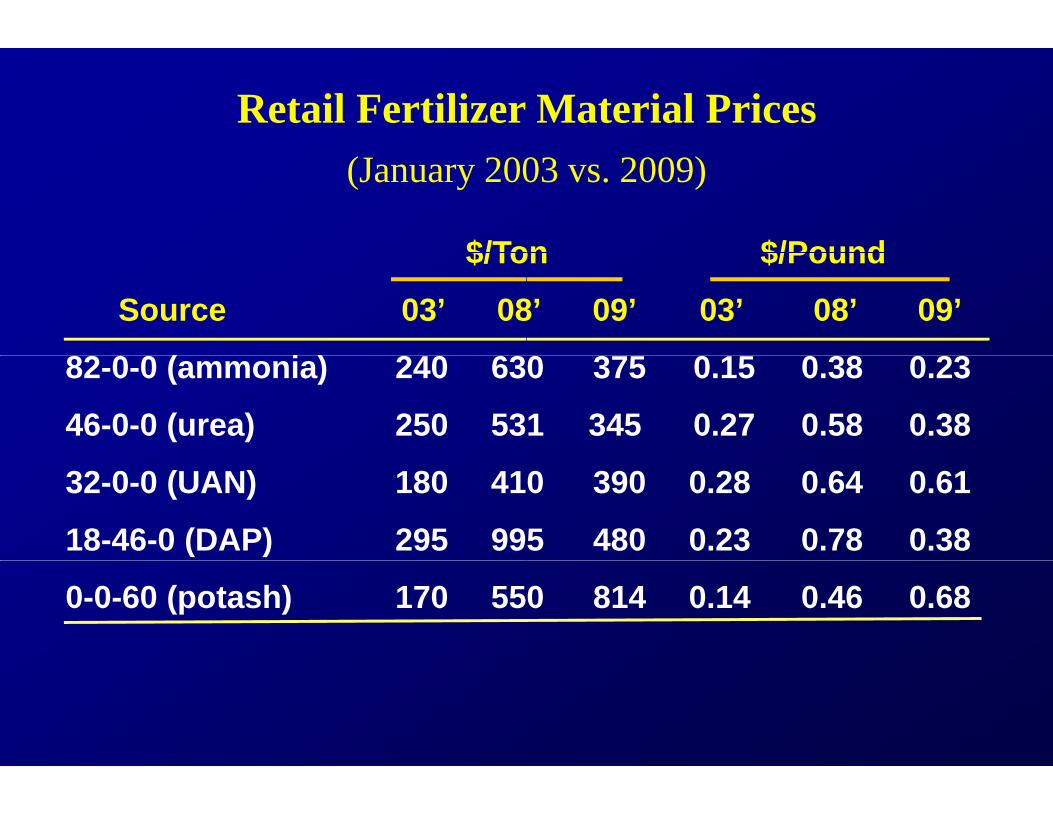
Retail Fertilizer
$/To
(January 200
$/To
Source 03’ 08
82 0 0 ( i ) 240 6382-0-0 (ammonia) 240 63
46-0-0 (urea) 250 53
32-0-0 (UAN) 180 41
18-46-0 (DAP) 295 99
0-0-60 (potash) 170 55
Material Prices
on $/Pound
03 vs. 2009)
on $/Pound
8’ 09’ 03’ 08’ 09’
0 3 0 1 0 38 0 230 375 0.15 0.38 0.23
1 345 0.27 0.58 0.38
0 390 0.28 0.64 0.61
5 480 0.23 0.78 0.38
0 814 0.14 0.46 0.68

Effect of Nitrogen Fg(Lufkin soil, O
Average AfAverage Af
None
A i it tAmmonium nitrate
Ammonium sulfateAmmonium sulfate
0 1
Fertilizer on Soil pHpOverton, Tx.)
fter 3 Yearsfter 3 Years
6.26.2
5.95.9
4.74.74.74.7
2 3 4 5 6 7pH

PhospPhospCh t i tiCh t i tiCharacteristicsCharacteristics
F ti i Pl tF ti i Pl t Si lSi lFunctions in Plant:Functions in Plant: SimulaSimularoot foroot foPromoPromoPromoPromoand quand qu
M t i S ilM t i S il V iV iMovement in Soil:Movement in Soil: Very iVery ivolatilivolatiliSubjecSubjecSubjecSubjecin surfin surfwhen swhen s
phorusphorusd F tid F tis and Functionss and Functions
t l th dt l th dates early growth andates early growth andormation.ormation.otes optimum forage growthotes optimum forage growthotes optimum forage growth otes optimum forage growth uality.uality.
bil ill t l hbil ill t l hmmobile, will not leach or mmobile, will not leach or ize.ize.ct to stratification (buildct to stratification (build--upupct to stratification (buildct to stratification (build upupface 2 to 3 inches of soil)face 2 to 3 inches of soil)surface applied.surface applied.

Dry SurfaceResponse to Deep PResponse to Deep P
DepthDepth
5(ppm(inches)(inches)
00--22222--88
88--14141414--20202020--2626
Wet SurfaceNo Response to Deep PNo Response to Deep P
7m P)
0911

Injected Injected –– 6 inches6 inches Surface AppliedSurface Applied


Phosphorus MPhosphorus Mpp
Establishment:Establishment: Soil test !!Soil test !!
Apply and Apply and fertilizer befertilizer befertilizer befertilizer be
Last chancLast chanc
ManagementManagementgg
incorporate phosphorus incorporate phosphorus efore planting.efore planting.efore planting.efore planting.
e to get it in the e to get it in the root zone.root zone.
PhosphoruPhosphorupp
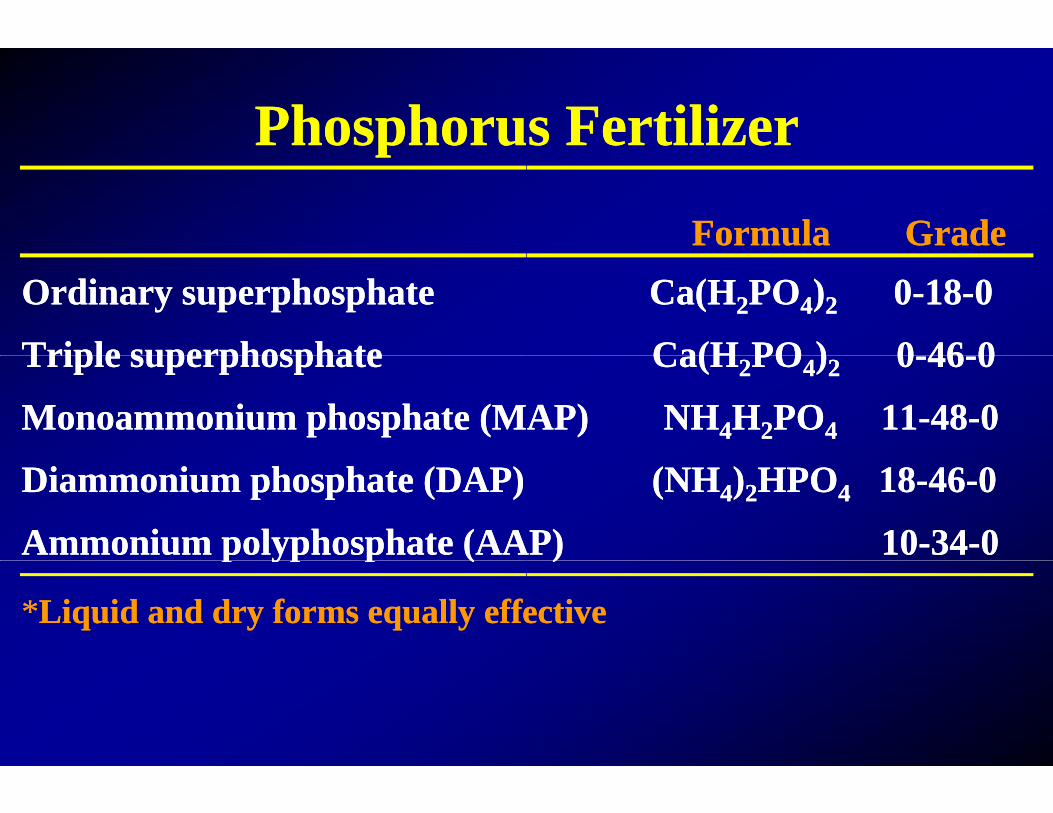
Ordinary superphosphateOrdinary superphosphate
Triple superphosphateTriple superphosphateTriple superphosphateTriple superphosphate
Monoammonium phosphate (MMonoammonium phosphate (M
Diammonium phosphate (DAP)Diammonium phosphate (DAP)
Ammonium polyphosphate (AAAmmonium polyphosphate (AAp yp p (p yp p (
**Liquid and dry forms equally effeLiquid and dry forms equally effe
s Fertilizers Fertilizer
Formula GradeFormula GradeCa(HCa(H22POPO44))22 00--1818--00
Ca(HCa(H POPO )) 00 4646 00Ca(HCa(H22POPO44))22 00--4646--00
AP) NHAP) NH44HH22POPO4 4 1111--4848--00
(NH(NH44))22HPOHPO44 1818--4646--00
AP) 10AP) 10--3434--00))
ectiveective

PotasPotasCh t i tiCh t i tiCharacteristicsCharacteristics
Available Forms: Available Forms: PotassiumPotassium
Functions in Plant: Functions in Plant: Controls sControls sIncreases Increases Improves Improves
Movement in Soil: Movement in Soil: Does not lDoes not lWill not vWill not v
P f lP f lPart of clPart of clclay soils.clay soils.
ssiumssiumd F tid F tis and Functionss and Functions
m ion (K+)m ion (K+)
stomates water use efficiencystomates water use efficiencyyydisease resistancedisease resistancecold hardinesscold hardiness
leach (medium/heavy soils)leach (medium/heavy soils)volatilize.volatilize.
l i ll i l hi h l l ihi h l l ilay minerals lay minerals –– high levels in most high levels in most ..

Potassium DeficiencyPotassium DeficiencyS d d li- Stand decline
- Winter killDi tibilit- Disease susceptibility
- Poor water use efficiency
F tiliF tiliFertiliFertili-- K is lK is l-- SplitSplit
for efor e
i M ti M tizer Managementizer Managementluxury consumedluxury consumed
t/balance applicationst/balance applicationseach cutting (fall?). each cutting (fall?). g ( )g ( )

Sources ofSources of
•• Commercial FertilizerCommercial Fertilizer•• OrganicsOrganics•• OrganicsOrganics
-- ManuresManuresComposted manuresComposted manures-- Composted manuresComposted manures
-- BiosolidsBiosolids
f Nutrientsf Nutrients

Sources ofSources of
•• Selected Commercial FeSelected Commercial Fe•• NN•• NN
-- Anhydrous ammonia, 82Anhydrous ammonia, 82--Urea 46Urea 46 00 00-- Urea, 46Urea, 46--00--00
-- Ammonium nitrate, 33Ammonium nitrate, 33--00A i lf t 21A i lf t 21 00-- Ammonium sulfate, 21Ammonium sulfate, 21--00
-- UNA, 32UNA, 32--00--00
f Nutrientsf Nutrients
ertilizersertilizers
--00--00
--0000 0000--00

Sources ofSources of
•• Selected Commercial FeSelected Commercial Fe•• PP –– diammonium phosphdiammonium phosph•• P P diammonium phosphdiammonium phosph
monoammonium phmonoammonium phl i h hl i h hcalcium phosphates,calcium phosphates,
•• K K –– potassium chloride, potassium chloride,
f Nutrientsf Nutrients
ertilizersertilizershate 18hate 18--4646--00hate, 18hate, 18 4646 00
hosphate, 11hosphate, 11--4848--0000 2020 0 00 0 4545 00, 0, 0--2020--0 to 00 to 0--4545--00KCl, 0KCl, 0--00--6060

Elemental ConcentElemental ConcentElemental ConcentElemental ConcentManMan
Animal N P2O5 K2Animal N P2O5 K2
-------------------
Dairy 1.35 1.24 1.6
Beef 1.36 1.21 1.8Beef 1.36 1.21 1.8
Poultry 3.15 5.52 3.1
Swine 7.6 4.1 3.
Biosolids 5.00 3.50 0.6oso ds 5 00 3 50 0 6
trations in Varioustrations in Varioustrations in Various trations in Various nuresnures
2O Ca Mg Na2O Ca Mg Na
--------%------------------------
64 3.69 0.60 0.24
85 1.43 0.49 0.6785 1.43 0.49 0.67
13 2.98 0.61 0.76
.1 2.6 0.7 0.5
62 2.87 0.26 0.226 8 0 6 0
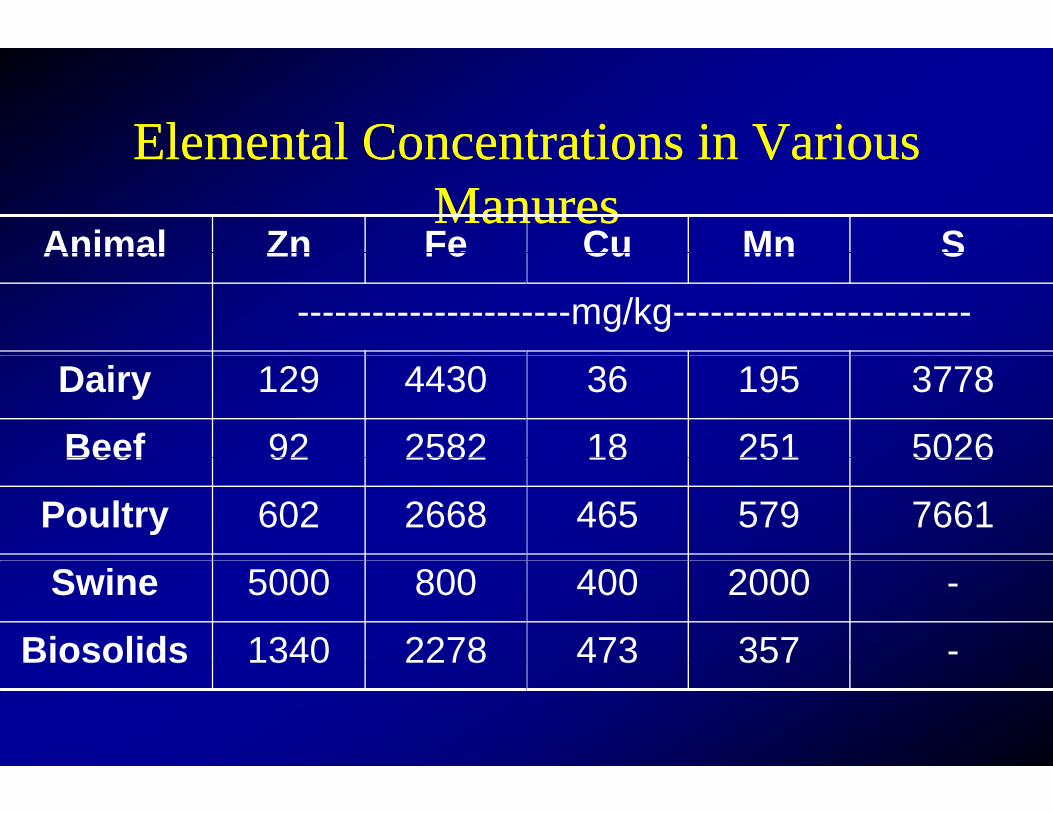
Elemental ConcentElemental ConcentElemental ConcentElemental ConcentManMan
Animal Zn FeAnimal Zn Fe
-------------------
Dairy 129 4430
Beef 92 2582Beef 92 2582
Poultry 602 2668
Swine 5000 800
Biosolids 1340 2278oso ds 3 0 8
trations in Varioustrations in Varioustrations in Various trations in Various nuresnures
Cu Mn SCu Mn S
----mg/kg------------------------
36 195 3778
18 251 502618 251 5026
465 579 7661
400 2000 -
473 357 -3 35

Typical ApplTypical Appl
•• Should always be deterShould always be deter•• BiosolidsBiosolids (Class A)(Class A) –– 1 t1 t•• BiosolidsBiosolids (Class A) (Class A) 1 t1 t•• Poultry litter Poultry litter –– 2 to 3 T/A2 to 3 T/A
C l /D iC l /D i 10 2510 25 TT•• Cattle/Dairy Cattle/Dairy –– 10 to 25 10 to 25 TT
lication Rateslication Rates
rmined by soil testingrmined by soil testingto 2 T/Ato 2 T/Ato 2 T/Ato 2 T/AAAT/AT/AT/AT/A

Delivery oDelivery o
•• Commercial fertilizers Commercial fertilizers --•• BiosolidsBiosolids -- $$3838--46/T46/T•• BiosolidsBiosolids $$3838 46/T46/T•• Poultry litter Poultry litter -- $$88--45/T45/T
C lC l $1$1 2/T 52/T 5•• Cattle Cattle -- $1$1--2/T up to 5 2/T up to 5 mm
f Nutrientsf Nutrients
$50 /A$50 /A
ililmilesmiles

DisadvantageDisadvantage
•• Unwanted seedsUnwanted seeds•• Nutrient amounts not theNutrient amounts not the•• Nutrient amounts not theNutrient amounts not the
over apply some and undover apply some and undTrash etc in manureTrash etc in manure•• Trash, etc. in manureTrash, etc. in manure
•• Slow release of nutrientsSlow release of nutrients
es of Manureses of Manures
e same as plant uptake soe same as plant uptake soe same as plant uptake, so e same as plant uptake, so der apply other nutrientsder apply other nutrients
ss

Advantages Advantages •• Maintains or adds organic mMaintains or adds organic mMaintains or adds organic mMaintains or adds organic m•• Adds all essential plant nutrAdds all essential plant nutr
Sl l f iSl l f i•• Slow release of nutrients, apSlow release of nutrients, ap•• If organic matter is increaseIf organic matter is increase
-- Nutrient cycling increasedNutrient cycling increased-- Soil air and water relationshiSoil air and water relationshi-- Soil aggregation/stability impSoil aggregation/stability imp-- Soil Soil cationcation exchange capacityexchange capacityg p yg p y-- Soil drainage improvedSoil drainage improved
of Manuresof Manuresmatter to the soilmatter to the soilmatter to the soilmatter to the soilrients to the soilrients to the soil
li i i ili i i ipplication timingpplication timingeded
ips improvedips improvedprovedprovedy increasedy increasedyy

Soil Amendment Soil Amendment or SNAKE OIL?or SNAKE OIL?

ReferRefer
•• Compendium of ResearcCompendium of ResearcNonNon--Traditional MateriaTraditional Materia1984. NCR1984. NCR--103 Commi103 CommiExtension Service, IowaExtension Service, Iowa,,
rencerence
ch Reports on Use of ch Reports on Use of als for Crop Production. als for Crop Production. ppittee. Cooperative ittee. Cooperative
a State Universitya State Universityyy

Types of Soil Types of Soil
•• Biological inoculants anBiological inoculants an•• Growth stimulants and rGrowth stimulants and r•• Growth stimulants and rGrowth stimulants and r•• Mineral nutrient sourcesMineral nutrient sources
analysis)analysis)analysis)analysis)•• Soil conditionersSoil conditioners•• Wetting agentsWetting agents•• OthersOthers
AmendmentsAmendments
nd activatorsnd activatorsregulatorsregulatorsregulatorsregulatorss (low volume/low s (low volume/low

Examples of EaExamples of EaAmenAmen
ach Type of Soil ach Type of Soil dmentdment

Biological inoculaBiological inocula
•• AgraAgra--LifeLife•• Genesis IIGenesis II•• Genesis IIGenesis II•• MedinaMedina
Ph h b iPh h b i•• PhosphobacterinPhosphobacterin
ants and activatorsants and activators

Growth StimulantGrowth Stimulant
•• AgroPlusAgroPlus•• CulbacCulbac•• CulbacCulbac•• DinosebDinoseb
S B Pl d S BS B Pl d S B•• Sea Born Plus and Sea BSea Born Plus and Sea B
ts and Regulatorsts and Regulators
B Pl FB Pl FBorn Plus FBorn Plus F

Mineral NutrMineral Nutr
•• BayfloanBayfloan•• HybortiteHybortite•• HybortiteHybortite•• PlenPlen--TT--44
ShSh GG•• ShurShur--GroGro
rient Sourcesrient Sources

Soil ConSoil Con
•• FertilaidFertilaid•• LeonarditeLeonardite•• LeonarditeLeonardite•• WonderlifeWonderlife
HH•• HumateHumate
nditionersnditioners

WettingWetting
•• Basic HBasic H•• SaturallSaturall•• SaturallSaturall•• SolSol--EzEz
TT•• TrazcoTrazco
g Agentsg Agents

OthOth
•• ExtendExtend•• PromesolPromesol•• PromesolPromesol•• SRCSRC--101101
E iE i•• EnagizerEnagizer
herher

Research ComparinResearch Comparinto Commercto Commerc
g Soil Amendments g Soil Amendments ial Fertilizerial Fertilizer

Murdock, Rieck and CuMurdock, Rieck and CuKentucky miKentucky miKentucky, miKentucky, mi
C G Til it Silt LC G Til it Silt LCorn Grown on a Tilsit Silt LoamCorn Grown on a Tilsit Silt LoamMaterial AppliedMaterial Applied RR
AgriserumAgriserum 1 1 M di W tM di W t 11Medina WaterMedina Water 1 1 Super NatentSuper Natent 1 1
NaChursNaChurs 9 9 Fertilizer in rowFertilizer in row 99--11
Fertilizer broadcastFertilizer broadcast 120120--11No FertilizerNo Fertilizer
urtsinger, University of urtsinger, University of d to late 1970d to late 1970d to late 1970d to late 1970
W t KYW t KYm, West KYm, West KYRateRate Average Yield Average Yield
(bu/A)(bu/A)(bu/A)(bu/A)pt/bupt/bu 37.237.2
l/Al/A 31 131 1gal/Agal/A 31.131.1gal/Agal/A 29.529.5gal/Agal/A 29.829.8
1919--9/A9/A 44.444.43030--104/A104/A 119.1119.100 36.236.2
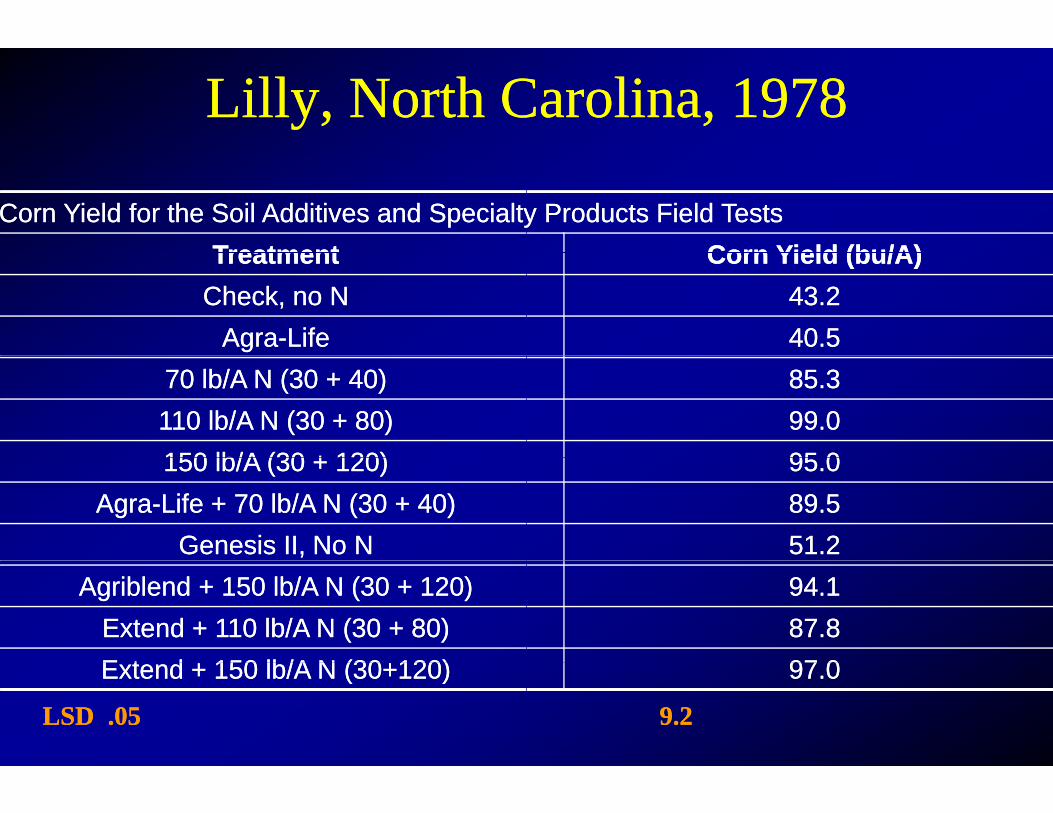
Lilly, North CLilly, North C
Corn Yield for the Soil Additives and SpecialtyCorn Yield for the Soil Additives and SpecialtyTreatmentTreatmentTreatmentTreatment
Check, no NCheck, no NAgraAgra--LifeLife
70 lb/A N (30 + 40)70 lb/A N (30 + 40)110 lb/A N (30 + 80)110 lb/A N (30 + 80)150 lb/A (30 + 120)150 lb/A (30 + 120)150 lb/A (30 + 120)150 lb/A (30 + 120)
AgraAgra--Life + 70 lb/A N (30 + 40)Life + 70 lb/A N (30 + 40)Genesis II, No NGenesis II, No N
Agriblend + 150 lb/A N (30 + 120)Agriblend + 150 lb/A N (30 + 120)Extend + 110 lb/A N (30 + 80)Extend + 110 lb/A N (30 + 80)E t d + 150 lb/A N (30+120)E t d + 150 lb/A N (30+120)Extend + 150 lb/A N (30+120)Extend + 150 lb/A N (30+120)
LSD .05 LSD .05
Carolina, 1978Carolina, 1978
y Products Field Testsy Products Field TestsCorn Yield (bu/A)Corn Yield (bu/A)Corn Yield (bu/A)Corn Yield (bu/A)
43.243.240.540.585.385.399.099.095 095 095.095.089.589.551.251.294.194.187.887.897 097 097.097.0
9.2 9.2

Effects of HuEffects of HuTift 85 BTift 85 BTifton 85 BermTifton 85 Berm
Treatment 200Treatment 200Fertilizer onlyFertilizer only 4.164.16Fertilizer onlyFertilizer only 4.164.16+ 0.5 gal/a HA+ 0.5 gal/a HA 4.184.18+ 1 0 gal/a HA+ 1 0 gal/a HA 3 983 98+ 1.0 gal/a HA+ 1.0 gal/a HA 3.983.98+ 2.0 gal/a HA+ 2.0 gal/a HA 4.24.2+ 3 0 gal/a HA+ 3 0 gal/a HA 4 134 13+ 3.0 gal/a HA+ 3.0 gal/a HA 4.134.13P > FP > F 0.340.34LSD NSLSD NSLSD NSLSD NS
umic Acid onumic Acid ond Yi ldd Yi ldmudagrass Yieldmudagrass YieldYield (bu/A) Yield (bu/A)
03 2004 200503 2004 20056 4.50 4.786 4.50 4.786 4.50 4.786 4.50 4.788 4.26 4.958 4.26 4.958 4 18 4 738 4 18 4 738 4.18 4.738 4.18 4.731 4.39 4.95 1 4.39 4.95 3 4 22 4 893 4 22 4 893 4.22 4.893 4.22 4.8947 0.837 0.62947 0.837 0.629S NS NSS NS NSS NS NSS NS NS

Effects of HuEffects of HuTift 85 BTift 85 BTifton 85 BermTifton 85 Berm
Treatment 200Treatment 200Fertilizer onlyFertilizer only 4.164.16Fertilizer onlyFertilizer only 4.164.16+ 0.5 gal/a HA + 0.5 gal/a HA Not DifNot Dif
+ 1 0 gal/a HA+ 1 0 gal/a HA Not DifNot Dif+ 1.0 gal/a HA + 1.0 gal/a HA Not DifNot Dif
+ 2.0 gal/a HA + 2.0 gal/a HA Not DifNot Dif
+ 3 0 gal/a HA+ 3 0 gal/a HA ifif+ 3.0 gal/a HA + 3.0 gal/a HA Not DifNot Dif
P > FP > F 0.340.34LSD NSLSD NSLSD NSLSD NS
umic Acid onumic Acid ond Yi ldd Yi ldmudagrass Yieldmudagrass YieldYield (bu/A) Yield (bu/A)
03 2004 200503 2004 20056 4.50 4.786 4.50 4.786 4.50 4.786 4.50 4.78fferent Not Different Not Differentfferent Not Different Not Different
fferent Not Different Not Differentfferent Not Different Not Differentfferent Not Different Not Differentfferent Not Different Not Different
fferent Not Different Not Differentfferent Not Different Not Different
ff iff iffff iff ifffferent Not Different Not Differentfferent Not Different Not Different
47 0.837 0.62947 0.837 0.629S NS NSS NS NSS NS NSS NS NS
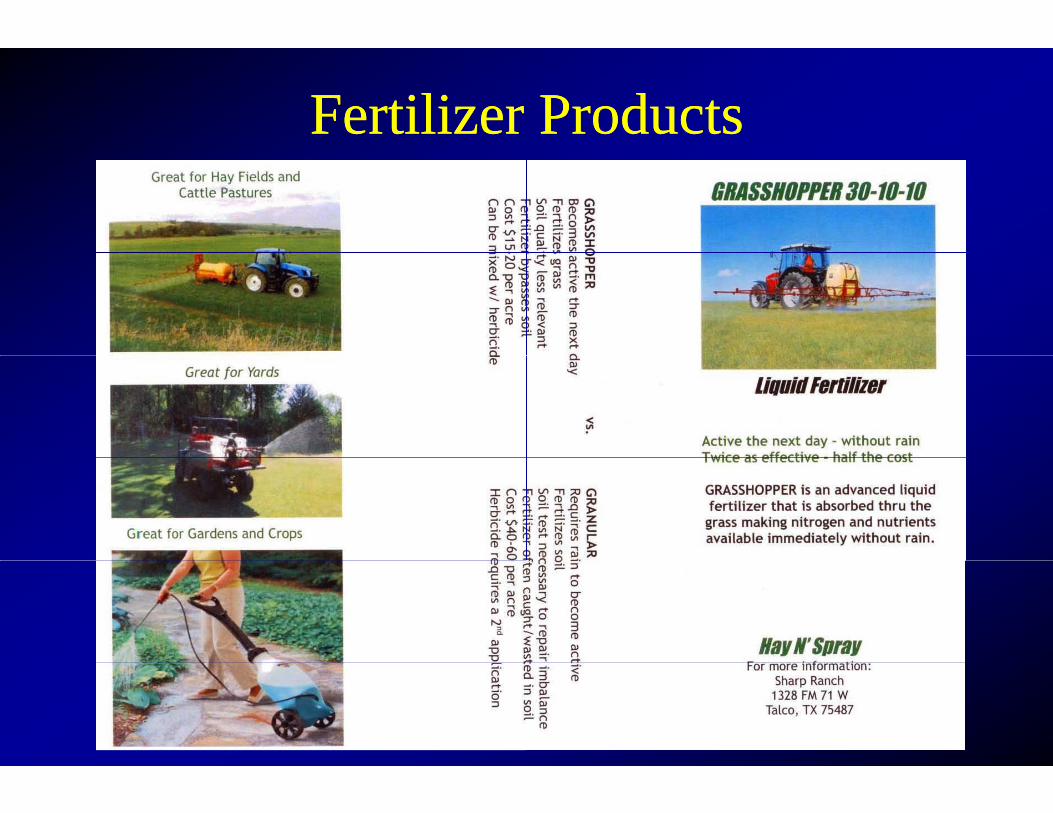
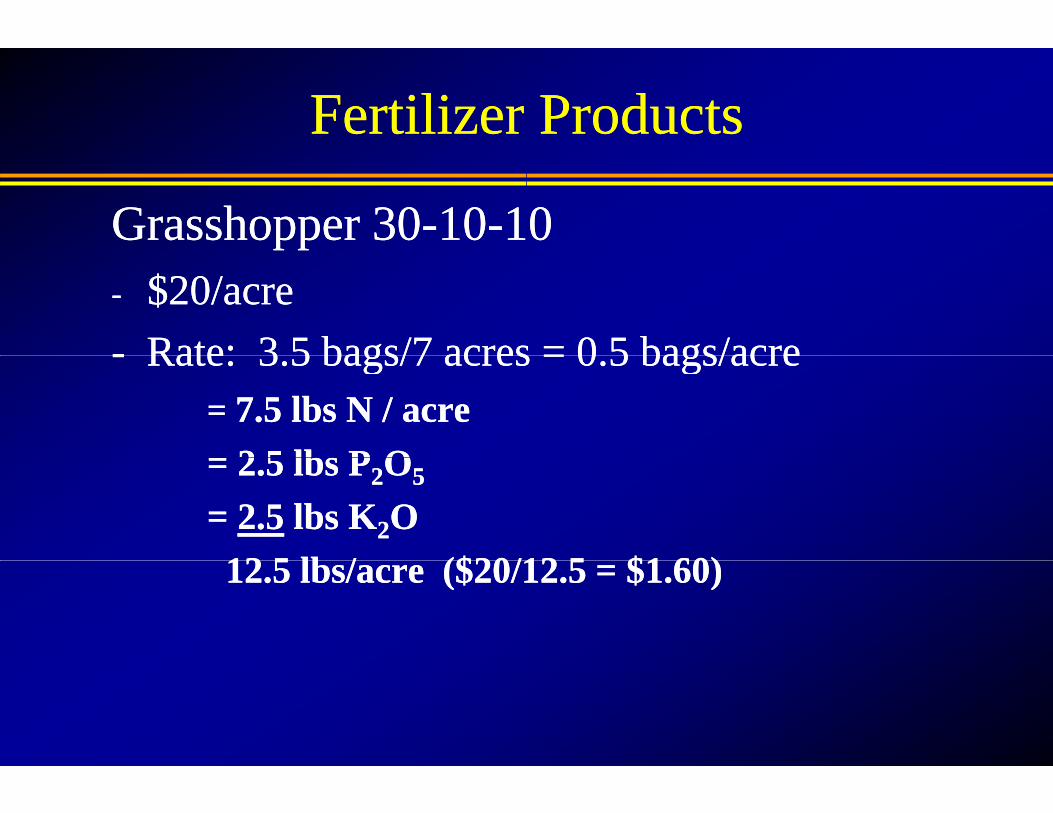
Fertilizer Fertilizer ProductsProducts
Fertilizer Fertilizer
Grasshopper 30Grasshopper 30--1010--11-- $20/acre$20/acre-- Rate: 3 5 bags/7 acresRate: 3 5 bags/7 acres-- Rate: 3.5 bags/7 acresRate: 3.5 bags/7 acres
= = 7.5 lbs N / acre7.5 lbs N / acre2 5 lbs P2 5 lbs P OO= 2.5 lbs P= 2.5 lbs P22OO55
= = 2.52.5 lbs Klbs K22OO12 5 lb / ($20/112 5 lb / ($20/112.5 lbs/acre ($20/112.5 lbs/acre ($20/1
ProductsProducts
00
s = 0 5 bags/acres = 0 5 bags/acres = 0.5 bags/acres = 0.5 bags/acre
12 5 $1 60)12 5 $1 60)12.5 = $1.60)12.5 = $1.60)

Advantages and DisAdvantages and DisAmendAmend
sadvantages of Soil sadvantages of Soil dmentsdments

AdvanAdvan
•• No advantages were fouNo advantages were foutraditional soil amendmetraditional soil amendmein the 1970’s at recommin the 1970’s at recommamendmentsamendments
•• Many of these products Many of these products are available with differeare available with differeare available with differeare available with differe
ntagesntages
und with any of the nonund with any of the non--ents in this 13 state study ents in this 13 state study yy
mended rates of the soil mended rates of the soil
are still available, some are still available, some ent namesent namesent namesent names
DisadvaDisadva
•• No yield increases with tNo yield increases with tamendmentsamendments
•• Some decreased yields aSome decreased yields aTexas has no soil amendTexas has no soil amend•• Texas has no soil amendTexas has no soil amendstates dostates do
antagesantages
the nonthe non--traditional soil traditional soil
at recommended ratesat recommended ratesdment regulations as mostdment regulations as mostdment regulations as most dment regulations as most

Traditional SoiTraditional Soi
•• Manures and Manures and biosolidsbiosolids•• GypsumGypsum•• GypsumGypsum
-- Good source of calcium aGood source of calcium aDoes not change the pH oDoes not change the pH o-- Does not change the pH oDoes not change the pH o
•• Agricultural LimestoneAgricultural LimestoneG d fG d f l il i-- Good source of Good source of calcium acalcium a
-- Increases the pH of the Increases the pH of the soso
il Amendmentsil Amendments
and sulfurand sulfurof the soilof the soilof the soilof the soil
d i id i iand sometimes magnesiumand sometimes magnesiumoiloil
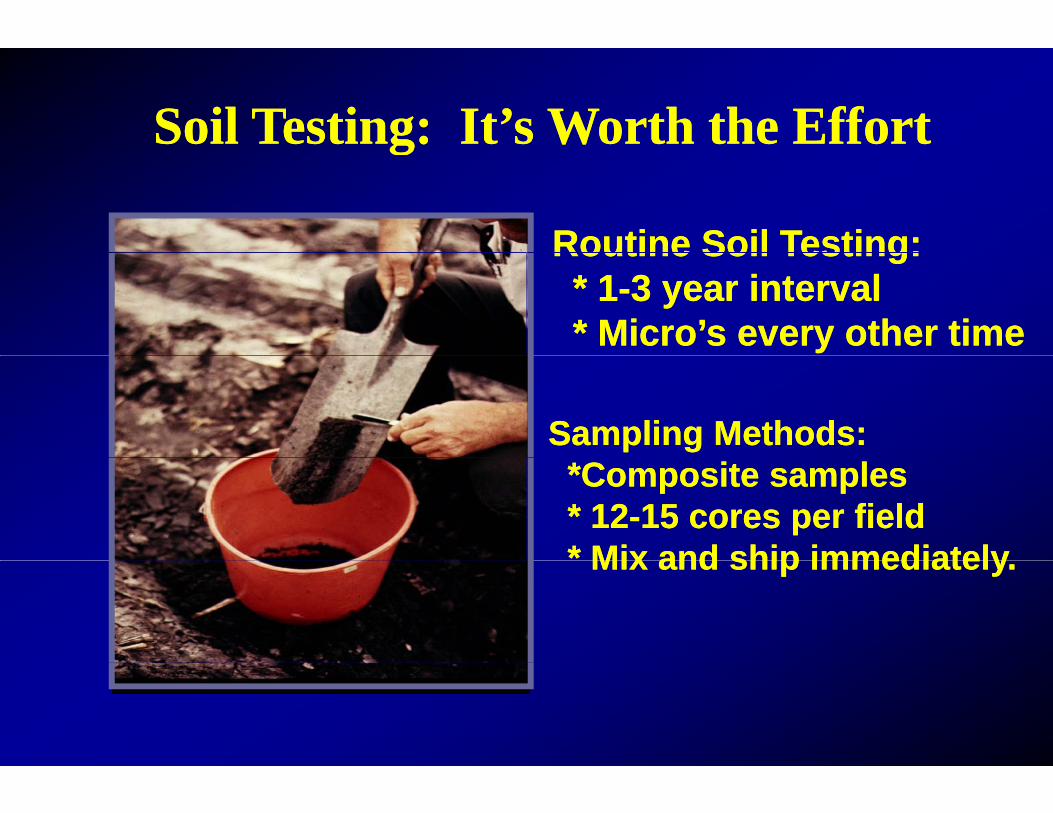
Soil Testing: It’sSoil Testing: It’sgg s Worth the Efforts Worth the Effort
Routine Soil Testing:Routine Soil Testing:Routine Soil Testing:Routine Soil Testing:* 1* 1--3 year interval3 year interval* Micro’s every other time* Micro’s every other time
Sampling Methods:Sampling Methods:*Composite samples*Composite samples* 12* 12--15 cores per field15 cores per field* Mix and ship immediately* Mix and ship immediately Mix and ship immediately. Mix and ship immediately.
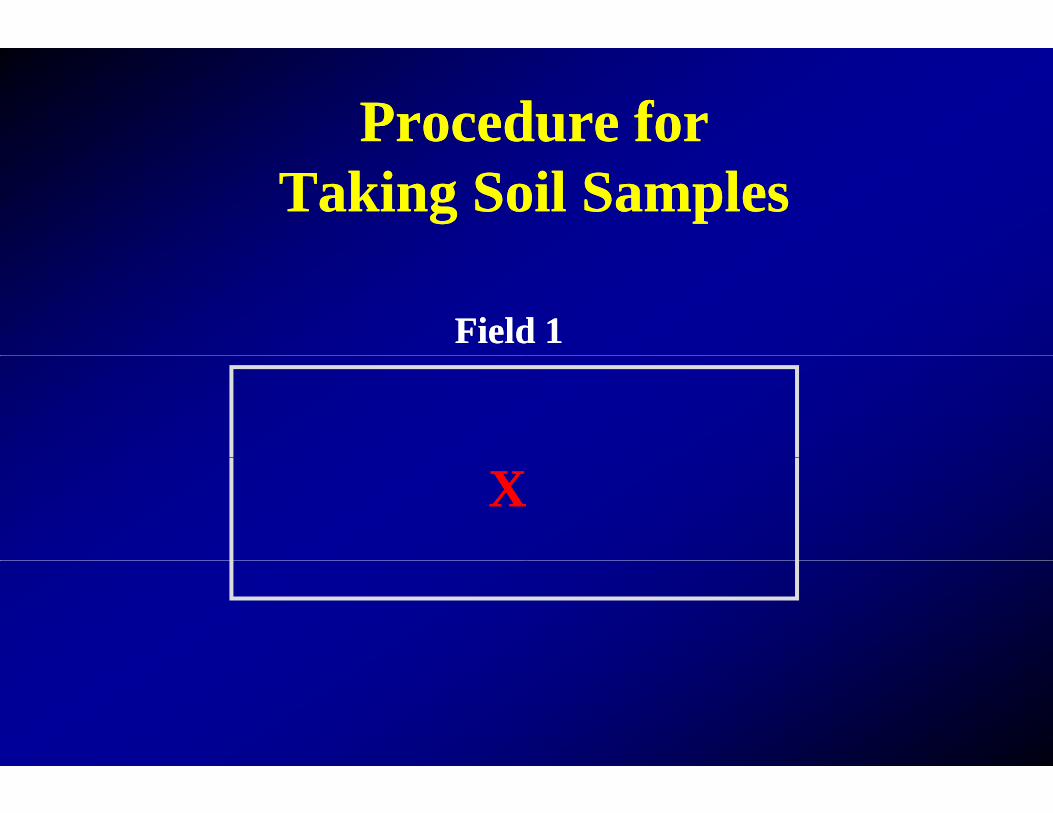
ProcedProcedTaking SoTaking So
FieldField
XX
dure for dure for oil Samplesoil Samples
d 1d 1

ProcedProcedTaking SoTaking So
•• Take 10Take 10--20 cores for each ma20 cores for each ma
Fi ldFi ldFeeding Feeding areaarea
Field Field
XXXX
XX XXareaarea
XXXX XX
XXXX
dure for dure for oil Samplesoil Samplesanagement area.anagement area.
11
XXSandSandPocketPocket
XX
11
XXXX
XX
XX XX
XXXX XX
Low area, drainageLow area, drainage

ProcedProcedTaking SoTaking So
ClayClay Field 1Field 1
XX
XX XX
XXXX
XX XX
dure for dure for oil Samplesoil Samples
SandSand11
XXXX
XX
XXXX
XXXX

RecommeRecomme•• 1. Soil test every 1. Soil test every 1 to 3 1 to 3 years on years on
drylanddrylanddrylanddryland•• 2. Apply nutrients as close to wh2. Apply nutrients as close to wh•• 3. Split apply N and K with all o3. Split apply N and K with all o3. Split apply N and K with all o3. Split apply N and K with all o•• 4. Choose source of nutrients tha4. Choose source of nutrients tha•• 5. Sources of organic nutrients sh5. Sources of organic nutrients shgg
prior to planting and should be inprior to planting and should be inrunoff and N volatilizationrunoff and N volatilization
f i ifi d illf i ifi d ill•• 6. If P is stratified, use tillage to 6. If P is stratified, use tillage to
endationsendationsirrigated and irrigated and 3 to 5 3 to 5 years on years on
hen the crop needs it as possiblehen the crop needs it as possiblef P at first applicationf P at first applicationf P at first applicationf P at first application
at is most economical for youat is most economical for youhould be applied 1 to 3 months hould be applied 1 to 3 months pppp
ncorporated to reduce potential for ncorporated to reduce potential for
i il l i hi il l i hmix soil at least 6 inchesmix soil at least 6 inches

htthtthtthtttp://soilcrop tamu edutp://soilcrop tamu edutp://soilcrop.tamu.edutp://soilcrop.tamu.edu

Effects of Effects of Yi ld f Tift 8Yi ld f Tift 8Yield of Tifton 8Yield of Tifton 8
N rateN rateN rateN rate(lbs./A/cutting) (lbs./A/cutting) 2020
5050 4 74 750 50 4.74.7
75 75 6.16.1100100 6.76.7125125 7.47.4125125 7.47.4150 150 -- --
N Rate onN Rate on5 B d5 B d5 Bermudagrass5 Bermudagrass
Tons/AcreTons/AcreTons/AcreTons/Acre01 2002 01 2002 20032003
1 d1 d 3 15 c3 15 c 3 07 c3 07 c1 d 1 d 3.15 c3.15 c 3.07 c3.07 c
4 c 4 c 5.18 b 5.18 b 4.03 b4.03 b8 b 8 b 6.32 a 6.32 a 4.15 ab 4.15 ab 3 a3 a 6.47 a 4.49 a6.47 a 4.49 a3 a 3 a 6.47 a 4.49 a6.47 a 4.49 a-- -- -- 4.53 a4.53 a
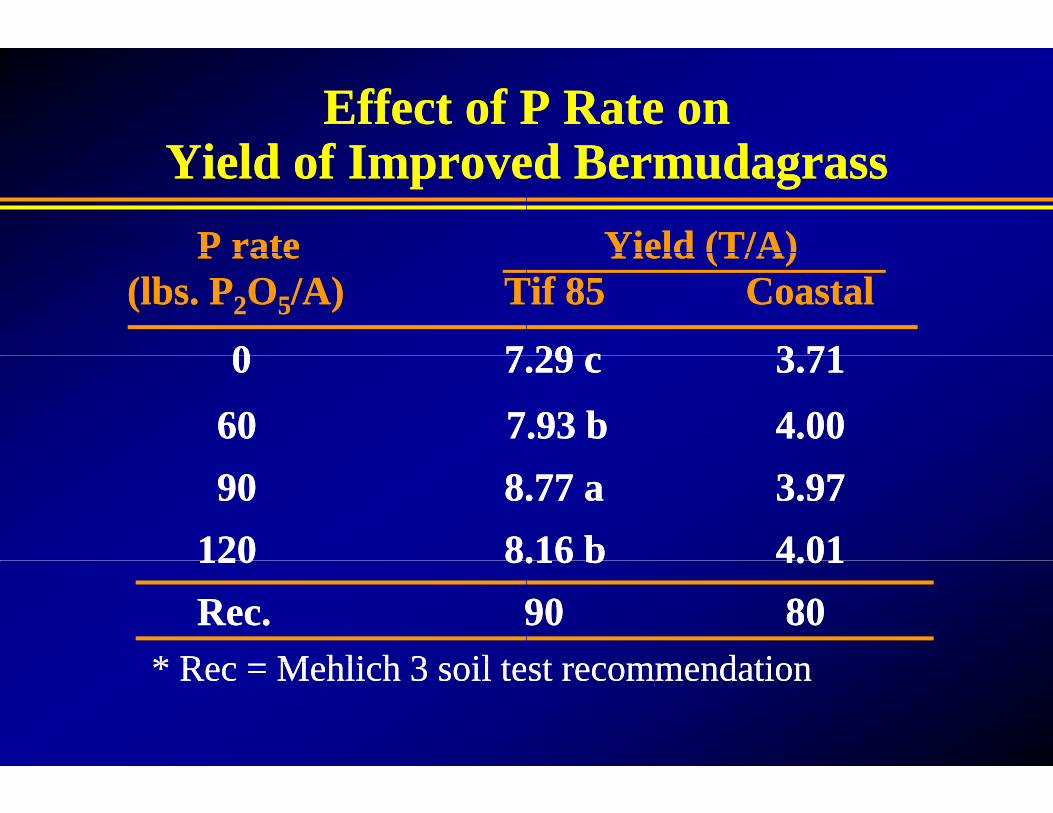
Effect of PEffect of PYi ld f IYi ld f IYield of ImproveYield of Improve
P rateP rateP rateP rate(lbs. P(lbs. P22OO55/A) /A) TT
00 770 0 7.7.
60 760 79090 8.8.
120120 8.8.120120 8.8.Rec.Rec. 99
* R M hli h 3 il t* R M hli h 3 il t* Rec = Mehlich 3 soil te* Rec = Mehlich 3 soil te
P Rate onP Rate ond B dd B ded Bermudagrassed Bermudagrass
Yield (T/A)Yield (T/A)Yield (T/A)Yield (T/A)Tif 85Tif 85 CoastalCoastal
29 c29 c 3 713 71.29 c .29 c 3.71 3.71
.93 b.93 b 4.004.00
.77 a.77 a 3.973.97
.16 b.16 b 4.014.01.16 b.16 b 4.014.019090 8080t d tit d tist recommendationst recommendation