silicon motion technology corporation
TRANSCRIPT

SILICON MOTION TECHNOLOGY CORPORATIONAnnual Report 2013

Financial Highlights
ContentsFinancial Highlights
Letter to Shareholders
About Silicon Motion
Form 20-F
Directors and Executives
01
02
04
Product Mix% of Net Sales (2013)
Mobile Storage
Mobile Communications
Others
82 %
14 %
4 %
Net SalesUS$ million
2009
2010
2011
2012
2013
89
133
224
281
225

01
Diluted Earnings per ADSUS$
2009
2010
2011
2012
2013
- 2.54
- 0.18
1.28
1.40
0.81
Gross Margin% of Net Sales
2009
2010
2011
2012
2013
41%
47%
48%
47%
47%

Letter to Shareholders
2013 was a transitional year for Silicon Motion as sales of removable storage controllers for mature card
and USB flash drive markets declined while sales of SSD plus embedded storage controllers, especially for
eMMC growth markets, grew rapidly. 2013 was also a transitional year for our LTE transceiver products as the
market quickly moved to the significantly enhanced LTE-Advanced standard. While the negative effects of
the transitions were dramatic from the perspective of revenue and profitability, we believe we have built a
strong foundation for renewed, long-term growth by focusing on eMMC, SSD, and other embedded storage
applications and are confident this will lead to strong growth in upcoming years.
In 2013, sales of our SSD plus embedded products grew almost 100% year-over-year to account for almost
half of our Mobile Storage sales. Sales of eMMC controllers, our largest SSD plus embedded product, are now
already larger than our card and USB flash drive controllers sales, and account for roughly a third of our total
revenue. Our eMMC controllers are designed for both SK Hynix and Samsung eMMC solutions and account
for 15 to 20% of the overall eMMC controller market. Last year, our two NAND flash partners supplied
eMMCs with our controllers to 8 out of the top 10 non-iOS smartphone OEMs for both their flagship and
other devices, to leading Android and Windows tablet OEMs, and for other applications such as game
consoles, set-top-boxes, smart TVs, and automotive infotainment systems. We have been expanding our
engineering resources, and have added a third NAND flash partner that will focus on TLC NAND eMMC
solutions, with sales to begin in the first quarter of 2014. We expect the eMMC market to continue growing
rapidly in 2014 and believe we are very well positioned to grow our eMMC sales well in excess of market
growth next year.
Dear Shareholders,
02

Sincerely,
Wallace KouPresident & Chief Executive Officer
03
We have also been expanding our R&D resources to support our many SSD controller initiatives. Our first
SATA 3 client SSD controller began commercial sampling in mid-2013, has been receiving very positive
third-party reviews, and should contribute material revenue in 2014. We will introduce a SATA 3 client SSD
controller to support TLC NAND flash in 2014 and our first PCIe SSD controller in late 2014 or early 2015. We
have been marketing our SSD controllers to NAND flash vendors, other OEMs, and module makers and believe
the success of our SSD controller market roll-out is important for our long-term growth.
Sales of our older LTE transceiver parts declined throughout 2013. In the second half of 2013, we
introduced a new LTE-Advanced transceiver for pairing with Samsung’s new LTE-Advanced baseband. This
new LTE-Advanced chipset will complete testing at Samsung in early 2014 and enter production soon
afterwards.
While our revenue and profitability declined in 2013, we believe this setback is temporary as we transition
our controller business from mature removable storage applications to long-term SSD plus embedded growth
opportunities, and we believe we are on track to grow again in 2014. Once again, I want to thank our
customers, employees and shareholders for their continued support.

We are a fabless semiconductor company that designs, develops and markets high performance, low-power semiconductor
solutions to OEMs and other customers in the mobile storage and mobile communications markets. For the mobile storage
market, our key products are microcontrollers used in solid state storage devices such as SSDs, eMMCs and other embedded
flash applications, as well as removable storage products. For the mobile communications market, our key products are
handset transceivers and mobile TV IC solutions. Our products are widely used in smartphones, tablets, and industrial and
commercial applications. For further information on Silicon Motion, visit www.siliconmotion.com.
Mobile Storage Market
More NAND flash products, especially next
generation flash, whether produced by
Samsung, SanDisk, Toshiba, Micron or SK Hynix
are supported by Silicon Motion controllers than
any other company. Silicon Motion is the
leading merchant supplier of controllers for
eMMC embedded memory used in smartphones
and tablets and is increasingly focused on client
SSD controllers for PCs and other applications.
We market our Mobile Storage products under
the “SMI” brand.
Mobile Communications Market
We are the dedicated provider of 4G LTE transceiv-
ers for Samsung’s smartphones and tablets and are
a leading provider of mobile TV SoCs. We market
our Mobile Communications products under the
“FCI” brand.
About Silicon Motion
04

UNITED STATESSECURITIES AND EXCHANGE COMMISSION
Washington, D.C. 20549
FORM 20-F‘ REGISTRATION STATEMENT PURSUANT TO SECTION 12(b) OR (g) OF THE
SECURITIES EXCHANGE ACT OF 1934OR
È ANNUAL REPORT PURSUANT TO SECTION 13 OR 15(d) OF THESECURITIES EXCHANGE ACT OF 1934
For the fiscal year ended December 31, 2013OR
‘ TRANSITION REPORT PURSUANT TO SECTION 13 OR 15(d) OF THESECURITIES EXCHANGE ACT OF 1934
OR‘ SHELL COMPANY REPORT PURSUANT TO SECTION 13 OR 15(d) OF THE
SECURITIES EXCHANGE ACT OF 1934Date of event requiring this shell company report: N/A
For the transition period from toCommission file number: 000-51380
Silicon Motion Technology Corporation(Exact name of Registrant as specified in its charter)
Cayman Islands(Jurisdiction of incorporation or organization)
8F-1, No. 36, Taiyuan St.,Jhubei City, Hsinchu County 302
TaiwanTel: +886 3 552 6888Fax: + 886 3 560 0336
(Address of principal executive offices)
Securities registered or to be registered pursuant to Section 12(b) of the Act:Title of each class Name of each exchange on which registered
Ordinary shares, par value US$0.01 per share*American Depositary Shares, each representing
four ordinary shares
Nasdaq Global Select Market
* Not for trading, but only in connection with the listing on the Nasdaq Global Select Market of American Depositary Shares, orADSs, each representing four ordinary shares.
Securities registered or to be registered pursuant to Section 12(g) of the Act:None
Securities registered or to be registered pursuant to Section 15(d) of the Act:None
Indicate the number of outstanding shares of each of the issuer’s classes of capital or common stock as of the close of the period covered by the annual report:131,630,180 ordinary shares as of December 31, 2013, US$0.01 par value per share.
Indicate by check mark if the registrant is a well-known seasoned issuer, as defined in Rule 405 of the Securities Act. Yes ‘ No È
If this report is an annual or transition report, indicate by check mark if the registrant is not required to file reports pursuant to Section 13 or Section 15(d) of theAct. Yes ‘ No È
Indicate by check mark whether the registrant (1) has filed all reports required to be filed by Sections 13 or 15(d) of the Securities Exchange Act of 1934 duringthe preceding 12 months (or for such shorter period that the registrant was required to file such reports), and (2) has been subject to such filing requirements for thepast 90 days. Yes È No ‘
Indicate by check mark whether the registrant has submitted electronically and posted on its corporate Web site, if any, every Interactive Data File required to besubmitted and posted pursuant to Rule 405 of Regulation S-T (§232.405 of this chapter) during the preceding 12 months (or for such shorter period that the registrantwas required to submit and post such files). Yes È No ‘
Indicate by check mark whether the registrant is a large accelerated filer, an accelerated filer, or a non-accelerated filed. See definition of “accelerated filer andlarge accelerated filer” in Rule 12b-2 of the Exchange Act. (Check one):
Large accelerated filer ‘ Accelerated filer È Non-accelerated filer ‘
Indicate by check mark which basis of accounting the registrant has used to prepare the financial statements included in this filing:U.S. GAAP È International Financial Reporting Standards as issued
by the International Accounting Standards Board ‘Other ‘
If “Other” has been checked in response to the previous question, indicate by check mark which financial statement item the registrant has elected tofollow. ‘ Item 17 ‘ Item 18
If this is an annual report, indicate by check mark whether the registrant is a shell company (as defined in Rule 12b-2 of the Act): Yes ‘ No È

TABLE OF CONTENTS
PART I 1ITEM 1. IDENTITY OF DIRECTORS, SENIOR MANAGEMENT AND ADVISERS 1ITEM 2. OFFER STATISTICS AND EXPECTED TIMETABLE 1ITEM 3. KEY INFORMATION 1ITEM 4. INFORMATION ON THE COMPANY 16ITEM 4A. UNRESOLVED STAFF COMMENTS 23ITEM 5. OPERATING AND FINANCIAL REVIEW AND PROSPECTS 23ITEM 6. DIRECTORS, SENIOR MANAGEMENT AND EMPLOYEES 40ITEM 7. MAJOR SHAREHOLDERS AND RELATED PARTY TRANSACTIONS 48ITEM 8. FINANCIAL INFORMATION 48ITEM 9. THE OFFER AND LISTING 50ITEM 10. ADDITIONAL INFORMATION 50ITEM 11. QUANTITATIVE AND QUALITATIVE DISCLOSURES ABOUT MARKET RISK 55ITEM 12. DESCRIPTION OF SECURITIES OTHER THAN EQUITY SECURITIES 56
PART II 57ITEM 13. DEFAULTS, DIVIDEND ARREARAGES AND DELINQUENCIES 57ITEM 14. MATERIAL MODIFICATIONS TO THE RIGHTS OF SECURITY HOLDERS AND USE OF
PROCEEDS 57ITEM 15. CONTROLS AND PROCEDURES 57ITEM 16A. AUDIT COMMITTEE FINANCIAL EXPERT 60ITEM 16B. CODE OF ETHICS 60ITEM 16C. PRINCIPAL ACCOUNTANT FEES AND SERVICES 60ITEM 16D. EXEMPTIONS FROM THE LISTING STANDARDS FOR AUDIT COMMITTEES 60ITEM 16E. PURCHASES OF EQUITY SECURITIES BY THE ISSUER AND AFFILIATED PURCHASERS 61ITEM 16F. CHANGE IN REGISTRANT’S CERTIFYING ACCOUNTANT 61ITEM 16G. CORPORATE GOVERNANCE 61
PART III 62ITEM 17. FINANCIAL STATEMENTS 62ITEM 18. FINANCIAL STATEMENTS 62ITEM 19. EXHIBITS 62
i

CONVENTIONS THAT APPLY TO THIS ANNUAL REPORT
Unless otherwise indicated, references in this annual report to:
• “ADRs” are to the American depositary receipts that evidence our ADSs;
• “ADSs” are to our American depositary shares, each of which represents four of our ordinary shares;
• “CAGR” are to compound annual growth rate;
• “China” or “PRC” are to the People’s Republic of China excluding the special administrative regionsof Hong Kong and Macau;
• “Korea” are to the Republic of Korea, or South Korea;
• “Korea Won” are to the legal currency of South Korea;
• “Nasdaq” are to the Nasdaq Stock Market;
• “NT dollar,” “NT dollars” or “NT$” are to New Taiwan dollars, the legal currency of Taiwan;
• “ROC” or “Taiwan” are to Taiwan, the Republic of China, the official name of Taiwan;
• “shares” or “ordinary shares” are to our ordinary shares, with par value US$0.01 per share;
• “U.S. GAAP” are to generally accepted accounting principles in the United States;
• “U.S. dollar,” “U.S. dollars” or “US$” are to United States dollars, the legal currency of theUnited States; and
• “we,” “us,” “our company,” “our,” “SMTC” and “Silicon Motion” are to Silicon Motion TechnologyCorporation, its predecessor entities and subsidiaries including but not limited to (i) Silicon Motion,Inc., incorporated in Taiwan, or SMI Taiwan, and formerly known as Feiya Technology Corporation,(ii) Silicon Motion, Inc., a California, USA, corporation, or SMI USA, and (iii) FCI Inc., incorporatedin Korea, or FCI.
Silicon Motion, the Silicon Motion logo, FCI, the FCI logo, airRF, basicRF, ezRF, ezSYS, powerRF,twinRF, zipRF, zipSYS, SSDLifeGuard, SSDLifeSaver, TurboMLC, FerriSSD and Ferri-eMMC are ourtrademarks or registered trademarks. We may also refer to trademarks of other corporations and organizations inthis document.
Unless otherwise indicated, our financial information presented in this annual report has been prepared inaccordance with U.S. GAAP.
ii

SPECIAL NOTE REGARDING FORWARD-LOOKING STATEMENTS
This annual report contains forward-looking statements. These forward-looking statements includestatements regarding our financial position; our expectations concerning future operations, margins, profitability,liquidity and capital resources; our business strategy and other plans and objectives for future operations; and allother statements that are not historical facts. In some cases, you can identify forward-looking statements byterminology such as “may,” “will,” “should,” “expects,” “intends,” “plans,” “anticipates,” “believes,” “thinks,”“estimates,” “seeks,” “predicts,” “potential,” and similar expressions. Although we believe that these statementsare based on reasonable assumptions, they are subject to numerous factors, risks and uncertainties that couldcause actual outcomes and results to be materially different from those projected. These factors, risks anduncertainties include those listed under “Risk Factors” and elsewhere in this annual report. Those factors, amongothers, could cause our actual results and performance to differ materially from the results and performanceprojected in, or implied by, the forward-looking statements. They include:
• unpredictable volume and timing of customer orders, which are not fixed by contract but vary on apurchase order basis;
• the loss of one or more key customers or the significant reduction, postponement, rescheduling orcancellation of orders from these customers;
• general economic conditions or conditions in the semiconductor or consumer electronics market;
• decreases in the overall average selling prices of our products;
• changes in the relative sales mix of our products;
• changes in our cost of finished goods;
• the availability, pricing and timeliness of delivery of other components and raw materials used in ourcustomers’ products;
• our customers’ financial health, sales outlook, purchasing patterns and inventory adjustments based onconsumer demand, market adoption of new technologies and general economic conditions;
• our ability to successfully develop, introduce and sell innovative, new or enhanced products in a timelymanner; and
• the timing of new product announcements or introductions by us or by our competitors.
One or more of these factors could materially and adversely affect our operating results and financialcondition in future periods. We cannot assure you that we will attain any meaningful estimates or maintainprofitability or that the assumptions on which they are based are reliable.
Except as required by law, we undertake no obligation to update or revise publicly any forward-lookingstatements, whether as a result of new information, future events or otherwise after the date of this annual report.All forward-looking statements contained in this annual report are qualified by reference to this cautionarystatement. As you read and consider this annual report, you should carefully understand that the forward-lookingstatements are not guarantees of performance or results.
iii

PART I
ITEM 1. IDENTITY OF DIRECTORS, SENIOR MANAGEMENT AND ADVISERS
Not applicable.
ITEM 2. OFFER STATISTICS AND EXPECTED TIMETABLE
Not applicable.
ITEM 3. KEY INFORMATION
Selected Consolidated Financial Data
You should read the following information with our consolidated financial statements and related notes and“Item 5. Operating and Financial Review and Prospects” included elsewhere in this annual report.
The selected consolidated statements of income and cash flow data for the years ended December 31, 2011,2012 and 2013 and the selected consolidated balance sheet data as of December 31, 2012 and 2013 are derivedfrom our audited consolidated financial statements included elsewhere in this annual report and should be read inconjunction with, and are qualified in their entirety by reference to, these consolidated financial statements andrelated notes. The selected consolidated statements of income and cash flow data for the years endedDecember 31, 2009 and 2010 and the selected consolidated balance sheet data as of December 31, 2009, 2010and 2011 are derived from our audited consolidated financial statements which are not included in this annualreport. These consolidated financial statements are prepared in accordance with U.S. GAAP.
Effective January 1, 2012, we changed the reporting currency of our consolidated financial statements fromthe NT dollar to the U.S. dollar because of a change in the functional currency of our largest subsidiary, SMITaiwan. The business profile of SMI Taiwan had changed because the primary factors affecting business are nowinternational in nature and the majority of cash flow are now U.S. dollar denominated. We believe that thischange provides greater alignment of our reporting currency with our most significant functional currency andunderlying financial performance. Unless otherwise specified, all financial information included in thisForm 20-F has been stated in U.S. dollars.
Year Ended December 31,
2009 2010 2011 2012 2013
US$ US$ US$ US$ US$(in thousands, except for per share data)
Consolidated Statements of Income Data:Net sales 88,540 132,793 223,845 281,370 225,308Cost of sales 52,173 70,605 115,806 149,650 118,698
Gross profit 36,367 62,188 108,039 131,720 106,610Operating expenses (income):Research and development 34,354 33,772 40,501 50,975 46,460Sales and marketing 12,108 11,936 14,537 15,919 13,597General and administrative 14,221 9,652 11,323 12,156 11,250Amortization of intangible assets 5,784 2,081 694 — —Impairment of goodwill and long-lived assets (1) 37,398 — — — —Gain from settlement of litigation (2) — (1,273) — — —
Total operating expenses 103,865 56,168 67,055 79,050 71,307
Operating income (loss) (67,498) 6,020 40,984 52,670 35,303
1

Year Ended December 31,
2009 2010 2011 2012 2013
US$ US$ US$ US$ US$(in thousands, except for per share data)
Total non-operating income (loss) (2,495) (11,777) 6,232 1,664 1,845Income (Loss) before income taxes (69,993) (5,757) 47,216 54,334 37,148Income tax expense (benefit) 242 (519) 5,747 7,116 9,772
Net income (loss) (70,235) (5,238) 41,469 47,218 27,376
Weighted average shares outstanding:Basic 110,694 116,159 123,082 129,259 132,259
Diluted 110,694 116,159 129,370 134,504 134,567
Earnings (Loss) per share:Basic (0.63) (0.05) 0.34 0.37 0.21
Diluted (0.63) (0.05) 0.32 0.35 0.20
Earnings (Loss) per ADS (3):Basic (2.54) (0.18) 1.35 1.46 0.83
Diluted (2.54) (0.18) 1.28 1.40 0.81
(1) Impairment of goodwill and long-lived assets relating to FCI and Centronix (selected parts of Centronixmobile TV business of Korea Information Engineering Services Co., Ltd.) acquisitions.
(2) Gain from favorable settlements of litigation with Advanced Semiconductor Engineering Inc. in 2010.(3) Each ADS represents four ordinary shares.
As of December 31,
2009 2010 2011 2012 2013
US$ US$ US$ US$ US$(in thousands)
Consolidated Balance Sheet Data:Cash and cash equivalents 61,006 53,889 88,763 154,734 161,720Other current assets 36,167 63,211 90,817 103,678 84,819Working capital 72,634 89,333 136,856 202,015 205,872Long-term investments 491 185 178 178 133Property and equipment, net 24,171 25,507 24,728 23,386 30,195Goodwill and intangible assets, net 38,077 35,996 35,458 35,472 35,474Other non-current assets 8,153 8,716 7,382 4,298 4,422Total assets 168,065 187,504 247,326 321,746 316,763Total liabilities 28,315 30,143 45,826 59,480 46,066Total shareholders’ equity 139,750 157,361 201,500 262,266 270,697
Consolidated Cash Flow Data:Net cash provided by (used in) operating activities 9,456 (11,987) 54,261 69,236 49,128Net cash provided by (used in) investing activities (1,486) (9,894) (13,947) (4,749) (12,815)Net cash provided by (used in) financing activities 556 — 2,294 224 (29,493)Depreciation and amortization 5,011 4,775 5,580 5,881 6,429Capital expenditures (3,053) (4,339) (4,916) (4,280) (12,772)
2

Risk Factors
Because our operating results for any period could be adversely affected by a number of factors and maytherefore fluctuate significantly, our annual and quarterly operating results are difficult to predict.
Our operating results have fluctuated in the past and could do so in the future. Fluctuations in our operatingresults may be due to a number of factors, including, but not limited to, those listed below and those identifiedthroughout this “Risk Factors” section:
• continuing downward pressure on the average selling prices of our products caused by intensecompetition in our industry;
• decreases in demand for consumer electronics products, including smartphones and tablets, into whichour semiconductor solutions are directly or indirectly incorporated;
• our customers’ financial health, sales outlook, purchasing patterns and inventory adjustments based onconsumer demand, market adoption of new technologies and general economic conditions;
• the loss of one or more key customers or the significant reduction, postponement, rescheduling orcancellation of orders from these customers;
• changes in the seasonality of our sales, which generally has a tendency toward increased sales in thesecond half of each year;
• our ability to develop or acquire, introduce, market and transition to volume production new orenhanced products and technologies in a cost-effective and timely manner;
• changes in supply and availability of flash memory from educations in fab capacity and fabs operatingat lower utilization rates;
• changes in the relative sales mix of our products;
• changes in foreign currency exchange rates;
• the availability and pricing of third party semiconductor foundry, assembly and test capacity and rawmaterials, as well as other changes in our cost of finished goods;
• the availability, pricing and timeliness of delivery of other components and raw materials used in ourcustomers’ products;
• unpredictable volume and timing of customer orders, which are not fixed by contract but vary on anorder-to-order basis;
• superior product innovations by our competitors;
• the timing of new product announcements or introductions by us or by our competitors;
• our ability to timely and accurately predict market requirements and evolving industry trends and toidentify and capitalize upon opportunities in new markets; and
• the overall cyclicality of, and changing economic and market conditions in, the semiconductorindustry.
These and other factors make it difficult for us to assess our future performance. Our sales and operatingresults are difficult to predict and have in the past, and will likely in the future, fluctuate from period to period.We could fail to achieve the operating targets that we have announced, such as revenue growth, gross margin,and operating expense. In addition, our operating results in the future may be below the expectations of securitiesanalysts or investors, which would likely cause the market price of our ADSs to decline. Any variations in ourperiod-to-period performance may also cause the market price of our ADSs to fluctuate. Accordingly, you shouldnot rely on the results of any prior periods as a reliable indicator of our future operating performance.
3

Our operating results and stock price may be adversely affected by worldwide economic uncertaintiesincluding political and social instability and industry-specific conditions in the markets we operate.
Disruptions or uncertainties in the economy, including any political and social instability may leadconsumers and business to postpone spending. This in turn may cause our customers to cancel, decrease or delaytheir existing and future orders with us. Furthermore, we operate primarily in the semiconductor industry, whichis cyclical in nature and subject to evolving industry standards. In the past, the semiconductor industry hasexperienced significant downturns characterized by decreases in product demand, excess customer inventoriesand accelerated erosion of prices. The semiconductor industry also periodically experiences increased demandand production capacity constraints, which may affect our ability to deliver products to our customers. Anincreasing number of our products are being incorporated into consumer electronic products, which are subject tosignificant seasonality and fluctuations in demand. Economic volatility can cause extreme difficulties for ourcustomers and vendors in accurately forecasting and planning future business activities. This unpredictabilitycould cause our customers to reduce spending on our products and services, which would delay and lengthensales cycles. Furthermore, during challenging economic times our customers and vendors may face challenges ingaining timely access to sufficient credit, which could impact their ability to make timely payments to us. Theaccurate forecasting and planning for our operations heavily rely on these worldwide economic and industry-specific conditions, the volatility and uncertainties associated with these factors may adversely affect our resultsof operation in a material manner.
Since we have limited visibility as to the sales volume by our customers of devices using our products, ourability to accurately forecast future demand for and sales of our products is limited.
The majority of our products are integrated into devices that are sold directly or indirectly into consumerelectronics markets which are difficult for us to accurately forecast as consumer electronics demand is subject tosignificant seasonality and fluctuations. Also, as significant portion of our quarterly sales are from ordersreceived and fulfilled in that quarter, our visibility as to expected orders from our customers in subsequentperiods and for any extended period of time is limited. Additionally, we depend upon our customers’procurement forecasts in order to forecast demand for our products. Our customers’ procurement forecast may besubject to change and failure to accurately forecast demand for our products and which in turn may result in lostsales or excess inventory and associated reserves or write-downs for our operations. Any of the aforementionedfactors could affect our ability to accurately forecast future demands for and sales of our products and therebyharm our business, financial condition and operating results.
If demand for our products declines in the major end-markets that we serve, our sales, net revenue andearnings will decrease.
Demand for our products is affected by a number of factors, including the general demand for the productsin the end-markets that we serve and price attractiveness of the devices incorporating our products that ourcustomers and vendors offer to the end-markets. A significant amount of our sales revenue is derived fromcustomers who use our microcontrollers in removable and embedded solid state storage solutions used inconsumer electronics, such as smartphones, tablets, digital cameras, and notebook and desktop PCs. Anysignificant decrease in the demand for these devices in the end-market may decrease the demand for oursemiconductor solutions and may result in a significant decrease in our revenues and earnings. Consumerelectronic devices that use our components rapidly change as product capabilities are upgraded or new classes ofproducts are introduced, and these changes may result in a significant reduction in demand for our products. Wecan not give any assurance that there will not be any downturn in the future or that any future downturn will notaffect our results of operations. Any significant decrease in demand for end-user applications of semiconductorswill negatively affect our sales, net revenue and earnings.
4

We may make acquisitions that are dilutive to existing shareholders, resulting in unanticipated one-timecharges or that may otherwise adversely affect our results of operations, and which may result in difficultiesin assimilating and integrating the operations, personnel, technologies, products and information systems ofacquired companies or businesses.
We continually evaluate and explore strategic opportunities as they arise, including business combinationsand capital investments. If we issue equity securities in connection with an acquisition, the issuance may bedilutive to our existing shareholders. Alternatively, acquisitions made entirely or partially for cash would reduceour cash reserves.
Mergers and acquisitions of high-technology companies are inherently risky and subject to many factorsoutside of our control and no assurance can be given that our previous or future acquisitions will be successfuland will not materially adversely affect our business, operating results, or financial condition. Failure to manageand successfully integrate acquisitions could materially harm our business and operating results. Even when anacquired company has already developed and marketed products, there can be no assurance that such productswill be successful after our acquisition, will not cannibalize sales of our existing products, that productenhancements will be made in a timely fashion or that pre-acquisition due diligence will have identified allpossible issues.
In April 2007 we completed the acquisition of FCI, a privately-held Korea-based fabless IC companyfocused on mobile TV and wireless communications RF applications, in November 2007 we acquired select partsof the Centronix mobile TV business of Korea Information Engineering Services Co., Ltd. (“Centronix”) and inOctober 2011 we acquired select assets of BTL Systems, Inc. (hereafter “BTL”) The products from our FCI,Centronix and BTL acquisitions comprise our mobile communications product line. In the fourth quarter of 2009,we determined that goodwill and certain long-lived assets relating to our mobile communication product linewere impaired and recorded an impairment charge of US$37.4 million. See “We are exposed to potentialimpairment charges on intangible assets relating to recent acquisitions and on investments if business conditionsdeteriorate” below. Risks arising from these or other future acquisitions could include among other things:
• our ability to accurately assess the business and prospects of an acquisition or the anticipated benefitsof an acquisition;
• delays in or failure to complete the development and application of the acquired technologies orproducts;
• timing of the rollout and adoption of new applications and technology standards;
• our ability to successfully integrate acquired technologies, operations and personnel;
• failure to achieve projected results of an acquisition or inability to realize the anticipated benefits of anacquisition;
• disruption of our ongoing business;
• diversion of management and employees’ attention from other business activities;
• risks associated with entering into a geographic region or business market in which we have little or noprior experience and specifically managing personnel in these regions;
• difficulties in establishing and maintaining uniform standards, controls, policies and procedures;
• deficiencies in the internal control of any acquired company resulting in a material weakness in ouroverall internal control;
• our ability to recover costs of the acquisition or investment;
• amortization expenses and large and immediate write-offs;
• impairment charges related to goodwill or other assets;
• negative impact on our relationships with customers, vendors, suppliers or contractors;
5

• inability to retain key employees of an acquired business; and
• potentially dilutive issuance of equity securities.
In addition, future acquisitions could result in the incurrence of debt or contingent liabilities, adverse taxconsequences, deferred compensation charges, dilution to future earnings, and large fees for professional advisorservices, any of which could negatively impact our financial conditions or results of operations and could causeour stock price to decline. We may be unable to identify suitable acquisition candidates or investmentopportunities or consummate any such transactions on terms and conditions that are acceptable to us, if at all.
We depend on a small number of customers for a significant portion of our revenues and a loss of some ofthese customers would result in the loss of a significant portion of our revenues.
We derived a substantial portion of our revenue from sales to a relatively small number of customers. As aresult, the loss of any significant customer could materially and adversely affect our financial condition andresults of operations. Sales to our five largest customers represented approximately 51%, 61% and 65% of ournet revenue in 2011, 2012 and 2013, respectively. Sales to one customer in 2011 and 2012 and two customers in2013 accounted for 10% or more of our net revenue, represented 28%, 35% and 46% of our net revenue in 2011,2012 and 2013, respectively. In 2011 and 2012, the significant customer was Samsung and in 2013, Samsung andSK Hynix. The identities of our largest customers and their respective contributions to our net revenue havevaried and will likely continue to vary from period to period.
We expect that we will continue to depend on a relatively limited number of customers for a substantialportion of our net sales and our ability to maintain good relationships with these customers will be important tothe ongoing success of our business. We cannot assure you that the revenue generated from these customers,individually or in the aggregate, will reach or exceed historical levels in any future period. Our failure to meet thedemands of these customers could lead to a cancellation or reduction of business from these customers. Inaddition, loss, cancellation or reduction of business from, significant changes in scheduled deliveries to, ordecreases in the prices of products sold to any of these customers could significantly reduce our revenues andadversely affect our financial condition and operating results. Moreover, any difficulty in collecting outstandingamounts due from our customers particularly customers who place large orders, would harm our financialperformance. In addition, if our relationships with our largest customers are disrupted for any reason, it couldhave a significant impact on our business.
If the semiconductor industry suffers a shortage of flash memory, which is a key component in many of ourcustomers’ end products, our revenues could be adversely affected.
During many periods in past years, some of our customers have indicated that they were unable to acquireenough NAND flash memory to meet all of the anticipated demand for their products. Several manufacturers offlash memory have increased or are planning to increase manufacturing capacity for flash memory. However, wecannot assure you that there will continue to be enough additional capacity to satisfy worldwide demand for flashmemory. Because flash memory is a key component in many of the products manufactured by our customers, ifany shortage in the supply of flash memory occurs and is not remedied, our customers may not be able topurchase enough flash memory to manufacture their products and may therefore purchase fewer controllers fromus than they would have otherwise purchased. Our ability to increase revenues and grow our profits could bematerially and adversely affected as a result of any shortage or decrease in the supply of flash memory.
We operate in a rapidly changing industry, and our failure to anticipate and respond quickly to changingindustry trends relating to technology, standards, and consumer demand could adversely affect our growthand profitability.
We operate in an intensely competitive industry that experience rapid technological developments, changes inindustry standards, changes in customer requirements, and frequent new product introductions and improvements. If
6

we are unable to respond quickly and successfully to these developments, we may lose our competitive position,and our products or technologies may become uncompetitive. To compete successfully, we must maintain asuccessful R&D effort, develop new products and production processes, and improve our existing products andprocesses at the same pace or ahead of our competitors. Many types of events could have a variety of negativeeffects on our overall competitive position and our financial results, such as reducing our revenue, increasing ourcosts, lowering our gross margin percentage, lowering our operating profitability and requiring us to recognizeimpairments on our assets. We may not be able to develop and market new products successfully, new markets atwhich our products target may not grow as expected, the products we invest in and develop may not be wellreceived by customers, and products developed and new technologies offered by others may affect demand for ourproducts.
Currently, a significant majority of our sales are controllers used in NAND flash memory storage devices. Ifnew technologies for storing digital media are developed that compete with flash memory technology or render itobsolete and if we are not able to shift our product offerings accordingly, demand for our products would likelydecline and our business would be materially and adversely affected.
In addition, we may not have sufficient management resources to manage, R&D capabilities to address, andfinancial resources to fund all of the required research to develop future innovations and meet changing industrystandards. Moreover, even if we have adequate management resources, R&D capabilities, and financialresources, our future innovations may be outpaced by competing innovations. As a result, we may lose customersand significant sales, and our business and operating results may be materially and adversely affected.
We may be unsuccessful in developing and selling new products or in penetrating new markets required tomaintain our competitiveness or expand our business.
We expect that a high percentage of our future sales will come from sales of new products. We sell productsin markets that are characterized by rapid technological change, evolving industry standards, frequent newproduct introductions and products with short life cycles. The markets for some of these products are extremelycompetitive and may entail technologies that are new, immature and/or unpredictable to us. These markets andour endeavors to meet the markets may not develop into profitable opportunities and we have in the past investedsubstantial resources in emerging technologies that did not achieve the market acceptance and generate returnsthat we had expected. Recently, we have made significant investments in eMMC and Solid State Drive (“SSD”)controller technologies and LTE transceiver technology. Failure to grow our eMMC, SSD and LTE products orto recoup on our investments in these technologies could materially adversely affect our results of operations andfuture business outlook. As a result, it is difficult to anticipate our future revenue streams from, or provideassurances on the success and the sustainability of, our new products.
The average selling prices of our products have historically decreased rapidly and will likely do so in thefuture, which could harm our revenue and profitability.
The products we develop and sell, especially those for flash memory storage solutions, are used for highvolume applications and many of them are subject to rapid declines in average selling prices. Our average sellingprices have historically decreased significantly, and we believe that it is possible they may also fall in the future.We may experience period-to-period fluctuations in future operating results if our average selling prices decline.We may be forced to reduce the average unit price of our products in response to new product introductions byour competitors, competitive pricing pressures and other factors. The consumer electronics market is extremelycost sensitive, which may result in rapidly declining average selling prices of electronic devices and components,such as those made by us, used in devices and create downward pressure on our average selling prices andoperating results. To maintain acceptable operating results, we will need to develop and introduce new productsand product enhancements on a timely basis and continue to reduce our costs. If we are unable to offset anyreductions in our average selling prices by increasing our sales volumes or reducing corresponding productioncosts, or if we fail to develop and introduce new products and enhancements on a timely basis, our sales andoperating results will be materially and adversely affected.
7

If we are unable to accurately predict our future sales and to appropriately budget for our expenses, ourresults of operations could suffer.
The rapidly changing nature of the global economy and the markets in which we sell our products limits ourability to accurately forecast quarterly and annual sales. Because many of our expenses are fixed in the short term orare incurred in advance of anticipated sales, we may not be able to decrease our expenses in a timely manner tooffset any shortfall of sales, or expand our R&D and other operating infrastructure in a timely manner to captureanticipated business opportunities. If we expand our business operations and demand for our products does notincrease as we may have projected, our operating results could be affected by our higher operating expense levels.Conversely, if we maintain or reduce our business operations and related expenses in accordance with ourprojections and demand for our products increases more than expected, our operating results could be affected bylost business opportunity, less competitive economies of scale, and damaged relationships with our customers.
A failure to accurately forecast customer demand may result in excess or insufficient inventory, which mayincrease our operating costs and harm our business.
To ensure the availability of our products for our customers, in some cases we cause our manufacturers tobegin manufacturing our products based on forecasts provided by these customers in advance of receivingpurchase orders. However, these forecasts do not represent binding purchase commitments, and we do notrecognize revenue from these products until they are shipped to the customer. As a result, we incur inventory andmanufacturing costs in advance of anticipated revenue. Because demand for our products may not materialize,manufacturing based on forecasts subjects us to risks of high inventory carrying costs and increased obsolescenceand may increase our costs. If we overestimate customer demand for our products or if purchase orders arecancelled or shipments delayed, we may end up with excess inventory that we cannot sell, which could have amaterial and adverse effect on our financial results. Conversely, if we underestimate demand, we may not havesufficient product inventory and may lose market share and damage customer relationships, which could alsoharm our business.
The loss of any of our key personnel or the failure to attract or retain specialized technical andmanagement personnel could impair our ability to grow our business.
We rely heavily on the services of our key employees, including Wallace C. Kou, our President and ChiefExecutive Officer. In addition, our engineers and other key technical personnel are a significant asset and are thesource of our technological and product innovations. We believe our future success will depend upon our abilityto retain these key employees and our ability to attract and retain other skilled managerial, engineering, technicaland sales and marketing personnel. The competition for such personnel, particularly technical personnel, isintense in our industry. We may not be successful in attracting and retaining sufficient numbers of technicalpersonnel to support our anticipated growth. These technical personnel are required to design and developintegrated circuits, including firmware, and to introduce product enhancements for use in future applications.Despite the incentives we provide, our current employees may not continue to work for us, and if additionalpersonnel were required for our operations, we may not be able to obtain the services of additional personnelnecessary for our growth. In addition, we do not maintain “key person” life insurance for any of our seniormanagement or other key employees. The loss of any of our key employees or our inability to attract or retainqualified personnel, including engineers, could delay the development and introduction of, and have an adverseeffect on our ability to sell, our products as well as have an adverse effect on our overall growth.
In addition, if any other members of our senior management or any of our other key personnel join acompetitor or form a competing company, we may not be able to replace them easily and we may lose customers,business partners, key professionals and staff members. Substantially all of our senior executives and keypersonnel have entered into confidentiality and non-disclosure agreements. In the event of a dispute between anyof our senior executives or key personnel and our operating companies in Taiwan, China or Korea, we cannotassure you the extent, if any, to which these provisions may be enforceable in Taiwan, China, or Korea due toconstant evolving nature of the Taiwanese, Chinese, or Korean legal systems.
8

We may not be able to deliver our products on a timely basis if our relationships with our suppliers, oursemiconductor foundries or our assembly and test subcontractors are disrupted or terminated.
We do not own or operate semiconductor fabrication facilities. Instead, we rely on third parties tomanufacture our semiconductors. Two outside foundries, Taiwan Semiconductor Manufacturing Company(“TSMC”) and Semiconductor Manufacturing International Corporation (“SMIC”), with fabs in Taiwan,Singapore, and China currently manufacture the majority of our semiconductors. As a result, we face severalsignificant risks, including higher wafer prices, availability of wafers and other raw materials, lack ofmanufacturing capacity, quality assurance, manufacturing yields and production costs, limited control overdelivery schedules and product quality, increased exposure to potential misappropriation of our intellectualproperty, labor shortages or strikes and actions taken by third party contractors that breach our agreements.
The ability of each foundry to provide us with semiconductors is limited by its available capacity and accessto wafers. We do not have long-term agreements with any of these foundries and we place orders on a purchaseorder basis. We place our orders based on our customers’ purchase orders and sales forecasts. However, thefoundries can allocate capacity to the production of the products of their other customers and reduce deliveries tous on short notice or increase the price they charge us. It is possible that other foundry customers that are largerand better financed than we are, or have long-term agreements with these foundries, may induce these foundriesto reallocate capacity to them. Any reallocation could impair our ability to secure manufacturing capacity that weneed for our products. In addition, interruptions to the wafer manufacturing processes caused by a natural disasteror human error could result in partial or complete disruption in supply until we are able to shift manufacturing toanother fabrication facility. It may not be possible to obtain sufficient capacity or comparable production costs atanother foundry. Migrating our design methodology to a new third-party foundry could involve increased costs,resources and development time comparable to a new product development effort. Any reduction in the supply ofsemiconductors for our products could significantly delay our ability to ship our products and potentially havenegative effects on our relationships with existing customers and our results of operations. In addition, if oursubcontractors terminate their relationships with us, we would be required to qualify new subcontractors, whichcould take as long as six months, resulting in unforeseen operations problems, and our operating results may bematerially and adversely affected.
If the foundries that provide us with the products for our operations do not achieve satisfactory yield orquality, or if the assembly and testing services fail us in the quality of their output, then our revenue,operating results and customer relationships will be affected.
The manufacture of semiconductors is a highly complex process. Minor deviations in the manufacturingprocess can cause substantial decreases in yield. In some situations, such deviations may cause production to besuspended. The foundries that manufacture our semiconductors have from time to time experienced lower thananticipated manufacturing yields, including yields for our semiconductors, typically during the production of newproducts or architectures or during the installation and start-up and ramp-up of new process technologies orequipment. If the foundries that manufacture our semiconductors do not achieve planned yields, our productcosts could increase and product availability would decrease.
After the wafer fabrication processes, our wafers are shipped to our assembly and testing subcontractors. Wehave a system to maximize consistent product quality, reliability and yield that involves our quality assuranceteam working closely with subcontractors in the various phases of the assembly and testing processes. We alsoemphasize a strong supplier quality management practice through which our quality assurance team pre-qualifiesour manufacturing suppliers and subcontractors. However, despite our efforts to strengthen supplier qualitymanagement, if our foundries fail to deliver fabricated silicon wafers of satisfactory quality in the volume and atthe price we require, or if our assembly and testing subcontractors fail to efficiently and accurately assemble andtest our products, we will be unable to meet our customers’ demand for our products or to sell those products atan acceptable profit margin, which would have a material and adverse effect on our sales and margins anddamage our customer relationships.
9

Failure to protect our proprietary technologies or maintain the right to certain technologies may negativelyaffect our ability to compete.
We believe that the protection of our intellectual property rights is and will continue to be important to thesuccess of our business. We rely on a combination of patent, copyright, trademark and trade secret laws andrestrictions on disclosure to protect our intellectual property rights. We also enter into confidentiality or licenseagreements with our employees, business partners and other third parties, and have implemented procedures tocontrol access to and distribution of our documentation and other proprietary information. Despite these efforts,we cannot assure you that these measures will provide meaningful protection of our intellectual property rights.Further, these agreements do not prevent others from independently developing technologies that are equivalentto or superior to our technology. In addition, unauthorized parties may attempt to copy or otherwise obtain anduse our proprietary technology. Monitoring unauthorized use of our technology is difficult and we cannot becertain that the steps we have taken will prevent unauthorized use of our technology, particularly in foreigncountries such as Taiwan, Korea, and China where the laws may not protect our proprietary rights as fully as dothe laws of the United States. In addition, if the foundries that manufacture our semiconductors lose control ofour intellectual property, it could be more difficult for us to take remedial measures because our foundries arelocated in countries that do not have the same protection for intellectual property that is provided in theUnited States. Also, some of our contracts, including license agreements, are subject to termination upon certaintypes of change-of-control transactions.
As of March 31, 2014, we had 433 patents and 790 patent applications pending in five countries. We cannotbe certain that patents will be issued as a result of our pending applications nor can we be certain that any issuedpatents would protect or benefit us or give us adequate protection from competing products. For example, issuedpatents may be circumvented or challenged and declared invalid or unenforceable or provide only limitedprotection for our technologies. We also cannot be certain that others will not design around our patentedtechnology, independently develop our unpatented proprietary technology or develop effective competingtechnologies on their own.
Failure to successfully defend against intellectual property lawsuits brought against us may adversely affectour business.
Companies in and related to the semiconductor industry often aggressively protect and pursue theirintellectual property rights. From time to time, we have received, and may continue to receive, notices that claimwe have infringed upon, misappropriated or misused other parties’ proprietary rights. Moreover, in the past wehave been engaged in litigation with parties that claim that we infringed their patents or misappropriated ormisused their trade secrets. In addition, we or our customers may be sued by other parties that claim that ourproducts have infringed their patents or misappropriated or misused their trade secrets, or which may seek toinvalidate one or more of our patents. An adverse determination in any of these types of disputes could preventus from manufacturing or selling some of our products, increase our costs of revenue and expose us to significantliability. Any of these claims may materially and adversely affect our business, financial condition and results ofoperations. For example, in a patent or trade secret action, a court could issue a preliminary or permanentinjunction that would require us or our customer(s) to withdraw or recall certain products from the market orredesign certain products offered for sales or under development. We may also be liable for damages for pastinfringement and royalties for future use of certain technologies. See “Legal Proceedings,” below.
In addition, any litigation to defend ourselves against claims that we have infringed the intellectual propertyrights of others, could, regardless of the ultimate outcome, materially and adversely affect our operating resultsby requiring us to incur significant legal expenses and diverting the resources of the company and the attention ofour management team.
10

Because the markets in which we compete are highly competitive and many of our competitors have greaterresources than we have, we cannot be certain that our products will compete favorably in the market place.
We face competition from a large number of competitors in each of our target markets. Our competitors inour mobile storage market include Alcor Micro, ASolid, LSI, Marvell, Phison, and Skymedi. In the mobilecommunications market, the companies with whom we compete include I&C and Raontech. We also facecompetition from our customers’ internal products and expect to face increased competition in the future fromour current and potential competitors. In addition, some of our customers have developed products andtechnologies that could replace their need for our products or otherwise reduce their demand for our products.
Some of our current and potential competitors have longer operating histories, greater name recognition,access to larger customer bases and significantly greater financial, sales and marketing, manufacturing,distribution, technical and other resources than we have. As a result, they may be able to respond more quickly tochanging customer demands or to devote greater resources to the development, promotion and sales of theirproducts than we can. Our current and potential competitors may develop and introduce new products that will bepriced lower, provide superior performance or achieve greater market acceptance than our products. In addition,in the event of a manufacturing capacity shortage, these competitors may be able to obtain capacity when we areunable to do so.
The consumer electronics market, which is the principal end market for our products, has historically beensubject to intense price competition. In many cases, low-cost, high-volume semiconductor component producershave entered markets and driven down profit margins. If a low-cost, high-volume producer should developproducts that compete with our products, our sales and profit margins would suffer.
Our products must meet exacting specifications and undetected defects and failures may occur, which maycause customers to return or stop buying our products and may expose us to product liability risk and risksof indemnification against defects in our products.
Our products are complex and may contain undetected hardware or software defects or failures, especiallywhen first introduced or when new versions are released. These errors could cause us to incur significant re-engineering costs, divert the attention of our engineering personnel from product development efforts andmaterially affect our customer relations and business reputation. If we deliver products with errors or defects, ourcredibility and the market acceptance and sales of our products could be harmed. Defects could also lead toliability for defective products as a result of lawsuits against us or against our customers. We have agreed toindemnify some of our customers in some circumstances against liability from defects in our products. Asuccessful warranty or product liability claim could require us to make significant payments.
Our intellectual property indemnification practices may adversely impact our business.
We may be required to indemnify our customers and our third-party intellectual property providers forcertain costs and damages of intellectual property infringement in circumstances where our products are a factorin creating infringement exposure. In some instances, our products are designed for use in devices manufacturedby our customers that comply with international standards. These international standards are often covered bypatent rights held by third parties, which may include our competitors. The combined costs of identifying andobtaining licenses from all holders of patent rights essential to such international standards could be high andcould reduce our profitability or increase our losses. The cost of not obtaining these licenses could also be high ifa holder of the patent rights brings a claim for patent infringement. In the contracts under which we sellsemiconductor products, we may have agreed to indemnify our customers against losses arising out of claims ofunauthorized use of intellectual property. In some of our licensing agreements, we have agreed to indemnify thelicensee against losses arising out of or related to our conduct or services. We cannot assure you that claims forindemnification will not be made or that these claims would not have a material and adverse effect on ourbusiness, operating results or financial condition.
11

We are exposed to potential impairment charges on intangible assets relating to recent acquisitions and oninvestments if business conditions deteriorate.
We are required to perform testing for impairment losses relating to long-lived assets used in operationswhen indicators of impairment, such as reductions in demand or significant economic slowdowns in our business,are present. Through our acquisitions of FCI and other assets, we acquired core technology, customerrelationships, goodwill and other intangible assets. The carry value of goodwill relating to these acquisitionsmust be assessed for impairment at least on an annual basis. In November 2009, we recorded US$6.6 million ofimpairment charges relating to our long-lived assets. Additionally, in November 2009, as a result of our annualimpairment assessment of the carrying value of goodwill, we determined that the goodwill balance was impaired,and wrote down the goodwill balance by US$30.8 million. As of December 31, 2013, we had goodwill associatedwith our acquisitions of US$35.5 million. Although we recorded an impairment on goodwill and other long-livedassets in 2009, we cannot be certain that these assets will not be subject to further write-downs in future periodsand may record further impairment charges if sales of our LTE transceivers and mobile TV SoCs do not grow asexpected.
We have not made any passive investments in private companies since February 2007. If the companies inwhich we have invested in are unable to execute their plans and succeed in their respective markets, we may notbenefit from such investments, and we could potentially lose the amounts we invested. We evaluate ourinvestments on a regular basis to determine if impairments have occurred and have recorded impairment chargesin past years. These and future impairment charges could have a material and adverse impact on our operatingresults. In 2011, 2012 and 2013, there were no impairments recorded.
Any failure to achieve and maintain effective internal controls could have a material adverse effect on ourbusiness, results of operations and the market price of our ADSs.
We are subject to reporting obligations under securities laws of the United States. The Securities andExchange Commission, or the SEC, as required by Section 404 of the Sarbanes-Oxley Act of 2002, or theSarbanes-Oxley Act, adopted rules requiring every public company to include in its annual report management’sassessment of the effectiveness of the company’s internal controls over financial reporting. In addition, anindependent registered public accounting firm must attest to and report on the effectiveness of the company’sinternal controls over financial reporting.
Our management and independent registered public accounting firm have concluded that our internalcontrols as of December 31, 2013 are effective. However, we cannot assure you that in the future we or ourindependent registered public accounting firm will not identify material weakness during the audit process or forother reasons. In addition, because of the inherent limitations of internal control over financial reporting,including the possibility of collusion or improper management override of controls, material misstatements dueto error or fraud may not be prevented or detected on a timely basis. As a result, if we fail to maintain effectiveinternal controls over financial reporting or should we be unable to prevent or detect material misstatements dueto error or fraud on a timely basis, investors could lose confidence in the reliability of our financial statements,which in turn could harm our business and results of operations, negatively impact the market price of our ADSsand harm our reputation.
Laws and regulations to which we are subject, as well as customer requirements in the area ofenvironmental protection and social responsibility, could impose substantial costs on us and may adverselyaffect our business.
We are subject to various state, federal and international laws and regulations governing the environment,including restricting the presence of certain substances in electronic products. In addition, we are also subject tovarious industry requirements restricting the presence of certain substances in electronic products. Although ourmanagement systems are designed to maintain compliance, we cannot assure you that we have been or will be at
12

all times in complete compliance with such laws and regulations. If we violate or fail to comply with any ofthem, a range of consequences could result, including fines, import/export restrictions, sales limitations, criminaland civil liabilities or other sanctions.
Recently there has been increased focus on environmental protection and social responsibility initiatives.We may be required or choose to implement various standards or processes due to the adoption of rules orregulations that result from these initiatives, such as the recently adopted United States rules on the disclosure ofthe use of “conflict minerals.” Our customers may also require us to implement environmental or socialresponsibility procedures or standards before they will continue to do business with us or order new productsfrom us. Our adoption of these procedures or standards could be costly, and our failure to adopt these standardsor procedures could result in the loss of business, fines or other costs.
Our stock price has been, and may continue to be, volatile, which could result in investors losing all or partof their investments.
Since we completed our initial public offering in June 2005, the market price of our ADSs has been andlikely will continue to be highly volatile and could be subject to wide fluctuations in response to numerousfactors, including the following:
• actual or anticipated variations in our quarterly operating results or those of our competitors,customers, or NAND flash vendors;
• actual or anticipated changes in NAND flash supply-demand dynamics;
• actual or anticipated changes in our market share or the market share of our competitors;
• the commencement or results of litigation;
• announcements by us, our competitors, our customers, or their other suppliers of new products ortechnological innovations;
• changes in financial estimates or recommendations by securities analysts;
• the payment or non-payment of cash dividends at the discretion of our board of directors;
• the announcement and implementation of share repurchase programs;
• announcements by us or our competitors of significant acquisitions, divestitures or partnerships; and
• actual or anticipated changes in the global economic or industry outlook.
Many of these factors are beyond our control and may negatively impact the market price of our ADSs,regardless of our performance. In addition, the stock market in general, and the market for technology andsemiconductor companies in particular, have been highly volatile. Our ADSs may not trade at the same pricelevels as that of other semiconductor and technology companies, and shares of semiconductor and technologycompanies, in general, may not sustain their current market prices. These fluctuations as well as generaleconomic, political, and market conditions may have an adverse effect on the market price of our ADSs.
There can be no assurance that we will continue to declare cash dividends on a quarterly basis, if at all orin any particular amounts.
Our Board of Directors declared payment of our first quarterly dividend on our common stock in January2013 and the first dividend payment was made on March 4, 2013. Our Board of Directors has subsequentlydeclared and paid dividends in the second, third and fourth quarters of 2013, as well as the first quarter of 2014,and our Board of Directors recently declared a dividend payment in the second quarter of 2014. The continuationof declaring quarterly dividends or if at all, depends on, among other things, that the dividend payment is in thebest interests of our shareholders, our results of operations, capital availability and future capital requirements,financial condition, statutory requirements, and other factors that the board of directors may deem relevant. The
13

decision of any declaration of dividend payment, the amount and the frequency of such, if at all, is the discretionof our Board of Directors. Our dividend payments may change from time to time, and we cannot provideassurance that we will continue to declare dividends, if at all or in any particular amounts. A reduction in orelimination of our dividend payments could have a negative effect on our share price.
If we are characterized as a passive foreign investment company, U.S. Holders may experience adverse taxconsequences.
Based on the present and projected composition of our income and valuation of our assets, we believe weare not currently classified as a passive foreign investment company (“PFIC”) for U.S. federal income taxpurposes. We will generally be classified as a PFIC for any taxable year in which either (a) at least 75% of ourgross income is passive income or (b) at least 50% of the value (determined on the basis of a quarterly average)of our assets is attributable to assets that produce or are held for the production of passive income. If we arecharacterized as a PFIC, U.S. Holders may experience adverse tax consequences. See “ ITEM 10. ADDITIONALINFORMATION -Taxation-United States Federal Income Taxation.”
We are subject to risks associated with international operations which may harm our business.
We conduct our business worldwide. We are headquartered in Taiwan and have most of our operationsoutside of the United States. We undertake our design and development activities primarily in Korea and Taiwan.Our integrated circuits are manufactured, assembled, tested and packaged by third-parties located primarily inChina, Korea, and Taiwan. We generated 89%, 93% and 90% of our revenue in 2011, 2012 and 2013,respectively, from sales to customers outside the United States. International operations are subject to many otherinherent risks, including but not limited to:
• international economic and political conditions, such as political tensions between countries in whichwe do business (please also refer to Risk Factors relating to Taiwan and Korea);
• unexpected changes in, or impositions of, legislative or regulatory requirements;
• complying with a variety of foreign laws;
• differing legal standards with respect to protection of intellectual property and employment practices;
• cultural differences in the conduct of business;
• inadequate local infrastructure that could result in business disruptions;
• exporting or importing issues related to export or import restrictions, tariffs, quotas and other tradebarriers and restrictions;
• financial risks such as longer payment cycles and difficulty in collecting accounts receivable;
• adverse taxes rules, regulations and penalties; and
• Other factors beyond our control such as nature disasters, terrorism, civil unrest, war and diseases suchas severe acute respiratory syndrome, the Avian influenza, and the Swine influenza.
Although our reporting currency is the U.S. dollar, and the majority of our sales and cost of sales aredenominated in the U.S. dollar, the majority of our operating expenses are denominated in the NT dollar, and to alesser extent Korean won, Chinese renminbi, and U.S. dollar. The functional currency of our Korean operationsis the Korean Won. As a result, appreciation or depreciation of other currencies in relation to the U.S. dollarcould result in material transaction and translation gains or losses that could adversely affect, or causefluctuations in, our results of operations. We do not currently engage in currency hedging activities.
Parts of the world, including Taiwan, Japan, China and the United States are susceptible to earthquakes. In1999, 2008, and 2011 Taiwan, China, and Japan respectively, experienced severe earthquakes that causedsignificant property damage and loss of life. Although the 1998, 2008 and 2011 earthquakes did not have a
14

material impact on our business, a major earthquake and consequent disruptive events could severely disrupt thenormal operations of our business and have a material and adverse effect on our financial condition and operatingresults.
We face substantial political risks associated with doing business in Taiwan because of the tense politicalrelationship between Taiwan and the People’s Republic of China.
While we also, through our acquisition of FCI, maintain substantive operations in Korea, our principalexecutive offices and a majority of our employees and a significant portion of our research and development andoperations are based in Taiwan. In addition, most of our foundries and assembly and testing suppliers such asTSMC, SMIC, Advanced Semiconductor Engineering Group (“ASE”), Siliconware Precision Industries Co., Ltd.(“SPIL”), Taiwan IC Packing Corp. (“TICP”), King Yuan Electronics Corp. (“KYEC”), and YoungtekElectronics Corp. (“YTEC”) are located in either Taiwan or China. Accordingly, our business and results ofoperations and the market price of our ADSs may be affected by changes in Taiwan or China governmentalpolicies, taxation, inflation or interest rates and by social instability and diplomatic and social developments in oraffecting Taiwan that are outside of our control. Taiwan has a unique international political status. China doesnot recognize the sovereignty of Taiwan. Although there have been significant economic and cultural tiesbetween Taiwan and China in recent years, the political relations have often been strained. The government ofChina has indicated that it may use military force to gain control over Taiwan, particularly under what itconsiders as highly provocative circumstances, such as a declaration of independence by Taiwan or the refusal byTaiwan to accept China’s “One China” policy. On March 14, 2005, the National People’s Congress of Chinapassed what is widely referred to as the “anti-secession” law, a law authorizing the Chinese military to attackTaiwan in order to block moves by Taiwan toward formalizing independence.
Past and recent developments in relations between Taiwan and China have on occasion depressed themarket prices of the securities of Taiwanese companies or companies with significant business activities inTaiwan. We cannot assure you any contentious situations between Taiwan and China will always resolve inmaintaining the current status quo or remain peaceful. Relations between Taiwan and China and other factorsaffecting military, political or economic conditions in Taiwan could have a material adverse effect on ourfinancial condition and results of operations, as well as the market price and the liquidity of our ADSs.
We face substantial political risk associated from doing business in South Korea because of tensions in thepolitical relationship between South Korea and North Korea.
Relations between South Korea and North Korea have been tense over most of South Korea’s history. Inrecent years, there have been heightened security concerns stemming from North Korea’s nuclear weapons andballistic missile capabilities and uncertainty regarding North Korea’s actions and possible responses from theinternational community. More recent concerns over North Korea’s nuclear and ballistic missile testingprograms, hostile and threatened actions by North Korea against South Korea, North Korea’s leadershipsuccession, and relations between the United States and North Korea, have created a global security issue thatmay adversely affect South Korean business and economic conditions. South Korea was not a signatory of thearmistice agreement that ended the Korean War, and since no peace treaty was signed between South Korea andNorth Korea, the two countries are technically still at war. We cannot assure you as to whether or when thissituation will be resolved or change abruptly as a result of current or future events, including, without limitation,the effects, if any, of (i) the transition of the “Supreme Leader” to Kim Jong Un that began after the passing ofKim Jong Il in 2011, (ii) recent increases to previously imposed UN sanctions on North Korea, (iii) the effects ofthe denial of access to South Koreans who manage jointly run factories in the North Korean city of Kaesong and(iv) the general increase in overtures and rhetoric by the North Korean government with respect to its nuclearcapabilities and willingness to use such weapons as they see fit. We cannot give any assurance that the level ofinstability and tension in the Korean peninsula will not escalate in the future, or that the political regime in NorthKorea may not suddenly collapse. An adverse change in economic or political conditions in South Korea orNorth Korea or in South Korea’s relations with North Korea could have a material adverse effect on our SouthKorean subsidiary and our company.
15

Our business depends on the support of the Taiwanese and South Korean governments, and a decrease inthis support may increase our tax liabilities and decrease our net income.
The Taiwanese and South Korean governments have been supportive of technology companies such as ours.In particular, we, like many Taiwanese technology companies, have benefited from tax incentives provided bythe Taiwanese government. For example, under the Statute for Upgrading Industries of Taiwan, we were grantedtax credits by the Taiwan Ministry of Finance for qualifying research and development costs and in qualifyingemployee training expenses. In addition, Taiwan law offers preferential tax treatments to industries that areencouraged by the government. In 2010, “Statute for Industries Innovation” was passed to replace the “Statutefor Upgrading Industries” in tax incentives. However, we are still eligible to use certain previously grantedunutilized, unexpired tax credits and exemptions. See “Operating and Financial Review and Prospects —Principal Factors Affecting Our Results of Operations — Provision for income taxes” and note 13 to ourconsolidated financial statements for a more detailed description of our ability to enjoy these preferential taxtreatments. If any of our tax credits or our ability to take advantage of these preferential tax treatments arecurtailed or eliminated, our net income may decrease materially.
The South Korean government provides a variety of tax incentives designed to promote designatedindustries such as the technology industry. We, like many Korean technology companies, have benefited fromcertain tax incentives, including tax credits for applicable research and development expenses and tax credit forinvestments made to improve business productivity. If these and other tax incentives are curtailed or eliminated,our net income may decrease materially.
ITEM 4. INFORMATION ON THE COMPANY
History and Development of the Company
Silicon Motion Technology Corporation (“Silicon Motion”) is a corporation which was incorporated in theCayman Islands in January 2005 and acquired Silicon Motion, Inc., a Taiwan corporation (“SMI Taiwan”) inApril 2005. Originally SMI Taiwan was known as Feiya Technology Corporation (“Feiya”), a Taiwancorporation which was incorporated in April 1997 but had changed its name to SMI Taiwan after acquiring inAugust 2002 Silicon Motion, Inc., a California corporation (“SMI USA”), which was incorporated in November1995. Feiya was originally a flash memory products company and SMI USA a graphics processor company. InApril 2007, we acquired FCI Inc. (“FCI”), a leading designer of RF ICs for mobile TV and wirelesscommunications based in Korea. In 2011, we established Silicon Motion BV in the Netherlands with the purposeof expanding our business activities in Europe, as well as to provide supervisory, financing, legal support,accounting services and shareholding for our businesses in other parts of the world.
Our principal executive offices are located at 8F-1, No. 36, Taiyuan St., Jhubei City, Hsinchu County 302,Taiwan. The address of our United States subsidiary, Silicon Motion, Inc. is 1591 McCarthy Blvd., Milpitas,CA 95035. Our ADSs have been listed and traded on Nasdaq since June 2005.
Subsidiaries of the Company
Below is a list of subsidiaries of the Company. All subsidiaries are wholly owned.
Name of Entity Jurisdiction of Incorporation
FCI Inc. KoreaSilicon Motion BV The NetherlandsSilicon Motion K.K. JapanSilicon Motion Korea Ltd. KoreaSilicon Motion Technology Corp (HK) Hong KongSilicon Motion, Inc. CaliforniaSilicon Motion, Inc. TaiwanSilicon Motion, Inc. (Beijing) ChinaSilicon Motion, Inc. (Shanghai) ChinaSilicon Motion, Inc. (Shenzhen) China
16

Overview
We are a fabless semiconductor company that designs, develops and markets high performance, low-powersemiconductor solutions to original equipment manufacturers (“OEMs”) and other customers in the mobilestorage and mobile communications markets. Our products are widely used in smartphones, tablets, notebooks,desktop PCs and industrial and commercial applications.
For the mobile storage market, our key products are microcontrollers used in solid state storage devices suchas SSDs, eMMCs and other embedded flash applications, as well as removable storage products. More NANDflash products, especially next generation flash, whether produced by Samsung, SanDisk, Toshiba, Micron orSK Hynix are supported by Silicon Motion controllers than any other company. We are the leading merchantsupplier of controllers for eMMC embedded memory used in smartphones and tablets and are increasinglyfocused on client SSDs controllers for PCs and other applications.
For the mobile communications market, our key products are handset transceivers and mobile TV SoCs. Weare a dedicated provider of 4G LTE transceivers for Samsung’s smartphones and tablets.
We market our mobile storage products under the “SMI” brand and mobile communications products underthe “FCI” brand and sell our semiconductor solutions to leading OEMs and module makers worldwide. Ourcustomers include industry leaders such as Micron, Samsung, SK Hynix, Sony, and Transcend. We sell ourproducts through our direct sales force and distributors.
Industry Background
We operate in the semiconductor industry and primarily focus on designing, developing and marketing:(i) controllers for managing NAND flash used in embedded storage applications such as eMMC embeddedmemory and SSDs and removable storage applications such as flash memory cards and USB flash drives, and(ii) specialty RF ICs used in smartphones and tablets such as LTE transceivers and mobile TV SoCs.
NAND Flash Controllers
NAND flash is a type of non-volatile digital data storage technology that does not require power to retaindata and has become the primary semiconductor technology for mass digital data storage. The benefits of NANDflash includes high data storage capacity at low cost per bit, fast data read and write access time, low operatingpower requirements, and is shock resistant. NAND flash is widely used for embedded and removable datastorage in mobile consumer electronic devices such as smartphones, tablets, digital cameras, and notebook PCsand more recently is also being used in commercial-grade, industrial-grade, and enterprise-grade equipment. TheNAND flash market is large and has grown rapidly, and the leading suppliers of NAND flash are Intel, Micron,Samsung, SanDisk, SK Hynix, and Toshiba.
All NAND flash storage devices require a controller and almost all storage devices use a discrete controllerIC. Key functions of a flash memory controller include:
• managing the interfacing of the NAND flash in the flash memory storage product with the host device;
• ensuring data reliability in NAND flash by detecting and correcting individual bit errors in the NANDflash caused by read/write disturbance and adjacent cell interference;
• ensuring data integrity in NAND flash by mapping bad blocks and preventing bad blocks from beingused for storing data;
17

• maximizing the life of NAND flash with wear-leveling algorithms which spread out the use of thememory array and equalize the use of all the memory cells;
• enhancing the sequential and random read and write performance of NAND flash by utilizing two-plane architecture, interleaving, or other technologies;
• preventing data loss during sudden, unexpected host device power failures with advanced powercycling solutions;
• implementing security features to protect software code, personal data and multimedia digital rights;and
• ensuring that flash memory storage solutions are compatible with host devices.
We believe that our controllers are designed to meet the specifications of the majority of NAND flashcurrently being produced by different flash memory manufacturers, including small and big block Single-LevelCell (“SLC”) and Multi-Level Cell (“MLC”) NAND flash. Most of our controllers support two-bits per cell MLCand three-bits per cell MLC NAND flash, which is also known as Triple-Level Cell (“TLC”) NAND flash. Ourcontrollers also support NAND flash designed and fabricated at all the primary process geometries, including themost advanced process geometries.
Mobile Device Specialty RF ICs
The RF IC industry is large and fragmented and encompasses several major markets, such as mobileconnectivity, broadcast TV, and broadband data. Since major markets demand large supplies of standardsolutions, these markets are intensively competitive and are dominated by large semiconductor companies withsignificant engineering, financial, intellectual property, and other resources. Within and outside of the traditionalmajor markets are niche and customs solutions sub-markets. We have significant RF, analog, and mixed signalIC design expertise and experience relating to several key sub-markets:
• LTE transceivers. Custom-designed LTE transceiver solutions specifically for Samsung for pairingwith Samsung LTE baseband ICs; and
• Mobile TV SoCs. Tuner plus demodulator SoCs for T-DMB and ISDB-T, specifically 1-Seg, Full-Seg,and ISDB-Tmm.
Our Markets and Products
We design, develop and supply a portfolio of products that address two main markets, mobile storage andmobile communications. In the mobile storage market we provide products for both the embedded storage andthe removable storage market segments. The following is a brief description of each of our markets and keyproducts.
Mobile Storage Market
Embedded Storage Market
Embedded memory controllers. Embedded NAND flash-based storage devices, especially eMMC embeddedmemory, have become very common as memory solutions for smartphones, tablets, and other consumerelectronics devices. We provide controllers for eMMC and its derivative multi-chip package (“MCP”) embeddedmemory, which combine NAND flash and mobile DRAM in an integrated solution. We also develop and supplycontrollers for other embedded memory solutions, such as those based on the USB flash drive and Secure Digital(“SD”) interface. In addition to providing consumer-grade embedded memory controllers to our customers, wealso supply commercial-grade and industrial-grade products.
18

SSD controllers and solutions. SSD is a next generation storage technology designed to replace orcompliment hard disk drives. SSDs are potentially faster in terms of data read and write speed, are more durableand not prone to mechanical malfunction, more power efficient, generate less heat, and are quieter and smaller inform factor. We provide SATA 6Gb/s SSD controllers for both NAND-cache SSDs and full-size client SSDs. Wealso provide controllers for single-chip SSDs and IDE/PATA disk-on-modules (“DOMs”), which are commonlyused in industrial applications. In addition to controllers, we also offer Ferri single-package SSD solutions, smallsingle-chip SSDs with either a standard SATA, PATA or eMMC interface in a BGA form factor that allows foreasy integration of this embedded storage into industrial-grade or commercial-grade devices and applications.
Removable Storage Market
Flash memory cardcontrollers. We believe we offer the broadest line of high-performance controllers for allmajor flash memory card formats, including Compact Flash (“CF”), SD and Memory Stick (“MS”). For SDcards, we offer controllers for (i) different physical card sizes, such as SD card’s miniSD card and microSD card,(ii) different speed class, which refer to how quickly information can be read from, or written to, the card,including the significantly faster Secure Digital High Capacity (“SDHC”) and Secure Digital eXtended Capacity(“SDXC”) cards that use the Ultra High Speed (UHS) bus, (iii) different storage capacities, including thesignificantly higher-capacity SDHC and SDXC cards, which also have faster speed and added capabilities.Smaller form factor cards are primarily used for smartphones and larger form factor cards are more often used indigital cameras.
USB flash drive controllers. USB flash drives are NAND flash memory data storage devices integrated witha standard USB interface, commonly high speed USB 2.0 and increasingly the newer USB3.0 with significantlyfaster read and write speed. USB flash drives are popular in computing and consumer electronics markets for theportable storage of files. Certain application software can be booted from a USB flash drive, such as a Windows8 system from a USB flash drive that supports Windows to Go.
Mobile Communications Market
Mobile TV SoCs. Our products include integrated mobile TV tuner plus demodulator SoCs for mobilephones and other portable devices. Our solutions are designed for many mobile TV broadcast standards,especially T-DMB for the Korean market and ISDB-T for the Japanese and South American markets.
LTE transceivers. We offer 4G LTE transceivers that are designed to specifically support Samsung LTEbaseband solutions. Our high performance, low power, multi-mode diversity LTE and LTE-Advancedtransceivers support GSM, GPRS, EDGE, HSPA, HSPA+, and TD-SCDMA, in addition to FDD-LTE andTD-LTE.
Our Customers
We sell our semiconductor solutions to leading OEMs and module makers, worldwide. We provide our highperformance flash memory storage controller to companies such as Netcom, Micron, Samsung, SK Hynix, Sonyand Transcend. We are a leading supplier of controllers used in eMMC embedded memory used in smartphonesand tablets manufactured by the handset and tablet industry’s leading OEMs and a leading supplier of controllersused in flash memory cards and USB flash drives. We provide our innovative mobile communications ICsprimarily to Samsung. We supply our LTE transceivers to Samsung and mobile TV SoCs to Samsung and otherKorea handset OEMs.
Sales to our five largest customers represented approximately 51%, 61% and 65% of our net revenue in2011, 2012 and 2013, respectively. Sales to one customer in 2011 and 2012 and two customers in 2013accounted for 10% or more of our net revenue, represented 28%, 35% and 46% of our net revenue in 2011, 2012
19

and 2013, respectively. In 2011 and 2012, the significant customer was Samsung and in 2013, Samsung and SKHynix. The identities of our largest customers and their respective contributions to our net revenue have variedand will likely continue to vary from period to period.
The majority of our customers purchase our products through purchase orders, as opposed to entering intolong-term contracts with us. The price for our products is typically agreed upon at the time a purchase order isplaced.
Sales and Marketing
We market and sell our products worldwide through a combination of direct sales personnel andindependent electronics distributors. Our direct sales personnel are strategically located near our major OEM andmodular maker customers in Taiwan, Korea, China, the United States, and Japan. Approximately 77% of oursales in 2011, 82% of our sales in 2012 and 83% of our sales in 2013 were attributable to our direct sales forcewhile the remainder was attributable to distributors.
To supplement our direct sales, we have independent electronics distributors with locations throughout theworld. We selected these distributors based on their ability to provide effective field sales, marketingcommunications and technical support for our products to our customers.
Our marketing group focuses on our product strategy, product development road maps, new productintroduction process, demand assessment, competitive analysis, and product marketing. We seek to work withpotential and existing customers early in their design process in order to best match our products to their needs,and more broadly, to ensure that product development activities, product launches, and on-going demand andsupply planning occur in a well-managed, timely basis in coordination with our research and development,operations, and sales groups, as well as our customers and distributors. We also attend industry tradeshows andtechnical conferences to promote our products and solutions, maintain close contact with our existing customersto assess demand, and keep current with industry trends. Our participation in industry standards associations,such as JEDEC and the SD Association for flash memory cards, helps us monitor the latest industrydevelopments and promote our corporate profile. Our marketing group also works with our sales teams toidentify new business opportunities.
We also have field application engineers, or FAEs, who provide technical support and assistance to existingand potential customers in designing, testing and qualifying systems that incorporate our products. Our FAEorganization is segmented by product and market to support our customers.
Research and Development
We devote a significant amount of resources to research and development for broadening and strengtheningour portfolio of products and solutions. Our engineering team has expertise in system architecture, digital, mixed-signal and RF IC design, and software engineering. As of March 31, 2014, we had 433 patents in China, Japan,Korea, Taiwan, and the United States and 790 patents pending. We continue to actively pursue the filing ofadditional patent applications in China, Japan, Korea, Taiwan, and the United States.
We believe technology research and product development are essential to our growth. Our primary researchand development centers are located in Hsinchu and Taipei, Taiwan, Seoul, South Korea, Shanghai andShenzhen, China and Milpitas, California. Our facilities in Milpitas focus primarily on graphics products, ourfacilities in Seoul focus primarily on our specialty RF IC products, our facilities in Hsinchu and Taipei focusprimarily on our NAND flash controller products, and our facilities in Shanghai and Shenzhen focus primarily onspecific product requirements of our customers in China.
Our research and development expenses were approximately US$40.5 million, US$51.0 million andUS$46.5 million for the years ended December 31, 2011, 2012 and 2013, respectively.
20

Manufacturing
We design and develop our products and electronically transfer our proprietary designs to independentfoundries for the manufacturing and processing of silicon wafers. Once the wafers are manufactured, they arethen shipped to third-party assembly and testing subcontractors. Individual dies on each wafer are assembled intofinished chips and undergo several stages of testing before delivery to our customers. We also ship bare dies toour customers. We believe that our strategy of outsourcing wafer fabrication, packaging and testing enables us tobenefit from the research and development efforts of leading manufacturers without the requirement to commitour own substantial capital investments. Our fabless business model also provides us with the flexibility toengage vendors who offer services that best complement our products and technologies.
Wafer fabrication. TSMC and SMIC are currently our primary foundries that manufacture most of oursemiconductors. We use their fabs in Taiwan, Singapore, and China to fabricate our devices using mature andstable CMOS process technology, primarily with line-widths from 55 to 160 nanometers. We regularly evaluatethe benefits and feasibility, on a product-by-product basis, of migrating to more cost efficient manufacturingprocess technologies.
Assembly and testing. Following wafer fabrication, our wafers are shipped to our assembly and testsubcontractors where they are probed, singulated into individual dies, assembled into packaged chips, andundergo the process of electronic final testing. In order to minimize cost and maximize turn-around time, ourproducts are designed to use low cost, industry standard packages and can be tested with widely availableautomatic testing equipment. We currently engage companies such as ASE, SPIL, TICP, KYEC, and YTEC inTaiwan and Amkor in Korea as our primary subcontractors for the assembly and testing of our products. We havededicated teams of manufacturing engineers who maintain control over the process from the early stages ofmanufacturing. Our engineers work closely with our subcontractors to develop product testing and packagingprograms to ensure these programs meet our product specifications, thereby maintaining our ownership of thefunctional and parametric performance of our semiconductors.
Quality and Reliability Assurance. We have designed and implemented a quality assurance system thatprovides the framework for continual improvement of products, processes and customer service. To ensureconsistent product quality, reliability and yield, our quality assurance teams perform reliability engineering,quality control, ISO system development, document control, subcontractor quality management and customerengineering services to closely monitor the overall process from IC design to after-sale customer support. Inparticular, we rely on in-depth simulation studies, testing and practical application testing to validate and verifyour products. We emphasize a strong supplier quality management practice in which our manufacturing suppliersand subcontractors are pre-qualified by our quality assurance teams. Our suppliers are required to have a qualitymanagement system, certified to ISO 9000 standard. Our operations have been ISO 9001 certified sinceNovember 18, 1999.
Competition
The semiconductor industry is characterized by intense competition. Our customers face supply shortages oroversupply, rapid technological changes, evolving industry standards and declining average selling prices.
Our competitors in our mobile storage market include Alcor Micro, ASolid, LSI, Marvell, Phison, andSkymedi. In the mobile communications market, the companies with whom we compete include I&C andRaontech. We also face competition from some of our customers, such as Samsung.
Seasonality
See “Risk Factors — Because our operating results for any period could be adversely affected by a numberof factors and therefore fluctuate significantly, our annual and quarterly operating results are difficult to predict”in Item 3 above and “Operating and Financial Review and Prospects — Principal Factors Affecting Our Resultsof Operations” in Item 5 below.
21

Intellectual Property
Our success and future revenue growth depends, in part, on our ability to protect our intellectual property.We rely on a portfolio of intellectual property rights, registered in the United States, Taiwan, and other countries,including patents, copyright rights, trademark registrations, trade secret laws, contractual provisions, licenses,and other methods to protect our intellectual property.
As of March 31, 2014, we held 433 patents in the United States, Taiwan, and other countries and have 790pending patent applications in the United States, Taiwan, and other countries. There can be no assurance thatpatents will ever be issued with respect to these pending applications. Furthermore, it is possible that any patentsheld by us may be invalidated, circumvented, challenged or licensed to others. In addition, there can be noassurance that such patents will provide us with competitive advantages or adequately safeguard our proprietaryrights. While we continue to file new patent applications with respect to our recent developments, existingpatents are granted for prescribed time periods and will expire at various times in the future. We expect tocontinue to file patent applications where appropriate to protect our proprietary technologies.
Companies in the semiconductor industry have frequently demonstrated a readiness to commence litigationbased on allegations of patent and other intellectual property infringement. From time to time, third parties mayassert infringement claims against us. We may not prevail in any such litigation or may not be able to license anyvalid and infringed patents from third parties on commercially reasonable terms, if at all. Litigation, regardless ofthe outcome, is likely to result in substantial cost and diversion of our resources, including our management’stime. Any such litigation could materially adversely affect us.
We intend to protect our intellectual property rights vigorously, but there can be no assurance that ourefforts will be successful. In addition, the laws of other countries in which our products are sold may not protectour products and intellectual property rights to the same extent as the laws of the United States.
While our ability to effectively compete depends in large part on our ability to protect our intellectualproperty, we believe that our technical expertise, customer support capabilities, and ability to introduce newproducts in a timely and cost effective manner will be important factors in maintaining our competitive position.
We claim copyright and trademark protection for proprietary documentation for our products and a varietyof branding marks. We have registered “Silicon Motion” and its logo (a three-dimensional cube depiction of theletters “SM”), FCI, the FCI logo, “airRF,” “basicRF,” “ezRF,” “ezSYS,” “powerRF,” “twinRF,” “zipRF,”“zipSYS,” “SSDLifeGuard,” “SSDLifeSaver,” “TurboMLC,” “FerriSSD,” and “Ferri-eMMC” as trademarks inthe United States, Taiwan, and other countries.
We also attempt to protect our trade secrets and other proprietary information through agreements with ourcustomers, suppliers, employees and consultants, and through other customary security measures.
We have entered into license agreements with third party intellectual property vendors for wafer fabricationtool libraries, semiconductor IP core, computer aided design tools, and software.
Facilities
Our corporate headquarters are located in Hsinchu, Taiwan. As of the date of this annual report, we own this137,700 square feet facility, which houses our management and administration, operations, and research anddevelopment departments. In Taiwan, we also lease premises in Taipei, occupying approximately 50,500 squarefeet of floor space, which houses our sales and marketing, as well as research and development departments.
In addition to these facilities in Taiwan, in 2008 we purchased a facility in Shanghai, China with anaggregate floor space of approximately 15,900 square feet. We lease facilities in Seoul, Korea; Shenzhen, and
22

Beijing, China; Milpitas, California; and Yokohama, Japan for research and development, sales and marketing,and administration. These facilities in aggregate consist of approximately 63,000 square feet of floor space withlease terms expiring at various dates between 2015 and 2019.
We also own commercial property in Taipei of approximately 6,200 square feet, which we purchased inOctober 1998 for NT$32 million. This property, which was formerly our Taipei sales office, has not been used byus since 2004, and we currently lease out as office premises. It is our intention that we will sell this property aswe do not intend to use it for operating purposes.
Government Regulation
See Risk Factors — “We face substantial political risks associated with doing business in Taiwan because ofthe tense political relationship between Taiwan and the People’s Republic of China,” “Our business depends onthe support of the Taiwanese and South Korean governments, and a decrease in this support may increase our taxliabilities and decrease our net income,” and “We face substantial political risk associated from doing business inSouth Korea because of tensions in the political relationship between South Korea and North Korea” in Item 3above.
ITEM 4A. UNRESOLVED STAFF COMMENTS
None.
ITEM 5. OPERATING AND FINANCIAL REVIEW AND PROSPECTS
General Information
We are a fabless semiconductor company that designs, develops and markets high performance, low-powersemiconductor solutions to OEMs and other customers in the mobile storage and mobile communicationsmarkets. Our products are widely used in smartphones, tablets, digital cameras, notebooks, desktop PCs andindustrial and commercial applications.
For the mobile storage market, our key products are microcontrollers used in solid state storage devices suchas SSDs, eMMCs and other embedded flash applications, as well as removable storage products. More NANDflash products, especially next generation flash, whether produced by Samsung, SanDisk, Toshiba, Micron or SKHynix are supported by Silicon Motion controllers than any other company. We are the leading merchantsupplier of controllers for eMMC embedded memory used in smartphones and tablets and are increasinglyfocused on client SSD controllers for PCs and other applications.
For the mobile communications market, our key products are handset transceivers and mobile TV SoCs. Weare a dedicated provider of 4G LTE transceivers for Samsung’s smartphones and tablets.
We market our mobile storage products under the “SMI” brand and mobile communications products underthe “FCI” brand and sell our semiconductor solutions to leading OEMs and module makers worldwide. Ourcustomers include industry leaders such as Micron, Samsung, SK Hynix, Sony, and Transcend. We sell ourproducts through our direct sales force and distributors.
Our revenue growth and product mix has been constantly evolving due to continued technologicaladvancement of solid state storage solutions using NAND flash and the introduction of new consumer electronicsdevices with more advanced capabilities. Historically, controllers for removable flash memory cards used inmobile phones and digital cameras provided the majority of our revenue. Recently, a growing portion of ourrevenue growth have come from controllers for SSDs and embedded memory, specifically eMMC embeddedmemory used in smartphones and tablets. In 2013, our SSD and embedded product sales accounted for almosthalf our overall NAND flash controller sales and exceeded the sales of our card controllers and USB flash drive
23

controllers. We believe that over the next few years, as the market for devices using SSDs and embeddedmemory further expands, the majority of our revenue could come from these new growth products. We continueto focus on adapting our business to the changing end-markets for NAND flash memory and aligning ourresources accordingly. We have no assurance that our SSD and embedded memory products will growconsistently over the next few years, or at all.
The following discussion of our financial condition and results of operations is based upon and should beread in conjunction with our consolidated financial statements and their related notes included in this annualreport. This discussion contains forward-looking statements that involve risks and uncertainties. We caution youthat our business and financial performance are subject to substantial risks and uncertainties. Actual resultscould differ materially from those projected in the forward-looking statements. In evaluating our business, youshould carefully consider the information provided under the caption “Risk Factors” included in Item 3 of thisannual report.
Principal Factors Affecting Our Results of Operations
Net sales. Our net sales consist primarily of sales of our semiconductors, after deducting sales discounts andallowances for returns. The semiconductors that we sell are primarily for mobile storage and mobilecommunications markets. Net sales generated by these product groups for the periods indicated are as follows:
Year Ended December 31,
2011 2012 2013
US$ % US$ % US$ %
(in thousands, except percentage data)
Net SalesMobile Storage (1) . . . . . . . . . . . . . . . . . . . . . . . . . . . . . . . . 152,838 68 202,093 72 185,488 82Mobile Communications (2) . . . . . . . . . . . . . . . . . . . . . . . . 56,629 25 67,564 24 31,022 14Others (3) . . . . . . . . . . . . . . . . . . . . . . . . . . . . . . . . . . . . . . . 14,378 7 11,713 4 8,798 4
Total . . . . . . . . . . . . . . . . . . . . . . . . . . . . . . . . . . . . . . . . . . . . . . 223,845 100 281,370 100 225,308 100
(1) Includes controllers for flash memory cards, USB flash drives, SSDs, and eMMCs.(2) Includes mobile TV IC solutions and handset transceiver ICs.(3) Includes embedded graphics processors, demo boards, and non-recurring engineering income.
For the years ended December 31, 2011, 2012 and 2013 we derived approximately 27%, 26%, and 21%respectively, of our net sales from customers located in Taiwan and approximately 11%, 7%, and 10%respectively, of our net sales from customers located in the United States. We anticipate that a majority of our netsales will continue to come from customers located outside of the United States. The percentages of our net salesby geographic area for the periods indicated were as follows:
Year Ended December 31,
2011 2012 2013
CountryTaiwan . . . . . . . . . . . . . . . . . . . . . . . . . . . . . . . . . . . . . . . . . . . . 27% 26% 21%Korea . . . . . . . . . . . . . . . . . . . . . . . . . . . . . . . . . . . . . . . . . . . . . 35% 49% 51%China . . . . . . . . . . . . . . . . . . . . . . . . . . . . . . . . . . . . . . . . . . . . . 22% 13% 13%United States . . . . . . . . . . . . . . . . . . . . . . . . . . . . . . . . . . . . . . . 11% 7% 10%Others . . . . . . . . . . . . . . . . . . . . . . . . . . . . . . . . . . . . . . . . . . . . 5% 5% 5%
24

Our net sales are denominated primarily in U.S. dollars. The percentages of our net sales by currency for theperiods indicated are set forth in the following table:
Year Ended December 31,
2011 2012 2013
CurrencyU.S. dollars . . . . . . . . . . . . . . . . . . . . . . . . . . . . . . . . . . . . . . . . . 89% 93% 97%NT dollars . . . . . . . . . . . . . . . . . . . . . . . . . . . . . . . . . . . . . . . . . 4% — —Korean won . . . . . . . . . . . . . . . . . . . . . . . . . . . . . . . . . . . . . . . . 7% 7% 3%
The length of our sales cycle, from the day purchase orders are received until products are shipped tocustomers, is dependent on the availability of our product inventories. If we do not have sufficient inventories onhand to meet customer demands, approximately three months are generally required from the day purchaseorders are received until finished goods are manufactured and shipped to customers. This cycle can take up to sixmonths during times when capacity at independent foundries is being fully utilized. The potential delays inherentin the manufacturing process increase the risk that we may not be able to fulfill a customer’s order on time. All ofour sales are made by purchase orders. Because our practice, which is consistent with industry practice, allowscustomers to reschedule orders on relatively short notice, order backlog may not be a good indicator of our futuresales.
Because many of our semiconductor solutions are designed for the multimedia consumer electronics marketsuch as smartphones, tablets, digital cameras, and desktop and notebook PCs, we expect our business to besubject to seasonality, with increased net sales in the second half of each year, when customers place orders tomeet increased demand during year-end holiday seasons, and decreased net sales in the first half of each year.However, our rapid sales growth in recent years makes assessment of the impact of seasonal factors on ourbusiness difficult.
Cost of sales. Our cost of sales consists primarily of the following costs:
• cost of wafer fabrication;
• assembly, testing and shipping costs of our semiconductors;
• personnel and equipment costs associated with manufacturing support;
• quality assurance;
• cost of raw materials; and
• write-off of inventory.
We engage independent foundries for the manufacturing and processing of our semiconductors. Ourmanufacturing cost is subject to the cyclical supply and demand conditions typical of the semiconductor industry.Our cost per wafer generally fluctuates with the availability of capacity at independent foundries. We believe thatour cost of sales is substantially variable in nature, and will likely fluctuate as our market conditions change.
Research and development expenses. Our research and development expenses consist primarily of employeesalaries and related costs, stock-based compensation expense, fees paid for the use of intellectual properties anddesign tools developed by third parties, development cost of software, expenses for the design, development andtesting of system architecture, new product or product alternatives, costs for the construction of prototypes,occupancy costs and depreciation on research and development related equipment. We expense research anddevelopment expenditures as they are incurred. We expect research and development expenses to increase inabsolute terms in future periods as our net sales increase.
25

Sales and marketing expenses. Our sales and marketing expenses consist primarily of employee salaries andrelated costs, stock-based compensation expense, commissions paid to independent distributors and costs for ouradvertising and promotional activities. We expect that our sales and marketing expenses will increase in absoluteterms over the next several years as our net sales increase.
General and administrative expenses. Our general and administrative expenses consist primarily of generalemployee salaries and related costs, stock-based compensation expense, insurance premiums, professional feesand allowance for doubtful accounts. We expect that general and administrative expenses will increase inabsolute terms in future periods as our net sales increase.
Amortization of acquired intangible assets. Amortization of acquired intangible assets relates to intangibleassets, such as core technology and customer relationships, but excluding goodwill.
Impairment of goodwill and long-lived assets. We evaluate the recoverability of goodwill and long-livedassets annually, or sooner if events or changes in circumstances indicate that the carrying amount may not berecoverable.
Accounting for stock-base compensation. We grant both stock options and restricted stock units to ouremployees and members of the Board of Directors. The value of our restricted stock units is based on the closingprice of our shares on the date of grant and expensed over the vesting period. We estimate the fair value of stockoptions on the date of grant using the Black-Scholes option-pricing model and recognize stock compensationexpense over the requisite service period of the individual grantees, which generally equals the vesting period.
Non-operating income and expenses. Our non-operating income and expenses include gains or losses on thesales of investments, interest from deposited cash or short-term investments, gains or losses on foreign exchangerates, impairment of long-term investments, interest paid on loans and capital leases and other non-operating incomeand expenses not categorized above. We conduct an assessment on the value of our long-term investments quarterlyand make corresponding write-downs as required to the value of the long-term investments.
Provision for income taxes. We must make certain estimates and judgments in determining income taxexpenses for financial statement purposes. These estimates and judgments occur in the calculation of tax credits,benefits, deductions and allowance, and in the calculation of certain tax assets and liabilities, which arise fromdifferences in the timing of recognition of revenue and expense for tax and financial statement purposes, as wellas the interest and penalties related to uncertain tax positions. Significant changes to these estimates may result inan increase or decrease to our tax provision in a subsequent period.
We have operations in several countries and determine income taxes for each of the jurisdictions where weoperate. Taiwan and Korea are our two primary countries of operations.
In Taiwan, we have received tax exemptions from the government that are valid for a number of years andfor certain income streams relating to the expansion of production capacity or the development of newtechnologies. We also receive significant amounts of tax credits for applicable research and developmentexpenses incurred in Korea. Because of these and other tax benefits, the effective tax rates of our Taiwan andKorea operations have been lower than statutory tax rates. See “Risk Factors — Our business depends on thesupport of the Taiwanese and South Korean governments, and a decrease in this support may increase our taxliabilities and decrease our net income” for the risks relating to our ability to enjoy favorable tax policies of theTaiwanese and Korean governments.
Critical Accounting Policies and Estimates
Our discussion and analysis of our financial condition and results of operations are based upon our financialstatements, which have been prepared in accordance with accounting principles generally accepted in the UnitedStates.
26

The preparation of our consolidated financial statements requires us to make estimates and judgments thataffect the reported amount of assets, liabilities, net sales and expenses, and related disclosure of contingent assetsand liabilities. We evaluate our estimates on an on-going basis, including those related to product returns andpricing allowances, allowances for doubtful accounts, inventories, goodwill, long-lived assets, long-terminvestments, income taxes, litigation and contingencies. We base our estimates and judgments on our historicalexperience, knowledge of current conditions and our beliefs of what could occur in the future consideringavailable information. Because our estimates may vary in each situation, our actual results may differ from ourestimates under different assumptions and conditions.
Our management considers the following factors in reviewing our financial statements:
• the selection of critical accounting policies; and
• the judgments and other uncertainties affecting the application of those critical accounting policies.
The selection of critical accounting policies, the judgments and other uncertainties affecting the applicationof those policies and the sensitivity of reported results to changes in conditions and assumptions are factors to beconsidered when reviewing our financial statements. Our principal accounting policies are set forth in detail inNote 2 to our consolidated financial statements included elsewhere in this annual report.
We believe the following critical accounting policies affect our more significant judgments used in thepreparation of our financial consolidated statements.
Revenue recognition. Revenue from product sales are generally recognized upon shipment to the customerprovided that we have received a signed purchase order, the price has been fixed or is determinable, transfer of titlehas occurred in accordance with the shipping terms specified in the arrangement with the customer, collectabilityfrom the customer is considered reasonably assured, product returns are reasonably estimable and there are noremaining significant obligations or customer acceptance requirements. Revenue on development service orders isgenerally recognized upon completion and customer acceptance of contractually agreed milestones.
We record reserves to cover the estimated returns from our customers. Certain of our distributors havelimited rights of return and price protection rights on unsold inventory. The return rights are generally limited tofive percent of the monetary value of products purchased within the preceding six months, provided thedistributor places a corresponding restocking order of equal or greater value. The allowance for sales returns fordistributors and all customers is recorded at the time of sale based on historical returns information available,management’s judgment and any known factors at the time the financial statements are prepared that wouldsignificantly affect the allowance. However, because of the inherent nature of estimates, actual returns andallowances could be significantly different from our estimates. To the extent rates of return change, our estimatesfor the reserves necessary to cover such returns would also change which could have a negative impact on ourrecorded revenue and gross margin. We reserved approximately US$4.0 million, US$0.3 million andUS$1.3 million in 2011, 2012 and 2013, respectively, for estimated sales returns and discounts, representingapproximately 1.8%, 0.1% and 0.6% of our gross sales for those respective periods
Occasionally, we have reduced our product pricing due to market conditions, competitive considerations andother factors. Price protection rights are granted to certain distributors under our distribution agreements. Whenwe reduce the price of our products, price protection allows the distributor to claim a credit against itsoutstanding accounts receivable balances based on the new price of the inventory it has on hand as of the date ofthe price reduction. A reserve for price adjustments is recorded at the time of sale based on our historicalexperience. The amount of our reserve for price adjustments to distributors is minimal.
Allowance for doubtful accounts. We record an allowance for doubtful accounts based on our evaluation ofthe collectability of our accounts receivable. Normal payment terms are provided to customers and applied upontransfer of title. On an ongoing basis, we analyze the payment history of customer accounts, including recentcustomer purchases. In circumstances where we are aware of a specific customer’s inability to meet its financial
27

obligations to us, we record a specific allowance against amounts due to reduce the net recognized receivableto the amount we reasonably believe will be collected. For all other accounts receivable due from customers, wecategorize accounts receivable and make provisions based on a percentage of each category. We determine thesepercentages by examining our historical collection experience and current trends in the credit quality of ourcustomers as well as our internal credit policies. If the financial condition of our customers or economicconditions in general were to deteriorate, additional allowances may be required in the future and such additionalallowances would increase our operating expenses and therefore reduce our operating income and net income.
Our allowance for trade-related doubtful accounts were approximately US$2.6 million, US$1.6 million andUS$1.3 million as of December 31, 2011, 2012 and 2013, respectively, representing approximately 6.0%, 4.1%and 3.8% of our gross accounts receivables at the end of each respective periods.
Inventory valuation. We value inventories at the lower of cost or market value. Inventories are recorded atstandard cost and adjusted to the approximate weighted-average cost at the balance sheet date. Market valuerepresents the current replacement cost for raw materials, finished goods and work in process. We write downour inventory for estimated obsolescence or unmarketable inventory in an amount equal to the differencebetween the cost of inventory and the estimated market value based upon assumptions about future demand andmarket conditions. If actual market conditions are less favorable than those we projected, additional inventorywrite-downs may be required. Inventory impairment charges establish a new cost basis for inventory and chargesare not subsequently reversed to income even if circumstances later suggest that increased carrying amounts arerecoverable. In estimating our reserves for obsolescence, we primarily evaluate estimates based on the timing ofthe introduction of our new products and the quantities remaining of our old products and write down the valueof inventory on hand in excess of the estimated demand. We wrote down US$4.6 million, US$1.6 million andUS$2.5 million in 2011, 2012 and 2013, respectively, for estimated obsolete or unmarketable inventory.
Stock-based compensation. All share-based payments, including grants of stock options and restricted stockunits, are recognized in our financial statements based upon their respective grant date fair values.
Calculating the fair value of stock option awards at the date of grant requires the use of an appropriatevaluation model and judgment. We use the Black-Scholes valuation formula to estimate the fair value ofemployee stock options. The Black-Scholes formula requires the use of input assumptions, including expectedvolatility, expected term, expected dividend rate and expected risk-free rate of return. Risk-free interest rate isbased on the U.S. Treasury yield curve in effect at the time of grant. Expected volatilities are based on historicalvolatilities of our ADS prices. We estimated our options’ expected terms using our best estimate of the period oftime from the grant date that we expect the options to remain outstanding. If we determined that another methodfor estimating expected volatility or expected term is more reasonable than our current methods, or if anothermethod for calculating these input assumptions was prescribed by authoritative guidance, the fair valuecalculated for future stock option awards could change significantly from those used for past awards, even if thecritical terms of the awards were similar. Higher volatility and expected term will result in an increase to the fairvalue of stock option awards at the date of grant. The expected dividend rate and expected risk-free rate of returnare not as significant to the calculation of fair value. Stock option awards are expensed over the requisite serviceperiod of the individual grantees, which generally equals the vesting period.
Valuation of long-lived assets and intangible assets with finite useful life. We evaluate the recoverability oflong-lived assets and intangible assets whenever events or changes in circumstances indicate the carrying valuemay not be recoverable. The carrying value of a long-lived asset is considered impaired when the sum of theanticipated undiscounted cash flows from such asset is separately identifiable and is less than the carrying value.If impairment occurs, a loss based on the excess of carrying value over the fair market value of the long-livedasset is recognized. Fair market value is determined by reference to quoted market prices, if available, ordiscounted cash flows, as appropriate. The impairment evaluations and the estimate of fair market value involvemanagement estimates of assets’ useful lives and future cash flows. Actual useful lives and cash flows could bedifferent from those estimated by management. This could have a material effect on our operating results andfinancial condition. No impairment losses were recognized in 2011, 2012 and 2013.
28

Impairment of long-term investments. We evaluate the recoverability of long-term investments wheneverevents or changes in circumstances indicate the carrying value may not be recoverable. Impairment charges aredetermined based on the difference between our carrying value and our proportionate ownership of the investeecompany’s net assets at year end. No impairment losses were recognized in 2011, 2012 and 2013.
Business combinations. When we acquire businesses, we allocate the purchase price to tangible assets andliabilities and identifiable intangible assets acquired. Any residual purchase price is recorded as goodwill. Theallocation of the purchase price requires management to make significant estimates in determining the fair valuesof assets acquired and liabilities assumed, especially with respect to intangible assets. These estimates are basedon historical experience and information obtained from the management of the acquired companies. Theseestimates can include, but are not limited to, the cash flows that an asset is expected to generate in the future, theappropriate weighted-average cost of capital, and the synergistic benefits expected to be derived from theacquired business. These estimates are inherently uncertain and unpredictable. In addition, unanticipated eventsand circumstances may occur which may affect the accuracy or validity of such estimates.
Goodwill. We record goodwill when the consideration paid for an acquisition exceeds the fair value of nettangible and intangible assets acquired.
We measure and test goodwill on an annual basis or more frequently if we believe indicators of impairmentexist. Our impairment review process compares the fair value of the reporting unit in which the goodwill residesto its carrying value. We determined that our reporting units are equivalent to our operating segments orcomponents of an operating segment for the purposes of completing our impairment test. We utilize a two-stepapproach to testing goodwill for impairment. The first step tests for possible impairment by applying a fair value-based test. In computing fair value of our reporting units, we use estimates of future revenues, costs and cashflows from such units. The second step, if necessary, measures the amount of such impairment by comparing theimplied fair value of goodwill to its carrying value. If the carrying amount of goodwill exceeds its implied fairvalue, an impairment loss is recognized equal to that excess.
In 2011, 2012 and 2013, no impairment charges were recorded. The assessment was based upon adiscounted cash flow analysis and analysis of our market capitalization. The estimate of cash flow was basedupon, among other things, certain assumptions about expected future operating performance such as revenuegrowth rates and operating margins used to calculate projected future cash flows, risk-adjusted discount rates,future economic and market conditions, and determination of appropriate market comparables. We based our fairvalue estimates on assumptions we believed to be reasonable but that are unpredictable and inherently uncertain.The long-term financial forecast represented the best estimate that we had at that time and we believed that itsunderlying assumptions were reasonable. However, actual performance in the near-term and longer-term couldbe materially different from the forecast, which could impact future estimates of fair value of our reporting unitsand may result in a charge to earnings in future periods due to the potential for further write-down of goodwill inconnection with future impairment tests.
Accounting for income taxes. In preparing our consolidated financial statements, we are required to estimateour income taxes in each of the jurisdictions in which we operate. This process involves estimating our actualcurrent tax exposure together with assessing temporary differences resulting from differing treatment of items fortax and accounting purposes. These differences result in deferred tax assets and liabilities, which are includedwithin our consolidated balance sheet. We must then assess the likelihood that our deferred tax assets will berecovered from future taxable income within the relevant jurisdiction and, to the extent we believe that recoveryis not likely, we must establish a valuation allowance. We provide for a valuation allowance to the extent webelieve that it is more likely than not that the deferred tax assets will not be recovered from future taxableincome. Realization of the future tax benefits related to the deferred tax assets is dependent on many factors,including our ability to generate taxable income within the period during which the temporary differencesreverse, the outlook for the economic environment in which we operate, and the overall future industry outlook.
29

Should we determine that we would not be able to realize all or part of our net deferred tax asset in the future, anadditional allowance for the deferred tax asset would be charged to income in the period the determination wasmade.
We utilize a two-step approach to recognizing and measuring uncertain tax positions. The first step is toevaluate the tax position for recognition by determining if the weight of available evidence indicates it is morelikely than not that the position will be sustained on audit, including resolution of related appeals or litigationprocesses, if any. The second step is to measure the tax benefit as the largest amount which is more than 50%likely of being realized upon ultimate settlement. The total amount of unrecognized tax benefits as ofDecember 31, 2011, 2012 and 2013 was US$2.7 million, US$3.5 million and US$5.8 million, respectively,excluding accrued interest and penalties. As of December 31, 2012 and 2013, US$1.3 million and US$1.4 millionof interest and penalties were accrued. Fiscal years 2007 through 2013 remain subject to examination by theUS Internal Revenue Service. Fiscal years 2008 through 2013 remain subject to examination by other foreign taxjurisdictions. The ultimate outcome of tax matters may differ from our estimates and assumptions. Unfavorablesettlement of any particular issue would require the use of cash and could result in increased income tax expense.Favorable resolution could result in reduced income tax expense. Within the next 12 months, we do not expectthat our unrecognized tax benefits would change significantly. See Note 13 to the Consolidated FinancialStatements for further information regarding changes in unrecognized tax benefits during 2013.
Functional Currency. Based on an evaluation of economic facts and circumstances together with thefunctional currency analysis prescribed in ASC 830, on January 1, 2012, we changed the functional currency ofour largest operating subsidiary, SMI Taiwan, from the NT dollar to the U.S. dollar. As a result of SMI Taiwan’sfunctional currency change, we changed its reporting currency from the NT dollar to the U.S. dollar.
In 2005, at the time of our IPO, we determined that SMI Taiwan’s functional currency was the NT dollar,and this determination was used consistently until we determined significant and permanent changes in economicfacts and circumstances warranted a change in functional currency. Since the business profile and activities ofSMI Taiwan had changed significantly and did not appear to be temporary, we re-evaluated the functionalcurrency of SMI Taiwan based on recent economic facts and circumstances, including analysis prescribed inASC 830, and determined that the U.S. dollar had become the functional currency of SMI Taiwan.
The business activities of SMI Taiwan have changed significantly since 2005. In the past, the majority ofSMI Taiwan sales were to Taiwanese module maker customers; in 2012 the majority of SMI Taiwan sales wereto international OEMs. We believe this trend is not temporary because a fast growing and increasingly large andmaterial source of SMI Taiwan’s sales are from SSD and embedded memory products, and these products arepredominately sold to international OEM customers. The significance of SMI Taiwan’s other products, primarilycard and USB flash drive controller products, has been declining and will continue to decline due to the maturityof their markets, and a majority of these products are now sold to non-Taiwan-based customers. SMI Taiwan’scash flow, sales price, sales markets, expenses, financing and intercompany transactions are now primarilyU.S. dollar-based. Economic facts and circumstances, as well as functional currency analysis support ourdetermination that the U.S. dollar has become the functional currency of SMI Taiwan as of January 1, 2012. Asfrom January 1, 2012, we have reported our consolidated results in U.S. dollars, and we have recasted ourhistorical financial statements included in this Form 20-F from the NT dollar to the U.S. dollar. Items on ourhistorical balance sheet and income statement were converted from the NT dollar to the U.S. dollars at thefollowing rates:
Balance Sheet(at year-end NT dollar to
U.S. dollar rate)
Income Statement(at average NT dollar to
U.S. dollar rate)
2008 32.80 31.422009 31.99 32.552010 29.13 31.562011 30.28 29.53
30

Litigation and contingencies. From time to time, we have been subject to legal proceedings and claimsrelating to intellectual property rights and other actions arising out of the normal course of business, as well asother matters identified in “Legal Proceedings,” in Item 8 of this Annual Report. Our success and future revenuegrowth will depend, in part, on our ability to protect our intellectual property. We rely on a combination ofpatent, copyright, trademark and trade secret laws, as well as nondisclosure agreements and other methods, toprotect our proprietary technologies. We have been issued patents and may have additional patents in the future;however, we cannot provide assurance that any patent will be issued as a result of any applications or, if issued,that any claims allowed will be sufficiently broad to protect our technology. In addition, it is possible thatexisting or future patents may be challenged, invalidated or circumvented. It may be possible for a third party tocopy or otherwise obtain and use our products or technology without authorization, develop correspondingtechnology independently or design around our patents. Effective copyright, trademark and trade secretprotection may be unavailable or limited in foreign countries. These disputes may result in costly and timeconsuming litigation or the license of additional elements of our intellectual property for free.
It is possible that other companies may pursue litigation with respect to any claims such companies purportto have against us. The results of any litigation are inherently uncertain. In the event of an adverse result in anylitigation with respect to intellectual property rights relevant to our products that could arise in the future, wecould be required to obtain licenses to the infringed technology, pay substantial damages under applicable laws,cease the use and sale of infringing products or to expend significant resources to develop non-infringingtechnology. Litigation frequently involves substantial expenditures and can require significant managementattention, even if we ultimately prevail.
We have been or are currently involved in various claims and legal proceedings and have incurred certaincosts associated with defending litigation matters. Periodically, we review the status of each significant matterand assess the potential financial exposure. If the potential loss from any claim or legal proceeding is consideredprobable and the amount can be estimated, we accrue a liability for the estimated loss. Because of uncertaintiesrelated to these matters, accruals are based only on the best information available at the time.
Given the uncertainties associated with litigation, if our assessments prove to be wrong, or if additionalinformation becomes available such that we estimate that there is a possible loss or possible range of lossesassociated with these contingencies, then we would record the reasonably estimated liability, which could have amaterial and adverse effect on our operations, financial condition and cash flows.
Results of Operations
The following table sets forth our statements of operations as a percentage of net sales for the periodsindicated:
Year Ended December 31,
2011 2012 2013
Net sales 100.0% 100.0% 100.0%Cost of sales 51.7 53.2 52.7
Gross profit 48.3 46.8 47.3
Operating expenses:Research and development 18.1 18.1 20.6Sales and marketing 6.5 5.7 6.0General and administrative 5.1 4.3 5.0Amortization of intangible assets 0.3 — —
Total operating expenses 30.0 28.1 31.6
Operating income 18.3 18.7 15.7
31

Year Ended December 31,
2011 2012 2013
Non-operating income (expenses):Gain from disposal of short-term investments 0.0 0.0 0.0Unrealized holding gain (loss) on short-term investment — (0.0) —Interest income 0.3 0.5 0.8Dividend income — 0.0 —Interest expense (0.0) (0.0) (0.0)Foreign exchange gain (loss), net 2.5 0.1 (0.0)Other income (loss), net 0.0 0.0 0.0
Total non-operating income (loss) 2.8 0.6 0.8
Income (loss) before income taxes 21.1 19.3 16.5Income tax expense (benefit) 2.6 2.5 4.3
Net income (loss) 18.5% 16.8% 12.2%
Comparison of Year Ended December 31, 2013 to Year Ended December 31, 2012
Net sales.
Years Ended December 31
2012 2013
US$ % of net sales US$ % of net sales $ change % change
(in thousands, except percentage data)
Net salesMobile storage 202,093 72 185,488 82 (16,605) (8)Mobile communications 67,564 24 31,022 14 (36,542) (54)Others 11,713 4 8,798 4 (2,915) (25)
Net sales 281,370 100 225,308 100 (56,062) (20)
Our net sales decreased 20% year-over-year to approximately US$225.3 million in 2013, primarily becauseof decreasing mobile storage and mobile communications sales.
Our mobile storage revenue decreased 8% year-over-year primarily because of decreasing card and USBflash drive controller sales, partially offset by strong eMMC and SSD controller sales. Mobile communicationsrevenue decreased 54% because of decreasing LTE transceiver sales relating to our customer’s producttransition.
Gross profit.
Years Ended December 31
2012 2013
US$ % of net sales US$ % of net sales $ change % change
(in thousands, except percentage data)
Gross profit 131,720 47 106,610 47 (25,110) (19)
Gross profit as a percentage of net sales was unchanged at 47% in 2013 as compared to 2012. Our grossprofit excluding obsolete and unmarketable inventory write-downs as a percentage of revenue increased from47% in 2012 to 48% in 2013.
32

Research and development expenses.
Years Ended December 31
2012 2013
US$ % of net sales US$ % of net sales $ change % change
(in thousands, except percentage data)
Salary and benefits 26,423 9 19,333 9 (7,090) (27)Stock-based compensation 7,055 3 6,351 3 (704) (10)Other research and development 17,497 6 20,776 9 3,279 19
Research and development 50,975 18 46,460 21 (4,515) (9)
Our research and development expenses decreased 9% year-over-year to approximately US$46.5 million in2013. Salary and benefits decreased 27% year-over-year to approximately US$19.3 million, primarily because ofless compensation expenses in 2013. Stock-based compensation decreased 10% year-over-year to approximatelyUS$6.4 million, primarily because of lower RSU cost in 2013. Other expenses increased 19% year-over-year toapproximately US$20.8 million, primarily because of higher IC tape-out and other project expenses in 2013.
Sales and marketing expenses.
Years Ended December 31
2012 2013
US$ % of net sales US$ % of net sales $ change % change
(in thousands, except percentage data)
Salary and benefits 8,897 3 7,411 3 (1,486) (17)Stock-based compensation 2,494 1 2,197 1 (297) (12)Other sales and marketing 4,528 2 3,989 2 (539) (12)
Sales and marketing 15,919 6 13,597 6 (2,322) (15)
Our sales and marketing expenses decreased 15% year-over-year to approximately US$13.6 million in2013. Salary and benefits decreased 17% year-over-year to approximately US$7.4 million, primarily because ofless compensation expenses in 2013. Stock-based compensation decreased 12% year-over-year to approximatelyUS$2.2 million, primarily because of lower RSU cost in 2013. Other sales and marketing expenses decreased12% year-over-year to approximately US$4.0 million primarily because of less testing fees in 2013.
General and administrative expenses.
Years Ended December 31
2012 2013
US$ % of net sales US$ % of net sales $ change % change
(in thousands, except percentage data)
Salary and benefits 7,428 2 6,330 3 (1,098) (15)Stock-based compensation 1,878 1 1,406 1 (472) (25)Other general and administrative 2,850 1 3,514 1 664 23
General and administrative 12,156 4 11,250 5 (906) (7)
Our general and administrative expenses decreased 7% year-over-year to approximately US$11.3 million in2013. Salary and benefits decreased 15% year-over-year to approximately US$6.3 million, primarily because ofless compensation expenses in 2013. Stock-based compensation decreased 25% year-over-year to approximatelyUS$1.4 million, primarily because of lower RSU cost in 2013.
33

Stock-based compensation
The following table presents details of total stock-based compensation expense that is included in eachfunctional line item in our consolidated statements of income:
Years Ended December 31
2012 2013
US$ % of net sales US$ % of net sales $ change % change
(in thousands, except percentage data)
Cost of sales 375 — 308 — (67) (18)Research and development 7,055 3 6,351 3 (704) (10)Sales and marketing 2,494 1 2,197 1 (297) (12)General and administrative 1,878 1 1,406 1 (472) (25)
Total stock-based compensation 11,802 5 10,262 5 (1,540) (13)
Total stock-based compensation decreased 13% primarily because of lower RSU cost in 2013.
See Note 15 of Notes to Consolidated Financial Statements for a discussion of activity related to share-based awards.
Interest income . Our interest income increased to approximately US$1.8 million for the year endedDecember 31, 2013 from approximately US$1.4 million for the year ended December 31, 2012 because of higherlevels of cash and cash equivalents.
Interest expense. Our interest expense increased to approximately US$110 thousand for the year endedDecember 31, 2013 from approximately US$61 thousand for the year ended December 31, 2012.
Foreign exchange gain (loss). For the year ended December 31, 2013, we had a foreign exchange loss lessthan US$0.1 million, compared with a foreign exchange gain of US$0.4 million for the year ended December 31,2012. We do not presently engage in any hedging activities.
Income tax expense (benefit). Our income tax expense was approximately US$9.8 million for the year endedDecember 31, 2013 compared to an income tax expense of approximately US$7.1 million for the year endedDecember 31, 2012.
Net income (loss). Net income was approximately US$27.4 million for the year ended December 31, 2013compare to a net income of approximately US$47.2 thousand million for the year ended December 31, 2012.
Comparison of Year Ended December 31, 2012 to Year Ended December 31, 2011
Net sales.
Years Ended December 31
2011 2012
US$ % of net sales US$ % of net sales $ change % change
(in thousands, except percentage data)
Net salesMobile storage 152,838 68 202,093 72 49,255 32Mobile communications 56,629 25 67,564 24 10,935 19Others 14,378 7 11,713 4 (2,665) (19)
Net sales 223,845 100 281,370 100 57,525 26
Our net sales increased 26% year-over-year to approximately US$281.4 million in 2012, primarily becauseof increasing mobile storage and mobile communications sales.
34

Our mobile storage revenue increased 32% year-over-year primarily because of strong eMMC and cardcontroller sales. Mobile communications revenue increased 19% because of strong LTE transceiver sales.
Gross profit.
Years Ended December 31
2011 2012
US$ % of net sales US$ % of net sales $ change % change
(in thousands, except percentage data)
Gross profit 108,039 48 131,720 47 23,681 22
Gross profit as a percentage of net sales decreased from 48% in 2011 to 47% in 2012 primarily because oflower card and USB flash drive gross margins. Our gross profit excluding obsolete and unmarketable inventorywrite-downs as a percentage of revenue decreased from 50% in 2011 to 47% in 2012.
Research and development expenses.
Years Ended December 31
2011 2012
US$ % of net sales US$ % of net sales $ change % change
(in thousands, except percentage data)
Salary and benefits 21,522 10 26,423 9 4,901 23Stock-based compensation 5,049 2 7,055 3 2,006 40Other research and development 13,930 6 17,497 6 3,567 26
Research and development 40,501 18 50,975 18 10,474 26
Our research and development expenses increased 26% year-over-year to approximately US$51.0 million in2012. Salary and benefits increased 23% year-over-year to approximately US$26.4 million, primarily because ofhigher headcount and compensation expenses in 2012. Stock-based compensation increased 40% year-over-yearto approximately US$7.1 million, primarily because of higher cost of RSUs granted to employees in 2012. Otherexpenses increased 26% year-over-year to approximately US$17.5 million, primarily because of higher IC tape-out and other project expenses in 2012.
Sales and marketing expenses.
Years Ended December 31
2011 2012
US$ % of net sales US$ % of net sales $ change % change
(in thousands, except percentage data)
Salary and benefits 8,203 4 8,897 3 694 8Stock-based compensation 2,060 1 2,494 1 434 21Other sales and marketing 4,274 2 4,528 2 254 6
Sales and marketing 14,537 7 15,919 6 1,382 10
Our sales and marketing expenses increased 10% year-over-year to approximately US$15.9 million in2012. Salary and benefits increased 8% year-over-year to approximately US$8.9 million, primarily because ofthe higher headcount and compensation expenses in 2012. Stock-based compensation increased 21% year-over-year to approximately US$2.5 million, primarily because of higher cost of RSUs granted to employees in2012. Other sales and marketing expenses increased 6% year-over-year to approximately US$4.5 millionprimarily because of higher testing fees in 2012.
35

General and administrative expenses.
Years Ended December 31
2011 2012
US$ % of net sales US$ % of net sales $ change % change
(in thousands, except percentage data)
Salary and benefits 6,446 3 7,428 2 982 15Stock-based compensation 1,514 1 1,878 1 364 24Other general and administrative 3,363 1 2,850 1 (513) (15)
General and administrative 11,323 5 12,156 4 833 7
Our general and administrative expenses increased 7% year-over-year to approximately US$12.2 million in2012. Salary and benefits increased 15% year-over-year to approximately US$7.4 million, primarily because ofhigher compensation expenses in 2012. Stock-based compensation increased 24% year-over-year toapproximately US$1.9 million, primarily because of higher cost of RSUs granted to employees in 2012.
Stock-based compensation
The following table presents details of total stock-based compensation expense that is included in eachfunctional line item in our consolidated statements of income:
Years Ended December 31
2011 2012
US$ % of net sales US$ % of net sales $ change % change
(in thousands, except percentage data)
Cost of sales 255 — 375 — 120 47Research and development 5,049 2 7,055 3 2,006 40Sales and marketing 2,060 1 2,494 1 434 21General and administrative 1,514 1 1,878 1 364 24
Total stock-based compensation 8,878 4 11,802 5 2,924 33
Total stock-based compensation increased 33% primarily because of higher cost of RSUs granted toemployees in 2012.
See Note 15 of Notes to Consolidated Financial Statements for a discussion of activity related to share-based awards.
Amortization of intangible assets.
Years Ended December 31
2011 2012
US$ % of net sales US$ % of net sales $ change % change
(in thousands, except percentage data)
Amortization of intangible assets 694 — — — (694) (100)
The intangible assets were fully amortized in 2011 and we had no amortization of intangible assets expensesin 2012.
Interest income . Our interest income increased to approximately US$1.4 million for the year endedDecember 31, 2012 from approximately US$0.6 million for the year ended December 31, 2011 because of higherlevels of cash and cash equivalents.
36

Interest expense. Our interest expense decreased to approximately US$61 thousand for the year endedDecember 31, 2012 from approximately US$75 thousand for the year ended December 31, 2011 primarilybecause of smaller government R&D grants in 2012 compared with 2011.
Foreign exchange gain (loss). For the year ended December 31, 2012, we had a foreign exchange gain ofUS$0.4 million, compared with a foreign exchange gain of US$5.7 million for the year ended December 31,2011. We do not presently engage in any hedging activities.
Income tax expense (benefit). Our income tax expense was approximately US$7.1 million for the year endedDecember 31, 2012 compared to an income tax expense of approximately US$5.7 million for the year endedDecember 31, 2011.
Net income (loss). Net income was approximately US$47.2 million for the year ended December 31, 2012compare to a net income of approximately US$41.5 thousand million for the year ended December 31, 2011.
Liquidity and Capital Resources
As of December 31, 2013, we had approximately US$161.7 million in cash and cash equivalents andapproximately US$0.7 million in short-term investments. We maintain our cash balances in bank deposits and inmoney market instruments. We do not currently engage in any currency hedging activities. Our short-terminvestments consist primarily of trading bond funds.
We believe our existing cash balances and short-term investments, together with cash we expect to generatefrom operating activities, will be sufficient to meet our anticipated cash needs for at least the next 12 months.Our future capital requirements will depend on many factors, including the level of our net sales, the timing andextent of spending to support product development efforts, the expansion of sales and marketing activities, thetiming of introductions of new products, the costs to ensure access to adequate manufacturing capacity, thecontinuing market acceptance of our products, availability of attractive acquisition opportunities, dividendpayments, and share repurchases. We could be required, or could elect, to seek additional funding through publicor private equity or debt financing, and additional funds may not be available on terms acceptable to us or at all.
The following table sets forth a summary of our cash flows for the periods indicated:
Year Ended December 31,
2011 2012 2013
US$ US$ US$(in thousands)
Consolidated Cash Flow Data:Net cash provided by (used in) operating activities 54,261 69,236 49,128Net cash provided by (used in) investing activities (13,947) (4,749) (12,815)Net cash provided by (used in) financing activities 2,294 224 (29,493)Depreciation and amortization 5,580 5,881 6,429Capital expenditures (4,916) (4,280) (12,772)
Operating activities
Our net cash provided by operating activities was approximately US$49.1 million for the year endedDecember 31, 2013, compared to net cash provided by operating activities of approximately US$69.2 million andUS$54.3 million during 2012 and 2011, respectively.
For the year ended December 31, 2013, cash flow provided by operations of US$49.1 million resultedprimarily from our net income of US$27.4 million and the following reasons:
• Our net income includes substantial non-cash charges, namely US$6.4 million of depreciation andamortization and US$10.3 million of stock-based compensation.
• Our disposal of short-term investments net of purchase of short-term investments wereUS$14.1 million.
37

• We reduced working capital by US$10.3 million due to declining sales. Inventory increased byUS$1.5 million, notes and accounts receivable decreased by US$5.6 million, notes and accountspayable decreased by US$12.0 million, income tax payable increased by US$3.5 million, and otherassets net of other liabilities used US$5.9 million of cash.
For the year ended December 31, 2012, cash flow provided by operations of US$69.2 million resultedprimarily from our net income of US$47.2 million and the following reasons:
• Our net income includes substantial non-cash charges, namely US$5.9 million of depreciation andamortization and US$11.8 million of stock-based compensation.
• Our purchase of short-term investments net of disposal of short-term investments were US$12.0million.
• We increased working capital by US$14.6 million to support increasing sales. Inventory increased byUS$1.8 million, notes and accounts receivable decreased by US$2.0 million, notes and accountspayable increased by US$5.6 million, income tax payable increased by US$1.3 million, and otherassets net of other liabilities provided US$7.5 million of cash.
Investing activities
Our net cash used in investing activities was approximately US$12.8 million for the year endedDecember 31, 2013, compared to net cash used in investing activities of approximately US$4.7 million for theyear ended December 31, 2012. In 2013, we purchased additional facilities in Hsinchu, Taiwan and design tools.
Our net cash used in investing activities was approximately US$4.7 million for the year endedDecember 31, 2012, compared to net cash used in investing activities of approximately US$13.9 million for theyear ended December 31, 2011. In 2011 we provided more collateral to our foundry supplier.
Financing activities
Our net cash used by financing activities was approximately US$29.5 million for the year endedDecember 31, 2013, compared to net cash provided by financing activities of approximately US$0.2 million forthe year ended December 31, 2012. Our cash used in financing activities in 2013 was primarily forUS$10.0 million of ADS repurchases and US$19.9 million of dividend payments.
Our net cash provided by financing activities was approximately US$0.2 million for the year endedDecember 31, 2012, compared to net cash provided by financing activities was approximately US$2.3 million forthe year ended December 31, 2011. Our cash generated from financing activities in 2012 was primarily fromissuance of ordinary shares upon exercise of employee stock options.
Contractual Obligations
The following table sets forth our commitments to settle contractual obligations in cash as of December 31,2013:
Amount of Commitment Maturing by Year
TotalLess Than
1 Year 1-3 Years 3-5 YearsMore Than
5 Years
US$ US$ US$ US$ US$(in thousands)
Operating leases 6,106 2,080 2,799 1,227 —Capital leases 15 4 9 2 —Pension 1,363 1,363 (a) (a) (a)Other long term liabilities 418 207 211 — —
Contractual cash obligations 7,902 3,654 3,019 1,229 —
(a) Our pension obligation after one year has not been estimated.
38

We increased long-term taxes payable of US$1,883 thousand related to uncertain tax positions as ofDecember 31, 2013. At this time, we are unable to make a reasonably reliable estimate of the timing of paymentsin individual years beyond 12 months due to uncertainties in the timing and outcome of tax audit.
Off-balance Sheet Arrangements
We currently do not have any outstanding derivative financial instruments, off-balance sheet guarantees orarrangements, interest rate swap transactions, or foreign currency forward contracts. We do not engage in anytrading activities involving non-exchange traded contracts.
Recent Accounting Pronouncements
In December 2011, Financial Accounting Standards Board (“the FASB”) issued an accounting update,which creates new disclosure requirements regarding the nature of an entity’s rights of setoff and relatedarrangements associated with its financial instruments and derivative instruments. Certain disclosures of theamounts of certain instruments subject to enforceable master netting arrangements or similar agreements wouldbe required, irrespective of whether the entity has elected to offset those instruments in the statement of financialposition. The disclosure requirements are effective for annual reporting periods beginning on or after January 1,2013 with retrospective application required. The adoption of this guidance did not have a material impact on theCompany’s financial statement disclosures since the financial instruments and derivative instruments to which itapplies are not significant.
In February 2013, the FASB amended its presentation guidance on comprehensive income to improve thereporting of reclassifications out of accumulated other comprehensive income (“AOCI”). The new accountingguidance requires entities to provide information about the amounts reclassified out of AOCI by component. Inaddition, entities are required to present, either on the face of the financial statements or in the notes, significantamounts reclassified out of AOCI by the respective line items of net income, but only if the amount reclassifiedis required to be reclassified in its entirety in the same reporting period. For amounts that are not required to bereclassified in their entirety to net income, entities are required to cross-reference to other disclosures thatprovide additional details about those amounts. The amended guidance is effective prospectively for reportingperiods beginning after December 15, 2012. The adoption of this guidance did not have a material impact on theCompany’s results of operations, financial position or cash flows.
In February 2013, the FASB issued an accounting update, which provides guidance for the recognition,measurement and disclosure of obligations resulting from joint and several liability arrangements for which thetotal amount of the obligation within the scope of the guidance is fixed at the reporting date. The guidancerequires an entity to measure such obligations as the sum of the amount that the reporting entity agreed to pay onthe basis of its arrangement among its co-obligors plus additional amounts the reporting entity expects to pay onbehalf of its co-obligors. The new guidance is effective for fiscal years beginning after December 15, 2013. Theadoption of this guidance is not expected to have a material impact on the Company’s results of operations,financial position or cash flows.
In March 2013, the FASB issued an accounting update that amended guidance on a parent’s accounting forthe cumulative translation adjustment upon derecognition of a subsidiary or group of assets within a foreignentity. This guidance requires that the parent release any related cumulative translation adjustment into netincome only if the sale or transfer results in the complete or substantially complete liquidation of the foreignentity in which the subsidiary or group of assets had resided. The guidance is effective for fiscal years beginningafter December 15, 2013. The adoption of this guidance is not expected to have a material impact on theCompany’s results of operations, financial position or cash flows.
In July 2013, the FASB issued an accounting update, which creates new guidance regarding the presentationof an unrecognized tax benefit when a net operating loss carryforward, a similar tax loss, or a tax credit
39

carryforward exists. Under certain circumstances, unrecognized tax benefits should be presented in the financialstatements as a reduction to a deferred tax asset for a net operating loss carryforward, a similar tax loss, or a taxcredit carryforward. The guidance is effective for fiscal years beginning after December 15, 2013 and earlyadoption is permitted. Since this guidance is a change in financial statement presentation only, its adoption is notexpected to have material impact on the Company’s result of operations, financial position or cash flows.
In April 10, 2014, the FASB issued an accounting update, which changes the criteria for reportingdiscontinued operations for all public and nonpublic entities. The guidance requires only disposals that representa strategic shift that has (or will have) a major effect on the entity’s results and operations would qualify asdiscontinued operations. The guidance also requires entities 1) to expand their disclosures about discontinuedoperations to include more information about assets, liabilities, income, and expenses and 2) to disclose the pre-tax income attributable to a disposal of “of an individually significant component of an entity that does notqualify for discontinued operations presentation in the financial statements.” The guidance is effective for fiscalyears beginning after December 15, 2014 and early adoption is prohibited. The adoption of this guidance is notexpected to have a material impact on the Company’s results of operations, financial position or cash flow.
ITEM 6. DIRECTORS, SENIOR MANAGEMENT AND EMPLOYEES
Executive Officers and Directors
Members of our board of directors are elected by our shareholders. Our board of directors consists of sevendirectors.
Our executive officers are appointed by, and serve at the discretion of, our board of directors. The followingtable sets forth information regarding our directors and executive officers as of the date of this annual report.
Name Age Position
James Chow 63 Chairman of the BoardWallace C. Kou 55 President, Chief Executive Officer and DirectorSteve Chen 42 DirectorTsung-Ming Chung 64 DirectorKenneth Kuan-Ming Lin 61 DirectorLien-Chun Liu 56 DirectorYung-Chien Wang 51 DirectorRiyadh Lai 45 Chief Financial OfficerFrank Chang 48 VP of R&D, Mobile StorageKen Chen 52 VP of OperationsNelson Duann 45 VP of Product Marketing, Mobile StorageSangwoo Han 45 Senior VP and General Manager, Mobile CommunicationsJohn (Chun-O) Kim 53 VP of Sales, Mobile CommunicationsArthur Yeh 53 VP of Sales, Mobile StorageJohn (Jong Ryul) Lee 50 VP of R&D, Mobile CommunicationsKevin Yeh 50 VP of R&D, Algorithm & TechnologyFrank Shu 57 VP of R&D, SSD System Technology and VCTJason Chiang 46 VP of HR and Administration, and Special Assistant to CEORobert Fan 50 VP and General Manager, SMI U.S.
Executive Officers and Directors
James Chow, Chairman of the Board of Directors
Mr. Chow has served as the Chairman of our board of directors since April 2005. Mr. Chow has been theChairman of Concord Financial Co., Ltd. since 1993. Concord Financial Co., Ltd. is an investment holdingcompany and was one of our significant shareholders. Mr. Chow has an MBA from Columbia University.
40

Wallace C. Kou, President, Chief Executive Officer, Director
Mr. Kou founded Silicon Motion in 1995 and has been our President and Chief Executive Officer since ourfounding. Prior to founding Silicon Motion, Mr. Kou was the Vice President and Chief Architect at the MultimediaProducts Division of Western Digital Corporation, which developed graphics processors for notebook PCs and wassold to Philips Semiconductor in 1995. Before Western Digital, Mr. Kou worked for Wyse Technology. Mr. Kouhas a BS in Electrical & Control Engineering from the National Chiao Tung University in Taiwan and an MS inElectrical & Computer Engineering from the University of California at Santa Barbara.
Steve Chen, Director
Mr. Chen has been the chairman of Mercuries Bakery Co., Ltd. since 2008 and is a Director of Mercuries &Associates, Ltd., Mercuries Furniture Co., Ltd., Mercuries General Media Inc., Cameo Communications, Inc.,and Tons Lightology Inc. Mr. Chen has a Master of Engineering degree from Cornell University.
Tsung-Ming Chung, Director
Mr. Chung joined our board of directors in June 2005. Mr. Chung is the Chairman of DynapackInternational Technology Corp, a leading provider of battery packs for notebook PCs and tablets. From 1985 to2000, Mr. Chung was an audit partner at Arthur Andersen. He is also a director at Far East International Bankand Taiwan Mobile Corporation. Mr. Chung has a BA in Business Administration from the National TaiwanUniversity and an MBA from the National Cheng-chi University in Taiwan.
Kenneth Kuan-Ming Lin, Director
Mr. Lin joined our board of directors in September 2009. Mr. Lin is the Chairman of Premier CapitalManagement Corp., the Taiwan Private Equity and Venture Capital Association, and Ruby Tech Corp., and is amember of the board of directors of the Straits Economics & Cultural Interchange Association. He waspreviously Assistant Vice President of MiTAC Corporation from 1977 to 1984, Vice President of SynnexCorporation from 1984 to 1987, President of TaiDevelop Information Corp. from 1987 to 1990 and Chairman ofthe board of System General Corp. from 1998 to 2001. Mr. Lin has a BS in Electrical Engineering from theNational Taiwan University.
Lien-Chun Liu, Director
Ms. Liu joined our board of directors in June 2005. Ms. Liu is a research fellow at the Taiwan ResearchInstitute. She also currently serves on the board of supervisors of Concord VIII Venture Capital Co., Ltd and on theboard of directors of New Tamsui Golf Course. From 2000 to 2004, she also served on the board of supervisors ofChina Television Corp. Ms. Liu has a BA from Wellesley College and a JD from Boston College Law School.
Yung-Chien Wang, Director
Mr. Wang joined our board of directors in June 2005. Mr. Wang has over 20 years of working experience inthe human resource and legal services industries. Mr. Wang has been a consultant of Professional Trust Co., Ltd.,a human resource consulting firm in Taiwan since August 1998 and is currently its Vice President. Mr. Wang hasa law degree from Fu Jen Catholic University in Taiwan.
Riyadh Lai, Chief Financial Officer
Mr. Lai joined us in April 2007 from ING Corporate Finance, Asia, where he was the Head of theTechnology Group. Previously, he was also an investment banker at Morgan Stanley and ABN AMRO andfinance manager at PepsiCo in Hong Kong and New York. Mr. Lai has over a decade of financial managementand M&A transaction experience. He has a BA in Economics from Georgetown University and an MBA fromNew York University.
41

Frank Chang, VP of R&D, Mobile Storage
Mr. Chang has served as our Vice President of research and development since 2008. Mr. Chang is head ofresearch and development for our mobile storage products and has around 20 years of experience in theintegrated circuit design industry. He was previously a project manager of firmware development at HoltekSemiconductors. Mr. Chang has a BS in Electrical Engineering from the National Changhua University ofEducation in Taiwan.
Ken Chen, VP of Operations
Mr. Chen has served as our Vice President in charge of operations since November 2003. Mr. Chen has over20 years of manufacturing and operations experience in the semiconductor industry, managing supply chain andvirtual manufacturing systems including wafer fabrication, mask tooling, as well as assembly and testing.Mr. Chen previously served in management positions at Faraday Technology and UMC, and joined us in 2003.Mr. Chen has a BS in Industrial Engineering from Chung Yuan Christian University in Taiwan and an MS inIndustrial Engineering and Engineering Management from the National Tsing Hua University, Taiwan.
Nelson Duann, VP of Product Marketing, Mobile Storage
Mr. Duann became our Vice President in charge of our mobile storage marketing in September 2010. Hejoined Silicon Motion in August 2007 as a product marketing director and R&D team leader. Mr. Duann hasalmost 15 years of experience in the semiconductor industry in product design, development and marketing. Priorto Silicon Motion, he worked for Sun Microsystems Inc., focusing on UltraSPARC micro Processor projects. Hehas an MS in Communications Engineering from National Chiao Tung University in Taiwan and an MS inElectrical Engineering from Stanford University.
Sangwoo Han, Senior VP and General Manager, Mobile Communications
Mr. Han became the General Manager of our Mobile Communications product line in July 2008. He wasformerly the Chief Technology Officer at FCI, a company that we acquired in April 2007. Mr. Han joined FCI in2003 and had been in charge of product design, development, production and marketing. In 1997, he co-foundedRF Solutions Inc. in Atlanta, Georgia, which became the Anadigics Wireless LAN Center of Excellence.Mr. Han has a BS in Electrical Engineering from Carnegie-Mellon University, an MS in Electrical Engineeringfrom the University of Pennsylvania, and a PhD in Electrical Engineering from the Georgia Institute ofTechnology.
John (Chun-O) Kim, VP of Sales, Mobile Communications
Mr. Kim became the Vice President of our Mobile Communications product line in July 2008. He wasformerly the Vice President of Sales at FCI, a company that we acquired in April 2007. Mr. Kim joined FCI in2006 and had previously served in management positions at Hewlett-Packard’s semiconductor division (nowAvago Technologies) and as a CEO of a private company. Mr. Kim has over 16 years of semiconductor salesleadership experience, including managing marketing strategies, product promotions and sales activities. He hasan MS in Electrical Engineering from Ajou University in Korea.
Arthur Yeh, VP of Sales, Mobile Storage
Mr. Yeh has served as our Vice President in charge of our mobile storage sales since November 2004.Mr. Yeh has over 15 years of sales experience managing marketing strategies, including product promotions andsales activities for semiconductor products. Mr. Yeh previously served in management positions at VIATechnologies for 10 years and joined us in 2004. Mr. Yeh holds an MS degree in Management BusinessAdministration from the National Chung Hsing University, Taiwan.
42

John (Jong Ryul) Lee, VP of R&D, Mobile Communications
Mr. Lee became the Vice President of our Mobile Communications product line in July 2008. He wasformerly the Vice President of R&D at FCI, a company that we acquired in April 2007. Mr. Lee joined FCI in2000 and had been in charge of product design, development, production and quality systems. In 2013, hebecame a director of the Semiconductor & Device Society of The Institute of Electronics Engineers of Korean(IEEK). He was previously a senior engineer at the Electronics and Telecommunications Research Institute(ETRI) in Korea. Mr. Lee has a BS and an MS in Electronics Engineering from Chung Ang University in Korea.
Kevin Yeh, VP of R&D, Algorithm & Technology
Mr. Yeh became our Vice President of research and development in August 2012. He joined Silicon Motionin September 2003 as a product marketing director and then he led the Algorithm and Technology R&D team.Mr. Yeh has more than 20 years of experience in semiconductor product design, development and marketing.Prior to Silicon Motion, Mr. Yeh worked in Taiwan Semiconductor Manufacturing Company, Neo Magic,VLSI Technology and LSI. Mr. Yeh holds a BS degree in Control Engineering from National Chiao TungUniversity in Taiwan and an MS degree in Electronic Engineering from Syracuse University.
Frank Shu, VP of R&D, SSD System Technology and VCT
Mr. Shu has served as our Vice President of SSD System Technology since July 2012. Mr. Shu has morethan 20 years of experience in the storage and PC system industry. Before joining Silicon Motion, Mr. Shu wasthe VP of R&D in charge of SSD testing at Allion Test Lab Inc. Mr. Shu also worked for Microsoft and played akey role in defining and developing the software storage stack for the Windows operating system. Prior toMicrosoft, Mr. Shu worked for Fujitsu, Seagate and Everex. Mr. Shu has a BS in Electronic Engineering fromNanjing Aeronautical Institute in China and an MS degree in Computer Science from the Oregon GraduateInstitution of Science & Technology.
Jason Chiang, VP of HR and Administration and Special Assistant to CEO
Mr. Chiang joined Silicon Motion in 2002 and has been serving as our Vice President of HR andAdministration and Special Assistant to our CEO since 2005. Mr. Chiang has more than 18 years of finance andbusiness administration experience. Prior to joining Silicon Motion, Mr. Chiang was a Director at ConcordVenture Capital. Mr. Chiang has a BS in Economics from the National Taiwan University and an MS degree inBusiness Administration from Rochester University.
Robert Fan, VP and General Manager, SMI U.S.
Mr. Fan has served as our Vice President and General Manager of SMI U.S. since May 2013. He managesSilicon Motion’s business operations in the U.S. and Europe and has over 20 years of sales and marketingexperience. Prior to Silicon Motion, Mr. Fan served in executive management roles at Spansion, Entorian,Berkana Wireless (acquired by Qualcomm) and Resonext (acquired by RF Micro Devices). He also spent overnine years at Intel in sales, marketing and management positions. Mr. Fan holds a BS in Electrical Engineeringfrom the University of California, Berkeley and MSEE from Santa Clara University, and completed the GeneralManagement Executive Program at McCombs School of Business, University of Texas.
There is no arrangement or understanding with major shareholders, customers, suppliers or others pursuantto which any person referred to above was selected as a director or member of senior management.
43

Board Practices
Board Committees
Our board of directors has established an audit committee, a compensation committee, and a nominating andcorporate governance committee.
Audit Committee. The audit committee is responsible for reviewing the financial information that will beprovided to shareholders and others, reviewing the systems of internal controls that management and the board ofdirectors have established, appointing, retaining and overseeing the performance of the independent registeredpublic accounting firm, overseeing our accounting and financial reporting processes and the audits of ourfinancial statements, and pre-approving audit and permissible non-audit services provided by the independentregistered public accounting firm. Tsung-Ming Chung, Lien-Chun Liu, and Yung-Chien Wang are members ofour audit committee. Our board of directors has determined that Mr. Chung, the Chairman of the auditcommittee, is the committee’s “Audit Committee Financial Expert” as required by Nasdaq and U.S. Securitiesand Exchange Commission (“SEC”) rules.
Compensation Committee. The compensation committee’s basic responsibility is to review the performanceand development of management in achieving corporate goals and objectives and to assure that our seniorexecutives are compensated effectively in a manner consistent with our strategy, competitive practice and therequirements of the appropriate regulatory bodies. Toward that end, this committee oversees, reviews andadministers all of our compensation, equity and employee benefit plans and programs. Lien-Chun Liu, SteveChen, and Yung-Chien Wang are members of our compensation committee, with Mr. Chen serving as theChairman of the committee.
Nominating and Corporate Governance Committee. The nominating and corporate governance committee isresponsible for overseeing, reviewing and making periodic recommendations concerning our corporategovernance policies, and for recommending to the full board of directors candidates for election to the board ofdirectors. Lien-Chun Liu, Steve Chen, and Yung-Chien Wang are members of our nominating and corporategovernance committee, with Ms. Liu serving as the Chairman of the committee.
Our board of directors has adopted a code of ethics, which is applicable to all of our employees. Our Codeof Ethics is posted on our website at www.siliconmotion.com.
Duties of Directors
Under Cayman Islands law, our directors have a duty to act honestly, in good faith and with a view to thebest interests of our company. Our directors also have a duty to exercise the care, diligence and skills that areasonably prudent person would exercise in comparable circumstances. In fulfilling their duty of care to ourcompany, our directors must ensure compliance with our memorandum and articles of association.
The functions and powers of our board of directors include, among others:
• convening shareholders’ meetings and reporting its work to shareholders at such meetings;
• implementing shareholders’ resolutions;
• determining our business plans and investment proposals;
• formulating our profit distribution plans and loss recovery plans;
• determining our debt and finance policies and proposals for the increase or decrease in our registeredcapital and the issuance of debentures;
• formulating our major acquisition and disposition plans, and plans for merger, division or dissolution;
44

• proposing amendments to our amended and restated memorandum and articles of association; and
• exercising any other powers conferred by the shareholders’ meetings or under our amended andrestated memorandum and articles of association.
Terms of Directors and Officers
Under Cayman Islands law and our articles of association, our directors hold office until a successor hasbeen duly elected and qualified. Our articles of association provide that our directors serve for a term of threeyears, with one-third of the directors (or, if their number is not a multiple of three, the number nearest to but notgreater than one-third) subject to re-election at each annual general meeting of shareholders (chairman andmanaging director not subject to retirement by rotation nor to be taken into account in determining the number ofdirectors to retire), unless the director was appointed by the board of directors, in which case such director holdsoffice until the next annual meeting of shareholders at which time such director is eligible for re-election. One ofour seven directors is currently subject to re-election at our next annual general meeting of shareholders. All ofour executive officers are appointed by and serve at the discretion of our board of directors.
Limitation on Liability and Other Indemnification Matters
Cayman Islands law and our articles of association allow us to indemnify our directors, secretary and otherofficers acting in relation to any of our affairs against actions, costs, charges, losses, damages and expensesincurred by reason of any act done or omitted in the execution of their duties as our directors, secretary and otherofficers. Under our memorandum and articles of association, indemnification is not available to any matter inrespect of any fraud, dishonesty, willful misconduct or bad faith which may attach to any of them.
Compensation of Directors and Executive Officers
For the year ended December 31, 2013, the aggregate compensation to our directors and senior executiveofficers was approximately US$3.25 million. In 2013, we granted options and restricted stock units to ourexecutive officers as a group to acquire an aggregate of 370,000 ordinary shares. The options and restricted stockunits granted to our executive officers and non-executive directors are subject to the same vesting conditions asthose of our employees.
Service Contracts
We currently do not have service contracts with our directors.
Share-Based Compensation Plans and Option Grants
In April 2005, our board of directors and shareholders adopted our 2005 Incentive Plan. Our shareholdersapproved our Amended and Restated 2005 Incentive Plan (referred to in this report as the “Plan”) at our AnnualGeneral Meeting in August 2006, including an amendment to increase the authorized number of shares availablefor issuance under the plan from 10,000,000 shares to 25,000,000 shares. In 2009, the board of directors amendedthe Plan to increase the authorized shares available for issuance under the Plan to 40,000,000 shares. The Planprovides for the grant of stock options, stock bonuses, restricted stock awards, restricted stock units and stockappreciation rights, which may be granted to our employees (including officers), directors and consultants.
Share Reserve. The aggregate number of ordinary shares that may be issued pursuant to awards grantedunder the Plan will not exceed 40,000,000 shares, inclusive of ordinary shares issuable upon exercise of awardspreviously granted under the Silicon Motion, Inc. Guidelines for Issuance and Subscription of Employee StockOption, which options we have, subject to the consent of the respective option-holders, agreed to assume in theshare exchange.
45

The following types of shares issued under the Plan may again become available for the grant of newawards under the Plan: restricted stock issued under the Plan that is forfeited or repurchased by us prior to itbecoming fully vested; shares withheld for taxes; shares tendered to us to pay the exercise price of an option; andshares subject to awards issued under the Plan that have expired or otherwise terminated without having beenexercised in full.
Administration. The board of directors will administer the Plan and may delegate this authority to administerthe plan to a committee. Subject to the terms of the Plan, the plan administrator, which is our board of directorsor its authorized committee, determines recipients, grant dates, the numbers and types of stock awards to begranted and the terms and conditions of the stock awards, including the period of their exercisability and vesting.Subject to certain limitations, the plan administrator will also determine the exercise price of options granted, thepurchase price for restricted stock and restricted stock units, and, if applicable, the strike price for stockappreciation rights.
Capitalization adjustments. In the event of a dividend or other distribution (whether in the form of cash,ordinary shares, other securities, or other property), recapitalization, stock split, reorganization, merger,consolidation, exchange of our ordinary shares or our other securities, or other change in our corporate structure,the board of directors may adjust the number and class of shares that may be delivered under the Plan and thenumber, class and price of the shares covered by each outstanding stock award.
Changes in control. In the event of a change in control of the company, all outstanding options and otherawards under the 2005 Incentive Plan may be assumed, continued or substituted for by any surviving oracquiring entity. If the surviving or acquiring entity elects not to assume, continue or substitute for such awards,the vesting of such awards held by award holders whose service with us or any of our affiliates has notterminated will be accelerated and such awards will be fully vested and exercisable immediately prior to theconsummation of such transaction, and the stock awards shall automatically terminate upon consummation ofsuch transaction if not exercised prior to such event.
Amendments to Plan in 2009 and 2010. In 2009, our board of directors amended the Plan to (i) increase theauthorized shares to 40,000,000 as discussed above and (ii) allow certain unilateral amendments to outstandingoptions and RSU grants. Shareholder approval for such amendments was not required under Cayman law and weused the home-country exemption for foreign private issuers under Nasdaq rules to effect such amendmentswithout a shareholder vote. In 2009, the Company cancelled 1,221,875 RSUs. There were no changes tooutstanding options in 2009. In 2010, the Company exchanged 4,369 thousand stock options for 3,785 thousandnew stock options with a similar value.
Future amendments and termination. The board of directors may amend (subject to shareholder approval asrequired by applicable law), suspend or terminate the Plan at any time. Unless sooner terminated by the board ofdirectors, the Plan will terminate pursuant to its terms on April 22, 2015.
Employees
The following table sets forth the number of our employees categorized by function as of the datesindicated.
As of December 31,
2011 2012 2013
Management and administration 98 98 100Operations 22 24 24Research and development 388 429 468Sales and marketing 134 137 139
Total 642 688 731
46
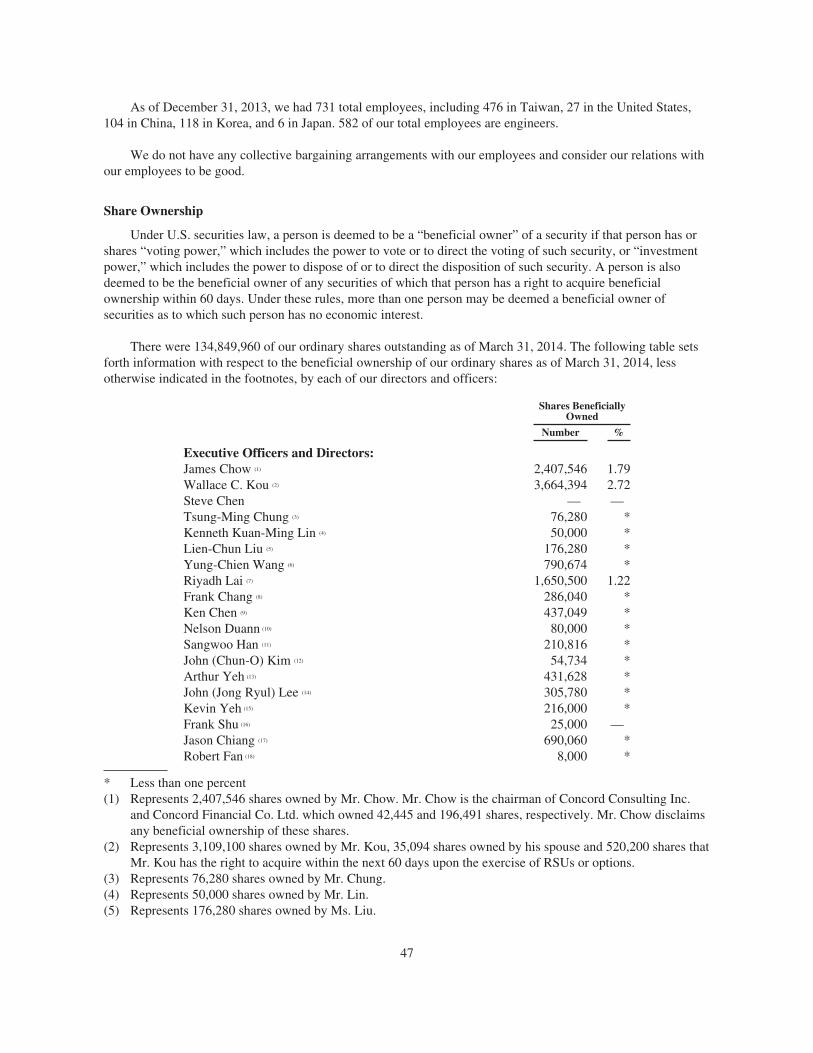
As of December 31, 2013, we had 731 total employees, including 476 in Taiwan, 27 in the United States,104 in China, 118 in Korea, and 6 in Japan. 582 of our total employees are engineers.
We do not have any collective bargaining arrangements with our employees and consider our relations withour employees to be good.
Share Ownership
Under U.S. securities law, a person is deemed to be a “beneficial owner” of a security if that person has orshares “voting power,” which includes the power to vote or to direct the voting of such security, or “investmentpower,” which includes the power to dispose of or to direct the disposition of such security. A person is alsodeemed to be the beneficial owner of any securities of which that person has a right to acquire beneficialownership within 60 days. Under these rules, more than one person may be deemed a beneficial owner ofsecurities as to which such person has no economic interest.
There were 134,849,960 of our ordinary shares outstanding as of March 31, 2014. The following table setsforth information with respect to the beneficial ownership of our ordinary shares as of March 31, 2014, lessotherwise indicated in the footnotes, by each of our directors and officers:
Shares BeneficiallyOwned
Number %
Executive Officers and Directors:James Chow (1) 2,407,546 1.79Wallace C. Kou (2) 3,664,394 2.72Steve Chen — —Tsung-Ming Chung (3) 76,280 *Kenneth Kuan-Ming Lin (4) 50,000 *Lien-Chun Liu (5) 176,280 *Yung-Chien Wang (6) 790,674 *Riyadh Lai (7) 1,650,500 1.22Frank Chang (8) 286,040 *Ken Chen (9) 437,049 *Nelson Duann (10) 80,000 *Sangwoo Han (11) 210,816 *John (Chun-O) Kim (12) 54,734 *Arthur Yeh (13) 431,628 *John (Jong Ryul) Lee (14) 305,780 *Kevin Yeh (15) 216,000 *Frank Shu (16) 25,000 —Jason Chiang (17) 690,060 *Robert Fan (18) 8,000 *
* Less than one percent(1) Represents 2,407,546 shares owned by Mr. Chow. Mr. Chow is the chairman of Concord Consulting Inc.
and Concord Financial Co. Ltd. which owned 42,445 and 196,491 shares, respectively. Mr. Chow disclaimsany beneficial ownership of these shares.
(2) Represents 3,109,100 shares owned by Mr. Kou, 35,094 shares owned by his spouse and 520,200 shares thatMr. Kou has the right to acquire within the next 60 days upon the exercise of RSUs or options.
(3) Represents 76,280 shares owned by Mr. Chung.(4) Represents 50,000 shares owned by Mr. Lin.(5) Represents 176,280 shares owned by Ms. Liu.
47

(6) Represents 790,674 shares owned by Mr. Wang.(7) Represents 499,200 shares owned by Mr. Lai, 767,000 shares owned by his spouse, 384,300 shares that
Mr. Lai has the right to acquire within the next 60 days upon the exercise of options or RSUs.(8) Represents 286,040 shares owned by Mr. Chang.(9) Represents 431,324 shares owned by Mr. Chen and 5,725 shares owned by his spouse.(10) Represents 80,000 shares owned by Mr. Duann.(11) Represents 210,816 shares owned by Mr. Han.(12) Represents 54,734 shares owned by Mr. Kim.(13) Represents 431,628 shares owned by Mr. Yeh.(14) Represents 305,780 shares owned by Mr. Lee.(15) Represents 216,000 shares owned by Mr. Yeh.(16) Represents 25,000 shares owned by Mr. Shu.(17) Represents 523,360 shares owned by Mr. Chiang and 11,448 shares owned by his spouse, 155,252 shares
that Mr. Chiang has the right to acquire within the next 60 days upon the exercise of options or RSUs.(18) Represents 8,000 shares owned by Mr. Fan.
ITEM 7. MAJOR SHAREHOLDERS AND RELATED PARTY TRANSACTIONS
Major Shareholders
As of March 31, 2014, there were 134,849,960 of our ordinary shares outstanding. The Bank of New YorkMellon, the depositary under our ADS deposit agreement, has advised us that as of March 31, 2014, we had33,594,442 ADSs, representing 134,377,768 ordinary shares.
The following table sets forth information with respect to the beneficial ownership of our ordinary shares asof March 31, 2014:
Identity of person or groupNumber of
shares ownedPercentage
Owned
Point72 Asset Management, Point 72 Capital Advisors Inc., SAC Capital Associates,Cubist Systematic Strategies, Steven A. Cohen and SAC Capital Advisors LP (1) 1,694,756 5.2
Notes:(1) According to the Schedule 13G filed by Point72 Asset Management, Point 72 Capital Advisors Inc., SAC Capital Associates, Cubist
Systematic Strategies, Steven A. Cohen and SAC Capital Advisors LP with the SEC on April 7, 2014.
To our knowledge, we are not owned or controlled, directly or indirectly, by another corporation, by anyforeign government or by any other natural or legal persons, severally or jointly. We are not aware of anyarrangement which may at a later date result in a change of control of our company.
No holder of our ordinary shares has preferential voting rights.
Related Party Transactions
No related party transactions occurred between January 1, 2011 and April 20, 2013.
ITEM 8. FINANCIAL INFORMATION
Consolidated Financial Statements
See “Item 18. Financial Statements” and pages F-1 through F-32 of this annual report.
Legal Proceedings
We are subject to legal proceedings and claims, either asserted or unasserted, which arise in the ordinarycourse of business. Although the outcome of such proceedings and claims cannot be predicted with certainty,management does not believe that the outcome of any of these matters will have a material adverse effect on ourbusiness, results of operations, financial position or cash flows. Any litigation, however, involves potential risk
48

and potentially significant litigation costs, and therefore there can be no assurance that any litigation which isnow pending or which may arise in the future would not have such a material adverse effect on our business,financial position, results of operations or cash flows.
All American Semiconductor, Inc. (“All American” or “AASI”) was a former distributor forthe Company. On April 25, 2007, All American filed for Chapter 11 bankruptcy protection. At the time of thefiling, the Company had US$256 thousand of unpaid accounts receivable from All American. On April 17, 2009,SMI USA and related entities were named as defendants in an adversary proceeding filed by the AASI CreditorLiquidating Trust (“CLT”) in the bankruptcy case pending in the U.S. Bankruptcy Court for the Southern Districtof Florida. The CLT was seeking the return of allegedly avoidable transfers in the amount of US$854thousand. The Company filed an answer and affirmative defenses. In March 2010, SMI USA settled with theCLT by paying the amount of US$220 thousand and on April 1, 2010, the Bankruptcy Court granted the motionto approve stipulations to compromise controversy. On August 23, 2010, the Court entered an order dismissingthe adversary proceeding. In June 2011, Liquidating Trustee for the CLT filed the AASI Creditor LiquidatingTrustee’s Seventeenth Omnibus Objection to Claims but in August 2011, withdrew it with respect to SMI USA’sproof of claim. According to the CLT’s letter dated September 9, 2011, it is currently finalizing its claims reviewprocess and preparing for distribution to beneficiaries who are holders of allowed claims and have rights to adistribution pursuant to the Plan. In January 2012 and 2014, we received the first distribution of US$21 thousandand the second distribution of US$36 thousand, respectively.
In 2006, FCI joined with other technology companies and invested in the Pangyo Silicon Park ConstructionProject Cooperative (“Pangyo Cooperative”) in Korea. In July 2010, FCI, TLi Inc. (“TLI”), OCI Materials Co.,Ltd (“OCI”) and other companies withdrew from the Pangyo Cooperative and forfeited 10% of their totalinvestment. FCI believes its loss was caused by bad will actions taken by TLI. In December 2011, FCI and OCItogether filed a complaint against TLI at the Suwon District Court in Korea. In April 2013, the court dismissedthe plaintiffs’ complaints. The plaintiffs have decided not to appeal the court’s decision.
Policy on Dividend Distributions
Pursuant to the laws and regulations of the ROC and the Articles of Incorporation of SMI Taiwan, oursubsidiary in Taiwan must make appropriations from annual earnings to a non-distributable reserve which couldaffect our ability to pay cash or stock dividends, if any. The Taiwan subsidiary may only distribute dividendsafter it has made allowances as determined under ROC GAAP at each year-end for:
a. Payment of taxes;
b. Recovery of prior years’ deficits, if any;
c. 10% of remaining balance after deduction for a and b as legal reserve;
d. Special reserve based on relevant laws or regulations or 10% of remaining balance for deduction fromabove a to c as special reserve when necessary;
e. Cash or stock bonus to employees at 0.01% of any remaining earnings after the above reserves havebeen appropriated, based on a resolution of the board of directors. If bonus to employees is in the formof stock, the bonus may also be appropriated to employees of subsidiaries under the board of directors’approval.
Dividends
Although no dividends were declared in our fiscal years ended 2011 and 2012. We announced and paid atotal of $19.9 million in dividends during 2013. Future dividends, if any, on our outstanding ADSs and ordinaryshares will be declared by and subject to the discretion of our board of directors. If our board of directors decides
49

to distribute dividends, the form, frequency and amount of such dividends will depend upon our future operationsand earnings, capital requirements and surplus, general financial condition, contractual restrictions and otherfactors our board of directors may deem relevant.
Any future dividend we declare will be paid to the holders of ADSs, subject to the terms of the depositagreement, to the same extent as holders of our ordinary shares, to the extent permitted by applicable laws andregulations, less the fees and expenses payable under the deposit agreement. Any dividend we declare will bedistributed by the depositary bank to the holders of our ADSs. Cash dividends on our ordinary shares, if any, willbe paid in U.S. dollars.
ITEM 9. THE OFFER AND LISTING
Market and Share Price Information
Our ADSs, each representing four of our ordinary shares, have been listed on Nasdaq since June 30, 2005.Our ADSs trade under the symbol “SIMO.” The Nasdaq Global Select Market is the principal trading market forour ADSs, which are not listed on any other exchanges in or outside the United States.
The high and low sales prices of our ADSs on Nasdaq since 2008 are as follows:
Price per ADS (US$)
High Low
Annual:2009 4.48 1.902010 6.50 2.642011 21.60 4.142012 24.98 11.322013 16.19 9.90
Quarterly:First Quarter, 2012 24.98 16.65Second Quarter, 2012 22.20 12.91Third Quarter, 2012 17.07 11.32Fourth Quarter, 2012 16.10 11.87
First Quarter, 2013 16.19 11.57Second Quarter, 2013 11.85 9.90Third Quarter, 2013 13.25 10.38Fourth Quarter, 2013 15.48 11.71
First Quarter, 2014 18.44 12.92
MonthlyNovember 2013 15.48 12.23December 2013 15.41 13.63January 2014 17.36 12.92February 2014 17.70 16.17March 2014 18.44 16.32April 2014 (through April 29) 17.89 15.58
ITEM 10. ADDITIONAL INFORMATION
Memorandum and Articles of Association
The information called for by Item 10B (“Memorandum and Articles of Association”) is incorporated byreference to the information under the heading “Description of Share Capital” in our Registration Statement onForm F-1, as amended (Registration Number 333-125673) and as filed with the SEC on June 5, 2005.
50

Material Contracts
We have not entered into any material contracts within the past two fiscal years other than in the ordinarycourse of business and other than those described in Item 4, “Information on the Company” or elsewhere in thisannual report.
Taxation
United States Federal Income Taxation
The following discussion summarizes certain U.S. federal income tax consequences to a U.S. Holder, asdefined below, who purchases our ADSs and ordinary shares. This discussion assumes that investors will holdtheir ADSs or ordinary shares as capital assets (generally, property held for investment). This discussion does notdiscuss all aspects of U.S. federal income taxation which may be important to particular investors in light of theirindividual circumstances, including investors subject to special taxation, such as:
• banks and financial institutions;
• brokers and dealers in securities or currencies;
• insurance companies;
• tax-exempt organizations and retirement plans;
• grantor trusts;
• S corporations;
• persons holding ADSs or ordinary shares as part of hedging, conversion, constructive sale, straddle orother integrated transactions;
• persons who acquired their ordinary shares upon the exercise of employee stock options or otherwise ascompensation;
• persons who have elected the mark-to-market method of accounting;
• persons who own 10% or more of our ADSs or shares;
• real estate investment trusts or regulated investment companies;
• U.S. persons whose “functional currency” is not the U.S. dollar;
• certain former citizens or long-term residents of the United States; and
• Non-U.S. Holders (as defined below).
This discussion is based in part on representations by the depositary and assumes that each obligation underthe deposit agreement and any related agreement will be performed in accordance with its terms. Furthermore,the discussion below is based upon the provisions of the Internal Revenue Code of 1986, as amended (the“Code”), and U.S. Treasury regulations, rulings and judicial decisions hereunder as of the date hereof. Suchauthorities are subject to change, possibly on a retroactive basis, which may result in U.S. federal income taxconsequences different from those discussed below.
A person considering an investment in our ADSs or ordinary shares is urged to consult its tax advisorconcerning U.S. federal, state, local and non-U.S. income and other tax consequences.
A U.S. Holder is a beneficial owner of ADSs or ordinary shares that is for U.S. federal income tax purposes:
• a citizen or resident individual of the United States;
• a corporation or other entity taxable as a corporation created or organized in or under the laws of theUnited States, any state thereof, or the District of Columbia;
51

• an estate the income of which is subject to U.S. federal income taxation, regardless of its source; or
• a trust if it is subject to the primary supervision of a court within the United States and one or moreU.S. persons have the authority to control all substantial decisions of the trust or has a valid election ineffect under applicable U.S. Treasury regulations to be treated as a U.S. person.
A beneficial owner of ADSs or ordinary shares that is not a U.S. Holder is referred to herein as a “Non-U.S.Holder.”
If a partnership or limited liability company treated as a partnership for U.S. federal income tax purposesholds ADSs or ordinary shares, the tax treatment of a partner or member will generally depend on the status ofthe partner or member and the activities of the partnership or such limited liability company. A partner of apartnership or a member of such a limited liability company holding ADSs or ordinary shares is urged to consultits tax advisors regarding an investment in our ADSs or ordinary shares.
ADSs. In general, for U.S. federal income tax purposes, a U.S. Holder of ADSs will be treated as the ownerof the underlying ordinary shares that are represented by such ADSs. Deposits and withdrawals of ordinaryshares in exchange for ADSs will not be subject to U.S. federal income taxation.
Distributions on ADSs or ordinary shares. Unless the passive foreign investment company rules, asdiscussed below, apply, the gross amount of the distributions in respect of the ADSs or ordinary shares will besubject to tax as dividend income to the extent of our current and accumulated earnings and profits, asdetermined under U.S. federal income tax principles. Subject to certain limitations, dividends paid to non-corporate U.S. Holders, including individuals, may be eligible for a reduced rate of taxation if we are deemed tobe a “qualified foreign corporation” for U.S. federal income tax purposes and provided that such holder satisfiescertain holding period requirements with respect to the ownership of our ADSs, or ordinary shares. The reducedrate of tax applicable to dividends from a “qualified foreign corporation” does not apply to taxable yearsbeginning after December 31, 2012, absent further legislation. Subject to the exceptions discussed below, acorporation is a qualified foreign corporation if it is:
• a foreign corporation that is eligible for the benefits of a comprehensive income tax treaty with theUnited States that includes an exchange of information program; or
• a foreign corporation if its stock with respect to which a dividend is paid or its ADSs backed by suchstock are readily tradable on an established securities market within the United States.
The Cayman Islands does not currently have a comprehensive income tax treaty with the United States. Aforeign corporation (even if it is described above) does not constitute a qualified foreign corporation if, for thetaxable year in which the dividend is paid or the preceding taxable year, the foreign corporation is or was apassive foreign investment company. Although we believe that we are a qualified foreign corporation because theADSs will be traded on an established U.S. securities market, no assurance can be given in this regard. Inaddition, our status as a qualified foreign corporation may change. A U.S. Holder that exchanges its ADSs forordinary shares may not be eligible for the reduced rate of taxation on dividends if the ordinary shares are notdeemed to be readily tradable on an established securities market within the United States.
Dividends will be includable in a U.S. Holder’s gross income on the date actually or constructively receivedby the depositary, in the case of ADSs or, in the case of ordinary shares, by such U.S. Holder. These dividendswill not be eligible for the dividends-received deduction generally allowed to U.S. corporations in respect ofdividends received from other U.S. corporations.
To the extent we pay dividends on the ADSs or ordinary shares in a currency other than the U.S. dollar, theU.S. dollar value of such dividends should be calculated by reference to the exchange rate prevailing on the dateof actual or constructive receipt of the dividend, regardless of whether the foreign currency is converted into U.S.
52

dollars at that time. If the foreign currency is converted into U.S. dollars on the date of actual or constructivereceipt of such dividends, the tax basis of the U.S. Holder in such foreign currency will be equal to its U.S. dollarvalue on that date and, as a result, the U.S. Holder generally should not be required to recognize any foreigncurrency exchange gain or loss. Dividends paid in respect of the ADSs or ordinary shares generally will betreated as income from sources outside the United States.
To the extent that the amount of any distribution exceeds our current and accumulated earnings and profits,the distribution will first be treated as a tax-free return of capital, causing a reduction in the adjusted basis of theADSs or ordinary shares, and the balance in excess of adjusted basis will be taxed as capital gain.
Sale, exchange or other disposition of ADSs or ordinary shares. Unless the passive foreign investmentcompany rules, as discussed below, apply, upon the sale, exchange or other disposition of ADSs or ordinaryshares a U.S. Holder generally will recognize capital gain or loss equal to the difference between the amountrealized upon the sale, exchange or other disposition and the adjusted tax basis of the U.S. Holder in the ADSs orordinary shares. The capital gain or loss generally will be long-term capital gain or loss if, at the time of sale,exchange or other disposition, the U.S. Holder has held the ADS or ordinary share for more than one year. Netlong-term capital gains of non-corporate U.S. Holders, including individuals, are eligible for reduced rates oftaxation. The deductibility of capital losses is subject to limitations. Any gain or loss that a U.S. Holderrecognizes generally will be treated as gain or loss from sources within the United States for U.S. foreign taxcredit limitation purposes.
Additional tax on net investment income. An additional 3.8% federal income tax may be assessed on netinvestment income (including dividends, other distributions, and gain realized on the sale of ADSs or ordinaryshares) earned by certain U.S. Holders. This tax does not apply to U.S. Holders who hold ADSs or ordinaryshares in the ordinary course of certain trades or businesses.
Passive foreign investment company rules. In general, we will be classified as a passive foreign investmentcompany for any taxable year in which either (a) at least 75% of our gross income is passive income or (b) atleast 50% of the value (determined on the basis of a quarterly average) of our assets is attributable to assets thatproduce or are held for the production of passive income. For this purpose, passive income generally includesdividends, interest, royalties, rents (other than rents and royalties derived in the active conduct of a trade orbusiness and not derived from a related person), annuities and gains from assets that produce passive income. Ifwe own directly or indirectly at least 25% by value of the equity shares of another corporation, we will be treatedfor purposes of the passive foreign investment company tests as owning a proportionate share of the assets of theother corporation, and as receiving directly a proportionate share of the other corporation’s income.
We believe, based on our present and projected composition of our income and valuation of our assets, weare not currently classified as a passive foreign investment company for U.S. federal income tax purposes,although no assurance can be given in this regard. Whether we are a passive foreign investment company for anyparticular taxable year is determined on an annual basis and will depend on the composition of our income andassets, including goodwill. The calculation of goodwill will be based, in part, on the then market value of ourcapital stock, which is subject to fluctuation. In addition, the composition of our income and assets will beaffected by how we spend the cash we raise in this offering. Accordingly, there can be no assurance that we willnot be classified as a passive foreign investment company in the current or any future taxable year.
If we are a passive foreign investment company for any taxable year during which a U.S. Holder has anequity interest in our company, unless the U.S. Holder makes a mark-to-market election as discussed below, suchU.S. Holder will be subject to special tax rules in any future taxable year regardless of whether we are classifiedas a passive foreign investment company in such future years with respect to (a) “excess distributions” and(b) gain from the disposition of stock. Excess distributions are defined generally as the excess of the amountreceived with respect to the equity interests in the taxable year over 125% of the average annual distributionsreceived in the shorter of either the three previous years or a U.S. Holder’s holding period before the taxable year
53

and must be allocated ratably to each day of the U.S. Holder’s holding period. The amount allocated to thecurrent taxable year or any year before we became a passive foreign investment company will be included asordinary income in a U.S. Holder’s gross income for that year. The amount allocated to other prior taxable yearswill be taxed as ordinary income at the highest rate in effect for a U.S. Holder in that prior year and the tax issubject to an interest charge at the rate applicable to deficiencies in income taxes. The entire amount of any gainrealized upon the sale or other disposition of the equity interests will be treated as an excess distribution made inthe year of sale or other disposition and as a consequence will be treated as ordinary income and, to the extentallocated to years prior to the year of sale or disposition with respect to which we were a passive foreigninvestment company, will be subject to the interest charge described above.
In certain circumstances, instead of being subject to the excess distribution rules discussed above, a U.S.Holder may make an election to include gain on the ADSs or ordinary shares of a passive foreign investmentcompany as ordinary income under a mark-to-market method, provided that the ADSs or ordinary shares areregularly traded on a qualified exchange. Under current law, the mark-to-market election is only available forADSs or ordinary shares that are regularly traded within the meaning of U.S. Treasury regulations on certaindesignated U.S. exchanges and foreign exchanges that meet trading, listing, financial disclosure and otherrequirements to be treated as a qualified exchange under applicable U.S. Treasury regulations. The Nasdaq StockMarket is a qualified exchange. The ordinary shares may not be eligible for mark-to-market treatment under theforegoing rule even if the ADSs otherwise satisfy the applicable requirement.
If a U.S. Holder makes a mark-to-market election, the U.S. Holder will include each year as ordinaryincome, rather than capital gain, the excess, if any, of the fair market value of the U.S. Holder’s ADSs orordinary shares at the end of the taxable year over such U.S. Holder’s adjusted basis in the ADSs (or ordinaryshares, if applicable) and will be permitted an ordinary loss in respect of the excess, if any, of the adjusted basisof these ADSs or ordinary shares over their fair market value at the end of the taxable year, but only to the extentof the net amount previously included in income as a result of the mark-to-market election. A U.S. Holder’s basisin the ADSs or ordinary shares will be adjusted to reflect any such income or loss amounts. Any gain or loss onthe sale of the ADSs or ordinary shares will be ordinary income or loss, except that this loss will be ordinary lossonly to the extent of the previously included net mark-to-market gain.
If we are a passive foreign investment company, then under certain circumstances a U.S. Holder must fileInternal Revenue Service Form 8621.
Information Reporting and Back-up Withholding. U.S. holders generally are subject to information reportingrequirements with respect to dividends on, or proceeds from the disposition of, our ordinary shares. In addition, aU.S. holder may be subject, under certain circumstances, to backup withholding at a rate of up to 28% withrespect to dividends paid on, or proceeds from the disposition of, our ordinary shares unless the U.S. holderprovides proof of an applicable exemption or correct taxpayer identification number, and otherwise complieswith the applicable requirements of the backup withholding rules. A U.S. holder of our ordinary shares whoprovides an incorrect taxpayer identification number may be subject to penalties imposed by the IRS. Amountswithheld under the backup withholding rules are not an additional tax and may be refunded or credited againstthe U.S. holder’s U.S. federal income tax liability, provided the required information is furnished to the IRS.
A U.S. Holder is urged to consult its tax advisor concerning the U.S. federal income tax consequences of aninvestment in our ADSs or ordinary shares if we are or become a passive foreign investment company, includingthe possibility of making a market-to-market election.
Cayman Islands Taxation
The Cayman Islands currently levy no taxes on individuals or corporations based upon profits, income,gains or appreciation and there is no taxation in the nature of inheritance tax or estate duty. There are no othertaxes likely to be material to our company levied by the Government of the Cayman Islands except for stamp
54

duties that may be applicable on instruments executed in, or after execution brought within the jurisdiction of, theCayman Islands. The Cayman Islands are not party to any double taxation treaties. There are no exchange controlregulations or currency restrictions in the Cayman Islands.
We have, pursuant to Section 6 of the Tax Concessions Law (1999 Revision) of the Cayman Islands,obtained an undertaking from the Governor-in-Council that:
• no law which is enacted in the Cayman Islands imposing any tax to be levied on profits or income orgains or appreciation applies to us or our operations; and
• the aforesaid tax or any tax in the nature of estate duty or inheritance tax are not payable on ourordinary shares, debentures or other obligations.
The undertaking that we have obtained is for a period of 20 years from March 1, 2005.
Documents on Display
We have previously filed with the SEC our registration statement on Form F-1 and Form F-6 under theSecurities Act of 1933, as amended (the “Securities Act”) with respect to our ADSs.
We are subject to the periodic reporting and other informational requirements of the U.S. SecuritiesExchange Act of 1934, as amended (the “Exchange Act”). Under the Exchange Act, we are required to filereports and other information with the SEC. Specifically, we are required to file annually a Form 20-F no laterthan four months after the close of each fiscal year, which is December 31. As a foreign private issuer, we areexempt from the rules under the Exchange Act prescribing the furnishing and content of quarterly reports andproxy statements, and our officers, directors, and principal shareholders are exempt from the reporting and short-swing profit recovery provisions of Section 16 of the Exchange Act.
Copies of reports and other information, when so filed, may be inspected without charge and may beobtained at prescribed rates at the public reference facilities maintained by the Securities and ExchangeCommission at the SEC’s public reference room in Washington D.C. at 100 F Street, N.E., Room 1580,Washington D.C. 20549. You can request copies of these documents upon payment of a duplicating fee, bywriting to the SEC. Please call the SEC at 1-800-SEC-0330 for further information on the operation of the publicreference rooms. The SEC also maintains a Website at www.sec.gov that contains reports, proxy and informationstatements, and other information regarding registrants that make electronic filings with the SEC using itsEDGAR system.
ITEM 11. QUANTITATIVE AND QUALITATIVE DISCLOSURES ABOUT MARKET RISK
Interest rate risk. Our exposure to changes in interest rates is limited to interest income generated by ourcash deposited with banks and short-term investments maintained in bond funds and structured notes. We do notbelieve that a 1% change in interest rates would have a significant impact on our operations.
Foreign currency risk. Since 2012, we consider our direct exposure to foreign exchange rate fluctuations tobe minimal. Prior to 2012, we reported our financial results in NT dollars and our direct exposure to foreignexchange rate fluctuations was more significant. Gains or losses from foreign currency re-measurement areincluded in “Non-Operating Income (Expenses)” in our Consolidated Financial Statements. The impact offoreign currency transaction gain or loss included in determining net income (loss) for 2013, 2012 and 2011 wasnil, $0.4 million and $5.7 million, respectively. Currently, the majority of our revenue, cost of sales, accountsreceivable, and accounts payable are denominated in U.S. dollars. Increases in the value of the U.S. dollarrelative to other currencies would make our products more expensive, which could negatively impact our abilityto compete. Conversely, decreases in the value of the U.S. dollar relative to other currencies could result in oursuppliers raising their prices in order to continue doing business with us. Fluctuations in currency exchange ratescould harm our business in the future. We do not utilize foreign exchange derivatives contracts to protect againstchanges in foreign exchange rates.
55

Also refer to “Risk Factors — We are subject to risks associated with international operations which mayharm our business.”
Investment Risk. Prior to March 2007, we invested in equity instruments of privately held companies. Wehave minority stake equity investments in Cashido and Vastview Technology, private companies related tosemiconductor and other technology industries. These investments are accounted for under the cost methodbecause our ownership is less than 20% and we do not have the ability to exercise significant influence over theoperations of these companies. As of December 31, 2013, the aggregate carrying value of these investments onour balance sheet was US$0.1 million. We monitor these investments for impairment and make appropriatereductions in carrying value when an impairment is deemed to be other than temporary. There were noimpairments for the years ended on December 31, 2011, 2012 and 2013, respectively.
As of December 31, 2013, we also had US$0.7 million of short-term investments maintained in bond funds.
ITEM 12. DESCRIPTION OF SECURITIES OTHER THAN EQUITY SECURITIES
Depositary Fees and Charges. For the year-ended December 31, 2013, we received from our depositarybank a reimbursement of US$0.5 million, net of withholding tax, for our continuing annual stock exchangelisting fees and our other expenses incurred in connection with maintaining and promoting our ADS program. Inaddition, the depositary bank has agreed to reimburse us annually for a fixed number of years for our continuingannual stock exchange listing fees and our other expenses incurred in connection with maintaining and promotingour ADS program. The amount of annual reimbursements is subject to certain limits.
56

PART II
ITEM 13. DEFAULTS, DIVIDEND ARREARAGES AND DELINQUENCIES
Not applicable.
ITEM 14. MATERIAL MODIFICATIONS TO THE RIGHTS OF SECURITY HOLDERS AND USE OF PROCEEDS
Not applicable.
ITEM 15. CONTROLS AND PROCEDURES
Disclosure Controls and Procedures
We performed an evaluation of the effectiveness of the design and operation of our disclosure controls andprocedures as of December 31, 2013. Disclosure controls and procedures are designed to ensure that the materialfinancial and non-financial information required to be disclosed in this annual report on Form 20-F and filed withthe SEC is recorded, processed, summarized and reported within the time periods specified in the SEC’s rulesand forms. The evaluation was performed with the participation of our key corporate senior management, andunder the supervision of our Chief Financial Officer, or CFO, Riyadh Lai, and our President and Chief ExecutiveOfficer, or CEO, Wallace Kou. In designing and evaluating the disclosure controls and procedures, managementrecognized that any controls and procedures, no matter how well designed and operated, can provide onlyreasonable, rather than absolute, assurances of achieving the desired control objectives, and managementnecessarily was required to apply its judgment in evaluating the cost-benefit relationship of possible controls andprocedures. Based on the foregoing, our management, including our CEO and CFO, concluded that ourdisclosure controls and procedures were effective.
Management’s Report on Internal Control over Financial Reporting
Our management, including our CEO and CFO, is responsible for establishing and maintaining adequateinternal control over financial reporting, as defined under Exchange Act Rules 13a-15(f) and 15d-15(f). Ourinternal control over financial reporting is a process designed to provide reasonable assurance regarding thereliability of financial reporting and the preparation of financial statements for external purposes in accordancewith accounting principles generally accepted in the United States. Internal control over financial reportingincludes those policies and procedures that: (1) pertain to the maintenance of records that, in reasonable detail,accurately and fairly reflect the transactions and dispositions of our assets, (2) provide reasonable assurance thattransactions are recorded as necessary to permit preparation of financial statements in accordance with generallyaccepted accounting principles, and that our receipts and expenditures are being made only in accordance withappropriate authorizations; and (3) provide reasonable assurance regarding prevention or timely detection ofunauthorized acquisition, use, or disposition of our assets that could have a material effect on the financialstatements.
Our management assessed the effectiveness of our internal control over financial reporting as of the end ofthe period covered by this annual report based on the criteria set forth in the Internal Control-IntegratedFramework (1992) issued by the Committee of Sponsoring Organizations of the Treadway Commission(“COSO”). Their assessment included an evaluation of the design of our internal control over financial reportingand testing of the operational effectiveness of our internal control over financial reporting. Based on thatassessment, our management concluded that as of December 31, 2013 the company’s internal control overfinancial reporting was effective.
Deloitte & Touche, the independent registered public accounting firm that audited our consolidated financialstatements included in this annual report has issued an attestation report regarding internal control over financialreporting.
57

Changes in Internal Control over Financial Reporting
During 2013, no change to our internal control over financial reporting occurred that has materially affected,or is reasonably likely to materially affect, our internal control over financial reporting.
Inherent Limitations on Effectiveness of Controls
All internal control systems no matter how well designed and implemented have inherent limitations. Evensystems determined to be effective may not prevent or detect misstatements or fraud and can only providereasonable assurance with respect to disclosure and financial statement presentation and reporting. Additionally,projections of any evaluation of effectiveness to future periods are subject to the risk that controls may becomeinadequate because of changed conditions and the degree of compliance with the policies or procedures maydeteriorate.
58

Attestation Report Of The Independent Registered Public Accounting Firm
REPORT OF INDEPENDENT REGISTERED PUBLIC ACCOUNTING FIRM
We have audited the internal control over financial reporting of Silicon Motion Technology Corporation andsubsidiaries (the “Company”) as of December 31, 2013, based on criteria established in Internal Control —Integrated Framework (1992) issued by the Committee of Sponsoring Organizations of the TreadwayCommission. The Company’s management is responsible for maintaining effective internal control over financialreporting and for its assessment of the effectiveness of internal control over financial reporting, included in theaccompanying Management’s Report on Internal Control Over Financial Reporting. Our responsibility is toexpress an opinion on the Company’s internal control over financial reporting based on our audit.
We conducted our audit in accordance with the standards of the Public Company Accounting OversightBoard (United States). Those standards require that we plan and perform the audit to obtain reasonable assuranceabout whether effective internal control over financial reporting was maintained in all material respects. Ouraudit included obtaining an understanding of internal control over financial reporting, assessing the risk that amaterial weakness exists, testing and evaluating the design and operating effectiveness of internal control basedon the assessed risk, and performing such other procedures as we considered necessary in the circumstances. Webelieve that our audit provides a reasonable basis for our opinion.
A company’s internal control over financial reporting is a process designed by, or under the supervision of,the company’s principal executive and principal financial officers, or persons performing similar functions, andeffected by the company’s board of directors, management, and other personnel to provide reasonable assuranceregarding the reliability of financial reporting and the preparation of financial statements for external purposes inaccordance with generally accepted accounting principles. A company’s internal control over financial reportingincludes those policies and procedures that (1) pertain to the maintenance of records that, in reasonable detail,accurately and fairly reflect the transactions and dispositions of the assets of the company; (2) provide reasonableassurance that transactions are recorded as necessary to permit preparation of financial statements in accordancewith generally accepted accounting principles, and that receipts and expenditures of the company are being madeonly in accordance with authorizations of management and directors of the company; and (3) provide reasonableassurance regarding prevention or timely detection of unauthorized acquisition, use, or disposition of thecompany’s assets that could have a material effect on the financial statements.
Because of the inherent limitations of internal control over financial reporting, including the possibility ofcollusion or improper management override of controls, material misstatements due to error or fraud may not beprevented or detected on a timely basis. Also, projections of any evaluation of the effectiveness of the internalcontrol over financial reporting to future periods are subject to the risk that the controls may become inadequatebecause of changes in conditions, or that the degree of compliance with the policies or procedures maydeteriorate.
In our opinion, the Company maintained, in all material respects, effective internal control over financialreporting as of December 31, 2013 based on the criteria established in Internal Control — Integrated Framework(1992) issued by the Committee of Sponsoring Organizations of the Treadway Commission.
We have also audited, in accordance with the standards of the Public Company Accounting Oversight Board(United States), the consolidated financial statements as of and for the year ended December 31, 2013 of theCompany and our report dated April 29, 2014 expressed an unqualified opinion on those financial statements.
/s/ Deloitte & ToucheTaipei, TaiwanRepublic of ChinaApril 29, 2014
59

ITEM 16A. AUDIT COMMITTEE FINANCIAL EXPERT
Our board of directors has determined that Mr. Tsung-Ming Chung, the Chairman of our audit committeeand an independent director, is an “audit committee financial expert” under Nasdaq and SEC rules.
ITEM 16B. CODE OF ETHICS
Our board of directors has adopted a code of business conduct and ethics applicable to every employee ofour company, including our CEO and our CFO, consistent with the requirements of the Nasdaq Stock Market. Acopy of our code of ethics has been filed with the SEC as Exhibit 11.1 to our annual report on Form 20-F filed onJune 30, 2006. For further information, see our Code of Ethics posted on our website (www.siliconmotion.com) .
ITEM 16C. PRINCIPAL ACCOUNTANT FEES AND SERVICES
Deloitte & Touche has acted as the independent registered public accountants of our company and itssubsidiaries for 2012 and 2013. The following table sets forth the aggregate fees by categories specified below inconnection with certain professional services rendered by Deloitte & Touche for the periods indicated.
2012 2013
US$ US$(in thousands)
Audit Fees (1) 698 747Audit-Related Fees (2) — —Tax Fees (3) 172 126All Other Fees (4) — —
Total 870 873
(1) Audit Fees. This category includes the audit and review of our annual financial statements and services thatare normally provided by the independent auditors in connection with regulatory filings or engagements,consultations provided on audit and accounting matters that arise during, or as a result of, the audits or thereviews of interim financial statements, audit procedures related to reviews of offering documents,registration statements and issuance of comfort letters.
(2) Audit-Related Fees. This category consists of assurance and related services by Deloitte & Touche that arereasonably related to the performance of the audit or review of our financial statements and are not reportedabove under “Audit Fees.” Deloitte & Touche did not provide any services under this category in 2012 or2013.
(3) Tax Fees. This category consists of professional services rendered by Deloitte & Touche for tax complianceand tax advice. The services for the fees disclosed in this category include tax return preparation andtechnical tax advice.
(4) All other fees. Deloitte & Touche did not provide any services under this category in 2012 or 2013.
Our audit committee is responsible for the retention of our independent registered public accounting firm,which currently is Deloitte & Touche. Our audit committee has adopted its own rules of procedure, in the form ofan audit committee charter. The audit committee’s rules of procedure provide for a process with respect to theprior approval of all non-audit services to be performed by our independent auditors. Our audit committee reportsto our board of directors regarding the scope and results of our annual audits, compliance with our accountingand financial policies and management’s procedures and policies related to the adequacy of our internalaccounting controls.
In 2013 our audit committee approved all of the audit services provided by Deloitte & Touche, and the otherservices provided by Deloitte & Touche.
ITEM 16D. EXEMPTIONS FROM THE LISTING STANDARDS FOR AUDIT COMMITTEES
Not applicable.
60

ITEM 16E. PURCHASES OF EQUITY SECURITIES BY THE ISSUER AND AFFILIATED PURCHASERS
Not applicable.
ITEM 16F. CHANGE IN REGISTRANT’ S CERTIFYING ACCOUNTANT
Not applicable.
ITEM 16G. CORPORATE GOVERNANCE
We are incorporated in the Cayman Islands and our corporate governance practices are governed byapplicable Cayman Islands law. In addition, because our ADSs are listed on the Nasdaq Global Select Market,we are subject to Nasdaq corporate governance requirements. Nasdaq Listing Rule 5615(a)(3) permits foreignprivate issuers like us to follow “home country practice” with respect to certain corporate governance matters.We are committed to a high standard of corporate governance. As such, we endeavor to comply with the Nasdaqcorporate governance practices and believe that we are currently in compliance with Nasdaq corporategovernance practices that are applicable to foreign private issuers.
61

PART III
ITEM 17. FINANCIAL STATEMENTS
Not applicable.
ITEM 18. FINANCIAL STATEMENTS
Our consolidated financial statements are included in this annual report at pages F-1 through F-32.
ITEM 19. EXHIBITS
ExhibitNumber Description
1.1 Memorandum of Association of the Registrant (incorporated by reference to Exhibit 3.1 to thecompany’s Registration Statement on Form F-1 (file no. 333-125673) filed with the Securities andExchange Commission on June 9, 2005).
1.2 Articles of Association of the Registrant (incorporated by reference to Exhibit 3.2 to the company’sRegistration Statement on Form F-1 (file no. 333-125673) filed with the Securities and ExchangeCommission on June 9, 2005).
2.1 Specimen of American Depositary Receipt (incorporated by reference to Exhibit 4.1 to thecompany’s Registration Statement on Form F-1 (file no. 333-125673) filed with the Securities andExchange Commission on June 9, 2005).
2.2 Form of Deposit Agreement (incorporated by reference to Exhibit 4.2 to the company’s RegistrationStatement on Form F-1 (file no. 333-125673) filed with the Securities and Exchange Commission onJune 9, 2005).
2.3 Second Amended and Restated Silicon Motion Technology Corporation Equity Incentive Plan 2005(incorporated by reference to Exhibit 2.3 of the company’s Form 20-F for the year endedDecember 31, 2009, filed June 25, 2010).
4.1 Lease Agreement between Silicon Motion, Inc. (Taiwan) and Fang Shinn Industrial Co., Ltd. datedMay 4, 2004 (incorporated by reference to Exhibit 10.1 to the company’s Registration Statement onForm F-1 (file no. 333-125673) filed with the Securities and Exchange Commission on June 9,2005).
4.2 Lease Agreement between Silicon Motion, Inc. (Taiwan) and TaiHsing Printing and Binding Co., Ltddated February 23, 2005 (incorporated by reference to Exhibit 10.2 to the company’s RegistrationStatement on Form F-1 (file no. 333-125673) filed with the Securities and Exchange Commission onJune 9, 2005).
4.3 Lease Agreement between Silicon Motion, Inc. (Taiwan) and Winsome Development Inc. datedNovember 27, 2003 (incorporated by reference to Exhibit 10.3 to the company’s RegistrationStatement on Form F-1 (file no. 333-125673) filed with the Securities and Exchange Commission onJune 9, 2005).
4.4 Lease Agreement between Silicon Motion, Inc. (Taiwan) and Richtek Technology Corp. datedFebruary 4, 2005 (incorporated by reference to Exhibit 10.4 to the company’s Registration Statementon Form F-1 (file no. 333-125673) filed with the Securities and Exchange Commission on June 9,2005).
4.5 Lease Agreement between Silicon Motion, Inc. (California) and Orchard Investment CompanyNumber 205 dated January 21, 2004 (incorporated by reference to Exhibit 10.5 to the company’sRegistration Statement on Form F-1 (file no. 333-125673) filed with the Securities and ExchangeCommission on June 9, 2005).
62

ExhibitNumber Description
4.6 Bank Line of Credit Agreement between Silicon Motion, Inc. (Taiwan) and Chinatrust CommercialBank Co., Ltd. dated November 25, 2004 (incorporated by reference to Exhibit 10.6 to thecompany’s Registration Statement on Form F-1 (file no. 333-125673) filed with the Securities andExchange Commission on June 9, 2005).
4.7 Financial Transaction Agreement between Silicon Motion, Inc. (Taiwan) and ChinatrustCommercial Bank Co., Ltd. dated November 25, 2004 (incorporated by reference to Exhibit 10.7 tothe company’s Registration Statement on Form F-1 (file no. 333-125673) filed with the Securitiesand Exchange Commission on June 9, 2005).
4.8 Specific Clause Agreement between Silicon Motion, Inc. (Taiwan) and Chinatrust CommercialBank Co., Ltd. dated November 25, 2004 (incorporated by reference to Exhibit 10.8 to thecompany’s Registration Statement on Form F-1 (file no. 333-125673) filed with the Securities andExchange Commission on June 9, 2005).
4.11 Purchase and Supply Agreement between Lexar Media, Inc. and Silicon Motion TechnologyCorporation, dated September 1, 2005 (incorporated by reference to Exhibit 4.11 to the Company’sAnnual Report on Form 20-F filed with the Securities and Exchange Commission on June 30,2006).
4.12 Share Purchase Agreement dated as of April 18, 2007 among Silicon Motion TechnologyCorporation, Lake Tahoe Investment Corporation, FCI Inc. and Kwang Jun Yun and theshareholders of FCI (incorporated by reference to Exhibit 4.12 to the Company’s Annual Report onForm 20-F filed with the Securities and Exchange Commission on July 2, 2007).
8.1 * List of Subsidiaries.
11.1 Code of Ethics (incorporated by reference to Exhibit 11.1 to the company’s Annual Report onForm 20-F filed with the Securities and Exchange Commission on June 30, 2006).
12.1 * Certification of Chief Executive Officer Required by Rule 13a-14(a).
12.2 * Certification of Chief Financial Officer Required by Rule 13a-14(a).
13.1 * Certification of Chief Executive Officer and Chief Financial Officer required by Rule 13a-14(b) andSection 1350 of Chapter 63 of Title 18 of the United States Code.
23.1 * Consent of Deloitte & Touche.
101.INS* XBRL Instance Document
101.SCH* XBRL Taxonomy Extension Schema Document
101.CAL* XBRL Taxonomy Extension Calculation Linkbase Document
101.DEF* XBRL Taxonomy Extension Definition Linkbase Document
101.LAB* XBRL Taxonomy Extension Label Linkbase Document
101.PRE* XBRL Taxonomy Extension Presentation Linkbase Document
* Filed herewith.
63

SIGNATURES
The registrant hereby certifies that it meets all the requirements for filing on Form 20-F and that it has dulycaused and authorized the undersigned to sign this annual report on its behalf.
SILICON MOTION TECHNOLOGY CORPORATION
By: /S/ WALLACE C. KOU
Wallace C. Kou,President and Chief Executive Officer
Date: April 30, 2014
64

SILICON MOTION TECHNOLOGY CORPORATION AND SUBSIDIARIES
INDEX TO CONSOLIDATED FINANCIAL STATEMENTS
Report of Independent Registered Public Accounting Firm . . . . . . . . . . . . . . . . . . . . . . . . . . . . . . . . . . . . . . . F-2Consolidated Balance Sheets as of December 31, 2012 and 2013 . . . . . . . . . . . . . . . . . . . . . . . . . . . . . . . . . . F-3Consolidated Statements of Income for the Years Ended December 31, 2011, 2012 and 2013 . . . . . . . . . . . . F-4Consolidated Statements of Comprehensive Income for the Years Ended December 31, 2011, 2012 and
2013 . . . . . . . . . . . . . . . . . . . . . . . . . . . . . . . . . . . . . . . . . . . . . . . . . . . . . . . . . . . . . . . . . . . . . . . . . . . . . . . . F-5Consolidated Statements of Changes in Shareholders’ Equity for the Years Ended December 31, 2011,
2012 and 2013 . . . . . . . . . . . . . . . . . . . . . . . . . . . . . . . . . . . . . . . . . . . . . . . . . . . . . . . . . . . . . . . . . . . . . . . . F-6Consolidated Statements of Cash Flows for the Years Ended December 31, 2011, 2012 and 2013 . . . . . . . . F-7Notes to Consolidated Financial Statements . . . . . . . . . . . . . . . . . . . . . . . . . . . . . . . . . . . . . . . . . . . . . . . . . . . F-8
F-1

REPORT OF INDEPENDENT REGISTERED PUBLIC ACCOUNTING FIRM
To the Board of Directors and Shareholders ofSilicon Motion Technology Corporation
We have audited the accompanying consolidated balance sheets of Silicon Motion Technology Corporationand subsidiaries (the “Company”) as of December 31, 2013 and 2012, and the related consolidated statements ofincome, comprehensive income, changes in shareholders’ equity and cash flows for each of the three years in theperiod ended December 31, 2013, all expressed in U.S. dollars. These financial statements are the responsibilityof the Company’s management. Our responsibility is to express an opinion on these financial statements basedon our audits.
We conducted our audits in accordance with the standards of the Public Company Accounting OversightBoard (United States). Those standards require that we plan and perform the audit to obtain reasonable assuranceabout whether the financial statements are free of material misstatement. An audit includes examining, on a testbasis, evidence supporting the amounts and disclosures in the financial statements. An audit also includesassessing the accounting principles used and significant estimates made by management, as well as evaluatingthe overall financial statement presentation. We believe that our audits provide a reasonable basis for ouropinion.
In our opinion, such consolidated financial statements present fairly, in all material respects, the financialposition of the Company as of December 31, 2013 and 2012, and the results of their operations and their cashflows for each of the three years in the period ended December 31, 2013, in conformity with accountingprinciples generally accepted in the United States of America.
As discussed in Note 2 to the consolidated financial statements, on January 1, 2012, SMI Taiwan, one of thesubsidiaries of Silicon Motion Technology Corporation, changed its functional currency to the U.S. dollar. TheCompany also changed its reporting currency to the U.S. dollar.
We have also audited, in accordance with the standards of the Public Company Accounting Oversight Board(United States), the Company’s internal control over financial reporting as of December 31, 2013, based on thecriteria established in Internal Control — Integrated Framework (1992) issued by the Committee of SponsoringOrganizations of the Treadway Commission and our report dated April 29, 2014 expressed an unqualifiedopinion on the Company’s internal control over financial reporting.
/s/ Deloitte & ToucheTaipei, TaiwanRepublic of ChinaApril 29, 2014
F-2

SILICON MOTION TECHNOLOGY CORPORATION AND SUBSIDIARIES
CONSOLIDATED BALANCE SHEETS(In Thousands, Except Par Value)
December 31
2012 2013
US$ US$
ASSETSCurrent Assets
Cash and cash equivalents . . . . . . . . . . . . . . . . . . . . . . . . . . . . . . . . . . . . . . . . . . . . . . . . . 154,734 161,720Short-term investments . . . . . . . . . . . . . . . . . . . . . . . . . . . . . . . . . . . . . . . . . . . . . . . . . . . 14,882 742Notes and accounts receivable, net . . . . . . . . . . . . . . . . . . . . . . . . . . . . . . . . . . . . . . . . . . 36,785 31,213Inventories . . . . . . . . . . . . . . . . . . . . . . . . . . . . . . . . . . . . . . . . . . . . . . . . . . . . . . . . . . . . . 32,143 33,666Restricted assets-current . . . . . . . . . . . . . . . . . . . . . . . . . . . . . . . . . . . . . . . . . . . . . . . . . . 15,283 15,299Deferred income tax assets, net . . . . . . . . . . . . . . . . . . . . . . . . . . . . . . . . . . . . . . . . . . . . . 2,369 1,278Prepaid expenses and other current assets . . . . . . . . . . . . . . . . . . . . . . . . . . . . . . . . . . . . 2,216 2,621
Total current assets . . . . . . . . . . . . . . . . . . . . . . . . . . . . . . . . . . . . . . . . . . . . . . . . . . 258,412 246,539Long-term investments . . . . . . . . . . . . . . . . . . . . . . . . . . . . . . . . . . . . . . . . . . . . . . . . . . . . . . . 178 133Property and equipment, net . . . . . . . . . . . . . . . . . . . . . . . . . . . . . . . . . . . . . . . . . . . . . . . . . . . 23,386 30,195Deferred income tax assets, net . . . . . . . . . . . . . . . . . . . . . . . . . . . . . . . . . . . . . . . . . . . . . . . . . 804 714Goodwill . . . . . . . . . . . . . . . . . . . . . . . . . . . . . . . . . . . . . . . . . . . . . . . . . . . . . . . . . . . . . . . . . . 35,472 35,474Other assets . . . . . . . . . . . . . . . . . . . . . . . . . . . . . . . . . . . . . . . . . . . . . . . . . . . . . . . . . . . . . . . . 3,494 3,708
Total assets . . . . . . . . . . . . . . . . . . . . . . . . . . . . . . . . . . . . . . . . . . . . . . . . . . . . . . . . 321,746 316,763
LIABILITIES AND SHAREHOLDERS’ EQUITYCurrent Liabilities
Notes and accounts payable . . . . . . . . . . . . . . . . . . . . . . . . . . . . . . . . . . . . . . . . . . . . . . . 26,642 14,661Income tax payable . . . . . . . . . . . . . . . . . . . . . . . . . . . . . . . . . . . . . . . . . . . . . . . . . . . . . . 4,668 8,189Current portion of long-term payable . . . . . . . . . . . . . . . . . . . . . . . . . . . . . . . . . . . . . . . . 252 207Accrued expenses and other current liabilities . . . . . . . . . . . . . . . . . . . . . . . . . . . . . . . . . 24,835 17,610
Total current liabilities . . . . . . . . . . . . . . . . . . . . . . . . . . . . . . . . . . . . . . . . . . . . . . . 56,397 40,667Long-term payable, net of current portion . . . . . . . . . . . . . . . . . . . . . . . . . . . . . . . . . . . . . . . . — 211Other long-term liabilities . . . . . . . . . . . . . . . . . . . . . . . . . . . . . . . . . . . . . . . . . . . . . . . . . . . . . 3,083 5,188
Total liabilities . . . . . . . . . . . . . . . . . . . . . . . . . . . . . . . . . . . . . . . . . . . . . . . . . . . . . 59,480 46,066
Commitments and Contingencies (Note 16)Shareholders’ Equity
Ordinary Shares at US$ 0.01 par value per share . . . . . . . . . . . . . . . . . . . . . . . . . . . . . . .Authorized: 500,000 thousand shares . . . . . . . . . . . . . . . . . . . . . . . . . . . . . . . . . . . .Issued and outstanding: 130,040 thousand shares in 2012 and 131,630 thousand
shares in 2013 . . . . . . . . . . . . . . . . . . . . . . . . . . . . . . . . . . . . . . . . . . . . . . . . . . . . 1,300 1,316Additional paid-in capital . . . . . . . . . . . . . . . . . . . . . . . . . . . . . . . . . . . . . . . . . . . . . . . . . 173,852 180,016Accumulated other comprehensive income . . . . . . . . . . . . . . . . . . . . . . . . . . . . . . . . . . . 3,665 4,095Retained Earnings . . . . . . . . . . . . . . . . . . . . . . . . . . . . . . . . . . . . . . . . . . . . . . . . . . . . . . . 83,449 85,270
Total shareholders’ equity . . . . . . . . . . . . . . . . . . . . . . . . . . . . . . . . . . . . . . . . . 262,266 270,697
Total liabilities and shareholders’ equity . . . . . . . . . . . . . . . . . . . . . . . . . . . . . 321,746 316,763
The accompanying notes are an integral part of the consolidated financial statements.
F-3

SILICON MOTION TECHNOLOGY CORPORATION AND SUBSIDIARIES
CONSOLIDATED STATEMENTS OF INCOME(In Thousands, Except Earnings Per Share)
Year Ended December 31
2011 2012 2013
US$(Note 2) US$ US$
NET SALES . . . . . . . . . . . . . . . . . . . . . . . . . . . . . . . . . . . . . . . . . . . . . . . . . . . . . . . 223,845 281,370 225,308COST OF SALES . . . . . . . . . . . . . . . . . . . . . . . . . . . . . . . . . . . . . . . . . . . . . . . . . . 115,806 149,650 118,698
GROSS PROFIT . . . . . . . . . . . . . . . . . . . . . . . . . . . . . . . . . . . . . . . . . . . . . . . . . . . 108,039 131,720 106,610
OPERATING EXPENSESResearch and development . . . . . . . . . . . . . . . . . . . . . . . . . . . . . . . . . . . . . . . . 40,501 50,975 46,460Sales and marketing . . . . . . . . . . . . . . . . . . . . . . . . . . . . . . . . . . . . . . . . . . . . . 14,537 15,919 13,597General and administrative . . . . . . . . . . . . . . . . . . . . . . . . . . . . . . . . . . . . . . . 11,323 12,156 11,250Amortization of intangible assets . . . . . . . . . . . . . . . . . . . . . . . . . . . . . . . . . . . 694 — —
Total operating expenses . . . . . . . . . . . . . . . . . . . . . . . . . . . . . . . . . . . . . 67,055 79,050 71,307
OPERATING INCOME . . . . . . . . . . . . . . . . . . . . . . . . . . . . . . . . . . . . . . . . . . . . . . 40,984 52,670 35,303
NON-OPERATING INCOME (EXPENSES)Gain from disposal of short-term investments . . . . . . . . . . . . . . . . . . . . . . . . . 10 2 122Unrealized holding loss on short-term investment . . . . . . . . . . . . . . . . . . . . . . — (118) —Dividend income . . . . . . . . . . . . . . . . . . . . . . . . . . . . . . . . . . . . . . . . . . . . . . . — 17 —Interest income . . . . . . . . . . . . . . . . . . . . . . . . . . . . . . . . . . . . . . . . . . . . . . . . . 597 1,433 1,845Foreign exchange gain (loss), net . . . . . . . . . . . . . . . . . . . . . . . . . . . . . . . . . . . 5,683 390 (25)Interest expense . . . . . . . . . . . . . . . . . . . . . . . . . . . . . . . . . . . . . . . . . . . . . . . . (75) (61) (110)Other income, net . . . . . . . . . . . . . . . . . . . . . . . . . . . . . . . . . . . . . . . . . . . . . . . 17 1 13
Total non-operating income . . . . . . . . . . . . . . . . . . . . . . . . . . . . . . . . . . . 6,232 1,664 1,845
INCOME BEFORE INCOME TAX . . . . . . . . . . . . . . . . . . . . . . . . . . . . . . . . . . . . 47,216 54,334 37,148INCOME TAX EXPENSE . . . . . . . . . . . . . . . . . . . . . . . . . . . . . . . . . . . . . . . . . . . 5,747 7,116 9,772
NET INCOME . . . . . . . . . . . . . . . . . . . . . . . . . . . . . . . . . . . . . . . . . . . . . . . . . . . . . 41,469 47,218 27,376
EARNINGS PER ORDINARY SHARE:Basic . . . . . . . . . . . . . . . . . . . . . . . . . . . . . . . . . . . . . . . . . . . . . . . . . . . . . . . . . 0.34 0.37 0.21
Diluted . . . . . . . . . . . . . . . . . . . . . . . . . . . . . . . . . . . . . . . . . . . . . . . . . . . . . . . 0.32 0.35 0.20
WEIGHTED AVERAGE ORDINARY SHARES OUTSTANDINGBasic (Thousands) . . . . . . . . . . . . . . . . . . . . . . . . . . . . . . . . . . . . . . . . . . . . . . 123,082 129,259 132,259
Diluted (Thousands) . . . . . . . . . . . . . . . . . . . . . . . . . . . . . . . . . . . . . . . . . . . . . 129,370 134,504 134,567
EARNINGS PER ADS (one ADS equals four ordinary shares):Basic . . . . . . . . . . . . . . . . . . . . . . . . . . . . . . . . . . . . . . . . . . . . . . . . . . . . . . . . . 1.35 1.46 0.83
Diluted . . . . . . . . . . . . . . . . . . . . . . . . . . . . . . . . . . . . . . . . . . . . . . . . . . . . . . . 1.28 1.40 0.81
WEIGHTED AVERAGE ADS OUTSTANDINGBasic (Thousands) . . . . . . . . . . . . . . . . . . . . . . . . . . . . . . . . . . . . . . . . . . . . . . 30,771 32,315 33,065
Diluted (Thousands) . . . . . . . . . . . . . . . . . . . . . . . . . . . . . . . . . . . . . . . . . . . . . 32,343 33,626 33,642
The accompanying notes are an integral part of the consolidated financial statements.
F-4

SILICON MOTION TECHNOLOGY CORPORATION AND SUBSIDIARIES
CONSOLIDATED STATEMENTS OF COMPREHENSIVE INCOME(In Thousands)
Year Ended December 31
2011 2012 2013
US$(Note 2) US$ US$
NET INCOME . . . . . . . . . . . . . . . . . . . . . . . . . . . . . . . . . . . . . . . . . . . . . . . . . . . . . . . . 41,469 47,218 27,376
OTHER COMPREHENSIVE INCOME (LOSS), NET OF TAX EFFECT OF NILChange in net foreign currency translation adjustments . . . . . . . . . . . . . . . . . . . . (8,476) 1,947 633Change in deferred pension gain (loss) . . . . . . . . . . . . . . . . . . . . . . . . . . . . . . . . . 76 (337) (203)
OTHER COMPREHENSIVE INCOME (LOSS) . . . . . . . . . . . . . . . . . . . . . . . . . . . . . (8,400) 1,610 430
TOTAL COMPREHENSIVE INCOME . . . . . . . . . . . . . . . . . . . . . . . . . . . . . . . . . . . . 33,069 48,828 27,806
The accompanying notes are an integral part of the consolidated financial statements.
F-5

SILICON MOTION TECHNOLOGY CORPORATION AND SUBSIDIARIES
CONSOLIDATED STATEMENTS OF CHANGES IN SHAREHOLDERS’ EQUITY(In Thousands, Except Per Share Data)
Ordinary Share
AdditionalPaid-inCapital
AccumulatedOther
ComprehensiveIncome (Loss)
RetainedEarnings
(accumulateddeficit)
TreasuryStock
TotalShareholders’
Equity
Shares Amount
(thousands) US$ US$ US$ US$ US$ US$BALANCE, JANUARY 1, 2011
(Note 2) . . . . . . . . . . . . . . . . . . . . . . 117,139 1,172 150,972 10,455 (5,238) — 157,361Components of comprehensive
income, net of tax . . . . . . . . . .Net income . . . . . . . . . . . . . . . . . — — — — 41,469 — 41,469Other comprehensive loss . . . . . . — — — (8,400) — — (8,400)
Total comprehensive income . . . . — — — — — — 33,069Stock-based compensation
expenses . . . . . . . . . . . . . . . . . — — 8,878 — — — 8,878Issuance of ordinary shares upon
exercise of employee stockoptions and restricted stockunits . . . . . . . . . . . . . . . . . . . . . 7,433 74 2,118 — — — 2,192
BALANCE, DECEMBER 31,2011 . . . . . . . . . . . . . . . . . . . . . . . . . 124,572 1,246 161,968 2,055 36,231 — 201,500
Components of comprehensiveincome, net of tax . . . . . . . . . .
Net income . . . . . . . . . . . . . . . . . — — — — 47,218 — 47,218Other comprehensive income . . . — — — 1,610 — — 1,610
Total comprehensive income . . . . — — — — — — 48,828Stock-based compensation
expenses . . . . . . . . . . . . . . . . . — — 11,802 — — — 11,802Issuance of ordinary shares upon
exercise of employee stockoptions and restricted stockunits . . . . . . . . . . . . . . . . . . . . . 5,468 54 82 — — — 136
BALANCE, DECEMBER 31,2012 . . . . . . . . . . . . . . . . . . . . . . . . . 130,040 1,300 173,852 3,665 83,449 — 262,266
Components of comprehensiveincome, net of tax . . . . . . . . . .
Net income . . . . . . . . . . . . . . . . . — — — — 27,376 — 27,376Other comprehensive income . . . — — — 430 — — 430
Total comprehensive income . . . . — — — — — — 27,806Stock-based compensation
expenses . . . . . . . . . . . . . . . . . — — 10,262 — — — 10,262Issuance of ordinary shares upon
exercise of employee stockoptions and restricted stockunits . . . . . . . . . . . . . . . . . . . . . 5,154 52 294 — — — 346
Share repurchase . . . . . . . . . . . . . — — — — — (10,018) (10,018)Dividends declared (US$0.15 per
ordinary share) . . . . . . . . . . . . . — — — — (19,965) — (19,965)Treasury stock retired . . . . . . . . . (3,564) (36) (4,392) — (5,590) 10,018 —
BALANCE, DECEMBER 31,2013 . . . . . . . . . . . . . . . . . . . . . . . . . 131,630 1,316 180,016 4,095 85,270 — 270,697
The accompanying notes are an integral part of the consolidated financial statements.
F-6

SILICON MOTION TECHNOLOGY CORPORATION AND SUBSIDIARIES
CONSOLIDATED STATEMENTS OF CASH FLOWS(In Thousands)
Year Ended December 31
2011 2012 2013
US$(Note 2) US$ US$
CASH FLOWS FROM OPERATING ACTIVITIESNet income . . . . . . . . . . . . . . . . . . . . . . . . . . . . . . . . . . . . . . . . . . . . . . . . . . . . 41,469 47,218 27,376Adjustments to reconcile net income to net cash provided by operating
activities:Unrealized holding loss on short-term investment . . . . . . . . . . . . . . . . . . — 118 —Depreciation and amortization . . . . . . . . . . . . . . . . . . . . . . . . . . . . . . . . . 5,580 5,881 6,429Amortization of intangible assets . . . . . . . . . . . . . . . . . . . . . . . . . . . . . . . 694 — —Gain from disposal of short-term investments . . . . . . . . . . . . . . . . . . . . . (10) (2) (122)Stock-based compensation . . . . . . . . . . . . . . . . . . . . . . . . . . . . . . . . . . . . 8,878 11,802 10,262Loss (gain) on disposal of property and equipment . . . . . . . . . . . . . . . . . (1) 26 5Deferred income taxes . . . . . . . . . . . . . . . . . . . . . . . . . . . . . . . . . . . . . . . 2,510 1,582 1,181Deferred rent . . . . . . . . . . . . . . . . . . . . . . . . . . . . . . . . . . . . . . . . . . . . . . . (2) — —Changes in operating assets and liabilities:
Short-term investments . . . . . . . . . . . . . . . . . . . . . . . . . . . . . . . . . . . (1,658) (12,018) 14,265Notes and accounts receivable . . . . . . . . . . . . . . . . . . . . . . . . . . . . . (10,952) 2,002 5,572Inventories . . . . . . . . . . . . . . . . . . . . . . . . . . . . . . . . . . . . . . . . . . . . . (6,334) (1,828) (1,523)Prepaid expenses and other current assets . . . . . . . . . . . . . . . . . . . . (1,052) 248 (403)Other assets . . . . . . . . . . . . . . . . . . . . . . . . . . . . . . . . . . . . . . . . . . . . (547) 590 (143)Notes and accounts payable . . . . . . . . . . . . . . . . . . . . . . . . . . . . . . . 9,667 5,644 (11,981)Accrued expenses and other current liabilities . . . . . . . . . . . . . . . . . 3,948 6,390 (7,415)Income tax payable . . . . . . . . . . . . . . . . . . . . . . . . . . . . . . . . . . . . . . 2,015 1,362 3,520Other liabilities . . . . . . . . . . . . . . . . . . . . . . . . . . . . . . . . . . . . . . . . . 56 221 2,105
Net cash provided by operating activities . . . . . . . . . . . . . . . . . . . . . 54,261 69,236 49,128
CASH FLOWS FROM INVESTING ACTIVITIESReturn of capital from long-term investments . . . . . . . . . . . . . . . . . . . . . . . . . — — 46Business acquisition-net of cash and cash equivalents acquired . . . . . . . . . . . (700) — —Purchase of property and equipment . . . . . . . . . . . . . . . . . . . . . . . . . . . . . . . . (4,916) (4,280) (12,772)Changes in restricted assets . . . . . . . . . . . . . . . . . . . . . . . . . . . . . . . . . . . . . . . (8,331) (469) (89)
Net cash used in investing activities . . . . . . . . . . . . . . . . . . . . . . . . . (13,947) (4,749) (12,815)
CASH FLOWS FROM FINANCING ACTIVITIESProceeds from issuance of ordinary shares upon exercise of employee stock
options . . . . . . . . . . . . . . . . . . . . . . . . . . . . . . . . . . . . . . . . . . . . . . . . . . . . . . 2,294 224 422Share repurchase . . . . . . . . . . . . . . . . . . . . . . . . . . . . . . . . . . . . . . . . . . . . . . . . — — (10,018)Dividends paid . . . . . . . . . . . . . . . . . . . . . . . . . . . . . . . . . . . . . . . . . . . . . . . . . — — (19,897)
Net cash provided by (used in) financing activities . . . . . . . . . . . . . . . . . 2,294 224 (29,493)
NET INCREASE IN CASH AND CASH EQUIVALENTS . . . . . . . . . . . . . . . . . . 42,608 64,711 6,820EFFECT OF EXCHANGE RATE CHANGES . . . . . . . . . . . . . . . . . . . . . . . . . . . . (7,734) 1,260 166CASH AND CASH EQUIVALENTS, BEGINNING OF YEAR . . . . . . . . . . . . . . 53,889 88,763 154,734
CASH AND CASH EQUIVALENTS, END OF YEAR . . . . . . . . . . . . . . . . . . . . . 88,763 154,734 161,720
SUPPLEMENTAL INFORMATIONInterest paid . . . . . . . . . . . . . . . . . . . . . . . . . . . . . . . . . . . . . . . . . . . . . . . . . . . . — — 86
Income taxes paid . . . . . . . . . . . . . . . . . . . . . . . . . . . . . . . . . . . . . . . . . . . . . . . 988 3,256 2,947
The accompanying notes are an integral part of the consolidated financial statements.
F-7

SILICON MOTION TECHNOLOGY CORPORATION AND SUBSIDIARIES
NOTES TO CONSOLIDATED FINANCIAL STATEMENTS(In Thousands)
1. ORGANIZATION AND OPERATIONS
Silicon Motion Technology Corporation (“SMTC”, collectively with its subsidiaries the “Company”) is aholding company incorporated in the Cayman Islands on January 27, 2005. Significant parts of the Company’soperations are conducted through Silicon Motion, Inc. (“SMI Taiwan”), a wholly-owned subsidiary of SMTC,located in Taiwan and FCI Inc. (“FCI”), a wholly-owned subsidiary of SMTC, located in Korea. The Company isa fabless semiconductor company that designs, develops and markets, high-performance, low-powersemiconductor solutions to OEMs and other customers in the mobile storage and mobile communicationsmarkets. In the mobile storage market, the Company’s key products are microcontrollers used in solid statestorage devices such as SSDs, eMMCs and other embedded flash applications, as well as removable storageproducts such as flash memory cards and USB flash drives. For the mobile communications market, theCompany’s key products are handset transceivers and mobile TV IC solutions.
The Company acquired SMI Taiwan in April 2005. Originally SMI Taiwan was known as Feiya TechnologyCorporation (“Feiya”), a Taiwan corporation which was incorporated in April 1997 but had changed its name toSMI Taiwan after acquiring in August 2002 Silicon Motion, Inc., a California corporation (“SMI USA”), whichwas incorporated in November 1995. Feiya was originally a flash memory products company and SMI USA agraphics processor company. In April 2007, the Company acquired FCI, a leading designer of RF ICs for mobileTV and wireless communications based in South Korea. The Company established Silicon Motion BV in theNetherlands in 2011 with the purpose of expanding its business activities in Europe, as well as providingsupervisory, financing, legal support, accounting services and shareholding for the Company’s businesses inother parts of the world.
2. SUMMARY OF SIGNIFICANT ACCOUNTING POLICIES
Basis of Presentation
The consolidated financial statements have been prepared in accordance with accounting principlesgenerally accepted in the United States of America (U.S. GAAP). The consolidated financial statements includethe accounts of SMTC and its wholly-owned subsidiaries. The Company owns 100% of the outstanding shares inall of its subsidiaries, except for FCI which the Company owns over 99.9%. All significant intercompanybalances and transactions have been eliminated upon consolidation.
Use of Estimates
The preparation of consolidated financial statements in conformity with U.S. GAAP requires managementto make estimates and assumptions that affect certain reported amounts and disclosures. The actual results coulddiffer from those estimates.
Concentration of Credit Risk
Financial instruments that potentially subject the Company to a concentration of credit risk consist of cash,cash equivalents, investment in debt securities and accounts receivable. Cash is deposited with high credit-qualityfinancial institutions. For accounts receivable, the Company performs ongoing credit evaluations of itscustomers’ financial condition and the Company maintains an allowance for doubtful accounts receivable basedupon a review of the expected collectibility of individual accounts.
F-8

The Company sells semiconductor solutions to leading module makers and OEMs worldwide. TheCompany provides high performance flash memory storage controllers to companies such as SK Hynix, Netcom,Micron, Samsung, Sony, and Transcend. The Company is a leading supplier of controllers used in eMMCembedded memory, flash memory cards, and USB flash drives. The Company provides innovative mobilecommunications ICs primarily to LG and Samsung. Sales to one customer in 2011 and 2012 and two customersin 2013 accounted for 10% or more of our net revenue, represented 28%, 35% and 46% of our net revenue in2011, 2012 and 2013, respectively. In 2011 and 2012, the significant customer was Samsung and in 2013,Samsung and SK Hynix. The Company’s top ten customers in 2011, 2012 and 2013 accounted for approximately64%, 75% and 76% of net sales.
Fair Value of Financial Instruments
The carrying amount of the Company’s financial instruments, including cash and cash equivalents, notesand accounts receivable and notes and accounts payables approximates fair value due to the short-term maturityof the instruments. Fair values of short-term investments represent quoted market prices, if available. If noquoted market prices are available, fair values are estimated based on discounted cash flow, or other valuationtechniques. Long-term investments are privately-held companies where there is no readily determinable marketvalue and are recorded using the cost method, since the cost of obtaining verifiable fair value is unreasonablyhigh. The Company periodically evaluates these investments for impairment. If it is determined that an other-than-temporary decline has occurred in the carrying value, an impairment loss is recorded for that period. TheCompany’s long-term liabilities approximate their fair values as they contain interest rates that vary according tomarket interest rates.
Fair value is the price that would be received upon sale of an asset or paid upon transfer of a liability in anorderly transaction between market participants at the measurement date and in the principal or most advantageousmarket for that assets or liability. The fair value should be calculated based on assumptions that market participantswould use in pricing the asset or liability, not on assumptions specific to the Company. A three-tier fair valuehierarchy is established as a basis for considering such assumptions and for inputs used in the valuationmethodologies in measuring fair value. The hierarchy prioritizes the inputs into three levels based on the extent towhich inputs used in measuring fair value are observable in the market. Each fair value measurement is reported inone of the three levels which is determined by the lowest level input that is significant to the fair value measurementin its entirety. These levels are:
Level 1 — Use unadjusted quoted prices in active markets for identical assets or liabilities.
Level 2 — Use observable inputs other than Level 1 prices such as quoted prices for identical or similarinstruments in markets that are not active, quoted prices for similar instruments in active markets, and model-based valuation in which all significant inputs are observable or can be corroborated by observable market datafor substantially the full term of the assets or liabilities.
Level 3 — Use inputs that are generally unobservable and reflect the use of significant managementjudgments and estimates.
See Note 18, “Fair Value Measurement”, for the related disclosure.
Cash Equivalents
The Company considers all highly liquid investments with maturities within three months from the date ofpurchase to be cash equivalents.
Short-term Investments
The Company’s short-term investments are short-term income yielding investments with original maturitiesgreater than three months from the purchase date and remaining maturities less than one year. These short-term
F-9

investments consist primarily of bond funds that are bought and held principally for the purpose of selling themin the near term and are classified as trading securities as well as structured notes designated at the fair value.They are reported at fair value with the subsequent changes in fair value recorded in earnings as unrealized gainsand losses.
Allowance for Doubtful Receivables
An allowance for doubtful receivables is provided based on a review of the collectability of accountsreceivables. The Company determines the amount of allowance for doubtful receivables by examining thehistorical collection experience and current trends in the credit quality of its customers as well as its internalcredit policies.
Inventories
Inventories are stated at the lower of cost or market value. Inventories are recorded at standard cost andadjusted to the approximate weighted-average cost at the balance sheet date. Market value represents the currentreplacement cost for raw materials, work in process and finished goods. The Company assesses its inventory forestimated obsolescence or unmarketable inventory based upon management’s assumptions about future demandand market conditions. In estimating reserves for obsolescence, the Company primarily evaluates estimates basedon the timing of the introduction of new products and the quantities remaining of old products and providesreserves for inventory on hand in excess of the estimated demand. Estimated losses on slow-moving items arerecognized and included in the allowance for losses.
Long-term Investments
The Company has long-term investments in companies that it does not exercise significant influence andaccounts for these investments under the cost method. Management regularly evaluates financial informationrelated to these investments to determine whether an other than temporary decline in their value exists. Factorsindicative of an other than temporary decline include recurring operating losses, credit defaults and subsequentrounds of financings at an amount below the cost basis of the investment. Management periodically weighs allquantitative and qualitative factors in determining if any impairment loss exists. When a decline in value isdeemed to be other-than-temporary, the Company recognizes an impairment loss in other income and expense.
Property and Equipment
Property and equipment are stated at cost less accumulated depreciation. Significant additions, renewals andbetterments are capitalized, while maintenance and repairs are expensed as incurred.
Depreciation is computed using the straight-line method over estimated useful lives that range as follows:buildings — 25 to 50 years; machinery and equipment — 3 to 6 years; furniture and fixtures — 3 to 8 years;software — 1 to 5 years; leasehold and buildings improvement — the shorter of the estimated useful life or leaseterm, which is generally 2 to 6 years. Depreciation expense recognized for the years ended December 31, 2011,2012 and 2013 was approximately US$5,580 thousand, US$5,881 thousand and US$6,429 thousand,respectively.
Upon the sale or other disposal of property and equipment, the related cost and accumulated depreciation areremoved from the accounts, and any gain or loss is credited or charged to operating income.
Government Grants
Grants received by the Company from the Korean government to assist with specific research anddevelopment activities are deducted from those research and development costs incurred, in the period in which
F-10

the related expenses are incurred, to the extent that they are non-refundable. Government grants that were usedfor the acquisition of fixed assets are deducted from the acquisition costs of the acquired assets and amortizedover the useful lives of the related assets. The Company recognizes refundable government grants as long-termpayable and current portion of long-term payable on its consolidated balance sheet.
Goodwill and Intangible Assets
Goodwill is the excess of the purchase price paid over the fair value of the net tangible and intangible assetsacquired in a business combination. Intangible assets, which consist primarily of core technology and customerrelationship, are amortized over their estimated useful lives, of 4 years at the time of acquisition.
Impairment of Goodwill and Long-Lived Assets
The Company evaluates the recoverability of long-lived assets whenever events or changes in circumstancesindicate the carrying value may not be recoverable. The determination of recoverability is based on an estimateof undiscounted cash flows expected to result from the use of an asset and its eventual disposition. The estimateof cash flows is based upon, among other things, certain assumptions about expected future operatingperformance, growth rates and other factors. Estimates of undiscounted cash flows may differ from actual cashflows due to, among other things, technological changes, economic conditions, changes to the business model orchanges in operating performance. If the sum of the undiscounted cash flows is less than the carrying value, animpairment loss is recognized, measured as the amount by which the carrying value exceeds the fair value of theasset. Fair value is determined by reference to quoted market prices, if available, or discounted cash flows, asappropriate. See Note 10, “Goodwill and Acquired Intangible Assets,” regarding impairment testing in fiscal year2012 and 2013.
The Company monitors the recoverability of goodwill recorded in connection with acquisitions, byreporting unit, annually, or sooner if events or changes in circumstances indicate that the carrying amount maynot be recoverable. The Company conducts its annual impairment test of goodwill on November 30. Reportingunits may be operating segments as a whole or an operation one level below an operating segment, referred to asa component. Goodwill impairment is tested using a two-step approach. The first step compares the fair value ofa reporting unit to its carrying amount, including goodwill. If the fair value of the reporting unit is greater than itscarrying amount, goodwill is not considered impaired and the second step is not required. If the fair value of thereporting unit is less than its carrying amount, the second step of the impairment test measures the amount of theimpairment loss, if any, by comparing the implied fair value of goodwill to its carrying amount. If the carryingamount of goodwill exceeds its implied fair value, an impairment loss is recognized equal to that excess. Theimplied fair value of goodwill is calculated in the same manner that goodwill is calculated in a businesscombination, whereby the fair value of the reporting unit is allocated to all of the assets and liabilities of that unit,with the excess purchases price over the amounts assigned to assets and liabilities. Estimating fair value isperformed by utilizing various valuation approaches, such as income approach or market approach. The total ofall reporting unit fair values was also compared to the Company’s market capitalization plus control premium forreasonableness. See Note 10, “Goodwill and Acquired Intangible Assets,” regarding impairment testing.
Other Assets
Other assets primarily consist of intellectual property and deposits for office leases.
Restricted Assets
Restricted assets consist of deposits required for litigation and restricted cash. Restricted cash representscash set aside as collateral for obtaining capacity and borrowings as well as cash received from governmentgrants with restriction on its usage.
F-11

Pension Costs
For employees under defined contribution pension plans, pension costs are recorded based on the actualcontributions made to employees’ individual pension accounts. For employees under defined benefit pensionplans, pension costs are recorded based on actuarial calculations.
Revenue Recognition
Revenue from product sales is generally recognized upon shipment to the customer provided that theCompany has received a signed purchase order, the price is fixed or determinable, transfer of title has occurred inaccordance with the shipping terms specified in the arrangement with the customer, collectibility from thecustomer is considered reasonably assured, product returns are reasonably estimable and there are no remainingsignificant obligations or customer acceptance requirements. Revenue on development service orders is generallyrecognized upon completion and customer acceptance of contractually agreed milestones.
The Company grants certain distributors limited rights of return and price protection rights on unsoldproducts. The return rights are generally limited to five percent of the monetary value of products purchasedwithin the preceding six months, provided that the distributor places a corresponding restocking order of equal orgreater value. An allowance for sales returns for distributors and all customers is recorded at the time of salebased on historical returns information available, management’s judgment and any known factors at the time thefinancial statements are prepared that would significantly affect the allowance. Price protection rights are basedon the inventory products the distributors have on hand at the date the price protection is offered. A reserve forprice adjustments is recorded based on the estimated products on hand at the distributors and historicalexperience. The Company incurred actual price adjustments to distributors are minimal.
The Company provides a warranty period of one year for manufacturing defects of its products. Warrantyreturns have been infrequent and relate to defective or off-specification parts. The Company estimates a reservefor warranty based on historical experience and records this amount to cost of sales. For the years endedDecember 31, 2011, 2012 and 2013, the Company did not experience significant costs associated with warrantyreturns.
Research and Development
Research and development costs consist of expenditures incurred during the course of planned research andinvestigation aimed at the discovery of new knowledge that will be useful in developing new products or atsignificantly enhancing existing products as well as expenditures incurred for the design and testing of productalternatives. All expenditures related to research and development activities of the Company are charged tooperating expenses when incurred. Third-party research and development costs are expensed when the contractedwork has been performed or as milestone results have been achieved.
Income Taxes
The provision for income tax represents income tax paid and payable for the current year plus the changes inthe deferred income tax assets and liabilities during the years. Deferred income tax assets are recognized for netoperating loss carryforwards, research and development credits, and temporary differences. The Companybelieves that uncertainty exists regarding the realizability of certain deferred income tax assets and, accordingly,has established a valuation allowance for those deferred income tax assets to the extent the realizability is notdeemed to be more likely than not. Deferred income tax assets and liabilities are measured using enacted taxrates.
The Company utilizes a two step approach to recognizing and measuring uncertain tax positions. The firststep is to evaluate the tax position for recognition by determining if the weight of available evidence indicates itis more likely than not that the position will be sustained in a dispute with taxing authorities, including resolution
F-12

of related appeals or litigation processes, if any. The second step is to measure the tax benefit as the largestamount which is more than 50% likely of being realized upon ultimate settlement.
SMI Taiwan, the Company’s largest operating company is a Taiwan registered company. Under Taiwan taxregulations, the current year’s earnings, on an after tax basis, that are not distributed in the following year aresubject to a 10% additional income tax. This 10% additional income tax is recognized in the period during whichthe related earnings are generated.
The Taiwan government enacted the Income Basic Tax Act (“the IBT Act”), which became effective onJanuary 1, 2006. The alternative minimum tax (“AMT”) imposed under the IBT Act is a supplemental tax leviedat a rate of 10% which is payable if the income tax payable determined pursuant to the Income Tax Law is belowthe minimum amount prescribed under the IBT Act. The taxable income for calculating the AMT includes mostof the income that is exempted from income tax under various laws and statutes. The Company has consideredthe impact of the IBT Act in the determination of its tax liabilities. Under the IBT Act amended in August 2012,the standard deduction and the tax rate of AMT were amended from NT$1,000 thousand to be NT$500 thousandand from 10% to 12%, respectively. The amended IBT Act is effective on January 1, 2013.
Foreign Currency Transactions
Foreign currency transactions are recorded at the rates of exchange in effect when the transaction occurs.Gains or losses, resulting from the application of different foreign exchange rates when cash in foreign currencyis converted into the entities’ functional currency, or when foreign currency receivables and payables are settled,are credited or charged to income in the period of conversion or settlement. At the balance sheet date, assets andliabilities denominated in foreign currencies are remeasured based on prevailing exchange rates and any resultinggains or losses are credited or charged to income.
Translation of Foreign Currency Financial Statements
The reporting currency of the Company is the New Taiwan dollars until December 2011. The functionalcurrency of each one of the Company’s subsidiaries is the local currency of the respective entity. Accordingly,the financial statements of the foreign subsidiaries were translated into New Taiwan dollars at the followingexchange rates: assets and liabilities — current rate on the balance sheet date; shareholders’ equity — historicalrates; income and expenses — average rate during the period. The resulting translation adjustment is recorded asa separate component of comprehensive income.
Change in Functional Currency and Reporting Currency
On January 1, 2012, the Company changed the functional currency of SMI Taiwan, its largest operatingsubsidiary, from the NT dollar to the U.S. dollar based on an evaluation of economic facts and circumstances andfunctional currency analysis prescribed in ASC 830. As a result of SMI Taiwan’s functional currency change, theCompany changed its reporting currency from the NT dollar to the U.S. dollar.
In 2005, at the time of the Company’s IPO, the Company determined that SMI Taiwan’s functional currencywas the NT dollar and this determination was used consistently until the Company determined significant andpermanent changes in economic facts and circumstances warranted a change in functional currency. Since thebusiness profile and activities of SMI Taiwan had changed significantly and did not appear to be temporary, theCompany re-evaluated the functional currency of SMI Taiwan based on recent economic facts andcircumstances, including analysis prescribed in ASC 830, and determined that the U.S. dollar had become thefunctional currency of SMI Taiwan.
The business activities of SMI Taiwan have changed significantly since 2005. In the past, the majority ofSMI Taiwan sales were to Taiwanese module maker customers; in 2012 the majority of SMI Taiwan sales were
F-13

to international OEMs. The Company believes this trend is not temporary because a fast growing andincreasingly large and material source of SMI Taiwan’s sales are from SSD and embedded memory products, andthese products are predominately sold to international OEM customers. The significance of SMI Taiwan’s otherproducts, primarily card and USB flash drive controller products, has been declining and will continue to declinedue to the maturity of their markets, and a majority of these products are now sold to non-Taiwan-basedcustomers. SMI Taiwan’s cash flow, sales price, sales markets, expenses, financing and intercompanytransactions are now primarily U.S. dollar-based. Economic facts and circumstances, as well as functionalcurrency analysis support the Company’s determination that the U.S. dollar has become the functional currencyof SMI Taiwan as of January 1, 2012.
As from January 1, 2012, the Company has reported the consolidated results in U.S. dollars, and theCompany has recasted the historical financial statements from the NT dollar to the U.S. dollar. Items on thehistorical balance sheet and income statement were converted from the NT dollar to the U.S. dollars at thefollowing rates:
Balance Sheet(at year-end NT dollar to
U.S.dollar rate)
IncomeStatement(at averageNT dollar
toU.S.
dollar rate)
2008 32.80 31.422009 31.99 32.552010 29.13 31.562011 30.28 29.53
Comprehensive Income (Loss)
Comprehensive income and loss represents net income (loss) plus the results of certain changes inshareholders’ equity during a period from non-owner sources. The following table presents the components ofaccumulated other comprehensive income (loss) as of December 31, 2011, 2012 and 2013:
Year Ended December 31, 2011 Year Ended December 31, 2012 Year Ended December 31, 2013
US$ US$ US$
Foreigncurrency
items
Definedbenefitpensionplans
Accumulatedother
comprehensiveincome (loss)
Foreigncurrency
items
Definedbenefitpensionplans
Accumulatedother
comprehensiveincome (loss)
Foreigncurrency
items
Definedbenefitpensionplans
Accumulatedother
comprehensiveincome (loss)
Beginning balance . . 10,452 3 10,455 1,976 79 2,055 3,923 (258) 3,665Current-period
change . . . . . . . . . (8,476) 76 (8,400) 1,947 (337) 1,610 633 (203) 430
Ending balance . . . . 1,976 79 2,055 3,923 (258) 3,665 4,556 (461) 4,095
Legal Contingencies
The Company is currently involved in various claims and legal proceedings. Periodically, the Companyreviews the status of each significant matter and assesses the potential financial exposure. If the potential lossfrom any claim or legal proceeding is considered probable and the amount can be estimated, the Companyaccrues a liability for the estimated loss. Because of uncertainties related to these matters, accruals are based onlyon the best information available at the time. As additional information becomes available, the Companyreassesses the potential liability related to the pending claims and litigation and revises these estimates asappropriate. Such revisions in the estimates of the potential liabilities could have a material impact on the resultsof operations and financial position.
F-14

Earnings Per Share
Basic earnings per share are computed by dividing net earnings attributable to ordinary shareholders by theweighted average number of ordinary shares outstanding during the period. Diluted earnings per share reflect thepotential dilution that could occur if stock options and other dilutive securities were exercised. Dilutive securitiesare excluded from the computation of the diluted income per share in periods when their effect is anti-dilutive.The Company’s dilutive securities consist of employee stock options and restricted stock units. The effect ofdilutive securities including employee stock options and restricted stock units were 6,288 thousand shares(1,572 thousand ADSs), 5,245 thousand shares (1,311 thousand ADSs) and 2,308 thousand shares (577 thousandADSs) for the year ended December 31, 2011, 2012 and 2013, respectively.
Stock-Based Compensation
The Company accounts for stock-based compensation in accordance with ASC 718 Compensation — StockCompensation. The Company uses the Black-Scholes valuation model for the valuation of stock options andrecognizes compensation expense on a straight-line basis over the requisite service period of the award. Thevalue of our restricted stock units is based on the fair value of our shares on the date of grant and expensed overthe vesting period.
Prior to the initial declaration of a quarterly cash dividend on January 22, 2013, the fair value of restrictedstock units (“RSUs”) was measured based on the grant date share price, as we did not historically pay cashdividends on our common stock. For awards granted on or subsequent to January 22, 2013, the fair value ofRSUs was measured based on the grant date share price, less the present value of expected dividends during thevesting period, discounted at a risk-free interest rate.
Treasury Stock
Treasury stock is stated at cost and shown as a reduction to shareholders’ equity.
The Company retires ordinary shares repurchased under a share repurchase plan. Accordingly, uponretirement the excess of the purchase price over par value is allocated between additional paid-in capital andretained earnings based on the average issuance price of the shares repurchased. A repurchase of ADSs isrecorded as treasury stock until the Company completes the withdrawal of the underlying ordinary shares fromthe ADS program.
Dividends
On January 22, 2013, the Company declared the first quarterly dividend of US$0.15 per ADS, equivalent toUS$0.0375 per ordinary share, and paid this dividend on March 4, 2013. The payment of future cash dividendsare subject to the Board’s continuing determination that the payment of dividends are in the best interests of theCompany’s shareholders and are in compliance with all laws and agreements of the Company applicable to thedeclaration and payment of cash dividends.
Recent Accounting Pronouncements
In December 2011, Financial Accounting Standards Board (“the FASB”) issued an accounting update,which creates new disclosure requirements regarding the nature of an entity’s rights of setoff and relatedarrangements associated with its financial instruments and derivative instruments. Certain disclosures of theamounts of certain instruments subject to enforceable master netting arrangements or similar agreements wouldbe required, irrespective of whether the entity has elected to offset those instruments in the statement of financialposition. The disclosure requirements are effective for annual reporting periods beginning on or after January 1,2013 with retrospective application required. The adoption of this guidance did not have a material impact on theCompany’s financial statement disclosures since the financial instruments and derivative instruments to which itapplies are not significant.
F-15

In February 2013, the FASB amended its presentation guidance on comprehensive income to improve thereporting of reclassifications out of accumulated other comprehensive income (“AOCI”). The new accountingguidance requires entities to provide information about the amounts reclassified out of AOCI by component. Inaddition, entities are required to present, either on the face of the financial statements or in the notes, significantamounts reclassified out of AOCI by the respective line items of net income, but only if the amount reclassifiedis required to be reclassified in its entirety in the same reporting period. For amounts that are not required to bereclassified in their entirety to net income, entities are required to cross-reference to other disclosures thatprovide additional details about those amounts. The amended guidance is effective prospectively for reportingperiods beginning after December 15, 2012. The adoption of this guidance did not have a material impact on theCompany’s results of operations, financial position or cash flows.
In February 2013, the FASB issued an accounting update, which provides guidance for the recognition,measurement and disclosure of obligations resulting from joint and several liability arrangements for which thetotal amount of the obligation within the scope of the guidance is fixed at the reporting date. The guidancerequires an entity to measure such obligations as the sum of the amount that the reporting entity agreed to pay onthe basis of its arrangement among its co-obligors plus additional amounts the reporting entity expects to pay onbehalf of its co-obligors. The new guidance is effective for fiscal years beginning after December 15, 2013. Theadoption of this guidance is not expected to have a material impact on the Company’s results of operations,financial position or cash flows.
In March 2013, the FASB issued an accounting update that amended guidance on a parent’s accounting forthe cumulative translation adjustment upon derecognition of a subsidiary or group of assets within a foreignentity. This guidance requires that the parent release any related cumulative translation adjustment into netincome only if the sale or transfer results in the complete or substantially complete liquidation of the foreignentity in which the subsidiary or group of assets had resided. The guidance is effective for fiscal years beginningafter December 15, 2013. The adoption of this guidance is not expected to have a material impact on theCompany’s results of operations, financial position or cash flows.
In July 2013, the FASB issued an accounting update, which creates new guidance regarding the presentationof an unrecognized tax benefit when a net operating loss carryforward, a similar tax loss, or a tax creditcarryforward exists. Under certain circumstances, unrecognized tax benefits should be presented in the financialstatements as a reduction to a deferred tax asset for a net operating loss carryforward, a similar tax loss, or a taxcredit carryforward. The guidance is effective for fiscal years beginning after December 15, 2013 and earlyadoption is permitted. Since this guidance is a change in financial statement presentation only, its adoption is notexpected to have material impact on the Company’s result of operations, financial position or cash flows.
In April 10, 2014, the FASB issued an accounting update, which changes the criteria for reportingdiscontinued operations for all public and nonpublic entities. The guidance requires only disposals that representa strategic shift that has (or will have) a major effect on the entity’s results and operations would qualify asdiscontinued operations. The guidance also requires entities 1) to expand their disclosures about discontinuedoperations to include more information about assets, liabilities, income, and expenses and 2) to disclose the pre-tax income attributable to a disposal of “of an individually significant component of an entity that does notqualify for discontinued operations presentation in the financial statements.” The guidance is effective for fiscalyears beginning after December 15, 2014 and early adoption is prohibited. The adoption of this guidance is notexpected to have a material impact on the Company’s results of operations, financial position or cash flow.
3. BUSINESS ACQUISITION
On October 25, 2011, FCI acquired the majority of the operating assets and employees of BTL System, Inc.(“BTL”), a Korea mobile TV-related software and module company. The aggregate purchase price was US$700thousand in cash. Goodwill arising from the acquisition was US$160 thousand.
F-16

The following table summarizes the estimated fair values of the assets acquired assumed at the date ofacquisition based on third-party asset valuations:
US$
Property and equipment . . . . . . . . . . . . . . . . . . . . . . . . . . . . . . . . . 60Software . . . . . . . . . . . . . . . . . . . . . . . . . . . . . . . . . . . . . . . . . . . . . 480Goodwill . . . . . . . . . . . . . . . . . . . . . . . . . . . . . . . . . . . . . . . . . . . . . 160
Total assets acquired . . . . . . . . . . . . . . . . . . . . . . . . . . . . . . . . . . . . 700
Of the total assets acquired, US$480 thousand of software have a weighted-average useful life ofapproximately 4 years.
The Company is not materially impacted by the acquisition of BTL and therefore has not presented proforma results of operations. The operating results of BTL have been included in the Company’s operationsbeginning October 25, 2011. The amounts of net sales and net loss of BTL since the acquisition date was nil andUS$135 thousand for the year ended December 31, 2011.
4. CASH AND CASH EQUIVALENTSDecember 31
2012 2013
US$ US$
Cash and deposits in bank . . . . . . . . . . . . . . . . . . . . . . . . . . . 31,087 19,025Time deposits . . . . . . . . . . . . . . . . . . . . . . . . . . . . . . . . . . . . 123,647 142,695
154,734 161,720
5. SHORT-TERM INVESTMENTS
The Company classified certain short-term investments as trading securities in 2011, 2012 and 2013.Realized gains on sales of these trading securities were US$10 thousand, US$2 thousand and US$4 thousand forthe years ended December 31, 2011, 2012 and 2013, respectively. The amount of unrealized losses related totrading securities at year end were nil, US$118 thousand and nil for the years ended December 31, 2011, 2012and 2013, respectively. Structured notes matured in May 2013 and the Company recognized the gain of US$118thousand.
6. NOTES AND ACCOUNTS RECEIVABLEDecember 31
2012 2013
US$ US$
Notes receivable . . . . . . . . . . . . . . . . . . . . . . . . . . . . . . . . . . . . 807 251Trade accounts receivable . . . . . . . . . . . . . . . . . . . . . . . . . . . . . 39,531 33,296
40,338 33,547Allowance for doubtful accounts . . . . . . . . . . . . . . . . . . . . . . . (1,634) (1,275)Allowance for sales returns and discounts . . . . . . . . . . . . . . . . (1,919) (1,059)
36,785 31,213
F-17

The changes in the allowances are summarized as follows:
Year Ended December 31
2011 2012 2013
US$ US$ US$
Allowances for doubtful accountsBalance, beginning of year . . . . . . . . . . . . . . . . . . . . . . . . . 3,118 2,648 1,634Additions (reversals) charged to expense . . . . . . . . . . . . . (469) (663) (359)Write-offs . . . . . . . . . . . . . . . . . . . . . . . . . . . . . . . . . . . . . . (1) (351) —
Balance, end of year . . . . . . . . . . . . . . . . . . . . . . . . . . . . . . 2,648 1,634 1,275
Year Ended December 31
2011 2012 2013
US$ US$ US$
Allowances for sales returns and discountsBalance, beginning of year . . . . . . . . . . . . . . . . . . . . . . . . . 2,057 2,709 1,919Additions . . . . . . . . . . . . . . . . . . . . . . . . . . . . . . . . . . . . . . 3,982 297 1,320Write-offs . . . . . . . . . . . . . . . . . . . . . . . . . . . . . . . . . . . . . . (3,330) (1,087) (2,180)
Balance, end of year . . . . . . . . . . . . . . . . . . . . . . . . . . . . . . 2,709 1,919 1,059
7. INVENTORIES
The components of inventories are as follows:
December 31
2012 2013
US$ US$
Finished goods . . . . . . . . . . . . . . . . . . . . . . . . . . . . . . . . . . . . . . 7,181 9,117Work in process . . . . . . . . . . . . . . . . . . . . . . . . . . . . . . . . . . . . . 17,718 17,218Raw materials . . . . . . . . . . . . . . . . . . . . . . . . . . . . . . . . . . . . . . 7,244 7,331
32,143 33,666
The Company wrote down US$4,644 thousand, US$1,631 thousand and US$2,503 thousand in 2011, 2012and 2013, respectively, for estimated obsolete or unmarketable inventory.
8. LONG-TERM INVESTMENTS
As of December 31, 2012 and 2013, the Company held equity investments in several privately-heldcompanies with the carrying value as follows:
Percentageof
Ownership December 31
2012 2013 2012 2013
US$ US$
Cost method:Cashido Corp. (Cashido) . . . . . . . . . . . . . . . . . . . . . . . . . . . . . . . . . . 2.1% 2.1% 104 104Vastview Technology, Corp. (Vastview) . . . . . . . . . . . . . . . . . . . . . 3.9% 2.9% 74 29
178 133
F-18

In July 2001, the Company invested in the common stock of Cashido. At the time of our investment,Cashido manufactured flash memory storage devices. Cashido currently focuses on the manufacture of computeraccessories and ozone based sterilization devices.
In December 2006 and February 2007, the Company invested US$3,360 thousand in the common stock ofVastview. Vastview is a fabless semiconductor company that develops and markets driver ICs and other ICs forthe TFT-LCD industry. In September 2009, Vastview reduced 70% of its share capital and distributed US$808 thousand to the Company. In March and December 2010, the Company recognized an impairment loss ofUS$73 thousand and US$27 thousand, respectively, in its investment in Vastview. In April 2013, Vastviewreduced 33.33% of its share capital and distributed US$46 thousand to the Company.
The Company accounts for these investments using the cost method. These investments are evaluated forimpairment on an annual basis or as circumstances warrant. The Company believed there was no other thantemporary impairment for the years ended December 31, 2011, 2012 and 2013, respectively.
9. PROPERTIES AND EQUIPMENTDecember 31
2012 2013
US$ US$
Cost:Land . . . . . . . . . . . . . . . . . . . . . . . . . . . . . . . . . . . . . . . . . . 4,429 6,650Buildings . . . . . . . . . . . . . . . . . . . . . . . . . . . . . . . . . . . . . . 13,398 16,711Machinery and equipment . . . . . . . . . . . . . . . . . . . . . . . . . 10,362 12,038Furniture and fixtures . . . . . . . . . . . . . . . . . . . . . . . . . . . . 3,974 4,407Leasehold and buildings improvement . . . . . . . . . . . . . . . 3,320 3,753Software . . . . . . . . . . . . . . . . . . . . . . . . . . . . . . . . . . . . . . 21,122 25,939
Total . . . . . . . . . . . . . . . . . . . . . . . . . . . . . . . . . . . . . 56,605 69,498
Accumulated depreciation:Buildings . . . . . . . . . . . . . . . . . . . . . . . . . . . . . . . . . . . . . . 1,532 1,869Machinery and equipment . . . . . . . . . . . . . . . . . . . . . . . . . 7,725 9,083Furniture and fixtures . . . . . . . . . . . . . . . . . . . . . . . . . . . . 2,947 3,224Leasehold and buildings improvement . . . . . . . . . . . . . . . 2,692 2,988Software . . . . . . . . . . . . . . . . . . . . . . . . . . . . . . . . . . . . . . 18,377 22,160
33,273 39,324Prepayment and construction in progress . . . . . . . . . . . . . . . . . 54 21
23,386 30,195
In April 2006, the Company leased its land and buildings located in Taipei, Taiwan, to a third party under athree-year operating lease. Net carrying value of the leased land and building as of December 31, 2013 wasUS$603 thousand and US$180 thousand, respectively. The lessee renewed the three year operating lease with theCompany in March 2012. Annual rental income from the lease is about US$41 thousand each year.
F-19

10. GOODWILL AND ACQUIRED INTANGIBLE ASSETS
Intangible assets: The intangible assets acquired from the Company’s acquisition of FCI and Centronix in2007 are as follows:
December 31
2012 2013
US$ US$
CostAccumulatedImpairment
AccumulatedAmortization
NetCarryingAmount Cost
AccumulatedImpairment
AccumulatedAmortization
NetCarryingAmount
Core technology . . . . . . . . 15,809 (4,474) (11,335) — 15,809 (4,474) (11,335) —Customer relationship . . . 8,325 — (8,325) — 8,325 — (8,325) —Order backlog . . . . . . . . . . 1,243 — (1,243) — 1,243 — (1,243) —
Total . . . . . . . . . . . . . 25,377 (4,474) (20,903) — 25,377 (4,474) (20,903) —
No impairment losses were recognized in 2011, 2012 and 2013. Amortization expense of acquisition-relatedintangible assets was US$694 thousand, nil and nil thousand for the years ended December 31, 2011, 2012 and2013, respectively.
Goodwill: Goodwill is not amortized, but instead is reviewed and tested for impairment at least annuallyand whenever events or circumstances occur which indicate that goodwill might be impaired. Impairment ofgoodwill is tested at the Company’s reporting unit level by comparing the carrying amount, including goodwill,to the fair value. In performing the analysis, the Company uses the best information available, includingreasonable and supportable assumptions and projections. If the carrying amount of the reporting unit exceeds itsimplied fair value, goodwill is considered impaired and a second step is performed to measure the amount ofimpairment loss, if any. The Company performed its annual impairment test on November 30. The goodwill thatresulted from the Company’s acquisition of FCI and Centronix in 2007 was US$66,300 thousand. TheCompany’s fiscal 2011, 2012 and 2013 impairment test concluded there was no impairment. In October 2011, theCompany purchased BTL’s assets and assumed US$156 thousand of goodwill. Total goodwill was US$35,472thousand and US$35,474 thousand as of December 31, 2012 and 2013, respectively.
11. ACCRUED EXPENSES AND OTHER CURRENT LIABILITIESDecember 31
2012 2013
US$ US$
Wages and bonus . . . . . . . . . . . . . . . . . . . . . . . . . . . . . . . . . . . . 14,532 6,741Research and development payable . . . . . . . . . . . . . . . . . . . . . 3,417 3,012License fees and royalties . . . . . . . . . . . . . . . . . . . . . . . . . . . . . 2,045 2,637Professional fees . . . . . . . . . . . . . . . . . . . . . . . . . . . . . . . . . . . . 1,663 1,765Others . . . . . . . . . . . . . . . . . . . . . . . . . . . . . . . . . . . . . . . . . . . . 3,178 3,455
24,835 17,610
12. PENSION PLAN
SMI Taiwan, the Company’s largest operating company is a Taiwan registered company and subject to Taiwan’sLabor Pension Act (the “Act”), which became effective on July 1, 2005, and the pension mechanism under theAct is deemed a defined contribution plan. The employees who were subject to the Labor Standards Law prior toJuly 1, 2005 were allowed to choose to be subject to the pension mechanism under the Act or continue to besubject to the pension mechanism under the Labor Standards Law. For those employees who were subject to theLabor Standards Law prior to July 1, 2005 and still work for the same company after July 1, 2005 and have
F-20

chosen to be subject to the pension mechanism under the Act, their seniority as of July 1, 2005 were maintained.The Act prescribes that the rate of contribution by an employer to employees’ pension accounts per month willnot be less than 6% of each employee’s monthly salary. According to the Act, SMI Taiwan made monthlycontributions and recognized pension costs of US$607 thousand, US$716 thousand and US$788 thousand for theyears ended December 31, 2011, 2012 and 2013, respectively.
The Company provides a defined benefit plan to the employees of SMI Taiwan under the Labor StandardsLaw that offers benefits based on an employee’s length of service and average monthly salary for the six-monthperiod prior to retirement. The Company contributes an amount equal to 2% of salaries paid each month to apension fund (the “Fund”), which is administered by the Labor Pension Fund Supervisory Committee establishedby the government (the “Committee”) and deposited in the Committee’s name in the Bank of Taiwan. Thegovernment is responsible for the administration of all the defined benefit plans for the companies in Taiwanunder the Labor Standards Law. The government also sets investment policies and strategies, determinesinvestment allocation and selects investment managers. As of December 31, 2012 and 2013, the asset allocationwas primarily in cash, equity securities and debt securities. Furthermore, under the Labor Standards Law, the rateof return on assets shall not be less than the average interest rate on a two-year time deposit published by thelocal banks. The government is responsible for any shortfall in the event that the rate of return is less than therequired rate of return. However, information on how investment allocation decisions are made, inputs andvaluation techniques used to measure the fair value of plan assets, the effect of fair value measurements usingsignificant unobservable inputs on changes in plan assets for the period and significant concentrations of riskwithin plan assets is not fully made available to the Company by the government. Therefore, the Company isunable to provide the required fair value disclosures related to pension plan assets. Future contributions will bebased on 2% of the employee salaries at that time. The Company estimates its contribution for the year endingDecember 31, 2014 to be US$59 thousand which was determined based on 2% of estimated salaries in 2014.
Starting in 2010, the Company provides a defined benefit pension plan to the Korean employees of FCI, theCompany’s second largest operating company with at least one year of service. FCI’s overall investment strategyis to avoid a negative return on plan assets.
For employees under defined contribution pension plans, pension costs are recorded based on the actualcontributions made to employees’ individual pension accounts. For employees under defined benefit pensionplans, pension costs are recorded based on actuarial calculations. Determining the cost associated with suchbenefits is dependent on various actuarial assumptions, including discount rate, expected return on plan assets,compensation increase, employee mortality and turnover rates. The Company reviewed its actuarial assumptionsat the measurement date on December 31 every year. The effect of modifications to assumptions is recorded inaccumulated other comprehensive loss and amortized to net periodic cost over future periods using the corridormethod. The company believes that assumptions utilized in recording its obligations under its plans arereasonable based on its experience and market conditions. Independent actuaries perform the requiredcalculations to determine expense in accordance with U.S. GAAP. Actual results may differ from the actuarialassumptions and are generally accumulated and amortized into earnings over future periods. The net periodiccosts are recognized as employees render services necessary to earn the benefits.
F-21

The changes in benefits obligation and plan assets and the reconciliation of funded status are as follows:
December 31
2012 2013
US$ US$
Change in benefit obligationProjected benefit obligation at beginning of year . . . . . . . . . 1,458 1,897Service cost . . . . . . . . . . . . . . . . . . . . . . . . . . . . . . . . . . . . . . 608 440Interest cost . . . . . . . . . . . . . . . . . . . . . . . . . . . . . . . . . . . . . . 77 58Actuarial loss . . . . . . . . . . . . . . . . . . . . . . . . . . . . . . . . . . . . . (187) (202)Benefits paid . . . . . . . . . . . . . . . . . . . . . . . . . . . . . . . . . . . . . (59) (95)
Projected benefit obligation at end of year . . . . . . . . . . . . . . 1,897 2,098
Change in plan assetsFair value of plan assets at beginning of year . . . . . . . . . . . . 1,376 1,925Actual return on plan assets . . . . . . . . . . . . . . . . . . . . . . . . . 43 43Employer contributions . . . . . . . . . . . . . . . . . . . . . . . . . . . . . 546 433Benefits paid . . . . . . . . . . . . . . . . . . . . . . . . . . . . . . . . . . . . . (40) (82)
Fair value of plan assets at end of year . . . . . . . . . . . . . . . . . 1,925 2,319
Reconciliation of funded statusFunded status recognized as an other asset . . . . . . . . . . . . . . 28 221
Net gain . . . . . . . . . . . . . . . . . . . . . . . . . . . . . . . . . . . . . . . . . . . . . 257 460Transition obligation . . . . . . . . . . . . . . . . . . . . . . . . . . . . . . . . . . . 1 1
Total recognized in accumulated other comprehensiveincome . . . . . . . . . . . . . . . . . . . . . . . . . . . . . . . . . . . . . . . . . . . . 258 461
Accumulated benefit obligation . . . . . . . . . . . . . . . . . . . . . . . . . . 1,332 1,369
The components of net periodic benefit cost are as follows:
Year Ended December 31
2011 2012 2013
US$ US$ US$
Service cost . . . . . . . . . . . . . . . . . . . . . . . . . . . . . . . . . . . . . . . . . . . . 399 608 440Interest cost . . . . . . . . . . . . . . . . . . . . . . . . . . . . . . . . . . . . . . . . . . . . 40 77 58Projected return on plan assets . . . . . . . . . . . . . . . . . . . . . . . . . . . . . . (30) (43) (47)Amortization of unrecognized net transition obligation and
unrecognized net actuarial gain . . . . . . . . . . . . . . . . . . . . . . . . . . . 1 — (3)
Net periodic benefit cost . . . . . . . . . . . . . . . . . . . . . . . . . . . . . . . . . . 410 642 448
Other changes in plan assets and benefit obligation recognized in other comprehensive loss:
2012 2013
US$ US$
Recognize the decrease in net gain . . . . . . . . . . . . . . . . . . . . . . . . . . . 336 203Amortization of net gain . . . . . . . . . . . . . . . . . . . . . . . . . . . . . . . . . . . 1 —Amortization of net transition obligation . . . . . . . . . . . . . . . . . . . . . . — —
Total recognized in accumulated other comprehensive loss . . . 337 203
F-22

Expected benefit payments:
US$
2014 . . . . . . . . . . . . . . . . . . . . . . . . . . . . . . . . . . . . . . . . . . . . . . . . . 1282015 . . . . . . . . . . . . . . . . . . . . . . . . . . . . . . . . . . . . . . . . . . . . . . . . . 2482016 . . . . . . . . . . . . . . . . . . . . . . . . . . . . . . . . . . . . . . . . . . . . . . . . . 1152017 . . . . . . . . . . . . . . . . . . . . . . . . . . . . . . . . . . . . . . . . . . . . . . . . . 1472018 . . . . . . . . . . . . . . . . . . . . . . . . . . . . . . . . . . . . . . . . . . . . . . . . . 2262019 and thereafter . . . . . . . . . . . . . . . . . . . . . . . . . . . . . . . . . . . . . 788
The actuarial assumptions to determine the benefit obligations were as follows:
2011 2012 2013
Taiwan Korea Taiwan Korea Taiwan Korea
Weighted-average assumptions used to determine benefitobligations:
Discount rate . . . . . . . . . . . . . . . . . . . . . . . . . . . . . . . . . . . . 1.75% 5.40% 1.63% 4.00% 1.88% 5.20%Rate of compensation increase . . . . . . . . . . . . . . . . . . . . . . 4.25% 7.00% 4.25% 3.00% 4.25% 2.60%
Weighted-average assumptions used to determine net projectedbenefit cost:
Discount rate . . . . . . . . . . . . . . . . . . . . . . . . . . . . . . . . . . . . 1.75% 5.40% 1.63% 4.00% 1.88% 5.20%Expected long-term return on plan assets . . . . . . . . . . . . . . 2.00% 4.30% 1.88% 3.10% 2.00% 3.00%Rate of compensation increase . . . . . . . . . . . . . . . . . . . . . . 4.25% 7.00% 4.25% 3.00% 4.25% 2.60%
FCI’s pension plan assets at December 31, 2012 and 2013 were invested in guaranteed interest contractsinsurance and fixed deposit, which are principal and interest guaranteed products and its fair value level islevel 2. The assets out of which the obligations have to be settled, measured at their market value by discountingfuture cash flow with discount rate. The discount rate was determined based on the average future life of theplan’s participants and the market yields on the high quality Korean Corporate Bonds (AA-). Therefore, FCI hasno concentration of risk in its plan assets.
The fair values of FCI’s pension plan assets at December 31, 2012 and 2013 are as follows:
December 31
2012 2013
US$ US$
Guaranteed interest contractKyobo Life Insurance Co. Ltd. . . . . . . . . . . . . . . . . . . . . . . . 504 534
Fixed depositIndustrial Bank of Korea . . . . . . . . . . . . . . . . . . . . . . . . . . . . 537 855
1,041 1,389
13. INCOME TAXES
The components of income tax expense are as follows:
Year Ended December 31
2011 2012 2013
US$ US$ US$
Current . . . . . . . . . . . . . . . . . . . . . . . . . . . . . . . . . . . . . . . . . . 3,237 5,534 8,591Deferred . . . . . . . . . . . . . . . . . . . . . . . . . . . . . . . . . . . . . . . . . 2,510 1,582 1,181
Income tax expense . . . . . . . . . . . . . . . . . . . . . . . . . . . . . . . . . . . . 5,747 7,116 9,772
F-23

The income (loss) before income taxes for domestic and foreign entities is as follows:
Year Ended December 31
2011 2012 2013
US$ US$ US$
Domestic . . . . . . . . . . . . . . . . . . . . . . . . . . . . . . . . . . . . . . . . . (8,730) (11,039) (8,080)Foreign entities
SMI Taiwan . . . . . . . . . . . . . . . . . . . . . . . . . . . . . . . . . . 42,382 51,997 50,628FCI . . . . . . . . . . . . . . . . . . . . . . . . . . . . . . . . . . . . . . . . . 12,572 12,645 (4,312)SMI USA . . . . . . . . . . . . . . . . . . . . . . . . . . . . . . . . . . . . 911 253 (1,235)Others . . . . . . . . . . . . . . . . . . . . . . . . . . . . . . . . . . . . . . . 81 478 147
47,216 54,334 37,148
Since the Company is based in the Cayman Islands, a tax-free country, domestic tax on pretax income iscalculated at the Cayman Islands statutory rate of zero for each year.
The Company and its subsidiaries file separate income tax returns. A reconciliation of income tax expenseon pretax income at statutory rate and income tax expense is shown below:
Year Ended December 31
2011 2012 2013
US$ US$ US$
Cayman statutory rate . . . . . . . . . . . . . . . . . . . . . . . . . . . . . . . . . . . . . . — — —Tax on pretax income at statutory rate . . . . . . . . . . . . . . . . . . . . . 7,859 8,142 6,788Tax-exempt income . . . . . . . . . . . . . . . . . . . . . . . . . . . . . . . . . . . . (3,477) (5,149) (4,325)Permanent differences . . . . . . . . . . . . . . . . . . . . . . . . . . . . . . . . . . 1,919 861 1,730Temporary differences . . . . . . . . . . . . . . . . . . . . . . . . . . . . . . . . . (622) (2,290) 1,732Alternative minimum tax . . . . . . . . . . . . . . . . . . . . . . . . . . . . . . . 2,804 4,340 2,203Income tax (10%) on undistributed earnings . . . . . . . . . . . . . . . . 2,277 2,631 3,396Net changes in income tax credit . . . . . . . . . . . . . . . . . . . . . . . . . 252 5,518 708Net changes in valuation allowance of deferred income tax
assets . . . . . . . . . . . . . . . . . . . . . . . . . . . . . . . . . . . . . . . . . . . . . (1,830) (3,879) (2,364)Net operating loss carryforwards . . . . . . . . . . . . . . . . . . . . . . . . . 341 604 (189)Liabilities related to unrealized tax benefits . . . . . . . . . . . . . . . . . (736) 832 (39)Adjustment of prior years’ taxes and others . . . . . . . . . . . . . . . . . (3,040) (4,494) 132
Income tax expense . . . . . . . . . . . . . . . . . . . . . . . . . . . . . . . . . . . . . . . . 5,747 7,116 9,772
Deferred income tax assets are as follows:
December 31
2012 2013
US$ US$
Current:Notes and accounts receivable . . . . . . . . . . . . . . . . . . . . . . 1,128 142Stock-based compensation . . . . . . . . . . . . . . . . . . . . . . . . . 473 679Allowance for sales return . . . . . . . . . . . . . . . . . . . . . . . . . 222 123Inventory reserve . . . . . . . . . . . . . . . . . . . . . . . . . . . . . . . . 686 544Foreign currency translation . . . . . . . . . . . . . . . . . . . . . . . . 1,063 312Investment tax credits . . . . . . . . . . . . . . . . . . . . . . . . . . . . . 1,126 —Others . . . . . . . . . . . . . . . . . . . . . . . . . . . . . . . . . . . . . . . . . 523 561Valuation allowance . . . . . . . . . . . . . . . . . . . . . . . . . . . . . . (2,852) (1,083)
2,369 1,278
F-24

December 31
2012 2013
US$ US$
Non-current:Inventory reserve . . . . . . . . . . . . . . . . . . . . . . . . . . . . . . 691 590Property and equipment . . . . . . . . . . . . . . . . . . . . . . . . . 753 651Investment tax credits . . . . . . . . . . . . . . . . . . . . . . . . . . . 5,862 7,011Net operating loss carryforwards . . . . . . . . . . . . . . . . . . 6,248 8,540Others . . . . . . . . . . . . . . . . . . . . . . . . . . . . . . . . . . . . . . . (401) (885)Valuation allowance . . . . . . . . . . . . . . . . . . . . . . . . . . . . (12,349) (15,193)
804 714
The valuation allowance shown in the table above relates to net operating loss carryforwards, tax credits andtemporary differences for which the Company believes that realization is uncertain. The valuation allowancedecreased by US$3,271 thousand and increased by US$1,075 thousand for the years ended December 31, 2012and 2013, respectively. The decrease in the valuation allowance in 2012 was primarily due to the utilization ofnet operating loss carryforward in 2012 which had been previously fully provided. The increase in valuationallowance in 2013 is primarily due to the Company being unable to generate sufficient taxable income in thefuture to utilize operating loss carryforwards and research and development credits before they expire. Inaddition, profits generated from certain products of SMI Taiwan are exempted from income tax for five yearsbeginning January 1, 2010 and January 1, 2012.
As of December 31, 2013, FCI had unused research and development tax credits of approximatelyUS$3,006 thousand which will expire in 2015 to 2018.
As of December 31, 2013, the Company’s United States federal net operating loss carryforwards for federalincome tax purposes were approximately US$5,431 thousand. If not utilized, the federal net operating losscarryforwards will expire in 2023.
As of December 31, 2013, the Company’s United States federal and state research and development taxcredit carryforwards for federal and state income tax purposes were approximately US$2,358 thousand andUS$1,647 thousand, respectively. If not utilized, the federal tax credit carryforwards will expire starting in 2023while the state tax credit carryforward has no expiration date.
Current United States federal and California state laws include substantial restrictions on the utilization ofnet operating losses and credits in the event of an “ownership change” of a corporation. Accordingly, theCompany’s ability to utilize net operating loss and tax credit carryforwards may be limited as a result of such“ownership change”. Such a limitation could result in the expiration of carryforwards before they are utilized.
Unrecognized Tax Benefit
A reconciliation of the beginning and ending balances of the total amounts of unrecognized tax benefits is asfollows:
Year Ended December 31
2012 2013
US $ US$
Balance, beginning of year . . . . . . . . . . . . . . . . . . . . . . . . . 2,657 3,520Increases in tax positions taken in current year . . . . . . . . . 917 2,947Decrease in tax position taken in prior year primarily
related to the resolution of tax audit . . . . . . . . . . . . . . . . (54) (652)
Balance, end of year . . . . . . . . . . . . . . . . . . . . . . . . . . . . . . 3,520 5,815
F-25

At December 31, 2013, the Company had US$5,815 thousand of unrecognized tax benefits that ifrecognized would affect the effective tax rate. For the years ended December 31, 2011, 2012 and 2013, the totalamount of interest expense and penalties related to uncertain tax positions recorded in the provision for incometax expense was approximately US$485 thousand, US$499 thousand and US$627 thousand, respectively. Thetotal amount of accrued interest and penalties recognized as of December 31, 2012 and 2013 was US$1,305thousand and US$1,412 thousand, respectively. The Company does not anticipate any material change in thetotal amount of unrecognized tax benefits to occur within the next twelve months.
The Company files income tax returns in United States and foreign jurisdictions. The following tablesummarizes the Company’s major jurisdictions and tax year that remain subject to examination by tax authoritiesas of December 31, 2013:
Tax Jurisdiction Tax Years
SMI Taiwan . . . . . . . . . . . . . . . . . . . . . . . . . . . . . . . . 2008 and onwardFCI . . . . . . . . . . . . . . . . . . . . . . . . . . . . . . . . . . . . . . . 2008 and onwardSMI USA . . . . . . . . . . . . . . . . . . . . . . . . . . . . . . . . . . 2007 onward
14. SHAREHOLDERS’ EQUITY
Appropriations from Earnings
Pursuant to the laws and regulations of the ROC and the respective Articles of Incorporation, SMI Taiwan,the Company’s largest subsidiary, must make appropriations from annual earnings to non-distributable reservewhich could affect the Company’s ability to pay cash or stock dividends, if any. SMI Taiwan subsidiary mayonly distribute dividends after it has made allowances as determined under ROC GAAP at each year-end for:
a. Payment of taxes;
b. Recovery of prior years’ deficits, if any;
c. 10% of remaining balance after deduction for a and b as legal reserve;
d. Special reserve based on relevant laws or regulations or 10% of remaining balance for deduction fromabove a to c as special reserve when necessary;
e. Cash or stock bonus to employees at 0.01% of any remaining earnings after the above reserves havebeen appropriated, based on a resolution of the board of directors. If bonus to employees is in the formof stock, the bonus may also be appropriated to employees of subsidiaries under the board of directors’approval;
Dividends
The Company declared cash dividends per ordinary share during the periods presented as follows:
2013
DividendsPer Share
(US$)
Amount(in US$
thousands)
First quarter . . . . . . . . . . . . . . . . . . . . . . . . . . . . . . . . . . . . . $0.0375 $ 5,056Second quarter . . . . . . . . . . . . . . . . . . . . . . . . . . . . . . . . . . $0.0375 5,042Third quarter . . . . . . . . . . . . . . . . . . . . . . . . . . . . . . . . . . . . $0.0375 4,932Fourth quarter . . . . . . . . . . . . . . . . . . . . . . . . . . . . . . . . . . . $0.0375 4,935
$19,965
F-26

No dividends were declared in our fiscal years ended 2011 or 2012. Future dividends, if any, on theCompany’s outstanding ADSs and ordinary shares will be declared by and subject to the discretion of theCompany’s board of directors. If the Company’s board of directors decides to distribute dividends, the form,frequency and amount of such dividends will depend upon the Company’s future operations and earnings, capitalrequirements and surplus, general financial condition, contractual restrictions and other factors our board ofdirectors may deem relevant.
Any future dividend the Company declares will be paid to the holders of ADSs, subject to the terms of thedeposit agreement, to the same extent as holders of the Company’s ordinary shares, to the extent permitted byapplicable laws and regulations, less the fees and expenses payable under the deposit agreement. Any dividendthe Company declares will be distributed by the depositary bank to the holders of our ADSs. Cash dividends onour ordinary shares, if any, will be paid in U.S. dollars.
Treasury Stock
On January 21, 2013, our Board of Directors approved share buyback plans to repurchase up to US$40million of the Company’s ADSs during the period from January 22, 2013 to January 21, 2014. The program doesnot obligate the Company to acquire any particular amount of ADS and the program may be modified orsuspended at any time at the Company’s discretion. All the treasury stock under this share repurchase programwas retired in July 2013.
In the year ended December 31, 2013, the Company repurchased 891 thousand of ADSs for a total cost ofUS$10.0 million. The weighted average purchase price per ADS repurchased was US$11.24.
15. EQUITY INCENTIVE PLAN
2004 Stock Option Plan and 2005 Equity Incentive Plan
In 2004, SMI Taiwan adopted a 2004 Employee Stock Option Plan (“the 2004 Plan”). The 2004 Planreserved 8,000 options with each option exercisable into for 1,000 shares of common stock. The options may begranted to qualified employees of the Company or any of its domestic or foreign subsidiaries and expire no laterthan six years from the date of grant. The options were granted at an exercise price not lower than the marketvalue of SMI Taiwan’s common stock at the date of the grant and vest over four years at certain percentages aftertwo years from the date of grant. As part of the share exchange between the Company and the shareholders ofSMI Taiwan effective on April 25, 2005, the Company agreed to assume the share options previously issued bySMI Taiwan. Subsequently on June 3, 2005, the Company amended the 2004 Plan such that options under the2004 Plan are granted at an exercise price not lower than the market value of the Company’s ordinary shares atthe date of the grant and vest over four years at certain percentages after one year from the date of grant.
On April 22, 2005, the Company adopted its 2005 Equity Incentive Plan (“the 2005 Plan”). The 2005 Planprovides for the grant of stock options, stock bonuses, restricted stock awards, restricted stock units and stockappreciation rights, which may be granted to employees (including officers), directors and consultants. The 2005Plan reserved 10,000 thousand shares of ordinary shares, inclusive of the number of assumed share options underthe 2004 Plan, for issuance upon the exercise of stock options.
In 2006, the Company amended the 2005 Plan to reserve an additional 15,000 thousand ordinary shares forissuance upon exercise of stock options and restricted stock units. In 2009, the Company amended the Plan toreserve an additional 15,000 thousand ordinary shares for issuance upon exercise of stock options and restrictedstock units.
Restricted stock units are converted into shares of the Company’s ordinary shares upon vesting on one-for-one basis. The vesting of restricted stock unit is subject to the employee’s continuing service to the Company.
F-27

The cost of these awards is determined using the fair value of the Company’s ordinary share on the date of thegrant, and compensation is recognized on a straight-line basis over the requisite service period. The Company’srestricted stock units are considered non-vested share awards as defined under ASC 718.
In April 2010, the Company’s Board of Directors and Compensation Committee approved an employeestock option exchange program that required certain employees to exchange eligible stock options for a lessernumber of new stock options that have approximately the same fair values as the options surrendered. Eligibleoptions included stock options granted between August 17, 2005 and July 31, 2008 that had an exercised priceabove US$1.85. In 2010, 4,369 thousand eligible stock options were exchanged for 3,785 thousand new stockoptions granted. The new stock options have an exercise price of US$1.47, which was equal to the market priceof the Company’s ordinary share on April 26, 2010, the date eligible stock options were surrendered and newstock options granted. The new stock options were issued under the 2005 Plan and are subject to its terms andconditions. The new stock options will continue to vest according to the original vesting schedule. Using theBlack-Scholes option pricing model, the Company determined that the fair value of the surrendered stock optionson a grant-by-grant basis was approximately equal, as of the date of the exchange, to the fair value of the newstock options granted, resulting in insignificant incremental share-based compensation.
Stock Option and Restricted Stock Units Activity
The following is a summary of, the 2004 Plan, and the 2005 Plan, which includes stock options andrestricted stock units:
Unit(in Thousands)
Available for grant at January 1, 2011 . . . . . . . . . . . . . . . 12,319Restricted stock units granted . . . . . . . . . . . . . . . . . . . . . (6,387)Option and restricted stock units forfeited . . . . . . . . . . . . 574
Available for grant at December 31, 2011 . . . . . . . . . . . . 6,506Restricted stock units granted . . . . . . . . . . . . . . . . . . . . . (1,461)Option and restricted stock units forfeited . . . . . . . . . . . . 291
Available for grant at December 31, 2012 . . . . . . . . . . . . 5,336Restricted stock units granted . . . . . . . . . . . . . . . . . . . . . (1,893)Option and restricted stock units forfeited . . . . . . . . . . . . 123
Available for grant at December 31, 2013 . . . . . . . . . . . . 3,566
Stock Options
A summary of the stock option activity and related information is as follows:
Number ofOptionsShares
(in Thousands)
WeightedAverageExercise
Price(US$)
WeightedAverage
RemainingContractual
Life(Years)
Outstanding at January 1, 2013 . . . . . . . . . . . . . . . 1,697 1.47Options forfeited . . . . . . . . . . . . . . . . . . . . . . . . . . — —Options exercised . . . . . . . . . . . . . . . . . . . . . . . . . (287) 1.47
Outstanding at December 31, 2013 . . . . . . . . 1,410 1.47 2.14
Options vested and expected to vest afterDecember 31, 2013 . . . . . . . . . . . . . . . . . . 1,410 1.47 2.14
Options exercisable at December 31,2013 . . . . . . . . . . . . . . . . . . . . . . . . . . . . . . 1,410 1.47 2.14
F-28

No stock options were granted in 2011, 2012 and 2013. The intrinsic value of options exercised, determinedas of the date of option exercise, was US$5,797, US$318 and US$594 thousand in 2011, 2012 and 2013,respectively.
As of December 31, 2013, total unrecognized compensation cost related to non-vested share-basedcompensation awards granted under the Company’s stock option plans, net of estimated forfeitures, was nil.
The aggregate intrinsic value represents the total intrinsic value (the difference between the Company’sclosing stock price on the last trading day of fiscal year 2013 and the exercise price, multiplied by the number ofin-the-money options) that would have been received by the option holders had all option holders exercised theiroptions on December 31, 2013. Intrinsic value will change in future periods based on the fair market value of theCompany’s stock and the number of shares outstanding.
The total cash received from employees as a result of employee stock option exercises were US$2,294,US$224 and US$422 thousand for the years ended December 31, 2011, 2012 and 2013, respectively.
The related tax effect for stock-based compensation benefit (expense) were US$215 thousand, US$631thousand, and US$343 thousand for 2011, 2012 and 2013, respectively. The related tax effect for stock-basedcompensation expense for option and restricted stock units exercised during 2011, 2012 and 2013 was US$756thousand, US$1,560 thousand and US$1,599 thousand, respectively. The related tax effect was determined usingthe applicable tax rates in jurisdictions to which this expense relates.
Determining Fair Value
The Company estimated the fair value of each option grant on the date of grant using the Black-Scholesoption pricing model. The Black-Scholes option valuation model was developed for estimating the fair value oftraded options that have no vesting restrictions and are fully transferable. In addition, the option valuation modelrequires the input of highly subjective assumptions, including the expected stock price volatility.
Risk-free interest rate is based on the U.S. Treasury yield curve in effect at the time of grant. Expectedvolatilities are determined based on historical volatilities of the stock prices of the Company. Expected liferepresents the periods that the Company’s share-based awards are expected to be outstanding and was determinedbased on historical experience regarding similar awards, giving consideration to the contractual term of the sharebased awards. The dividend yield is zero as the Company has never declared or paid dividends on the ordinaryshares or other securities by 2012.
Restricted Stock Units
A summary of the status of restricted stock units and changes during the year ended December 31, 2013 isas follows:
Number ofNon-vestedStock Units
(in Thousands)
WeightedAverageGrantDateFair
Value(US$)
WeightAverage
RemainingRecognition
Period(Years)
Non-vested at January 1, 2013 . . . . . . . . . . . . . . . 7,018 2.68Restricted stock units granted . . . . . . . . . . . . . . . . 1,893 3.13Restricted stock units vested . . . . . . . . . . . . . . . . . (4,867) 2.60Restricted stock units forfeited . . . . . . . . . . . . . . . (123) 2.60
Non-vested at December 31, 2013 . . . . . . . . . . . . 3,921 2.90 0.43
F-29

As of December 31, 2013, there was US$3,412 thousand of total unrecognized compensation cost related torestricted stock units granted under the 2005 Plan.
Stock-based Compensation Expense
The following table shows total stock-based compensation expense included in the Consolidated Statementsof Income for the years ended December 31, 2011, 2012 and 2013.
Year Ended December 31
2011 2012 2013
US $ US $ US$
Cost of sales . . . . . . . . . . . . . . . . . . . . . . . . . . . . . . . . . . . . . . . . 255 375 308Research and development . . . . . . . . . . . . . . . . . . . . . . . . . . . . . 5,049 7,055 6,351Sales and marketing . . . . . . . . . . . . . . . . . . . . . . . . . . . . . . . . . . 2,060 2,494 2,197General and administrative . . . . . . . . . . . . . . . . . . . . . . . . . . . . 1,514 1,878 1,406
8,878 11,802 10,262
16. COMMITMENTS AND CONTINGENCIES
FCI provided their employees with collateral for personal loans by depositing at a designated bankUS$937 thousand and US$946 thousand at December 31, 2012 and 2013, respectively. Such amounts wereaccounted for as restricted cash.
Operating Leases
The Company entered into various operating lease agreements for office space that expire on various datesthrough March 2017. The Company recognized rent expense for the years ended December 31, 2011, 2012 and2013 of US$1,465 thousand, US$1,609 thousand and US$1,763 thousand, respectively. The minimum operatinglease payments expected under these leases as of December 31, 2013 were US$2,080 thousand, US$1,734thousand, US$1,065 thousand, US$645 thousand, and US$582 thousand for the years ending December 31, 2014,2015, 2016, 2017 and 2018, respectively.
Litigation
The Company are subject to legal proceedings and claims, either asserted or unasserted, which arise in theordinary course of business. Although the outcome of such proceedings and claims cannot be predicted withcertainty, management does not believe that the outcome of any of these matters will have a material adverseeffect on our business, results of operations, financial position or cash flows. Any litigation, however, involvespotential risk and potentially significant litigation costs, and therefore there can be no assurance that anylitigation which is now pending or which may arise in the future would not have such a material adverse effect onour business, financial position, results of operations or cash flows.
All American Semiconductor, Inc. (“All American” or “AASI”) was a former distributor forthe Company. On April 25, 2007, All American filed for Chapter 11 bankruptcy protection. At the time of thefiling, the Company had US$256 thousand of unpaid accounts receivable from All American. On April 17, 2009,SMI USA and related entities were named as defendants in an adversary proceeding filed by the AASI CreditorLiquidating Trust (“CLT”) in the bankruptcy case pending in the U.S. Bankruptcy Court for the Southern Districtof Florida. The CLT was seeking the return of allegedly avoidable transfers in the amount of US$854thousand. The Company filed an answer and affirmative defenses. In March 2010, SMI USA settled with theCLT by paying the amount of US$220 thousand and on April 1, 2010, the Bankruptcy Court granted the motionto approve stipulations to compromise controversy. On August 23, 2010, the Court entered an order dismissingthe adversary proceeding. In June 2011, Liquidating Trustee for the CLT filed the AASI Creditor Liquidating
F-30

Trustee’s Seventeenth Omnibus Objection to Claims but in August 2011, withdrew it with respect to SMI USA’sproof of claim. According to the CLT’s letter dated September 9, 2011, it is currently finalizing its claims reviewprocess and preparing for distribution to beneficiaries who are holders of allowed claims and have rights to adistribution pursuant to the Plan. In January 2012 and 2014, the Company received the first distribution of US$21thousand and the second distribution of US$36 thousand, respectively.
In 2006, FCI joined with other technology companies and invested in the Pangyo Silicon Park ConstructionProject Cooperative (“Pangyo Cooperative”) in Korea. In July 2010, FCI, TLi Inc. (“TLI”), OCI Materials Co.,Ltd (“OCI”) and other companies withdrew from the Pangyo Cooperative and forfeited 10% of their totalinvestment. FCI believes its loss was caused by bad will actions taken by TLI. In December 2011, FCI and OCItogether filed a complaint against TLI at the Suwon District Court in Korea. In April 2013, the court dismissedthe plaintiffs’ complaints. The plaintiffs have decided not to appeal the court’s decision.
17. SEGMENT INFORMATION
The Company designs, develops and markets high performance, low-power semiconductor products for themultimedia consumer electronics market. The Company currently operates as one reportable segment. The chiefoperating decision maker is the Chief Executive Officer.
The Company groups its products into three categories, based on the markets and products in which its ICsmay be used. The following summarizes the Company’s revenue by product category:
Year Ended December 31
2011 2012 2013
US$ US$ US$
Mobile Storage . . . . . . . . . . . . . . . . . . . . . . . . . . . . . . . . . . 152,838 202,093 185,488Mobile Communications . . . . . . . . . . . . . . . . . . . . . . . . . . 56,629 67,564 31,022Other products . . . . . . . . . . . . . . . . . . . . . . . . . . . . . . . . . . 14,378 11,713 8,798
223,845 281,370 225,308
Revenue is attributed to a geographic area based on the bill-to location. The following summarizes theCompany’s revenue by geographic area:
Year Ended December 31
2011 2012 2013
US$ US$ US$
Taiwan . . . . . . . . . . . . . . . . . . . . . . . . . . . . . . . . . . . . . . . . 61,174 74,034 47,653United States . . . . . . . . . . . . . . . . . . . . . . . . . . . . . . . . . . . 25,535 20,230 22,528Japan . . . . . . . . . . . . . . . . . . . . . . . . . . . . . . . . . . . . . . . . . . 2,769 5,363 3,936Korea . . . . . . . . . . . . . . . . . . . . . . . . . . . . . . . . . . . . . . . . . 78,718 137,797 115,287China . . . . . . . . . . . . . . . . . . . . . . . . . . . . . . . . . . . . . . . . . 49,000 37,507 29,129Others . . . . . . . . . . . . . . . . . . . . . . . . . . . . . . . . . . . . . . . . . 6,649 6,439 6,775
223,845 281,370 225,308
Major customers representing at least 10% of net sales
Year Ended December 31
2011 2012 2013
US$ % US$ % US$ %
Samsung . . . . . . . . . . . . . . . . . . . . . . . . . . . . . . . . . . . . . . . . . . . . . . . . . 61,370 28 98,368 35 36,037 16SK Hynix . . . . . . . . . . . . . . . . . . . . . . . . . . . . . . . . . . . . . . . . . . . . . . . . * * * * 67,977 30
* Less than 10%
F-31

Long-lived assets (property and equipment, net) by geographic area were as follows:
Year Ended December 31
2011 2012 2013
US$ US$ US$
Taiwan . . . . . . . . . . . . . . . . . . . . . . . . . . . . . . . . . . . . . . . . . . . 17,317 16,799 24,066United States . . . . . . . . . . . . . . . . . . . . . . . . . . . . . . . . . . . . . . 91 58 54Korea . . . . . . . . . . . . . . . . . . . . . . . . . . . . . . . . . . . . . . . . . . . . 2,980 2,226 1,773China . . . . . . . . . . . . . . . . . . . . . . . . . . . . . . . . . . . . . . . . . . . . 4,340 4,303 4,302
24,728 23,386 30,195
18. FAIR VALUE MEASUREMENT
The following section describes the valuation methodologies the Company uses to measure assets andliabilities at fair value.
The Company uses quoted prices in active markets for identical assets to determine fair value whereapplicable. This pricing methodology applies to Level 1 investments such as bond funds. The fair value of thestructure note investments was estimated by the Company using a discounted cash flow model that incorporatestransaction details such as contractual terms, maturity and timing and amount of future cash flows, references tothe observable market data such as the risk free rate, discount rate and yield rate related to the underlying bondsecurities as well as unobservable inputs related to liquidity, default likelihood, and credit valuation adjustments.Due to the unobservable inputs are insignificant to the measurement in its entirety, such investments wereclassified as Level 2 instruments as of December 31, 2012. For the years ended December 31, 2012 and 2013,none of the Company’s assets measured on a recurring basis was determined by using significant unobservableinputs.
The following table presents our assets measured at fair value on a recurring basis as of December 31, 2012and 2013:
December 31, 2012
Level 1 Level 2 Level 3 Total
US$ US$ US$ US$
AssetsShort-term investments — designated at the fair value
structured note . . . . . . . . . . . . . . . . . . . . . . . . . . . . . . . . — 14,882 — 14,882
December 31, 2013
Level 1 Level 2 Level 3 Total
US$ US$ US$ US$
AssetsShort-term investments — trading bond funds . . . . . . . . . . . 742 — — 742
Those assets required to be measured at fair value on a nonrecurring basis and the associated losses were nilduring the years ended December 31, 2011, 2012 and 2013 and please refer to Note 2, “Summary of SignificantAccounting Policy” and Note 10, “Goodwill and Acquired Intangible Assets” for the significant assumption wereused.
The Company reviews the carrying values of financial assets carried at cost when impairment indicators arepresent. The fair values of assets without quoted market price are determined based on management judgmentwith the best available information. The impairment charge was determined based on the difference between theCompany’s carrying value and the proportionate ownership of the investee’s net assets at year end.
F-32

Board of Directors
James ChowChairman of the BoardSilicon Motion Technology Corporation
Wallace C. KouPresident & Chief Executive OfficerSilicon Motion Technology Corporation
Steve ChenChairmanMercuries Bakery Co., Ltd.
Tsung-Ming ChungChairmanDynapack International Technology Corp.
Kenneth Kuan-Ming LinChairmanPremier Capital Management Corp.
Lien-Chun LiuResearch FellowTaiwan Research Institute
Yung-Chien WangVice PresidentProfessional Trust Co., Ltd.
Executive Officers
Wallace C. KouPresident & Chief Executive Officer
Riyadh LaiChief Financial Officer
Frank ChangVP of R&D, Mobile Storage
Ken ChenVP of Operations
Nelson DuannVP of Product Marketing, Mobile Storage
Sangwoo HanSenior VP and General Manager, Mobile Communications
John (Chun-O) Kim VP of Sales, Mobile Communications
Arthur YehVP of Sales, Mobile Storage
John (Jong Ryul) LeeVP of R&D, Mobile Communications
Kevin Yeh VP of R&D, Algorithm & Technology
Frank ShuVP of R&D, SSD System Technology and VCT
Jason ChiangVP of HR and Administration, and SpecialAssistant to CEO
Robert FanVP and General Manager, SMI U.S.
ADS ListingOur American Depositary Shares (ADSs) trade on the NASDAQ Global Select Market under the symbol "SIMO"
ADS DepositaryThe Bank of New York Mellon, New York, NY
Legal Counsel, Taipei, TaiwanK&L Gates, Taipei, Taiwan
Independent AuditorsDeloitte & Touche, Taipei, Taiwan
Investor RelationsFor more information about Silicon Motion, please visit our website at www.siliconmotion.com or e-mail us at [email protected]
Directors and Executives

Silicon Motion Technology Corporationwww.siliconmotion.com