siltronic ag roadshow presentation - siltronic / perfect ... siltronic ag 2018 market overview &...
TRANSCRIPT
© Siltronic AG 2018
Siltronic AG
Roadshow Presentation
January, 2018
© Siltronic AG 2018
MARKET OVERVIEW &
CAPEX STRATEGY
……Capabilities, automation
and incremental invest to
keep stable market share
without providing excess
capacity to the market …..
Siltronic AG – Roadshow Presentation
January, 2018 3 of 40 © Siltronic AG 2018
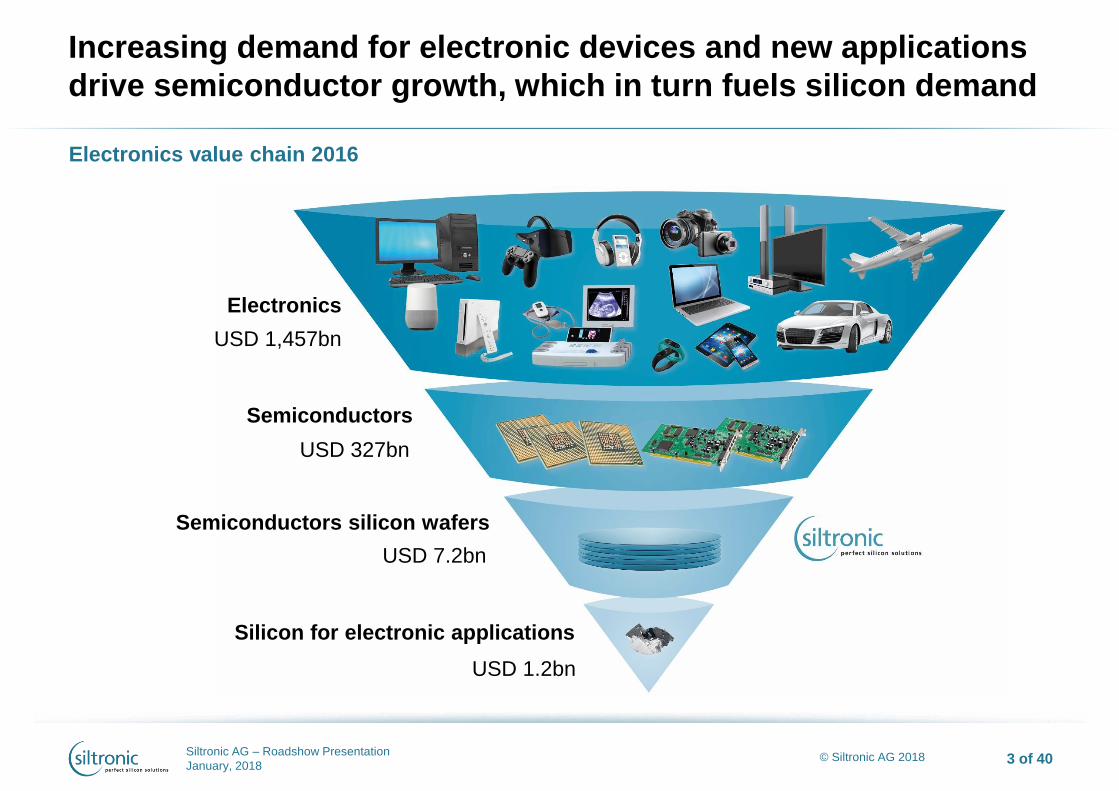
Increasing demand for electronic devices and new applications
drive semiconductor growth, which in turn fuels silicon demand
Electronics value chain 2016
Electronics
USD 1,457bn
Semiconductors
USD 327bn
Semiconductors silicon wafers
USD 7.2bn
Silicon for electronic applications
USD 1.2bn

Siltronic AG – Roadshow Presentation
January, 2018 4 of 40 © Siltronic AG 2018
10%
15%
31%
28%
16%
SK Siltron Siltronic Shin Etsu Sumco GlobalWafers
Siltronic is a strong wafer supplier with leading-edge technology
Sources: Companies’ revenue reports 2016, converted to USD million
Top 5 wafer producers serve more than 90% of market across all diameters
Comments
Siltronic with long-term
stable market share of
around 15%
Siltronic recognized as
technology leader in the
industry
Joint development
programs with most
300mm customers
Qualified at latest Design
Rules
Siltronic AG – Roadshow Presentation
January, 2018 5 of 40 © Siltronic AG 2018
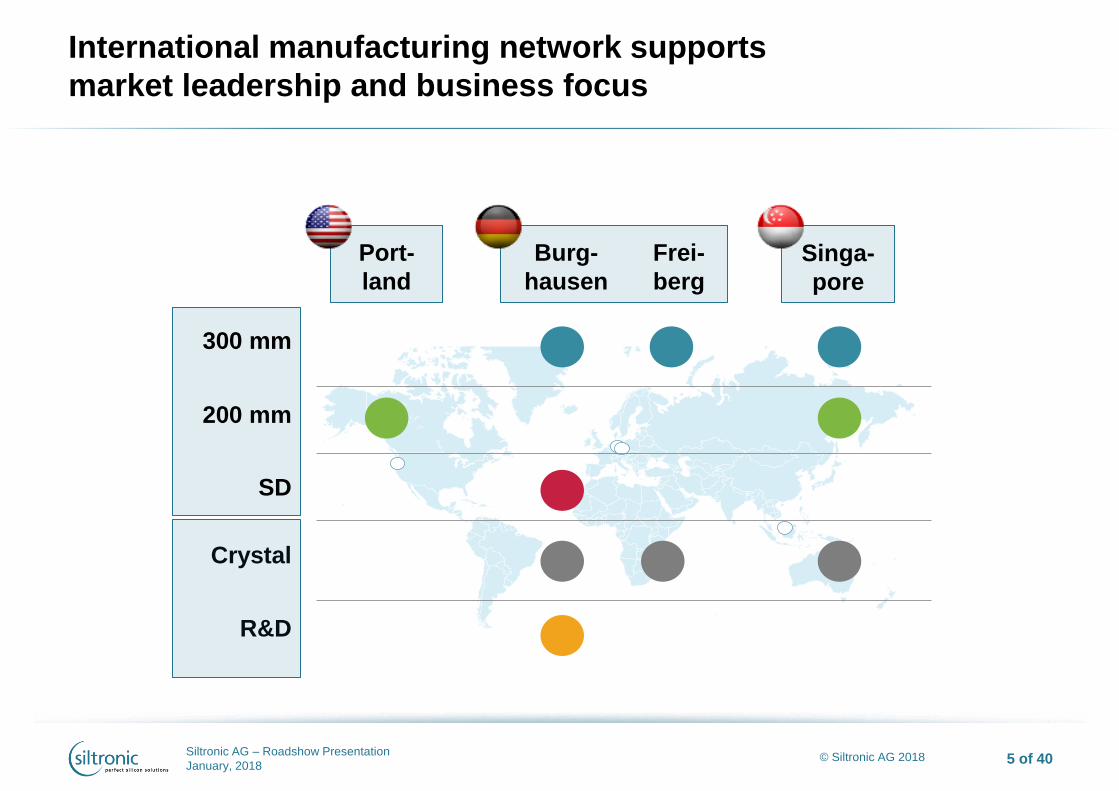
Port-
land
International manufacturing network supports
market leadership and business focus
5
300 mm
200 mm
SD
Crystal
R&D
Burg-
hausen
Frei-
berg
Singa-
pore
Siltronic AG – Roadshow Presentation
January, 2018 6 of 40 © Siltronic AG 2018
0
1
2
3
4
5
6
2010 2011 2012 2013 2014 2015 2016 2017
300 mm 200 mm SD
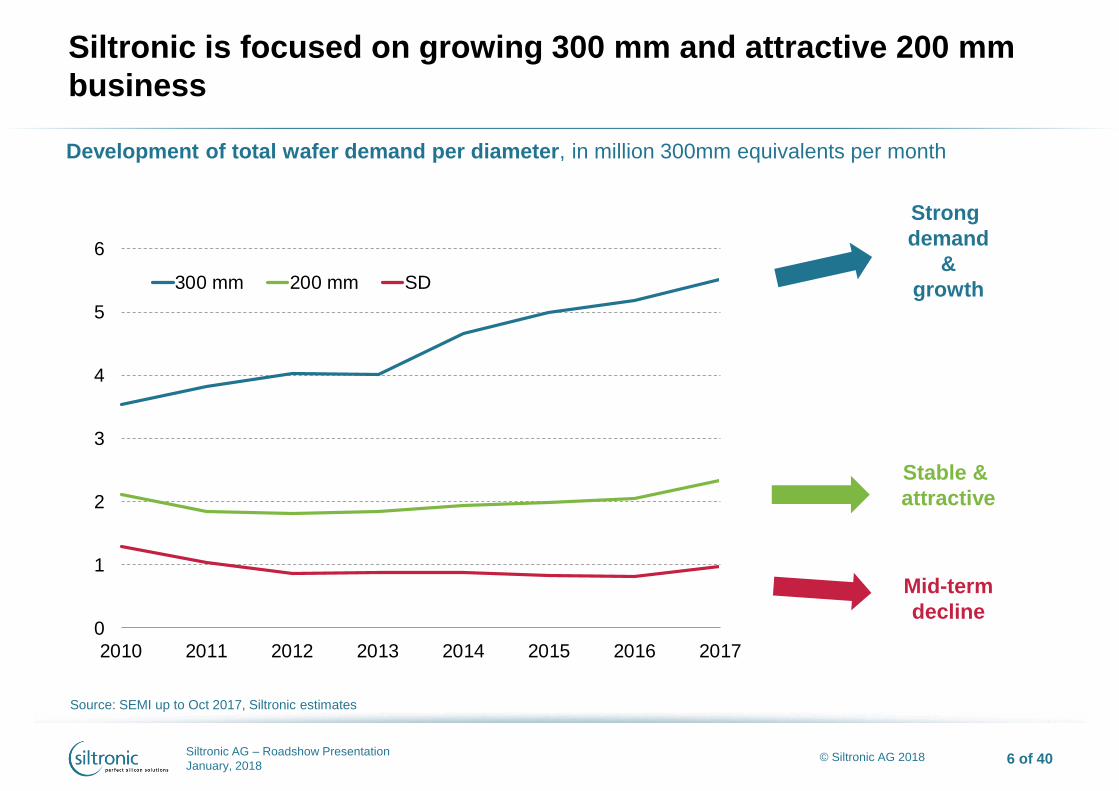
Siltronic is focused on growing 300 mm and attractive 200 mm
business
Source: SEMI up to Oct 2017, Siltronic estimates
Stable &
attractive
Mid-term
decline
Strong
demand
&
growth
Development of total wafer demand per diameter, in million 300mm equivalents per month
Siltronic AG – Roadshow Presentation
January, 2018 7 of 40 © Siltronic AG 2018
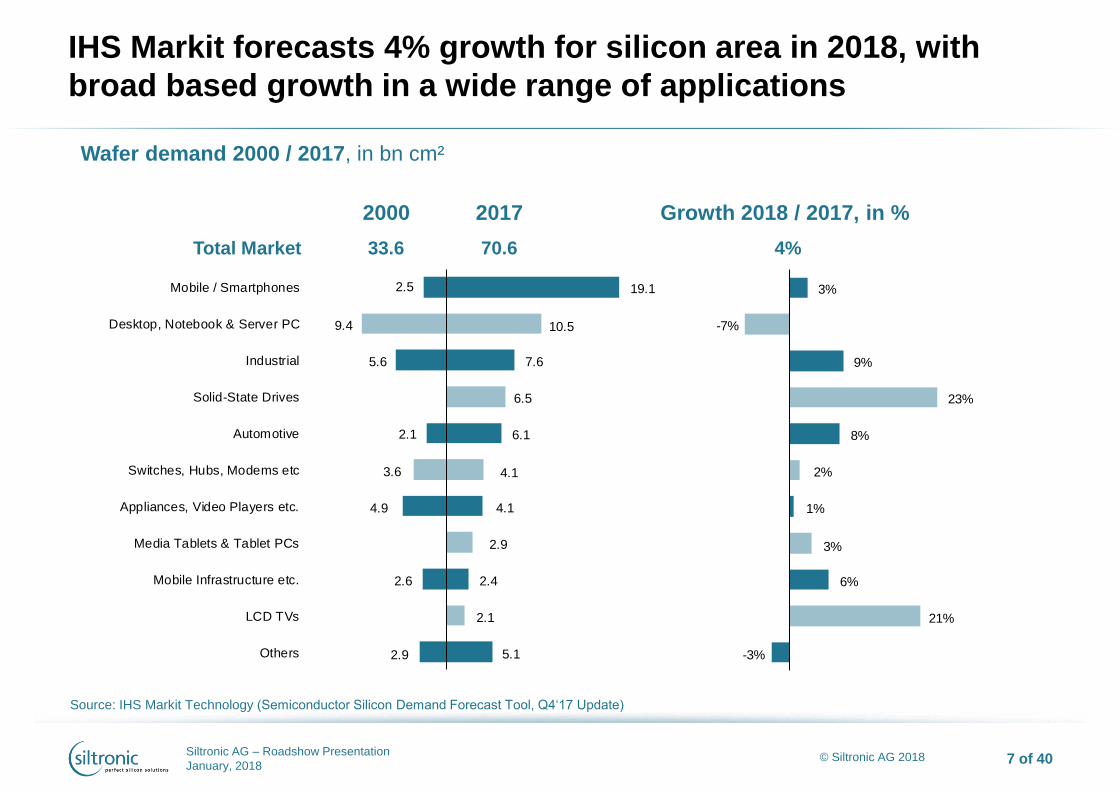
IHS Markit forecasts 4% growth for silicon area in 2018, with
broad based growth in a wide range of applications
7
2000 2017 Growth 2018 / 2017, in %
Wafer demand 2000 / 2017, in bn cm²
Total Market 33.6 70.6 4%
Source: IHS Markit Technology (Semiconductor Silicon Demand Forecast Tool, Q4‘17 Update)
19.1
10.5
7.6
6.5
6.1
4.1
4.1
2.9
2.4
2.1
5.1
Mobile / Smartphones
Desktop, Notebook & Server PC
Industrial
Solid-State Drives
Automotive
Switches, Hubs, Modems etc
Appliances, Video Players etc.
Media Tablets & Tablet PCs
Mobile Infrastructure etc.
LCD TVs
Others
2.5
9.4
5.6
4.9
3.6
2.1
2.6
3%
-7%
9%
23%
8%
2%
1%
3%
6%
21%
-3%2.9

Siltronic AG – Roadshow Presentation
January, 2018 8 of 40 © Siltronic AG 2018
~5.5 mn. Wfr./month
Wafer suppliers not able to support 300mm wafer demand
during 2018 and 2019
Customers bringing new FABs online –
total demand increase 2017-2020:
~1.900 kw/m
Capacity increase of wafer suppliers limited
by equipment supply potentials / lead times
Wafer suppliers seem to act rationally by
only adding capacities in incremental steps
Industry probably constrained by wafer
supply until 2020
Sources: SEMI, IHS, Siltronic estimates
300mm demand vs. supply capacity, in kw/month
Demand (SEMI / IHS)
Capacity (Estimation)

Siltronic AG – Roadshow Presentation
January, 2018 9 of 40 © Siltronic AG 2018
Semiconductor revenue vs. silicon revenue and silicon area
Source: WSTS and SEMI up to Q3 2017
0%
100%
200%
300%Silicon area
Semic. revenue
Silicon revenue
Semiconductor vs silicion revenue and silicon area, as % of Q1 1996
Siltronic AG – Roadshow Presentation
January, 2018 10 of 40 © Siltronic AG 2018
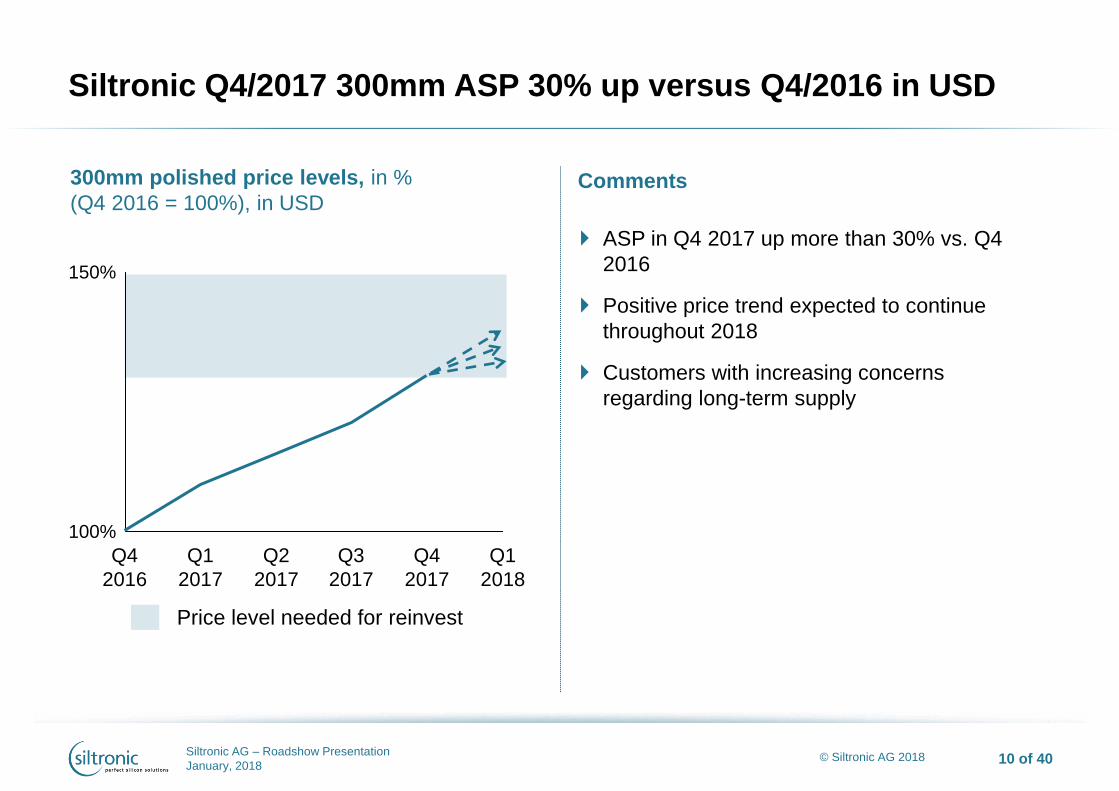
Price level needed for reinvest
Siltronic Q4/2017 300mm ASP 30% up versus Q4/2016 in USD
Comments
300mm polished price levels, in %
(Q4 2016 = 100%), in USD
100%
150%
Q4
2016
Q3
2017
Q1
2017
Q2
2017
Q4
2017
Q1
2018
ASP in Q4 2017 up more than 30% vs. Q4
2016
Positive price trend expected to continue
throughout 2018
Customers with increasing concerns
regarding long-term supply

Siltronic AG – Roadshow Presentation
January, 2018 11 of 40 © Siltronic AG 2018
2017/18 only debottlenecking / OEE improvement possible
Decision taken to add ~70kWfr/month by mid-2019: around 15-18 months lead-time
Capacity extension supported by LTAs & customer prepayments
Keep 300mm market share of ~ 15%
Invest of EUR ~2m need per 1kWfr/month
Capable cleanroom space and facilities available
Siltronic will continuously invest to support the market growth and to keep stable market share and to
ensure long term prices stay on reinvest level
Siltronic will incrementally add 70kWfr/month by mid-2019
Siltronic AG – Roadshow Presentation
January, 2018 12 of 40 © Siltronic AG 2018
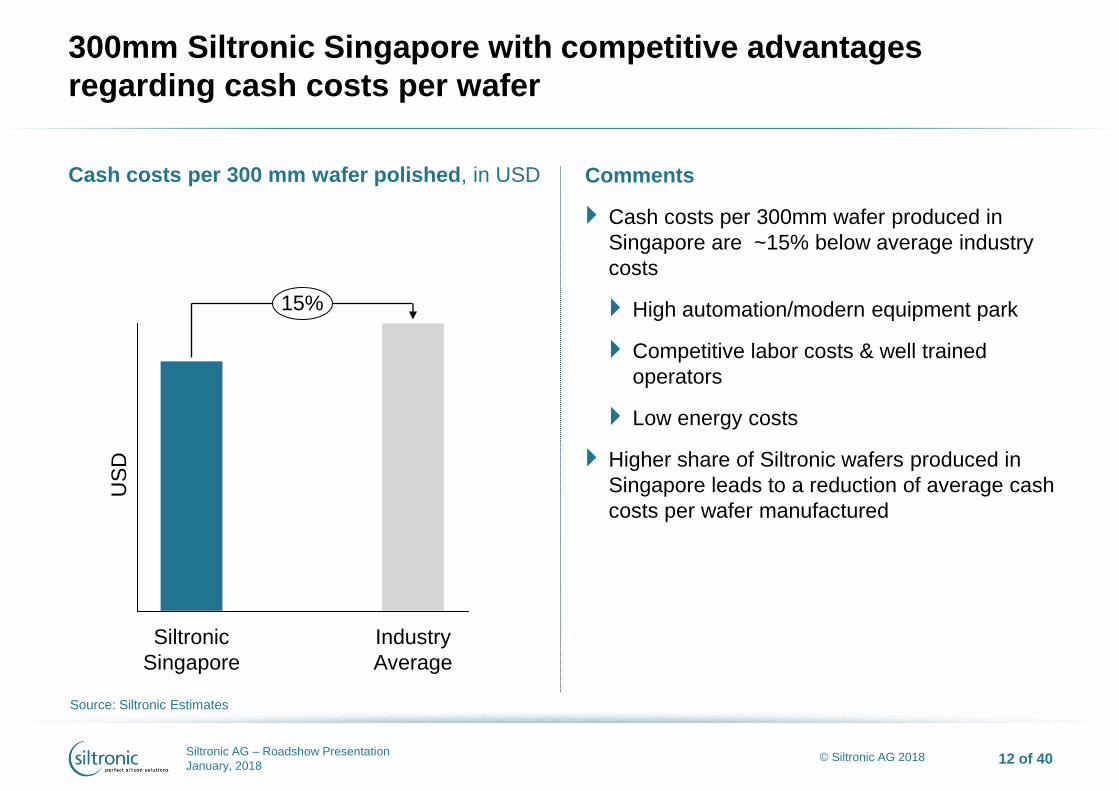
300mm Siltronic Singapore with competitive advantages
regarding cash costs per wafer
Source: Siltronic Estimates
Comments
Cash costs per 300mm wafer produced in
Singapore are ~15% below average industry
costs
High automation/modern equipment park
Competitive labor costs & well trained
operators
Low energy costs
Higher share of Siltronic wafers produced in
Singapore leads to a reduction of average cash
costs per wafer manufactured
Siltronic
Singapore
15%
Industry
Average
US
D
Cash costs per 300 mm wafer polished, in USD
Siltronic AG – Roadshow Presentation
January, 2018 13 of 40 © Siltronic AG 2018
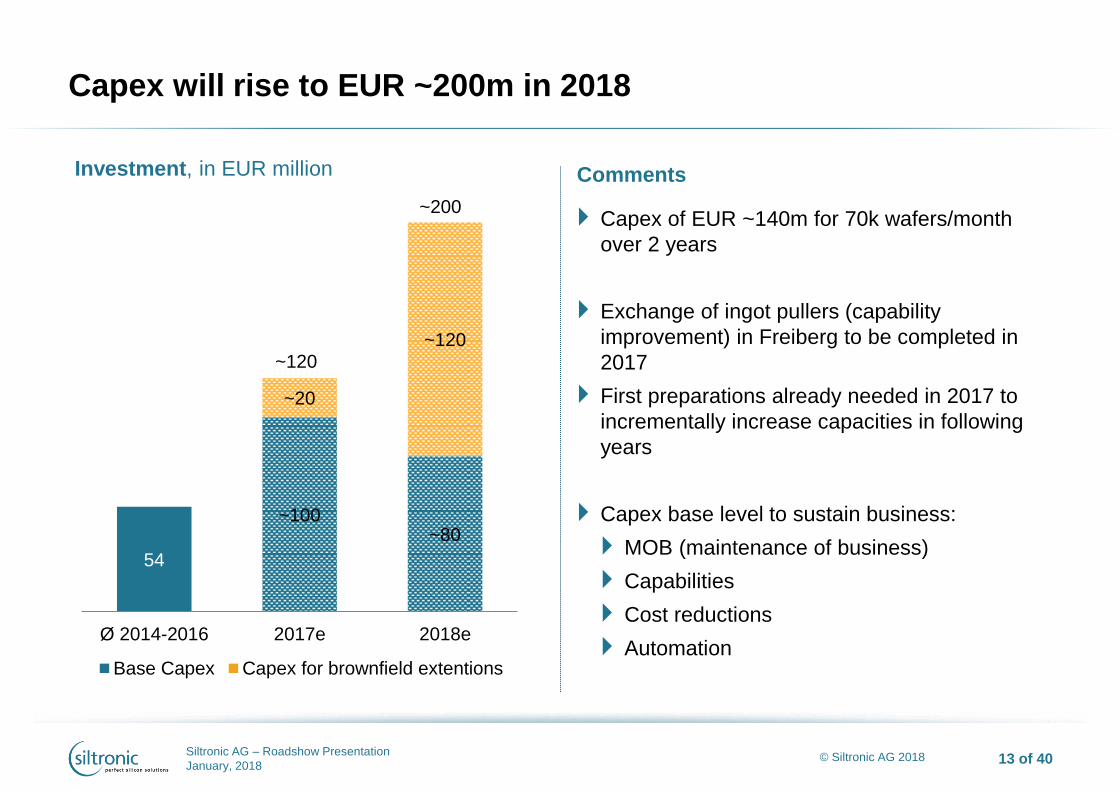
54
~100 ~80
~20
~120
Ø 2014-2016 2017e 2018e
Base Capex Capex for brownfield extentions
~120
Capex will rise to EUR ~200m in 2018
Comments
Capex of EUR ~140m for 70k wafers/month
over 2 years
Exchange of ingot pullers (capability
improvement) in Freiberg to be completed in
2017
First preparations already needed in 2017 to
incrementally increase capacities in following
years
Capex base level to sustain business:
MOB (maintenance of business)
Capabilities
Cost reductions
Automation
Investment, in EUR million
~200

© Siltronic AG 2018
SILTRONIC - AN INDUSTRY
TECHNOLOGY LEADER
……Technological
leadership - a constant race
for improvement…..
Siltronic AG – Roadshow Presentation
January, 2018 15 of 40 © Siltronic AG 2018
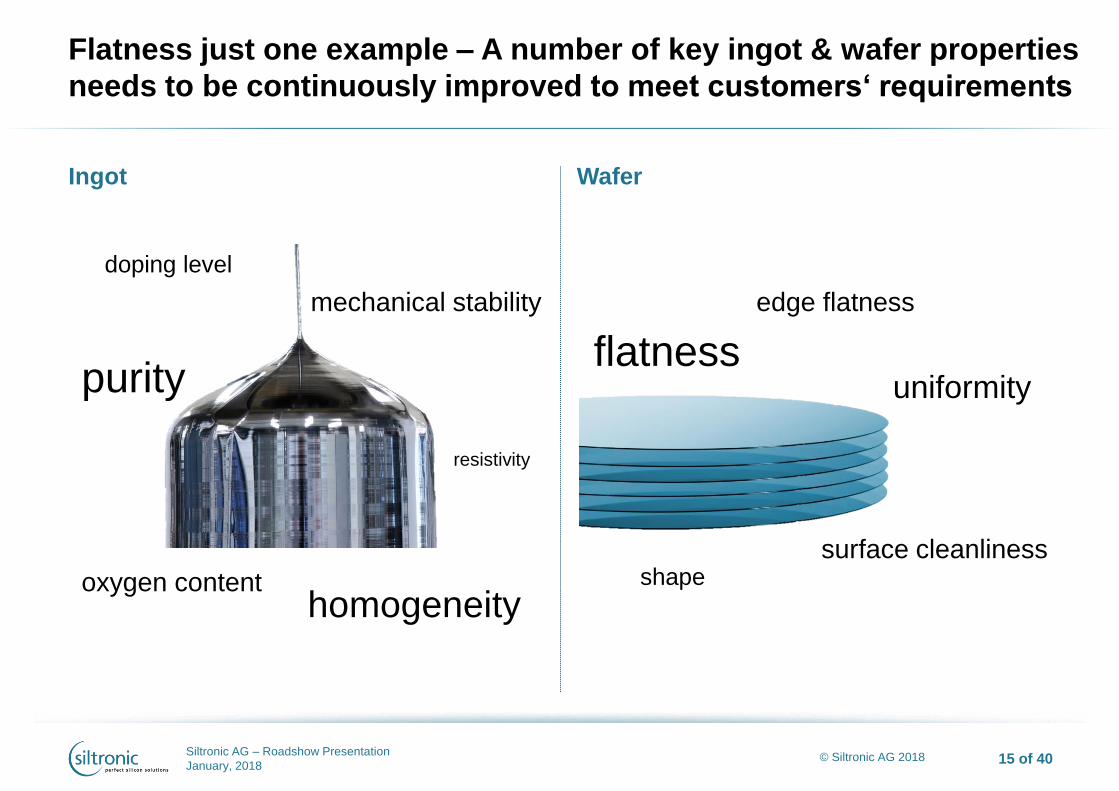
Ingot
Flatness just one example – A number of key ingot & wafer properties
needs to be continuously improved to meet customers‘ requirements
Wafer
oxygen content homogeneity
flatness
surface cleanliness
edge flatness
uniformity
resistivity
shape
mechanical stability
purity
doping level
Siltronic AG – Roadshow Presentation
January, 2018 16 of 40 © Siltronic AG 2018
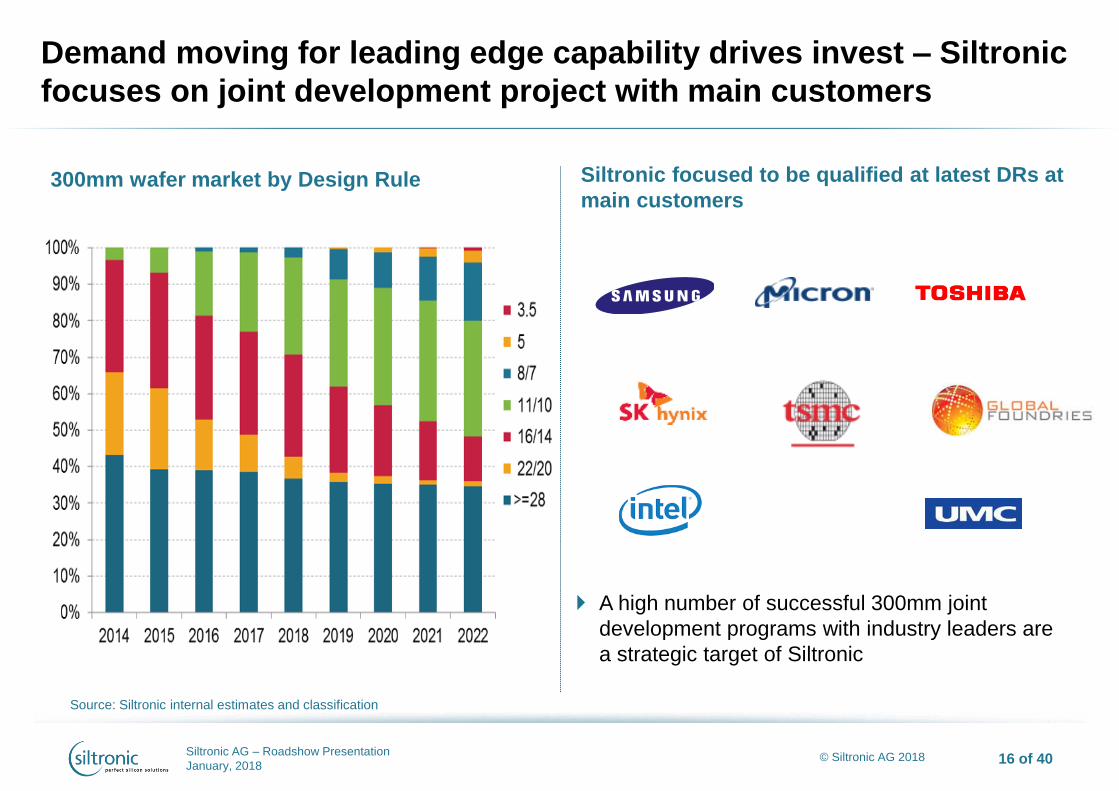
Demand moving for leading edge capability drives invest – Siltronic
focuses on joint development project with main customers
Siltronic focused to be qualified at latest DRs at
main customers
300mm wafer market by Design Rule
A high number of successful 300mm joint
development programs with industry leaders are
a strategic target of Siltronic
Source: Siltronic internal estimates and classification

Siltronic AG – Roadshow Presentation
January, 2018 17 of 40 © Siltronic AG 2018
Siltronic is a leader in wafer technology and quality
First supplier to ship 300mm wafers
Development of 8 nm design rule started in
2013 (commercialization 2017);
Concurrently optimizing on 50+ wafer
parameters of each design rule
>400 engineers worldwide
Approximately 1,700 patents issued and
pending (as of Dec. 31, 2016)
Single wafer traceability for 300mm
Standardized processes across sites enabling
“copy exactly” at product level
Quality awards from several top semiconductor
players
Technology leadership complemented with the highest level of quality

© Siltronic AG 2018
SILTRONIC PERFORMANCE
…well prepared to gain from
future growth…..

Siltronic AG – Roadshow Presentation
January, 2018 19 of 40 © Siltronic AG 2018
Long-term EBITDA margin trend clearly above industry average
Adjusted1 EBITDA margin, in % w/o hedging
1 figures 2012-2014 adjusted for consolidation effects resulting from acquisition of SSW and restructuring Source: Siltronic Guidance: EBITDA margin 2017 at least 27%
2017
≥29%
12%
2012 2016
16%
13%
2014
14%
2013 2015
13%
Comments
Siltronic targets to become one of
the two wafer suppliers with
highest EBITDA margin for the full
year 2017

Siltronic AG – Roadshow Presentation
January, 2018 20 of 40 © Siltronic AG 2018
~55
~45
~30
15-20e
2014 2015 2016 2017
Successful cost reduction programs continue
Cost savings, in EUR million1
Additional savings levers
Investing in automation in
Germany
Investing in new pullers to
improve yields and capabilities
Poly cost optimization ongoing
Further productivity increases
through various initiatives
1 Based on prior year cost basis to current year volumes and adjustments to certain current year costs to reflect prior year contractual and economic parameters (e.g.
prior year unit labor cost).

Siltronic AG – Roadshow Presentation
January, 2018 21 of 40 © Siltronic AG 2018
Gross margin improves steadily
Revenue vs. manufacturing costs, in €-cent/cm² and gross margin, in %
Gross margin
Revenue per cm²
Manufacturing costs per cm²
2823221917151519191713108
3
37
Q2 Q1
14
Q3 Q1
16
Q3 Q4 Q3 Q2 Q1
15
Q4 Q2 Q2 Q1
17
Q4 Q3
Siltronic AG – Roadshow Presentation
January, 2018 22 of 40 © Siltronic AG 2018
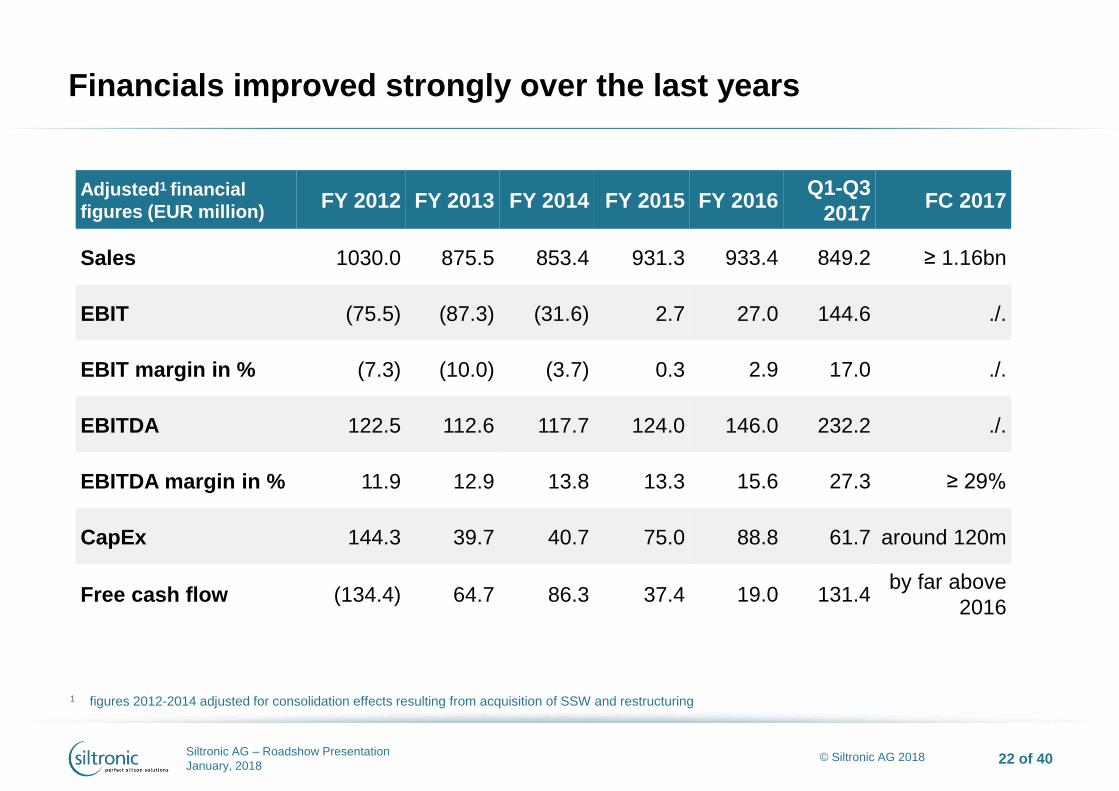
Financials improved strongly over the last years
1 figures 2012-2014 adjusted for consolidation effects resulting from acquisition of SSW and restructuring
Adjusted1 financial
figures (EUR million) FY 2012 FY 2013 FY 2014 FY 2015 FY 2016
Q1-Q3
2017 FC 2017
Sales 1030.0 875.5 853.4 931.3 933.4 849.2 ≥ 1.16bn
EBIT (75.5) (87.3) (31.6) 2.7 27.0 144.6 ./.
EBIT margin in % (7.3) (10.0) (3.7) 0.3 2.9 17.0 ./.
EBITDA 122.5 112.6 117.7 124.0 146.0 232.2 ./.
EBITDA margin in % 11.9 12.9 13.8 13.3 15.6 27.3 ≥ 29%
CapEx 144.3 39.7 40.7 75.0 88.8 61.7 around 120m
Free cash flow (134.4) 64.7 86.3 37.4 19.0 131.4 by far above
2016

© Siltronic AG 2018
STRATEGY AND OUTLOOK
……no change in our
proven strategy while
enjoying improving
returns…..
Siltronic AG – Roadshow Presentation
January, 2018 24 of 40 © Siltronic AG 2018
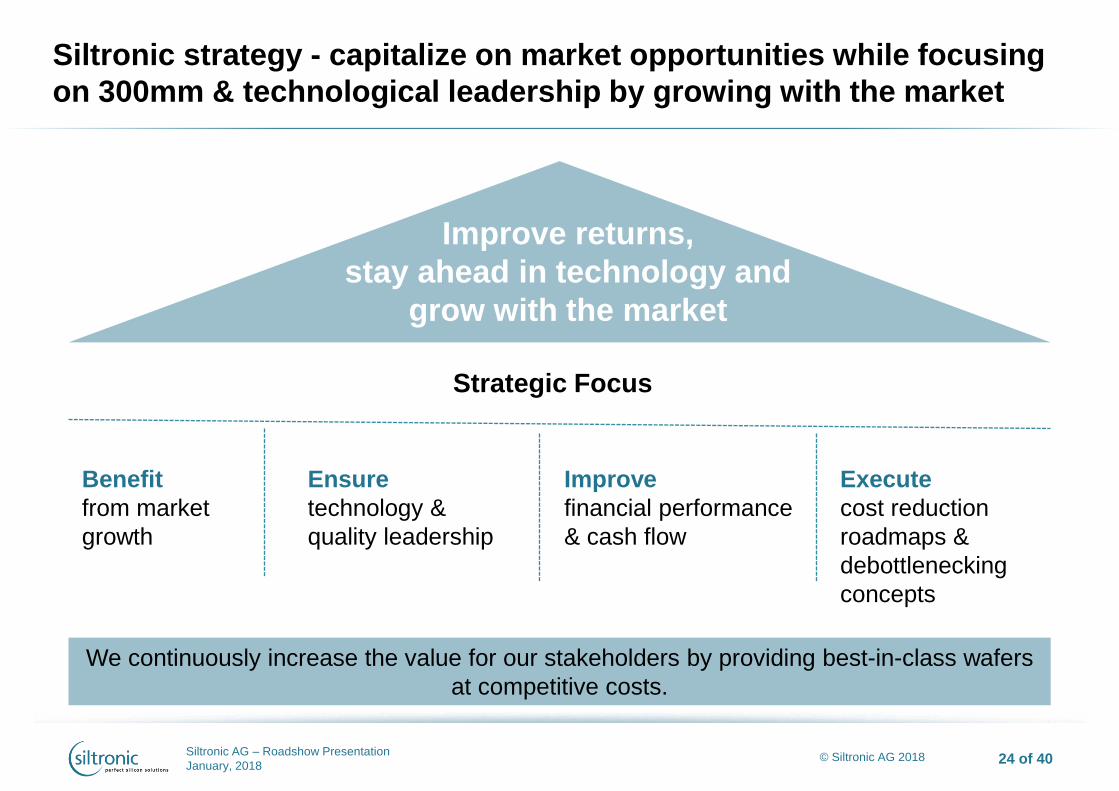
Siltronic strategy - capitalize on market opportunities while focusing
on 300mm & technological leadership by growing with the market
Benefit
from market
growth
Improve
financial performance
& cash flow
Execute
cost reduction
roadmaps &
debottlenecking
concepts
Ensure
technology &
quality leadership
Strategic Focus
We continuously increase the value for our stakeholders by providing best-in-class wafers
at competitive costs.
Improve returns,
stay ahead in technology and
grow with the market
Siltronic AG – Roadshow Presentation
January, 2018 25 of 40 © Siltronic AG 2018
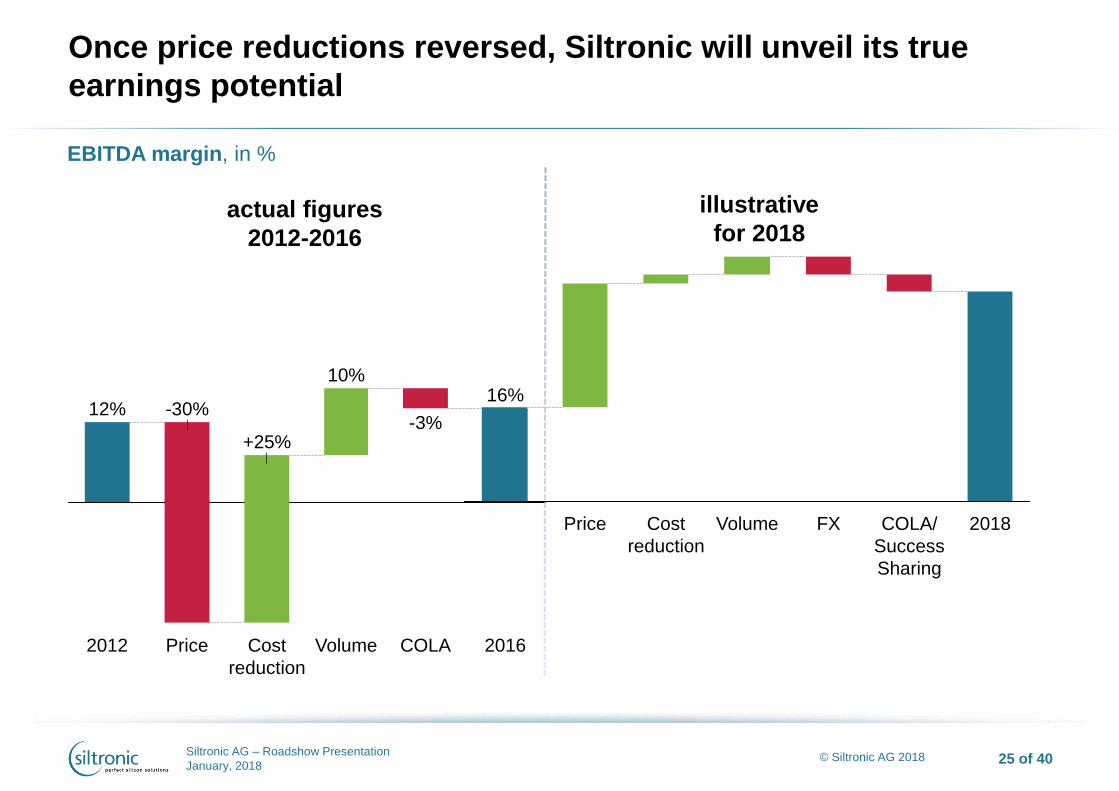
Once price reductions reversed, Siltronic will unveil its true
earnings potential
-30%
COLA 2016
16%
Volume
+25%
12%
10%
Price 2012 Cost
reduction
-3%
Price 2018 COLA/
Success
Sharing
FX Volume Cost
reduction
EBITDA margin, in %
actual figures
2012-2016
illustrative
for 2018
© Siltronic AG 2018
THANK YOU!
Appendix

© Siltronic AG 2018
FINANCIALS Q3/2017
…price increases
accelerate continuous
improvement …….

Siltronic AG – Roadshow Presentation
January, 2018 28 of 40 © Siltronic AG 2018
Highlights Q3/2017: Financials
Net Financial Assets EUR 294.8m (December 31, 2016: EUR 175.0m)
Margin EBITDA margin of 34.6% (Q2/2017: 25.7%)
EBIT & ROCE EUR 77.8m (Q2/2017: EUR 43.4m)
ROCE 43.4% (Q2/2017: 24.0%)
CapEx EUR 16.9m (Q2/2017: EUR 25.5m)
Free Cash Flow EUR 58.2m (Q2/2017: EUR 41.8m)
Sales Sales of EUR 308.1m (Q2/2017: EUR 283.1m)
EBITDA EUR 106.5m (Q2/2017: EUR 72.7m)
Siltronic AG – Roadshow Presentation
January, 2018 29 of 40 © Siltronic AG 2018
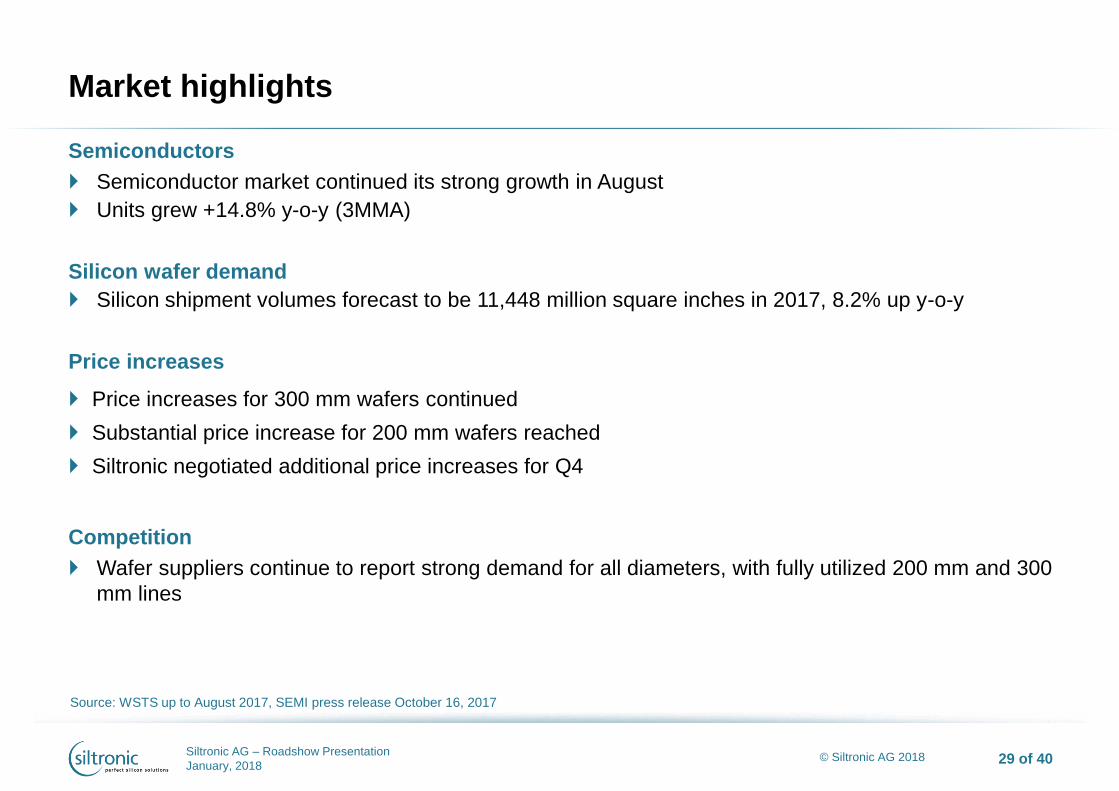
Semiconductors
Semiconductor market continued its strong growth in August
Units grew +14.8% y-o-y (3MMA)
Silicon wafer demand
Silicon shipment volumes forecast to be 11,448 million square inches in 2017, 8.2% up y-o-y
Price increases
Price increases for 300 mm wafers continued
Substantial price increase for 200 mm wafers reached
Siltronic negotiated additional price increases for Q4
Competition
Wafer suppliers continue to report strong demand for all diameters, with fully utilized 200 mm and 300
mm lines
Market highlights
Source: WSTS up to August 2017, SEMI press release October 16, 2017

Siltronic AG – Roadshow Presentation
January, 2018 30 of 40 © Siltronic AG 2018
237.0 246.3
258.0
283.1
308.1
Q3 2016 Q4 2016 Q1 2017 Q2 2017 Q3 2017
Q3 sales development driven by increased prices
Sales, in EUR million +8.8%
Comments
Positive
Slight volume growth q-o-q,
especially in smaller
diameters
Higher wafer prices for
300mm and 200mm in Q3
ASP up y-o-y and q-o-q
Further price increases
negotiated for Q4
Negative
Some headwind from USD
q-on-q
Siltronic AG – Roadshow Presentation
January, 2018 31 of 40 © Siltronic AG 2018
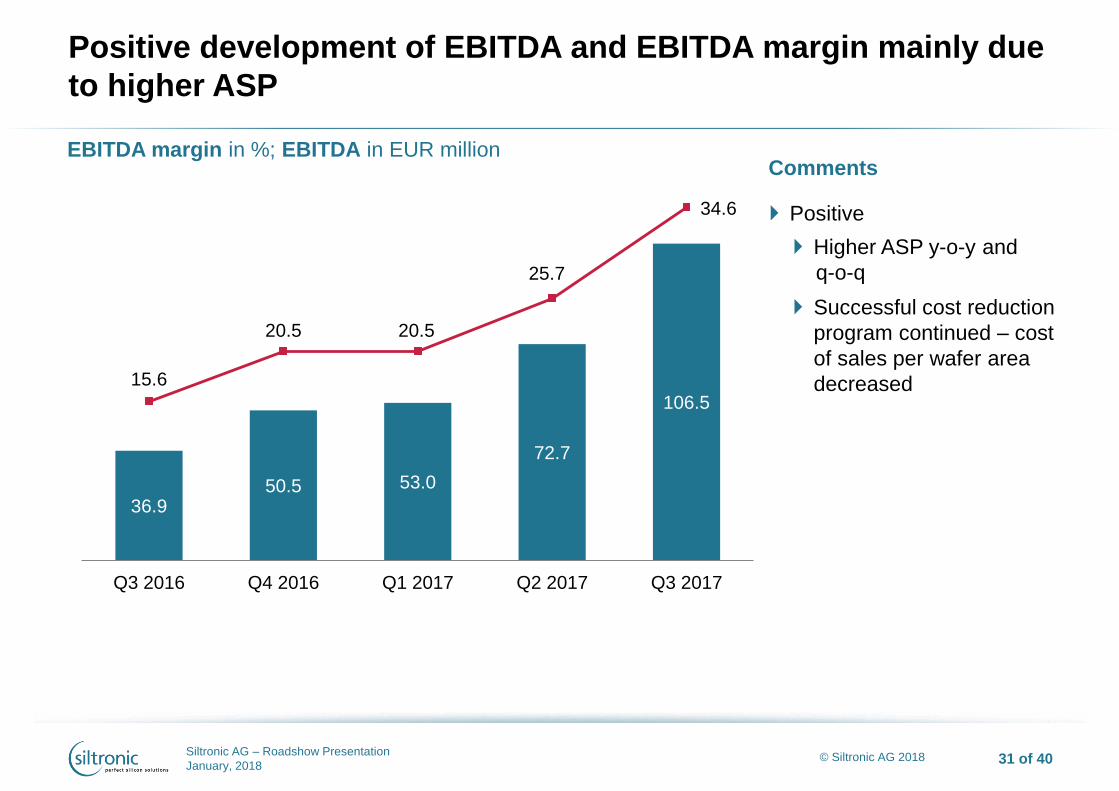
36.9 50.5 53.0
72.7
106.5
15.6
20.5 20.5
25.7
34.6
Q3 2016 Q4 2016 Q1 2017 Q2 2017 Q3 2017
EBITDA margin in %; EBITDA in EUR million Comments
Positive
Higher ASP y-o-y and
q-o-q
Successful cost reduction
program continued – cost
of sales per wafer area
decreased
Positive development of EBITDA and EBITDA margin mainly due
to higher ASP
Siltronic AG – Roadshow Presentation
January, 2018 32 of 40 © Siltronic AG 2018
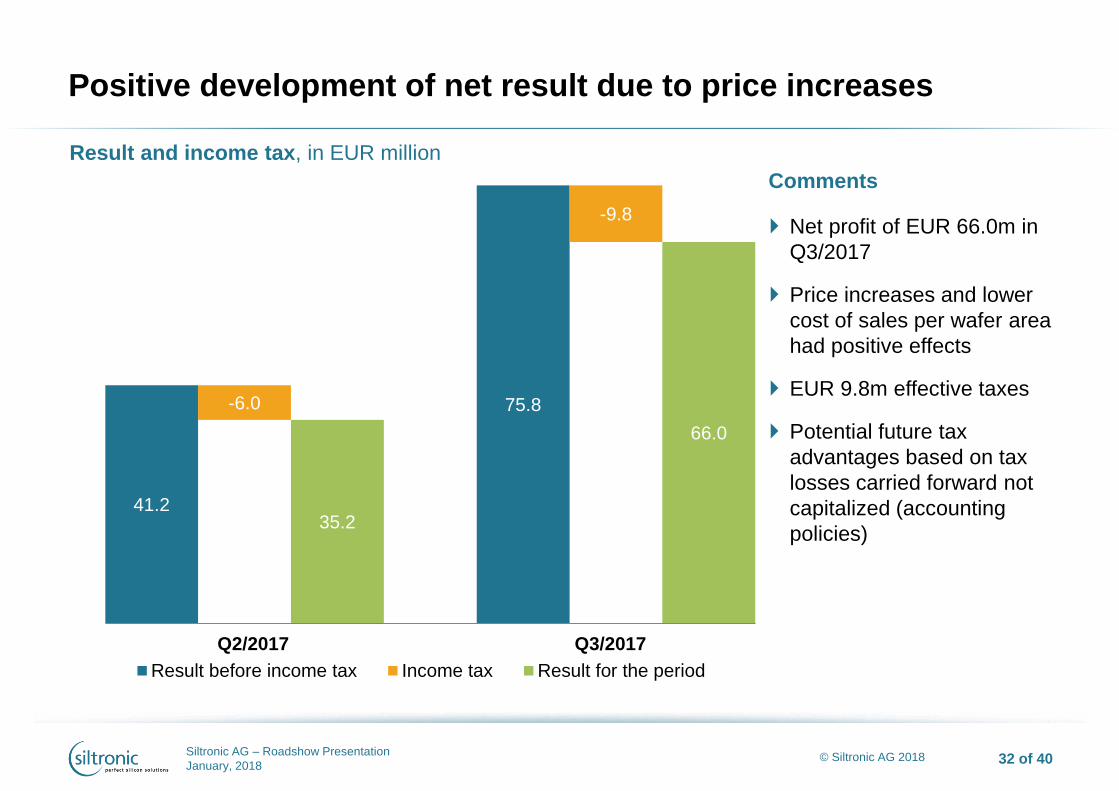
41.2 35.2
75.8
66.0
-6.0
-9.8
Result before income tax Income tax Result for the period
Positive development of net result due to price increases
Q2/2017 Q3/2017
Result and income tax, in EUR million
Comments
Net profit of EUR 66.0m in
Q3/2017
Price increases and lower
cost of sales per wafer area
had positive effects
EUR 9.8m effective taxes
Potential future tax
advantages based on tax
losses carried forward not
capitalized (accounting
policies)
Siltronic AG – Roadshow Presentation
January, 2018 33 of 40 © Siltronic AG 2018
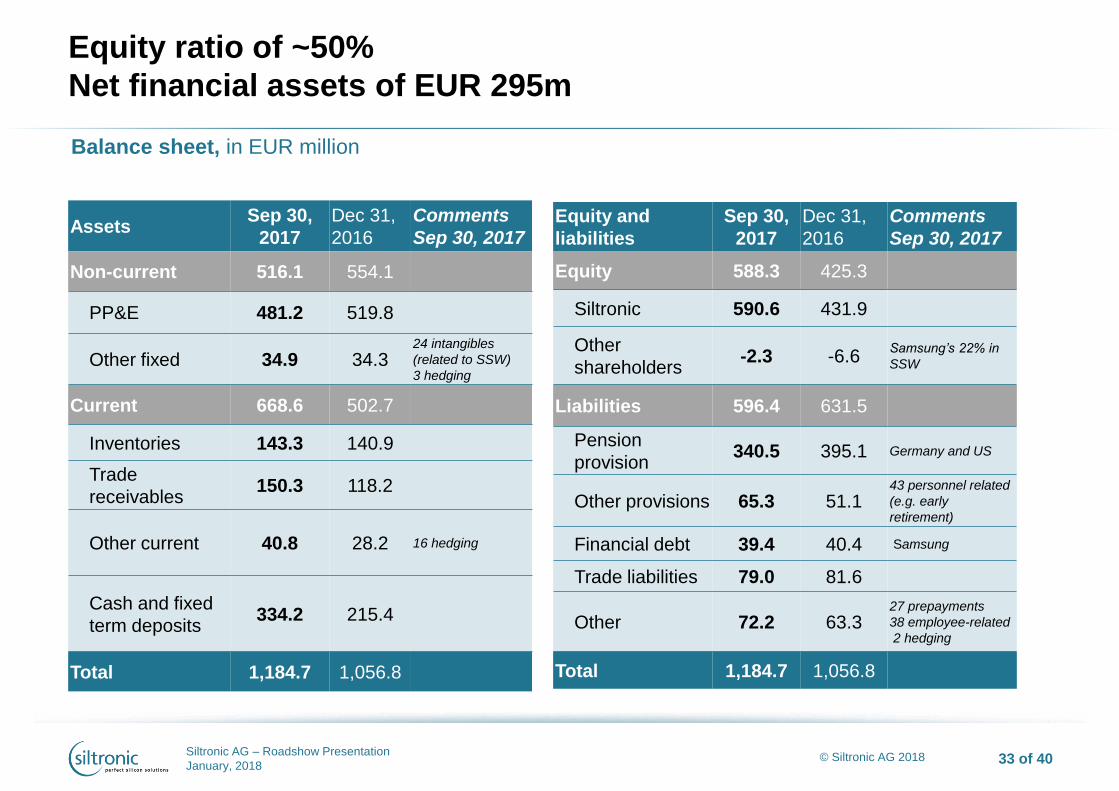
Equity ratio of ~50%
Net financial assets of EUR 295m
Assets Sep 30,
2017
Dec 31,
2016
Comments
Sep 30, 2017
Non-current 516.1 554.1
PP&E 481.2 519.8
Other fixed 34.9 34.3 24 intangibles
(related to SSW)
3 hedging
Current 668.6 502.7
Inventories 143.3 140.9
Trade
receivables 150.3 118.2
Other current 40.8 28.2
16 hedging
Cash and fixed
term deposits 334.2 215.4
Total 1,184.7 1,056.8
Equity and
liabilities
Sep 30,
2017
Dec 31,
2016
Comments
Sep 30, 2017
Equity 588.3 425.3
Siltronic 590.6 431.9
Other
shareholders -2.3 -6.6
Samsung’s 22% in
SSW
Liabilities 596.4 631.5
Pension
provision 340.5 395.1 Germany and US
Other provisions 65.3 51.1 43 personnel related
(e.g. early
retirement)
Financial debt 39.4 40.4 Samsung
Trade liabilities 79.0 81.6
Other 72.2 63.3 27 prepayments
38 employee-related
2 hedging
Total 1,184.7 1,056.8
Balance sheet, in EUR million
Siltronic AG – Roadshow Presentation
January, 2018 34 of 40 © Siltronic AG 2018
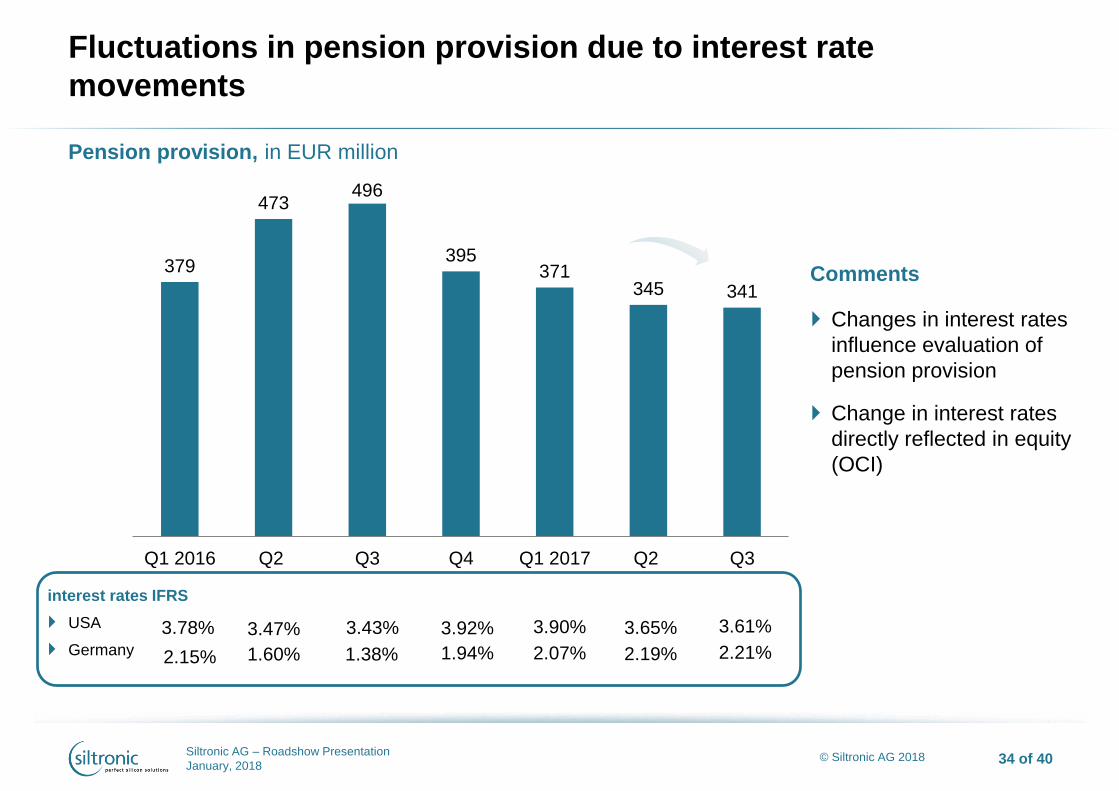
379
473 496
395 371
345 341
Q1 2016 Q2 Q3 Q4 Q1 2017 Q2 Q3
Fluctuations in pension provision due to interest rate
movements
interest rates IFRS
USA
Germany
Pension provision, in EUR million
Comments
Changes in interest rates
influence evaluation of
pension provision
Change in interest rates
directly reflected in equity
(OCI)
3.78%
2.15%
3.47%
1.60%
3.43%
1.38%
3.92%
1.94% 2.07%
3.90%
2.19%
3.65%
2.21%
3.61%
Siltronic AG – Roadshow Presentation
January, 2018 35 of 40 © Siltronic AG 2018
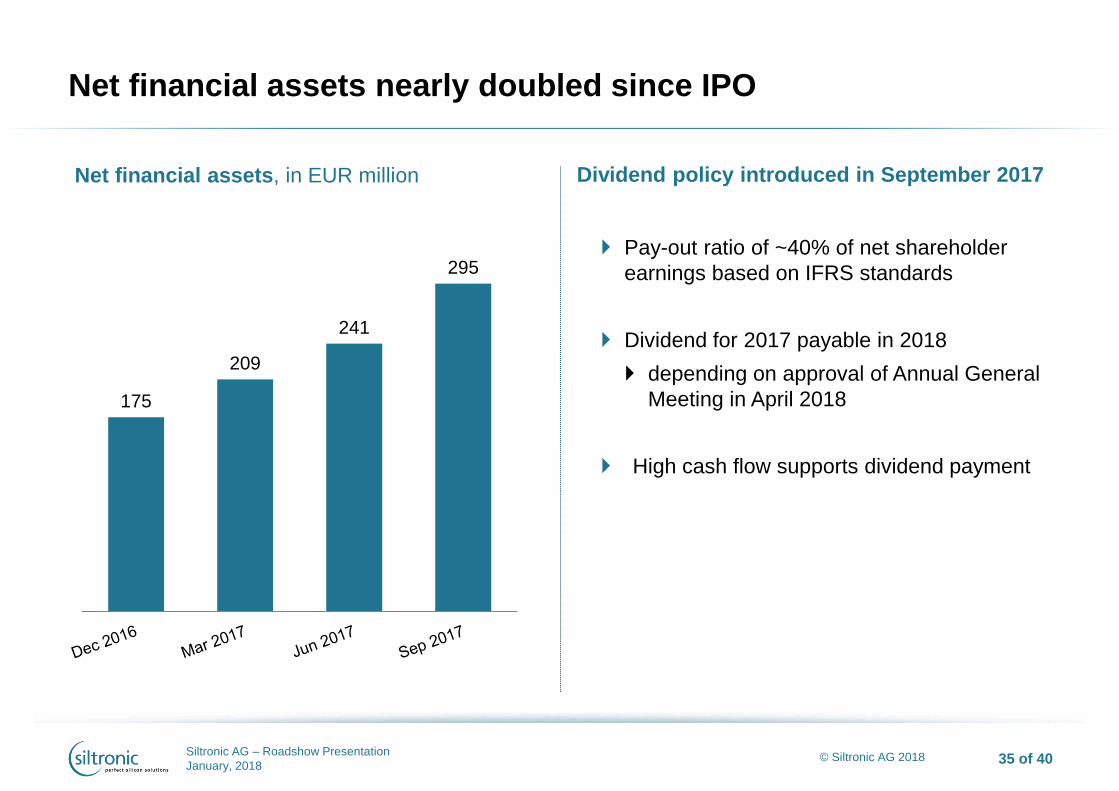
175
209
241
295
Net financial assets nearly doubled since IPO
Dividend policy introduced in September 2017
Pay-out ratio of ~40% of net shareholder
earnings based on IFRS standards
Dividend for 2017 payable in 2018
depending on approval of Annual General
Meeting in April 2018
High cash flow supports dividend payment
Net financial assets, in EUR million
Siltronic AG – Roadshow Presentation
January, 2018 36 of 40 © Siltronic AG 2018
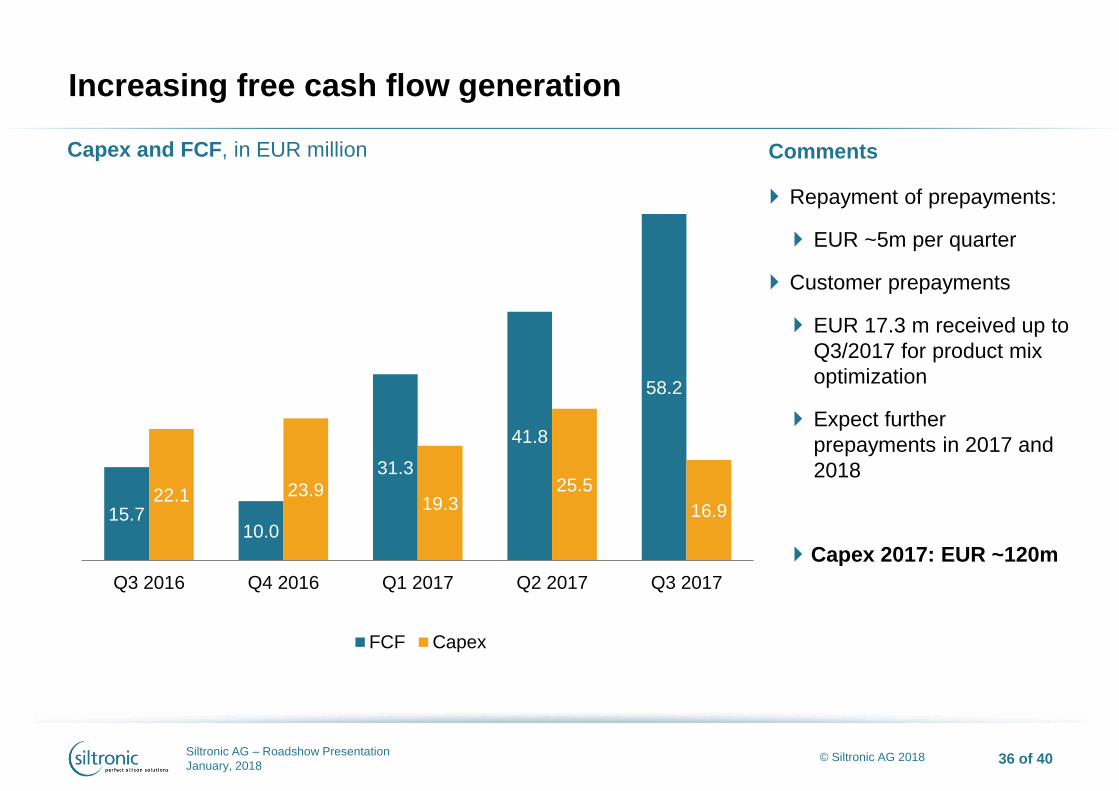
15.7 10.0
31.3
41.8
58.2
22.1 23.9 19.3
25.5
16.9
Q3 2016 Q4 2016 Q1 2017 Q2 2017 Q3 2017
FCF Capex
Capex and FCF, in EUR million Comments
Repayment of prepayments:
EUR ~5m per quarter
Customer prepayments
EUR 17.3 m received up to
Q3/2017 for product mix
optimization
Expect further
prepayments in 2017 and
2018
Capex 2017: EUR ~120m
Increasing free cash flow generation
Siltronic AG – Roadshow Presentation
January, 2018 37 of 40 © Siltronic AG 2018
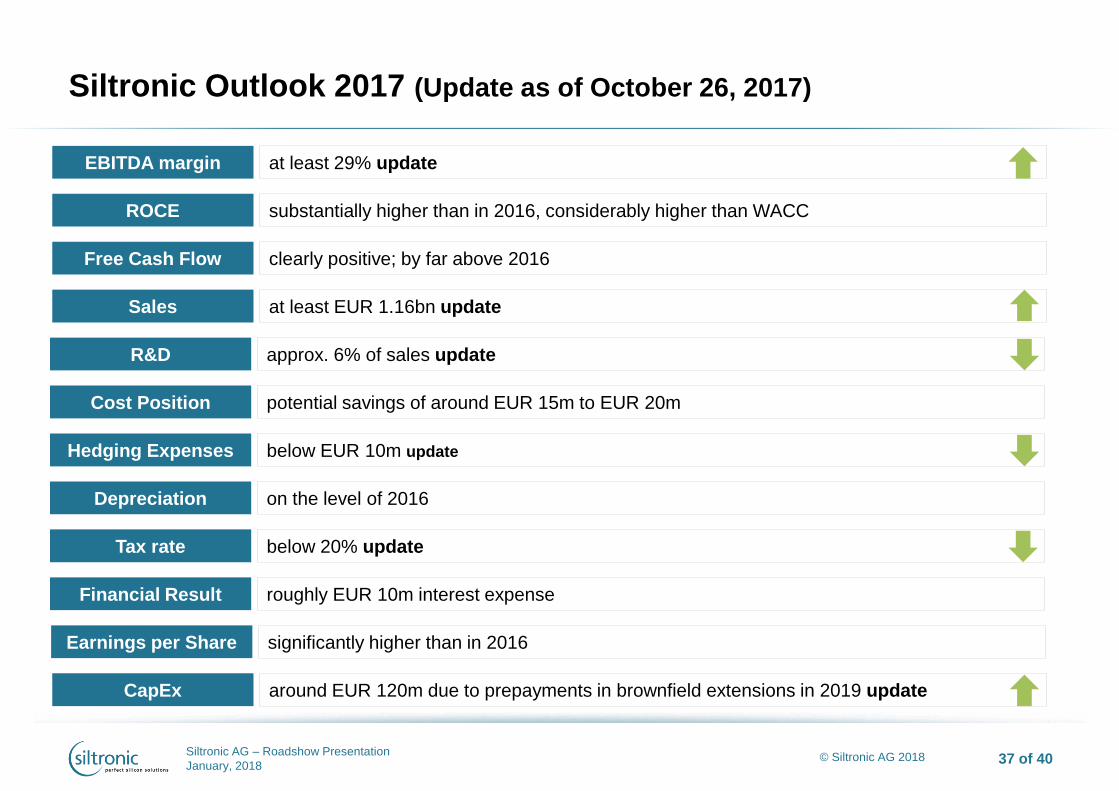
Siltronic Outlook 2017 (Update as of October 26, 2017)
Depreciation on the level of 2016
Free Cash Flow clearly positive; by far above 2016
Sales at least EUR 1.16bn update
R&D approx. 6% of sales update
Cost Position potential savings of around EUR 15m to EUR 20m
Hedging Expenses below EUR 10m update
EBITDA margin at least 29% update
ROCE substantially higher than in 2016, considerably higher than WACC
Tax rate below 20% update
Financial Result roughly EUR 10m interest expense
Earnings per Share significantly higher than in 2016
CapEx around EUR 120m due to prepayments in brownfield extensions in 2019 update

Siltronic AG – Roadshow Presentation
January, 2018 38 of 40 © Siltronic AG 2018
Contact and Additional Information
Issuer and Contact
Siltronic AG
Hanns-Seidel-Platz 4
D-81737 München
Investor Relations:
Petra Mueller
email: [email protected]
Tel. +49 89 8564-3133
Additional Information
ISIN: DE000WAF3001
WKN: WAF300
Deutsche Börse: WAF
Listing: Frankfurt Stock Exchange
Prime Standard
Financial Calendar
Full Year 2017 Results March 5, 2018
Annual General Meeting April 19, 2018
Q1 2018 Results April 25, 2018
Q2 2018 Results July 25, 2018
Q3 2018 Results October 25, 2018
Siltronic AG – Roadshow Presentation
January, 2018 39 of 40 © Siltronic AG 2018
Disclaimer
The information contained in this presentation is for background purposes only and is subject to
amendment, revision and updating. Certain statements contained in this presentation may be
statements of future expectations, future financial performance and other forward-looking statements
that are based on management's current views and assumptions and involve known and unknown risks
and uncertainties. In addition to statements which are forward-looking by reason of context, including
without limitation, statements referring to risk limitations, operational profitability, financial strength,
performance targets, profitable growth opportunities and risk adequate pricing, words such as "may”,
“will”, “should”, “expects”, “plans”, “intends”, “anticipates”, “believes”, “estimates”, “predicts”, “continue”,
“projects” or “seeks”, “potential”, “future”, or “further” and similar expressions may identify forward-
looking statements. By their nature, forward-looking statements involve a number of risks, uncertainties
and assumptions which could cause actual results or events to differ materially from those expressed or
implied by the forward-looking statements. These include, among other factors, changing business or
other market conditions, currency and interest fluctuations, introduction of competitive products, poor
acceptance of new products and services, change of the corporate strategy and the prospects for
growth anticipated by the management. These and other factors could adversely affect the outcome and
financial effects of the plans and events described herein. Statements contained in this presentation
regarding past trends or activities should not be taken as a representation that such trends or activities
will continue in the future. Siltronic AG does not undertake and does not intent to undertake any
obligation to update or revise any statements contained in this presentation, whether as a result of new
information, future events or otherwise. In particular, you should not place any reliance on forward-
looking statements which speak only as of the date of this presentation.
© Siltronic AG 2018
SILTRONIC AG | Hanns-Seidel-Platz 4
81737 Munich
Germany