silver standard resources inc....
TRANSCRIPT

SILVER STANDARD RESOURCES INC.
MANAGEMENT'S DISCUSSION AND ANALYSIS OF THE FINANCIAL POSITION AND RESULTS OFOPERATIONS FOR THE THREE MONTHS ENDED MARCH 31, 2017
1. FIRST QUARTER 2017 HIGHLIGHTS
2. OUTLOOK
3. BUSINESS OVERVIEW
4. RESULTS OF OPERATIONS
5. SUMMARIZED FINANCIAL RESULTS
6. LIQUIDITY
7. CAPITAL RESOURCES
8. FINANCIAL INSTRUMENTS AND RELATED RISKS
9. OTHER RISKS AND UNCERTAINTIES
10. RELATED PARTY TRANSACTIONS
11. NON-GAAP AND ADDITIONAL GAAP FINANCIAL MEASURES
12. CRITICAL ACCOUNTING POLICIES AND ESTIMATES
13. FUTURE ACCOUNTING CHANGES
14. INTERNAL CONTROL OVER FINANCIAL REPORTING AND DISCLOSURE CONTROLS AND
PROCEDURES
15. CAUTIONARY NOTES REGARDING FORWARD-LOOKING STATEMENTS AND MINERAL
RESERVES AND MINERAL RESOURCES ESTIMATES

SILVER STANDARD RESOURCES INC.
MANAGEMENT'S DISCUSSION AND ANALYSIS OF THE FINANCIAL POSITION AND RESULTSOF OPERATIONS FOR THE THREE MONTHS ENDED MARCH 31, 2017
This Management's Discussion and Analysis ("MD&A") is intended to supplement the unaudited condensedconsolidated interim financial statements of Silver Standard Resources Inc. ("we", "us", "our" or "Silver Standard")for the three months ended March 31, 2017, and the related notes thereto, which have been prepared in accordancewith International Financial Reporting Standards ("IFRS"), as issued by the International Accounting StandardsBoard ("IASB"), applicable to the preparation of interim financial statements, including IAS 34, Interim FinancialReporting.
All figures are expressed in U.S. dollars except where otherwise indicated. References to C$ refer to Canadian dollars.References to ARS are to Argentine Pesos. This MD&A has been prepared as of May 3, 2017, and should be readin conjunction with the unaudited condensed consolidated interim financial statements for the three months endedMarch 31, 2017.
Additional information, including our Annual Information Form and Annual Report on Form 40-F for the year endedDecember 31, 2016, is available on SEDAR at www.sedar.com, and on the EDGAR section of the U.S. Securitiesand Exchange Commission ("SEC") website at www.sec.gov.
This MD&A contains "forward-looking statements" that are subject to risk factors set out in a cautionary notecontained in section 15 herein. We use certain non-GAAP and additional GAAP financial measures in this MD&A;for a description of each of these measures, please see the discussion under "Non-GAAP and Additional GAAPFinancial Measures" in section 11 of this MD&A.
2
1. FIRST QUARTER 2017 HIGHLIGHTS
▪ Strong financial performance: Achieved quarterly revenue of $117.9 million, net income of $15.0 million or$0.13 per share and adjusted net income of $19.7 million or $0.17 per share.
▪ Increased cash balance: Quarter-end cash increased by $13.5 million to $340.6 million. Cash generated byoperating activities totaled $30.6 million. Marketable securities increased by $41.7 million to $190.6 million.
▪ Consistent production: Produced 97,851 gold equivalent ounces at cash costs of $646 and AISC of $977 perpayable gold equivalent ounce.
▪ Low cost gold production at Marigold: Produced 55,215 ounces of gold at cash costs of $585 and AISC of$799 per payable ounce of gold sold.
▪ Robust gold production at Seabee: Achieved production of 21,023 ounces of gold as higher grade ore wassourced from the Santoy mine at cash costs of $574 and AISC of $986 per payable ounce of gold sold.
▪ Strong operating fundamentals at Pirquitas: Concluded open pit mining in January and commenced stockpileprocessing for quarterly production of 1.5 million ounces of silver at cash costs of $12.68 and AISC of $14.82per payable ounce of silver sold.
• Exercised option on the Chinchillas project: Creates a joint venture to extend the Pirquitas operating life withthe Chinchillas silver-lead-zinc deposit. Silver Standard will be the operator.
▪ Resolved export duty claim: We entered into the tax moratorium system in Argentina, which resolves our exportduty claim. We have agreed to pay approximately ARS 1 billion with 5% paid upon entry and the balance ininstallments over 60 months.

2. OUTLOOK
This section of the MD&A provides management's production and cost estimates. See "Cautionary Notes RegardingForward-Looking Statements and Mineral Reserves and Mineral Resources Estimates" in section 15 of this MD&A.
Our operating guidance remains unchanged from that provided in our fourth quarter 2016 MD&A Outlook. For thefull year 2017, we expect:
Operating Guidance Marigold mine Seabee Gold Operation Pirquitas mineGold Production oz 205,000 - 215,000 72,000 - 82,000 —Silver Production Moz — — 4.5 - 5.5Cash Costs per Payable Ounce Sold (1) $/oz 655 - 705 575 - 625 13.50 - 16.00Capital Expenditures $M 30 8 5Capitalized Stripping / CapitalizedDevelopment $M 17 11 —Exploration Expenditures (2) 5 5 —
(1) We report the non-GAAP financial measure of cash costs per payable ounce of gold and silver sold to manage and evaluate operatingperformance at the Marigold mine, the Seabee Gold Operation and the Pirquitas mine. See “Non-GAAP and Additional GAAP FinancialMeasures” in section 11.
(2) Includes capitalized and expensed exploration expenses.
In 2017, on a consolidated basis at mid-point of guidance, we expect to produce 355,000 gold equivalent ounces atgold equivalent cash costs of $735 per ounce. Cash costs and capital guidance are based on $55 per barrel oil priceand 1.30 Canadian to U.S. dollar exchange rate. Gold equivalent figures are based on $1,250 per ounce gold priceand $17.50 per ounce silver price.
3

3. BUSINESS OVERVIEW
Strategy
We are a resource company focused on the operation, acquisition, exploration and development of precious metalresource properties located in the Americas. We have three producing mines and a portfolio of precious metal dominantprojects located throughout the Americas. Our focus is on safe, profitable gold and silver production from our Marigoldmine in Nevada, U.S., our Seabee Gold Operation in Saskatchewan, Canada, and our Pirquitas mine in Jujuy,Argentina.
Corporate summary
On March 31, 2017, we entered into the tax moratorium system in Argentina to resolve the dispute regarding theapplication of export duties relating to production from our Pirquitas mine. Under the conditions of the moratorium,which converts the tax liability to ARS, we agreed to pay approximately ARS 1 billion with 5% down paymentinitially and the balance in installments over 60 months. Outstanding ARS amounts are subject to interest at a minimumrate of 1.5% per month. Upon completion of these payments all liabilities related to historical export duties andinterest will be extinguished.
Also on March 31, 2017, we exercised the option on the Chinchillas project to form a joint venture with GoldenArrow Resources Corporation ("Golden Arrow") for development of the property. The joint venture will be comprisedof our Pirquitas property and Golden Arrow's Chinchillas property and will be owned on a 75%/25% basis by eachcompany, respectively. We will be the operator. Based on and subject to the permitting process, we anticipateconstruction at the Chinchillas property to begin during the third quarter of 2017 with ore delivery to the Pirquitasmill expected in the second half of 2018.
Subsequent to the quarter end, on April 24, 2017, the final step in the sale of our Diablillos and M-18 projects (the“Projects”), located in Argentina, to Huayra Minerals Corp. (“Huarya”) was completed with the reverse take-over(“RTO”) of Huayra by AbraPlata Resource Corp. (“AbraPlata”). This transaction was previously announced in ournew releases dated September 19, 2016 and April 25, 2017.
As a result of the RTO and under the terms of the definitive agreement, Silver Standard: received 19.9% of AbraPlataas partial consideration for the sale of the Projects, with a free carried interest in AbraPlata until the completion ofa financing of $5 million or more (the “Financing”); has appointed one member to the Board of Directors of AbraPlata;maintains the right to participate in future equity financings after the Financing to maintain our ownership level inAbraPlata for as long as Silver Standard continues to hold more than ten percent of the then issued and outstandingshares of AbraPlata on a non-diluted basis; is entitled to cash payments to Silver Standard of approximately $1.6million, of which $0.6 million was received by March 31, 2017, over the first two years and $12.5 million over thefollowing three to five years; and retains a 1.0% net smelter returns royalty on production from each of the Projects.
Subsequent to the quarter end, AbraPlata paid Silver Standard its $0.5 million installment due April 30, 2017.
On April 26, 2017, we announced that we entered into an option agreement with Eskay Mining Corp. to acquire upto a 60% undivided interest in the SIB project, located in British Columbia, Canada.
On May 2, 2017, we completed the sale of 100% of our Berenguela project in Peru to Valor Resources Limited.
Macro-economic environment
Our financial performance is impacted by gold and silver prices. Precious metals prices in the first quarter of 2017remained at comparable levels with the fourth quarter of 2016, with gold averaging $1,219 per ounce and silveraveraging $17.41 per ounce. Gold and silver prices improved towards the end of the quarter and closed at $1,243
4

per ounce of gold and $18.06 per ounce of silver on March 31, 2017. Gold continued to improve above these levelsfollowing the quarter end.
The principal factors impacting precious metals prices in the first quarter were the increase of the U.S. interest ratesand expectations of further increases later this year, and expectations of rising inflation. Additionally, there isuncertainty resulting from increased geopolitical risk and trade protectionism.
The Canadian dollar remained at levels comparable with the end of the fourth quarter of 2016. During the first quarter,the Canadian dollar averaged and closed at approximately 1.33 Canadian dollars per 1 U.S. dollar. Our exposure tothe Canadian dollar is significant due to our Canadian Seabee Gold Operation and we have continued with our riskmanagement hedging program to protect a portion of our Canadian dollar operating costs through 2017 and 2018.
The ARS was stable in the first quarter of 2017 and strengthened by 3%, closing at 15.40 ARS per 1 U.S. dollar onMarch 31, 2017. ARS devaluation offsets inflation in Argentina, so the strengthening of the ARS in the quarter hashad a negative impact on our operating costs.
West Texas Intermediate oil prices in the first quarter of 2017 were comparable to the fourth quarter of 2016, averaging$51.70 per barrel and closing at $50.60 per barrel. Diesel, a product of oil, is a significant consumable at our operationsand the movement in diesel prices can have a significant impact on the cost structure at all of our mines. We hedgea portion of our diesel usage to manage price risk of this consumable through 2018.
5

Consolidated financial summary
Selected Financial Data (1)
Three months ended March 312017 2016
$ $Revenue 117,905 101,513Income from mine operations 40,089 23,298Operating income 24,809 14,614Net income for the period 15,047 2,300Basic income per share 0.13 0.03Adjusted income before tax 23,161 12,581Adjusted net income (2) 19,741 9,023Adjusted basic income per share (2) 0.17 0.11Cash generated by operating activities 30,643 12,724Cash (used in) investing activities (18,118) (5,844)Cash generated by (used in) financing activities 335 (1,069)
Financial PositionMarch 31, 2017 December 31, 2016
Cash and cash equivalents 340,585 327,127Marketable securities 190,631 148,944Current assets (including cash and cash equivalents) 769,074 704,240Current liabilities 80,837 144,306Working capital 688,237 559,934Total assets 1,484,224 1,438,688
(1) All values are presented in thousands of U.S. dollars, except per share amounts. (2) We report non-GAAP measures including adjusted income before- and after-tax and adjusted basic income per share, to manage and
evaluate our operating performance. See "Non-GAAP and Additional GAAP Financial Measures" in section 11.
Quarterly financial summary
The 16% increase in quarterly revenue compared to the first quarter of 2016 was due to higher realized prices ofgold by 3% and silver by 16%, combined with an 8% increase in equivalent payable gold ounces sold. The increasein ounces sold was largely due to sales from the Seabee Gold Operation, which we did not own in the first quarterof 2016, partially offset by 55% lower ounces sold from the Pirquitas mine.
Income from mine operations in the first quarter of 2017 generated a gross margin of 34%, significantly higher thanthe 23% margin in the first quarter of 2016 due to higher precious metals prices, lower cost of sales at Marigold andthe addition of the Seabee Gold Operation. In addition, the resolution of our export duty claim in Argentina resultedin a $4.3 million reduction to cost of sales.
Cash generated by operating activities increased significantly to $30.6 million compared to $12.7 million in the firstquarter of 2016. Higher prices of gold and silver and higher volumes of gold sold at lower unit costs generatedsignificantly higher cash from operating activities. We used $18.1 million in investing activities in the first quarterof 2017 compared to $5.8 million in the first quarter of 2016. Investments in property and plant were higher by $3.7million mainly due to the addition of the Seabee Gold Operation and we also capitalized $2.5 million of undergrounddevelopment. Capitalized stripping at Marigold was $5.3 million higher than in the comparative quarter in 2016.
6

4. RESULTS OF OPERATIONS
Consolidated results of operations
The following table presents consolidated operating information for our Marigold and Pirquitas mines and our SeabeeGold Operation. Additional operating information is provided in the sections relating to the individual mines.
Three months ended
Operating data (1)March 31
2017December 31
2016September 30
2016June 30
2016March 31
2016Consolidated production and sales:Gold produced (oz) 76,238 79,656 67,598 53,916 50,520Silver produced ('000 oz) 1,520 2,210 3,047 2,526 2,639
Gold sold (oz) 74,939 78,537 69,189 58,430 48,605Silver sold ('000 oz) 1,443 2,633 2,947 2,594 3,223
Cash costs ($/oz) - payable gold from Marigold mine (2) 585 585 636 663 719Cash costs ($/oz) - payable gold from Seabee GoldOperation (2,5) 574 595 661 663 —Cash costs ($/oz) - payable silver from Pirquitas mine (2) 12.68 9.80 8.48 8.87 8.93
Gold equivalent production (oz) (3) 97,851 110,130 112,559 86,956 83,680
Realized gold price ($/oz) (2) 1,220 1,243 1,331 1,263 1,189Realized silver price ($/oz) (2) 17.35 17.14 19.64 16.52 14.94
Consolidated costs:Cash Costs per equivalent gold ounce sold ($/oz) (2,3,5) 646 625 618 669 715AISC per equivalent gold ounce sold ($/oz) (2,3,5) 977 845 940 1,061 859
Financial data ($000s)Revenue 117,905 127,317 143,381 118,775 101,513Income from mine operations (4) 40,089 27,456 59,190 44,062 23,298
(1) The data presented includes results from the Seabee Gold Operation for the period from May 31, 2016, to March 31, 2017, the period forwhich we were entitled to all economic benefits of the Seabee Gold Operation, following our acquisition of Claude Resources Inc. ("ClaudeResources").
(2) We report the non-GAAP financial measures of cash costs, realized metal prices and all-in sustaining costs ("AISC") per payable ounce ofprecious metals sold to manage and evaluate operating performance at our mines. For a better understanding and a reconciliation of thesemeasures to cost of sales, as shown in our consolidated statements of comprehensive income (loss), please refer to “Non-GAAP and AdditionalGAAP Financial Measures” in section 11.
(3) Gold equivalent ounces have been established using the realized gold and silver prices in the period and applied to the recovered metalcontent produced by the mines.
(4) The income from mine operations in the quarter ended March 31, 2017, includes a non-cash benefit of $4.3 million from the resolution ofthe export duty claim in Argentina. Income from mine operations for the quarter and year ended December 31, 2016, includes $5.7 millionof severance provision related to the Pirquitas mine and $3.7 million of non-cash write-down of supplies inventory and VAT receivable.
(5) The non-GAAP financial measure of cash costs from the Seabee Gold Operation was adjusted to eliminate the adjustment of inventory tofair value as at the date of our acquisition of Claude Resources.
7

Marigold mine, U.S.
Three months ended
Operating dataMarch 31
2017December 31
2016September 30
2016June 30
2016March 31
2016Total material mined (kt) 16,736 19,559 19,558 18,685 17,291Waste removed (kt) 11,062 13,123 14,741 12,005 11,611Total ore stacked (kt) 5,674 6,436 4,817 6,680 5,680Strip ratio 1.9 2.0 3.1 1.8 2.0Mining cost ($/t mined) 1.65 1.52 1.48 1.55 1.45Gold stacked grade (g/t) 0.42 0.48 0.42 0.44 0.47Processing cost ($/t processed) 0.89 0.80 0.95 0.70 0.71Gold recovery (%) 74.0 75.0 71.0 70.7 70.0General and admin costs ($/t processed) 0.52 0.46 0.56 0.38 0.47
Gold produced (oz) 55,215 59,945 47,456 47,195 50,520Gold sold (oz) 52,528 61,308 47,278 47,124 48,605
Realized gold price ($/oz) (1) 1,214 1,247 1,330 1,259 1,189
Cash costs ($/oz) (1) 585 585 636 663 719AISC ($/oz) (1) 799 835 1,139 1,067 841
Financial data ($000s)Revenue 63,762 77,047 62,831 59,197 57,742Income from mine operations 21,327 28,648 23,156 17,641 11,227Capital investments 3,043 3,271 8,310 10,154 8,796Capitalized stripping 6,745 10,171 13,787 7,231 1,435Exploration expenditures (2) 1,024 1,276 1,145 1,597 1,102
(1) We report the non-GAAP financial measures of realized gold prices, cash costs and AISC per payable ounce of gold sold to manage andevaluate operating performance at the Marigold mine. For a better understanding and a reconciliation of these measures to cost of sales, asshown in our consolidated statements of comprehensive income (loss), please refer to “Non-GAAP and Additional GAAP Financial Measures”in section 11.
(2) Includes capitalized and expensed exploration expenses.
Mine production
In the first quarter of 2017, the Marigold mine produced 55,215 ounces of gold, in line with our plan.
A total of 16.7 million tonnes were mined in the first quarter of 2017, 14% less than the fourth quarter of 2016, primarilydue to weather-related impacts in January and February, which caused the open pit to cease operations intermittentlydue to unsafe work conditions. Additionally, the rope shovel was down for planned maintenance for five days duringthe month of March. We expect to recover the tonnage in the second half of 2017 as we will have significantly shorterhauls available due to backfilling previously mined areas.
Approximately 5.7 million tonnes of ore were delivered to the heap leach pads at an average gold grade of 0.42 g/t.This compares to 6.4 million tonnes of ore delivered to the heap leach pads at a gold grade of 0.48 g /t in the fourthquarter of 2016. Gold grade mined in the first quarter was 13% lower than the fourth quarter due to planned pit phasesequencing. The strip ratio declined to 1.9:1 in the quarter, a 5% reduction compared to the previous quarter.
8
Mine operating costs
Cash costs and AISC per payable ounce of gold sold are non-GAAP financial measures. Please see the discussion under"Non-GAAP and Additional GAAP Financial Measures" in section 11.
Cash costs, which include all costs of inventory, refining costs and royalties, of $585 per payable ounce of gold soldin the first quarter of 2017 were equal to cash costs in the fourth quarter of 2016. Total mining costs were lower in thefirst quarter of 2017 than in the fourth quarter of 2016. However, costs per tonne mined increased by 9% to $1.65 pertonne in the first quarter, due to a decrease in total tonnes mined. Processing unit costs were 11% higher in the firstquarter of 2017 than in the fourth quarter of 2016 due to fewer tonnes stacked. General and administrative unit costswere also higher in the first quarter of 2017 than in the fourth quarter of 2016 due to fewer tonnes stacked but werecomparable on an absolute basis.
AISC of $799 per payable ounce of gold sold in the first quarter of 2017 decreased from $835 in the fourth quarter of2016 predominantly due to lower capitalized stripping.
Mine sales
A total of 52,528 ounces of gold were sold at an average price of $1,214 per ounce during the first quarter of 2017,compared to 61,308 ounces of gold sold at a 3% higher average price of $1,247 per ounce during the fourth quarter of2016.
Exploration
Exploration activities during the first quarter of 2017 focused on the conversion of Mineral Resources to MineralReserves in areas proximal to the 2016 Mineral Reserve pit. During the quarter we completed 10,255 meters of reversecirculation drilling in 44 drillholes on four targets. Positive drill results demonstrate the potential to increase and convertMineral Resources and warrant further follow up drilling, which is currently underway. The drill results from our fourthquarter 2016 and first quarter 2017 were reported in our news release dated May 1, 2017.
9

Seabee Gold Operation, Canada
Three months ended
Operating data March 312017
December 312016
September 302016
Period fromAcquisition to
June 30, 2016 (1)
Three monthsended
June 30, 2016 (2)
Total ore milled (t) 72,394 84,526 82,756 18,856 71,218
Ore milled per day (t/day) 804 919 900 629 783
Gold mill feed grade (g/t) 9.22 7.40 7.40 7.79 7.97
Mining costs ($/t mined) 68 62 58 110 N/A
Processing costs ($/t processed) 23 19 19 29 N/A
Gold recovery (%) 97.7 97.0 96.5 96.6 96.8
General and admin costs ($/t processed) 59 44 37 61 N/A
Gold produced (oz) 21,023 19,711 20,142 6,721 17,524
Gold sold (oz) 22,411 17,229 21,911 11,306 16,305
Realized gold price ($/oz) (3) 1,233 1,230 1,334 1,278 1,271
Cash costs ($/oz) (3,5) 574 595 661 663 N/A
AISC ($/oz) (3,5) 986 833 840 776 N/A
Financial data ($000s)
Revenue 27,609 21,175 29,214 14,437 N/A
Income from mine operations 4,995 2,864 4,126 1,216 N/A
Capitalized development 2,514 2,432 2,104 803 N/A
Capital investments 4,760 1,010 579 337 N/A
Exploration expenditures (4) 1,953 829 1,206 117 N/A
(1) The data presented in this column is for the period from May 31, 2016, to June 30, 2016, the period for which we were entitled to all economicbenefits of the Seabee Gold Operation following our acquisition of Claude Resources.
(2) The data presented in this column includes operating results for the Seabee Gold Operation for the entire second quarter of 2016, includingthe period from April 1 to May 30, 2016 prior to our acquisition of Claude Resources.
(3) We report the non-GAAP financial measures of realized gold prices, cash costs and AISC per payable ounce of gold sold to manage andevaluate operating performance at the Seabee Gold Operation. For a better understanding and a reconciliation of these measures to cost ofsales, as shown in our consolidated statements of comprehensive income (loss), please refer to “Non-GAAP and Additional GAAP FinancialMeasures” in section 11.
(4) Includes capitalized and expensed exploration expenses.(5) The non-GAAP financial measures of cash costs per payable ounce of gold sold and AISC per payable ounce of gold sold from the Seabee
Gold Operation were adjusted to eliminate the adjustment of inventory to fair value as at the date of our acquisition of Claude Resources.
Mine production
The Seabee Gold Operation consists of the Seabee and Santoy underground mines, both of which feed a single processingfacility. In the first quarter of 2017, the Seabee Gold Operation produced 21,023 ounces of gold, a 7% increase fromthe 19,711 ounces of gold produced during the fourth quarter of 2016, primarily due to higher grade ore from the Santoymine complex.
A total of 72,394 tonnes of ore was milled at an average gold grade of 9.22 g/t and recovery of 97.7% during the firstquarter of 2017. This compares to a total of 84,526 tonnes of ore milled at an average gold grade of 7.40 g/t and recoveryof 97.0% in the fourth quarter of 2016.
10
During the first quarter, the mill was maintained at a throughput of 804 tonnes per day, lower than the previous quarteras ore delivery from the mine constrained mill throughput due to ventilation system requirements. The need for additionalventilation was identified in the fourth quarter of 2016. A solution to deliver more fresh air, especially in deeper sectionsof the Santoy mine, was developed with equipment delivered to site in the first quarter of 2017, with installation andoperability expected by the end of the second quarter.
The Santoy mine complex supplied 98% of ore milled in the first quarter, predominantly from long hole stopes. Wecontinue to develop new mine plans to achieve a higher, sustainable production rate.
Mine operating costs
Cash costs and AISC per payable ounce of gold sold are non-GAAP financial measures. Please see the discussion under"Non-GAAP and Additional GAAP Financial Measures" in section 11.
Cash costs per payable ounce of gold sold, which include all costs of inventory, refining costs and royalties, were $574in the first quarter of 2017, lower than the $595 in the fourth quarter of 2016. Costs per tonne mined were $68 per tonnein the first quarter of 2017, 10% higher than in the previous quarter due to lower tonnes mined. Processing and generaland administration unit costs were higher by 21% and 34%, respectively, in the first quarter of 2017 compared to thefourth quarter of 2016 due to lower tonnes milled; however, the mill feed grade was 25% higher in the current quarterthan in the preceding period driving higher production which resulted in lower cash costs in the period.
AISC per payable ounce of gold sold, were $986 in the first quarter of 2017, higher than the $833 in the fourth quarterof 2016 as a significant portion of planned capital spending was incurred due to the delivery of capital items over theice road. Exploration spending also increased, consistent with our objective of adding Mineral Reserves and MineralResources at the mine.
Mine sales
A total of 22,411 ounces of gold were sold at an average price of $1,233 per ounce during the first quarter of 2017, 30%higher than the 17,229 ounces of gold sold at a comparable price of $1,230 per ounce in the fourth quarter of 2016.
Exploration
For 2017, the Seabee Gold Operation plans to complete up to 60,000 meters of underground drilling and 28,500 metersof surface drilling with the objective to increase and convert Mineral Resources into Mineral Reserves. In the firstquarter of 2017, we completed 16,267 meters of underground drilling and 11,394 meters of surface drilling in 42 and24 drillholes, respectively. Drill results continue to be encouraging and additional exploration drilling has been plannedfor 2017 across the Seabee Gold Operation to define, increase and convert Mineral Resources. The drill results forfourth quarter 2016 and first quarter 2017 were reported in our news release dated May 1, 2017.
11

Pirquitas mine, Argentina
Three months ended
Operating dataMarch 31
2017December 31
2016September 30
2016June 30
2016March 31
2016Total material mined (kt) (1) 89 1,694 2,385 2,543 2,520Ore mined (kt) (1) 53 501 801 729 794Silver mined grade (g/t) (1) 205 168 190 189 181Mining costs ($/t mined) (1) 25.80 4.84 3.80 3.54 2.97Ore milled (kt) 449 476 455 425 418Silver mill feed grade (g/t) 145 194 264 238 247Processing cost ($/t milled) 13.66 14.17 14.78 15.10 13.58Silver recovery (%) 72.6 74.5 79.0 77.6 79.7General and admin costs ($/t milled) 5.22 6.19 5.84 6.22 5.68
Silver produced ('000 oz) 1,520 2,210 3,047 2,526 2,639Silver sold ('000 oz) 1,443 2,633 2,947 2,594 3,223
Realized silver price ($/oz) (2) 17.35 17.14 19.64 16.52 14.94
Cash costs ($/oz) (2) 12.68 9.80 8.48 8.87 8.93AISC ($/oz) (2) 14.82 11.47 9.87 10.00 9.67
Financial Data ($000s)Revenue 26,534 29,095 51,336 45,141 43,771Income (loss) from mine operations (3) 13,767 (4,056) 31,908 25,205 12,071Capital investments 2,261 3,467 3,158 2,057 1,578Exploration expenditures — 11 7 25 22
(1) Data for the quarter ended March 31, 2017, represent mining until mid-January 2017. We will stop reporting these metrics beginning in thesecond quarter of 2017.
(2) We report the non-GAAP financial measures of cash costs per payable ounce of silver sold, realized silver prices and AISC to manage andevaluate operating performance at the Pirquitas mine. For a better understanding and a reconciliation of these measures to cost of sales, asshown in our consolidated statements of comprehensive income, please refer to “Non-GAAP and Additional GAAP Financial Measures” insection 11.
(3) The income from mine operations in the quarter ended March 31, 2017, includes a non-cash impact of $4.3 million relating to the resolutionof the export duty claim in Argentina. Income (loss) from mine operations for the quarter ended December 31, 2016, includes $5.7 millionof severance provision and a non-cash write-down of supplies inventory and VAT receivable of $3.7 million.
Mine production
Mining from the San Miguel open pit ceased in January 2017 and medium grade stockpile material is being processedthrough the plant. Lower grade stockpiles may be processed in late 2017, and potentially in early 2018, once the mediumgrade stockpiles have been consumed, depending on prevailing economic conditions. The operation produced a totalof 1.5 million ounces of silver from ore mined and stockpiles processed. Ore was milled at an average rate of 4,994 tonnes per day in the first quarter, 25% above the mill’s nominal throughputof 4,000 tonnes per day. Ore milled in the first quarter of 2017 contained an average silver grade of 145 g/t, 25% lowerthan the 194 g/t reported in the fourth quarter of 2016 as the majority of mill feed was sourced from medium gradestockpiles. The jig circuit was not utilized to treat stockpile material. The average silver recovery in the first quarterwas 72.6%, lower than the 74.5% recovery in the previous quarter, in line with reduced silver mill feed grade.
Mine operating costs
Cash costs and AISC per payable ounce of silver sold are non-GAAP financial measures. Please see the discussionunder "Non-GAAP and Additional GAAP Financial Measures" in section 11.
12

Cash costs, which include cost of inventory, treatment and refining costs and by-product credits, increased by 29% to$12.68 per payable ounce of silver sold in the first quarter of 2017 from $9.80 per payable ounce of silver sold in thefourth quarter of 2016, principally due to the transition to processing lower grade stockpiled ore. While unit processingcosts declined as the pre-concentration circuit was idled, the transition to processing stockpiles added re-handling costsand stockpile inventory costs of approximately $2.00 per payable ounce that were previously incurred.
AISC of $14.82 per payable ounce of silver sold were higher in the first quarter of 2017 than the $11.47 per payableounce of silver sold in the fourth quarter of 2016 due to higher cash costs per payable ounce of silver sold and highercapital spend per ounce sold.
Mine sales
We recognized sales of 1.4 million ounces of silver in the first quarter of 2017, lower than the 2.6 million ounces in thefourth quarter of 2016, as a result of lower production due to processing of lower grade stockpiles.
Chinchillas project, Argentina
On March 31, 2017, we provided notice to Golden Arrow to exercise our option on the Chinchillas project and forma joint venture comprised of our Pirquitas property and Golden Arrow's Chinchillas property owned on a 75%/25%basis by us and Golden Arrow, respectively. The transaction is expected to close on or before May 31, 2017 and wewill be the operator.
The Chinchillas project provides operating life extension to Pirquitas with a modest capital investment of $81 millionon a 100% basis. With construction expected to begin in the third quarter of 2017, subject to permitting, Chinchillas isexpected to produce 8.4 million ounces of annual silver equivalent production over an eight-year operating life.Chinchillas ore delivery to the Pirquitas mill is expected in the second half of 2018.
A news release on the Chinchillas pre-feasibility study was reported by Golden Arrow on March 31, 2017. The associatedNational Instrument 43-101 technical report will be filed within 45 days. Subject to closing the transaction, we approvedthe development of the project and expect construction to commence in the third quarter of 2017, following the receiptof environmental permits.
Export duties
We entered into a fiscal stability agreement with the Federal Government of Argentina in 1998 for production from thePirquitas mine. In December 2007, the National Customs Authority of Argentina (Dirección Nacional de Aduanas)("Customs") levied an export duty of approximately 10% from concentrate for projects with fiscal stability agreementspre-dating 2002 and Customs has asserted that the Pirquitas mine is subject to this duty. We had previously challengedthe legality of the export duty applied to silver concentrate.
On March 31, 2017, we entered into the tax moratorium system in Argentina to resolve the export duty dispute. Underthe conditions of the moratorium, which converts the export duty liability to ARS, we have agreed to pay approximatelyARS 1 billion with 5% down payment initially and the balance in installments over 60 months. Outstanding ARSamounts are subject to interest at a minimum rate of 1.5% per month.
With our entry into the tax moratorium for resolution of our export duty dispute, we are no longer challenging thelegality of the application of the export duty other than with respect to our right for reimbursement of the $6.6 millionof export duty that we paid. Export duties were removed effective February 12, 2016. At December 31, 2016 we hadaccrued a provision for $67.1 million for unpaid duties but had not accrued for potential interest and penalties.
Entering the tax moratorium resolves the existing liability, and we have recognized the new ARS liability at amortizedcost by discounting expected future payments using a discount rate of 20% per annum over the 60-month period. We
13

paid 5%, or ARS 52.9 million ($3.4 million), when entering the moratorium on March 31, 2017 and have recognizedthe reduction in the liability of $4.3 million within cost of sales.
14

5. SUMMARIZED FINANCIAL RESULTS
The following table sets out selected financial results for each of the eight most recently completed quarters, expressedin thousands of U.S. dollars, except per share amounts:
2017 2016 201531-Mar 31-Dec 30-Sep 30-Jun 31-Mar 31-Dec 30-Sep 30-Jun
$000s $000s $000s $000s $000s $000s $000s $000sRevenue 117,905 127,317 143,381 118,775 101,513 90,592 77,191 95,818
Gold equivalent ounces soldpayable 94,576 113,308 110,618 90,579 87,320 87,924 75,171 81,758
Realized gold price ($/oz) (1) 1,220 1,243 1,331 1,263 1,189 1,084 1,110 1,205
Realized silver price ($/oz) (1) 17.35 17.14 19.64 16.52 14.94 15.00 14.97 16.72
Income (loss) from mineoperations (2) 40,089 27,456 59,190 44,062 23,298 (20,485) (7,396) 16,319Net income (loss) before tax 18,467 18,606 40,999 15,521 5,858 (60,353) (62,556) (3,316)Net income(loss) after tax 15,047 12,132 38,042 12,482 2,300 (66,722) (59,416) (7,327)
Basic earnings (loss) per share 0.13 0.10 0.32 0.13 0.03 (0.83) (0.74) (0.09)Diluted earnings (loss) per share 0.12 0.10 0.31 0.13 0.03 (0.83) (0.74) (0.09)
Cash and cash equivalents 340,585 327,127 277,544 232,619 217,634 211,862 200,017 217,228Total assets 1,484,224 1,438,688 1,454,618 1,432,263 880,501 871,677 954,766 996,549Working capital 688,237 559,934 556,263 530,196 354,999 340,883 373,068 379,767Non-current financial liabilities 223,258 220,054 216,977 213,955 210,994 208,085 205,277 202,517
(1) We report the non-GAAP financial measure of realized metal prices per payable ounce of precious metals sold to manage and evaluateoperating performance at our mines. For a better understanding and a reconciliation of this measure, please refer to “Non-GAAP andAdditional GAAP Financial Measures” in section 11.
(2) The income from mine operations in the quarter ended March 31, 2017, includes a non-cash impact of $4.3 million relating to the resolutionof the export duty claim in Argentina. Income from mine operations for the quarter ended December 31, 2016, includes $5.7 million ofseverance provision and non-cash adjustments to supplies inventory and VAT of $3.7 million related to the Pirquitas mine. Loss frommine operations for the quarters ended December 31, 2015 and September 30, 2015, include $23.6 million and $7.7 million, respectively,of non-cash adjustments to stockpile and supplies inventory at the Pirquitas mine to its net realizable value and severance provision.
The volatility in revenue over the past eight quarters has resulted from variable precious metal prices, which are notunder our control, and sales volumes. There are no significant seasonal fluctuations in the results for the presentedperiods. Metal prices in the first quarter of 2017 weakened slightly compared to the previous quarter but still remainedcomparable to the average prices for the whole of 2016. Metal prices in the second, third and fourth quarters of 2016improved significantly after a period of weaker metal prices in the second half of 2015 and the first quarter of 2016.In the first quarter of 2017 and in 2016, higher income from mine operations is a result of improved metal pricesand increasing volumes of gold and silver sold, the acquisition of the Seabee Gold Operation on May 31, 2016 andoperating improvements at Pirquitas, as well as lower cost of sales per ounce at our Marigold and Pirquitas mines.The income from mine operations in the first quarter of 2017 was impacted by the resolution of the export duty claimin Argentina which resulted in a non-cash reduction to cost of sales of $4.3 million. Income (loss) from mine operationsin the fourth quarter of 2016 and the third and fourth quarters of 2015 were affected by non-cash write-downs ofinventory at the Pirquitas mine to its net realizable value. The income from mine operations in the fourth quarter of2016 and in the fourth quarter of 2015 were also impacted by $5.7 million and $4.7 million, respectively, of severanceprovision related to the Pirquitas mine. Excluding the effect of these inventory write-downs, income from mineoperations followed a similar trend to revenue over the two-year period presented.
15

Net income (loss) before and after income tax has fluctuated significantly over the past eight quarters, heavilyinfluenced by impairments and adjustments. In the fourth and third quarters of 2015, we recorded non-cash impairmentcharges and inventory adjustments totaling $38.7 million and $42.2 million, respectively, against the carrying valueof the Pirquitas mine.
Three months ended March 31, 2017, compared to the three months ended March 31, 2016
Net income for the three months ended March 31, 2017, was $15.0 million ($0.13 per share), compared to $2.3million ($0.03 per share) in the same period of 2016. In the first quarter of 2017, we recognized a non-cash adjustmentto cost of sales due to the resolution of the export duty claim in Argentina of $4.3 million. The following is a summaryand discussion of the other significant components of income and expenses recorded during the current quartercompared to the same period in the prior year.
Revenue
Realized silver and gold price is a non-GAAP financial measure. Please see the discussion under "Non-GAAP andAdditional GAAP Financial Measures" in section 11.
In the three months ended March 31, 2017, we recognized total revenues of $117.9 million, compared to $101.5million recognized in the comparative period of 2016, with the increase due to the impact of the Seabee GoldOperation, which we acquired on May 31, 2016, and higher gold and silver prices, which were partially offset bylower sales from the Pirquitas mine.
▪ At the Marigold mine, we recognized revenues of $63.8 million in the first quarter of 2017 from the sale of52,500 payable ounces of gold at an average realized price of $1,214 per ounce. In the first quarter of 2016,revenues were $57.7 million from the sale of 48,500 payable ounces of gold at an average realized gold priceof $1,189 per ounce.
▪ At the Seabee Gold Operation, we recognized revenues of $27.6 million in the first quarter of 2017 fromthe sale of 22,400 payable ounces of gold, at an average realized gold price of $1,233 per ounce. We did notown the Seabee Gold Operation in the comparative period.
▪ At the Pirquitas mine, we recognized revenues of $26.5 million in the first quarter of 2017, lower than the$43.8 million in the same period in 2016. Sales volumes were lower as the mine ceased to operate January2017 and we are currently processing lower grade stockpiled ore. We sold 1.4 million payable ounces ofsilver in the first quarter of 2017, significantly lower than the 3.1 million payable ounces sold in thecomparative period. Lower sales were partially offset by higher realized silver prices in the first quarter of2017, which averaged $17.35 per ounce, excluding the impact of period-end price adjustments, comparedto $14.94 per ounce in the same period in 2016. In addition, we had a positive mark to market increase of$4.9 million in the first quarter of 2017, compared to $1.9 million in the first quarter of 2016. At March 31,2017, sales contracts containing 1.4 million ounces of silver were subject to final price settlement over thenext four months.
Cost of sales
Cost of sales for the first quarter of 2017 was $77.8 million, compared to $78.2 million in the first quarter of 2016.Consolidated cost of sales was lower in the current period as the addition of the Seabee Gold Operation was morethan offset by a significant reduction at the Pirquitas mine due to lower sales and the impact of the export dutyresolution.
▪ At the Marigold mine, cost of sales in the first quarter of 2017 was $42.4 million, generating income frommine operations of $21.3 million, equal to a gross margin of 33.4%. This compares to cost of sales of $46.5million in the first quarter of 2016, generating an income from mine operations of $11.2 million and a gross
16
margin of 19.4%. The increase in the gross margin is partly due to higher realized prices of gold sold in thefirst quarter of 2017 and by lower cost of sales per ounce of gold sold.
▪ At the Seabee Gold Operation, cost of sales in the first quarter was $22.6 million, generating income fromoperations of $5.0 million, equal to a gross margin of 18.1%. We did not own the operation in the comparativeperiod.
▪ At the Pirquitas mine, cost of sales in the first quarter of 2017 was $12.8 million, generating income frommine operations of $13.8 million, equal to a gross margin of 52.1%. The cost of sales in the first quarter of2017 was positively impacted by a non-cash impact of $4.3 million of export duties following the resolutionof the export duty claim in Argentina. Excluding the effect of this non-cash impact, the gross margin was35.8%. This compared to cost of sales of $31.7 million in the first quarter of 2016, generating an incomefrom mine operations of $12.1 million and a gross margin of 27.6%. The improved margin in the currentquarter was mainly due to significantly higher realized prices and the mark-to-market adjustments to revenue,partially offset by higher cost of inventory in the first quarter of 2017 compared to the first quarter of 2016.
Other operating costs
General and administrative expenses in the three months ended March 31, 2017, of $7.9 million were higher thanthe $4.2 million recorded in the three months ended March 31, 2016. This was due to cash-settled share-basedcompensation expense of $3.7 million in the first quarter of 2017 compared to an expense of $0.2 million in the threemonths ended March 31, 2016, due to stronger relative and absolute share price performance.
Exploration and evaluation costs of $7.4 million for the three months ended March 31, 2017, were higher than the$4.5 million for the three months ended March 31, 2016. Expenditures in the first quarter of 2017 related to greenfieldexploration work performed at the Seabee Gold Operation and $3.5 million was due to the re-measurement of thereclamation liability at the Pirquitas mine. In the first quarter of 2016, exploration and evaluation work related mainlyto funding the drilling and evaluation work at the Chinchillas project.
Non-operating items
During the first quarter of 2017, we recorded interest expense and other finance costs of $6.6 million compared to$6.6 million recorded in the first quarter of 2016. In each period, the interest expense is mainly attributable to our2.875% convertible senior notes (the “Notes”).
We recorded a foreign exchange gain for the three months ended March 31, 2017, of $0.6 million compared with aloss of $3.4 million in the three months ended March 31, 2016. Our main foreign exchange exposures are related tonet monetary assets denominated in Argentine pesos and Canadian dollars. During the three months ended March 31,2017, this gain resulted mainly from a strengthening Argentine peso while the Canadian dollar was unchanged againstthe U.S. dollar.
Taxation
For the three months ended March 31, 2017, we recorded an income tax expense of $3.4 million compared to $3.6million in the three months ended March 31, 2016. The total income tax expense in the quarter consists of a currenttax expense of $2.3 million and a deferred tax expense of $1.2 million. Income tax expense is a result of profitableoperations at the Marigold and Seabee mines and concentrate and gold sales activities in Canada. Offsets to theincome tax expense items include the general and administrative expenses in Canada.
The tax expense of $3.6 million for the three months ended March 31, 2016, was the result of profitable operationsat the Marigold mine, and concentrate and gold sales activities in Canada.
17

Other comprehensive income
During the first quarter of 2017, we recognized a gain of $35.6 million on marketable securities, compared to a gainof $6.2 million in the first quarter of 2016, primarily driven by valuation movements in our investment in PretiumResources Inc. ("Pretium").
18
6. LIQUIDITY
At March 31, 2017, we had $340.6 million of cash and cash equivalents, an increase of $13.5 million fromDecember 31, 2016. Our cash flows from operations were $30.6 million, while $8.7 million was invested in plantand equipment, $6.7 million was invested in capitalized stripping at the Marigold mine and $2.5 million was investedin capitalized development at the Seabee Gold Operation, which will benefit future periods.
At March 31, 2017, compared to December 31, 2016, our working capital position increased by $128.3 million to$688.2 million from $559.9 million, mainly due to the appreciation in value of our marketable securities, positivecash flows from operations and the restructuring of the export duty liability. We manage our liquidity position withthe objectives of ensuring sufficient funds available to meet planned operating requirements and providing supportto fund strategic growth initiatives. Our cash balance at March 31, 2017, along with projected operating cash flows,are expected to be sufficient to fund planned activities over the next twelve months from the date of this MD&A. Wecontinue to focus on capital allocation and our cost reduction strategy while also implementing various optimizationactivities at our operations to improve the cash generating capacity of each mine.
Of our cash and cash equivalents balance, $332.7 million was held in Canada and the United States. At March 31,2017, we held $6.6 million cash in Argentina. All cash is invested in short-term investments or high interest savingsaccounts under our investment policy with maturities of 90 days or less providing us with sufficient liquidity to meetour foreseeable corporate needs.
7. CAPITAL RESOURCES
Our objectives when managing capital are:
▪ to safeguard our ability to continue as a going concern in order to develop and operate our current projectsand pursue strategic growth initiatives;
▪ to maintain a flexible capital structure which lowers the cost of capital.
In assessing our capital structure, we include in our assessment the components of shareholders’ equity and our Notes.In order to facilitate the management of capital requirements, we prepare annual expenditure budgets and continuouslymonitor and review actual and forecasted cash flows. The annual and updated budgets are monitored and approvedby the Board of Directors.
To maintain or adjust the capital structure, we may, from time to time, issue new shares, issue new debt, repay debtor dispose of non-core assets. We expect our current capital resources will be sufficient to carry out our explorationplans and support operations through the current operating period.
As of March 31, 2017, we were in compliance with externally-imposed financial covenants in relation to our $75million senior secured revolving credit facility. Our Notes do not contain any financial covenants.
As at March 31, 2017, we had 119,487,666 common shares and 3,327,386 stock options outstanding which areexercisable into common shares at exercise prices ranging between C$2.54 and C$28.78 per share.
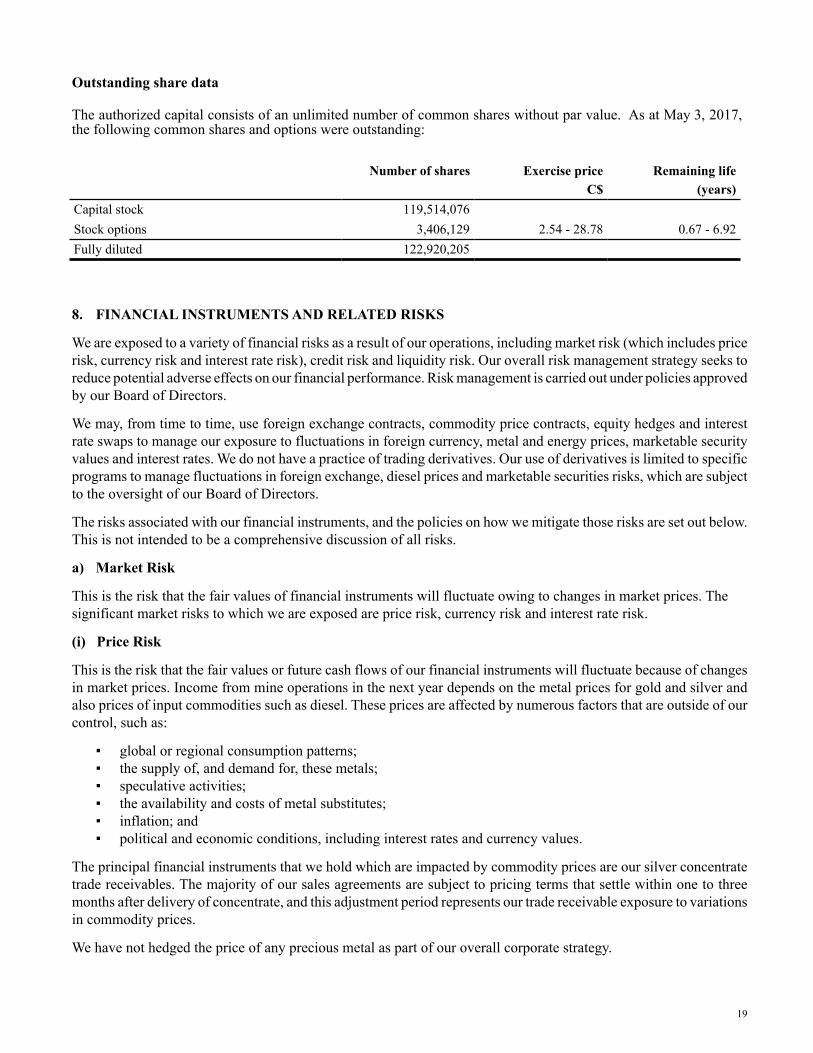
Outstanding share data
The authorized capital consists of an unlimited number of common shares without par value. As at May 3, 2017,the following common shares and options were outstanding:
Number of shares Exercise price Remaining lifeC$ (years)
Capital stock 119,514,076Stock options 3,406,129 2.54 - 28.78 0.67 - 6.92Fully diluted 122,920,205
19
8. FINANCIAL INSTRUMENTS AND RELATED RISKS
We are exposed to a variety of financial risks as a result of our operations, including market risk (which includes pricerisk, currency risk and interest rate risk), credit risk and liquidity risk. Our overall risk management strategy seeks toreduce potential adverse effects on our financial performance. Risk management is carried out under policies approvedby our Board of Directors.
We may, from time to time, use foreign exchange contracts, commodity price contracts, equity hedges and interestrate swaps to manage our exposure to fluctuations in foreign currency, metal and energy prices, marketable securityvalues and interest rates. We do not have a practice of trading derivatives. Our use of derivatives is limited to specificprograms to manage fluctuations in foreign exchange, diesel prices and marketable securities risks, which are subjectto the oversight of our Board of Directors.
The risks associated with our financial instruments, and the policies on how we mitigate those risks are set out below.This is not intended to be a comprehensive discussion of all risks.
a) Market Risk
This is the risk that the fair values of financial instruments will fluctuate owing to changes in market prices. Thesignificant market risks to which we are exposed are price risk, currency risk and interest rate risk.
(i) Price Risk
This is the risk that the fair values or future cash flows of our financial instruments will fluctuate because of changesin market prices. Income from mine operations in the next year depends on the metal prices for gold and silver andalso prices of input commodities such as diesel. These prices are affected by numerous factors that are outside of ourcontrol, such as:
▪ global or regional consumption patterns;▪ the supply of, and demand for, these metals;▪ speculative activities;▪ the availability and costs of metal substitutes;▪ inflation; and▪ political and economic conditions, including interest rates and currency values.
The principal financial instruments that we hold which are impacted by commodity prices are our silver concentratetrade receivables. The majority of our sales agreements are subject to pricing terms that settle within one to threemonths after delivery of concentrate, and this adjustment period represents our trade receivable exposure to variationsin commodity prices.
We have not hedged the price of any precious metal as part of our overall corporate strategy.

We hedge a portion of our diesel consumption at the Marigold mine with the objective of securing future costs duringthis period of lower prices. We executed swap and option contracts under a risk management policy approved by ourBoard of Directors. In addition, due to the ice road supply at the Seabee Gold Operation, we purchase annualconsumable supplies in advance at prices, which are generally fixed at time of purchase, not during period of use.
There has been no significant change in our objectives and policies for managing this risk and no significant changein our exposure to this risk during the three months ended March 31, 2017.
(ii) Currency Risk
Currency risk is the risk that the fair values or future cash flows of our financial instruments and other assets andliabilities will fluctuate because of changes in foreign currency rates. Our financial instruments are exposed to currencyrisk where those instruments are denominated in currencies that are not the same as the functional currency of theentity that holds them; exchange gains and losses in these situations impact earnings.
We monitor and manage this risk with the objective of ensuring our group-wide exposure to negative fluctuations incurrencies against the U.S. dollar is managed. There has been no significant change in our objectives and policies formanaging this risk and no significant change in our exposure to this risk during the three months ended March 31,2017, except for the settlement of the export duty claim which resulted in a U.S. dollar liability being converted intoan ARS liability. This materially impacts our exposure to ARS but if the ARS devalues against the U.S. dollar, thiswill reduce our net liability in U.S. dollar terms.
(iii) Interest Rate Risk
Interest rate risk is the risk that the fair values or future cash flows of our financial instruments will fluctuate becauseof changes in market interest rates. Interest rate risk arises from the interest rate impact on our cash and cash equivalentsbecause these are the only financial instruments we hold that are impacted by interest based on variable market interestrates. The Notes have a fixed interest rate and are not exposed to fluctuations in interest rates. A change in interestrates would impact the fair value of the Notes, but because we record the Notes at amortized cost, there would be noimpact on our financial results. We monitor our exposure to interest rates closely and have not entered into anyderivative contracts to manage our risk.
There has been no significant change in our objectives and policies for managing this risk and no significant changein our exposure to this risk during the three months ended March 31, 2017, except that, under the tax moratorium inArgentina, the outstanding liability incurs interest based on variable rates with a floor of 1.5% per month. At thecurrent time, we consider the rate 1.5% to be unlikely to change in the near future.
b) Credit Risk
Credit risk is the risk that a third party might fail to discharge its obligations under the terms of a financial contract.Our credit risk is limited to the following instruments:
Credit risk related to financial institutions and cash deposits Under our investment policy, investments are madeonly in highly-rated financial institutions and corporate and government securities. We diversify our holdings andconsider the risk of loss associated with investments to be low.
Credit risk related to trade receivables We are exposed to credit risk through our trade receivables on concentratesales, which are principally with internationally-recognized counterparties. Payments of receivables are scheduled,routine and received within a contractually agreed time frame. We manage this risk by requiring provisional paymentsof at least 75% of the value of the concentrate shipped and through utilizing multiple counterparties.
Credit risk related to other financial assets Our credit risk with respect to other financial assets includes deferredconsideration following the sales of various mineral properties. We have security related to these payments in theevent of default.
We also have credit risk through our significant VAT receivables balance that is collectible from the government ofArgentina. The balance is expected to be recoverable in full, however due to legislative rules and the complex collection
20
process, a significant portion of the asset is classified as non-current until government approval of the recovery claimis approved.
c) Liquidity Risk
Liquidity risk is the risk that we will not be able to meet our obligations under our financial instruments as they falldue. We manage our liquidity risk through a rigorous planning and budgeting process, which is reviewed and updatedon a regular basis, to help determine the funding requirements to support our current operations, expansion anddevelopment plans, and by managing our capital structure. Our objective is to ensure that there are sufficient committedfinancial resources to meet our business requirements for a minimum of twelve months.
A detailed discussion of our liquidity position as at March 31, 2017, is included in section 6.
21
9. OTHER RISKS AND UNCERTAINTIES
We are subject to a number of risks and uncertainties, each of which could have an adverse effect on our operatingresults, business prospects or financial position.
For a comprehensive list of the risks and uncertainties affecting our business, please refer to the section entitled "RiskFactors" in our most recent Annual Information Form, which is available at www.sedar.com, and our most recentAnnual Report on Form 40-F, which is available on the EDGAR section of the SEC website at www.sec.gov.
10. RELATED PARTY TRANSACTIONS
We did not enter into any related party transactions other than normal course compensation arrangements with seniormanagement and our Board of Directors during the three months ended March 31, 2017.

11. NON-GAAP AND ADDITIONAL GAAP FINANCIAL MEASURES
The non-GAAP financial measures presented in the MD&A do not have any standardized meaning prescribed byIFRS and are therefore unlikely to be directly comparable to similar measures presented by other issuers. The datapresented is intended to provide additional information and should not be considered in isolation or as a substitutefor measures of performance prepared in accordance with IFRS. These non-GAAP measures should be read inconjunction with our consolidated financial statements.
Additional GAAP measures are line items, headings or subtotals that are relevant to an understanding of the financialstatements but are not mandated by IFRS.
Non-GAAP financial measures - Cash costs and AISC per payable ounce of precious metals sold
We use the non-GAAP financial measures of cash costs and AISC per payable ounce of precious metals sold tomanage and evaluate operating performance. We believe that, in addition to conventional measures prepared inaccordance with GAAP, certain investors use this information to evaluate our performance and ability to generatecash flows. Cash costs per ounce metrics, net of by-product credits, are also used in our internal decision makingprocesses. Accordingly, the data presented is intended to provide additional information and should not be consideredin isolation or as a substitute for measures of performance prepared in accordance with GAAP.
In line with the guidance published by the World Gold Council, AISC reflect the full cost of operating our consolidatedbusiness as they include the cost of replacing ounces through exploration, cost of sustaining capital and general andadministrative expenses. Expansionary capital is not included in this measure.
The following table provides a reconciliation of our condensed consolidated interim statements of income (loss) tocash costs and AISC per payable ounce of precious metals sold for the three month periods indicated below:
22

Q1 Q4 Q3 Q2 Q12017 2016 2016 2016 2016
$000s $000s $000s $000s $000sMarigold mineCost of sales (A) 42,435 48,399 39,675 41,556 46,515Add: Treatment and refining costs 36 45 59 21 61Less: By-product revenue (10) (9) (14) (9) (9)Less: Depreciation, depletion and amortization (11,736) (12,569) (9,747) (10,321) (11,687)Cash costs 30,725 35,866 29,973 31,247 34,880
Sustaining capital expenditure 3,043 3,271 8,310 9,660 3,233Exploration and evaluation costs (sustaining) 1,024 1,276 1,145 1,597 1,102Reclamation cost 429 604 433 535 158
Capitalized stripping costs 6,745 10,171 13,787 7,231 1,435AISC 41,966 51,188 53,648 50,270 40,808
Seabee Gold Operation (1)
Cost of sales (B) 22,614 18,311 25,088 13,221 —Add: Treatment and refining costs 37 20 30 6 —Less: By-product revenue (13) — — (28) —Less: Adjustment for fair value at acquisition — — (2,283) (5,708) —Less: Depreciation, depletion and amortization (9,775) (8,077) (8,365) — —Cash costs 12,863 10,254 14,470 7,491 —
Sustaining capital expenditure 4,670 1,010 579 337 —Capitalized development 2,514 2,432 2,104 803Exploration and evaluation costs (sustaining) 1,953 598 1,206 117 —Reclamation cost 78 48 48 16 —AISC 22,078 14,342 18,407 8,764 —
Pirquitas mineCost of sales (C) 12,767 33,151 19,428 19,936 31,700Add: Treatment and refining costs 3,349 4,681 5,355 4,454 5,555Less: By-product revenue (56) — — (503) —Less: Inventory NRV write-down — (3,701) — — —Less: Restructuring costs (397) (5,692) — — —Less: Depreciation, depletion and amortization (2,426) (3,713) (855) (2,070) (8,165)Less: Export duties on silver concentrate — — — — (1,497)Add: Impact of silver export duty resolution 4,303 — — — —Cash costs 17,540 24,726 23,928 21,817 27,593Sustaining capital expenditure 2,261 3,467 3,158 2,057 1,578Exploration and evaluation costs (sustaining) — — — — —Reclamation cost 705 770 743 725 707AISC 20,506 28,963 27,829 24,599 29,878
Cost of sales, per consolidated statement ofincome (loss) (A+B+C) 77,816 99,861 84,191 74,713 78,215
AISC (total for all mines) 84,550 94,493 99,884 83,633 70,686General and administrative costs 7,890 1,203 4,061 12,466 4,361
Consolidated AISC 92,440 95,696 103,945 96,099 75,047
23

(1) The data presented for the Seabee Gold Operation is for the period from May 31, 2016, to March 31, 2017, the period for which we wereentitled to all economic benefits of the Seabee Gold Operation following our acquisition of Claude Resources.
(2) Gold equivalent ounces have been established using realized gold and silver prices in the period and applied to the recovered metal contentof the gold and silver sold by the Marigold mine, the Seabee Gold Operation and the Pirquitas mine. We have not included zinc as it isconsidered a by-product.
Non-GAAP financial measures - realized metal prices
Average realized price per ounce of silver sold in each reporting period excludes the period end price adjustmentsand final settlements on concentrate shipments. The price adjustments do not apply to gold bullion sales.
Non-GAAP financial measures - adjusted net income (loss)
We have included the non-GAAP financial performance measures of adjusted income (loss) before tax, adjustedincome tax (expense), adjusted net income (loss) and adjusted basic earnings (loss) per share. Adjusted net income(loss) excludes gains/losses and other costs incurred for acquisitions and disposals of mineral properties andexploration and evaluation assets, impairment charges, unrealized and realized gains/losses on financial instruments,significant non-cash foreign exchange impacts as well as other significant non-cash, non-recurring items. We excludethese items from net income (loss) to provide a measure which allows investors to evaluate the operating results ofour underlying core operations and our ability to generate liquidity through operating cash flow to fund workingcapital requirements, future capital expenditures and service outstanding debt. We believe that, in addition toconventional measures prepared in accordance with GAAP, certain investors may use this information to evaluateour performance. Accordingly, the data presented is intended to provide additional information and should not beconsidered in isolation or as a substitute for measures of performance prepared in accordance with GAAP.
Q1 Q4 Q3 Q2 Q12017 2016 2016 2016 2016
$000s $000s $000s $000s $000sMarigold minePayable ounces of gold sold (oz) 52,500 61,279 47,100 47,100 48,500Cash costs per gold ounce sold ($/oz) 585 585 636 663 719AISC per gold ounce sold ($/oz) 799 835 1,139 1,067 841
Seabee Gold Operation (1)
Payable ounces of gold sold (oz) 22,400 17,220 21,900 11,300 —Cash costs per gold ounce sold ($/oz) 574 595 661 663 —AISC per gold ounce sold ($/oz) 986 833 841 776 —
Pirquitas minePayable ounces of silver sold (oz) 1,383,541 2,524,343 2,820,419 2,460,205 3,089,476Cash costs per silver ounce sold ($/oz) 12.68 9.80 8.48 8.87 8.93AISC per silver ounce sold ($/oz) 14.82 11.47 9.87 10.00 9.67
Realized gold price ($/oz) 1,220 1,243 1,331 1,263 1,189Realized silver price ($/oz) 17.35 17.14 19.64 16.52 14.94
Precious metals equivalencyEquivalent payable gold ounces sold (2) 94,576 113,308 110,618 90,579 87,320Cash costs per equivalent gold ounce sold ($/oz) 646 625 618 669 715Consolidated AISC per equivalent gold ouncesold ($/oz) 977 845 940 1,061 859
24

The following table provides a reconciliation of adjusted net income (loss) to the consolidated financial statements:
Three months ended March 312017 2016
$000s $000s
Net income before tax per consolidated statement of income 18,467 5,858Adjusted for:Business acquisition costs — 602Non-cash finance income and expense 5,742 3,794Effect of resolution of export duty settlement (4,303) —Effect of revaluation of reclamation provision 3,578 —Restructuring costs 397 —Non-cash foreign exchange (gain) loss (515) 2,344Other items (205) (17)Adjusted income before tax 23,161 12,581
Income tax expense per consolidated statement of income (3,420) (3,558)
Adjusted for:Other items — —Adjusted income tax expense (3,420) (3,558)
Adjusted net income 19,741 9,023
Weighted average shares outstanding (000's), per consolidated statement of income 119,425 80,826
Adjusted basic income per share ($) 0.17 0.11
Additional GAAP financial measures - income (loss) from mine operations
Income (loss) from mine operations represents the amount of revenues less mining and processing expenses, exportduties, royalties, and depreciation and depletion expense. It also includes non-cash adjustments to inventories, ourexport duty settlement, VAT and restructuring provisions, where applicable.
Additional GAAP financial measures - gross margin from mine operations
Gross margin from mine operations is the difference between revenue and cost of sales, divided by revenue, expressedas a percentage.
Additional GAAP financial measures - operating income (loss)
Operating income (loss) represents the income from mine operations less operating costs, such as general andadministrative expenses, exploration and evaluation costs and impairment charges. This measure excludes foreignexchange, interest and other non-operating costs.
25
12. CRITICAL ACCOUNTING POLICIES AND ESTIMATES
Basis of preparation and accounting policies
Our condensed consolidated interim financial statements have been prepared in accordance with IFRS as issued bythe IASB applicable to the preparation of interim financial statements, including IAS 34, Interim Financial Reporting.The comparative information has also been prepared on this basis.

The accounting policies applied in the preparation of our condensed consolidated interim financial statements areconsistent with those applied and disclosed in our audited consolidated financial statements for the year endedDecember 31, 2016.
Pronouncements affecting our financial statements presentation or disclosureNo new or amended IFRS pronouncements were adopted during the three months ended March 31, 2017.
Critical Accounting Estimates and Judgments
The preparation of financial statements in conformity with IFRS requires the use of judgments and/or estimates thataffect the amounts reported and disclosed in the consolidated financial statements and related notes. These judgmentsand estimates are based on management’s best knowledge of the relevant facts and circumstances, having regard toprevious experience, but actual results may differ materially from the amounts included in the financial statements.The critical judgments and estimates applied in the preparation of our unaudited condensed consolidated interimfinancial statements for the three months ended March 31, 2017, are consistent with those applied and disclosed inNote 2(u) to our audited consolidated financial statements for the year ended December 31, 2016, other than thosediscussed below.
(i) Export duties on Pirquitas mine
Following the resolution of the export duty claim, we have measured the resulting liability at amortized cost. Thisrequired an estimate of the most appropriate discount rate to use for such an ARS liability.
(ii) Mine life extension of the Pirquitas mine
Following our exercise of the option to proceed with forming the Pirquitas / Chinchillas joint venture, we have re-assessed our estimates for: (a) the carrying value of plant assets that were previously impaired; (b) depreciable livesof remaining plant assets; (c) value added tax collection; (d) supplies inventory usage; and (e) timing of certain cashflows for our close down and restoration provision. The result of these changes in estimates was a reduction to ourclose down and restoration provision of $5.4 million.
26
13. FUTURE ACCOUNTING CHANGES
The below new standards have been issued but are not yet effective:
Revenue from contracts with customers
The IASB has replaced IAS 18, Revenue in its entirety with IFRS 15, Revenue from Contracts with Customers (“IFRS15”), which covers principles that an entity shall apply to report useful information to users of financial statementsabout the nature, amount, timing, and uncertainty of revenue and cash flows arising from a contract with a customer.In September 2015, the IASB deferred the effective date of the standard to annual reporting periods beginning on orafter January 1, 2018, with earlier application permitted. We will not be early adopting IFRS 15. We are currentlyassessing the impact on our consolidated financial statements. We have identified two potential areas of impact:
• Gold doré or bullion sales – we do not anticipate these sales to be significantly affected by IFRS 15
• Concentrate sales – we do not anticipate these sales or the associated provisional pricing adjustments to besignificantly affected by IFRS 15
We will continue to assess and implement the new revenue recognition policy and any related impact on our internalcontrols throughout 2017.
Leases
The IASB has replaced IAS 17, Leases in its entirety with IFRS 16, Leases (“IFRS 16”), which requires lessees torecognize assets and liabilities for most leases. Application of the standard is mandatory for annual reporting periodsbeginning on or after January 1, 2019, with earlier application permitted, provided IFRS 15 has been applied or is

applied at the same date as IFRS 16. We are currently assessing the impact on our consolidated financial statementsalong with timing of our adoption of IFRS 16. We expect that IFRS 16 will result in an increase in assets and liabilitiesas fewer leases will be expensed as payments are made. We expect an increase in depreciation and accretion expensesand also an increase in cash flow from operating activities as these lease payments will be recorded as financingoutflows in our cash flow statement.
There are no other IFRS or International Financial Reporting Interpretations Committee interpretations that are notyet effective that would be expected to have a material impact on our consolidated financial statements.
27
14. INTERNAL CONTROL OVER FINANCIAL REPORTING AND DISCLOSURE CONTROLS ANDPROCEDURES
Management is responsible for establishing and maintaining adequate internal control over financial reporting anddisclosure controls and procedures. Any system of internal control over financial reporting, no matter how welldesigned, has inherent limitations. Therefore, even those systems determined to be effective can provide onlyreasonable assurance with respect to financial statement preparation and presentation. There have been no changesin our internal control over financial reporting or disclosure controls and procedures during the three months endedMarch 31, 2017, that have materially affected, or are reasonably likely to affect, our internal control over financialreporting.
The scope of our internal control over financial reporting or disclosure controls and procedures for the period coveredby this report excludes the Seabee Gold Operation. We completed the acquisition of the Seabee Gold Operation onMay 31, 2016, and proceeded to integrate the operations and administration of the acquired operation immediatelythereafter. Although the Seabee Gold Operation is currently subject to similar controls as our other operations forthe consolidation and financial reporting of period-end results, we will formally expand our internal control overfinancial reporting and our disclosure controls and procedures to include the Seabee Gold Operation in the secondquarter of 2017. The Seabee Gold Operation represents $329.4 million of net assets (34%), $27.6 million ofconsolidated revenues (23%) for the three months ended March 31, 2017, and $2.8 million of net earnings as at andfor the three months ended March 31, 2017.
15. CAUTIONARY NOTES REGARDING FORWARD-LOOKING STATEMENTS AND MINERALRESERVES AND MINERAL RESOURCES ESTIMATES
This MD&A contains forward-looking information within the meaning of Canadian securities laws and forward-looking statements within the meaning of the U.S. Private Securities Litigation Reform Act of 1995 (collectively,“forward-looking statements”). All statements, other than statements of historical fact, are forward-lookingstatements.
Generally, forward-looking statements can be identified by the use of words or phrases such as “expects,”“anticipates,” “plans,” “projects,” “estimates,” “assumes,” “intends,” “strategy,” “goals,” “objectives,” “potential,”“believes,” or variations thereof, or stating that certain actions, events or results “may,” “could,” “would,” “might”or “will” be taken, occur or be achieved, or the negative of any of these terms or similar expressions. The forward-looking statements in this MD&A relate to, among other things: future production of gold, silver and other metals;future costs of inventory, and cash costs, total costs and AISC per payable ounce of gold, silver and other metalssold; expected exploration and development expenditures; the prices of gold, silver and other metals; the timing ofstockpile processing at the Pirquitas mine; the effects of laws, regulations and government policies affecting ouroperations or potential future operations; our exposure to fluctuations in ARS and interest rates on the liability underthe tax moratorium; the expected devaluation of the Argentine Peso; future successful development of our projects;anticipated closing of our joint venture with Golden Arrow; expected timing of construction of and ore delivery fromthe Chinchillas project; expected production from Chinchillas; the sufficiency of our current working capital,anticipated operating cash flow or our ability to raise necessary funds; estimated production rates for gold, silverand other metals produced by us; timing of production and the cash costs and total costs of production at the Marigoldmine, the Seabee Gold Operation and the Pirquitas mine; the anticipated timing of upgrades to the ventilation system

at the Santoy mine; the estimated cost of sustaining capital; ongoing or future development plans and capitalreplacement, improvement or remediation programs; the timing for discontinuing zinc data; the estimates of expectedor anticipated economic returns from our mining projects, including future sales of metals, concentrate or otherproducts produced by us; our ability to expand Mineral Resources and convert Mineral Resources into MineralReserves; and our plans and expectations for our properties and operations.
These forward-looking statements are subject to a variety of known and unknown risks, uncertainties and otherfactors that could cause actual events or results to differ from those expressed or implied, including, without limitation,the following: uncertainty of production, development plans and cost estimates for the Marigold mine, the SeabeeGold Operation, the Pirquitas mine and our projects; our ability to replace Mineral Reserves; our ability to completeand successfully integrate Golden Arrow’s Chinchillas project, on a joint venture basis, into our current operations;commodity price fluctuations; political or economic instability and unexpected regulatory changes; currency andinterest rate fluctuations; the possibility of future losses; general economic conditions; fully realizing the value ofour shareholdings in Pretium Resources Inc. and our other marketable securities, due to changes in price, liquidityor disposal cost of such marketable securities; counterparty and market risks related to the sale of our concentrateand metals; uncertainty in the accuracy of Mineral Reserves and Mineral Resources estimates and in our ability toextract mineralization profitably; differences in U.S. and Canadian practices for reporting Mineral Reserves andMineral Resources; lack of suitable infrastructure or damage to existing infrastructure; future development risks,including start-up delays and cost overruns; our ability to obtain adequate financing for further exploration anddevelopment programs and opportunities; uncertainty in acquiring additional commercially mineable mineral rights;delays in obtaining or failure to obtain governmental permits, or non-compliance with our permits; our ability toattract and retain qualified personnel and management; potential labour unrest, including labour actions by ourunionized employees at the Pirquitas mine; the impact of governmental regulations, including health, safety andenvironmental regulations, including increased costs and restrictions on operations due to compliance with suchregulations; reclamation and closure requirements for our mineral properties; social and economic changes followingclosure of a mine, including the anticipated closure of the Pirquitas mine in late 2017 or early 2018, may lead toadverse impacts and unrest; unpredictable risks and hazards related to the development and operation of a mine ormineral property that are beyond our control; indigenous peoples’ title claims and rights to consultation andaccommodation may affect our existing operations as well as development projects and future acquisitions;assessments by taxation authorities in multiple jurisdictions; recoverability of VAT and significant delays in thecollection process in Argentina; claims and legal proceedings, including adverse rulings in litigation against us and/or our directors or officers; compliance with anti-corruption laws and internal controls, and increased regulatorycompliance costs; complying with emerging climate change regulations and the impact of climate change; fullyrealizing our interest in deferred consideration received in connection with recent divestitures; uncertainties relatedto title to our mineral properties and the ability to obtain surface rights; the sufficiency of our insurance coverage;civil disobedience in the countries where our mineral properties are located; operational safety and security risks;actions required to be taken by us under human rights law; competition in the mining industry for mineral properties;our ability to complete and successfully integrate an announced acquisition; an event of default under our Notes maysignificantly reduce our liquidity and adversely affect our business; failure to meet covenants under our senior securedrevolving credit facility; conflicts of interest that could arise from certain of our directors’ and officers’ involvementwith other natural resource companies; information systems security threats; and those other various risks anduncertainties identified under the heading “Risk Factors” in our most recent Annual Information Form filed with theCanadian securities regulatory authorities and included in our most recent Annual Report on Form 40-F filed withthe SEC.
This list is not exhaustive of the factors that may affect any of our forward-looking statements. Our forward-lookingstatements are based on what our management considers to be reasonable assumptions, beliefs, expectations andopinions based on the information currently available to it. Assumptions have been made regarding, among otherthings, our ability to carry on our exploration and development activities, our ability to meet our obligations underour property agreements, the timing and results of drilling programs, the discovery of Mineral Resources and MineralReserves on our mineral properties, the timely receipt of required approvals and permits, including those approvalsand permits required for successful project permitting, construction and operation of our projects, the price of theminerals we produce, the costs of operating and exploration expenditures, our ability to operate in a safe, efficient
28
and effective manner, our ability to obtain financing as and when required and on reasonable terms, and our abilityto continue operating the Marigold mine, the Seabee Gold Operation and the Pirquitas mine. You are cautioned thatthe foregoing list is not exhaustive of all factors and assumptions which may have been used. We cannot assure youthat actual events, performance or results will be consistent with these forward-looking statements, and management’sassumptions may prove to be incorrect. Our forward-looking statements reflect current expectations regarding futureevents and operating performance and speak only as of the date hereof and we do not assume any obligation to updateforward-looking statements if circumstances or management’s beliefs, expectations or opinions should change otherthan as required by applicable law. For the reasons set forth above, you should not place undue reliance on forward-looking statements.
Qualified Persons
The scientific and technical information contained in this MD&A relating to the Marigold mine has been reviewedand approved by Thomas Rice and James N. Carver, each of whom is a SME Registered Member and a QualifiedPerson under National Instrument 43-101 - Standards of Disclosure for Mineral Projects (“NI 43-101”). Mr. Riceis our Technical Services Manager and Mr. Carver is our Chief Geologist at the Marigold mine. The scientific andtechnical data contained in this MD&A relating to the Seabee Gold Operation has been reviewed and approved byCameron Chapman, P.Eng., and Jeffrey Kulas, P. Geo., each of whom is a Qualified Person under NI 43-101.Mr. Chapman is our General Manager and Mr. Kulas is our Manager Geology, Mining Operations at theSeabee Gold Operation. The scientific and technical information contained in this MD&A relating to the Pirquitasmine has been reviewed and approved by Bruce Butcher, P.Eng., and F. Carl Edmunds, P. Geo., each of whom is aQualified Person under NI 43-101. Mr. Butcher is our Director, Mine Planning.
Cautionary Note Regarding Mineral Reserves and Mineral Resources Estimates
This MD&A includes Mineral Reserves and Mineral Resources classification terms that comply with reportingstandards in Canada and the Mineral Reserves and the Mineral Resources estimates are made in accordance with NI43-101. NI 43-101 is a rule developed by the Canadian Securities Administrators that establishes standards for allpublic disclosure an issuer makes of scientific and technical information concerning mineral projects. These standardsdiffer significantly from the requirements of the SEC set out in SEC Industry Guide 7. Consequently, Mineral Reservesand Mineral Resources information included in this MD&A is not comparable to similar information that wouldgenerally be disclosed by domestic U.S. reporting companies subject to the reporting and disclosure requirementsof the SEC. Under SEC standards, mineralization may not be classified as a “reserve” unless the determination hasbeen made that the mineralization could be economically produced or extracted at the time the reserve determinationis made.
In addition, the SEC’s disclosure standards normally do not permit the inclusion of information concerning “MeasuredMineral Resources,” “Indicated Mineral Resources” or “Inferred Mineral Resources” or other descriptions of theamount of mineralization in mineral deposits that do not constitute “reserves” by U.S. standards in documents filedwith the SEC. U.S. investors should understand that “Inferred Mineral Resources” have a great amount of uncertaintyas to their existence and great uncertainty as to their economic and legal feasibility. Moreover, the requirements ofNI 43-101 for identification of “reserves” are also not the same as those of the SEC, and reserves reported by us incompliance with NI 43-101 may not qualify as “reserves” under SEC standards. Accordingly, information concerningmineral deposits set forth herein may not be comparable with information made public by companies that report inaccordance with U.S. standards.
29