silverlining: a cloud forecaster using benchmarking and...
TRANSCRIPT

Silverlining: A Cloud Forecaster Using Benchmarking and Simulation
Lawrence ChungDepartment of Computer Science The University of Texas at DallasDallas, Texas, [email protected]
Tom HillDepartment of Computer Science The University of Texas at DallasDallas, Texas, [email protected]
Nary SubramanianDepartment of Computer Science The University of Texas at TylerTyler, Texas, [email protected]
1

Outline
• Motivation• Cloud Configuration• Goal-Oriented Approach• NFR Approach• Simulation-based Design• Benchmark Testing on GAE• CloudSim Simulations• Conclusion
2

Motivation
• CIO would like to know run-time performance and operating costs for an application before deciding to migrate it to a cloud service.
• A cloud service provider would want to estimate how well the particular resource allocation will meet the performance and cost requirements.
3
Cloud Configuration
• IAAS, PAAS, SAAS• Hardware components• Operating system, database type• Number of front ends, application instances,
database connections• RAM, Bandwidth, and CPU cycles used
4

Goal-Oriented Approach
• System development is aligned with the objectives (or goals)
• Performance and cost are considered primary goals for cloud-based system
• Each configuration is evaluated against the goals
5
The NFR Approach
• Non-Functional Requirements (NFR) approach is goal-oriented
• NFRs are quality attributes of a system e.g. adaptability, changeability, security, etc.
• Performance and cost are considered as NFRs
• The NFR Approach provides an evaluation framework
6
Softgoal Interdependency Graph
• NFR Approach uses SIG for evaluation• SIG captures the relationship between
different softgoals• SIG captures the synergistic and conflicting
contributions to softgoals• Concept of satisficing used – satisfaction
within limits instead of absolute satisfaction
7

Simple SIG
8

Useful SIG
9

NFR Approach Ontology
10
NFR Approach Steps
• Develop NFR softgoals and their decompositions (AND, OR, EQUAL)
• Develop operationalizing softgoals and their decompositions (AND, OR, EQUAL)
• Determine contributions between operationalizing softgoals and NFR softgoals(MAKE, HELP, HURT, BREAK)
• Assign labels (satisficed/denied) • Evaluation and analysis – apply propagation rules
11

Example Propagation RulesSource Label Contribution Destination Label
Satisficed MAKE Satisficed
Satisficed BREAK Denied
Denied MAKE Denied
Denied BREAK Satisficed
Child Contributions Decomposition Parent Contribution
All satisficed AND Satisficed
One denied AND Denied
All denied OR Denied
One satisficed OR Satisficed
12

Issues
• In order to evaluate a proposed cloud configuration, we need– The label of the operationalizing softgoal– The contribution of this softgoal to performance
and cost softgoals– The claim associated with the label– The claim associated with the contribution
13

Label Determination
• Is this a valid configuration?• Is the application’s operating system
supported?• Is the application’s database supported?• Does the expected usage profile fit the SLA?• Do we satisfy copyright regulations?• Are security/privacy requirements
supportable?
14

Contribution Determination
• Use benchmarking to identify expected traffic parameters
• Execute benchmarks on the cloud to get performance data
• Run simulations to duplicate benchmark data• Baseline simulation parameters for future
environment modification• Use answers from simulation for contributions
15

Claims Determination
• Justify the reason for label based on current knowledge
• Justify the reason for contribution based on simulation results
• If configuration changes– Re-evaluate label for the configuration– Re-evaluate contribution from the configuration
16

SIG Evaluation
• Continuous process• Any change to SIG element data triggers the
(re)evaluation process• Latest performance and cost satisficing extent
always known• Based on this knowledge decide on the
suitability of cloud configuration
17

Goal-Oriented Simulation-Based Design Process
18

Transaction Processing BenchmarksTransaction Processing Benchmarks [TPC-C11]
Transaction Processing Council Benchmarks [TPC-C13]
+ Standard objective verifiable performance and cost OLTP, RDB since 1992+ Business throughput metrics; number of orders processed per minute with cost
- OLTP and relational database only
- High cost to benchmark, high cost to customize
+ 274 client server benchmarks documented+ 9 cloud benchmarks using Amazon cloud created by Stony Brook University
- No cloud benchmarks for Google, Microsoft, HP
19

Google Cloud Platform Abstraction Layer
InternetGoogle App Engine Frontend / Backend Service
Google CloudSQL Database Engine Service
Request Messages SQL Request Statements
Response Messages SQL Response Messages
Mapping Layer
Infrastructure Abstraction Hardware/software Layer
Performance Implementation Hardware Layer Disk –Capacity 300GB -- 420GB
Average seek – read/write ms 3.6/4.2 --15.5/15.5. Average seek 10ms
1. Google - Average Seek 10ms or 100 seeks/sec2. MySQL - big tables log(rows 500,000)/log(index block bytes 1024/3*2/(index bytes 3 + pointer bytes 4)) + 1 = 4 seeks/read, 6 seeks/write3. Application instruction path length aggregation [MIPs] can be matched with processor capacity [MIPs]4. …..
Processor- Intel core 2 dual core,2.93GHz 27,079 MIPs, F1—F4_1G 600MHz—2.4GHz, B1—B8 600MHz—4.8GHz
Memory RAM -0.5—16GB
Silver lining PaaS Abstraction Layer
Google Cloud infrastructure
20

TPC-C Benchmarks
21

TPC-C Benchmark Example
22

Running BenchmarksGoogle Cloud Graphical View of a Statistical Model to Estimate Performance
and Cost of Running a Software Application
Conceptual diagram of Google Cloud InfrastructureTransaction resource usageEstimate of costs
Transaction characteristics
Production characteristics
Estimate of transaction throughput 23

User InterfacesGoogle Cloud Project Benchmark “New Order” Transaction Window Design
1. Design the New Order transaction user interface in accordance with TPC-C benchmark specifications
2. Design and implement the New Order benchmark web program in Java and Python
3. Design and implement the remaining transactions
Input keys randomized for benchmark generation
24

Executing Benchmarks on GAEGoogle Cloud Project Benchmark Modified Stress-testing Tool to Generate 40
Concurrent User’s Transactions
Statistics for users (agents) 1 through 40
Number of concurrent users (agents) to generate transactions - 40
300 seconds benchmark duration – 300
Response time and throughput calculated and reported
Response message size in bytes
Pylot.py, open source web stress testing tool, modified to generate TPC-C benchmark transactions with random database keys, keying time and think time
25
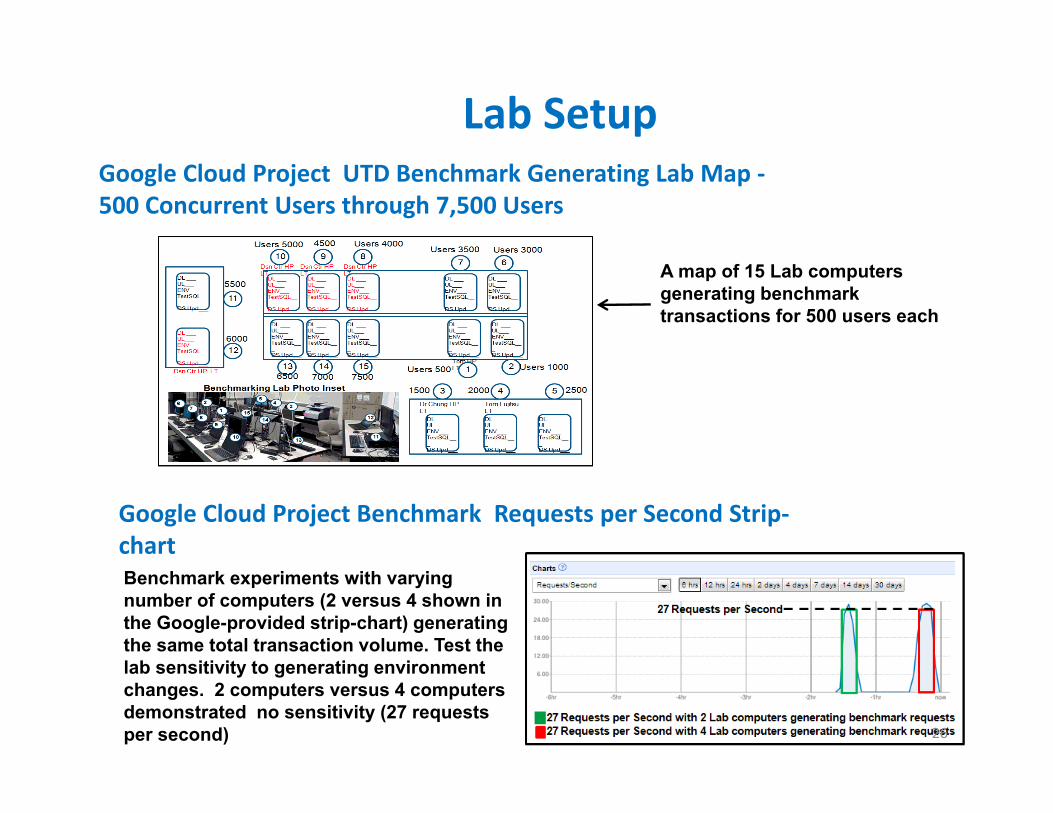
Lab SetupGoogle Cloud Project UTD Benchmark Generating Lab Map -500 Concurrent Users through 7,500 Users
Google Cloud Project Benchmark Requests per Second Strip-chart
A map of 15 Lab computers generating benchmark transactions for 500 users each
Benchmark experiments with varying number of computers (2 versus 4 shown in the Google-provided strip-chart) generating the same total transaction volume. Test the lab sensitivity to generating environment changes. 2 computers versus 4 computers demonstrated no sensitivity (27 requests per second) 26

Results of Benchmark TestingGoogle Cloud Project Benchmark Record of Experiments Example
Benchmark Data Collection Resource Usage Time Strip-charts Provided by Google
Lab computer name
Accumulated number of users
Number of Front End instances assigned by Google
6,000 concurrent users level benchmark
Cloud FE instances 628
240 requests per second
CloudSQL number of reads and writes 27

Plots from GAE
28

Benchmark Result AnalysisGoogle Cloud Project Preliminary Benchmark Results for a D1 CloudSQL
Database Instance
The performance throughput knee of the D1 CloudSQL server (338.1 transactions per minute with 320 concurrent users)
Benchmark throughput in transactions per minute (tpmC) for a variable number of concurrent users
The number of Front End instances allocated by the Google Cloud with pricing
29

Simulation Forecaster DesignGoogle Cloud Project Simulation Forecaster Function Design
Use XML that describes the experiment as function input and output performance metrics and cost
Workload requests represent resource usage and architecture infrastructure components represent capacity
Simulator generates workload of multiple users and collects metrics
Queues are created for a finite capacity model
Service times combine usage and capacity
30
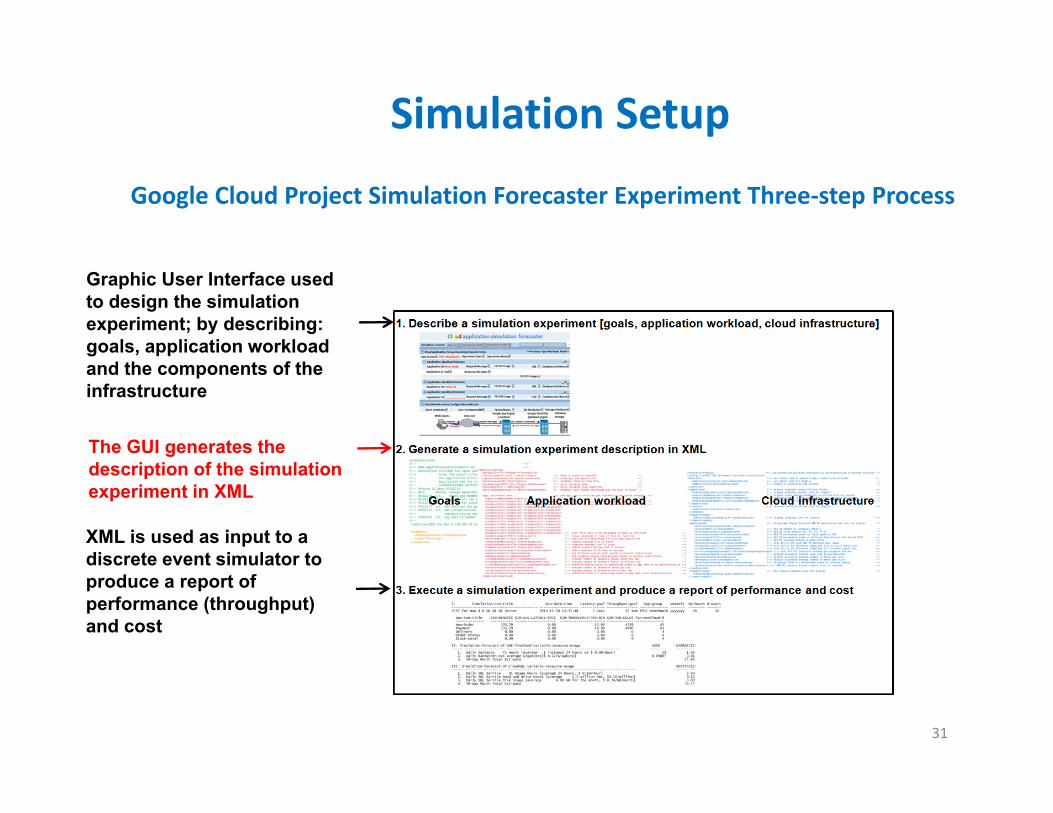
Simulation SetupGoogle Cloud Project Simulation Forecaster Experiment Three-step Process
Graphic User Interface used to design the simulation experiment; by describing: goals, application workload and the components of the infrastructure
The GUI generates the description of the simulation experiment in XML
XML is used as input to a discrete event simulator to produce a report of performance (throughput) and cost
31

GUI for Simulator
32

XML for Simulator
33

I. Simulation-run-title Run-date-time Latency-goal Throughput-goal App-group smtwtfs Op-hours #-users------------------------------------------ ------------------- ------------ --------------- -------------- ------- -------- -------TEST for sim 2014-03-30 09:03:56 2 secs Max tpm TPCC-Benchmark yyyyyyy 24 10
App-txn-title SIM-MINUTES SIM-AVG-LATENCY-SECS SIM-THROUGHPUT-PER-MIN SIM-TXN-COUNT Txn-workload-%-------------- ----------- -------------------- ---------------------- ------------- --------------New-Order 333.32 0.00 11.82 3939 45Payment 333.32 0.00 13.89 4628 43Delivery 0.00 0.00 0.00 0 4Order-Status 0.00 0.00 0.00 0 4Stock-Level 0.00 0.00 0.00 0 4
II. Simulation-forecast-of-GAE-frontend-variable-resource-usage USED CHARGE($):------------------------------------------------------------------------------------------------------ -------- ---------1. Daily F4_1G 2 instances [F1 billing @ 2 (F4_1G) * 6 (power) * 24 (hours/day) ea $ 0.08/Hour] 288 23.042. Daily Bandwidth Out average Gigabytes[$ 0.12/Gigabyte] 0.052 0.013. 30-day Month Total Estimate 691.39
III. Simulation-forecast-of-Datastore-variable-resource-usage USED CHARGE($):------------------------------------------------------------------------------------------------------ -------- ---------1. Daily Datastore Writes $ 0.9 per million operations] 3.77 3.402. Daily Datastore Reads $ 0.6 per million operations] 0.77 0.463. Daily Datastore Storage $0.006 per GB per day] 1390.00 8.344. 30-day Month Total Estimate 365.99
Report from Simulator

Forecaster Interarrival AlgorithmGoogle Cloud Project Simulation Forecaster Mean Interarrival Algorithm
Example
Mean interarrival seconds for 640 users
Transaction definition for the “New Order” application workload contained in XML, includes: workload mix (45%), request keying time (18 seconds) and response think time (12 seconds)
35

Forecaster Database AlgorithmGoogle Cloud Project Simulation Forecaster Mean Database Service Time
Algorithm Example
“New Order” application workload combined with cloud capacity, defined in XML, includes: mean number of cloud database read operations (23), mean number of SQL seek operations per read (4), mean number of cloud database write operations (24), mean number of SQL seek operations per write (6) and the mean seek time (10 milliseconds)
36

Baselining SimulatorGoogle Cloud Project Benchmark Performance Results versus Simulation
Forecaster Performance Results
Benchmark performance data points and SimPY simulation data points (tpmC and Number of Concurrent Users) similar.
Additional SimPY simulation data points (tpmC and Number of Concurrent Users) must be implemented to demonstrate sensitivity to “server timeouts” and “100 user connection limit”
37
Simulator Use
• The calibrated simulator used for future cost and performance estimation.
• If threshold parameters for cloud change then simulator will be re-calibrated
• Results from simulator can be used with high degree of confidence
• Directly based on benchmarking data used to generate simulator parameters
38

39

Conclusion• Performance and cost are important parameters
before migrating to cloud• Knowing which configuration provides best
performance/cost tradeoff will help practitioners • Using TPCC benchmarks against GAE gives
parameters for SimPY simulator model• CloudSim simulator model provides performance
and cost estimates• NFR Approach provides ability to choose
optimum configuration based on tradeoff analysis
40
References• L. Chung, T. Hill, et. al., “A Goal-Oriented Simulation
Approach for Obtaining Good Private Cloud-Based System Architectures”, Journal of Systems and Software, September 2013, pp. 2242 – 2262.
• N. Subramanian, S. Drager, W. McKeever, “Identifying Trustworthiness Deficit in Legacy Systems Using the NFR Approach”, CrossTalk Journal, January/February, 2014, pp. 4-11.
• N. Subramanian and L. Chung, “Software Architecture Adaptability - An NFR Approach”, Proceedings of the International Workshop on Principles of Software Evolution (IWPSE 2001) 2001, pp. 52-61.
41