simple geometry, incredible graphs math and science matter saturday, march 3, 2001
TRANSCRIPT

Simple Geometry, Incredible Graphs
Math and Science Matter
Saturday, March 3, 2001
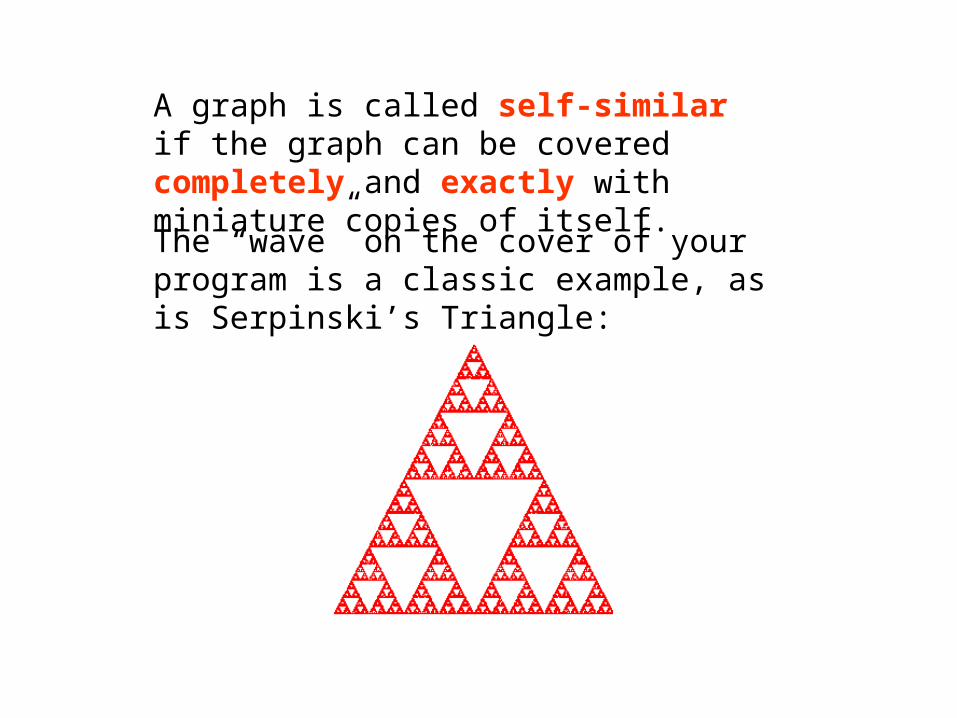
A graph is called self-similar if the graph can be covered completely and exactly with miniature copies of itself.
The “wave” on the cover of your program is a classic example, as is Serpinski’s Triangle:
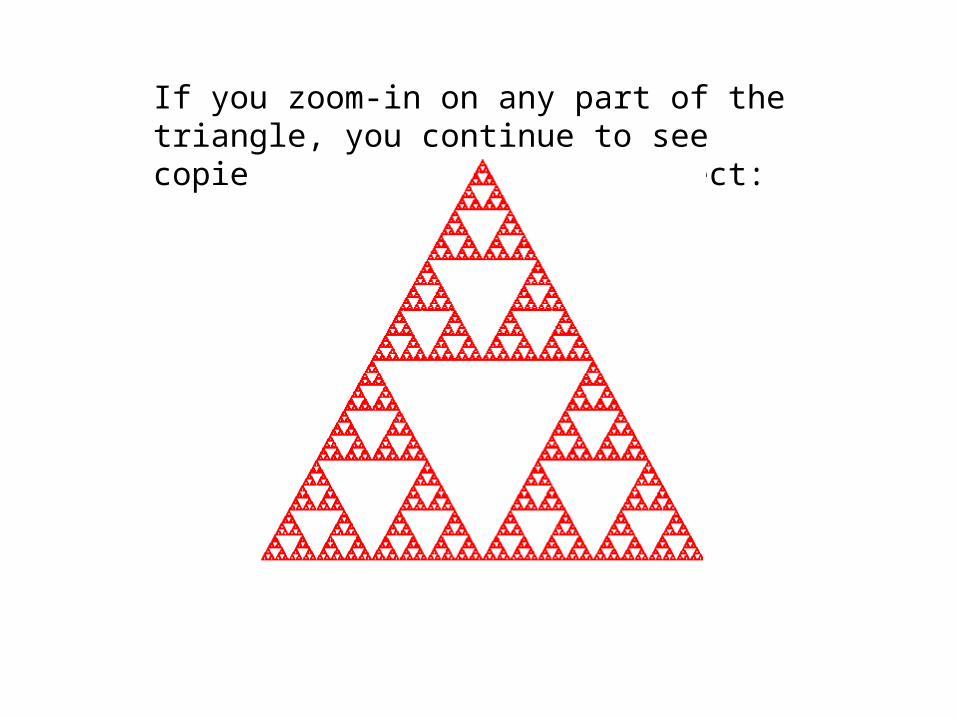
If you zoom-in on any part of the triangle, you continue to see copies of the same basic object:

Likewise, you can compress the triangle onto a copy of itself:

With a computer to help, it’s easy to make Serpinski’s triangle, or the wave, or any number of exotic graphs.
All we need are some simple ideas from basic geometry.

The location of every point in the plane is specified by two numbers:
(3,1)
the x-coordinate is 3
the y-coordinate is 1
3
1

If we multiply the x-coordinate by 1/2, we slide the point halfway towards the vertical axis:
(3,1)(1.5,1)
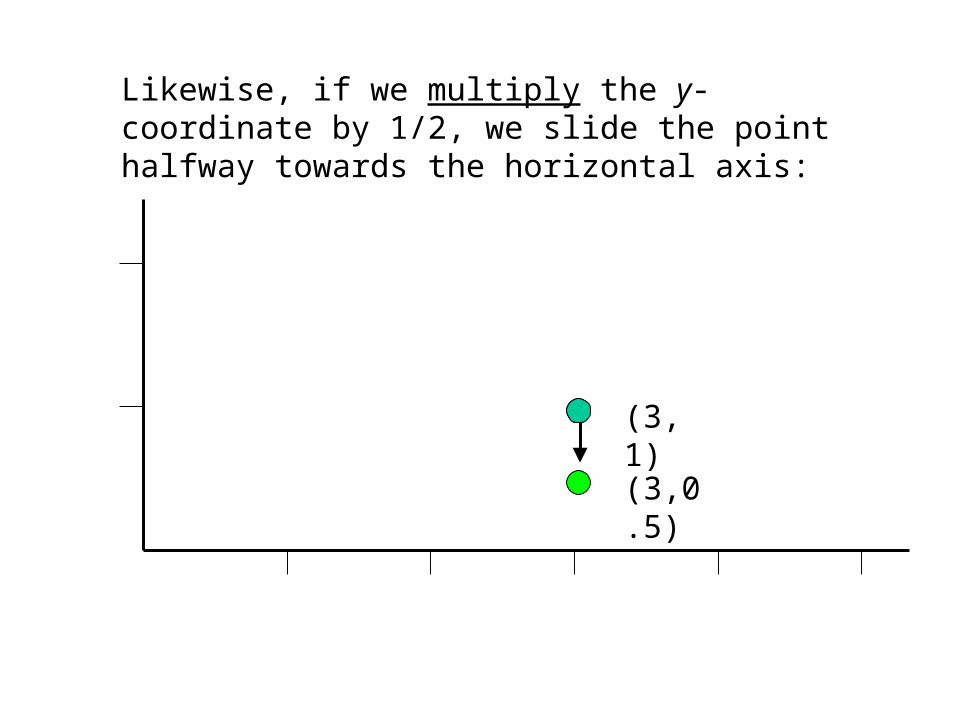
Likewise, if we multiply the y-coordinate by 1/2, we slide the point halfway towards the horizontal axis:
(3,1)
(3,0.5)

If we multiply both coordinates by 1/2, we slide the point halfway towards the origin:
(3,1)(1.5,0.5)

If we multiply every x-coordinate in an entire figure by 1/2, we shrink the entire figure halfway towards the vertical axis:
Note that the size of the figure changes.
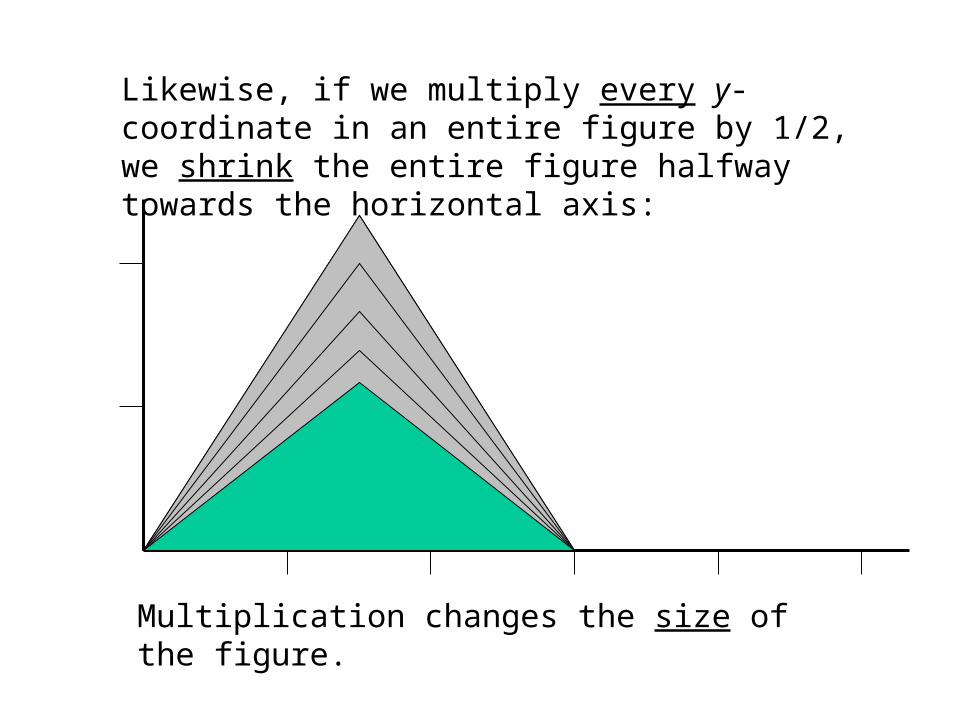
Likewise, if we multiply every y-coordinate in an entire figure by 1/2, we shrink the entire figure halfway towards the horizontal axis:
Multiplication changes the size of the figure.

If we add 1 to the x-coordinate, we shift the point 1 unit away from the vertical axis:
(3,1) (4,1)

…and if we add 1 to the y-coordinate, we shift the point one unit away from the horizontal axis:
(3,1)
(3,2)

If we add 1 to every x-coordinate in an entire figure, we shift the entire figure one unit away from the vertical axis:
Note that the size of the figure does not change.
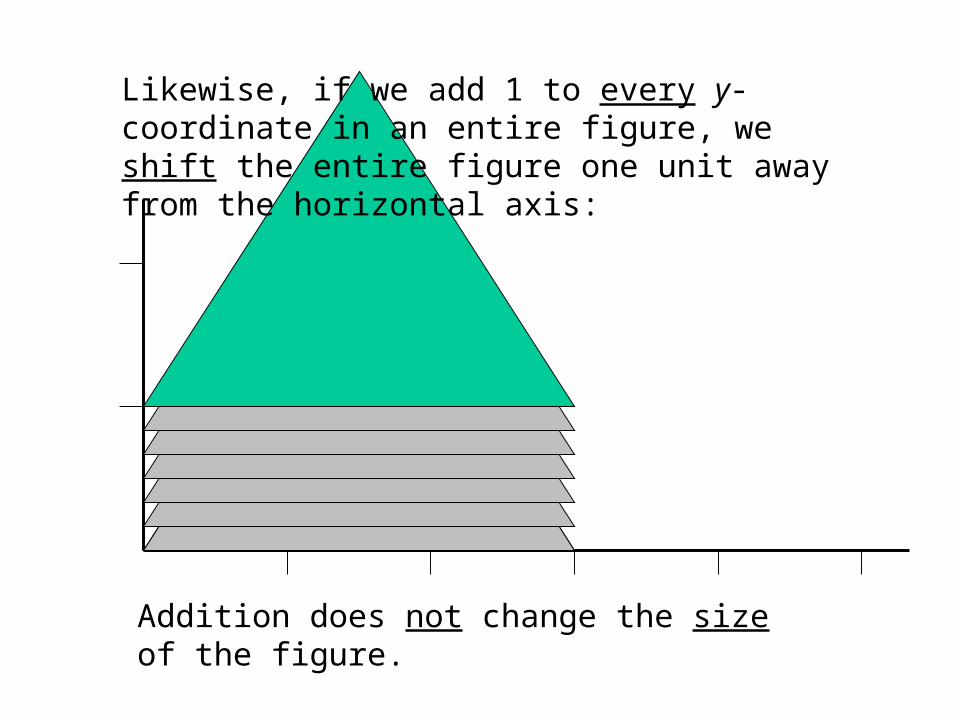
Addition does not change the size of the figure.
Likewise, if we add 1 to every y-coordinate in an entire figure, we shift the entire figure one unit away from the horizontal axis:

The first one is easy: we need to shrink the entire triangle down onto the lower-left corner.
To create Serpinski’s Triangle, we need to find formulas to shrink it onto the three major subsets of itself.
Just multiply every x-coordinate by 1/2 and then multiply every y-coordinate by 1/2.
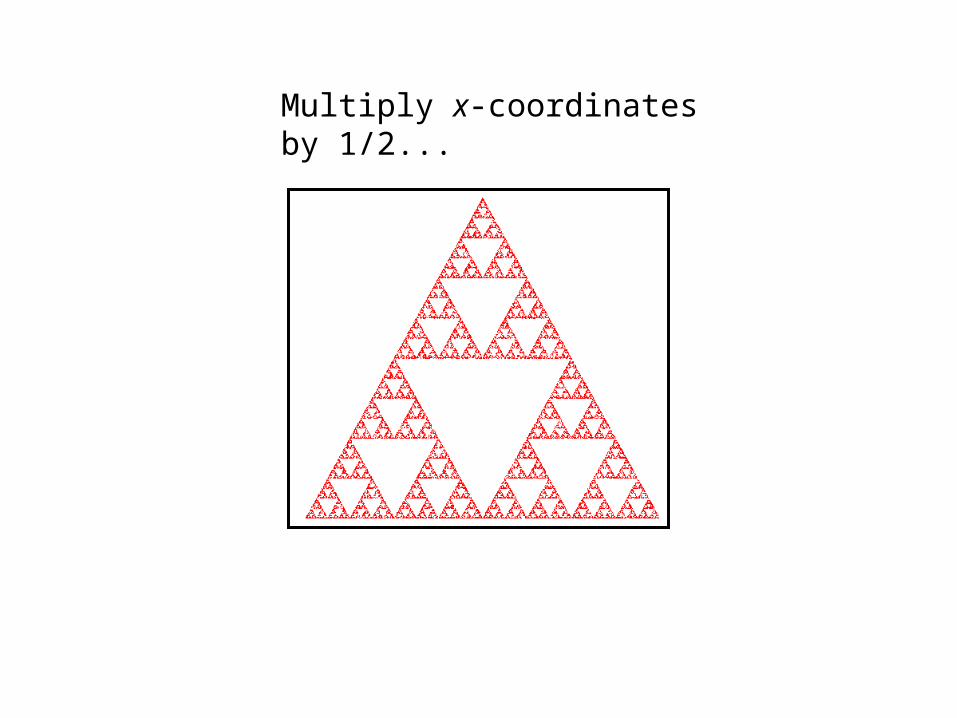
Multiply x-coordinates by 1/2...

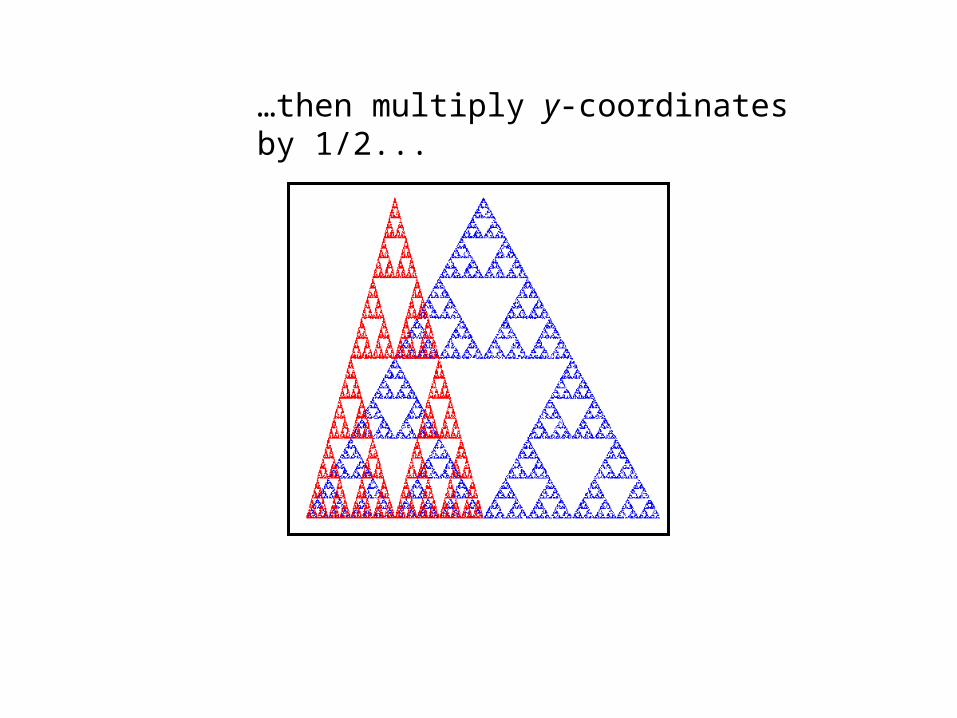
…then multiply y-coordinates by 1/2.

First formula: multiply x-coordinates by 1/2multiply y-coordinates by 1/2

We can think of this as sliding thetriangle in the lower-left corneronto the triangle in the lower-right corner.
The second formula is also pretty easy -we need to shrink the entire triangle down onto the triangle in the lower-right corner.
If we set the length of the base to be 1 then, after multiplying all coordinates by 1/2, we should add one-halfto each x-coordinate.

Multiply x-coordinates by 1/2...
…then multiply y-coordinates by 1/2...

…then add half the base length to each x-coordinate.
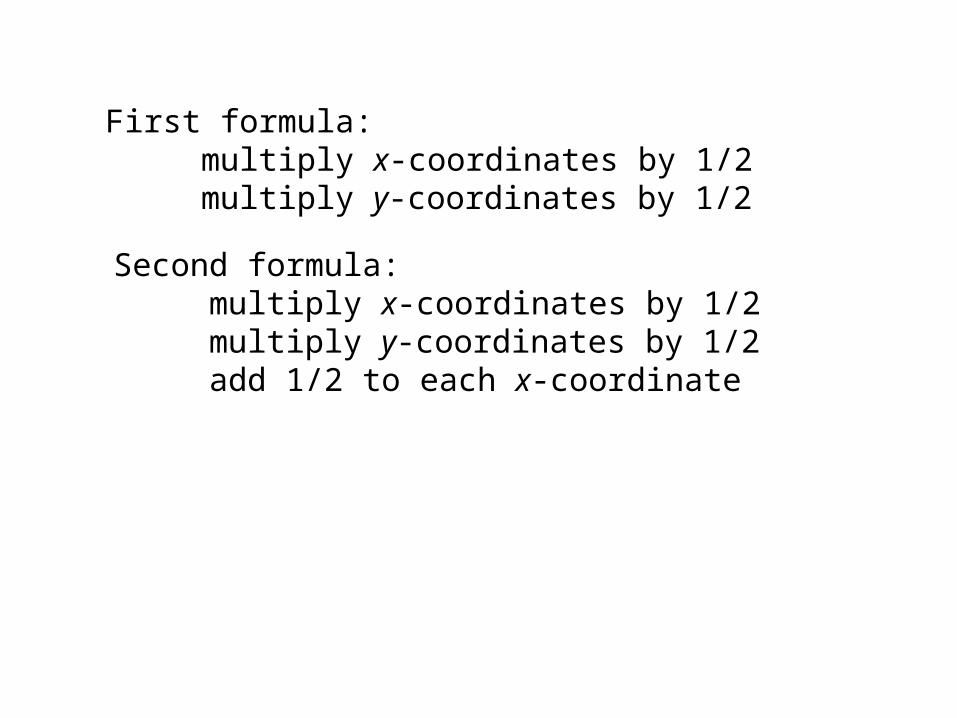
First formula:multiply x-coordinates by 1/2multiply y-coordinates by 1/2
Second formula:multiply x-coordinates by 1/2multiply y-coordinates by 1/2add 1/2 to each x-coordinate

We can do this by sliding thetriangle in the lower-left corneronto the triangle in the upper-middle vertex.
The third formula is also pretty easy -we need to shrink the entire triangle up onto the triangle in the upper-middle vertex.
As it turns out, the height of this triangle is about 0.866 so,after multiplying all coordinates by 1/2, we should add 0.25 to each x-coordinate and add 0.433 to each y-coordinate.

Multiply x-coordinates by 1/2...

…then multiply y-coordinates by 1/2...
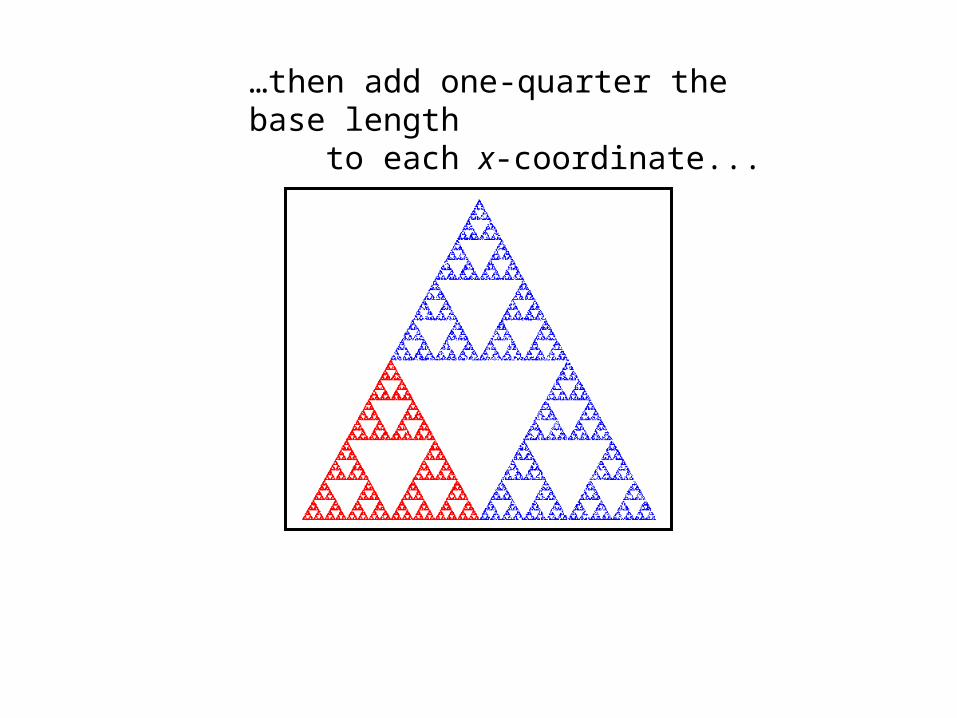
…then add one-quarter the base length to each x-coordinate...
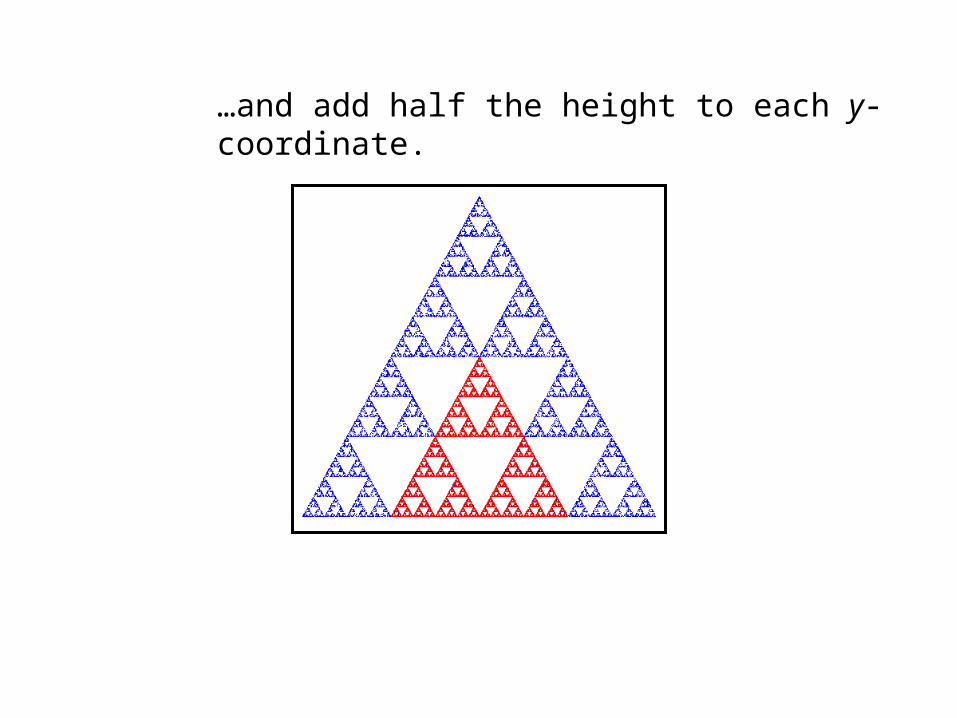
…and add half the height to each y-coordinate.

First formula:multiply x-coordinates by 1/2multiply y-coordinates by 1/2
Second formula:multiply x-coordinates by 1/2multiply y-coordinates by 1/2add 0.5 to each x-coordinate
Third formula:multiply x-coordinates by 1/2multiply y-coordinates by 1/2add 0.25 to each x-coordinateadd 0.433 to each y-coordinate

Start with the point x = 0 and y = 0 (the lower-left vertex)and plot it.
Randomly pick one of the three formulas and use it to transform the point (0,0) into a new point.
Plot the new point.
Randomly pick one of the three formulas and use it to transform the most recently plotted point into a new point.
Repeat the last two steps...
Finally, how do we create the entire figure?
100,000 times.
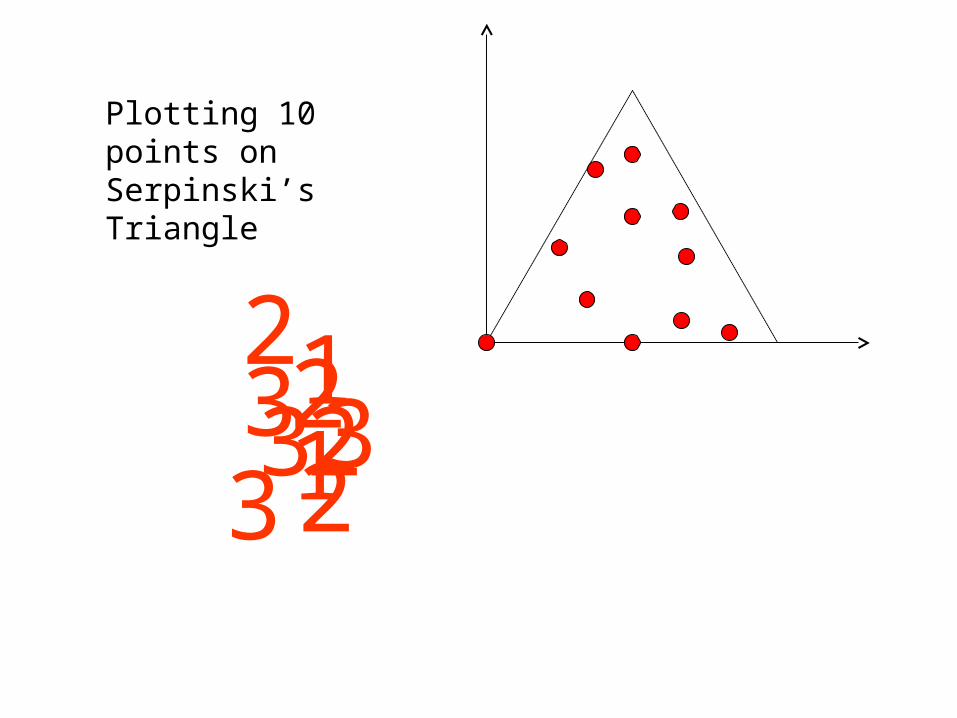
Plotting 10 points on Serpinski’s Triangle
23
3 13212
23

100 points500 points2500 points10000 points100000 points

Although shrinking and sliding are enough to create Serpinski’s Triangle, if we add done last effect, we can create stunning graphics:
Rotation.

We can rotate a point around the origin by any angle.
(2,1)
(1.67,1.48)
A 15 degree rotation has this effect:
Think of the point as being on the circumference of a circle centered at the origin.
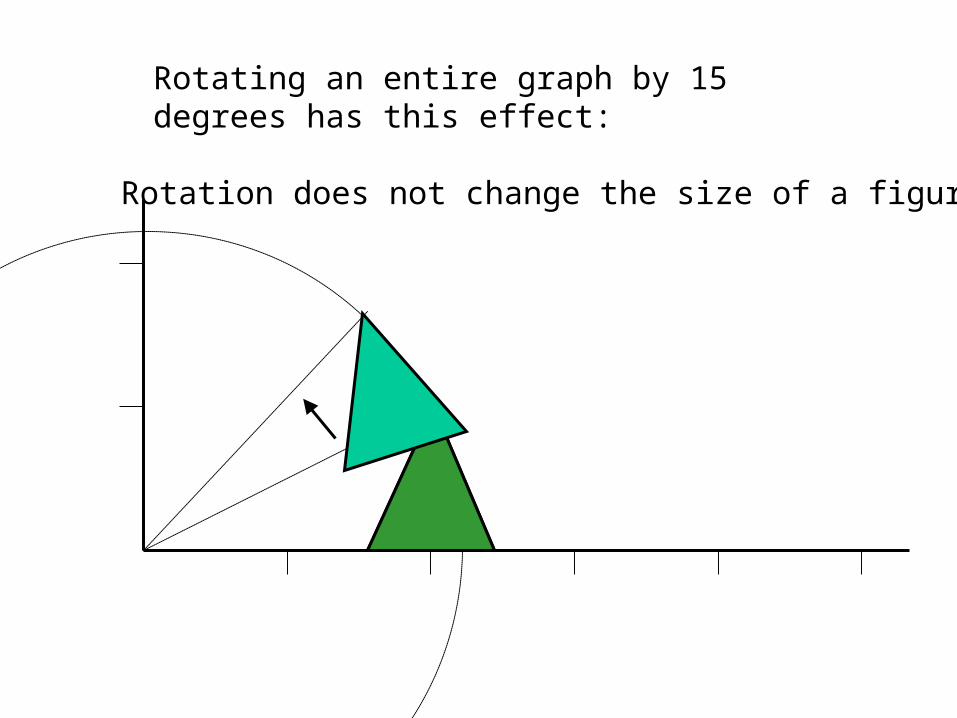
Rotating an entire graph by 15 degrees has this effect:
Rotation does not change the size of a figure.

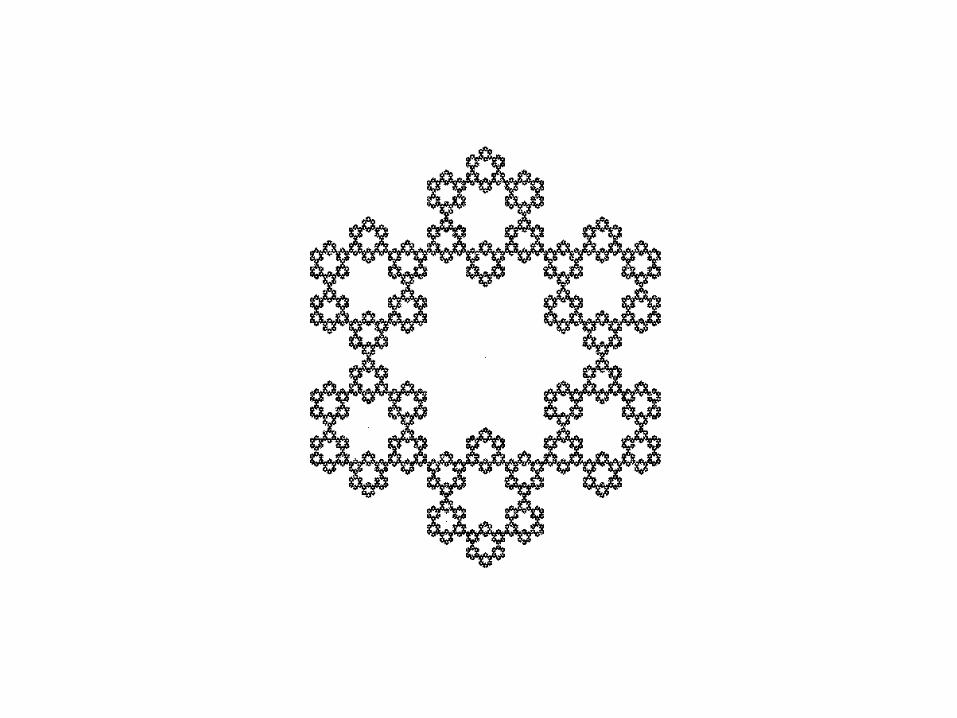
Using shrinking, shifting and rotations about the originwe can make the following self-similar objects.

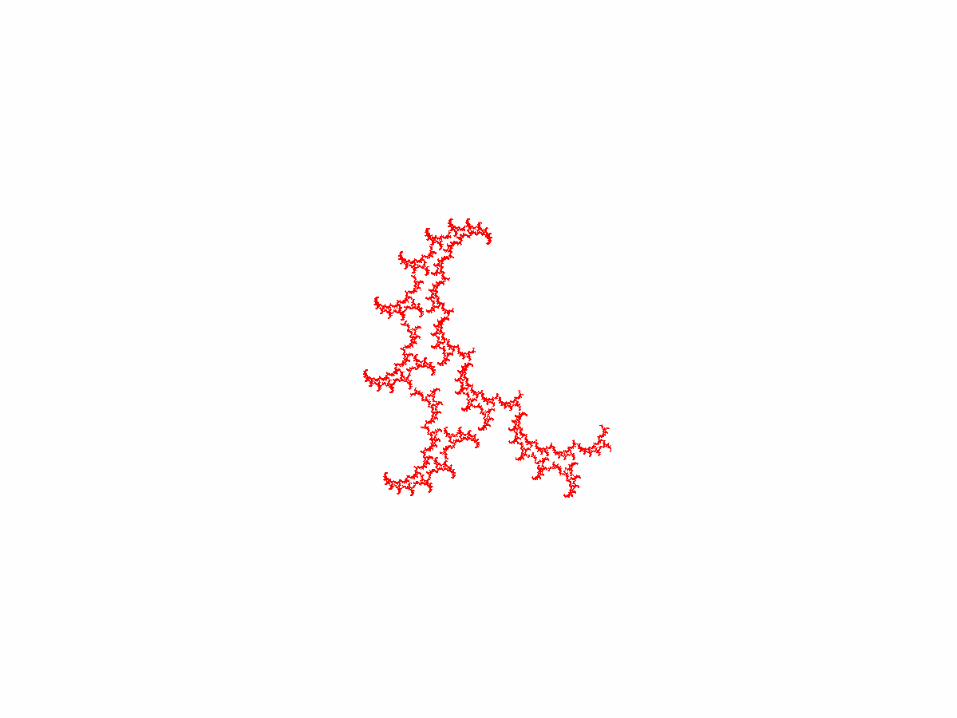

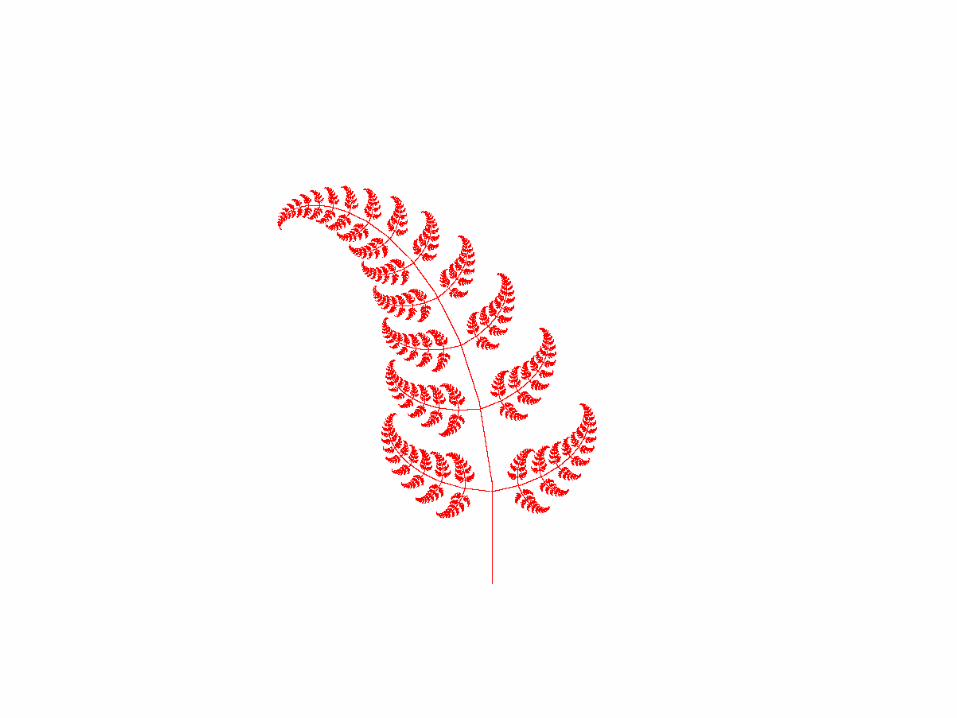
Using other techniques which we won’t discuss today, we can make self-similar graphs that look quite life-like.