simple simulation sensitivity tool - ibpsa | · pdf file · 2013-09-15simple...
TRANSCRIPT

SIMPLE SIMULATION SENSITIVITY TOOL
Enrico Crobu1, Simon Lannon1, Michael Rhodes1 and Gabriela Zapata1 1Welsh School of Architecture, Cardiff University, United Kingdom.
ABSTRACT
One of the key responses of the UK Government to the European Energy Performance Building Directive EPBD2002 has been the introduction and refinement of an energy efficiency compliance tool for domestic dwellings, the Standard Assessment Procedure (SAP, 2009). A major disadvantage of the current assessment procedure is that a SAP model is generally confined to the final compliance stage of the design when it is used to certify energy performance once the design is concluded owing largely to the perceived complexity of the existing interfaces amongst architects (lowcarboncymru.org, 2012). However, SAP could potentially have a large influence over the design process of low energy buildings if a more intuitive interface was available. This paper introduces the SAP Sensitivity Tool 2009 (SST2009) that was developed as part of the A4B project: Delivering Low Carbon Buildings Cymru and describes its features as well as its possible applications and limitations. The tool, based on SAP2009, provides a simple interface for “what if” scenarios modelling of building performance. Limitations have been introduced in the variety of input data that the user can provide to the calculation engine, with the intent of preserving simplicity of use and communicability.
INTRODUCTION The early stage design of a low energy building is the phase in the lifetime of a project where end results can be largely influenced by decisions taken by the design team as shown in Figure 1. In this stage various scenarios are evaluated so that an energy efficient building can be successfully designed, built and used. Scenarios represent a combination of design options which offer a range of optimal solutions in line with current regulation's requirement. Over the last 10 years there has been an increasing focus on energy efficiency in the UK building regulations and these standards tend to characterise and affect decision making in the early stage of building design. For this reason the early stage is one of the most complex and influential phases of the project in terms of the outcome . The professionals involved at this stage are typically architects who are required to address issues in
different areas of expertise. Architects often make use of computer tools to help informing the design. However, normally these tools are not designed by architects for architects (Attia S. et al, 2012), and they tend to require too much detailed information to set up even a simple model when this information may not actually be available at an early stage (Radford, A. D. and Gero, J. S., 1980). These facts add further complexity to the design stage, which loses dynamism and control of outcomes. Moreover computer tools tend to evaluate proposed solutions (e.g. for compliance) instead of suggesting optimal alternative scenarios. This means that if the proposed solution doesn't derive from a comparative analysis of early performance scenarios the risk of carrying on a non-optimal design is high.
Figure 1 “MacLeamy Curve” showing the
relationship between effort and design stages in traditional vs optimal design processes (Patrick
MacLeamy, 2007)
Current research in the built environment demonstrates the need for early design tools or sensitivity tools that could help to reduce complexity (Attia S. et al, 2012), allowing a better performance driven design to be planned since the conception of a building.
Proceedings of BS2013: 13th Conference of International Building Performance Simulation Association, Chambéry, France, August 26-28
- 460 -
This paper presents a simple sensitivity tool, based on the Approved Document Part L (Approved Document L, 2013) and SAP2009. The tool estimates the energy performance of predetermined building typologies and calculates parameters simultaneously. It has been designed in order to offer visual graphical dynamic outputs so as to inform the design stage. Advantages in the use of the tool have been reported by a number of volunteer testers based in UK architectural practices whose feedback has contributed also to the most recent implementation of new functionalities. The tool informs the design stage allowing the designer to consider various scenarios using a "what-if" approach.
BACKGROUND The Approved Document L was initially introduced in UK in 1985. Since then, the document has always “provided guidance on compliance with Building Regulation Part L” (HM Government, 2010). In 2002 the ADL changed radically in order to include the new requirements imposed by the Energy Performance Building Directive of the European Community (EPBD, 2002). The modern versions of ADL after 2002 have the primary objective of regulating CO2 emissions from buildings through an incremental improvement of building performance. The current goal of the UK Government is the reduction of carbon dioxide emissions by 80% by 2050, compared with the level in 1990 (gov.uk, 2013) to be achieved in part by improving building energy efficieny. ADL has been amended and refined across a decade and today represents a solid reference for professionals involved in reducing emissions in the domestic building stock. The regulation comprises of two dedicated sections: dwellings (Part L1) and non-dwellings (Part L2). It also differentiates between new and existing buildings (A and B). In order to check compliance with Part L, computer tools have been developed by each member state within the European Community in accordance with guidelines published in the EPBD2002 and in subsequent amendments. Compliance computer tools in UK are the Standard Assessment Procedure (SAP) and the Simplified Building Energy Modelling (SBEM), used respectively for dwellings and non-dwellings. The methodologies used to calculate energy performances of buildings are different in these two tools. SAP is based on the steady state method known as BREDEM developed by BRE ( BRE, 1997) and able to estimate energy consumption in dwellings, including space heating, water heating, lighting, electrical appliances and cooking. SBEM uses a more complex “quasi-steady” method (National Calculation Method) (BRE, 2011) that calculates monthly energy consumption and CO2 emissions. Despite the official tools available for practitioners to understand and evaluate energy performance of the building designs, the influence of simulation tools in
design decisions is likely to be limited during early design. While analysing the influence of simulation tools in early design decision in two case studies, De Wilde and van der Voorden (2003) found that the simulation tools were used when conceptual design phase finished and that they had limited influence in the selection of design strategies. Hensen and Augenbroe (2004) point out that although the use of simulation in the design process is recommended by the academic literature, it is rarely included in routine practice and Struck and Hensen (2007) found that ‘design guidance early in the process is rarely exploited’. Clarke et al. (2008) argue that there is not an extensive use of simulation and modelling techniques in the UK despite the variety of tools and guidance. Raslan and Davies (2012) conducted a survey and in-depth interviews to obtain the practiotioners' perceptions about the National Calculation Methodology (NCM) as a compliance methodology in the UK. The results suggest that the compliance tools might be limited in terms of usability, technical capability and reliability. During the research project that led to the development of the SAP Sensitivity Tool (SST2009), the team focused on the residential sector (i.e. dwellings). Over the last 10 years the number of new build dwellings completed annually in Wales peaked at 9,334 in 2006-2007 (Welsh Government, 2012). The number of new dwellings completed annually has decreased year-on-year since the financial crisis of 2008 and the most recently available statistics indicate that only 5,575 new dwellings were completed in 2011-2012 (Welsh Government, 2012). To put this in context of the entire domestic stock, the total number of dwellings in Wales was approximately 1,35 million in 2011 (Welsh Government, 2012).
WORKSHOP The decision for starting the development of the SST2009 was taken after a series of workshop events that focused on compliance analysis and computer simulation tools, targeted mainly at architects and local authority building control officers, as well as other building professionals. These workshops allowed the development team to identify the need for this tool and to plan its features. The workshop was attended by 65 delegates from a range of architectural practices and other construction related organisations in Wales. The delegates formed into groups to discuss questions relating to SAP and SBEM and were asked to formulate 3 responses per question, per group. Delegates were given 20 minutes to formulate 3 responses to each question. The responses were then placed under the relevant question heading before being grouped into a series of common ‘themes’. Summaries of these themes for each question are presented in the following paragraph:
Proceedings of BS2013: 13th Conference of International Building Performance Simulation Association, Chambéry, France, August 26-28
- 461 -
What are the shortcomings of SAP/SBEM that need attention, particularly in relation to low carbon design?
User friendliness / simplification: • Need a SAP/SBEM ‘Lite’ for architects to use
for early-stage energy strategy. • SAP/SBEM needs to be more user-friendly. • Simplified early stage model i.e. for use at RIBA
Stage B (Strategic Brief). • SAP/SBEM needs to be ‘demystified’ to enable
accurate interpretation. • Usually need a consultant; any change to design
requires re-consultation. • The simple elemental U-Value approach was
easier.
Education / expertise of SAP/SBEM user needs to be improved: • People carrying out low carbon design should
have a good knowledge of SAP/SBEM - simple user-friendly calculation tools would be useful.
• Need to improve education / credibility of SAP/SBEM users.
• There is insufficient expertise to accurately interpret the SAP system; better education and training is required - even for SAP assessors.
• Dissemination of information to trades / workers on the ground so that they understand the implications of SAP/SBEM assessment
Technical improvements: • On compliance – designer needs to design right
in the first place, not hit and miss on SAP scores. • There is not a simple pre-assessment tool for
initial design guidance. • SAP software should be freely available. • There should be a standard software interface
system for SAP for Building Regulations in Wales.
• The prescriptive element of SAP should be retained.
‘Tick box’ vs Design: • There is a large gap between designer and
compliance. • Need to reduce the ability to ‘fiddle’ results. • Needs to be a design tool, not just a ‘tick box’
compliance tool. • SAP is a ‘tick box’ exercise as opposed to
helping make informed decisions on design. General comments: • SAP needs to distinguish different types of users. • Sustainable design can be an exciting process. • Why does the technical guidance to achieve
standards (SAP/SBEM/Code for sustainable homes) have to be so mind-numbingly dull?
A number of common themes were identified from the discussions. These included: • More education - of SAP users, contractors and
building end-users. • More simplification - of SAP and of building
services controls. • More flexibility – of SAP, standards, services
and building design.
COMPLEXITY With the increase in energy efficiency performance demanded by recent iterations of ADL and other measures such as the introduction of the Code for Sustainable Homes, architects have faced new challenges in achieving the required standards. The number of inputs and variables in a project, together with the management of outputs, are complex aspects embedded in the design. Buildings have become sophisticated systems and consequently the designer has had to take into account a vast range of elements, including fabric and systems, together with geometry and orientation, in order to produce a successful design.
Opinions and feedback recorded among professionals during the workshops highlighted the sense of dissatisfaction which designers encounter when using compliance analysis software tools like SAP. This tool in particular was criticised for the complexity of the procedure of assessment which doesn’t reflect the intrinsic simplicity of the methodology adopted for calculating the outputs. SAP has been considered too complex and time consuming for the type of accuracy it employs to predict results. The majority of the people interviewed at the workshops agreed on the “need for simple tools” capable of immediate generation and assessment of design alternatives to inform decision making in the design stage. Hensen and Lamberts (2011), discussing complexity, state that “there is a […] misconception that increasing the model complexity will decrease the uncertainty of the results”. Zapata and Tweed (2011) reported the outcomes of the interviews carried out with a selected number of practitioners in Wales and concluded that “practitioners expressed that they are adopting […] simple tools to estimate potential performance of buildings […] before the application of official calculation methods for compliance […] when there is a lack of detail definition about the product.”
SAP, DECONSTRUCTED SAP is developed and distributed by Building Research Establishment (BRE) as a worksheet supported by a comprehensive documentation of about 300 pages with all information required for completing the assessment of a building. In the most simple instance the calculation model can be in the
Proceedings of BS2013: 13th Conference of International Building Performance Simulation Association, Chambéry, France, August 26-28
- 462 -

form of an interlinked Excel spread sheet, however an number of commercial interfaces or ‘front-ends’ have been developed to aid the data entry process. Hence, the SAP user currently has two options to use the tool: choose a third party accredited interface or just choose suitable software (like Excel) to edit and calculate the worksheet manually. Overall the use of the SAP does not require a high level of computer skills. It basically consists in a series of numeric fields that the user has to complete. The procedure develops along a one-way sequence beginning with the geometry (that the user has to model numerically) and finishing off with data input about the cost of fuel to estimate CO2 emissions. Nonetheless users find the procedure complex and time consuming due to the number of steps that must be completed in the sequence and the way that it is not immediately apparent how small changes can affect the result. Moreover the lack of automatic error detection increases the likelihood of erroneous results and therefore the need for continuous check up on input data from the user. The SAP2009 worksheet includes a total of around 800 numeric fields. Each field has to be completed by the user. Fields are distributed into 12 main sections (building dimension, ventilation rate, heat losses & HLP, water heating energy requirement, internal gains, solar gains, mean internal temperature, space heating requirements, space cooling requirements, energy requirements, fuel cost and total energy cost). Sections are connected to each other by simple formulas so that any imprecision committed in the first section (building geometry) will affect all
subsequent calculations as well as final outcomes. The user has to refer to a total of 36 tables (Figure 2) that provide the appropriate numeric values for each numeric field. The complexity of the procedure is evident for example when the user has to deal with 96 + 68 + 84 (= 248) numeric fields for internal gains, solar gains, main internal temperatures respectively. The lack of an “intelligent” interface that could suggest or assume some unknown input hinders the usability of the tool. These aspects can dramatically affect the time taken for assessing the building performance thus possibly affecting the quality of the analysis itself. It is clear that the complexity of the certification system impacts significantly on the quality of the project. In fact, it is typical that the designer loses control over the certification phase as this is carried out by a specialised SAP assessor. At this point if the design doesn’t pass the compliance checks, the designer should review the design and resubmit it to the assessor. The implicit complexity of this procedure means that it is not always possible to make several iterations of the design towards the optimal solution that the architect would like to take. This negates the opportunities for “what-if” scenarios modelling which could provide the designer with more control over quality and energy performances.
WHAT IS THE NEED: A SIMPLE CLEAR SIMULATION TOOL Even though in theory SAP could have a large influence over the early design process, the assessment procedure remains largely confined in a
Figure 2 SAP 2009 deconstructed: links between input field and tables.
Proceedings of BS2013: 13th Conference of International Building Performance Simulation Association, Chambéry, France, August 26-28
- 463 -
restricted phase at the end of the project – e.g. proof of compliance. Because of the way SAP has been conceived, it can only be used in the final stage of the design only to certify the performance of buildings once the design is concluded. At that point, in the majority of cases, it is too late for the architect to modify the strategic decisions previously taken without significant impacts on cost and project timescale. Having a methodology, like SAP, delivery in a simple tool capable of showing the validity of the decisions taken during the design and suggesting other implementations, would therefore be beneficial for the entire project. The proposal of the development team was that the SAP methodology could be employed to give feedback for decision making during the early design phase of a project. This view is corroborated in a statement by the Department of Energy and Climate Change in UK (DECC): “SAP is a compliance tool. However, there is no reason why designers could not use it to predict the performance of different dwelling designs. Given that the assessment methodology and calculation principles are fully set out in the SAP document then software suppliers could easily make a design version available” (DECC, 2013).
Even after a decade of development, the delivery of low carbon buildings still depends largely on architect’s experience and on on-site quality control. One factor behind this lies with the lack of adequate support in the upstream phase. Computer tools that are supposed to support the design of a building are not mature enough to ensure the quality of results. There is a divide between the design phase and the compliance check that has not yet been closed. This point tends to undermine the architectural design and to complicate the design process. It is therefore necessary to explore new ways to educate and assist the designer in this phase. The need for feedback during a decision making stage becomes crucial when the amount of data to manage is significant or when data are not just about architectural features but also technical and scientific aspects. In the field of energy efficient design, the role of architects usually overlaps with those of engineers and building physicists / consultants. These can cause confusion as to the tasks that the architect is supposed to perform. Software sometimes reflects this lack of defined boundaries between professionals and reciprocal responsibilities. Attia S. et.al. (2012), analysed the market of Building Performances Simulation tools listed on the DOE (American Department of the Environment, 2011) website in the last 10 years and highlighted the fact that only 40 out of the 392 software tools are intended for use by architects. Even though the early design stage of a building is the most critical stage for optimising performances, software is typically designed to be employed in the post design stage. The same study also found that only 1% of the total number of
software tools was specifically designed for use during early stage design (“pre-design informative”). Once these critical points had been identified they supported the need for simple modelling tools for architects. The SST2009 is designed to demonstrate that a sensitivity approach can shape a different process in the design of low carbon buildings.
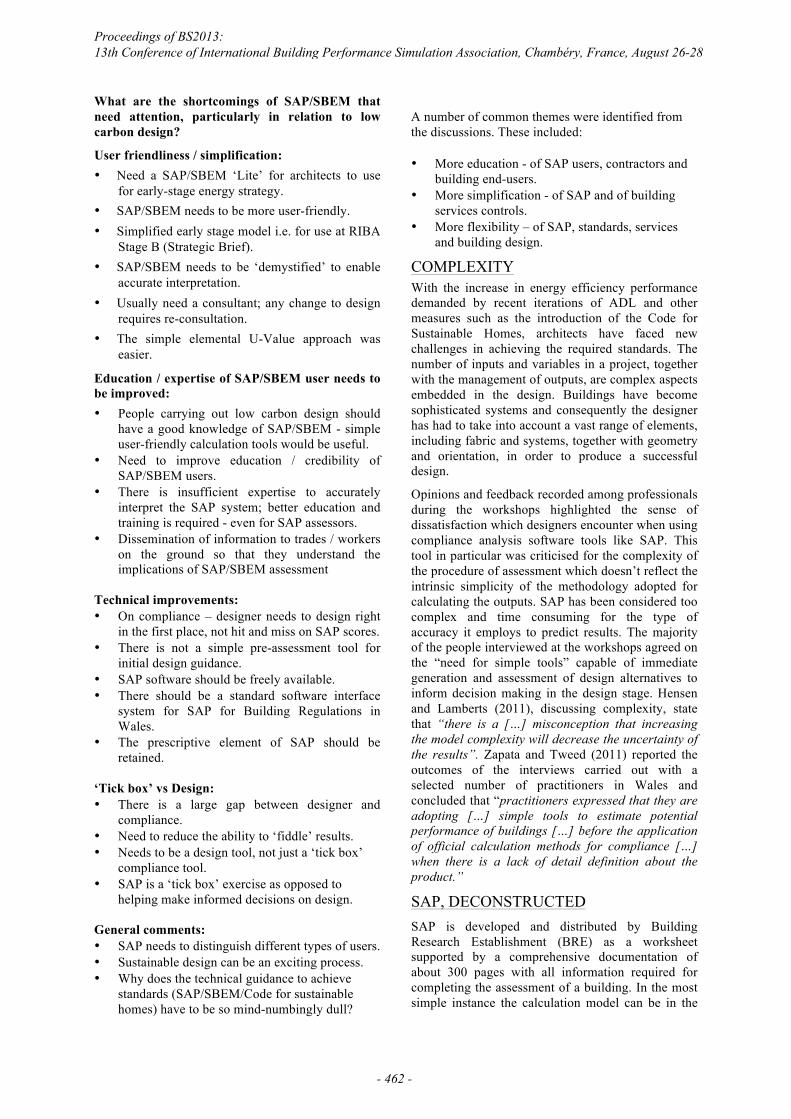
THE INTERFACE EXPLAINED The graphical user interface (GUI) is the outcome of a long process of refinement and improvements initiated from a simple concept: the creation of a web-based, compact but communicative, user-friendly display capable of managing large sets of numeric data and combinations.
Figure 3 SAP ST – GUI
One of the main features of the GUI is the ability to represent in a concise and clear way technical complexities that will otherwise constitute an obstacle to non-experts. The amount of data to be analysed and produced represented a high level of complexity to the understanding of buildings energy efficiency from the user side. Turning this complexity into “communicative simplicity” has become a necessary step to increase awareness during the design of buildings. Interaction with the user is achieved by employing three elements: sliders, push buttons and radio buttons. The interface identifies 4 principal sections where the user can customise settings and an output area where all results are dynamically shown. At the top of the interface is “building overview” section, on the left side are two other sections that identify two well-known approaches to building design: “fabric first” and “systems first”. At the bottom the results are displayed in an easy to understand combination of graphics and numbers. Once settings in the building overview have been chosen, the fabric and system settings represent the most used area of the tool, where scenarios can be simulated and tested. This area is where sliders are located, allowing for a quick visualisation of selected features and comparison of different configurations.
Proceedings of BS2013: 13th Conference of International Building Performance Simulation Association, Chambéry, France, August 26-28
- 464 -
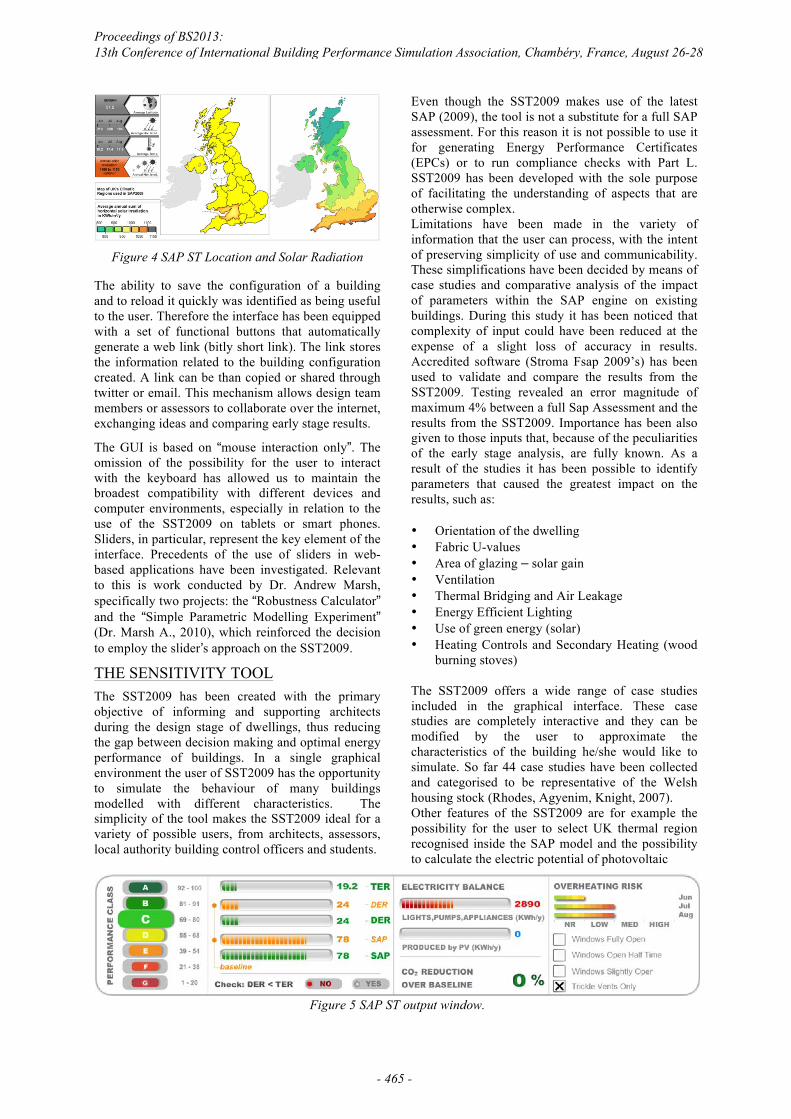
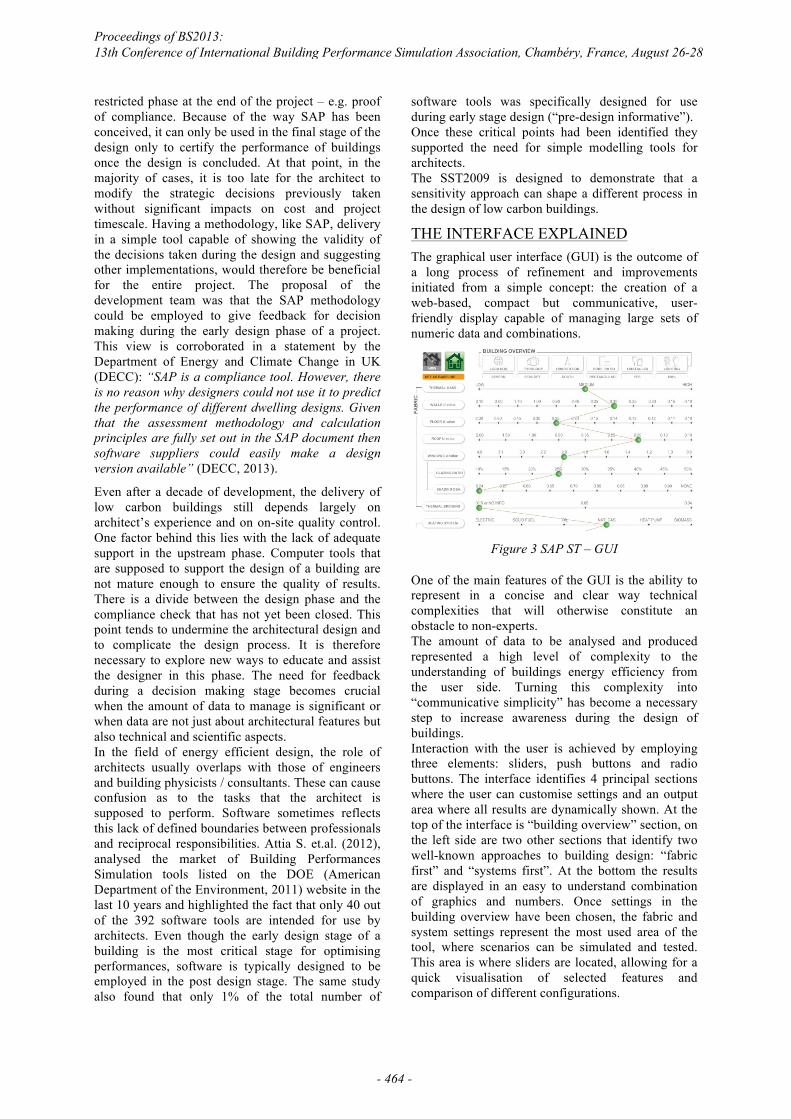
Figure 4 SAP ST Location and Solar Radiation
The ability to save the configuration of a building and to reload it quickly was identified as being useful to the user. Therefore the interface has been equipped with a set of functional buttons that automatically generate a web link (bitly short link). The link stores the information related to the building configuration created. A link can be than copied or shared through twitter or email. This mechanism allows design team members or assessors to collaborate over the internet, exchanging ideas and comparing early stage results.
The GUI is based on “mouse interaction only”. The omission of the possibility for the user to interact with the keyboard has allowed us to maintain the broadest compatibility with different devices and computer environments, especially in relation to the use of the SST2009 on tablets or smart phones. Sliders, in particular, represent the key element of the interface. Precedents of the use of sliders in web-based applications have been investigated. Relevant to this is work conducted by Dr. Andrew Marsh, specifically two projects: the “Robustness Calculator” and the “Simple Parametric Modelling Experiment” (Dr. Marsh A., 2010), which reinforced the decision to employ the slider’s approach on the SST2009.
THE SENSITIVITY TOOL The SST2009 has been created with the primary objective of informing and supporting architects during the design stage of dwellings, thus reducing the gap between decision making and optimal energy performance of buildings. In a single graphical environment the user of SST2009 has the opportunity to simulate the behaviour of many buildings modelled with different characteristics. The simplicity of the tool makes the SST2009 ideal for a variety of possible users, from architects, assessors, local authority building control officers and students.
Even though the SST2009 makes use of the latest SAP (2009), the tool is not a substitute for a full SAP assessment. For this reason it is not possible to use it for generating Energy Performance Certificates (EPCs) or to run compliance checks with Part L. SST2009 has been developed with the sole purpose of facilitating the understanding of aspects that are otherwise complex. Limitations have been made in the variety of information that the user can process, with the intent of preserving simplicity of use and communicability. These simplifications have been decided by means of case studies and comparative analysis of the impact of parameters within the SAP engine on existing buildings. During this study it has been noticed that complexity of input could have been reduced at the expense of a slight loss of accuracy in results. Accredited software (Stroma Fsap 2009’s) has been used to validate and compare the results from the SST2009. Testing revealed an error magnitude of maximum 4% between a full Sap Assessment and the results from the SST2009. Importance has been also given to those inputs that, because of the peculiarities of the early stage analysis, are fully known. As a result of the studies it has been possible to identify parameters that caused the greatest impact on the results, such as: • Orientation of the dwelling • Fabric U-values • Area of glazing – solar gain • Ventilation • Thermal Bridging and Air Leakage • Energy Efficient Lighting • Use of green energy (solar) • Heating Controls and Secondary Heating (wood
burning stoves) The SST2009 offers a wide range of case studies included in the graphical interface. These case studies are completely interactive and they can be modified by the user to approximate the characteristics of the building he/she would like to simulate. So far 44 case studies have been collected and categorised to be representative of the Welsh housing stock (Rhodes, Agyenim, Knight, 2007). Other features of the SST2009 are for example the possibility for the user to select UK thermal region recognised inside the SAP model and the possibility to calculate the electric potential of photovoltaic
Figure 5 SAP ST output window.
Proceedings of BS2013: 13th Conference of International Building Performance Simulation Association, Chambéry, France, August 26-28
- 465 -

panels on the basis of solar radiation corresponding to the selected region but not bound to it. In this way, the user can check in a few clicks the differences in output of panels installed in different climatic regions, and eventually understand the scope for improvement of the system (Figure 4). Results displayed during the sensitivity analysis are dynamically shown at the bottom of the interface. The outputs are: class of performance of the building (from A to G), target emission rate (TER), dwelling emission rate (DER), SAP rating, “DER < TER” check and electricity balance. Moreover the tool is also able to assess the overheating risk and the percentage of CO2 reduction over a baseline building (Figure 5).
CASE STUDY Tests conducted by the research team during the stages of development and then later on, thanks to the involvement of construction professionals in Wales, have produced interesting results, especially on two fronts.
Application in architectural practices From a practical point of view the sensitivity tool has demonstrated an ability in facilitating and informing design. After the release, users commented very positively on the capabilities of the tool. The judgment of users appears to encourage and support future developments of sensitivity tools related to the early stages of the design. The simplicity and clarity of the interface has been appreciated, as has the approach used to demystify the complexity of the procedure. Comments like the following have demonstrated the appreciation for this approach: “It’s amazingly clear and fast showing you what the impact (of different parameters, ndr) is […]. Makes you wonder why this has not happened before”. And again: “This is a handy tool […] that will help inform the specification and design for meeting target ratings under Part L1a and Part L1b”.
Unexpected results From a technical point of view the use of the SST2009 tool displayed unexpected behaviour in the manner in which certain characteristics of the building are modelled. In this respect it is interesting to notice that varying the thermal mass can cause the output to behave very differently according to different case scenarios; its performance is also related to the location of the insulation within the wall/floor/roof, hence its difficulty with generalising it. !Thermal mass is conceived as a highly effective energy saving feature mainly in passive design, but in standard contemporary dwellings it does not necessarily lead to energy savings since it requires a larger amount of energy to be heated up. In principle most of this heat should be returned into the space when the temperature drops but this isn’t always the case, and often the energy that is absorbed by the
thermal mass can be wasted (either through thermal bridges to the outside, or just because the thermal mass is inappropriate for the size of the space - hence the thermal lag is not beneficial for the specific scenario). Using the SST2009, we have observed that in all cases but the flats, the thermal mass behaves opposite to the SAP rating, that is: the more thermal mass the property has, the lower the SAP rating becomes, respectively reducing the CO2 savings. The opposite is observed when analysing a flat. Comparisons with Stroma Fsap 2009’s results showed the same behaviour, in particular the results for a detached house.
CONCLUSIONS The need for a simple and intuitive tool based on the SAP methodology for use primarily by architects was identified through workshops carried out as part of the European founded project: Delivering Low Carbon Buildings Cymru. The SST2009 was developed as a possible response to this demand. The SST2009 has been improved in a series of iterations based on user feedback since its initial release. The results of user BETA testing have been very positive, commenting on the ease of use and new approach to design tool use. The simplicity of the tool makes the SST2009 ideal for a variety of possible users, from architects, assessors, local authority building control officers and students. Although the simulation of dwellings in SAP is not new, examples of unexpected behaviour in the SAP 2009 methodology can be demonstrated using the SST2009. For example when investigating the impact of thermal mass in apartments, the improvements to carbon emissions swap directions when the fabric thermal efficiency is increased. These unexpected results are currently being investigated further in order to establish the extent to which varying factors can affect the outcome. The main benefit of the SST2009 is to allow the user to explore design options at the early design stage.
ACKNOWLEDGEMENT The authors would like to acknowledge the support of the Academic Expertise For Business (A4B) programme through the Welsh Government.
REFERENCES Department of Energy and Climate Change, The
government’s standard assessment procedure for energy rating of dwellings, 2011.
Delivering Low Carbon Buildings Cymru; from Policy to Practice, European Project, Workshop feedback: www.lowcarboncymru.org/ events.html
Attia S. et al., Simulation-based decision support tool for early stages of zero-energy building design, Architecture et Climat, Université Catholique de Louvain, 1348 Louvain La Neuve, Belgium,
Proceedings of BS2013: 13th Conference of International Building Performance Simulation Association, Chambéry, France, August 26-28
- 466 -
Building Physics and Services, Eindhoven University of Technology, The Netherlands
Radford, A. D. and Gero, J. S. (1980). Tradeoff diagrams for the integrated design of the physical environment in buildings, Building and Environment, Volume 15, Issue 1, 1980, Pages 3-15.
Approved Document L1: Conservation of fuel and power, HM Government December , 2010, www.planningportal.gov.uk/buildingregulations/approveddocuments/partl/approved
American institute of Architects, Integrated Project Delivery: A Guide, AIA, 2007.
European Parliament and Council (2010). Energyperformance of buildings. Directive 2010/31/EU.Luxembourg, Official Journal of the European Union.
HM Government, Department of Energy and Climate Change (2013), 2050 Pathways: www.gov.uk/2050-pathways-analysis
Building Research Establishment General Information Leaflet 31, BRE Domestic Energy Model (BREDEM), BRE, 1997
Building Research Establishment, National Calculation Method: http://www.ncm.bre.co.uk/
SDR222/2010 New House Building and Social Housing Sales, Welsh Government, 15/12/10
SDR216/2012 New House Building in Wales, Welsh Government, 12/12/12
SDR25/2012 Dwelling Stock Estimates for Wales, Welsh Government, 22/02/12
Hensen J. L. M., Lamberts R., Introduction to building performance simulation. Building performance simulation for design and operation, 2011, Pages 1-14.
Zapata G., Tweed C., From low carbon policy intent to design practice. Welsh School of Architecture, Cardiff University, UK.
HM Government, Department of Energy and Climate Change, SAP introduction, 2013
Attia S et al., Selection Criteria for Building Performance Simulation Tools: Contrasting Architects and Engineers Needs, Architecture et Climat, Université Catholique de Louvain, 1348 Louvain La Neuve, Belgium, Building Physics and Services, Eindhoven University of Technology, The Netherlands
U.S. Government Department of the Environment, Building Energy Software Tools Directory, 2011
Dr. Marsh A., November 2010, Graph Robustness Calculator: http://andrewmarsh.com/blog/2009/11/01/graph-robustness-calculator, Simple Parametric Modelling Experiment:
http://andrewmarsh.com/blog/2010/02/28/simple-parametric-modelling-experiment
Rhodes M., Agyenim F. and Knight I.P. - Categorising the Existing Welsh Housing Stock in Terms of Heating and Cooling Demand and Thermal Storage Capacity, Proceedings of 2nd Palenc and the 28th AIVC Conference, Crete, September 2007.
Wilde, P. D. & Voorden, M. V. D. 2004. Providing computational support for the selection of energy saving building components. Energy and Buildings, 36, 749-758.
Augenbroe, G. & Hensen, J. 2004. Simulation for better building design. Building and Environment, 39, 875-877.
Struck, C. & Hensen, J. 2007. On supporting design decisions in conceptual design addressing specification uncertainties using performance simulation. International Building Performance Simulation Association. Beijing, China.
Clarke, J. A., Johnstone, C. M., Kelly, N. J., Strachan, P. A. & Tuohy, P. 2008. The role of built environment energy efficiency in a sustainable UK energy economy. Energy Policy, 36, 4605-4609.
Raslan, R. & Davies, M. 2012. Legislating building energy performance: putting EU policy into practice. Building Research & Information, 40, 305-316.
Proceedings of BS2013: 13th Conference of International Building Performance Simulation Association, Chambéry, France, August 26-28
- 467 -