simpler, stronger bank
TRANSCRIPT

WESTPAC 2021 ANNUAL REPORT
Simpler, stronger bank

About this report
Westpac’s 2021 Annual Report is our primary statutory and regulatory reporting disclosure. It comprises information about our activities, strategy, and financial and non-financial results over the reporting period.
Cover story
Westpac Strathpine branch manager, Rachel, helping a customer. Read about how she supported a customer who was a victim of a scam on page 25.
Westpac Banking Corporation ABN 33 007 457 141
In this Annual Report a reference to ‘Westpac’, ‘Group’, ‘Westpac Group’, ‘we’, ‘us’ and ‘our’ is to Westpac Banking Corporation ABN 33 007 457 141 and its subsidiaries unless it clearly means just Westpac Banking Corporation. All figures in this Annual Report are for the 12 months ended 30 September 2021 unless otherwise indicated. All comparisons are against results for the 12 months ended 30 September 2020 unless otherwise indicated. All dollar amounts are in Australian dollars unless otherwise indicated. For certain information about the basis of preparing the financial information in this Annual Report see ‘Reading this report’ in Section 2. In addition, this Annual Report contains statements that constitute ‘forward-looking statements’ within the meaning of Section 21E of the US Securities Exchange Act of 1934. For an explanation of forward-looking statements and the risks, uncertainties and assumptions to which they are subject, see ‘Reading this report’ in Section 2. Information contained in or accessible through the websites mentioned in this Annual Report does not form part of this report unless we specifically state that it is incorporated by reference and forms part of this report. All references in this report to websites are inactive textual references and are for information only.

2021 has been a year of progress for Westpac. We reset our purpose and strategy last year and are delivering on our plans. Our major program to strengthen our management of risk and culture is well underway and we’ve simplified our business through asset sales and consolidations. While there is still more to do to restore value and the trust you have placed in us, these changes are making us a simpler, stronger bank.
1 STRATEGIC REVIEW 01
Strategic Review 01
About Westpac 02
2021 Year in review 04
Performance review 06
Chairman’s report 08
Chief Executive Officer’s report 10
External environment 12
Our strategy 14
Our strategic priorities 16
Fix 16
Simplify 20
Perform 24
Corporate Governance 33
Directors’ Report 36
Board of Directors 37
Executive team 40
Remuneration Report 50
Information on Westpac 7744Significant developments 74
2 GROUP PERFORMANCE 8811
882288449966111122
RReeaaddiinngg tthhiiss rreeppoorrttReview of Group operations
Divisional performance
Risk and risk management
Other Westpac business
information 113333
3 FINANCIAL STATEMENTS 113377
Financial statements 113388Notes to the financial statements 114444Statutory statements 226655
4 SHAREHOLDER INFORMATION 227755
227766228833
Shareholding information
Additional information
Glossary of abbreviations
and defined terms
Contact us
228844inside back cover
WESTPAC’S ANNUAL REPORTING SUITE
Our annual reporting suite brings together the Group’s financial, non-financial, risk and sustainability performance for the year. It includes our Annual Report, Financial Results Announcement, Presentation and Investor Discussion Pack, Pillar 3 Report, Sustainability Supplement, and our Corporate Governance Statement. Access the full suite online at westpac.com.au/2021annualreport.
Key informationAnnual Report
Corporate Governance Statement
Pillar 3 Report
FY21 Results Announcement
Sustainability Supplement
Operational performance
Strategy
Risk
Governance
Climate action
Sustainability
People and community
Financial performance
Shareholder information
Case study
3 FINA
NC
IAL STA
TEM
EN
TS2 G
RO
UP
PE
RFO
RM
AN
CE
1 STRA
TEG
IC R
EP
OR
T4
SHA
RE
HO
LDE
R IN
FOR
MA
TION
1WESTPAC GROUP 2021 ANNUAL REPORT

About Westpac
Founded in 1817, Westpac is Australia’s first bank and oldest company. We were established as the Bank of NSW in Sydney before expanding across Australia and New Zealand over the next century.
Over that time, we continued our expansion, acquiring several banks and growing our network across the region. In 1982 we changed our name to Westpac.
In 2008 we completed a merger with St.George Bank, acquiring the brands of St.George and BankSA and we relaunched the Bank of Melbourne brand in 2011.
In 2021, after resetting our purpose and strategy, we began to simplify our operations to refocus on banking in Australia and New Zealand. This year we exited several businesses, closed some international operations and are working to simplify our banking business through our lines of business operating model. Further simplification is expected in the year ahead.
Today we are one of the four major banks in Australia and one of the five major banks in New Zealand – supporting over 13.9 million customers.
We have branches, affiliates and controlled entities throughout Australia, New Zealand, Asia and in the Pacific region, and maintain branches and offices in some of the key financial centres around the world.
WESTPAC COMPRISES SIX MAJOR DIVISIONS
Consumer
Serving consumers in Australia with a range of banking products under the brands of Westpac, St.George, BankSA, Bank of Melbourne and RAMS.
Business
Serving the needs of small to medium businesses and commercial and agribusiness customers across Australia. This division also includes Private Wealth, supporting the needs of high-net-worth individuals.
Westpac Institutional Bank (WIB)
Delivering a broad range of financial services to commercial, corporate, institutional, and government customers operating in, and with connections to, Australia and New Zealand.
New Zealand
Delivering banking, wealth and insurance services to consumer, business and institutional customers across New Zealand.
Group Businesses
Comprising our head office and Australian corporate and support functions including treasury, technology, operations, property services, strategy, finance, risk, compliance, legal, human resources, and customer and corporate relations.
Specialist Businesses
Bringing together the Group’s non-core businesses that we ultimately plan to divest. These include superannuation, wealth platforms and investments, Auto finance, along with our operations in Fiji and Papua New Guinea. For part of the year, the division included our Vendor Finance and Australian insurance operations (General and Lenders Mortgage Insurance) which were sold during the year. The sale of Life Insurance and Auto finance is expected to be completed in 2022.
2 WESTPAC GROUP 2021 ANNUAL REPORT

Australia
Household deposits2 21%Mortgages3 21%Business credit3 15%
Customers4 12.6m
New Zealand
Consumer lending5 18%
Deposits5 18%
Business lending5 16%
Customers 1.3m
$3,081m
$1,789m
($670m)
$950m(A$ EQUIVALENT)
$9m
$193m
MARKET SHARE DATABRANDSFY21 CASH EARNINGS1
1 See cash earnings definition on page 6 of this Report.
2 APRA Banking Statistics, September 2021.
3 RBA Financial Aggregates, September 2021.
4 Includes customers outside Australia and New Zealand.
5 RBNZ, September 2021.
3 FINA
NC
IAL STA
TEM
EN
TS2 G
RO
UP
PE
RFO
RM
AN
CE
1 STRA
TEG
IC R
EP
OR
T4
SHA
RE
HO
LDE
R IN
FOR
MA
TION
3WESTPAC GROUP 2021 ANNUAL REPORT

2021 Year in review
OverviewIt has been another challenging year as COVID-19, and its associated lockdowns, continued to create uncertainty for economies and customers.
The pandemic’s human impact has been tragic, however the Australian and New Zealand economies have been much more resilient than originally expected. The combined support of governments, regulators and the banking sector helped to insulate these economies from the worst of the financial impacts.
Westpac continued to help customers – individuals and businesses – through the uncertainty with a range of targeted financial support. We remained open and available to customers in many branches and processing centres, while supporting over half of our people to work from home.
2021 has also been a year of progress for Westpac. Our major program to strengthen our management of risk and culture is well underway, we’ve simplified our business and performance has improved.
We have faced some setbacks. As we have worked to improve our management of risk, new issues have emerged. In addition, we have looked to accelerate the pace of change in line with both our own and regulator expectations. We have adjusted our plans and are meeting the milestones we have set ourselves – although we recognise there is still much to do.
Our Fix, Simplify and Perform strategic priorities are helping to frame what we do and provide clarity for our people. As part of Fix we are addressing our shortcomings, and dealing with risk and legacy issues, under Simplify we are focusing on banking in Australia and New Zealand and making things easier for customers and our people while Perform is our program to lift underlying performance and returns.
HIG
HS
Entered into an enforceable undertaking with APRA, after the regulator required a more comprehensive risk and culture program
Weaknesses in risk management and culture highlighted by Reserve Bank of New Zealand
LO
WS
Fix
CORE program1 to strengthen risk management and risk culture
121 of 327activities undertaken2
Addressed all items in AUSTRAC’s Statement of Claim
Substantially completed two major advice remediation programs. Over
$1bn paid oroffered to approximately 1 million customers
>30%Increase in financial crime specialists since 2019
Reduced average time to resolve complaints to
5.4 days
from 6.5 days
84%of complaints resolved at first point
Remediation required in our management of liquidity
Additional legal cases and investigations by ASIC
Potential external fraud relating to a portfolio of equipment leases
1 Customer Outcomes and Risk Excellence.
2 Activities undertaken and submitted to independent reviewer, Promontory Australia.
4 WESTPAC GROUP 2021 ANNUAL REPORT

4 non-core businesses sold3
3 non-core businesses announced for sale3
Reduced correspondent banking group relationships by
286
Closed
2international offices – a further 3 to be finalised by the end of 2022 calendar year
Helped over
17,200customers manage through COVID-19 loan deferrals4
Organisational Health Index
74 from 70
over the year
Restored growth in Australian mortgages
Plan to reduce cost base to
$8bn by FY24
Panorama over
$100bnin funds under management
284 products closed
Embedded lines of businesses operating model
Brought
>1,000 jobs back to Australia
Proposed sale of Westpac Pacific was not granted regulatory approval
Lagged peers in mortgage processing via brokers
4thConsumer NPS remains at the bottom of the peer group
Significant increase in costs in FY21 related to Fix priority spend
Significant write-offs in our institutional business and non-core assets
PerformSimplify
Multi-day BT Panorama platform outage disrupted many customers
Strong common equity tier 1 capital ratio
12.3%
$1.9bnin new lending to climate change solutions5
Women in leadership6
50%
Largest bank lender to greenfield renewable energy projects in Australia for past7
5 years
New 5 minute digital process to set up deposit accounts
3 See page 21 of this Report for full list.4 During 2021 COVID-19 lock-down, from July to September 2021.5 ‘Climate change solutions’ definition can be found in 2021 Sustainability Appendix – Glossary available online.6 The proportion of women in leadership roles across the Group. It includes the CEO, Group Executives, General Managers, senior leaders with
significant influence on business outcomes (direct reports to General Managers and their direct reports), large (3+) team people leaders three levels below General Manager, and Bank and Assistant Bank Managers. Senior Executive refers to the proportion of women in the combined Group Executives and General Manager populations.
7 IJGlobal and Westpac Research data.
3 FINA
NC
IAL STA
TEM
EN
TS2 G
RO
UP
PE
RFO
RM
AN
CE
1 STRA
TEG
IC R
EP
OR
T4
SHA
RE
HO
LDE
R IN
FOR
MA
TION
5WESTPAC GROUP 2021 ANNUAL REPORT

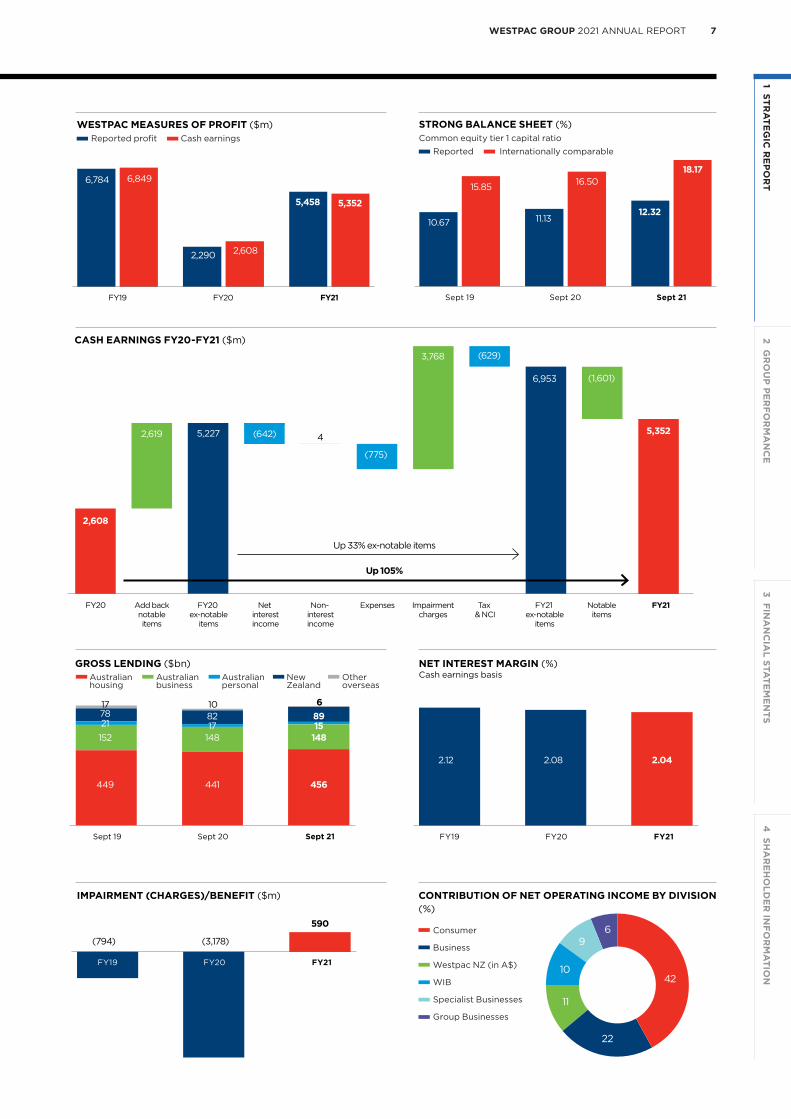
FY21 performance overview
In FY21, we recorded a net profit attributable to the owners of Westpac of $5,458 million, an increase of 138% on FY20.
The higher net profit was principally due to lower notable items and from released impairment provisions raised in 2020 as COVID-19’s financial impact was much lower than expected.
Notable items are larger infrequent items that we remove when assessing underlying earnings. In FY21 notable items were $1.6 billion, mostly related to the write-down of intangible items (goodwill and capitalised software) as detailed in section 3 of this Report. In FY20, notable items were $2.6 billion including costs associated with the AUSTRAC matter.
In FY21 there was a $3.8 billion turnaround in impairment charges as FY20 included a significant impairment charge reflecting the expected losses linked to the impacts of COVID-19. In FY21 we recorded an impairment benefit as the impact of COVID-19 has been much less than originally expected and some impairment provisions were reversed.
Cash earnings
The table below is on a ‘Reported’ earnings basis, however in assessing performance, we use ‘cash earnings’ – a measure of profit determined by adjusting reported earnings by three factors:
1. Material items that do not reflect ongoing performance.
2. Items that may not be considered when determiningdividends including the amortisation of intangible items,treasury shares or economic hedging impacts.
3. Accounting classifications between individual itemsthat do not impact reported results.
Cash earnings excluding notable items was up 33% (see cash earnings chart on opposite page) mostly from the turnaround in impairment charges.
Net interest income was lower, down 2%, on a cash earnings basis. While lending improved through the year, average interest earning assets were relatively flat and net interest margins were 4 basis points lower from historically low interest rates and strong competition, particularly in mortgages.
Non-interest income was higher from an improvement in insurance earnings while expenses were higher as we employed more people to support our strategic priorities, particularly Fix.
Asset quality improved over the year with stressed assets as a percentage of total committed exposures falling to 1.36%, from 1.91%. This ratio is still higher than pre-COVID-19 levels. Other indicators of asset quality have also improved including mortgage 90+ day delinquencies and total impaired assets.
Westpac had an income tax expense of $3.0 billion for Full Year 2021, with an effective tax rate of 36%. Including the Bank Levy our adjusted effective tax rate was 40%.
Together, higher earnings, the 2020 final dividend being underwritten, and the exit of non-core businesses, have further strengthened the Group’s capital base with our common equity tier 1 ratio of 12.3%, comfortably above APRA’s unquestionably strong benchmark of 10.5%.
FULL YEAR SEPT 2021
FULL YEAR SEPT 2020
% MOV’T SEPT 21
– SEPT 20
Net interest income 16,858 16,696 1
Non interest income 4,364 3,487 25
Net operating income 21,222 20,183 5
Operating expenses (13,311) (12,739) 4
Net profit before impairment charges and income tax 7,911 7,444 6
Impairment (charges)/benefits 590 (3,178) large
Profit before income tax 8,501 4,266 99
Income tax expense (3,038) (1,974) 54
Net profit for the period 5,463 2,292 138
Profit attributable to non-controlling interests (NCI) (5) (2) 150
Net profit attributable to owners of WBC 5,458 2,290 138
Total cash earnings adjustments (post tax) (106) 318 large
Cash earnings 5,352 2,608 105
Add back notable items (after tax) 1,601 2,619 (39)
Cash earnings excluding notable items 6,953 5,227 33
REPORTED NET PROFIT ATTRIBUTABLE TO OWNERS OF WESTPAC ($m)
Reported earnings
6 WESTPAC GROUP 2021 ANNUAL REPORT
16.50
11.13
15.85
10.67
STRONG BALANCE SHEET (%)Common equity tier 1 capital ratio
Reported Internationally comparable
Sept 19 Sept 20 Sept 21
12.32
18.17
2.08 2.042.12
NET INTEREST MARGIN (%)Cash earnings basis
FY19 FY20 FY21
GROSS LENDING ($bn)
Sept 19 Sept 20
441449
148152
827817 10
17
456
148
89
6
1521
Sept 21
Australian housing
Australian business
Australian personal
New Zealand
Other overseas
CASH EARNINGS FY20-FY21 ($m)
FY20 Add backnotableitems
FY20 ex-notable
items
FY21 ex-notable
items
Notableitems
Net interestincome
Non- interestincome
Expenses Impairmentcharges
Tax & NCI
FY21
5,227
(775)
(642) 4
3,768 (629)
6,953 (1,601)
5,352
2,608
2,619
Up 33% ex-notable items
Up 105%
2,6082,290
5,3525,458
6,8496,784
WESTPAC MEASURES OF PROFIT ($m) Reported profit Cash earnings
FY19 FY20 FY21
CONTRIBUTION OF NET OPERATING INCOME BY DIVISION (%)
Consumer
Business
Westpac NZ (in A$)
WIB
Specialist Businesses
Group Businesses
42
22
10
11
96
(3,178)
590
(794)
IMPAIRMENT (CHARGES)/BENEFIT ($m)
FY19 FY20 FY21
3 FINA
NC
IAL STA
TEM
EN
TS2 G
RO
UP
PE
RFO
RM
AN
CE
1 STRA
TEG
IC R
EP
OR
T4
SHA
RE
HO
LDE
R IN
FOR
MA
TION
7WESTPAC GROUP 2021 ANNUAL REPORT

Dear fellow shareholders,
It has been a privilege to complete my first full year as your Chairman. I am genuinely pleased at the progress the Company is making in its transformation and value creation, but equally disappointed at current and historical issues that persist as we pursue this journey.
Pleasingly, our earnings have recovered, our capital position is strong, and our share price has improved. Accordingly, we have been able to determine a higher dividend of 60 cents for the second half, and 118 cents for the year.
Our efforts to strengthen the balance sheet and exit non-core businesses have created surplus capital and enabled us to announce an off-market share buy-back of up to $3.5 billion. The buy-back will make us more capital-efficient while retaining sufficient capital for growth and unplanned events.
Reported profit was materially higher in FY21, up 138%. The better result was principally due to lower impairments and notable items. FY20 included provisions for the AUSTRAC civil penalty, large customer remediation-related provisions and write-downs linked to business exits as well as large credit impairment provisions as the COVID-19 pandemic emerged.
Through the year we restored growth in mortgages although we suffered margin attrition, as well as higher temporary costs to implement the Fix, Simplify and Perform priorities. Our main concern is the possibility of further margin attrition should interest rates remain low and competition remain intense. However, we remain committed to maintaining our market position, whilst securing a significantly reduced cost base with our $8 billion target for 2024.
Shareholders will also recall that on my appointment as Chair and Peter King’s as CEO last year, we announced a comprehensive program to transform Westpac into a simpler, more agile accountable organisation, building on our strong domestic banking franchises in Australia and New Zealand.
We announced plans for the exit of businesses that were inconsistent with that focus. This program is being executed well and is ahead of schedule. This is radically simplifying the bank and allows for increased management focus on our traditional core businesses.
To deliver our agenda, there is no substitute for a strong management team. Peter King has consolidated his position as CEO and has grown in the role. He has overseen a significant change in the senior management team as well as in the executives reporting to them. I believe we now have the right management team for the future.
The team is genuinely making progress including moving from a heavily centralised model to a decentralised one that is closer to customers and where decision making is faster.
Unfortunately, with all transformation programs, as we turn over stones, more issues reveal themselves. We faced several issues, particularly, but not exclusively, risk related, that continue to detract from our reputation and performance, while also absorbing considerable management attention, time, and remediation cost. These issues are not acceptable for a company of our quality and heritage.
For example, this year we entered into an enforceable undertaking with our regulator to lift our risk governance, while the Reserve Bank of New Zealand has required us to remediate similar weaknesses in our New Zealand operations. Other regulatory investigations are also underway that highlight the inadequacy of our past risk practices. Disappointingly, we also uncovered a significant potential external fraud relating to a portfolio of equipment leases and we are investigating how that happened, and strengthening our corresponding processes and controls. Drawing a line under these matters is a major priority for us and we are working towards a future where the news is predominantly good rather than mixed.
Chairman’s report
8 WESTPAC GROUP 2021 ANNUAL REPORT

1 IJGlobal and Westpac Research data.
The challenges created by COVID-19 remained during the year, and our teams continued to manage both its health and economic impacts. The Board and I have been proud of the way management has led and our people have responded. We kept our doors open to help customers in need and provided comprehensive support packages. These efforts have contributed to Australia and New Zealand’s economic resilience and demonstrate that our purpose – helping Australians and New Zealanders succeed – is reflected in our actions.
While uncertainty remains around the pandemic’s lasting impact, the rise in vaccination rates towards the end of the year has been cause for optimism about the path forward to economic recovery.
Operating sustainably has long been a part of Westpac’s culture and aligns with our purpose although expectations from the community, customers, shareholders and regulators have been increasing rapidly. We built on our plans during the year with the Board approving a detailed environmental, social and governance plan to deepen the integration of these areas into the business.
On the topic of climate change, we are carefully balancing our responsibility to move to a net zero economy, while supporting customers and the economy as they transition to a low carbon environment. In 2021 we provided $1.9 billion in new lending to climate change solutions and retained our position as largest bank lender to greenfield renewable energy projects in Australia for the past five years.1
Diversity also remains a focus and this year we joined the investor-led ‘40:40 Vision’ initiative to achieve 40:40:20 gender balance by 2030 for the Executive Team. As part of this commitment we set clear interim targets of 30% female representation by 2023 and 35% by 2027 and are tracking ahead of these targets with an expected 36% female representation by December this year. We have also reinforced our target of 50% Women in Leadership – an objective we have consistently achieved for the last 5 years.
Balancing the skills and diversity of the Board has also been a priority. We have also agreed the target of 40:40:20 gender balance for Board members, and by the end of calendar 2021 our female representation is expected to be 40%.
During the year, there were changes to the Board. Alison Deans stepped down at last year’s Annual General Meeting (AGM), Steven Harker retired in October, and Craig Dunn retires at this year’s meeting in December. I would like to thank them all for their dedication and service to the Company.
Two new Directors have joined us since last year’s AGM, Nora Scheinkestel and Audette Exel. Both are contributing well to the Board and committees.
Nora is an experienced company director and currently serves on several major Australian boards. She has experience across a range of public, private and government entities as well as the not-for-profit sector. Nora was an Associate Professor at the Melbourne Business School and has been a member of the Takeovers Panel.
Audette brings senior banking experience as Managing Director of Bermuda Commercial Bank and as a non-executive Director at Suncorp. She is the founder and CEO of Adara Group and was formerly Chair of the Bermuda Stock Exchange and a board member of the Bermuda Monetary Authority.
I would like to thank my colleagues on the Board and the management team for their commitment to Westpac’s success and for their effective participation in incredibly difficult circumstances due to COVID-19. I also thank our employees for continuing to serve customers both face-to-face and remotely.
Turning to the future, we are reshaping Westpac to be a bolder, different company for our customers and other stakeholders. We are embracing digital ways of dealing with customers, which we expect to have future economic benefits.
Our current view is that the Australian and New Zealand economies will continue to do well over the next few years, but this is partly dependent on COVID-19 which is likely to be with us for some time, in various forms.
At the same time, we expect that margins will continue to be under competitive pressure. At some point however, it is inevitable that interest rates will rise, which would create a more favourable banking environment.
For Westpac, we are working to lift returns as we simplify our business, harness improved performance from the new management team, dispose of non-core businesses and improve capital and expense efficiency. Together they should augur well for shareholders and customers over the next few years.
Yours sincerely,
John McFarlaneChairman
3 FINA
NC
IAL STA
TEM
EN
TS2 G
RO
UP
PE
RFO
RM
AN
CE
1 STRA
TEG
IC R
EP
OR
T4
SHA
RE
HO
LDE
R IN
FOR
MA
TION
9WESTPAC GROUP 2021 ANNUAL REPORT

Dear shareholders,
2021 has been both a challenging and significant year for Westpac, as we progress to become a simpler, stronger bank.
Managing through the uncertainties of COVID-19 has been a dominant feature of the last two years and our decisions have been focused on supporting customers whilst keeping our people safe and adapting the way we work. During the year we improved financial returns, continued to reshape our Company, and maintained a strong balance sheet.
Much of our effort has been directed to strengthening our foundations – particularly in the areas of risk management and financial crime – as part of our Fix strategic priority. We have made significant progress and are now increasingly shifting our focus to simplifying Westpac and improving financial performance and shareholder returns.
Managing the impacts of COVID-19
COVID-19, and associated lockdowns, has disrupted life for many of us. With the support of governments, regulators and the banking sector, the economies of Australia and New Zealand have proved resilient, although the effects on individual customers have been varied and, in some instances, devastating.
We have worked hard to support businesses and consumers through this uncertainty. Since the onset of the pandemic, we have provided approximately 160,000 mortgage deferrals and processed over 200,000 requests for early release of superannuation. For businesses, we have granted over 35,000 loan deferrals, provided more than $564 million in government guaranteed business loans and waived certain fees.
Keeping our people safe has also been a priority. We have introduced additional protections for those working in branches and operational sites whilst enabling over 20,000 employees to work from home. We were also one of the first companies to set up workplace-based vaccination hubs for employees and their families and have been trialling rapid antigen testing.
Transforming Westpac
In 2020, we announced a major change in our strategy to focus on banking in Australia and New Zealand and become a simpler, stronger bank. This included a new purpose and strategic priorities, establishing a ‘lines of business’ operating model, and commencing a program to improve our management of risk and our culture.
Our focus in 2021 has been on implementing these changes and embedding them in everything we do. Our strategic priorities of Fix, Simplify and Perform are providing clarity for the Company and we explain these in more detail in this Annual Report.
There is much to do, but we have a clear plan and are making progress.
Having the right executive team to lead our transformation is critical, and over the year we welcomed Scott Collary as our Chief Operating Officer, Anthony Miller to run our Institutional Bank, while Chris de Bruin is now responsible for our Consumer and Business divisions. In 2022 we will also welcome Shannon Finch as our Group General Counsel and Catherine McGrath as our new CEO for Westpac New Zealand. This will see 73% of Group Executives new to the bank or new to the Group Executive team since December 2019 when I commenced in the CEO role, and I am very pleased with the calibre and external experience I have in this team.
A key plank of our plan is the simplification of the Westpac business portfolio. Having completed the sale of four businesses, we have a further three sales due for completion by the end of the 2022 calendar year. We have also reduced our international footprint, closing our Mumbai and Jakarta offices. Three more international offices are expected to close by the end of the 2022 calendar year.
Central to our plans is the digitisation of our business. In 2021 we launched a new mobile banking app, made better use of intelligent technologies, and improved the stability of our infrastructure. This has been particularly important in making banking easier and more accessible for customers who have been in lockdown for much of the year.
CEO’s report
10 WESTPAC GROUP 2021 ANNUAL REPORT
Looking ahead, our digitisation roadmap will help us develop single product solutions for all our brands supported by a common infrastructure. We now have a new mortgage origination process with plans underway across our other lines of business as part of a multi-year program of work.
Our simplification program also includes consolidating products and streamlining our processes. We retired more than 200 products through the year and began to optimise end-to-end processes through our lines of business.
Our management of risk and risk culture has been a weakness, and this was reinforced by APRA’s review of our risk governance in late 2020. We are addressing this through our Customer Outcomes and Risk Excellence (CORE) program. The program has oversight of over 300 activities which aim to improve how risks are captured and managed, provide clarity on risk ownership and accountability, lift the quality of our data, and enhance oversight. We are one year into this program, and it will remain a priority for the next few years.
Strengthening our financial crime approach has also been an imperative. Through the year we rebuilt our processes, systems and practices and closed out all the matters referenced in AUSTRAC’s statement of claim. As with the CORE program, the end goal is to embed financial crime risk management into everything we do.
These changes and initiatives require significant investment, particularly in the early stages. We are balancing this with an ambitious plan to reduce expenses to meet our $8 billion cost target by 2024 (compared with $13.3 billion in FY21). Part of this reduction will be from the exit of businesses, but we will also improve efficiency by streamlining our head office to reflect our more simplified and focused business.
We are also dealing with a range of regulatory matters, mostly historical, and expect these to reduce next year.
Alongside these changes we are stepping up our actions on climate change. Reflecting the increased urgency for all our stakeholders, we have elevated our management of climate change to a key priority. This has been backed with Board-approved initiatives that will strengthen our actions, accelerate our understanding, and clarify our plans to support the transition to a net zero emissions economy by 2050.
The success of our change program relies on our people, and I could not be prouder of the way they have stepped up to the COVID-19 related challenges and embraced our transformation.
This was reflected this quarter with our OHI (Organisational Health Index) score of 74, up 4 points from our September 2020 baseline of 70. The OHI is part of our culture measurement approach which monitors our progress against our desired culture.
Performance
Full Year cash earnings increased 105% to $5.3 billion. As the Chairman indicated, the result was due to lower notable items and a turnaround in impairment provisioning. The lower notable items was due to lower write downs and lower provisioning for remediation and litigation and reflected some large items in Full Year 2020.
Cash earnings excluding notable items were $7.0 billion, 33% higher this year, mostly due to the turnaround in impairment charges. In FY20 impairment charges were high (at $3.2 billion) as we expected a large increase in stress linked to COVID-19. In FY21 there was an impairment benefit as some of the increase in provisions was no longer required.
Excluding notable items, core earnings (net profit before impairment charges and tax) were down 12% from lower income and higher expenses. Operating income was impacted by low interest rates, heightened competition, and a change in the mix of mortgages to lower spread fixed rate products. Higher expenses were primarily due to increased resourcing for our Fix priority.
Outlook
The economic environment remains difficult to predict. To date, the Australian and New Zealand economies have managed through COVID-19 well, however there is still much uncertainty, particularly as economic stimulus measures unwind.
For Westpac, lending demand is expected to be sound as the economy rebounds, although net interest margins will remain under pressure from low interest rates and competition. Expenses are expected to be lower as we simplify our business and work towards our $8 billion cost target by 2024. Our asset sales will improve our capital position however they will also reduce earnings.
Reflecting the strength of our capital position, we announced an off-market buy-back of up to $3.5 billion that will reduce our share count and which is expected to support our return metrics in the future.
It’s a privilege to lead Westpac through this defining time and I thank our 40,000 people, management team and Board for their commitment and passion. I am especially grateful to shareholders for your ongoing support and confidence as we steer the business onto the path of improved performance.
Yours sincerely,
Peter KingCEO
3 FINA
NC
IAL STA
TEM
EN
TS2 G
RO
UP
PE
RFO
RM
AN
CE
1 STRA
TEG
IC R
EP
OR
T4
SHA
RE
HO
LDE
R IN
FOR
MA
TION
11WESTPAC GROUP 2021 ANNUAL REPORT

This year has again been framed by the impact of COVID-19. The economic impact of the pandemic, while significant, has been much less than originally feared in 2020. This reflects government stimulus measures including payments to workers and businesses and very low interest rates. The banking sector has also played its part through repayment deferrals, fee waivers and helping customers move to contactless banking.
At the time of writing, several states are emerging from lockdown as vaccination rates have reached target levels. While the final impact of these lockdowns remains uncertain, it is expected that the economy will rebound relatively quickly.
In Australia and New Zealand, banks have recovered from the low returns of 2020. This was mostly because the material increases in credit impairment provisions in 2020 proved to be conservative (2021 saw relatively low levels of customer stress) and so provisions have been released. In addition, low interest rates have supported increased demand for housing and higher house prices – this in turn has contributed to higher system credit growth.
The regulatory environment continues to bring strong scrutiny for financial services companies and the increasing engagement of investors and global regulators on environmental, social and governance issues will see a greater focus on this important area, particularly on climate change.
Competition
Banking across Australia and New Zealand has remained highly competitive across price, engagement and innovation.
Low interest rates and significant market liquidity have been the major contributors as relatively easy access to funding has supported price-based competition for lending across both banks and non-banks.
Digital innovation has also continued to redefine the competitive landscape. The delivery of services and the infrastructure used to facilitate finance and transactions is evolving rapidly beyond the services typically supplied by banks.
This has led to several new entrants over recent years across home loans, business lending, buy now pay later, personal finance and transaction services. At the same time, some existing competitors have diverted more resources to key sectors, particularly home lending.
An active lending broker market and new technologies have also contributed to competition, allowing consumers and businesses to easily compare offers and to apply for lending faster.
Outlook
Uncertainty remains around the outlook for 2022 as Australia and New Zealand emerge from lockdown and government stimulus measures unwind.
That said, as the path out of previous lockdowns has been relatively fast there is some confidence that the economy will rebound relatively quickly and the level of stress for both consumers and businesses is unlikely to be a major concern.
We expect the lockdowns in Australia’s most populous regions will continue to unwind through November and December with most of the domestic economy to open in the 2022 new year.
Progress with international borders is expected to be gradual and Australia will experience challenges in attracting back students and workers.
Given these circumstances we expect GDP growth in Australia of 8.3% in the year to September 2022. This reflects the strong rebound in activity following the severe 4% GDP contraction expected in the September quarter of 2021 when both Sydney and Melbourne were in lockdown.
We expect the level of Australian GDP will return to its pre-delta path by the second half of 2022 although the losses in activity in the September 2021 quarter will not be fully recouped.
Recovery prospects are however likely to be tempered by shortages of skilled and unskilled labour (created by border closures) along with supply chain disruptions.
Unemployment has been remarkably resilient through 2021, partly reflecting falls in the participation rate as discouraged workers exited the workforce.
Despite a sharp contraction in employment following the lockdowns in the September 2021 quarter, the unemployment rate is expected to hold around 5% and decline through 2022 as labour shortages persist, despite moves to reopen international borders.
Australian house prices have risen 21% in 2021 despite the ongoing pandemic. Low interest rates, a price competitive financial system, and supply shortages are driving the market. This momentum is expected to be sustained into 2022 although APRA has already introduced policies to slow growth and further actions are expected in the new year.
2021 was another challenging year as we navigated a resurgence in COVID-19, managed through lock downs and very low interest rates and saw asset prices rise.
External environment
12 WESTPAC GROUP 2021 ANNUAL REPORT

Credit growth for the Australian financial system was 5.3% for the year to September 2021 with growth concentrated in mortgages as consumers responded to low interest rates. In the year to September 2022, total financial system credit is expected to grow by 6.2%. Housing credit growth is likely to reach 8.4% while business credit growth will hold around 3%. Personal credit, which has been in decline for some years, is expected to fall further in 2022 as consumers remain cautious on debt and use alternative sources of financial credit.
Very low interest rates will continue to weigh on banks and place pressure on net interest margins. The Reserve Bank of Australia (RBA) has indicated that the cash rate will not be increased until its objectives of full employment and inflation sustained around 2.5% are achieved. While the RBA does not expect this until 2024, Westpac is looking to early 2023 given the positive outlook for the unemployment rate and the likely emergence of some inflationary pressure.
The Reserve Bank of New Zealand (RBNZ) recently increased the overnight cash rate by 0.25% to 0.5% recognising emerging inflationary forces and a tight labour market. We expect there will be further increases in 2021 and 2022.
In 2022, the banking sector will increase its wholesale funding activities given completion of the RBA’s Term Funding Facility (TFF) and the withdrawal of the Committed Liquidity Facility (CLF) by the end of 2022. The CLF allowed banks to utilise internal securitisation to meet their liquidity requirements. These requirements will now need to be met by additional purchases of high quality liquid assets.
Westpac outlook
In Full Year 2022, Westpac is looking to grow lending broadly in line with its major bank peers, leveraging the momentum built up over the last year. The level of growth will depend on the scale of the economic recovery in Australia and New Zealand, measures put in place by regulators to slow mortgage lending, and Westpac’s own performance.
Net interest margins are expected to reduce further in the year ahead given very low interest rates, strong competition for loans and deposits and the return to more normal levels of term wholesale funding.
Revenue and costs (particularly non-interest income) in Full Year 2022 will also be impacted by the completion of sales of businesses. Over the past year we announced, and completed, the sale of four businesses, while a further three sales have been announced but have yet to complete. We are also working on the sale of other businesses in the Specialist Businesses division and further sales may be announced in the year ahead.
In May 2021 we announced a target cost base of $8 billion by 2024. This is an ambitious target, and we will begin to see the impact on our costs of simplification initiatives designed to meet this goal. This includes the further exit of businesses, completion of activities to fix our risk management shortcomings, business simplification and digitisation of processes.
In the past year, we devoted significant time and resources to improving the management of risk and addressing legacy issues. While we have made major inroads, costs related to this activity will likely continue in the period ahead. In particular, some litigation and regulatory investigations are ongoing and further costs or fines may emerge.
In Full Year 2021, impairment charges were a benefit, reflecting sound asset quality and the release of provisions built up in Full Year 2020 as we prepared for an expected rise in COVID-19 related stress. In Full Year 2022, impairment charges will likely increase with any rise dependent on a variety of factors including the speed of the recovery and the potential for ongoing government support. Regardless, the Group’s provision levels are adequate, and we are well placed to respond to any potential increase in stress.
Having materially increased capital ratios over recent years, we have surplus capital and have announced an off-market buy-back. This buy-back is expected to utilise a portion of our surplus capital and franking credits and reduce the share count. This should help to improve the Group’s return on equity and earnings per share while ensuring we retain sufficient capital for growth and uncertainties in the period ahead.
In 2022 we expect to devote additional resources to our Simplify and Perform strategic priorities. This will include further business sales, digitising more processes and continuing to streamline our operations.
With a sharper focus on banking in our core markets of Australia and New Zealand, a strong balance sheet and a highly committed team, we are well placed to see these plans through and improve the strength of our franchise.
3 FINA
NC
IAL STA
TEM
EN
TS2 G
RO
UP
PE
RFO
RM
AN
CE
1 STRA
TEG
IC R
EP
OR
T4
SHA
RE
HO
LDE
R IN
FOR
MA
TION
13WESTPAC GROUP 2021 ANNUAL REPORT
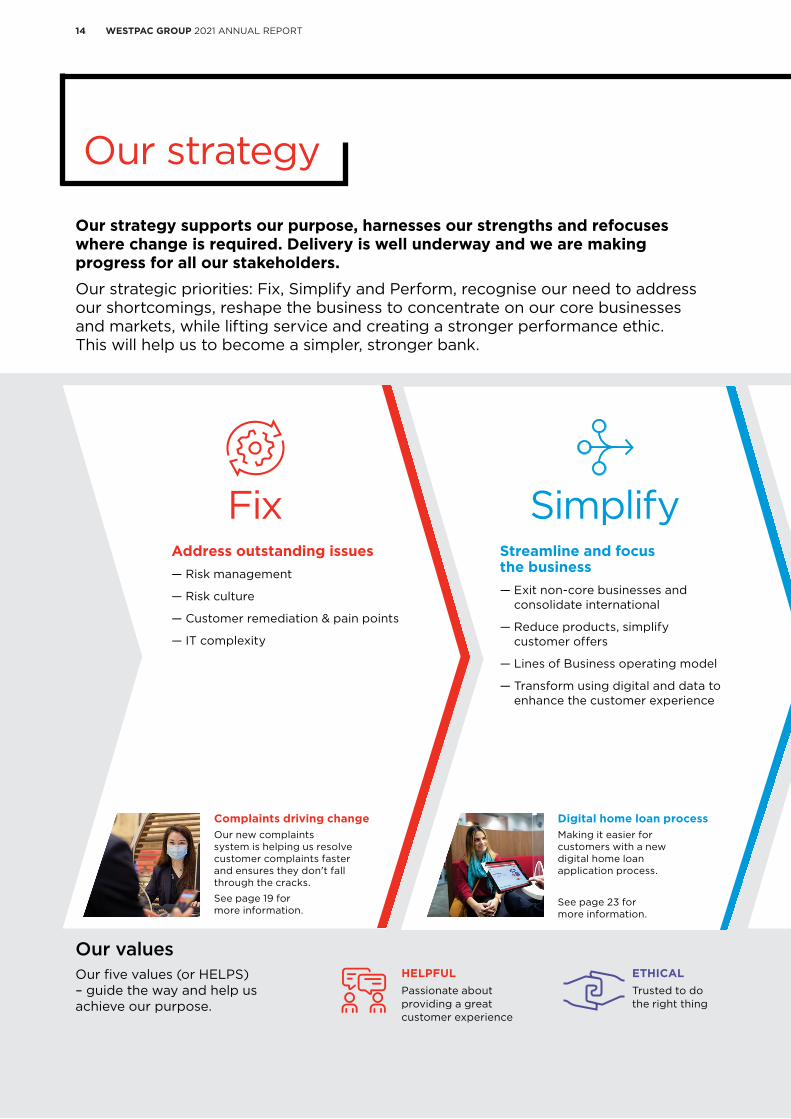
Our strategy supports our purpose, harnesses our strengths and refocuses where change is required. Delivery is well underway and we are making progress for all our stakeholders.
Our strategic priorities: Fix, Simplify and Perform, recognise our need to address our shortcomings, reshape the business to concentrate on our core businesses and markets, while lifting service and creating a stronger performance ethic. This will help us to become a simpler, stronger bank.
FixAddress outstanding issues
— Risk management
— Risk culture
— Customer remediation & pain points
— IT complexity
SimplifyStreamline and focus the business
— Exit non-core businesses and consolidate international
— Reduce products, simplify customer offers
— Lines of Business operating model
— Transform using digital and data to enhance the customer experience
Complaints driving change
Our new complaints system is helping us resolve customer complaints faster and ensures they don't fall through the cracks.
See page 19 for more information.
Digital home loan process
Making it easier for customers with a new digital home loan application process.
See page 23 for more information.
Our values Our five values (or HELPS) – guide the way and help usachieve our purpose.
HELPFUL
Passionate about providing a great customer experience
ETHICAL
Trusted to do the right thing
Our strategy
14 WESTPAC GROUP 2021 ANNUAL REPORT

PerformSustainable long-term returns
— Customer service – market leading
— Growth in key markets
— Reset cost base
— Enhance returns, optimise capital
— Strong balance sheet
— Climate change – focus on net zero
Our purposeHelping Australians and New Zealanders succeed.
Our focus Banking for Australian and New Zealand consumers, businesses and institutional customers.
Foiling scammers
Protecting customers from scams through updated transaction monitoring, training and customer education.
See page 25 for more information.
Stakeholder outcomes
$6.0bn paid to employees
$580bn in customer deposits
50% Women in Leadership roles
$710bn in lending1
$8.0bn total supply chain spend
$1.6m spent towards Indigenous-owned businesses
Suppliers
149.4 cents2 earnings per share
118 cents dividends per share
Shareholders
$4.6bn mortgage deferrals
$3.4bn paid globally in various taxes and the Bank Levy
The economy
$10.9bn lending to climate change solutions
Climate Change Position Statement and 2023 Action Plan
Environment
$144m in community investment
$12.1m towards Safer Children, Safer Communities program
Communities
Employees
Customers
1 Includes held for sale.
2 146.3 cents on a cash earnings basis.
LEADING CHANGE
Determined to make it better and be better
PERFORMING
Accountable to get it done
SIMPLE
Inspired to keep it simple and easy
3 FINA
NC
IAL STA
TEM
EN
TS2 G
RO
UP
PE
RFO
RM
AN
CE
1 STRA
TEG
IC R
EP
OR
T4
SHA
RE
HO
LDE
R IN
FOR
MA
TION
15WESTPAC GROUP 2021 ANNUAL REPORT

Fix
Fix is focused on addressing our shortcomings, improving our management of risk and culture, reducing customer pain points and completing historical customer remediation.
97%EMPLOYEES COMPLETED RISK LEARNING MODULES
600 STATEMENTS OF ACCOUNTABILITY HELD BY SENIOR LEADERS1
63%REDUCTION IN HIGH RATED ISSUES THAT WERE OPEN AT THE START OF FY21
~600 IMPROVED CRITICAL DATA ELEMENTS
Enhanced risk dashboardsSIMPLER AND STANDARDISED REPORTING TO EXECUTIVE TEAM AND BOARD
3 lines of defenceMODEL IMPLEMENTED ACROSS RISK CLASSES AND DIVISIONS
1 Statements of Accountability (SoA) outline the accountabilities and outcomes that leaders are required to deliver in their individual roles. The SoA provides clarity on delegations and authorities.
16 WESTPAC GROUP 2021 ANNUAL REPORT

Our CORE program
Our CORE program is central to improving our management of risk and building a strong culture.
To become a simpler, stronger bank we are rectifying our shortcomings at their source – and our Customer Outcomes and Risk Excellence (CORE) program is leading the change.
The CORE program was first established in 2020 and expanded in 2021 to address the issues identified by our own assessments and the findings of our regulators. This includes the Australian Prudential Regulation Authority’s (APRA) Risk Governance Review, completed in December 2020, which resulted in a court enforceable undertaking agreed with APRA.
The CORE program is a significant piece of work comprising 19 workstreams, underpinned by 80 deliverables and 327 activities. Each activity progresses through the three stages of ‘Design, Implement and Embed’. 80% of the Design activities are now complete with 95% expected to be reached by the end of the calendar year. At 30 September 2021, 121 of the 327 activities had been undertaken and submitted to the independent reviewer.
More than a set of activities, the CORE program is focused on achieving sustained improvement in our risk management effectiveness, and real outcomes including:
— A strong culture where accountability is clear
— Effective end-to-end risk management resulting in better customer outcomes
— A three lines of defence model where everyone is clear on their accountabilities and understands their role in identifying and managing risk
— Better insights, underpinned by high quality data
— Stronger risk oversight and better execution.
The quarterly reports of the CORE program’s independent reviewer, Promontory Australia, are being provided to APRA and released publicly every six months.
Strengthening our management of risk and risk culture through our CORE program.
A stronger risk culture
Creating a strong risk culture is an important objective of the CORE program. Our people must more proactively identify and manage risks, and work in an environment where they feel safe to speak up. We have updated our Code of Conduct, strengthened our whistleblower protections, and amended our performance management framework and recruitment approach. We are building the right workforce based on their values and behaviours.
Transforming these values and behaviours into a stronger culture must start at the top. Our senior leaders are expected to be role models in their attitudes and actions if we are to deliver genuine change. While it is early in the program, we are seeing improved results in our employee surveys and our leaders’ actions.
CHANGE STARTS AT THE TOP
Culture change initiatives for our most senior leaders have included:
— Refreshed Code of Conduct and incorporated new behaviours in our performance management framework. The roll-out of our Code of Conduct has been driven by our leaders
— Statements of Accountability for the Group’s top 600 leaders
— Leadership Culture Development training program for 500 of our most senior leaders to clarify the mindsets, skills and behaviours required
— Leadership dashboards incorporate new behaviours and are more transparent.
3 FINA
NC
IAL STA
TEM
EN
TS2 G
RO
UP
PE
RFO
RM
AN
CE
1 STRA
TEG
IC R
EP
OR
T4
SHA
RE
HO
LDE
R IN
FOR
MA
TION
17WESTPAC GROUP 2021 ANNUAL REPORT

Rebuilding our management of financial crime risk
Over the past 18 months, we have rebuilt our approach to financial crime. This program has been extensive, including elevating the Financial Crime, Compliance & Conduct function, with the Group Executive reporting directly to the CEO, and increasing the number of financial crime specialists by around one-third since 2019.
The rebuild has included upgrades to our technology, dedicating more resources to controls and transaction monitoring, and new training to increase the understanding of financial crime risk throughout the Group.
This transformation is part of a significant multi-year program of work aimed at improving Westpac’s management of financial crime risk, including addressing issues highlighted in the civil proceedings commenced by AUSTRAC against Westpac on 20 November 2019 in relation to alleged contraventions of the Anti-Money Laundering and Counter-Terrorism Financing Act 2006. These civil proceedings were settled in 2020.
Our program has now addressed all the matters referenced in AUSTRAC’s Statement of Claim and remediated over 350 issues.
These activities have materially improved our ability to detect and report potential financial crime. On the back of these steps, we are working to embed our new financial crime approach in everything we do.
Fix
OUR ‘SHOULD WE?’ TEST
This year we incorporated the ‘Should We?’ test into our Code of Conduct to help our people make decisions and encourage them to speak up.
After ensuring an issue complies with law and regulation as well as Westpac’s policies, processes, and guidance, we encourage our people to ask these ‘Should We?’ questions:
— Am I sure it helps us to fulfil our purpose, values and behaviours?
— Am I sure it helps us achieve each of our Code of Conduct outcomes?
— Are we doing the right thing for our customers, communities as well as shareholders now and in the long term?
— Would I feel comfortable if I had to tell my manager or my family or friends?
40,000+ HOURS OF FINANCIAL CRIME AWARENESS TRAINING DELIVERED IN FY21
60 TRANSACTION MONITORING RULES UPDATED OR NEWLY IMPLEMENTED
UPGRADED TRANSACTION SCREENING SOFTWARE AND SETTINGS TO BETTER DETECT REPORTABLE CUSTOMER ACTIVITY
18 WESTPAC GROUP 2021 ANNUAL REPORT

Improving the way we identify, manage and resolve complaints.
Putting things right for customers
We get things wrong from time-to-time and when we do, we want to put it right. We are carrying out remediation programs to resolve historical issues.
We put things right for approximately one million customers by paying or offering more than $1 billion in compensation in 2021, and have paid over $1.5 billion across all programs to date. We have substantially completed payments associated with the two largest financial advice programs.
Resolving customer pain points
A significant component of our Fix agenda has been to remove obstacles standing in the way of great customer experiences. We are removing these customer pain points by improving our management and mitigation of complaints.
We continue to embed a culture where frontline teams own and resolve complaints for customers at first point. Our new digital complaints management system guides bankers on resolutions to create more consistent outcomes, our Artificial Intelligence complaints bot assists bankers to solve complaints in the moment and automated system controls ensure compliance. In addition, we’ve made the complaints process more accessible for customers with new tools and resources, such as Easy English Guides and Auslan translation videos. These changes are contributing to:
— Reduced average time to resolve complaints to 5.4 days in Full Year 2021, from 6.5 days in Full Year 2020
— 84% of complaints are resolved at first point
— Addressing the top three complaint pain points, implementing 113 improvement initiatives
— Through driving our culture of encouraging complaints and improving logging behaviour, total number of complaints increased 33% over the year.
Resolving complaints faster is contributing to a better customer experience and is reinforcing a culture where employees own and act upon complaints faster.
COMPLAINTS DRIVING CHANGE
Our new digital complaints management system allows employees to manage and own every complaint – improving the experience for customers. By analysing the system’s data, we identified over 400 improvements to our products, services, and processes to reduce customer pain points and fix issues before they impact others. For example, an out-of-service 1300 number was mistakenly included in a customer letter. After a customer called to complain about the error and it was logged, our complaints team fixed the issue before the same letter was sent to a further 13,000 customers.One new system supports faster complaint resolution and ensures customer complaints do not fall through the cracks.
3 FINA
NC
IAL STA
TEM
EN
TS2 G
RO
UP
PE
RFO
RM
AN
CE
1 STRA
TEG
IC R
EP
OR
T4
SHA
RE
HO
LDE
R IN
FOR
MA
TION
19WESTPAC GROUP 2021 ANNUAL REPORT

Simplify
Simplify is about returning to our core business of banking in Australia and New Zealand, exiting non-core businesses and consolidating our international footprint. It also includes making banking easier for customers by rationalising our products and simplifying processes via digital.
284PRODUCTS CLOSED
BROUGHT
>1,000JOBS BACK TO AUSTRALIA
20 WESTPAC GROUP 2021 ANNUAL REPORT

A simpler bank
To become a simpler bank, we are exiting non-core businesses and consolidating our international footprint.
In 2020, we established our Specialist Businesses division to bring together the businesses we plan to exit. This year, we completed four business sales and exited two investments in Zip Co. and Coinbase Inc. In addition, we have announced the sale of three more businesses and expect to complete these sales by the end of the 2022 calendar year.
In December 2020, we also announced the sale of our Westpac Pacific business, however following the decision by Papua New Guinea’s Independent Consumer and Competition Commission to deny authorisation for the proposed acquisition, the parties agreed to terminate the relevant sale agreements. We will continue to operate our Fiji and PNG operations and support our Pacific customers while considering other options.
Together, the businesses sold have added around 34 basis points to the Group’s common equity tier 1 capital ratio, while businesses scheduled for sale are expected to add a further 29 basis points once completed.
During the year, we began the consolidation of our international presence by closing offices in Mumbai and Jakarta. We are currently underway with the closure of our Beijing, Shanghai and Hong Kong offices, which we expect to complete by the end of the 2022 calendar year. We will support customers in Asia from our Singapore office.
Our major institutional offices outside of Australia and New Zealand include Singapore, London and New York and we are in the process of opening a Frankfurt office to support customer relationships in Europe.
Embedding our new operating model
Last year we introduced our Lines of Business operating model, restructuring our business along major customer offerings. This model creates better end-to-end responsibility for product lines and is allowing us to simplify processes.
Our focus through the year was to embed the model across our Australian businesses. This included delegating more responsibility to each line of business and continuing to map and refine end-to-end processes.
For example, in our mortgage line of business, we have made over 70 changes to simplify processes and speed up approval times for customers.
Implementation of the lines of business operating model is underway in New Zealand.
Returning to our core business of banking in Australia and New Zealand and simplifying everything we do.
OUR LINES OF BUSINESSES
Consumer Business Institutional Specialist Businesses New Zealand
Status of Implementation:
Consumer & Small Business Customer Engagement
Mo
rtg
ag
es
Co
nsu
mer
Fin
an
ce
Cash
& T
ran
sacti
on
al
Ban
kin
g
Bu
sin
ess
Len
din
g
Fin
an
cia
l Mark
ets
Glo
bal T
ran
sacti
on
Serv
ices
Co
rpo
rate
an
d
Inst
itu
tio
nal B
an
kin
g
Insu
ran
ce
Sp
ecia
list
Fin
an
ce
Pla
tfo
rms,
Invest
men
t an
d O
pera
tio
ns
Su
per
Tre
asu
ry
Co
nsu
mer
Ban
kin
g
an
d W
ealt
h
Co
rpo
rate
an
d
Inst
itu
tio
nal B
an
kin
g
CommercialRelationships
Private Wealth
Complete Finalising interfaces Scoping support interfaces
Businesses/investments sold Completed
Zip Co. Ltd. Oct 2020
Coinbase Inc. May 2021
General Insurance Jul 2021
Vendor Finance Jul 2021
Westpac LMI Aug 2021
Westpac NZ Wealth Advisory Dec 2020
Announced sale Completion expected
Motor Vehicle Finance First half of 2022
Westpac NZ Life Insurance First half of 2022
Westpac Life Insurance Second half of 2022
PROGRESS ON PORTFOLIO SIMPLIFICATION
3 FINA
NC
IAL STA
TEM
EN
TS2 G
RO
UP
PE
RFO
RM
AN
CE
1 STRA
TEG
IC R
EP
OR
T4
SHA
RE
HO
LDE
R IN
FOR
MA
TION
21WESTPAC GROUP 2021 ANNUAL REPORT

Simplify
Migrating more activity to digital means making it available to customers when they choose to bank. It’s a faster, easier, and more intuitive digital customer experience. It is also simpler for customers and the bank.
Our technology roadmap sets out our pathway to transform our technology to a modern single multi-brand environment, from the multiple systems we currently operate. Key steps in this change include reducing the number of products and services we offer and streamlining our processes. Fewer products and clearer processes help to optimise the change required.
Harnessing digital to make things simpler
COVID-19 has accelerated society’s move to digital and customer trends over the year reflect this. From online shopping to banking, since September 2020 the number of digitally active customers rose to 5.24 million and digital transactions increased to 316 million, up 3% and 14% respectively.
Given more banking can be completed online – and due to lockdowns – we are seeing fewer physical transactions and services. Over the year, ATM transactions were down 15% and over-the-counter transactions in branches and call centre volumes fell 7% and 11% respectively. The use of cash and cheques has also declined.
TRANSFORMING TECHNOLOGY UNDERPINNED BY FOUR PRINCIPLES:
End-to-end, insight-led digital experiences – designed for both customers and employees.
Simplified and digitised processes designed to be instant.
Modular technology – designed to easily evolve.
Digital to the core
Automation
Built to change
Evergreen technology
Systems built with embedded continuous currency. Designed to be secure, enduring and available.
Create leading digital experiences
— Completed roll-out of new Mobile Banking app for Westpac — New insights engine to provide right time and personalised
insights to customers
Seeking to build world-class data platforms
— Moved our data platform to the latest cloud technology — Open banking enabled for our major brands
Create flexible platforms focusing on:
1. Mortgages
2. Business lending
3. Transaction services
4. Payments
— Completed the roll-out of customer service hub – new mortgage origination platform for all major brands
— New, simple, cloud-based Banking as a Service (BaaS) savings and transaction products based on the 10X platform
Flexible bank platforms
Data
Digital
DIGITAL FOCUS AREAS AND 2021 PROGRESS
22 WESTPAC GROUP 2021 ANNUAL REPORT

NEW DIGITAL HOME LOAN EXPERIENCE
Our end-to-end digital mortgage application process is making it easier and faster for customers to apply for a home loan and to track its progress along the way. Launched in December 2020, the new process is paperless, allowing documents to be uploaded and once approved, loan offers can be accepted online. Customers can also request help along the way with customers and bankers all having access to the same information. Moving to digital is freeing up our people to spend more valuable time with customers. Westpac Home Finance Manager, Rebecca, received a home loan application late one Friday afternoon. Instead of preparing paperwork in the branch, the customer completed the digital application over the weekend and met with Rebecca on the following Monday morning – the same day the loan was approved.
PRODUCT SIMPLIFICATION FOR SELECT PRODUCT LINES1 – FY21 VS FY20
Sep 20 Sep 21
339 329
161
68
109
47
Cash & Transactional Banking2
Mortgages Consumer Finance
221195
New Zealand
1 Includes both products for sale and products not for sale.
2 Includes cash management.
We continued to strengthen our technology, simplifying and increasing reliability. In 2021, developments included:
— Launched a state-of-the-art integrated command centre helping us to more quickly identify and respond to issues
— Upgraded branch network, improving bandwidth by ten-times, reducing operating costs by 50% and increasing transaction speed
— Decommissioned 116 applications to simplify our technology
— Two thirds of infrastructure services (networks, servers, workplace technology) have shifted to evergreen models.
Stability of our infrastructure has also improved with a reduction in major technology incidents from 51 to 31 over the year, while delivering and executing 19% more changes.
Fewer, simpler products
Creating an easier and more streamlined experience for customers is a vital aspect of our simplification agenda. Over many years we became complex with too many products, too many manual process variations, and an excessive number of fees. This complexity added risk, increased cost, and made it difficult for both our employees and customers.
To better serve customers, we are working to simplify fees and processes. Over the year we removed 284 products and associated fees across consumer and business banking.
The chart below illustrates the reduction over the year in select products. In addition, in WIB we exited or restricted 286 correspondent banking group relationships. In our Specialist Businesses division, we migrated over $56 billion in funds from the BT Wrap platform to BT Panorama and completed the migration of Advance Retirement Suite members to BT Super, which resulted in 3,070 accounts and $209 million in funds management transferred.
3 FINA
NC
IAL STA
TEM
EN
TS2 G
RO
UP
PE
RFO
RM
AN
CE
1 STRA
TEG
IC R
EP
OR
T4
SHA
RE
HO
LDE
R IN
FOR
MA
TION
23WESTPAC GROUP 2021 ANNUAL REPORT

Perform
Perform is growing our customer franchise through great service, sharpening our focus on returns, and resetting the cost base. A strong balance sheet and engaged workforce forms the foundations of our performance. We are also focused on responding to climate change and building the pathway to support a net zero emissions economy by 2050.
$4.6bn HOME LOAN DEFERRALS WITH 10,500 CUSTOMERS SUPPORTED
$135mBUSINESS DEFERRALS WITH 2,600 BUSINESSES SUPPORTED
327 INTEREST FREE TEMPORARY OVERDRAFTS TO SMALL BUSINESS CUSTOMERS
209 BUSINESS COVID-19 GRANTS AT A TOTAL VALUE OF $627,000
Supporting customers1
1 During 2021 COVID-19 lock down, from July to September 2021.
24 WESTPAC GROUP 2021 ANNUAL REPORT

Committed to helping
Our purpose – helping Australians and New Zealanders succeed – guides what we do. It was reaffirmed over the year as we continued to support customers through the challenges posed by the pandemic.
COVID-19 has impacted customers in a variety of ways. For individuals and businesses in difficulty, we provided targeted support. This included repayment deferrals, fee waivers and special loans or overdrafts for business.
Our people have remained resilient and dedicated in the face of uncertainty. They have overcome disruptions to their own working arrangements and remained focused on supporting customers. In addition, our people have also helped customers with contactless banking, to better manage their finances and protected them from scams.
Our people have embraced the changes underway across the Company, as reflected this quarter by the lift in our Organisational Health Index score (OHI) up 4 points to 74 from our September 2020 baseline of 70.
Strong employee commitment and engagement are the foundation for improved service and this improvement positions us well for the period ahead.
Our people have worked hard to support customers through another challenging year.
14 VACCINATION HUBS
1,430 RAPID ANTIGEN TESTS ADMINISTERED
3,140 PARTICIPANTS IN VACCINATION PROGRAM
+20kEMPLOYEES WORKED FROM HOME
Supporting employees
PROTECTING CUSTOMERS FROM SCAMS
In the past year, the number of scams reported by customers doubled. From cons based on investments, buying and selling, and email compromise – scams are becoming more sophisticated and can be devastating for victims. Through our transaction monitoring, training and customer education, we’re helping to protect customers from scams.
In our Westpac Strathpine branch in Queensland, Branch Manager, Rachel, has seen first-hand the impact of scams. She recently helped a customer who was the victim of a telecommunications scam.
"Ray*” came to the branch and was very distressed. We sat down and he explained what had happened. I contacted our Scams Assist team who had thankfully blocked his account after detecting unusual activity," said Rachel.
The scammer claimed he was calling from Ray’s internet provider and gained access to his computer and online banking. Over $3,500 was transferred from Ray’s account triggering several fees.
Rachel worked with our specialist Scams team to halt the transfers, recover his funds, and reverse the fees. She also took Ray through a checklist to help him spot future scammers.
“Recovering Ray’s funds was an incredible relief and as a token of his appreciation, he donated some of the money to the Westpac Foundation,” said Rachel.
“Helping customers through times like these is the most rewarding part of my job”.
*Customer’s name has been changed
3 FINA
NC
IAL STA
TEM
EN
TS2 G
RO
UP
PE
RFO
RM
AN
CE
1 STRA
TEG
IC R
EP
OR
T4
SHA
RE
HO
LDE
R IN
FOR
MA
TION
25WESTPAC GROUP 2021 ANNUAL REPORT

Perform
A better experience for customers
Our customer satisfaction rankings have been challenged by the need to address our shortcomings and the impacts of the pandemic.
Our primary measure of customer satisfaction is the Net Promoter Score1,2 (NPS) and while our score improved over the year to -3.3 from -6.9, our rank for Westpac remains at the lower end of peers. Encouragingly, the trend has been improving and our St.George brand scores are ahead of the major banks but further improvement is required. Our scores partially reflect lower service levels, as we were not able to increase resourcing fast enough to meet increased COVID-19 related demands. They also reflect negative sentiment around branch closures and regulatory actions on historical matters.
To help improve service, we have boosted our front-line teams, and brought back over 1,000 roles to Australia in key contact and processing roles. As part of our Fix and Simplify agendas, we are addressing the root causes of service issues. This includes working to resolve customer complaints faster, simplify key processes and improve the customer experience through digital.
#3Business Banking NPS ranking1,3
#5 New Zealand Consumer and Business Banking NPS rankings4,5
1 Net Promoter Score measures the net likelihood of recommendation to others of the customer’s main financial institution for retail or business banking. Net Promoter ScoreSM is a trademark of Bain & Co Inc., Satmetrix Systems, Inc., and Mr Frederick Reichheld. Using a 11 point numerical scale where 10 is ‘Extremely likely’ and 0 is ‘Extremely unlikely’, Net Promoter Score is calculated by subtracting the percentage of Detractors (0-6) from the percentage of Promoters (9-10).
2 Source: DBM Consultants Consumer Atlas, August 2020 and August 2021, 6MMA. MFI customers.
3 Source: DBM Consultants Business Atlas, 6 months to August 2021. MFI customers, all businesses.
4 Source: 3 month rolling Retail Market Monitor data (survey conducted by Camorra Research). Respondents are asked about likelihood to recommend their main bank to family and friends on a scale of 1 (extremely unlikely) to 10 (extremely likely). Net Promoter Score is represents % of Promoters (recommend score of 9 or 10) minus % of Detractors (recommend score of 1 to 6).
5 Source: 6 month rolling Business Finance Monitor data (survey conducted by Kantar TNS among businesses with an annual turnover of $5 to $150 million). Respondents are asked about likelihood to recommend their main business bank to business colleagues and associates on a scale of 1 (extremely unlikely) to 10 (extremely likely). Net Promoter Score is represents % of Promoters (recommend score of 9 or 10) minus % of Detractors (recommend score of 1 to 6).
Improving service is a priority.
SUPPORTING VULNERABLE CUSTOMERS
We have specialist teams that support customers through tough times – like divorce and losing a loved one – and through domestic and family violence, elder abuse and scams. Over the year, 33,400 cases were escalated through our specialist vulnerability teams. Over 81,000 applications for financial assistance packages were approved for customers experiencing financial hardship.
Some initiatives include: — Piloting a savings buffer of at least $100 a month to help mortgage customers who seek hardship support when they are in financial difficulty. Financial Counselling Australia welcomed the initiative, which has now been included in the Australian Banking Association’s financial difficulty guidelines.
— Stopping threatening and abusive messages attached to payments. A bank account is no place for abuse, and over 700 warnings and suspensions have been issued to customers who sent abuse via digital banking.
— Introducing in-app functionality for our customers to block gambling transactions on eligible credit and debit cards across all brands. The block has been applied to over 30,000 cards.
26 WESTPAC GROUP 2021 ANNUAL REPORT

Restoring growth in our core businesses
Restoring mortgage and business lending growth was a major focus this year and we are building momentum in both areas.
We reached our target to grow mortgages in line with the major banks in the second half of the year. Through the year we employed more mortgage bankers, addressed key processing bottlenecks, and ensured our pricing was responsive to the competitive pressure in the market.
A key element of this turnaround has been the establishment of our Mortgage line of business. With clearer end-to-end accountability for key processes, this business has been able to make faster and more targeted decisions to support growth.
Growth in total Australian business lending across the industry was 4.6% for the year to September 2021 compared to 1.9% over the prior year.
We are making progress in business lending. In Australia, business and institutional lending was up 1% over the year and was 4% higher over the last six months.
While momentum has improved, additional opportunities remain. This includes further process improvements and directing more of our people from programs designed to resolve issues to front-line customer roles.
Strong balance sheet and improved capital efficiency
In banking, strong financial foundations across capital, liquidity and funding are paramount. We ended this financial year with a common equity tier 1 capital ratio of 12.3%, which was comfortably above APRA’s unquestionably strong benchmark of 10.5%. We had $9 billion in capital above this benchmark. This strength has supported the determination of a 60 cent per share dividend and enabled us to announce an off-market buy-back of up to $3.5 billion.
The buy-back will help us to optimise our capital base for the more focused business we are becoming, helping to improve per share metrics and future returns.
Cost reset
Digitisation and low interest rates are changing the banking industry and its returns. To remain competitive, we need to reduce costs. In May 2021, we set a cost target of $8 billion in expenses by 2024. This is an ambitious target given costs in 2021 were more than $13 billion.
Part of the cost reduction will be putting behind us significant remediation expenses and business write-downs. Costs will also be lower as we exit businesses. The final gains to reach our target are expected to flow from simplifying our operations and reconfiguring our head office to reflect our more focused business.
Elevating climate change action
Westpac has focused on climate change for many years. This year, we made a significant addition to our strategic priorities – elevating climate change as part of our Perform priority. Its importance to investors, customers and society more broadly has accelerated, and it was therefore appropriate to recognise in our major priorities. This includes explaining how we are supporting the transition to a net zero economy.
Climate forms part of our broader environmental, social and governance agenda, and we recognise that managing climate-related risks and opportunities is vital to the long-term sustainability of our Company. We were the first Australian bank to release a climate change position statement in 2008. In 2015 we supported the Paris Agreement and in 2017 we committed to managing our business in line with the Paris Agreement and the need to transition to a net zero emissions economy by 2050.
AUSTRALIAN GROSS MORTGAGE MOVEMENT ($bn)
(3.5)
1H20 2H20 1H21 2H21
(4.7)
2.6
12.0
xx
AUSTRALIAN GROSS MORTGAGE MOVEMENT ($bn)
3 FINA
NC
IAL STA
TEM
EN
TS2 G
RO
UP
PE
RFO
RM
AN
CE
1 STRA
TEG
IC R
EP
OR
T4
SHA
RE
HO
LDE
R IN
FOR
MA
TION
27WESTPAC GROUP 2021 ANNUAL REPORT

Climate change is one of the most significant issues that will impact the long-term prosperity of the global economy and our way of life. We are committed to managing our business in alignment with the Paris Agreement and the need to transition to a net zero emissions economy by 2050.
As a major financial institution, we recognise that we have an important role to play in supporting customers and communities in transition, through providing products and services.
This year, we continued to deliver on our Climate Change Position Statement and 2023 Action Plan (Climate Action Plan) while recognising the significant increase in the importance of climate change to our business and stakeholders. This includes:
— Helping customers and communities respond to climate change
— $15 billion target in new lending to climate change solutions by 20301
— Aiming to reduce our exposure to thermal coal mining to zero by 2030
— Financing of electricity generation sector to support Paris-aligned transition pathways to a net zero emissions economy by 2050
— Sourcing equivalent of 100% of Westpac’s electricity consumption through renewable energy sources by 2025.
Below is a summary of major developments this year, and further detail can be found in the Climate Change section of our 2021 Sustainability Supplement.
Developments on governance and oversight of sustainability matters
— Established a CEO-led Group ESG and Reputation Committee that will oversee our Climate Action Plan and wider ESG agenda. The Committee meets at least four times a year
— During the year the Board:
• attended a workshop led by industry experts on climatechange risks, and related Directors’ responsibilities
• reviewed our Climate Action Plan progress as part of its six-monthly sustainability strategy update
• endorsed extra resources to support our ClimateAction Plan.
Climate change
1 Over time period 2020 to 2030.
2 IJGlobal and Westpac Research data.
3 Includes Westpac Group operations in Australia, New Zealand, United Kingdom and Pacific. 2021 is the first year Westpac is reporting market based emissions to account for renewable energy investment. The base year of our Scope 1 & 2 and Scope 3 Supply Chain GHG reduction targets is calculated applying the location-based accounting method. Historic location-based data is used as a proxy for a market-based method, as electricity supplier emission factors or residual emission factors for some international operations are not available.
IN NEW LENDING TO CLIMATE CHANGE SOLUTIONS
Strategy
Progress on our Climate Action Plan and how we are helping our customers transition, included:
$1.9bn
LARGEST BANK LENDER TO GREENFIELD RENEWABLE ENERGY PROJECTS IN AUSTRALIA FOR PAST FIVE YEARS2
ELEVATED CLIMATE CHANGE RESPONSE TO A COMPANY-WIDE STRATEGIC PRIORITY
CONTINUED TO DEVELOP PARIS-ALIGNED FINANCING STRATEGIES AND PORTFOLIO TARGETS FOR SECTORS REPRESENTING THE MAJORITY OF OUR FINANCED EMISSIONS, WITH A FOCUS DURING THE YEAR ON OIL AND GAS, METALS AND MINING SECTORS
PARTICIPATED IN A RANGE OF INDUSTRY FORUMS INCLUDING THE UNITED NATIONS ENVIRONMENT PROGRAMME FINANCE INITIATIVE PRINCIPLES FOR RESPONSIBLE BANKING AND THE AUSTRALIAN SUSTAINABLE FINANCE INITIATIVE
REDUCED SCOPE 1 & 2 EMISSIONS3 BY 58% AGAINST A 2016 BASE YEAR AND 43% AGAINST 2020
ADVANCED WORK TO UNDERSTAND HOW BEST TO SUPPORT AGRIBUSINESS CUSTOMERS TO MANAGE CLIMATE RISK
28 WESTPAC GROUP 2021 ANNUAL REPORT

Developments on Risk Management
— Continued to embed sustainability and climate risk management in the Group’s Risk Management Framework, and aligned with the Three Lines of Defence model
— Worked to manage transition and physical risks across key loan portfolios – overseen by the Climate Change Financial Risk Committee
— Continued to support our existing thermal coal mining customers, managing our portfolio in line with a commitment to reduce our exposure to zero by 2030
— Continued to participate in APRA’s Climate Vulnerability Assessment
— Continued to build our understanding of physical risk in agribusiness and residential mortgage portfolios.
Metrics and targets
Further detail on climate metrics and targets is in our Sustainability Supplement.
Looking ahead
In 2022, we will continue developing Paris-aligned financing strategies and portfolio targets, particularly for sectors representing the majority of our financed emissions. We will work with customers and industry experts. The analysis will consider a range of factors, including the IPCC Sixth Assessment Report, the IEA’s Net Zero by 2050, A Roadmap for the Global Energy Sector Report, as well as the impact on the bank and customers, including in hard-to-abate sectors.
BUILDING OUR UNDERSTANDING OF TRANSITION CLIMATE RISKS
We seek to engage customers, particularly those in the most emissions intensive and climate-vulnerable sectors, to develop financing strategies to support their response to climate change impacts. We seek to provide our business customers1 with a range of innovative sustainable finance structures including green deposits, green bonds and sustainability-linked loans.
This year, we undertook further analysis to understand our Scope 3 financed emissions, which estimates that: — manufacturing, utilities and mining are the sectors2 with the highest emissions intensity per dollar lent — the majority of our lending is to relatively low-emissions intensity sectors such as property and residential mortgages.
ENERGY SECTOR VALUE CHAIN
Lending to the energy sector value chain3 can be described in the categories below. Overall, we saw a decrease in exposures to non-renewable energy sectors and an increase in exposures to renewable energy over the year.
1 Customers from our Institutional, Corporate and Commercial segments.
2 Manufacturing includes primary metal production and petroleum refining. Utilities includes electricity generation. Mining includes coal, oil and gas extraction.
3 All figures are Total Committed Exposures (TCE) at 30 September 2021 for WIB only.
4 For oil and gas extraction customers with LNG terminal operations, the exposures to LNG terminals is reported in the Transport category.
5 Coal exposures within diversified miners are apportioned by the percentage EBITDA contribution of coal in their latest annual financial statements. Thermal coal exposures in diversified miners is immaterial.
6 Australia and New Zealand only. Customers with operations across several sectors are attributed across those activities based on business segment contribution.
7 Other mining includes iron ore, metal ore, construction material, exploration and services.
8 Thermal coal mining is 43% of coal mining exposure (WIB only).
LENDING TO ELECTRICITY GENERATION AUS & NZ (%) LENDING TO ELECTRICITY GENERATIONAUSTRALIA AND NEW ZEALAND (%)
0.5
RENEWABLE NON-RENEWABLE
0
10
20
30
40
50
60
70
80
90
100
20212020201920182017201620152014201320122011
The share of renewables in our lending to the electricity sector has increased to 79%.
Total mining is 0.75% of Group TCE, lending to coal mining is 0.05% and lending to oil and gas extraction is 0.21% of Group TCE.
COAL MINING –THERMALAND METALLURGICAL8
OIL AND GAS EXTRACTION
OTHER MINING7TOTAL
9.7
10.7 10.5
9.08.4
5.3 5.4
6.15.55.7
3.8 3.93.6
2.42.8
0.6
1.40.8
0.50.5
MINING EXPOSURE($bn)
2017 2018 2019 2020 2021
MINING EXPOSURE ($bn)
Oil and Gas
Extraction4
FY21 $1.84bn FY20 $2.22bn
Exploration
FY21 $0.33bn FY20 $0.56bn
Coal
Metallurgical coal
FY21 $0.29bn FY20 $0.21bn
Metallurgical coal in diversified miners5
FY21 $0.02bn FY20 $0.03bn
Thermal coal
FY21 $0.22bn FY20 $0.30bn
Uranium
FY21 $0.08bn FY20 $0.03bn
LNG Terminal
FY21 $0.52bn FY20 $0.57bn
Coal
Rail
FY21 $0.30bn FY20 $0.28bn
Port
FY21 $0.32bn FY20 $0.44bn
Gas
FY21 $0.58bn FY20 $0.67bn
Black coal
FY21 $0.19bn FY20 $0.27bn
Brown coal
FY21 $0.03bn FY20 $0.03bn
Liquid fuel
FY21 $0.12bn FY20 $0.12bn
Hydro
FY21 $1.26bn FY20 $1.30bn
Other renewables
FY21 $2.23bn FY20 $1.89bn
Electricity and Gas
Networks
FY21 $3.80bn FY20 $4.53bn
Retailers
FY21 $1.01bn FY20 $0.77bn
Oil and Gas
FY21 $2.10bn FY20 $1.32bn
Mining and extraction
Oil and gas refining
FY21 $0.58bn FY20 $2.02bn
Electricity generation6
Transport
Distribution and retail
3 FINA
NC
IAL STA
TEM
EN
TS2 G
RO
UP
PE
RFO
RM
AN
CE
1 STRA
TEG
IC R
EP
OR
T4
SHA
RE
HO
LDE
R IN
FOR
MA
TION
29WESTPAC GROUP 2021 ANNUAL REPORT

Human rights
We are committed to respecting human rights through our business and activities, including as a financial services provider, purchaser of goods and services, employer, and supporter of communities.
Our third Human Rights Position Statement and 2023 Action Plan (Human Rights Action Plan) sets out the principles that guide our approach.
Our Human Rights Action Plan commits to 19 actions that are underpinned by a commitment to respect human rights as set out in the UN Guiding Principles on Business and Human Rights. Under these actions we review our salient human rights issues annually to help prevent, mitigate and account for any adverse human rights impacts, and to inform our areas of focus.
This year’s review highlighted the need to continue supporting customers and employees through the impacts of COVID-19, as well as focusing on rights of Aboriginal and Torres Strait Islander peoples, privacy, workplace diversity and discrimination, human rights grievance mechanisms, and modern slavery. Actions included:
— Improved our management of privacy risks by enhancing our policies, processes and systems, and through updated training to lift the understanding of our employees of the requirements and risks
— Launched our Access and Inclusion Plan 2021-2024 to set out our actions for enhancing inclusion and accessibility practices
— Expanded our mental health support for employees in responding to the pandemic with a new mental health plan
— Updated our Responsible Sourcing Program to strengthen management and monitoring processes, to address ESG risks in our supply chain and take action to raise awareness in our supply chain of Speaking Up channels
— Conducted training with natural resources teams on Indigenous consent
— Published our fifth Modern Slavery Statement, and the first under the requirements of the Modern Slavery Act 2018 (Cth).
For further information on our salient human rights issues and specific management actions, please see our Sustainability Supplement.
TAKING ACTION ON MODERN SLAVERY
We published our first statement under the Modern Slavery Act 2018 (Cth) in March 2021. This statement was also in accordance with the Modern Slavery Act 2015 (UK). This was recognised by the Monash University Centre for Financial Studies as among the strongest for disclosure quality amongst the S&P/ASX 100.
Modern slavery is a challenge that no one organisation can solve alone. Cross industry collaboration through sharing of information and resources can help to drive effective change and reduce instances of modern slavery across industries.
As part of our Safer Children, Safer Communities program, this year we partnered with the International Centre for Missing and Exploited Children (ICMEC). ICMEC’s work focuses on the development of capability and technology tools across and within jurisdictions, working with diverse stakeholders across the area of child protection law enforcement and regulatory partners, private industry, the education community, primary healthcare and the medical profession and civil society partners.
Our partnership, which builds on scoping and discovery work conducted in FY20, aims to drive cross-industry data and knowledge sharing to better detect, monitor, report and prevent the use of the Australian payments platforms being used to process payments that relate to Child Sexual Exploitation (CSE). Modern slavery includes the worst forms of child labour, including the commercial sexual exploitation of children. The three-year $25 million data-sharing and innovation grant, managed by ICMEC, will be used to design, build, deploy and maintain a platform and analytic tools to aggregate insights and data from multiple industry participants to help identify perpetrators of Online Sexual Exploitation of Children (OSEC).
This is one way that we may provide for or cooperate in remedy. Access to ‘remedy’ is one of the key principles guiding our approach and commitment to respecting human rights. Our Human Rights Action Plan notes that remedy may take many forms, depending on how we identify our role in causing or contributing to human rights harm.
30 WESTPAC GROUP 2021 ANNUAL REPORT

Supporting local communities
Westpac Foundation1 awarded $1.95 million in job creation grants to social enterprises and $1 million in grants to 100 local organisations helping Australians become job-ready through education, training and employment opportunities.
As one of the region’s largest companies and providers of capital, we believe it is important we use our scale and reach to create positive impact across Australia and New Zealand.
This includes providing support in times of emergency and natural disasters and positively contributing to complex social and economic issues where we can have an impact.
Backing diverse business and social enterprise
Through our supplier inclusion and diversity program we support a variety of suppliers including Aboriginal and Torres Strait Islander businesses, social enterprises, Australian Disability Enterprises, women-led businesses and businesses with a B-corps certification. Despite some large contracts coming to an end and COVID-19 restrictions impacting some activities, in FY21 we spent $11.6 million with diverse suppliers.
Backing communities through our foundations
Westpac supports a number of foundations to support local communities. This includes:
— Westpac Foundation1: supporting social enterprises and community organisations that create jobs, training and education pathways for Australia’s most under-represented
— St.George Foundation2: providing grants to eligible Australian charities and community organisations to help improve the lives of children experiencing disadvantage
— BankSA Foundation3: supporting small, local charities helping to create a brighter future for South Australians and Northern Territorians experiencing disadvantage
— Bank of Melbourne Foundation4: supporting local charities and programs that deliver sustainable benefits to Victorians experiencing disadvantage.
Tomorrow’s leaders
Established to mark Westpac’s 200th anniversary in 2017, this year Westpac Scholars Trust5 awarded its 500th scholarship. The Trust, together with some of the nation’s leading universities, has now provided $31 million in scholarships to invest in individuals with leadership potential in areas important to Australia’s growth and prosperity – technology and innovation, Australia-Asia ties, and positive social change.
500+WESTPAC SCHOLARS AWARDED IN FIRST FIVE YEARS
1 Westpac Foundation is administered by Westpac Community Limited (ABN 34 086 862 795) as trustee for Westpac Community Trust (ABN 53 265 036 982). The Westpac Community Trust is a Public Ancillary Fund, endorsed by the ATO as a Deductible Gift Recipient. None of Westpac Foundation, Westpac Community Trust Limited nor the Westpac Community Trust are part of Westpac Group. Westpac provides administrative support, skilled volunteering, donations and funding for operational costs of Westpac Foundation.
2 St.George Foundation is administered by St.George Foundation Limited (ABN 46 003 790 761) as trustee for St George Foundation Trust (ABN 44 661 638 970), a Public Ancillary Fund, endorsed by the ATO as a Deductible Gift Recipient. While St George Foundation Limited is a related body corporate of Westpac Group, neither St.George Foundation nor St George Foundation Trust are part of Westpac Group. Westpac provides administrative support, donations and funding for operational costs of the Foundation.
3 BankSA Foundation is part of St.George Foundation and is administered by St.George Foundation Limited (ABN 46 003 790 761) as trustee for St George Foundation Trust (ABN 44 661 638 970), a Public Ancillary Fund, endorsed by the ATO as a Deductible Gift Recipient. While St George Foundation Limited is a related body corporate of Westpac Group, neither BankSA Foundation, St.George Foundation nor St George Foundation Trust are part of Westpac Group. Westpac provides administrative support, donations and funding for operational costs of the Foundation.
4 Bank of Melbourne Foundation is part of St.George Foundation and is administered by St.George Foundation Limited (ABN 46 003 790 761) as trustee for St George Foundation Trust (ABN 44 661 638 970), a Public Ancillary Fund, endorsed by the ATO as a Deductible GiftRecipient. While St George Foundation Limited is a related body corporate of Westpac Group, neither Bank of Melbourne Foundation, St.George Foundation nor St George Foundation Trust are part of Westpac Group. Westpac provides administrative support, donations and funding for operational costs of the Foundation.
5 Westpac Scholars Trust (ABN 35 600 251 071) is administered by Westpac Scholars Limited (ABN 72 168 847 041) as trustee for the Westpac Scholars Trust. Westpac Scholars Trust is a private charitable trust and neither the Trust nor the Trustee are part of Westpac Group. Westpac provides administrative support, skilled volunteering, and funding for operational costs of Westpac Scholars Trust.
Su from Green Connect, a social and environmental enterprise in Illawarra region, NSW
3 FINA
NC
IAL STA
TEM
EN
TS2 G
RO
UP
PE
RFO
RM
AN
CE
1 STRA
TEG
IC R
EP
OR
T4
SHA
RE
HO
LDE
R IN
FOR
MA
TION
31WESTPAC GROUP 2021 ANNUAL REPORT

Safer Children, Safer Communities
The Safer Children, Safer Communities program involves a series of actions and investments in Australia and across Asia-Pacific over three years to help make a meaningful impact on child safety and protection. The program was a commitment in our Response Plan to the AUSTRAC proceedings.
Now in its second year, progress includes:
— $12.1 million invested in the overall work program, of which $9.2 million was committed over three years to 26 organisations in Australia through our grants program
— Finalised a $25 million grant for cross-industry data sharing projects with the International Centre for Missing and Exploited Children (ICMEC)
— Continued our partnership with International Justice Mission (IJM) who supported 33 police operations, 141 victim rescues and 36 suspect arrests in the Philippines
— Supported Save the Children’s ‘Protect Children – Philippines’ project to deliver training sessions to 687 young people and parents on issues relating to online exploitation in the first six months of 2021.
Sustainability Supplement
In December 2020, we updated our Sustainability Strategy outlining our sustainability priorities for the next three years. These priorities are centred around how we can best serve our customers, communities and nation, and contribute to solving global challenges.
More on our sustainability approach
Our Annual Report covers our most material sustainability topics in our strategic update. Our 2021 Sustainability Supplement provides additional detail on our sustainability approach, sustainability materiality assessment, progress against our 2023 Sustainability Strategy priorities, and additional climate change and human rights disclosures.
Sustainability metrics and glossary can be found in our 2021 Sustainability Datasheet, and our mapping to sustainability benchmarks and indices as well as performance scorecards can be found in our 2021 Sustainability Appendix.
Skilled volunteering and employee giving
Volunteering and supporting charities is an important part of our company culture, and an opportunity for our people to contribute to creating positive social impact. More than 530 employees participated in our volunteering programs to share their skills and time on causes important to them.
Supporting local communities
$144mIN COMMUNITY INVESTMENT
96%EMPLOYEE VOLUNTEERS FOUND THE EXPERIENCE REWARDING
$2.1mDONATED TO MORE THAN 770 CHARITIES THROUGH OUR MATCHING GIFTS PROGRAM
950+WESTPAC EMPLOYEES HAVE COMPLETED A JAWUN SKILLED VOLUNTEERING SECONDMENT WITH AN INDIGENOUS COMMUNITY ORGANISATION SINCE 2001
Helping when it matters most
Backing a stronger Australia
Collaborating for impact
32 WESTPAC GROUP 2021 ANNUAL REPORT

Corporate Governance
Our approach to Corporate Governance
Corporate governance is the framework of systems, policies, and processes by which we operate, make decisions, and hold people to account. Our framework establishes the roles and responsibilities of Westpac’s Board, management team, employees and suppliers. It also establishes the systems, policies, and processes for monitoring and evaluating Board and management performance and the practices for corporate reporting, disclosure, remuneration, risk management and engagement of security holders.
Our approach to corporate governance is based on a set of values and behaviours that underpin our day-to-day activities and are designed to promote transparency, fair dealing, and the protection of stakeholder interests, including our customers, our shareholders, our employees and our community.
It includes aspiring to the highest standards of corporate governance, which we see as fundamental to the sustainability of our business and our performance.
While our frameworks and policies are critical elements of corporate governance, the outcomes achieved are also directly influenced by decisions made by our people. Providing context and guidance to assist our people with their decisions has been a significant focus for Westpac in 2021. We have continued to embed our purpose – Helping Australians and New Zealanders succeed’ – as well as our supporting values and behaviours.
WESTPAC’S BOARD AND BOARD COMMITTEE STRUCTURE
Board
Independent Assurance and Advice Chief Executive Officer
External Auditors
Group Audit
Independent Assurance and External Advice
Group Executives
Board Committees
Nominations & Governance
Remuneration Audit Risk Technology
Legal, Regulatory & Compliance
Sub-Committee
Provide relevant periodic assurances and reports (as appropriate)
Provide assurance on the remuneration
disclosures in the Remuneration Report
Provide assurance on risk components of
the annual report and interim/annual financial results announcements
Delegation
Assurance, Oversight through
Reporting
Accountability
Accountability
Delegation
Delegation
Board Committees will refer matters to the Board or other Board Committee where appropriate.
Specific reporting
3 FINA
NC
IAL STA
TEM
EN
TS2 G
RO
UP
PE
RFO
RM
AN
CE
1 STRA
TEG
IC R
EP
OR
T4
SHA
RE
HO
LDE
R IN
FOR
MA
TION
33WESTPAC GROUP 2021 ANNUAL REPORT

Board areas of focus in FY21
This year the Board (including with assistance from its Board Committees) has focused on overseeing:
— The delivery of key priorities under our Fix, Simplify and Perform strategic priorities;
— Westpac’s response to the COVID-19 pandemic, including measures taken to support our customers and our people;
— The development and implementation of the expanded CORE program to uplift outcomes for customers and our governance of financial and non-financial risk;
— Ongoing work to improve Westpac’s management of financial crime risk following the AUSTRAC proceedings;
— The implementation and performance of the Lines of Business operating model, which was introduced in 2020 to clarify responsibilities and accountability for end-to-end performance;
— The simplification of our business and operations through the exit of non-core businesses and the consolidation of our international locations;
— The program of work to reset the bank’s cost base to $8 billion by FY24;
— The renewal of the Board and Executive team, with three Directors and three members of the Executive team commencing this year; and
— Approving the Group’s 2023 Sustainability Strategy.
Board skills
Westpac’s Board of Directors brings together a broad range of financial and other skills, knowledge, and experience necessary to guide the business of the Group. The Board uses a skills matrix to illustrate the key skills and experience the Board seeks in its collective membership and the number of Directors with each skill and experience.
1 At 30 September 2021.
Corporate Governance
Board diversity1
During the year, the Board Nominations & Governance Committee approved an objective to have a gender mix of 40:40:20; 40% women, 40% men and 20% of any gender on the Board. At 30 September 2021, 33% of the Group’s Board were women.
In addition Westpac joined the investor-led ‘40:40 Vision’ initiative with a target of at least 40% women on the Executive team by 2030.
Board tenure1
The average Board tenure is 2.8 years. The length of service of each Director is in Section 1 of the Directors’ Report.
CORPORATE GOVERNANCE STATEMENT
Westpac’s 2021 Corporate Governance Statement describes our corporate governance framework, policies and practices at 31 October 2021. The Statement is available – along with Board and Committee Charters, principles and policies – on our website at westpac.com.au/corpgov.
NUMBER OF FEMALE DIRECTORS ON THE BOARD (4 OUT OF 12)Note as at 30 September 2021 33%
AVERAGE BOARD TENURE Note as at 30 September 2021 2.8 yrs
0-3 years 66% 3-6 years 17% 6-9 years 17%
34 WESTPAC GROUP 2021 ANNUAL REPORT
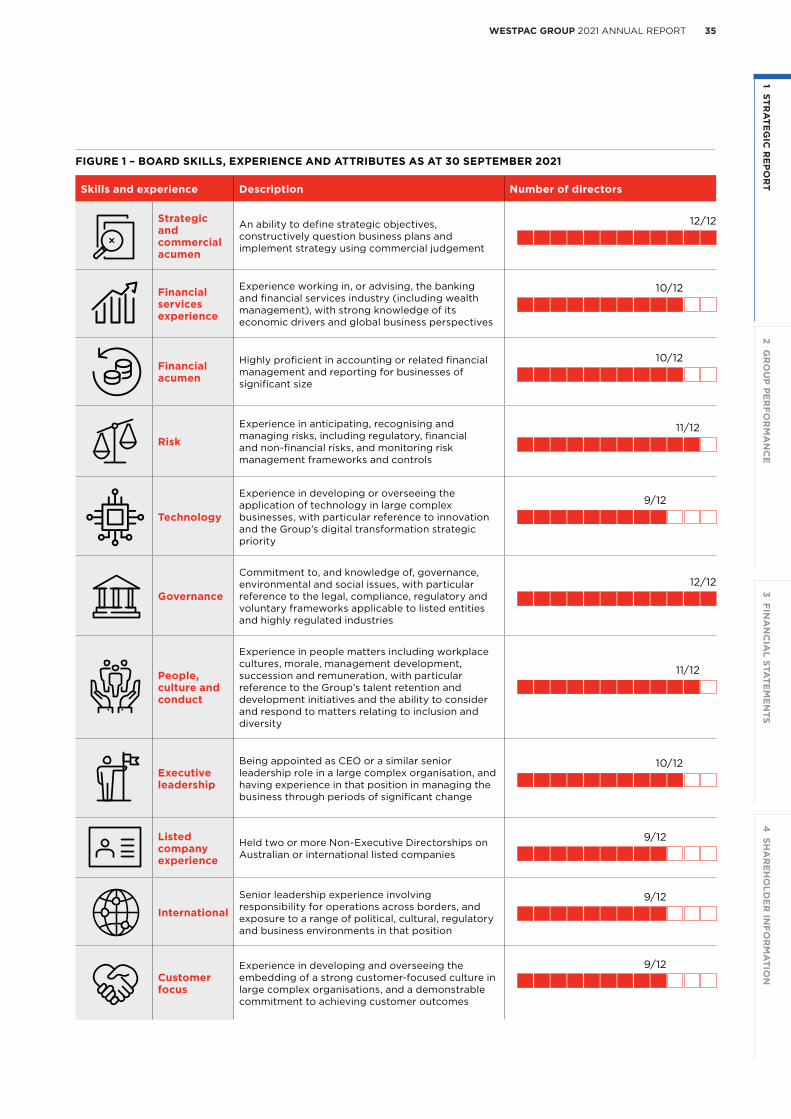
Skills and experience Description Number of directors
Strategic and commercial acumen
An ability to define strategic objectives, constructively question business plans and implement strategy using commercial judgement
Financial services experience
Experience working in, or advising, the banking and financial services industry (including wealth management), with strong knowledge of its economic drivers and global business perspectives
Financial acumen
Highly proficient in accounting or related financial management and reporting for businesses of significant size
Risk
Experience in anticipating, recognising and managing risks, including regulatory, financial and non-financial risks, and monitoring risk management frameworks and controls
Technology
Experience in developing or overseeing the application of technology in large complex businesses, with particular reference to innovation and the Group’s digital transformation strategic priority
Governance
Commitment to, and knowledge of, governance, environmental and social issues, with particular reference to the legal, compliance, regulatory and voluntary frameworks applicable to listed entities and highly regulated industries
People, culture and conduct
Experience in people matters including workplace cultures, morale, management development, succession and remuneration, with particular reference to the Group’s talent retention and development initiatives and the ability to consider and respond to matters relating to inclusion and diversity
Executive leadership
Being appointed as CEO or a similar senior leadership role in a large complex organisation, and having experience in that position in managing the business through periods of significant change
Listed company experience
Held two or more Non-Executive Directorships on Australian or international listed companies
International
Senior leadership experience involving responsibility for operations across borders, and exposure to a range of political, cultural, regulatory and business environments in that position
Customer focus
Experience in developing and overseeing the embedding of a strong customer-focused culture in large complex organisations, and a demonstrable commitment to achieving customer outcomes
9/12
9/12
9/12
10/12
11/12
12/12
9/12
11/12
10/12
10/12
12/12
FIGURE 1 – BOARD SKILLS, EXPERIENCE AND ATTRIBUTES AS AT 30 SEPTEMBER 2021
3 FINA
NC
IAL STA
TEM
EN
TS2 G
RO
UP
PE
RFO
RM
AN
CE
1 STRA
TEG
IC R
EP
OR
T4
SHA
RE
HO
LDE
R IN
FOR
MA
TION
35WESTPAC GROUP 2021 ANNUAL REPORT

Includes Board and Executive Team biographies, report on the business, Directors’ interests, environmental and human rights disclosures, political engagement, Directors’ meetings and Remuneration Report.
Our Directors present their report together with the financial statements of the Group for the financial year ended 30 September 2021.
Directors
The names of the persons who have been Directors, or appointed as Directors, during the period since 1 October 2020 and up to the date of this report are: John McFarlane, Peter King, Nerida Caesar, Catriona Alison Deans (Alison Deans) (appointed as a Director on 1 April 2014 and retired as a Director on 11 December 2020), Craig Dunn, Audette Exel AO (Director from 1 September 2021), Steven Harker (appointed as a Director on 1 March 2019 and retired as a Director on 26 October 2021), Michael Hawker AM (Director from 1 December 2020), Christopher Lynch, Peter Marriott, Peter Nash, Nora Scheinkestel (Director from 1 March 2021), and Margaret Seale.
Particulars of the skills, experience, expertise and responsibilities of the Directors at the date of this report, including all directorships of other listed companies held by a Director at any time in the three years immediately before 30 September 2021, and the period for which each directorship has been held, are set out in the following pages.
Board Committee Member KeyChairman of each committee is noted with a red icon.
Board Nominations & Governance
Board Risk
Board Technology
Board Legal, Regulatory and Compliance
Board Remuneration
Board Audit
Directors’ report
36 WESTPAC GROUP 2021 ANNUAL REPORT

Craig DunnBCom, FCA
Age: 58
Independent Non-Executive Director
Appointed: Director since June 2015.
Experience: Craig has more than 20 years’ experience in financial services, including as CEO of AMP Limited. He was formerly a director of Financial Literacy Australia Limited, and a Board member of the Australian Japanese Business Cooperation Committee, Jobs for New South Wales, and the New South Wales Government’s Financial Services Knowledge Hub. Craig was Chairman of Stone and Chalk Limited and of the Investment and Financial Services Association (now the Financial Services Council). He was also a member of the Financial Services Advisory Committee, the Australian Financial Centre Forum, the Consumer and Financial Literacy Taskforce and a Panel member of the Australian Government’s Financial System Inquiry.
Directorships of listed entities over the past three years: Telstra Corporation Limited (since April 2016).
Other principal directorships and interests: Director of Lion Pty Limited and Lion Global Craft Beverages Pty Limited. Chairman of The Australian Ballet, Chairman of the International Standards Technical Committee on Blockchain and Distributed Ledger Technologies (ISO/TC 307), and consultant to King & Wood Mallesons.
Board Committees:
John McFarlaneMA, MBA
Age: 74
Chairman and Independent Non-Executive Director
Appointed: Director since February 2020 and Chairman since April 2020.
Experience: John is a senior figure in global banking and financial services and has 46 years of experience in the sector. He was formerly Chairman of Barclays plc, Aviva plc and FirstGroup plc, and Chairman of The City UK. He was also a Non-Executive Director of Westfield Group/Westfield Corporation, The Royal Bank of Scotland Group, Capital Radio plc and was a council member of The London Stock Exchange.
John served as Chief Executive Officer of Australia and New Zealand Banking Group Limited from 1997 to 2007, and as Group Executive Director at Standard Chartered. He also held senior positions at Citicorp including as Managing Director of Citicorp Investment Bank Ltd and Head of Citicorp and Citibank in the UK and Ireland. He began his career at Ford Motor Co.
Directorships of listed entities over the past three years: Unibail-Rodamco-Westfield SE (since June 2018) and Barclays plc (January 2015 to May 2019).
Other principal directorships and interests: Director of Old Oak Holdings Ltd.
Board Committees:
Managing Director and Chief Executive Officer
Appointed: Director since December 2019.
Experience: Peter was appointed Westpac Group Chief Executive Officer in April 2020. Peter previously held this role on an acting basis between December 2019 and March 2020. Since joining the Westpac Group in 1994, Peter also held senior finance roles including Chief Financial Officer with responsibility for Westpac’s Finance, Tax, Treasury and Investor Relations functions. Prior to this, he was Deputy Chief Financial Officer for three years. He has also held senior positions across the Group including in Group Finance, Business and Consumer Banking, Business and Technology Services, Treasury and Financial Markets. Peter commenced his career at Deloitte Touche Tohmatsu. He has a Bachelor of Economics from Sydney University and completed the Advanced Management Programme at INSEAD. He is a Fellow of the Institute of Chartered Accountants.
Directorships of listed entities over the past three years: Nil.
Other principal directorships and interests: Director of the Australian Banking Association Incorporated, Institute of International Finance and The Financial Markets Foundation for Children.
Board Committees: Nil.
Independent Non-Executive Director
Appointed: Director since September 2017.
Experience: Nerida has over 34 years of broad ranging commercial and business management experience, with particular depth in technology-led businesses. Nerida was Group Managing Director and Chief Executive Officer, Australia and New Zealand, of Equifax (formerly the ASX-listed Veda Group Limited) and was also a former director of Genome. One Pty Ltd and Stone and Chalk Limited. Before joining Equifax, Nerida held several senior management roles at Telstra, including Group Managing Director, Enterprise and Government and Group Managing Director, Wholesale. Nerida also held several Executive and senior management positions with IBM within Australia and internationally, including as Vice President of IBM’s Intel Server Division for the Asia Pacific region.
Directorships of listed entities over the past three years: Nil.
Other principal directorships and interests: Chair of Workplace Giving Australia Limited, Director of CreditorWatch and Spark Investment Holdco Pty Ltd. Advisor to startups in the technology sector.
Board Committees:
Peter KingBEc, FCA
Age: 51
Nerida CaesarBCom, MBA, GAICD
Age: 57
Board of Directors
3 FINA
NC
IAL STA
TEM
EN
TS2 G
RO
UP
PE
RFO
RM
AN
CE
1 STRA
TEG
IC R
EP
OR
T4
SHA
RE
HO
LDE
R IN
FOR
MA
TION
37WESTPAC GROUP 2021 ANNUAL REPORT

Peter MarriottBEc (Hons.), FCA
Age: 64
Independent Non-Executive Director
Appointed: Director since June 2013.
Experience: Peter has over 40 years’ experience in senior management roles in the finance industry, encompassing international banking, finance and auditing. He joined Australia and New Zealand Banking Group Limited (ANZ) in 1993 and was Chief Financial Officer from July 1997 to May 2012. Prior to his career at ANZ, Peter was a banking and finance, audit and consulting partner at KPMG Peat Marwick. Peter was formerly a Director of ANZ National Bank Limited in New Zealand and various ANZ subsidiaries.
Directorships of listed entities over the past three years: ASX Limited (since July 2009).
Other principal directorships and interests: Director of ASX Clearing Corporation Limited, ASX Settlement Corporation Limited and Austraclear Limited. Member of Monash University Council and Chairman of the Monash University Council’s Resources and Finance Committee.
Board Committees:
Audette Exel AO
BA, LLB (Hons)
Age: 58
Independent Non-Executive Director
Appointed: Director since September 2021.
Experience: Audette has more than 35 years’ experience in the global financial services markets as a senior executive, a non-executive director and as a social entrepreneur. Audette was formerly the Managing Director of BSX-listed Bermuda Commercial Bank (1993–1996), Chair of the Bermuda Stock Exchange (1995–1996) and a Director and Chair of the Investment Committee of the Bermuda Monetary Authority (1999–2005). She was a Director and Chair of the Investment Committee of Steamship Mutual (1999–2017). She began her career as a lawyer specialising in international finance. Audette is the founder and Chair of the Adara Group, a pioneering social enterprise which exists to support people living in extreme poverty, and is the Chief Executive Officer of its corporate advice businesses. She is the recipient of numerous awards, including an honorary Order of Australia for service to humanity.
Directorships of listed entities over the past three years: Suncorp Group Limited (June 2012 to September 2020).
Other principal directorships and interests: Founder and Chair of Adara Development Australia, Adara Development USA, Adara Development Bermuda, Adara Development UK and Adara Development Uganda. CEO and Director of Adara Advisors Pty Limited and Adara Partners (Australia) Pty Limited.
Board Committees:
Independent Non-Executive Director
Appointed: Director since December 2020.
Experience: Michael has substantial experience, with over 35 years' in the financial services industry, including as Chief Executive Officer and Managing Director of Insurance Australia Group from 2001 to 2008. Prior to this, he held senior positions at Westpac, and with Citibank in Australia and Europe. Michael was a Director of Macquarie Bank Limited and Macquarie Group Limited, and a Director of Aviva plc. Michael was also President of the Insurance Council of Australia, Chairman of the Australian Financial Markets Association, a Board member of the Geneva Association and a member of the Financial Sector Advisory Council.
Directorships of listed entities over the past three years: Washington H. Soul Pattinson and Company Ltd (since October 2012), Macquarie Group Limited (March 2010 – September 2020), Macquarie Bank Limited (March 2010 – September 2020), Aviva plc (January 2010 – March 2019).
Other principal directorships and interests: Director of BUPA Global Board UK, Deputy Chairman of BUPA ANZ Group, and a Non-Executive Director of the Museum of Contemporary Art Australia.
Board Committees:
Independent Non-Executive Director
Appointed: Director since September 2020.
Experience: Chris has significant experience in mineral resources and infrastructure, having spent over 30 years working in these fields globally. Chris was formerly the Global Chief Financial Officer of Rio Tinto Group, based in London, and an Executive Director. Prior to this, he was a Non-Executive Director of Rio Tinto Group. Chris was the Chief Executive Officer of Transurban Group, an international toll road developer and manager with interests in Australia and North America from 2008 to 2012. His executive career also included seven years at BHP Billiton where he was Chief Financial Officer and then Executive Director and Group President - Carbon Steel Materials. Chris spent 20 years with Alcoa Inc. where he held a number of executive positions, including Vice-President and Chief Information Officer based in Pittsburgh, USA and Chief Financial Officer of Alcoa Europe in Switzerland. He was also managing director of KAAL Australia Limited, a joint venture company formed by Alcoa and Kobe Steel. Chris was formerly a Commissioner of the Australian Football League from 2008 until 2014.
Directorships of listed entities over the past three years: Nil.
Other principal directorships and interests: Director of Business for Millennium Development Ltd, Chairman of the National Water Grid Authority Advisory Board.
Board Committees:
Michael Hawker AM
BSc, FAICD, SF Fin, FAIM, FIoD
Age: 62
Chris LynchBCom, MBA, FCPA
Age: 68
Board of Directors
38 WESTPAC GROUP 2021 ANNUAL REPORT

Peter NashBCom, FCA, F Fin
Age: 59
Independent Non-Executive Director
Appointed: Director since March 2018.
Experience: Peter was formerly a Senior Partner with KPMG, having been admitted to the Australian partnership in 1993. He served as the National Chairman of KPMG Australia and served on KPMG’s Global and Regional Boards. His previous positions with KPMG included Regional Head of Audit for Asia Pacific, National Managing Partner for Audit in Australia and head of KPMG Financial Services. Peter has worked in geographically diverse and complex operating environments providing advice on a range of topics including business strategy, risk management, internal controls, business processes and regulatory change. He has also provided financial and commercial advice to many State and Federal Government businesses.
Peter is a former member of the Business Council of Australia and its Economic and Regulatory Committee.
Directorships of listed entities over the past three years: Johns Lyng Group Limited (Chairman since October 2017), Mirvac Group (since November 2018) and ASX Limited (since June 2019).
Other principal directorships and interests: Director of Golf Victoria Limited and General Sir John Monash Foundation. Board member of the Koorie Heritage Trust.
Board Committees:
Independent Non-Executive Director
Appointed: Director since March 2021.
Experience: Nora is an experienced company director with a background as a senior banking executive in international and project financing. Nora has served as Chair and Director in a range of companies across various industry sectors and in the public, private and government arena. Previously, Nora was a director of a number of other major ASX-listed companies, an Associate Professor at the Melbourne Business School at Melbourne University and was formerly a member of the Takeovers Panel. In 2003, Nora was awarded a centenary medal for services to Australian society in business leadership.
Directorships of listed entities over the past three years: Telstra Corporation Limited (since August 2010), AusNet Services Ltd (since November 2016), Brambles Limited (since June 2020), Atlas Arteria Limited (August 2014 to November 2020), Atlas Arteria International Limited (April 2015 to November 2020) and OceanaGold Corporation (April 2018 to December 2019).
Other principal directorships and interests: Nil.
Board Committees:
Independent Non-Executive Director
Appointed: Director since March 2019.
Experience: Margie is an experienced company director and has served on the boards of companies across a range of industries. She previously worked in senior executive roles in Australia and overseas including in the consumer goods, health and global publishing sectors, and sales and marketing, and in the successful transition of traditional business models to digital environments. Immediately prior to her non-executive career, Margie was Managing Director of Random House ANZ and President, Asia Development for Random House Inc. She was a Director and then Chair of Penguin Random House Australia Pty Limited, and a Director of Ramsay Health Care Limited, Bank of Queensland Limited and the Australian Publishers’ Association. She also served on the boards of Chief Executive Women, the Powerhouse Museum and the Sydney Writers Festival. She has been on the Advisory Board of J P Morgan ANZ, and the Advisory Board for the Australian Public Service Commission Centre for Learning and Leadership.
Directorships of listed entities over the past three years: Telstra Corporation Limited (May 2012 to October 2021) and Scentre Group Limited (since February 2016).
Other principal directorships and interests: Nil.
Board Committees:
Nora ScheinkestelLLB (Hons), PhD, FAICD
Age: 61
Margaret (Margie) SealeBA, FAICD
Age: 61
3 FINA
NC
IAL STA
TEM
EN
TS2 G
RO
UP
PE
RFO
RM
AN
CE
1 STRA
TEG
IC R
EP
OR
T4
SHA
RE
HO
LDE
R IN
FOR
MA
TION
39WESTPAC GROUP 2021 ANNUAL REPORT

Group General Counsel & Enterprise Executive
Rebecca is responsible for leading Westpac’s legal function globally, as well as leading the CEO’s office.
Rebecca joined Westpac in 2002 and has held a variety of other senior leadership roles including General Manager, Human Resources for St.George Bank and General Manager, St.George Private Clients.
Rebecca began her career at Blake Dawson Waldron (now Ashurst) before joining the US firm Skadden Arps where she worked in both New York and London. Rebecca then moved into an in-house role in investment banking at Goldman Sachs in London before returning to Australia and joining Westpac.
Rebecca is a member of Chief Executive Women.
Managing Director and Chief Executive Officer, Westpac Group
Peter was appointed Westpac Group Chief Executive Officer in April 2020, after holding the role on an acting basis between December 2019 and March 2020.
In his 25 years at Westpac, Peter has held senior finance roles including Chief Financial Officer with responsibility for Westpac’s Finance, Group Audit, Tax, Treasury and Investor Relations functions. Prior to this he was Deputy Chief Financial Officer for three years and worked in senior positions across the Group including in Group Finance, Business and Consumer Banking, Business and Technology Services, Treasury and Financial Markets.
Peter commenced his career at Deloitte Touche Tohmatsu. He has a Bachelor of Economics from Sydney University and completed the Advanced Management Programme at INSEAD.
He is a Fellow of the Institute of Chartered Accountants.
Chief Operating Officer
Scott joined Westpac in November 2020 as Chief Operating Officer and leads our corporate services, operations and technology functions.
Scott has over 30 years’ global banking experience, with a breadth of expertise across technology, operations, risk mitigation and commercial functions. Before joining Westpac, Scott was Chief Information & Operations Officer for North America Consumer Businesses at Bank of Montreal, Canada. Prior to that, Scott held senior executive positions at a number of multinational financial institutions including ANZ, Citibank, Fifth Third Bank and Bank of America. Scott holds a Bachelor’s Degree from the University of Maryland in the United States.
Chief Executive, Consumer & Business Banking
Chris de Bruin joined Westpac Group as Chief Executive, Consumer, in February 2021 and became Chief Executive, Consumer & Business Banking in March 2021.
With nearly 25 years in the financial services sector globally, Chris’ experience spans retail banking, consumer product portfolios, fintech and digital banking.
He spent 13 years at Standard Chartered Bank, where he held a variety of roles across Asia and the Middle East, including as Global Head of Retail Products and Digital Banking. Before joining Westpac, Chris was Chief Executive Officer of Deem Finance, one of the largest non-bank financial institutions in the Middle East. Prior to that, Chris was President of Canadian fintech Zafin and had been an Associate Principal at McKinsey & Company. Chris was educated in South Africa and holds an MBA from the University of Cape Town, and a Bachelor of Science (Honours) from Stellenbosch University.
Peter KingBEc, FCA
Age: 51
Scott CollaryBA, Humanities
Age: 57
Chris de BruinMBA, B.Sc. (Hons)
Age: 58
Rebecca LimB Econ, LLB (Hons)
Age: 49
Executive team
40 WESTPAC GROUP 2021 ANNUAL REPORT

Chief Executive, Westpac Institutional Bank
Anthony joined Westpac Group as Chief Executive, Westpac Institutional Bank in October 2020. He has responsibility for Westpac’s global relationships with corporate, institutional and government clients, as well as all products across financial and capital markets, transactional banking, structured finance and working capital payments.
In addition, Anthony has responsibility for Westpac’s offices and branches in Asia, London and New York. Before joining Westpac Group, Anthony was CEO of Australia & New Zealand and Co-Head of Investment Bank, Asia Pacific at Deutsche Bank from 2017.
Prior to Deutsche Bank, Anthony was a partner at Goldman Sachs based in Hong Kong within the investment banking division and previously held a number of roles at Goldman Sachs in Australia and New Zealand having joined the organisation in 2001. Before joining Goldman Sachs, Anthony worked at Credit Suisse. Anthony holds a Bachelor of Law (Honours) from Queensland University of Technology, and Bachelor of Arts (Japanese Language, Modern Asian Studies) from Griffith University.
Group Executive, Customer & Corporate Relations
Carolyn was appointed as Westpac’s Group Executive, Customer and Corporate Relations in 2018 and is responsible for customer advocacy, corporate affairs and sustainability. The division brings together customer complaints, customer remediation and the customer advocate, alongside corporate affairs, government relations, communications, sustainability and community.
Carolyn has more than 20 years’ experience in corporate affairs, mainly in the financial services industry. This year Carolyn also became responsible for the Group’s COVID response.
Carolyn joined Westpac in 2013, as General Manager, Corporate Affairs and Sustainability. Prior to joining Westpac, Carolyn spent 13 years at Insurance Australia Group in various positions, including Group General Manager, Corporate Affairs and Investor Relations. She began her career in consulting and has extensive in-house and consulting experience in financial services. Carolyn has a Bachelor of Arts from The University of Queensland, a Bachelor of Business from Queensland University of Technology, and a Graduate Diploma of Applied Finance and Investment from the Securities Institute of Australia.
Group Executive, Human Resources
Christine was appointed to Westpac Group’s Executive Team in October 2011. As Group Executive, Human Resources, Christine leads the HR function for the Group, responsible for strengthening our service oriented and inclusive culture, attracting and retaining the best talent, developing and helping our workforce to grow skills for the future, rewarding and recognising our people and ensuring their health and wellbeing. Christine has responsibility for the office of the Banking Executive Accountability Regime (BEAR) and also supports the CEO and Board on culture and conduct. Since joining Westpac in 2007, Christine has held a variety of senior leadership roles including Group General Manager, Human Resources and General Manager, Human Resources for Westpac New Zealand Limited. Before joining Westpac, Christine held senior HR roles in a number of high-profile organisations and across a range of industries, including Carter Holt Harvey and Restaurant Brands New Zealand. Christine initially trained as an Accountant and continued her professional development with a range of post graduate qualifications in HR Management, Leadership and Quality Management. Christine is currently Chair of the St.George Foundation, Director of Orygen Youth Mental Health Foundation, and was previously a Director of Women’s Community Shelters and member of the Veterans’ Employment Industry Advisory Committee.
Acting Chief Executive Officer, Westpac New Zealand Limited
Simon has been Acting Chief Executive Officer of Westpac New Zealand since June 2021. Prior to his appointment as Acting CEO he was General Manager of Institutional & Business Banking, and he has also held the positions of General Manager of Consumer Banking & Wealth, and General Manager of Business Bank, Private Bank, Wealth & Insurance.
Prior to his banking career, Simon spent 12 years as a New Zealand Member of Parliament. Between 2008-2011 he served as Minister of Justice, Minister of Commerce and Minister of State-Owned Enterprises. Simon attended Wellington’s Victoria University where he obtained degrees in both Law and Politics. He has completed the Advanced Management Programme at Harvard Business School, as well as programmes at the Australian Graduate School of Management and Melbourne Business School.
Anthony MillerLLB (Hons), BA
Age: 51
Carolyn McCannBBus (Com), BA, GradDipAppFin, GAICD
Age: 49
Christine ParkerBGDipBus (HRM)
Age: 61
Simon PowerBA, LLB, MA (Dist.)
Age: 52
3 FINA
NC
IAL STA
TEM
EN
TS2 G
RO
UP
PE
RFO
RM
AN
CE
1 STRA
TEG
IC R
EP
OR
T4
SHA
RE
HO
LDE
R IN
FOR
MA
TION
41WESTPAC GROUP 2021 ANNUAL REPORT

Group Executive, Financial Crime, Compliance & Conduct
Les was appointed Group Executive, Financial Crime, Compliance and Conduct in June 2020. In this role, Les is responsible for overseeing and strengthening the governance and management of these risks.
Les has over 25 years’ executive experience across transformation and program delivery, risk and governance, operations and line management. Joining Westpac in 2008, Les has held a variety of senior roles including Chief Operating Officer, Consumer Division and Chief Risk Officer, BT Financial Group. Prior to Westpac, Les was Group Executive for External Funds at Investa Property Group and Chief Executive for Gaming at TAB Limited. Les commenced his career as a solicitor at the legal firm Freehills.
Les holds a Bachelor of Commerce and a Bachelor of Laws with Honours, both from University of Queensland.
Chief Financial Officer
Michael joined Westpac Group as Chief Financial Officer in September 2020. He is responsible for Westpac’s Finance, Investor Relations, Tax and Treasury functions.
Before joining Westpac, Michael was a Partner in Management Consulting at KPMG. Before that he held a number of senior executive positions at ANZ from 1999 to 2013. This included CFO Institutional Banking, CFO Wealth, CFO New Zealand, CFO Personal Financial Services, and business leadership roles as CEO Pacific, Managing Director Mortgages and General Manager, Transformation. Michael commenced his career at KPMG, where he was promoted to become a Tax Partner in 1993.
Michael holds a Bachelor of Commerce, University of Melbourne and a Graduate Diploma of Taxation Law, Monash University. He is a Fellow of the Institute of Chartered Accountants in Australia and New Zealand.
Chief Risk Officer
David was appointed Chief Risk Officer in October 2018, with responsibility for risk management across the Group.
Prior to this, David was the Chief Risk Officer for Royal Bank of Scotland (RBS) from 2013, having joined in 2010 as the Deputy Chief Risk Officer. David has also previously held other senior roles at both retail and investment banks in the UK, USA, Hong Kong and Australia, including serving as Chief Risk Officer at ANZ and Chief Credit Officer at Credit Suisse Financial Products. David has a Bachelor of Business in Banking and Finance from Monash University and is a Board member of the International Financial Risk Institute.
Chief Executive, Specialist Businesses & Group Strategy
Jason was appointed Chief Executive, Specialist Businesses in May 2020.
He is responsible for Group Strategy, Corporate & Business Development and the Strategic Reviews and potential divestments of the Group’s Specialist Businesses. Specialist Businesses support customers with wealth needs including Insurance, Superannuation and Platforms and Investments, as well as Auto Finance and Pacific banking.
Most recently, Jason was Chief Executive Officer NewCo, CBA, where he was appointed to lead the demerger of its wealth management and mortgage broking businesses. Prior to that, he was Chief Executive Officer & Managing Director, SocietyOne, an early financial services disrupter and consumer finance marketplace lender.
Jason was previously with the Westpac Group for more than 20 years, holding a number of senior positions including Group Executive, Westpac Retail & Business Banking, and a range of senior executive positions in BT Financial Group. Jason holds a Bachelor of Commerce (Marketing & Finance) from the University of New South Wales and Graduate Diploma in Applied Finance and Investment from the Securities Institute of Australia.
Les VanceBCom, LLB (Hons)
Age: 51
Michael RowlandB.Comm, FCA
Age: 60
David StephenBBus
Age: 57
Jason YettonB.Comm (Finance & Mktg),GradDipAppFin
Age: 50
Executive team
42 WESTPAC GROUP 2021 ANNUAL REPORT

3 FINA
NC
IAL STA
TEM
EN
TS2 G
RO
UP
PE
RFO
RM
AN
CE
1 STRA
TEG
IC R
EP
OR
T4
SHA
RE
HO
LDE
R IN
FOR
MA
TION
43WESTPAC GROUP 2021 ANNUAL REPORT
Company Secretary
Tim was appointed Company Secretary in November 2011. Before that appointment, Tim was Head of Legal – Risk Management & Workouts, Counsel & Secretariat and prior to that, he was Counsel, Corporate Core.
Before joining Westpac in 2006, Tim was a Consultant with Gilbert + Tobin, where he provided corporate advisory services to ASX-listed companies. Tim was previously a lawyer at Henderson Boyd Jackson W.S. in Scotland and in London in Herbert Smith’s corporate and corporate finance division.
Tim HartinLLB (Hons.)
Age: 46
Company Secretary
EXECUTIVE TEAM
As at 30 September 2021 our Executive Team was:
NAME POSITION
YEAR JOINED GROUP
YEAR APPOINTED
TO POSITION
Peter King Managing Director & Chief Executive Officer
1994 2020
Scott Collary Chief Operating Officer 2020 2020
Chris de Bruin Chief Executive, Consumer & Business Banking
2021 2021
Rebecca Lim Group General Counsel & Enterprise Executive
2002 2020
Carolyn McCann Group Executive, Customer & Corporate Relations
2013 2018
Anthony Miller Chief Executive, Westpac Institutional Bank
2020 2020
Christine Parker Group Executive, Human Resources 2007 2011
Simon Power Acting Chief Executive Officer, Westpac New Zealand Limited
2012 2021
Michael Rowland Chief Financial Officer 2020 2020
David Stephen Chief Risk Officer 2018 2018
Les Vance Group Executive, Financial Crime, Compliance & Conduct
2008 2020
Jason Yetton Chief Executive, Specialist Businesses & Group Strategy
2020 2020
There are no family relationships between or among any of our Directors or Executive Team.

44 WESTPAC GROUP 2021 ANNUAL REPORT
Directors’ report
Directors’ report
3. Operating and financial review
a) Principal activities
The principal activities of the Group during the financial year ended 30 September 2021 were the provision of financial services including lending, deposit taking, payments services, investment platforms, superannuation and funds management, insurance services, leasing finance, general finance, interest rate risk management and foreign exchange services.
During the period Westpac sold its general insurance and lenders mortgage insurance businesses and ceased to provide these services once the transactions completed. Other than these changes, there have been no significant changes in the nature of the principal activities of the Group during 2021.
b) Operations and financial performance
Net profit attributable to owners of Westpac Banking Corporation for 2021 was $5,458 million, an increase of $3,168 million or 138% compared to 2020.
The increase in net profit was predominantly due to a credit impairment benefit of $590 million in 2021 compared to a charge of $3,178 million in 2020. Over recent years, Westpac has incurred certain items that have been called “notable items”. The net after tax impact of these items was lower in 2021 ($1,601 million) compared to 2020 ($2,619 million). 2021 items included:
• The write-down of assets (goodwill, capitalisedsoftware and certain other assets);
• Additional provisions for estimated customerrefunds, payments, associated costs and litigation;and
• Separation and transaction costs related todivestment of the Group’s Specialist Businesses;partly offset by
• Gains on sale of assets and non-core businesses.
The following is a summary of the movements in the major line items in net profit for 2021 compared to 2020.
• Net interest income increased $162 millioncompared to 2020 reflecting a 3 basis pointincrease in reported net interest margin (to 2.06%)partly offset by a small decline in average interestearning assets of $2.3 billion (down less than 1%).The decline in average interest earning assets wasmostly from lower business lending early in the yearand from a decline in other overseas assets as weconsolidated our operations in Asia. The rise in netinterest income was predominantly due to:
– A $667 million change in unrealised gains onfair value economic hedges, from a charge of$477 million in 2020 to a benefit of $190 millionin 2021; and
– Lower wholesale funding and deposit costs;partly offset by
– Lower spreads on mortgages and businesslending from intense competition, and a shift inthe mix of the portfolio to lower spread fixedrate lending; and
– Reduced returns on hedged capital and liquidassets from lower interest rates.
• Non-interest income increased $877 millioncompared to 2020. The rise was mainly due to:
– Gains on sale of assets and non-core businesses;and
– Higher net wealth and insurance income due tofavourable life policyholder liability revaluationand lower general insurance severe weatherclaims; partly offset by
– Lower financial markets trading income fromlower volatility and the exit from energy trading;and
– Lower net fee income from fee simplificationinitiatives.
• Operating expenses increased $572 million or 4%compared to 2020. The rise was mainly due to:
– Asset impairments (including goodwill andcapitalised software);
– An increase in full time equivalent (FTE)employees and associated costs, principally toimprove risk management as part of our Fixpriority and increased mortgage volumes; partlyoffset by
– Costs of the AUSTRAC proceedings including apenalty in 2020.
The Group recognised a credit impairment benefit of $590 million in 2021 compared to a charge of $3,178 million in 2020. In 2020, the Group materially increased provisions in response to the expected economic impact of COVID-19, including forecasts of prolonged deterioration in economic activity, a rise in unemployment and a decline in property prices. The improvement in credit quality along with a better economic outlook has meant that some of the provisions booked in 2020 are no longer required. The Group also fully provided for a large equipment finance fraud in 2021.
The effective tax rate of 35.7% was lower than the 2020 effective tax rate of 46.3% predominantly due to the non-deductible items in 2020.
A review of the operations of the Group and its divisions and their results for the financial year ended 30 September 2021 is set out in Section 2 of the Annual Report under the sections ‘Review of Group operations’ (see pages 84 to 95), ‘Divisional performance’ (see pages 96 to 111) and ‘Risk and risk management’ (see pages 112 to 132), which form part of this report.
Further information about our financial position and financial results is included in the financial statements in Section 3 of this Annual Report (see pages 137 to 274), which form part of this report.
c) Dividends
Since 30 September 2021, Westpac has announced a final ordinary dividend of 60 cents per Westpac ordinary share, totaling approximately $2,201 million for the year ended 30 September 2021. The dividend will be fully franked and will be paid on 21 December 2021.
An interim ordinary dividend for the current financial year of 58 cents per Westpac ordinary share for the half year ended 31 March 2021 was paid as a fully franked dividend on 25 June 2021 (no interim ordinary dividend was paid in 2020).

45WESTPAC GROUP 2021 ANNUAL REPORT3 FIN
AN
CIA
L STATE
ME
NTS
2 GR
OU
P P
ER
FOR
MA
NC
E1 STR
ATE
GIC
RE
PO
RT
4 SH
AR
EH
OLD
ER
INFO
RM
ATIO
N
Directors’ report
Further, in respect of the year ended 30 September 2020, a fully franked final dividend of 31 cents per ordinary share totaling $1,120 million was paid on 18 December 2020. The payment comprised direct cash disbursements of $719 million with $401 million, being reinvested by participants through the DRP.
New shares were issued under the DRP for the 2020 final ordinary dividend.
d) Significant changes in state of affairs and eventsduring and since the end of the 2021 financialyear
Throughout the financial year ended 30 September 2021, the Group has operated in a challenging environment, including as a result of the continued social and economic effects of COVID-19 over this year as well as historical regulatory matters.
In this environment, significant changes in the state of affairs of the Group were:
• commencing a program of work to reduce thebank’s cost base, targeting an $8 billion cost baseby Full Year 2024;
• Westpac’s entry into an enforceable undertakingwith APRA in relation to Westpac’s risk governanceremediation (EU), following APRA announcing thefindings of its risk governance review into Westpacand expanding the existing Customer Outcomesand Risk Excellence (CORE) program to deliverthe Integrated Plan and support the strengtheningof Westpac’s risk governance, accountability andculture;
• implementing a number of multi-year programs(in addition to the CORE program) that seek toaddress identified shortcomings and significantlyimprove Westpac’s management of risks;
• two BT MySuper products (AESA MySuper andBT Super MySuper) failing the annual MySuperperformance test for the year ended 30 June 2021;if these BT products also fail the next annualperformance test, the BT Trustee will be precludedfrom accepting new MySuper members;
• APRA releasing further guidance on capital buffersand the calculation of RWA including for specificasset classes. As part of the proposal, APRA intendsto increase the capital conservation buffer from2.5% to 4.0% and introduce a base level for thecountercyclical capital buffer of 1.0%. As a result,the CET1 requirement (comprising the minimumrequirement and buffers) for the major banksis proposed to increase from 8% to 10.5% from1 January 2023;
• making changes to the Westpac Board andExecutive Team, as outlined in the RemunerationReport (see pages 50 to 71);
• following a strategic review of the specialistbusinesses in 2020:
– completing the sale of: Westpac GeneralInsurance Limited and Westpac GeneralInsurance Services Limited to Allianz, Westpac’sVendor Finance business to Angle Finance andWestpac Lenders Mortgage Insurance Limited toArch Capital Group; and
– announcing the following transactions, whichhave not yet completed: sale of Westpac’smotor vehicle dealer finance and novatedleasing businesses to Angle Finance, saleof Westpac Life-NZ-Limited to Fidelity LifeAssurance Company Limited; and sale ofWestpac Life Insurance Services Limited to TALDai-ichi Life Australia Pty Limited; and
• ongoing regulatory changes and developments,which have included changes relating to financialservices, superannuation, lending, remuneration,cyber resilience, capital and liquidity, and otherregulatory requirements.
For a discussion of these matters, please refer to ‘Significant developments’ in Section 1 of the Annual Report, which forms part of this report (see pages 74 to 80).
On 1 November 2021, Westpac announced an off- market buy back of up to $3.5 billion. Westpac’s operating performance and progress on our strategic priorities, including the completion of a number of divestments, have contributed to a strong capital position, allowing us to return capital to shareholders. Shareholder participation in the buy-back is voluntary. Westpac reserves the right to vary, suspend or terminate the buy-back at any time.
Other than as set out above, the Directors are not aware of any other matter or circumstance that has occurred since 30 September 2021 that has significantly affected or may significantly affect the operations of the Group, the results of these operations or the state of affairs of the Group in subsequent financial years.
e) Business strategies, developments and expectedresults
Our business strategies, prospects and likely major developments in the Group’s operations in future financial years and the expected results of those operations are discussed in the Strategic report (see pages 1 to 32 and in ‘Significant developments’ in Section 1 of the Annual Report (see pages 74 to 80), which forms part of this report.
Further information on our business strategies and prospects for the future financial years and likely developments in our operations and the expected results of operations have not been included in this report because the Directors believe it would be likely to result in unreasonable prejudice to us.
f) Risks to our financial performance, position andour operations
Our financial position, our future financial results, our operations and the success of our strategy are subject to a range of risks. These risks are set out and discussed in Section 2 of this Annual Report under the section ‘Risk and risk management’, which forms part of this report (see pages 112 to 132).

46 WESTPAC GROUP 2021 ANNUAL REPORT
Directors’ report
4. Directors’ interests
a) Directors’ interests in securities
The following particulars for each Director are set out in the Remuneration Report in Section 10 of the Directors’ report for the year ended 30 September 2021 and in the table below:
• their relevant interests in our shares or the shares of any of our related bodies corporate;
• their relevant interests in debentures of, or interests in, a registered scheme made available by us or any of ourrelated bodies corporate;
• their rights or options over shares in, debentures of, or interests in, any registered scheme made available byus or any of our related bodies corporate; and
• any contracts:
– to which the Director is a party or under which they are entitled to a benefit; and
– that confer a right to call for or deliver shares in, debentures of, or interests in, a registered scheme madeavailable by us or any of our related bodies corporate.
Directors’ interests in Westpac and related bodies corporate as at 31 October 2021Number of Relevant Interests in Westpac
Ordinary SharesNumber of Westpac
Share Rights
Westpac Banking Corporation
Current Directors
John McFarlane 40,000 -
Peter King 131,886 380,5681
Nerida Caesar 13,5832 -
Craig Dunn 15,009 -
Audette Exel AO 4,000 -
Michael Hawker AM 19,252 -
Chris Lynch 13,0903 -
Peter Marriott 22,110 -
Peter Nash 15,260 -
Nora Scheinkestel 5,172
Margaret Seale 10,4384 -
Former Directors
Steven Harker 11,6055 -
Alison Deans 15,6326 -6
1. Share rights issued under the Long Term Variable Reward Plan.2. As at 30 September 2021, Nerida Caesar’s related parties also hold the following interests in registered schemes made available by
certain related bodies corporate of Westpac in their capacity as the responsible entity of the registered scheme: (a) 364,032.0377units in Ironbark Karara Wholesale Plus Aust Small Companies Fund; (b) 255,025.9616 units in PIMCO Wholesale Plus Global BondFund; (c) 7,794.8400 units in Fidelity Wholesale Plus Australian Equities Fund; and (d) 97,602.0228 units in Walter Scott WholesalePlus Global Equity Fund.
3. Chris Lynch and his related bodies corporate also hold relevant interests in 1,137 Westpac Capital Notes 5.4. Margaret Seale and her related bodies corporate also hold relevant interests in 100 Westpac Capital Notes 7 (WBCPJ).5. Figure displayed is as at Steven Harker’s retirement date of 26 October 2021.6. Figure displayed is as at Alison Dean’s retirement date of 11 December 2020.
Note: Certain subsidiaries of Westpac offer a range of registered schemes. The Directors from time to time invest in these schemes and are required to provide a statement to the ASX when any of their interests in these schemes change. ASIC has exempted each Director from the obligation to notify the ASX of a relevant interest in a security that is an interest in BT Cash Management Trust (ARSN 087 531 539), BT Premium Cash Fund (ARSN 089 299 730), Westpac Cash Management Trust (ARSN 088 187 928) or Advance Cash Multi-Blend Fund (ARSN 094 113 050).

47WESTPAC GROUP 2021 ANNUAL REPORT3 FIN
AN
CIA
L STATE
ME
NTS
2 GR
OU
P P
ER
FOR
MA
NC
E1 STR
ATE
GIC
RE
PO
RT
4 SH
AR
EH
OLD
ER
INFO
RM
ATIO
N
Directors’ report
b) Indemnities and insurance
Under the Westpac Constitution, unless it is forbidden or would be made void by statute, we indemnify any person who is or has been a Director or Company Secretary of Westpac and of each of our related bodies corporate (except related bodies corporate listed on a recognised stock exchange), any person who is or has been an employee of Westpac or our subsidiaries (except subsidiaries listed on a recognised stock exchange), and any person who is or has been acting as a responsible manager under the terms of an Australian Financial Services Licence of any of Westpac’s wholly- owned subsidiaries against every liability (other than a liability for legal costs) incurred by each such person in their capacity as director, company secretary, employee or responsible manager, as the case may be; and all legal costs incurred in defending or resisting (or otherwise in connection with) proceedings, whether civil or criminal or of an administrative or investigatory nature, in which the person becomes involved because of that capacity.
Each of the Directors named in this Directors’ report and the Company Secretary of Westpac has the benefit of this indemnity.
Consistent with shareholder approval at the 2000 Annual General Meeting, Westpac has entered into a Deed of Access and Indemnity with each of the Directors, which includes indemnification in identical terms to that provided in the Westpac Constitution.
Westpac also executed a deed poll in September 2009 providing indemnification equivalent to that provided under the Westpac Constitution to individuals who are or have been acting as:
• statutory officers (other than as a director) ofWestpac;
• directors and other statutory officers of wholly- owned subsidiaries of Westpac; and
• directors and statutory officers of other nominatedcompanies as approved by Westpac in accordancewith the terms of the deed poll and Westpac’sContractual Indemnity Policy.
Some employees of Westpac’s related bodies corporate and responsible managers of Westpac and its related bodies corporate are also currently covered by a deed poll that was executed in November 2004, which is on similar terms to the September 2009 deed poll.
The Westpac Constitution also permits us, to the extent permitted by law, to pay or agree to pay premiums for contracts insuring any person who is or has been a Director or Company Secretary of Westpac or any of its related bodies corporate against liability incurred by that person in that capacity, including a liability for legal costs, unless:
• we are forbidden by statute to pay or agree to paythe premium; or
• the contract would, if we paid the premium, bemade void by statute.
Under the September 2009 deed poll, Westpac also agrees to provide directors’ and officers’ liability insurance to Directors of Westpac and Directors of Westpac’s wholly-owned subsidiaries (except wholly- owned subsidiaries listed on a recognised stock exchange).
For the year ended 30 September 2021, the Group has insurance cover which, in certain circumstances, will provide reimbursement for amounts which we have to pay under the indemnities set out above. That cover is subject to the terms and conditions of the relevant insurance, including but not limited to the limit of indemnity provided by the insurance. The insurance policies prohibit disclosure of the premium payable and the nature of the liabilities covered.
c) Share rights outstanding
As at the date of this report there are 3,624,609 share rights outstanding in relation to Westpac ordinary shares. The latest dates for exercise of the share rights range between 1 October 2022 and 1 October 2035.
Holders of outstanding share rights in relation to Westpac ordinary shares do not have any rights under the share rights to participate in any share issue or interest of Westpac or any other body corporate.
d) Proceedings on behalf of Westpac
No application has been made and no proceedings have been brought or intervened in, on behalf of Westpac under section 237 of the Corporations Act.

48 WESTPAC GROUP 2021 ANNUAL REPORT
Directors’ report
5. Environmental disclosure
The Westpac Group’s environmental framework is made up of:
• our Sustainability Strategy;
• our Westpac Group Environment Policy and targets;
• our Sustainability Risk Management Framework;
• our Climate Change Position Statement and 2023 Action Plan;
• our positions on certain sensitive sectors;
• our Responsible Sourcing Code of Conduct and Responsible Sourcing Program; and
• public reporting of our environmental performance.
We participate in a number of voluntary initiatives including the Dow Jones Sustainability Index, CDP (formerly known as the Climate Disclosure Project), the Equator Principles, the Principles for Responsible Banking, the Principles for Responsible Investment, the United Nations Global Compact, the RE100 and the Australian Government Climate Active Carbon Neutral Standard. We also review our performance against a number of Environmental, Social and Governance (ESG) benchmarks, including Sustainalytics, MSCI ESG and ISS. We report in line with the recommendations of the Taskforce on Climate-related Financial Disclosures (TCFD).
The National Greenhouse and Energy Reporting Act 2007 (NGER) came into effect in September 2007. The Group reports on greenhouse gas emissions, energy consumption and production under the NGER for the period 1 July through 30 June each year.
Our operations are not subject to any other significant environmental regulation under any law of the Commonwealth of Australia or of any state or territory of Australia. We may, however, become subject to environmental regulation as a result of our lending activities in the ordinary course of business and we have policies in place to ensure that this potential risk is addressed as part of our normal processes.
We are not aware of the Group incurring any material liability (including for rectification costs) under any environmental legislation.
Westpac has reported its performance against its 2021 Sustainability Strategy and provides an update in the section titled ‘climate change’ in Section 1 of this Annual Report. Our Sustainability Supplement provides disclosures aligned to the recommendations of the TCFD (see pages 28 to 29).
Additional information about our environmental performance, including information on our climate change approach, details of our greenhouse gas emissions profile and environmental footprint, and progress against our environmental targets and carbon neutral program are available on our website at https:// www.westpac.com.au/about-westpac/sustainability/.
6. Human rights disclosure
Westpac’s overall approach to human rights is set out in our Human Rights Position Statement and 2023 Action Plan. This lays out the principles and actions that guide our approach and commitment to respecting human rights in our role as a financial services provider, lender, purchaser of goods and services, employer, and supporter of communities.
For example, our Responsible Sourcing Program, including the Responsible Sourcing Code of Conduct and risk assessment methodology is the primary framework for identifying and addressing human rights in our supply chain.
The Group is subject to the Commonwealth of Australia’s Modern Slavery Act 2018 (Cth) and the United Kingdom’s Transparency in Supply Chains provisions under the Modern Slavery Act 2015.
As required under the Australian and UK legislation, Westpac publishes an annual statement to disclose the steps taken during the year to help prevent modern slavery from occurring within the Group’s operations and supply chain. Westpac published its statement for the 2020 financial year in March 2021.
7. Rounding of amounts
Westpac is an entity to which ASIC Corporations Instrument 2016/191 dated 24 March 2016, relating to the rounding of amounts in directors’ reports and financial reports, applies. Pursuant to this Instrument, amounts in this Directors’ report and the accompanying financial report have been rounded to the nearest million dollars, unless indicated to the contrary.
8. Political engagement
In line with Westpac policy, no cash donations were made to political parties during the financial year ended 30 September 2021.
In Australia, political expenditure for the financial year ended 30 September 2021 was $137,151. This relates to payment for participation in legitimate political engagement activities where they were assessed to be of direct business relevance to Westpac. Such activities include business observer programs attached to annual party conferences, policy dialogue forums and other political engagement activities, such as speeches and events with industry participants.
In New Zealand, political expenditure for the financial year ended 30 September 2021 was NZD$10,321.

49WESTPAC GROUP 2021 ANNUAL REPORT3 FIN
AN
CIA
L STATE
ME
NTS
2 GR
OU
P P
ER
FOR
MA
NC
E1 STR
ATE
GIC
RE
PO
RT
4 SH
AR
EH
OLD
ER
INFO
RM
ATIO
N
Directors’ report
9. Directors’ meetings
The Westpac Banking Corporation Board met 12 times during the year ended 30 September 2021. In addition, Directors attended Board strategy sessions and special purpose committee meetings during the year.
The following table includes:
• Names of the Directors that held office at any time during, or since the end of the financial year.
• The number of scheduled and unscheduled Board and Board Committee meetings held during the financialyear that each Director, as a member of the Board or Board Committee was eligible to attend, and the numberof meetings attended by each Director.
The table excludes the attendance of those Directors who attended the Board Committee meetings of which they are not a member.
Scheduled meetings
Unscheduled meetings3 Risk
Legal, Regulatory & Compliance Audit Remuneration
Nominations & Governance Technology
Held1
At-tend-ed2 Held1
At-tend-ed2 Held1
At-tend-ed2 Held1
At-tend-ed2 Held1
At-tend-ed2 Held1
At-tend-ed2 Held1
At-tend-ed2 Held1
At-tend-ed2
Director
John McFarlane4 9 9 3 3 n/a n/a n/a n/a n/a n/a n/a n/a 4 4 n/a n/a
Peter King5 9 9 3 3 n/a n/a n/a n/a n/a n/a n/a n/a n/a n/a 4 4
Nerida Caesar6 9 9 3 3 n/a n/a 10 10 n/a n/a n/a n/a n/a n/a 4 4
Craig Dunn7 9 9 3 3 10 10 n/a n/a n/a n/a 8 8 4 4 n/a n/a
Audette Exel AO8 1 1 n/a n/a 1 1 n/a n/a n/a n/a n/a n/a n/a n/a 0 0
Steven Harker9 9 9 3 3 n/a n/a 10 10 5 5 6 6 n/a n/a n/a n/a
Michael Hawker AM10 8 8 2 2 n/a n/a 8 7 n/a n/a n/a n/a 3 3 3 3
Chris Lynch11 9 9 3 3 10 10 n/a n/a 5 5 n/a n/a n/a n/a n/a n/a
Peter Marriott12 9 9 3 3 10 10 10 10 5 5 n/a n/a 4 4 4 4
Peter Nash13 9 9 3 3 10 10 10 10 5 5 n/a n/a 4 4 n/a n/a
Nora Scheinkestel14 6 6 n/a n/a 6 6 n/a n/a n/a n/a 5 5 n/a n/a n/a n/a
Margaret Seale15 9 9 3 3 5 5 10 10 n/a n/a 8 8 2 2 n/a n/a
Former Director
Alison Deans16 2 2 2 2 2 2 n/a n/a n/a n/a 3 2 1 1 1 1
1. The number of scheduled meetings held during the time the Director was a member of the Board or Board Committee.2. The number of scheduled Board or Committee meetings that the Director attended as a member.3. Out of cycle meetings normally called for a special purpose that do not form part of the Board’s forward agenda.4. Chairman of the Board and Chairman of the Board Nominations & Governance Committee.5. Retired as a member of the Board Technology Committee on 1 September 2021.6. Member of the Board Legal, Regulatory & Compliance Committee and the Board Technology Committee.7. Chairman of the Board Remuneration Committee. Member of the Board Risk Committee and Board Nominations & Governance
Committee.8. Appointed as a Director and member of the Board Risk Committee and the Board Technology Committee on 1 September 2021.9. Appointed as a member of the Board Remuneration Committee on 1 December 2020. Member of the Board Audit Committee and
Board Legal, Regulatory & Compliance Committee. Retired as a Director on 26 October 2021.10. Appointed as a Director and member of the Board Legal, Regulatory & Compliance Committee and Board Technology Committee
on 1 December 2020. Appointed as Chairman of the Board Technology Committee and as a member of the Board Nominations &Governance Committee on 11 December 2020.
11. Member of the Board Audit Committee and Board Risk Committee.12. Chairman of the Board Risk Committee and member of the Board Legal, Regulatory & Compliance Committee, Board Audit
Committee, Board Nominations & Governance Committee and Board Technology Committee.13. Chairman of the Board Audit Committee and member of the Board Risk Committee, Board Legal, Regulatory & Compliance
Committee and Board Nominations & Governance Committee. Ceased to be the Chairman of the Board Legal, Regulatory &Compliance Committee on 1 April 2021.
14. Appointed as a Director and member of the Board Risk Committee and Board Remuneration Committee on 1 March 2021.15. Appointed as Chairman of the Board Legal, Regulatory & Compliance Committee and as a member of the Board Risk Committee and
Board Nominations & Governance Committee on 1 April 2021. Member of the Board Remuneration Committee.16. Retired as a Director following the completion of the 2020 Annual General Meeting.

50 WESTPAC GROUP 2021 ANNUAL REPORT
Directors’ report
Our remuneration framework will continue to play a key role in supporting the strategic priorities and driving performance and outcomes for all of our stakeholders.
2021 remuneration outcomesIn making this year's remuneration decisions, the Board has sought to reflect and balance performance, risk and shareholder outcomes.
In doing so, the Board has taken into account the impact of historical issues, including further remediation provisions, asset write-downs and litigation. It has balanced these disappointing outcomes, with the good progress made on Westpac’s strategic priorities by the renewed Executive team. It is critical that we measure and reward the organisation's progress in transforming the company and addressing past issues – as this will ultimately drive shareholder value.
Unfortunately, as we work through the Fix and Simplify priorities, some new unknown issues from the past have surfaced, and costs of other historical issues have increased or become clearer. The culture we are building encourages the identification and effective rectification of issues along with establishing controls to stop them happening again – and this should be recognised. It is also important, where possible, that we hold relevant executives accountable for such issues, when they bear accountability, as we do through the application of consequences including individual remuneration adjustments.
In summary, key remuneration outcomes for 2021 include:
• The CEO's 2021 Short Term Variable Reward (STVR)outcome was 47% of the maximum opportunity;
• The average 2021 STVR outcome for GroupExecutives was 48% of the maximum opportunity,with outcomes ranging from 0% to 70%;
• The 2018 Long Term Variable Reward (LTVR) lapsedin full for the sixth consecutive year;
• Remuneration adjustments were applied to twoformer Group Executives for risk and complianceoutcomes resulting in reductions to 2021 STVR;
10. Remuneration Report
Letter from the Chairman of the Board Remuneration Committee
Directors’ report
Dear shareholders,
On behalf of the Board, I am pleased to present Westpac’s 2021 Remuneration Report.
Group performance and strategic priorities2021 was a year of renewal focused on our strategy to Fix, Simplify and Perform. This Annual Report outlines our progress on these strategic priorities, which have been central to how we have measured and rewarded performance this year.
The COVID-19 pandemic has continued to have a profound impact on all areas of society. Westpac has been proud to deliver a range of measures for our customers to help provide a level of support and certainty, including repayment deferrals, certain fee waivers and low interest loans.
Westpac's result this year, with reported net profit up 138% and cash earnings up 105%, has been mostly due to two factors: a reduction in notable items (large infrequent items that do not reflect ongoing operations) and a $3.8 billion turnaround in impairment charges.
On a cash earnings basis, our underlying operating performance (earnings before impairment charges and notable items) was down on 2020, and finished 5% below the target agreed with the Board at the beginning of the year.
Pleasingly, we restored mortgage growth through the year, though margins were down from very low interest rates and strong competition and, as a result, net interest income was lower. To drive improved earnings, we have established a cost reset program targeting a cost base of $8 billion by 2024, although operating costs (excluding notable items) were higher this year, up 8% given the Fix agenda and higher volumes, including COVID-19 assistance. Variable reward payments were also higher recognising the remuneration decisions made by the Board in 2020 to reflect collective accountability for the AUSTRAC matter.
Although we have made good progress on implementing our strategic priorities, particularly simplifying our business, more issues have emerged as we have worked to improve our management of risk and delved deeper into our processes. These have included additional regulatory actions and investigations, weaknesses in our calculation of liquidity ratios and further remediation provisions. This has been disappointing – clearly, we have more to do.
2021 was a year of renewal focused on Fix, Simplify and Perform.

51WESTPAC GROUP 2021 ANNUAL REPORT3 FIN
AN
CIA
L STATE
ME
NTS
2 GR
OU
P P
ER
FOR
MA
NC
E4
SHA
RE
HO
LDE
R IN
FOR
MA
TION
1 STRA
TEG
IC R
EP
OR
T
Directors’ report
• A range of remuneration and other consequenceswere applied to other current and former employeesin relation to the potential fraud by Forum Finance;
• Two Group Executives received total targetremuneration increases reflecting increased scopeand accountability in their expanded roles; and
• Total realised remuneration by the CEO and GroupExecutives was higher year on year given thecancellation of 2020 STVR to demonstrate collectiveaccountability for the outcomes that led to theAUSTRAC proceedings.
A summary of remuneration decisions and outcomes for 2021 is set out following this letter, along with a summary of executive appointments and exit arrangements.
In addition, the Board reviewed the CEO's target remuneration package for 2022 and determined an increase of 3% to align with market. Further details will be included in the Notice of the 2021 Annual General Meeting.
The Board also determined that one other Group Executive will receive an increase of 4% to their 2022 target remuneration package to align with market.
Future directionExecutive remuneration structure review
Amidst the changing environment, the Group continued its review of the executive remuneration structure.
The key objective of the review is to ensure that our remuneration structure continues to support Westpac's strategy, as well as our remuneration strategy and principles, while meeting the requirements of APRA's Prudential Standard CPS 511 (Remuneration).
A key focus is to support further alignment to the long term interests of shareholders and provide market competitive remuneration. The minimum shareholding requirement will also be updated as part of the review.
In the interim, any shares that may be delivered to the CEO and Group Executives through LTVR grants from 2022 onwards are only able to be sold to meet tax obligations, until their minimum shareholding requirement is met.
In addition, the CEO has made a commitment to not sell any Westpac shareholdings while he is below his minimum shareholding requirement, except for the purpose of meeting tax obligations.
We look forward to continuing to engage with shareholders on the review.
Environmental, social and governance focus
Westpac recognises the importance of integrating how we address environmental, social and governance (ESG) issues in the remuneration framework and ensuring that it supports and enables progress in these areas.
This is currently achieved through the inclusion of certain measures in the Group STVR scorecard which are aligned to the ESG related priorities integrated in our strategy. The modifier also includes reference to aspects of our ESG priorities and for 2022, the modifier will include an explicit component for climate related priorities.
On behalf of the Board, I invite you to read our Remuneration Report and welcome your feedback. I hope you find the summaries on the following page to be a useful reference when reading the broader Report.
Craig Dunn, Chairman Board Remuneration Committee
In this Report
1. Key Management Personnel 53
2. Summary of the 2021 executive remuneration framework 54
3. 2021 remuneration outcomes and alignment to performance 56
4. Further detail on the executive variable reward structure 60
5. Remuneration governance 62
6. Non-executive Director remuneration 64
7. Statutory remuneration details 65

52 WESTPAC GROUP 2021 ANNUAL REPORT
Directors’ report
Chief Executive Officer
• The CEO’s target remuneration package remained in line with the prior year comprising fixed remuneration of $2,400,0001, target STVR of $2,400,000 (which may be awarded at between 0% and 150% of target depending on performance) and LTVR of $3,200,000. This represents a 10.7% reduction relative to the former CEO.
• In 2021, the CEO received $2.40 million in fixed remuneration, $0.84 million in cash STVR and $0.17 million in deferred STVR awarded in prior years that vested during the year, equalling $3.41 million in total realised remuneration (i.e. take home pay).
• The CEO’s 2021 STVR outcome is 47% of maximum opportunity.
• The 2018 LTVR outcome is zero. The LTVR lapsed in full because the relative TSR and cash ROE hurdles were not achieved.
Non-executive Directors
• There was no change to Non-executive Director base fees, which have not increased since 1 October 2014.
Group Executives
• The average 2021 STVR outcome for Group Executives was 48% of maximum opportunity, with outcomes ranging from 0% to 70%.
• A total target remuneration increase of 11% was approved for Chris de Bruin in line with the increased scope and accountability associated with his new role in merging and leading the Consumer & Business Bank.
• A total target remuneration increase of 11% was approved for Les Vance in line with the increased scope and accountability including Financial Crime Operations, the integrated plan under the Enforceable Undertaking and the Customer Outcomes and Risk Excellence (CORE) program.
All employees
• Remuneration arrangements continued to be refined including the removal of short term variable reward for certain employee groups. Over 14,000 employees will progressively transition to fixed remuneration arrangements without any variable reward by the end of 2022.
• The Group managed 1,306 employee conduct matters in Australia in 2021, of which 95 employees exited the business and 828 employees were subject to formal disciplinary outcomes.
Summary of remuneration decisions and actions
Summary of appointment and exit arrangementsNew Executives Appointment arrangements
Scott Collary
Chief Operating Officer
• Total target remuneration of $4,700,0001 comprised of 26% fixed remuneration, 26% STVR and 48% LTVR.
• Pro rata 2021 LTVR grant.
• Buy out award2 comprising cash and equity components totalling $2,153,360.
• Relocation benefits.
Chris de Bruin
Chief Executive, Consumer & Business Banking
• Total target remuneration of $4,500,0001 comprised of 26% fixed remuneration, 26% STVR and 48% LTVR. Total target remuneration was subsequently increased by 11% reflecting his new role in merging and leading the Consumer & Business Bank.
• Pro rata 2021 LTVR grant.
• Buy out award2 comprising cash and equity components totalling $1,845,570.
• Relocation benefits.
Anthony Miller
Chief Executive, Westpac Institutional Bank
• Total target remuneration of $4,500,0001 comprised of 26% fixed remuneration, 26% STVR and 48% LTVR.
• Pro rata 2021 LTVR grant.
• Buy out award2 comprising cash and equity components totalling $5,717,540.
Former Executives Exit arrangements3
Guil Lima
Chief Executive, Business
• Received contractual requirements in line with retrenchment.
• Unvested equity remains on foot.
• Eligible for 2021 STVR on a pro rata basis.
David McLean
Chief Executive Officer, Westpac New Zealand
• Received contractual requirements in line with retirement.
• Unvested equity remains on foot.
• Eligible for 2021 STVR on a pro rata basis.
Gary Thursby
Acting Chief Information Officer
• Received contractual requirements in line with retrenchment.
• Unvested equity remains on foot.
• Not eligible for 2021 STVR.
1. Excludes the increase to the superannuation guarantee rate from 9.5% to 10% effective 1 July 2021.2. Provided in exceptional circumstances to compensate external hires for remuneration foregone from their previous employer on
resignation to join Westpac. Awards reflect the vesting profile at the previous employer and are subject to continued service and adjustment.
3. Refer to Section 5.4 for an overview of employment agreements including termination provisions.

53WESTPAC GROUP 2021 ANNUAL REPORT3 FIN
AN
CIA
L STATE
ME
NTS
2 GR
OU
P P
ER
FOR
MA
NC
E4
SHA
RE
HO
LDE
R IN
FOR
MA
TION
1 STRA
TEG
IC R
EP
OR
T
Directors’ report
1. Key Management PersonnelThe remuneration of KMP is disclosed in the Report. In 2021, KMP comprised the CEO, Group Executives andNon-executive Directors as set out in the table below. Disclosures related to former KMP that ceased in 2020 areincluded in the 2020 Annual Report.
KMP is defined as those persons having authority and responsibility for planning, directing and controlling the activities of an entity, directly or indirectly, including any director (whether executive or otherwise) of that entity.
Name Position Term as KMP
Managing Director & Chief Executive Officer
Peter King Managing Director & Chief Executive Officer Full Year
Group Executives
Scott Collary1 Chief Operating Officer Commenced in KMP role on 2 November 2020
Chris de Bruin2 Chief Executive, Consumer & Business Banking Commenced in KMP role on 4 January 2021
Carolyn McCann Group Executive, Customer & Corporate Relations Full Year
Anthony Miller Chief Executive, Westpac Institutional Bank Commenced in KMP role on 19 October 2020
Christine Parker Group Executive, Human Resources Full Year
Simon Power Acting Chief Executive Officer, Westpac New Zealand Commenced in KMP role on 26 June 2021
Michael Rowland Chief Financial Officer Full Year
David Stephen Chief Risk Officer Full Year
Les Vance Group Executive, Financial Crime, Compliance & Conduct Full Year
Jason Yetton3 Chief Executive, Specialist Businesses & Group Strategy Full Year
Former Group Executives
Richard Burton Acting Chief Executive, Consumer Ceased in KMP role on 31 January 2021
Guil Lima Chief Executive, Business Ceased in KMP role on 22 March 2021
David McLean Chief Executive Officer, Westpac New Zealand Ceased in KMP role on 25 June 2021
Gary Thursby Acting Chief Information Officer Ceased in KMP role on 23 November 2020
Alastair Welsh Acting Group Executive, Enterprise Services Ceased in KMP role on 23 November 2020
Curt Zuber Acting Chief Executive, Westpac Institutional Bank Ceased in KMP role on 19 October 2020
Current Non-executive Directors
John McFarlane Chairman Full Year
Nerida Caesar Director Full Year
Craig Dunn4 Director Full Year
Audette Exel AO5 Director Commenced in KMP role on 1 September 2021
Steven Harker6 Director Full Year
Michael Hawker AM7 Director Commenced in KMP role on 1 December 2020
Chris Lynch Director Full Year
Peter Marriott Director Full Year
Peter Nash Director Full Year
Nora Scheinkestel8 Director Commenced in KMP role on 1 March 2021
Margaret Seale Director Full Year
Former Non-executive Director
Alison Deans Director Retired on 11 December 2020 following completion of the 2020 Annual General Meeting
1. Scott Collary commenced as a Group Executive on 2 November 2020 and assumed responsibility for the Chief Operating Office on 23November 2020. Alastair Welsh and Gary Thursby continued in their respective Acting Group Executive roles until 23 November 2020.
2. Chris de Bruin commenced as Group Executive on 4 January 2021 and assumed responsibility for the Consumer division on 1 February2021. Chris de Bruin was appointed Chief Executive, Consumer & Business Banking on 22 March 2021. Richard Burton continued in theActing Chief Executive, Consumer role until 31 January 2021.
3. Jason Yetton’s title was changed from Chief Executive, Specialist Businesses, Strategy & Transformation to Chief Executive, SpecialistBusinesses & Group Strategy on 14 December 2020. Jason’s total target remuneration was not changed.
4. Craig Dunn will retire from the Board following the 2021 Annual General Meeting.5. Audette Exel was appointed as a Non-executive Director on 1 September 2021.6. Steven Harker retired from the Board on 26 October 2021.7. Michael Hawker was appointed as a Non-executive Director on 1 December 2020.8. Nora Scheinkestel was appointed as a Non-executive Director on 1 March 2021.

54 WESTPAC GROUP 2021 ANNUAL REPORT
Directors’ report
2. Summary of the 2021 executive remuneration frameworkOur purpose and strategy are supported by our remuneration strategy, principles and frameworks.
Westpac’s purpose and strategyWestpac’s purpose is to help Australians and New Zealanders succeed. Our strategy seeks to deliver on our purpose by building deep and enduring customer relationships, being a leader in the community, being a place where the best people want to work and, in so doing, delivering sustainable returns for shareholders.In delivering our strategy, we have three priorities that help guide our activities:• Fix;• Simplify; and• Perform.
Remuneration strategy Westpac’s remuneration strategy is designed to attract and retain talented employees by rewarding them for achieving high performance and delivering superior long-term results for our customers and shareholders, while adhering to sound risk management and governance principles.
Remuneration principlesThe remuneration strategy is underpinned by the following principles:• align remuneration with customer and shareholder interests;• support an appropriate risk culture and employee conduct;• differentiate pay for behaviour and performance in line with our vision and strategy;• provide market competitive and fair remuneration;• enable recruitment and retention of talented employees;• provide the ability to risk-adjust remuneration; and• be simple, flexible and transparent.
Executive remuneration framework
Fixed remuneration STVR LTVR
Purpose
Attract and retain high quality executives through market competitive and fair remuneration.
Ensure a portion of remuneration is variable, at-risk and linked to the delivery of agreed plan targets for financial and non-financial measures that support Westpac’s strategic priorities. The STVR outcome can range from 0% to 100% of target depending on performance relative to targets agreed at the beginning of the year, or exceed 100% (up to a maximum of 150% of target) when exceptional performance is achieved.
Align executive accountability and remuneration with the long-term interests of shareholders by rewarding the delivery of sustained Group performance over the long term.
Delivery
Comprises cash salary, salary sacrificed items and superannuation contributions.
Awarded in cash (50%) and restricted shares1 (50%) based on an assessment of performance over the preceding year. Restricted shares vest in equal portions after one and two years following grant subject to continued service and adjustment.
Awarded in performance share rights which vest after four years subject to the achievement of a relative Total Shareholder Return (TSR) performance hurdle, continued service and adjustment.
Alignment to performance
Set with reference to market benchmarks in the financial services industry in Australia and globally as well as the size, responsibilities and complexity of the role, and the skills and experience of the executive.Individual performance impacts fixed remuneration adjustments.
Performance is assessed using a scorecard comprising:• a values and behaviours assessment
against Westpac's values;
• financial and non-financial measureslinked to Westpac’s key strategicpriorities; and
• a modifier to support the adjustment ofthe outcome, upwards or downwards(including to zero), for risk andreputation matters, people managementmatters and any other matters asdetermined by the Board.
Performance is assessed against relative TSR which is a comparative measure of Westpac’s performance relative to that of peers (measured over four years).
Alignment to shareholders
Minimum shareholding requirements equivalent to five times annual fixed remuneration excluding superannuation for the CEO and $1.2 million for Group Executives. These requirements must be satisfied within five years of appointment.
Half of the STVR award is deferred into equity for a period of up to two years to support alignment with shareholders over the medium term.
The LTVR is delivered in equity and the relative TSR performance hurdle is aligned to long-term shareholder returns and value creation.
1. The Group Executives outside of Australia receive deferred STVR as unhurdled share rights.

55WESTPAC GROUP 2021 ANNUAL REPORT3 FIN
AN
CIA
L STATE
ME
NTS
2 GR
OU
P P
ER
FOR
MA
NC
E4
SHA
RE
HO
LDE
R IN
FOR
MA
TION
1 STRA
TEG
IC R
EP
OR
T
Directors’ report
2.1. RiskWestpac’s remuneration arrangements are designed and managed to support effective risk management, the generation of appropriate risk-based returns and the risk profile associated with our businesses which incorporate products with varying complexity and maturity profiles.
• Remuneration outcomes: The performance of the Group and each division is reviewed and measured with reference to how risk is managed in line with Westpac’s Risk Appetite Statement and the results influence remuneration outcomes. The key risks that are considered include strategic risk, risk culture, operational risk, compliance and conduct, financial crime, cyber risk, reputational and sustainability risk, capital adequacy, funding and liquidity risk, credit risk and market risk. In addition, STVR outcomes are influenced by relevant risk-related matters through the Board’s application of the scorecard modifier, which is informed by risk and compliance input independent of the business or functional area.
• Variable reward pool: The Board determines the size of the variable reward pool each year. This is based on the Group’s performance for the year and an assessment of how profit should be shared between shareholders and employees while retaining sufficient capital for growth. A broad range of non-financial measures including customer outcomes, talent retention and market competitiveness are considered when determining the pool.
• Mandatory risk and compliance requirements: Individuals are only eligible to receive a fixed remuneration adjustment, STVR and LTVR where an individual has satisfied minimum requirement gates which require that behaviours are in line with Westpac’s Values and Code of Conduct and that the individual has met the risk and compliance requirements for their role and business.
• Remuneration adjustments for prior period matters: The Board may adjust all forms of unvested deferred variable reward downward, including to zero, for matters arising from a prior period if circumstances or information come to light which mean that in the Board’s view all or part of the award was not appropriate. Having decided that a downward adjustment is appropriate and determined the amount of any adjustment, typically the Board will first apply that adjustment against the STVR for the current performance period. In instances where an adjustment to current year STVR is insufficient or unavailable, the Board may apply the adjustment to unvested deferred variable reward. Clawback provides an additional mechanism to recover vested deferred variable reward in certain limited circumstances for awards made in respect of performance periods commencing on or after 1 October 2019. It is the Board’s current intention that clawback will only be considered for relevant conduct that occurred on or after 1 October 2019.
2.2. 2021 target remuneration mix1
30% fixed remuneration
15% STVR(cash component)15% STVR
(deferred component)
40% LTVR
Chief Executive Officer
26% fixed remuneration
13% STVR(cash component)
13% STVR(deferredcomponent)
48% LTVR
Group Executives2
1. Based on target STVR and LTVR (face value). Variation in the target remuneration mix by individual may apply.
2. Excludes Control Function Group Executives with a target remuneration mix comprised of 32% fixed remuneration, 24% STVR and 44% LTVR. This applies to the Group Executive, Customer & Corporate Relations, the Group Executive, Financial Crime, Compliance & Conduct, the Chief Financial Officer, the Group Executive, Human Resources and the Chief Risk Officer.
2.3. Timeline of potential remuneration2022 2023 2024 20252021
Date eligible for vesting Date grantedDate paid
Cash STVR award (50%)
Fixed remuneration
LTVR award subject to relative TSR performance (100%) – measured over 4 years
Deferred STVR award (25%)
Deferred STVR award (25%)

56 WESTPAC GROUP 2021 ANNUAL REPORT
Directors’ report
3. 2021 remuneration outcomes and alignment to performance
3.1. Snapshot of 2021 remuneration outcomes
2021 STVR
The CEO's 2021 STVR outcome was 47% of the maximum opportunity.
The average 2021 STVR outcome for Group Executives was 48% of the maximum opportunity, with outcomes ranging from 0% to 70%.
Further detail on performance and individual outcomes is set out in Section 3.5 (2021 STVR and Group Scorecard) and Section 3.6 (Variable reward awarded for 2021).
2018LTVR
There is a zero vesting outcome under Westpac’s LTVR plan for the CEO and Group Executives in 2021. The performance hurdles, comprising relative TSR and cash ROE1, were not achieved and the 2018 LTVR award lapsed in full.
The table below shows the vesting outcome for the 2018 LTVR award to the CEO and Group Executives that reached the end of its performance period in 2021.
Performance hurdle
Performance start date Test date
Performance range
Outcome % Vested % LapsedThreshold Maximum
TSR (50% of award)
1 October 2017
1 October 2021
Equal to composite TSR index
Exceeds composite
TSR index by 21.55
(i.e. 5% CAGR2)
Westpac: (1.939%)
Index: 13.895%
0% 100%
ROE (50% of award)
1 October 2017
1 October 20213 13.25% 14.25% 9.05% 0% 100%
1. Cash ROE is return on equity on a cash earnings basis. Cash earnings is not prepared in accordance with accounting standards and has not been subject to audit. Refer to Note 2 to the Financial Statements for a description of cash earnings.
2. Compound annual growth rate.3. The cash ROE hurdled performance share rights reached the end of their performance period on 30 September 2020 and were subject
to an additional one year holding lock through to 30 September 2021.
3.2. Group performance The table below summarises Group key performance indicators and variable reward outcomes over the last 5 years.
Years ended 30 September2021 2020 2019 2018 2017
CEO STVR award (% of maximum) 47% 0% 0% 52% 74%
Average Group Executive STVR (% of maximum) 48% 0% 37% 58% 73%
LTVR award (% vested) 0% 0% 0% 0% 0%
Cash earnings1 ($m) 5,352 2,608 6,849 8,065 8,062
Statutory earnings ($m) 5,458 2,290 6,784 8,095 7,990
Economic profit2 ($m) 768 (3,579) 1,619 3,444 3,774
Cash ROE2 7.55% 3.83% 10.75% 13.00% 13.77%
TSR – three years 1.18% (35.43%) 15.33% 8.27% 11.79%
TSR – five years 10.34% (27.87%) 14.58% 25.67% 81.32%
Dividends per Westpac share (cents) 60 31 174 188 188
Cash earnings per Westpac share1 $1.46 $0.73 $1.98 $2.36 $2.40
Share price – high $27.12 $29.81 $30.05 $33.68 $35.39
Share price – low $16.51 $13.47 $23.30 $27.24 $28.92
Share price – close $26.00 $16.84 $29.64 $27.93 $31.92
0%
20%
40%
60%
80%
100%
STVR
aw
ard
(% o
f max
imum
)
0
2,000
4,000
6,000
8,000
Cas
h ea
rnin
gs ($
m)
2017
Cash earnings ($m)CEO STVR award (% of maximum)
Return on equity (%)LTVR award (% vested)
2018 2019 2020 2021 2017 2018 2019 2020 20210%
20%
40%
60%
100%
80%
0%2%4%6%8%
10%12%14%16%
LTVR
aw
ard
(% v
este
d)
Ret
urn
on e
quity
-40%
-20%
0%
20%
40%
80%
60%
Tota
l sha
reho
lder
retu
rn
Oct 16 Oct 17 Oct 18 Oct 19 Oct 20 Oct 21
Peer 1 Peer 2 Peer 3Westpac
Cash earnings and CEO STVR award (2017 to 2021)
Return on equity and LTVR vesting (2017 to 2021)
Total shareholder return (1 October 2016 to 30 September 2021)
1. Cash earnings is not prepared in accordance with AAS and has not been subject to audit. Refer to Note 2 to the Financial Statements for a description of cash earnings.
2. Economic profit and cash ROE is derived from cash earnings.

57WESTPAC GROUP 2021 ANNUAL REPORT3 FIN
AN
CIA
L STATE
ME
NTS
2 GR
OU
P P
ER
FOR
MA
NC
E4
SHA
RE
HO
LDE
R IN
FOR
MA
TION
1 STRA
TEG
IC R
EP
OR
T
Directors’ report
3.3. Total realised remuneration – Chief Executive Officer and Group Executives (000) (unaudited)The table below details the actual remuneration paid1 and equity that vested2 in 2021 and 2020.
Fixed remuneration
Cash STVR payments
Vesting of prior year
deferred STVR awards
Vesting of prior year
LTVR awardsTotal realised remuneration
Prior year LTVR lapsed
Name $ $ $ $ $ $
Managing Director & Chief Executive OfficerPeter King, Managing Director & Chief Executive Officer2021 2,403,149 840,000 169,680 - 3,412,829 2,043,148 2020 2,120,582 - 294,003 - 2,414,585 1,478,000
Group ExecutivesScott Collary, Chief Operating Officer3
2021 1,123,350 444,500 - - 1,567,850 - 2020 ---------------------------------------- Not a KMP in 2020 ----------------------------------------
Chris de Bruin, Chief Executive, Consumer & Business Banking3
2021 941,648 467,500 - - 1,409,148 - 2020 ---------------------------------------- Not a KMP in 2020 ----------------------------------------
Carolyn McCann, Group Executive, Customer & Corporate Relations2021 901,181 285,000 101,083 - 1,287,264 318,535 2020 809,655 - 152,968 - 962,623 -
Anthony Miller, Chief Executive, Westpac Institutional Bank3
2021 1,122,518 392,000 - - 1,514,518 - 2020 ---------------------------------------- Not a KMP in 2020 ----------------------------------------
Christine Parker, Group Executive, Human Resources2021 1,001,312 320,000 163,708 - 1,485,020 1,628,097 2020 945,609 - 258,908 - 1,204,517 1,082,000
Simon Power, Acting Chief Executive Officer, Westpac New Zealand3
2021 200,897 82,066 - - 282,963 - 2020 ---------------------------------------- Not a KMP in 2020 ----------------------------------------
Michael Rowland, Chief Financial Officer2021 1,201,574 405,000 - - 1,606,574 - 2020 101,149 - - - 101,149 -
David Stephen, Chief Risk Officer4
2021 1,802,362 439,000 242,181 - 2,483,543 4,788,645 2020 1,806,897 - 163,678 - 1,970,575 -
Les Vance, Group Executive, Financial Crime, Compliance & Conduct2021 959,331 278,500 - - 1,237,831 - 2020 263,115 - - - 263,115 -
Jason Yetton, Chief Executive, Specialist Businesses & Group Strategy2021 1,177,574 617,000 - - 1,794,574 - 2020 463,391 - - - 463,391 -
Former Group ExecutivesRichard Burton, Acting Chief Executive, Consumer3
2021 281,085 127,500 - - 408,585 - 2020 249,922 - - - 249,922 -
Guil Lima, Chief Executive, Business3
2021 546,666 68,726 - - 615,392 - 2020 968,888 - - - 968,888 -
David McLean, Chief Executive Officer, Westpac New Zealand3
2021 747,731 - 246,825 - 994,556 1,740,843 2020 1,025,640 - 354,552 - 1,380,192 1,157,000
Gary Thursby, Acting Chief Information Officer3,5
2021 179,081 - 252,615 - 431,696 1,396,686 2020 1,179,081 120,000 247,802 - 1,546,883 1,010,000
Alastair Welsh, Acting Group Executive, Enterprise Services3
2021 121,402 42,000 70,153 - 233,555 - 2020 834,050 - 75,794 - 909,844 -
Curt Zuber, Acting Chief Executive, Westpac Institutional Bank3
2021 66,955 - - - 66,955 - 2020 295,609 - - - 295,609 -
1. Excluding contractual provisions relating to termination.2. Equity that vested in October 2021 is included in the 2021 figures. Equity that vested in October 2020 is included in the 2020 figures. The
value of deferred STVR and LTVR is based on the number of restricted shares or share rights multiplied by the five day VWAP up to and including the scheduled date of vesting, forfeiture or lapse (as relevant). The value of equity differs from the disclosure in Section 7.
3. The information relates to the period the individual was a KMP. Refer to Section 1 for further details.4. David Stephen's prior year LTVR lapsed represents a portion of his buy out award which was subject to the 2018 LTVR performance
hurdles and vesting criteria.5. In 2020, Gary Thursby received a cash payment relating to the divestment of part of the BT Financial Group and the Wealth Reset.
3.4. Buy out awards paid or vested during 2021In addition, the following buy out awards were paid or vested under the Restricted Share Plan during the year: Scott Collary received a cash buy out of $780,000, Chris de Bruin received a cash buy out of $649,660, Anthony Miller received a cash buy out of $920,050, David Stephen had 32,581 restricted shares vest in March 2021 and Guil Lima had 10,963 and 8,729 restricted shares vest in October 2020 and March 2021 respectively.

58 WESTPAC GROUP 2021 ANNUAL REPORT
Directors’ report
3.5. 2021 short term variable reward and Group scorecardThe Group’s priorities are set out in the Group scorecard, which forms part of the CEO’s scorecard and is cascaded to Group Executive scorecards in combination with other divisional measures. The Board’s preference is to make any discretionary adjustments within each focus area of the scorecard where the initial score is not considered to appropriately reflect performance. The discretion applied by the Board reflects performance and risk outcomes for the year along with the outcomes experienced by our key stakeholders.
Performance measures and targets were not adjusted to reflect the continuing impacts of COVID-19. The measures and weightings of the Fix focus area were agreed with APRA as part of the Enforceable Undertaking. A summary of the performance assessment is provided below. Further detail is set out throughout this Annual Report.
Group scorecard - short term variable reward Focus area outcome
Fix (30%)
Performance measurement is based on delivery of the Customer Outcomes and Risk Excellence (CORE) Integrated Plan and measured by committed activities and associated outcomes.
• Established the CORE Program and the Integrated Plan was approved by APRA. The foundation for a successful program is in place and currently tracking to plan.
• The Group’s cultural transformation, through our Culture Reset program, delivered good progress. The Organisational Health Index score exceeded targets (74 vs. 72).
• Further improved the stability of our technology environment, notwithstanding the Panorama outage.
• Certain Group risks returned within appetite and key non-financial risk metrics demonstrated progress, including a considerable reduction in outstanding High Risk Issues and improved financial crime capability.
• Significant risk incidents arose: APRA’s Prudential Standards on liquidity, potential fraud by Forum Finance, ASIC proceedings in relation to the 2016 Ausgrid transaction and the Reserve Bank of New Zealand requiring reviews into risk governance practices.
0% 100%50% 150%
0% 100%
Zero Maximum
40% of maximum outcome contributing 12% to maximum STVR
Simplify (20%)
Performance measurement is based on the exit of non-core businesses and consolidating international operations, embedding the Lines of Business operating model, using data and technology to transform the customer experience and reducing systems and technology complexity.
• Completed the sale of four businesses, with three further businesses under sale agreements. The proposed sale of Westpac Pacific was not supported by PNG regulators.
• Closed two international offices with a further three currently in the process of winding down by the end of 2022.
• Closed over 284 products and launched an end-to-end digital mortgage experience to speed up the application process for customers.
• Completed the migration of BT Wrap to Panorama taking total funds under administration on Panorama to over $100 billion.
• Continued to embed the Lines of Business operating model which is operating well with improved accountability and decision making.
Zero Maximum
0% 100%
0% 150%100%50%
57% of maximum outcome contributing 12% to maximum STVR
Perform (50%)
Performance measurement is based on enhancing financial returns and optimising capital, growth in key markets, resetting the cost base and providing market leading customer service.
• Cash earnings up by 105% (above $5.2bn target). Core earnings (excluding notable items) down on 2020 and below target by 5%. Cash return on equity of 7.55%, up from 3.83%.
• Established our cost reset program targeting a cost base of $8 billion by 2024, though operating costs (excluding notable items) exceeded target by 8%.
• Net growth in Australian mortgages was $14.7bn (2020: -$8.3bn). 2H21 Australian mortgage settlements were in line with major bank system growth.
• Provided support to customers throughout COVID, including over 200,000 deferral packages. Targets for Net Promoter Scores were not met and Consumer bank scores lagged major bank peers for the year.
• Further developed our ESG plan with a particular focus on developing our approach to climate change and plans to reach net zero.
Zero Maximum150%
50%
0% 100%
150%100%
50%
47% of maximum outcome contributing 23% to maximum STVR
Overall Group scorecard performance assessment 47% of maximum STVR

59WESTPAC GROUP 2021 ANNUAL REPORT3 FIN
AN
CIA
L STATE
ME
NTS
2 GR
OU
P P
ER
FOR
MA
NC
E4
SHA
RE
HO
LDE
R IN
FOR
MA
TION
1 STRA
TEG
IC R
EP
OR
T
Directors’ report
3.6. Variable reward awarded for 2021 (unaudited)The table below shows the variable reward awarded to the CEO and Group Executives for 2021, including:• STVR outcomes for 2021 (including the cash and deferred equity components); and• equity granted under the 2021 LTVR plan1.
The final value of equity received will depend on the share price at the time of vesting and the number of restricted shares or share rights that vest subject to performance hurdles (where applicable), continued service and remuneration adjustments. The value of equity differs from the disclosure in Section 7 which provides the annualised accounting value for unvested equity awards prepared in accordance with accounting standards.
2021 LTVR award
Name
Maximum STVR
opportunity (pro rata)
($)
STVR award (% of
maximum)STVR
outcome ($)
Maximum STVR
foregone ($)
Face value1 (pro rata)
($)
Managing Director & Chief Executive OfficerPeter King 3,600,000 47% 1,680,000 1,920,000 3,200,000
Group Executives
Scott Collary2
Chief Operating Officer 1,676,404 53% 889,000 787,404 2,062,500
Chris de Bruin2
Chief Executive, Consumer & Business Banking 1,402,911 67% 935,000 467,911 1,721,575
Carolyn McCannGroup Executive, Customer & Corporate Relations 1,005,000 57% 570,000 435,000 1,230,000
Anthony Miller2
Chief Executive, Westpac Institutional Bank 1,675,582 47% 784,000 891,582 2,060,417
Christine ParkerGroup Executive, Human Resources 1,200,000 53% 640,000 560,000 1,562,000
Simon Power2
Acting Chief Executive Officer, Westpac New Zealand 307,850 53% 164,133 143,717 67,298
Michael RowlandChief Financial Officer 1,350,000 60% 810,000 540,000 1,700,000
David StephenChief Risk Officer 2,025,000 43% 878,000 1,147,000 2,559,375
Les VanceGroup Executive, Financial Crime, Compliance & Conduct 1,070,959 52% 557,000 513,959 1,303,288
Jason Yetton
Chief Executive, Specialist Businesses & Group Strategy 1,762,500 70% 1,234,000 528,500 2,150,000
Former Group Executives
Richard Burton2
Acting Chief Executive, Consumer 424,603 60% 255,000 169,603 141,534
Guil Lima2
Chief Executive, Business 824,712 17% 137,452 687,260 2,072,500
David McLean2
Chief Executive Officer, Westpac New Zealand 1,123,879 0% 0 1,123,879 1,845,791
Gary Thursby2
Acting Chief Information Officer 518,116 - - - -
Alastair Welsh2
Acting Group Executive, Enterprise Services 182,959 46% 84,000 98,959 60,986
Curt Zuber2
Acting Chief Executive, Westpac Institutional Bank 110,959 - - - -
Average Group Executive STVR award (% of maximum) 48%
1. Calculated by multiplying the number of rights by the five day VWAP up to the commencement of the performance period. The fiveday VWAP was $17.10 for awards made in December 2020 and April 2021. For Richard Burton and Alastair Welsh, given their Actingcapacity, the five day VWAP was $20.02 for awards made in December 2020 which were allocated under the Restricted Share plan witha deferral period of four years subject to continued service and adjustment.
2. The information relates to the period the individual was a KMP. Refer to Section 1 for further details.

60 WESTPAC GROUP 2021 ANNUAL REPORT
Directors’ report
4. Further detail on the executive variable reward structureThis section provides further details of the 2021 STVR and LTVR plans.
4.1. Short term variable rewardThe table below sets out the key design features of the 2021 STVR plan.
Short term variable reward plan
Plan structure 50% of STVR is awarded in cash and 50% is deferred into equity in the form of restricted shares (or unhurdled share rights for the Group Executive based outside Australia).
One restricted share provides the holder with one ordinary share at no cost subject to trading restrictions until the time of vesting.
One unhurdled share right entitles the holder to one ordinary share at the time of vesting with no exercise cost.
Dividends are paid on restricted shares from the grant date.
Target and maximum opportunity
The target opportunity for the CEO and Group Executives is expressed as a percentage of fixed remuneration. The target opportunity is set by the Board following recommendation from the Board Remuneration Committee which considers a range of factors including market competitiveness and the nature of the role.
Target STVR(100% of fixed remuneration for the CEO and between
74% and 100% of fixed remuneration for Group Executives)
Maximum STVR(150% of target STVR)
0% 100% 150%
Remuneration at-riskWestpac’s STVR is designed to award the target opportunity on delivery of agreed plan targets for financial and non-financial measures that support Westpac’s strategic priorities. It is possible for the outcome to fall below the target amount depending on performance relative to targets agreed at the beginning of the year.
Reward for exceptional performanceThere is the possibility to award up to a maximum of 150% of the STVR targetin circumstances where exceptional outcomes are achieved that are also in line with the Group’s risk appetite and where an individualhas acted in a manner that exemplifies the encouraged behaviours.
Performance measures
STVR awards are determined based on performance against a scorecard which is designed to align with shareholder interests by setting stretching measures and seeks to ensure that our customers’ and employees’ needs are met and appropriate risk settings are maintained.
The scorecard is split into three sections:
• Values and behaviours assessment: Consideration of the degree to which individuals have demonstrated Westpac's values of 'Helpful, Ethical, Leading change, Performing and Simple';
• Focus areas: Performance is assessed against a balance of financial and non-financial measures that are imperative to supporting the effective execution of Westpac’s strategy; and
• Modifier: The Board and Board Remuneration Committee recognise that performance measures may not always appropriately reflect overall performance of the Group. The modifier supports adjustment of the outcome, upwards or downwards (including to zero), for risk and reputation matters, people management matters and any other matters that the Board feels are not fully reflected in the focus areas.
Further information on the 2021 Group scorecard is provided in Section 3.5.
Deferred STVR awards recognise past performance and are subject to continued service and adjustment.
Deferral period 50% of STVR is deferred into equity for a period of up to two years, which aligns executive remuneration with shareholder interests and acts as a retention mechanism. The deferral period also allows the Board to apply discretion to reduce deferred components where necessary.
Deferred STVR vests in equal portions one and two years after the grant date, subject to continued service and adjustment.
Delayed vesting The Board has discretion (subject to law) to delay vesting of equity-based awards if the individual is under investigation for misconduct, the subject of, or implicated in legal or regulatory proceedings, if the Board is considering an adjustment or if otherwise required by law.
Remuneration adjustments for prior period matters
The Board has discretion to adjust current year STVR.
The Board may also adjust unvested deferred STVR downwards, including to zero, if circumstances or information come to light which mean that in the Board’s view all or part of the award was not appropriate. The Board will typically apply the adjustment to unvested STVR where an adjustment to current year STVR is considered insufficient or unavailable.
Clawback applies, to the extent legally permissible and practicable, to deferred STVR awarded in respect of performance periods commencing on or after 1 October 2019 for up to seven years from the date of grant. Clawback may occur in circumstances of serious or gross misconduct, fraud, bribery, severe reputational damage, and any other deliberate, reckless or unlawful conduct that may have a serious adverse impact on Westpac, its customers or its people which has resulted in dismissal or the Board considers at its discretion would have justified the dismissal of the relevant executive or where otherwise required by law. It is the Board’s current intention that clawback will only be considered for relevant conduct that occurred on or after 1 October 2019.
Changes for 2022 There are no changes to the 2022 STVR plan.

61WESTPAC GROUP 2021 ANNUAL REPORT3 FIN
AN
CIA
L STATE
ME
NTS
2 GR
OU
P P
ER
FOR
MA
NC
E4
SHA
RE
HO
LDE
R IN
FOR
MA
TION
1 STRA
TEG
IC R
EP
OR
T
Directors’ report
4.2. Long term variable rewardThe table below sets out the key design features of the 2021 LTVR Plan awarded in December 2020.
Long term variable reward plan
Plan structure LTVR is awarded in performance share rights which vest after four years subject to the achievement of performance hurdles, continued service and adjustment. One performance share right entitles the holder to one ordinary share at the time of vesting with no exercise cost. Dividends are not accumulated on performance share rights.
Award opportunity
The value of LTVR awarded to the CEO and Group Executives is expressed as a percentage of fixed remuneration. The value of LTVR is set by the Board following recommendation from the Board Remuneration Committee which considers a range of factors including market competitiveness and the nature of the role.
The face value of the LTVR opportunity for the CEO for 2021 is 133% of fixed remuneration, and the face value of LTVR opportunities for the Group Executives (excluding Acting Group Executives) range between 135% and 183% of fixed remuneration.
Allocation methodology
The number of performance share rights each executive receives will be determined by dividing the dollar value of the LTVR award by the face value of performance share rights. The face value is the five day VWAP up to the commencement of the performance period (which is 1 October 2020 for the 2021 LTVR grant).
Performance hurdles
LTVR is subject to a relative TSR performance hurdle that aims to achieve long-term growth in shareholders’ value and support alignment between executive reward and shareholder interests. Relative TSR is a measure of the total return delivered to shareholders over the performance period assuming dividends are reinvested, relative to that of peers.
The performance hurdle measures Westpac’s TSR performance against eight Australian financial services companies using a percentile ranking vesting schedule as outlined below.
Westpac’s TSR performance Indicative vesting percentage
At the 75th percentile or higher 100%
Between the median and the 75th percentile Pro-rata vesting between 50% and 100%
At the median 50%
Below the median 0%
The comparator group of companies comprise: AMP, ANZ Banking Group, Bank of Queensland, Bendigo and Adelaide Bank, Commonwealth Bank of Australia, Macquarie Group, National Australia Bank and Suncorp Group.
Assessment of performance outcomes
The relative TSR result is calculated independently to ensure external objectivity before being provided to the Board to determine the vesting outcome. The Board may exercise discretion in determining the final vesting outcome, for example where relative TSR performance hurdles have been met but the absolute TSR outcome is negative.
Performance share rights subject to relative TSR performance will be tested against the performance hurdle on 30 September 2024.
No re-testing There is no re-testing. Awards that have not vested after the measurement period lapse immediately.
Early vesting Unvested awards may vest before a test date if the executive is no longer employed by the Group due to death or disability (subject to law). In these cases, vesting is generally not subject to the performance hurdles being met.
Delayed vesting The Board has discretion (subject to law) to delay vesting of equity-based awards if the individual is under investigation for misconduct, or the subject of or implicated in legal or regulatory proceedings, if the Board is considering an adjustment or if otherwise required by law.
Treatment of awards on cessation of employment
The Board has the discretion to determine the treatment of unvested performance share rights where the CEO or a Group Executive resigns, retires or otherwise leaves the Group before vesting occurs.
The Board may choose to accelerate the vesting of performance share rights or leave the awards on foot for the remainder of the performance period. In exercising its discretion, the Board will consider relevant circumstances including those relating to the departure.
The Board also has the ability to adjust the number of performance share rights downwards (including to zero) in the event of misconduct resulting in significant financial and/or reputational impact to the Group and in other circumstances considered appropriate. Where an executive acts fraudulently or dishonestly, or is in material breach of their obligations under the relevant equity plan, unexercised performance share rights (whether vested or unvested) will be forfeited unless the Board determines otherwise.
Remuneration adjustments for prior period matters
The Board has discretion to adjust LTVR which is awarded on a prospective basis. The Board may adjust unvested LTVR downwards, including to zero, if circumstances or information come to light which mean that in the Board’s view all or part of the award was not appropriate. The Board will typically apply the adjustment to unvested LTVR where an adjustment to current and deferred STVR is considered insufficient or unavailable.
The Board may also determine to apply clawback to LTVR which has previously vested. Clawback applies, to the extent legally permissible and practicable, to deferred LTVR awarded in respect of performance periods commencing on or after 1 October 2019 for up to seven years from the date of grant. Clawback may occur in circumstances of serious or gross misconduct, fraud, bribery, severe reputational damage, and any other deliberate, reckless or unlawful conduct that may have a serious adverse impact on Westpac, its customers or its people which has resulted in dismissal or the Board considers at its discretion would have justified the dismissal of the relevant executive or where otherwise required by law. It is the Board’s current intention that clawback will only be considered for relevant conduct that occurred on or after 1 October 2019.
Changes for 2022 There are no changes to the 2022 LTVR plan, noting that any shares that may be delivered from 2022 onwards are only able to be sold to meet tax obligations until the minimum shareholding requirement is met. Refer to Section 5.2 for further detail.
Other LTVR awards currently on foot
Vesting date Performance hurdles Further detail
2019 LTVR award 30 September 2022
Relative TSR performance against a weighted composite index of comparator companies (50%) and average cash ROE performance (50%)
Refer to the 2019 Annual Report
2020 LTVR award 30 September 2023
Relative TSR performance against an index of comparator companies (100%)
Refer to the 2020 Annual Report

62 WESTPAC GROUP 2021 ANNUAL REPORT
Directors’ report
5. Remuneration governance
5.1. Group Remuneration Policy and governanceThe Group Remuneration Policy sets out the mandatory requirements to be reflected in the design and management of remuneration arrangements across Westpac.
The policy supports Westpac’s vision by requiring the design and management of remuneration to align with stakeholder interests, support long-term financial soundness and encourage prudent risk management. The policy is supported by an established governance structure, plans and frameworks.
Board
The Board provides strategic guidance for the Group and has oversight of management’s implementation of Westpac’s strategic initiatives. The Board has accountability for reviewing and approving remuneration for select groups of employees.
Without limiting its role, the Board approves (following recommendation from the Board Remuneration Committee where applicable):
• corporate goals and objectives relevant to the remuneration of the CEO;
• the size of the variable reward pool;
• adjustments to variable reward (including forfeiture and clawback) in accordance with the Group Remuneration Policy; and
• remuneration (including variable reward targets and performance outcomes) for the CEO, Group Executives, other executives who report directly to the CEO, any other accountable persons under the Banking Executive Accountability Regime, other persons whose activities in the Board’s opinion affect the financial soundness of the Group, any other person specified by APRA and any other person the Board determines.
The Board has the discretion to defer, adjust or withdraw aggregate and individual variable reward.
Further detail is contained in the Board and Committee Charters which are available on Westpac’s website.
Board Remuneration Committee
The Board Remuneration Committee assists the Board to discharge its responsibility by overseeing remuneration policies and practices of Westpac and its related bodies corporate in the context that these policies and practices fairly and responsibly reward individuals having regard to performance, and reflect Westpac’s risk management framework, the law and the highest standard of governance.
The Board Remuneration Committee reviews and makes recommendations to the Board in relation to:
• the Group Remuneration Policy;
• remuneration arrangements for the individuals and groups outlined above;
• the remuneration structures for each category of persons covered by the Group Remuneration Policy;
• corporate goals and objectives relevant to the remuneration of the CEO;
• STVR and LTVR plans and outcomes and adjustments (including forfeiture and clawback) for the Group Executives, any other accountable persons under the Banking Executive Accountability Regime and any other person the Board determines; and
• approving any equity-based plans.
In carrying out its duties, the Board Remuneration Committee accesses internal personnel (including risk and financial control personnel) and engages external advisers who are independent of management. Members of the Board Remuneration Committee are independent Non-executive Directors.
Further detail is contained in the Board Remuneration Committee Charter which is available on Westpac’s website.
Interaction with other Board Committees Management remuneration oversight committees
Members of the Board Remuneration Committee are members of either the Board Risk Committee or the Board Legal, Regulatory & Compliance Committee.
The cross membership of those Committees supports alignment between risk and reward.
The Board Remuneration Committee seeks feedback from and considers matters raised by other Board Committees with respect to remuneration outcomes, adjustments to remuneration in light of relevant matters and alignment of remuneration with the risk management framework.
Divisional remuneration oversight committees consider areas of risk and consider potential implications for remuneration. These committees report to the Group Remuneration Oversight Committee which in turn considers consistency of remuneration across the Group and provides information to the Board Remuneration Committee and Board for review and decision making as appropriate.
During the financial year, remuneration governance arrangements were reviewed and minor changes were made to enhance the Terms of Reference for the Group Remuneration Oversight Committee.
Remuneration consultants
In 2021, the Board retained an independent adviser to provide specialist information on executive remuneration and other remuneration matters. The services were provided directly to the Board Remuneration Committee independent of management. The Chairman of the Board Remuneration Committee oversees the engagement and associated costs. Work undertaken by the independent adviser included the provision of information relating to the benchmarking of Non-executive Director, CEO and Group Executive remuneration.
In 2021, no remuneration recommendations, as prescribed under the Corporations Act 2001 (Cth) (Corporations Act), were made by Board advisers.

63WESTPAC GROUP 2021 ANNUAL REPORT3 FIN
AN
CIA
L STATE
ME
NTS
2 GR
OU
P P
ER
FOR
MA
NC
E4
SHA
RE
HO
LDE
R IN
FOR
MA
TION
1 STRA
TEG
IC R
EP
OR
T
Directors’ report
5.2. Executive minimum shareholding requirements and current complianceThe CEO and Group Executives are required to build and maintain a significant Westpac shareholding within five years of their appointment to strengthen alignment with shareholder interests.
At 30 September 2021, the CEO and Group Executives comply with the requirement. The table below sets out the minimum shareholding requirement for the CEO and Group Executives.
Minimum shareholding requirement
Chief Executive Officer Five times annual fixed remuneration excluding superannuation, equivalent to $10.96 million
Group Executives Equivalent to $1.2 million
The multiple for the CEO’s shareholding requirement is higher than that of his peers and reflects Westpac’s approach to calculating the minimum shareholding requirement. Since 2006, this has included:
• shares held outright in the individual’s name either solely or jointly with another person;
• shares held in an employee share plan (including deferred STVR); and
• 50% of any unvested performance share rights (including LTVR).
The assessment approach has included shares held in a family trust or a self-managed superannuation fund since 2012.
Any shares that may be delivered to the CEO and Group Executives through LTVR grants from 2022 onwards are only able to be sold to meet tax obligations, until their minimum shareholding requirement is met.
5.3. Hedging policyParticipants in Westpac’s equity plans are prohibited from entering, either directly or indirectly, into hedging arrangements for unvested awards in the STVR and LTVR plans. No financial products may be used to mitigate the risk associated with these awards. Any attempt to hedge awards will result in forfeiture and the Board may consider other disciplinary action. These restrictions satisfy the requirements of the Corporations Act which prohibits hedging of unvested awards.
5.4. Employment agreementsThe remuneration and other terms of employment for the CEO and Group Executives are formalised in their employment agreements. Each agreement provides for the payment of fixed and variable reward, employer superannuation contributions and other benefits such as death and disablement insurance cover.
The table below details the key terms including termination provisions of the employment agreements for the CEO and Group Executives.
Term Who Conditions
Duration of agreement CEO and Group Executives • Ongoing until notice given by either party
Notice (by the executive or the Group) to terminate employment
CEO and Group Executives • Twelve months1
Termination payments on termination without cause2
CEO and Group Executives • Deferred STVR and LTVR awards vest according to the applicable equity plan rules
Termination for cause CEO and Group Executives • Immediately for misconduct
• Three months' notice for poor performance
Post-employment restraints CEO and Group Executives • Twelve month non-solicitation restraint
1. Payment in lieu of notice may in certain circumstances be approved by the Board for some or all of the notice period.2. The maximum liability for termination benefits for the CEO and Group Executives at 30 September 2021 was $14.5 million (2020:
$14.9 million).

64 WESTPAC GROUP 2021 ANNUAL REPORT
Directors’ report
6. Non-executive Director remuneration
6.1. Structure and policyWestpac’s Non-executive Director remuneration strategy is designed to attract and retain experienced, qualified Board members and provide appropriate remuneration for their time and expertise.
Non-executive Director fees are not related to Westpac’s results. Fees are paid in cash and no discretionary payments are made for performance. Non-executive Directors are required to build and maintain a minimum shareholding to align their interests with those of shareholders (refer to Section 6.3 for further details).
The table below sets out the components of Non-executive Director remuneration.
Non-executive Director remuneration
Base fees Relate to service on the Westpac Banking Corporation Board. The base fee for the Chairman covers all responsibilities, including for Board Committees.
Committee fees Additional fees are paid to Non-executive Directors (other than the Board Chairman) for chairing or participating in Board Committees other than the Board Nominations & Governance Committee.
Employer superannuation contributions
Reflects statutory superannuation contributions which are capped at the superannuation maximum contributions base as prescribed under the Superannuation Guarantee legislation.
Subsidiary Board and Advisory Board fees
Relates to service on Subsidiary Boards and Advisory Boards and are paid by the relevant subsidiary.
6.2. Non-executive Director remuneration in 2021The table below sets out the annual Board and standing Committee fees (exclusive of superannuation). Changes in Board and Committee composition during the year are set out in the overview of Directors' meetings in Section 9 of the Directors' report.
Non-executive Director base fees have not increased since 1 October 2014 and the Non-executive Director fee pool of $4.5 million per annum was approved by shareholders at the 2008 Annual General Meeting. For 2021, $3.92 million (87%) of the fee pool was used. The fee pool includes employer superannuation contributions.
Base and Committee fees Annual fee $
Chairman 890,000
Other Non-executive Directors 225,000
Committee Chairman fees
Board Audit Committee 70,400
Board Risk Committee 90,000
Board Remuneration Committee 63,800
Board Technology Committee 35,200
Board Legal, Regulatory & Compliance Committee 67,500
Committee membership fees
Board Audit Committee 32,000
Board Risk Committee 32,000
Board Remuneration Committee 29,000
Board Technology Committee 20,000
Board Legal, Regulatory & Compliance Committee 30,000
Subsidiary Board and Advisory Board feesDuring the reporting period, there were no additional fees paid to Non-executive Directors.
6.3. Non-executive Director minimum shareholding requirementNon-executive Directors are required to build and maintain a holding in Westpac ordinary shares to align their interests with those of shareholders. Each Non-executive Director is required to hold an interest in shares in Westpac with a value not less than the Board base fee, within five years of appointment to the Board.
At 30 September 2021, all Non-executive Directors comply with the requirement.

65WESTPAC GROUP 2021 ANNUAL REPORT3 FIN
AN
CIA
L STATE
ME
NTS
2 GR
OU
P P
ER
FOR
MA
NC
E4
SHA
RE
HO
LDE
R IN
FOR
MA
TION
1 STRA
TEG
IC R
EP
OR
T
Directors’ report
7. Statutory remuneration details
7.1. Details of Non-executive Director remunerationThe table below details Non-executive Director remuneration.
Short-term benefits Post-employment benefits
Westpac Banking Corporation Board
fees1
Subsidiary and Advisory Board
fees
Non- monetary benefits2 Superannuation Total
Name $ $ $ $ $
Current Non-executive Directors
John McFarlane, Chairman
2021 893,423 - 8,355 22,573 924,351
2020 480,054 - 8,335 14,698 503,087
Nerida Caesar
2021 276,058 - - 22,290 298,348
2020 294,454 - - 21,012 315,466
Craig Dunn
2021 322,034 - - 22,311 344,345
2020 323,268 - - 21,079 344,347
Audette Exel AO3
2021 23,438 - - 2,344 25,782
2020 ---------------------------------------- Not a KMP in 2020 ----------------------------------------
Steven Harker
2021 312,419 - - 22,351 334,770
2020 306,349 - - 21,029 327,378
Michael Hawker AM3
2021 242,854 - - 19,692 262,546
2020 ---------------------------------------- Not a KMP in 2020 ----------------------------------------
Chris Lynch
2021 290,111 - - 22,296 312,407
2020 24,454 - - 2,323 26,777
Peter Marriott
2021 398,527 - - 22,346 420,873
2020 376,057 - - 21,190 397,247
Peter Nash
2021 377,525 - - 22,273 399,798
2020 377,085 - - 21,187 398,272
Nora Scheinkestel3
2021 169,400 - - 13,851 183,251
2020 ---------------------------------------- Not a KMP in 2020 ----------------------------------------
Margaret Seale
2021 320,110 - - 22,427 342,537
2020 303,523 - - 21,025 324,548
Former Non-executive Director
Alison Deans3
2021 64,240 - - 4,954 69,194
2020 323,671 - - 10,578 334,249
Total fees
2021 3,690,139 - 8,355 219,708 3,918,202
20204 3,423,165 42,610 15,803 180,454 3,662,032
1. Includes fees paid to the Chairman and members of Board Committees.2. Non-monetary benefits are determined on the basis of the cost to the Group including associated fringe benefits tax (FBT) where
applicable and includes bank funded car parking.3. The information relates to the period the individual was a KMP. Refer to Section 1 for further details.4. Total fees for 2020 shown as reported in the 2020 Annual Report.
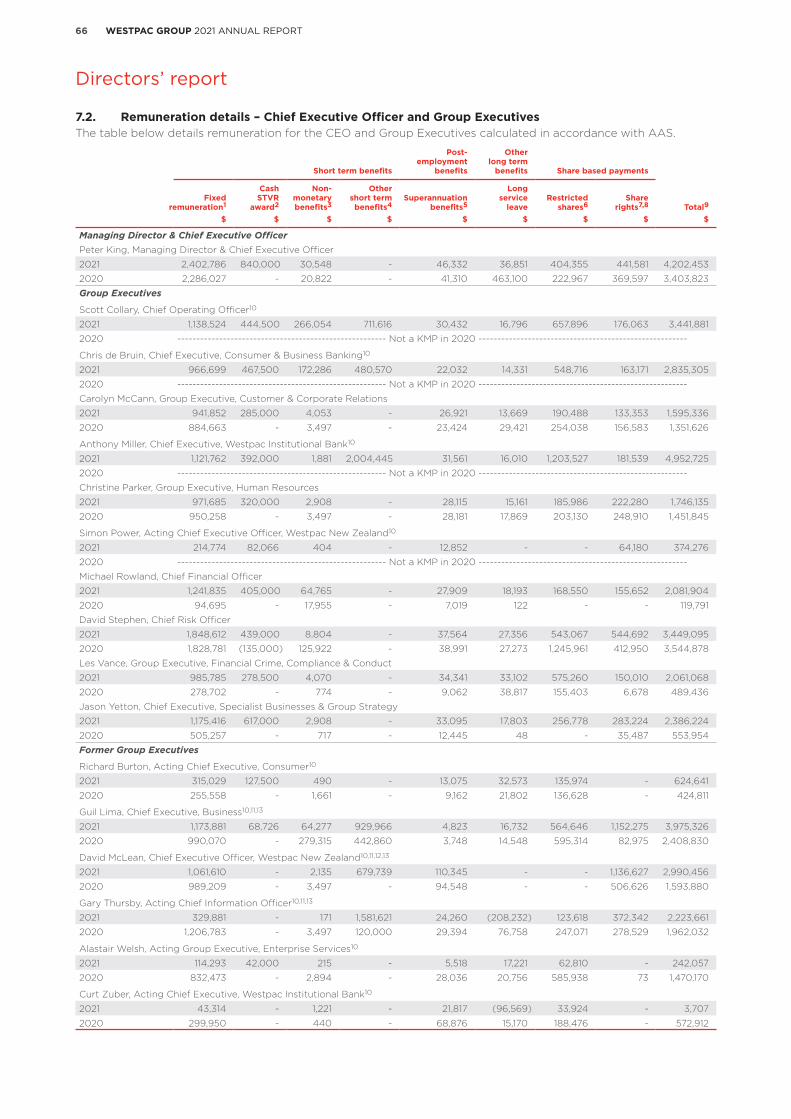
66 WESTPAC GROUP 2021 ANNUAL REPORT
Directors’ report
7.2. Remuneration details – Chief Executive Officer and Group ExecutivesThe table below details remuneration for the CEO and Group Executives calculated in accordance with AAS.
Short term benefits
Post- employment
benefits
Other long term
benefits Share based payments
Fixed remuneration1
Cash STVR
award2
Non- monetary benefits3
Other short term benefits4
Superannuation benefits5
Long service
leaveRestricted
shares6Share
rights7,8 Total9
$ $ $ $ $ $ $ $ $
Managing Director & Chief Executive OfficerPeter King, Managing Director & Chief Executive Officer
2021 2,402,786 840,000 30,548 - 46,332 36,851 404,355 441,581 4,202,453
2020 2,286,027 - 20,822 - 41,310 463,100 222,967 369,597 3,403,823
Group Executives
Scott Collary, Chief Operating Officer10
2021 1,138,524 444,500 266,054 711,616 30,432 16,796 657,896 176,063 3,441,881
2020 ------------------------------------------------------- Not a KMP in 2020 -------------------------------------------------------
Chris de Bruin, Chief Executive, Consumer & Business Banking10
2021 966,699 467,500 172,286 480,570 22,032 14,331 548,716 163,171 2,835,305
2020 ------------------------------------------------------- Not a KMP in 2020 -------------------------------------------------------
Carolyn McCann, Group Executive, Customer & Corporate Relations
2021 941,852 285,000 4,053 - 26,921 13,669 190,488 133,353 1,595,336
2020 884,663 - 3,497 - 23,424 29,421 254,038 156,583 1,351,626
Anthony Miller, Chief Executive, Westpac Institutional Bank10
2021 1,121,762 392,000 1,881 2,004,445 31,561 16,010 1,203,527 181,539 4,952,725
2020 ------------------------------------------------------- Not a KMP in 2020 -------------------------------------------------------
Christine Parker, Group Executive, Human Resources
2021 971,685 320,000 2,908 - 28,115 15,161 185,986 222,280 1,746,135
2020 950,258 - 3,497 - 28,181 17,869 203,130 248,910 1,451,845
Simon Power, Acting Chief Executive Officer, Westpac New Zealand10
2021 214,774 82,066 404 - 12,852 - - 64,180 374,276
2020 ------------------------------------------------------- Not a KMP in 2020 -------------------------------------------------------
Michael Rowland, Chief Financial Officer
2021 1,241,835 405,000 64,765 - 27,909 18,193 168,550 155,652 2,081,904
2020 94,695 - 17,955 - 7,019 122 - - 119,791
David Stephen, Chief Risk Officer
2021 1,848,612 439,000 8,804 - 37,564 27,356 543,067 544,692 3,449,095
2020 1,828,781 (135,000) 125,922 - 38,991 27,273 1,245,961 412,950 3,544,878
Les Vance, Group Executive, Financial Crime, Compliance & Conduct
2021 985,785 278,500 4,070 - 34,341 33,102 575,260 150,010 2,061,068
2020 278,702 - 774 - 9,062 38,817 155,403 6,678 489,436
Jason Yetton, Chief Executive, Specialist Businesses & Group Strategy
2021 1,175,416 617,000 2,908 - 33,095 17,803 256,778 283,224 2,386,224
2020 505,257 - 717 - 12,445 48 - 35,487 553,954
Former Group Executives
Richard Burton, Acting Chief Executive, Consumer10
2021 315,029 127,500 490 - 13,075 32,573 135,974 - 624,641
2020 255,558 - 1,661 - 9,162 21,802 136,628 - 424,811
Guil Lima, Chief Executive, Business10,11,13
2021 1,173,881 68,726 64,277 929,966 4,823 16,732 564,646 1,152,275 3,975,326
2020 990,070 - 279,315 442,860 3,748 14,548 595,314 82,975 2,408,830
David McLean, Chief Executive Officer, Westpac New Zealand10,11,12,13
2021 1,061,610 - 2,135 679,739 110,345 - - 1,136,627 2,990,456
2020 989,209 - 3,497 - 94,548 - - 506,626 1,593,880
Gary Thursby, Acting Chief Information Officer10,11,13
2021 329,881 - 171 1,581,621 24,260 (208,232) 123,618 372,342 2,223,661
2020 1,206,783 - 3,497 120,000 29,394 76,758 247,071 278,529 1,962,032
Alastair Welsh, Acting Group Executive, Enterprise Services10
2021 114,293 42,000 215 - 5,518 17,221 62,810 - 242,057
2020 832,473 - 2,894 - 28,036 20,756 585,938 73 1,470,170
Curt Zuber, Acting Chief Executive, Westpac Institutional Bank10
2021 43,314 - 1,221 - 21,817 (96,569) 33,924 - 3,707
2020 299,950 - 440 - 68,876 15,170 188,476 - 572,912

67WESTPAC GROUP 2021 ANNUAL REPORT3 FIN
AN
CIA
L STATE
ME
NTS
2 GR
OU
P P
ER
FOR
MA
NC
E4
SHA
RE
HO
LDE
R IN
FOR
MA
TION
1 STRA
TEG
IC R
EP
OR
T
Directors’ report
1. Fixed remuneration is the total cost of salary, salary sacrificed benefits (including motor vehicles, parking and associated FBT where applicable) and an accrual for annual leave entitlements.
2. The cash STVR award is typically paid in December following the end of the financial year.3. Non-monetary benefits are determined on the basis of the cost to the Group (including associated FBT, where applicable) and include
annual health checks, provision of taxation advice, bank funded car parking, relocation costs, living away from home expenses and allowances. The approach to recognising cash relocation allowances in 2021 has been amended to recognise the expense from the commencement date as a KMP to the end of a clawback period. 2020 values for relevant individuals have been restated for alignment given cash relocation allowances were previously recognised evenly over two years.
4. Includes payments on cessation of employment or other contracted amounts. The approach to recognising the cash portion of buyout arrangements has been amended to recognise the expense from commencement date as a KMP to the end of a clawback period. 2020 values for relevant individuals have been restated for alignment given cash portions of buyouts were previously recognised in full in the year in which they were paid.
5. The CEO and Group Executives are provided with life insurance cover under the Westpac Group Plan at no cost. Superannuation benefits have been calculated consistent with AASB 119 Employee Benefits.
6. The amortisation approach for restricted shares has been amended to include the service period when the award was earned. This typically results in amortisation over an additional year. In prior years, the amortisation approach only used the vesting period. This means the 2021 amortisation value now includes a portion of the 2021 STVR outcome. In prior years, the current year STVR outcome was not included in the current reporting period. The 2020 values have been restated to align with the current year presentation. The 2020 values for Peter King and Les Vance reflect amortisation from prior year awards while in previous roles with lower total target remuneration. The restricted shares held by Scott Collary, Chris de Bruin, Anthony Miller, Guil Lima and a portion of shares held by David Stephen represent an allocation made to compensate them for remuneration foregone from their previous employer on resignation to join Westpac. The restricted shares replicate the vesting periods of the equity foregone.
7. Equity-settled remuneration is based on the amortisation over the performance and vesting period (normally two to four years). It is calculated using the fair value at the grant date of hurdled and unhurdled share rights granted during the four years ending 30 September 2021. The methodology applied to calculate fair value at grant date has been updated with a consistent external valuation using the invitation opt out date. The 2020 values have been restated to align with the current year presentation. Details of prior year grants are disclosed in previous Annual Reports. The 2021 value for David McLean includes 5% attributed to deferred STVR awards. The 2021 value for Simon Power includes 31% attributed to deferred STVR awards. The 2020 comparison has been restated to include the allocation for Peter King awarded following approval at the 2020 Annual General Meeting.
8. The expensed value of the 2019 LTVR cash ROE hurdled performance share rights has been reduced to zero. This reflects the current assessment of the probability of vesting.
9. The percentage of total remuneration which is performance related (i.e. cash STVR awards plus share-based payments) was: Peter King 40%, Scott Collary 37%, Chris De Bruin 42%, Carolyn McCann 38%, Anthony Miller 36%, Christine Parker 42%, Simon Power 39%, Michael Rowland 35%, David Stephen 44%, Les Vance 49%, Jason Yetton 48%, Richard Burton 42%, Guil Lima 45%, David McLean 38%, Gary Thursby 22%, Alastair Welsh 43%, Curt Zuber n/a. The percentage of total remuneration delivered in the form of options or share rights was: Peter King 11%, Scott Collary 5%, Chris De Bruin 6%, Carolyn McCann 8%, Anthony Miller 4%, Christine Parker 13%, Simon Power 17%, Michael Rowland 7%, David Stephen 16%, Les Vance 7%, Jason Yetton 12%, Richard Burton n/a, Guil Lima 29%, David McLean 38%, Gary Thursby 17%, Alastair Welsh n/a, Curt Zuber n/a.
10. The information relates to the period the individual was a KMP. Refer to Section 1 for further details. 11. Fixed remuneration for Guil Lima, David McLean and Gary Thursby includes payments made or to be made during their notice period
where, in line with contractual requirements, they continue to receive cash salary and superannuation. 12. From 26 June 2021 to 31 July 2021, David acted as an advisor to the Group and received fixed remuneration of $97,249 (including
superannuation), which has been excluded from the table on the basis that it does not relate to his KMP role.13. The share based payment values for Guil Lima, David McLean and Gary Thursby reflect the accruals for unvested equity up to the end
of each performance period. While the full value is being accrued for all unvested equity, the awards may or may not vest subject to the relevant performance hurdles.

68 WESTPAC GROUP 2021 ANNUAL REPORT
Directors’ report
7.3. Movement in equity-settled instruments during the yearThe table below shows the movements in the number and value of equity instruments for the CEO and Group Executives under the relevant plan during 2021.
Name Type of equity-based instrumentNumber granted1
Number vested2
Number exercised3
Value granted4
$
Value exercised5
$
Value forfeited or
lapsed5 $
Managing Director and Chief Executive OfficerPeter King Performance share rights 199,525 - - 1,239,724 - 1,567,392
Shares under Restricted Share Plan - 17,048 - - - -
Group Executives
Scott Collary6 Performance share rights 120,614 - - 771,930 - -
Shares under Restricted Share Plan 75,088 - - 1,646,334 - -
Chris de Bruin6 Performance share rights 100,676 - - 874,201 - -
Shares under Restricted Share Plan 61,046 - - 1,468,343 - -
Carolyn McCann Performance share rights 71,929 - - 460,346 - -
Shares under Restricted Share Plan - 18,220 - - - -
Anthony Miller6 Performance share rights 120,492 - - 771,149 - -
Shares under Restricted Share Plan 123,295 - - 2,813,233 - -
Christine Parker Performance share rights 91,345 - - 584,608 - 1,147,969
Shares under Restricted Share Plan - 15,013 - - - -
Simon Power6 Performance share rights - - - - - -
Unhurdled share rights 1,295 - - 27,066 - -
Michael Rowland Performance share rights 99,415 - - 636,256 - -
Shares under Restricted Share Plan - - - - - -
David Stephen Performance share rights 149,671 - - 957,894 - -
Shares under Restricted Share Plan - 42,072 - - - -
Les Vance Performance share rights 76,214 - - 512,794 - -
Shares under Restricted Share Plan 14,985 20,694 - 301,134 - -
Jason Yetton Performance share rights 125,988 - - 805,753 - -
Shares under Restricted Share Plan - - - - - -
Former Group Executives
Richard Burton6 Performance share rights - - - - - -
Shares under Restricted Share Plan 16,508 15,188 - 331,740 - -
Guil Lima6 Performance share rights 121,198 - - 775,667 - -
Shares under Restricted Share Plan - 19,692 - - - -
David McLean6 Performance share rights 106,919 - - 684,282 - 1,227,244
Unhurdled share rights - 20,559 - - - -
Gary Thursby6 Performance share rights - - - - - 1,071,438
Shares under Restricted Share Plan - 14,369 - - - -
Alastair Welsh6 Performance share rights - - - - - -
Shares under Restricted Share Plan - 20,137 - - - -
Curt Zuber6 Performance share rights - - - - - -
Shares under Restricted Share Plan - 39,066 - - - -
1. Performance share rights granted to the CEO were approved by shareholders at the 2020 Annual General Meeting under ASX Listing Rule 10.14. No performance options were granted in 2021. Any deferred STVR awards in the form of restricted shares (or unhurdled share rights for KMP in New Zealand) are awarded in December each year. Shares allocated under the Restricted Share Plan for Scott Collary, Chris de Bruin and Anthony Miller relate to buy out awards. For Scott Collary, the restricted shares were allocated in February 2021 and vest between December 2022 and December 2023. For Chris de Bruin, the restricted shares were allocated in March 2021 and vest between April 2022 and December 2023. For Anthony Miller, the restricted shares were allocated in February and April 2021 and vest between February 2022 and March 2025.
2. No hurdled share rights granted in 2016 vested in October 2020 when assessed against the relative TSR and cash ROE performance hurdles. For David Stephen, 32,581 of the restricted shares that vested were in relation to a buy out award which represents 24% of the total number of shares allocated for that award. For Guil Lima, all of the restricted shares that vested were in relation to a buy out award which represents 43% of the total number of shares allocated for that award.
3. Vested share rights granted after July 2015 may be exercised up to a maximum of 15 years from their commencement date. For each vested share right exercised during the year, the relevant executive received one fully paid Westpac ordinary share. The exercise price for share rights is zero.
4. For performance share rights, the value granted represents the number of securities granted multiplied by the fair value per instrument as set out in the table in the sub-section titled ‘Fair value of LTVR awards made during the year’ below. For restricted shares, the value granted represents the number of ordinary shares granted multiplied by the five day VWAP of a Westpac ordinary share on the date the shares were granted. These values, which represent the full value of the equity-based awards made to the CEO and Group Executives in 2021, do not reconcile with the amount shown in the table in Section 7.2 which shows the amount amortised in the current year of equity awards over the performance year the award was earned and the applicable vesting period. The minimum total value of the grants for future financial years is zero and an estimate of the maximum possible total value in future financial years is the fair value, as shown above.
5. The value of each share right exercised, forfeited or lapsed is calculated based on the five day VWAP of a Westpac ordinary share on the date of exercise (or forfeiture or lapse), less the relevant exercise price (if any). Where the exercise price is greater than the five day VWAP of a Westpac ordinary share, the value has been calculated as zero. The overall values reflect forfeitures or lapses as a result of a failure to meet performance conditions or resignation.
6. The information relates to the period the individual was a KMP. Refer to Section 1 for further details.

69WESTPAC GROUP 2021 ANNUAL REPORT3 FIN
AN
CIA
L STATE
ME
NTS
2 GR
OU
P P
ER
FOR
MA
NC
E4
SHA
RE
HO
LDE
R IN
FOR
MA
TION
1 STRA
TEG
IC R
EP
OR
T
Directors’ report
Fair value of LTVR awards made during the yearIn accordance with AASB 2 Share-based Payment, the table below provides a summary of the fair value of LTVR awards granted to the CEO and Group Executives in December 20201. LTVR awards will only vest if performance hurdles are achieved and service conditions are met in future years.
Plan name Granted toPerformance hurdle Grant date
Commencement date Test date Expiry
Fair value per instrument2
Westpac LTVR Plan
CEO and Group Executives
Relative TSR
17 December 2020
1 October 2020
1 October 2024
1 October 2035
$6.35 for the CEO $6.40 for the Group Executives
The allocation methodology differs from the fair value used for accounting purposes. The allocation is determined by dividing the dollar value of the LTVR award by the face value of performance share rights. The face value is the five day VWAP up to the commencement of the performance period. Refer to Section 4.2 for further detail.
7.4. Details of Westpac equity holdings of Non-executive DirectorsThe table below sets out details of relevant interests in Westpac ordinary shares held by Non-executive Directors (including their related parties) during the year ended 30 September 20213.
Number held at start of the year
Changes during the year
Number held at end of the year
Current Non-executive Directors
John McFarlane 10,000 30,000 40,000
Nerida Caesar 13,583 - 13,583
Craig Dunn 15,009 - 15,009
Audette Exel AO4 n/a - 4,000
Steven Harker 13,170 - 13,170
Michael Hawker AM4 n/a 4,558 20,854
Chris Lynch5 13,090 - 13,090
Peter Marriott6 40,311 - 40,311
Peter Nash 15,260 100 15,360
Nora Scheinkestel4 n/a 112 5,172
Margaret Seale7,8 38,680 (12,522) 26,158
Former Non-executive Director
Alison Deans4 15,632 - n/a
1. LTVR awards were also granted to Chris de Bruin on 8 February 2021 with a fair value of $8.39, Chris de Bruin and Les Vance on 8 April2021 with a fair value of $12.24. These grants have a commencement date of 1 October 2020, a test date of 1 October 2024 and anexpiry date of 1 October 2035. In addition, Peter King and Jason Yetton were also granted LTVR awards on 17 December 2020 with afair value per instrument of $4.15 and $4.19 respectively. The commencement date of these awards is 2 April 2020, the test date is 1 April2024 and the expiry date is 2 April 2035.
2. The fair values of performance share rights granted during the year have been independently calculated at their respective grant datesbased on the requirements of AASB 2 Share-based Payment. The fair value of performance share rights with hurdles based on TSRperformance relative to a group of comparator companies takes into account the average TSR outcome determined using a MonteCarlo simulation pricing model. The grant date used for accounting purposes was 16 December 2020 for the CEO and 11 December2020 for the Group Executives.
3. Other than as disclosed below, no share interests include non-beneficially held shares.4. The information relates to the period the individual was a KMP. Refer to Section 1 for further details.5. In addition to holding ordinary shares, Chris Lynch and his related parties held interests in 1,137 Capital Notes 5 at year end.6. In addition to holding ordinary shares, Peter Marriott and his related parties held interests in 563 Westpac Capital Notes 2 at year end.7. In addition to holding ordinary shares, Margaret Seale and her related parties held interests in 100 Capital Notes 7 at year end.8. The disposal of 12,522 ordinary shares related to the finalisation of an estate.

70 WESTPAC GROUP 2021 ANNUAL REPORT
Directors’ report
7.5. Details of Westpac equity holdings of Executive Key Management PersonnelThe table below details Westpac equity held (and movement in that equity) by the CEO and Group Executives (including their related parties) for the year ended 30 September 20211.
NameType of equity-based
instrument
Number held at start of
the year
Number granted during
the year as remuneration
Received on exercise
and/or exercised
during the year
Number forfeited
or lapsed during the
year2
Other changes
during the year
Number held at end of the
year
Number vested and exercisable
at end of the year
Managing Director & Chief Executive OfficerPeter King Ordinary shares 131,886 - - - - 131,886 -
Performance share rights 346,795 199,525 - (85,690) - 460,630 -
Group Executives
Scott Collary3 Ordinary shares n/a 75,088 - - - 75,088 -
Performance share rights n/a 120,614 - - - 120,614 -
Chris de Bruin3 Ordinary shares n/a 61,046 - - - 61,046 -
Performance share rights n/a 100,676 - - - 100,676 -
Carolyn McCann Ordinary shares 67,175 - - - - 67,175 -
Performance share rights 102,207 71,929 - - - 174,136 -
Anthony Miller3 Ordinary shares n/a 123,295 - - 123,295 -
Performance share rights n/a 120,492 - - - 120,492 -
Christine Parker Ordinary shares 32,457 - - - (3,000) 29,457 -
Performance share rights 252,231 91,345 - (62,760) - 280,816 -
Simon Power3 Ordinary shares n/a - - - - 236 -
Unhurdled share rights n/a 1,295 - - - 38,122 -
Michael Rowland Ordinary shares - - - - - - -
Performance share rights - 99,415 - - - 99,415 -
David Stephen Ordinary shares 154,910 - - - - 154,910 -
Performance share rights 364,381 149,671 - - - 514,052 -
Les Vance Ordinary shares 78,767 14,985 - - (12,000) 81,752 -
Performance share rights 22,227 76,214 - - - 98,441 -
Jason Yetton Ordinary shares - - - - - - -
Performance share rights 54,213 125,988 - - - 180,201 -
Former Group Executives
Richard Burton3 Ordinary shares 71,749 16,508 - - - n/a n/a
Performance share rights - - - - - n/a n/a
Guil Lima3 Ordinary shares 46,085 - - - - n/a n/a
Performance share rights 57,819 121,198 - - - n/a n/a
David McLean3 Ordinary shares 9,613 - - - - n/a n/a
Performance share rights 284,473 106,919 - (67,094) - n/a n/a
Unhurdled share rights 98,115 - - - - n/a n/a
Gary Thursby3 Ordinary shares 128,573 - - - - n/a n/a
Performance share rights 250,336 - - (58,576) - n/a n/a
Alastair Welsh3 Ordinary shares 73,200 - - - - n/a n/a
Performance share rights - - - - - n/a n/a
Curt Zuber3 Ordinary shares 202,934 - - - - n/a n/a
Performance share rights - - - - - n/a n/a
1. The highest number of shares held by an individual in the table is 0.0055% of total Westpac ordinary shares outstanding as at 30 September 2021.
2. Forfeitures or lapses during the year are as a result of a failure to meet performance conditions or resignation.3. The information relates to the period the individual was a KMP. Refer to Section 1 for further details.

71WESTPAC GROUP 2021 ANNUAL REPORT3 FIN
AN
CIA
L STATE
ME
NTS
2 GR
OU
P P
ER
FOR
MA
NC
E4
SHA
RE
HO
LDE
R IN
FOR
MA
TION
1 STRA
TEG
IC R
EP
OR
T
Directors’ report
7.6. Loans to Non-executive Directors and Executive Key Management Personnel disclosuresFinancial instrument transactions that occurred during the financial year between Non-executive Directors, the CEO or Group Executives and the Group are in the ordinary course of business on terms and conditions (including interest and collateral) as they apply to other employees and certain customers. These transactions are provided at arms-length and at normal commercial rates and consist principally of normal personal banking and financial investment services.
The table below details loans to Non-executive Directors, the CEO and Group Executives (including their related parties) of the Group.
Balance at start of the year
$
Interest paid and payable for the year
$
Interest not charged during the year
$
Balance at end of the year
$Number in Group at
end of the year
Non-executive Directors 350,184 92,490 - 9,894,987 4
CEO and Group Executives 14,561,628 311,403 - 19,029,937 8
Total 14,911,812 403,893 - 28,924,924 12
The table below details KMP (including their related parties) with loans above $100,000 during 2021.
Balance at start of the year
$
Interest paid and payable for the year
$
Interest not charged during the year
$
Balance at end of the year
$
Highest indebtedness during the year
$
Non-executive Directors
Steven Harker - 39,871 - 4,999,400 7,004,409
Chris Lynch - 26,996 - 3,931,965 6,000,000
Peter Nash 350,184 13,397 - 367,702 462,880
Margaret Seale - 12,226 - 595,920 1,720,795
CEO and Group Executives
Peter King - 10,547 - 1,158,000 1,162,094
Scott Collary1 n/a 35,553 - 2,465,126 2,505,053
Carolyn McCann 261,373 11,698 - 605,601 672,898
Anthony Miller1 n/a 21,120 - 2,637,914 2,803,258
Christine Parker 5,535,827 124,127 - 5,505,875 5,556,015
Simon Power1 n/a 9,736 - 1,162,611 1,162,611
Les Vance 2,531,885 53,506 - 2,644,810 2,765,595
Jason Yetton - 21,702 - 2,850,000 3,007,289
Former Group Executives
David McLean1 681,206 19,890 - n/a 1,457,242
Alastair Welsh1 651,337 3,524 - n/a 699,789
Curt Zuber1 4,900,000 - - n/a 4,900,000
1. The information relates to the period the individual was a KMP. Refer to Section 1 for further details.

72 WESTPAC GROUP 2021 ANNUAL REPORT
Directors’ report
Directors’ report
11. Auditor
a) Auditor’s independence declaration
A copy of the auditor’s independence declaration as required under section 307C of the Corporations Act is below:
PricewaterhouseCoopers, ABN 52 780 433 757 One International Towers Sydney, Watermans Quay, Barangaroo, GPO BOX 2650, SYDNEY NSW 2001 T: +61 2 8266 0000, F: +61 2 8266 9999, www.pwc.com.au
Liability limited by a scheme approved under Professional Standards Legislation.

73WESTPAC GROUP 2021 ANNUAL REPORT3 FIN
AN
CIA
L STATE
ME
NTS
2 GR
OU
P P
ER
FOR
MA
NC
E4
SHA
RE
HO
LDE
R IN
FOR
MA
TION
1 STRA
TEG
IC R
EP
OR
T
Directors’ report
b) Non-audit services
We may decide to engage PwC on assignments additional to their statutory audit duties where their expertise or experience with Westpac or a controlled entity is important.
Details of the non-audit service amounts paid or payable to PwC for non-audit services provided during the 2020 and 2021 financial years are set out in Note 34 to the financial statements.
PwC also provides audit and non-audit services to non-consolidated entities, non-consolidated trusts of which a Westpac Group entity is trustee, manager or responsible entity and non-consolidated superannuation funds or pension funds. The fees in respect of these services were approximately $9.6 million in total (2020: $6.1 million). PwC may also provide audit and non-audit services to other entities in which Westpac holds a minority interest and which are not consolidated. Westpac is not aware of the amount of any fees paid to PwC by those entities.
Westpac has a policy on engaging PwC, details of which are set out in its Corporate Governance Statement in the section ‘‘Engagement of the external auditor’.
The Board has considered the position and, in accordance with the advice received from the Board Audit Committee, is satisfied that the provision of the non-audit services during 2021 by PwC is compatible with the general standard of independence for auditors imposed by the Corporations Act. The Directors are satisfied, in accordance with advice received from the Board Audit Committee, that the provision of non-audit services by PwC, as set out above, did not compromise the auditor independence requirements of the Corporations Act for the following reasons:
• all non-audit services provided by PwC for the year have been reviewed by the Board Audit Committee, whichis of the view that they do not impact the impartiality and objectivity of PwC; and
• based on Board quarterly independence declarations made by PwC to the Board Audit Committee duringthe year, none of the services undermine the general principles relating to auditor independence includingreviewing or auditing PwC’s own work, acting in a management or a decision-making capacity for thecompany, acting as advocate for the company or jointly sharing economic risk and rewards.
12. Responsibility statement
The Directors of Westpac Banking Corporation confirm that to the best of their knowledge:
• the consolidated financial statements for the financial year ended 30 September 2021, which have beenprepared in accordance with the accounting policies described in Note 1 to the consolidated financialstatements, being in accordance with Australian Accounting Standards (AAS), give a true and fair view of theassets, liabilities, financial position and profit of the Group; and
• the Annual Report from the section entitled ‘About Westpac’ to and including the section entitled ‘OtherWestpac business information’ includes a fair review of the information required by the Disclosure Guidanceand Transparency Rules 4.1.8R to 4.1.11R of the United Kingdom Financial Conduct Authority, together with adescription of the principal risks and uncertainties faced by the Group.
Signed in accordance with a resolution of the Board.
John McFarlane Peter King
Chairman Managing Director & Chief Executive Officer
31 October 2021 31 October 2021

74 WESTPAC GROUP 2021 ANNUAL REPORT
Information on Westpac
Significant developments
COVID-19 impacts
The continued social and economic effects of COVID-19 over this year have been impacted by the emergence and spread of new variants, the rollout of vaccines, and the evolution of local and global responses, including lockdowns and social restrictions, and prudential, industry and economic measures taken by governments and regulators world-wide.
Westpac has continued to support customers impacted by the COVID-19 pandemic, including via repayment deferrals, fee waivers, special interest rates and special loans, although the current levels of support are down on the 2020 peaks.
Further information on the impacts of COVID-19 is set out in the ‘Strategic review’ and ‘Risk factors’ sections.
Westpac significant developments - Australia
Off-market buy-back
Westpac has announced an off-market buy-back of up to $3.5 billion worth of Westpac shares. Westpac’s operating performance and progress on our strategic priorities, including the completion of a number of divestments, have contributed to a strong capital position, allowing us to return capital to shareholders.
Exit of specialist businesses
Following a strategic review of the specialist businesses in 2020, Westpac determined it would look to exit these businesses over time. During 2021, the following transactions have been announced and/or completed.
Completed transactions:
• Sale of Westpac General Insurance Limited and Westpac General Insurance Services Limited to Allianz;
• Sale of Westpac’s Vendor Finance business to Angle Finance; and
• Sale of Westpac Lenders Mortgage Insurance Limited to Arch Capital Group.
Announced transactions that have not yet completed:
• Sale of Westpac’s motor vehicle dealer finance and novated leasing businesses to Angle Finance;
• Sale of Westpac Life-NZ-Limited to Fidelity Life Assurance Company Limited; and
• Sale of Westpac Life Insurance Services Limited to TAL Dai-ichi Life Australia Pty Limited.
Approvals may be required from shareholders, regulators or other stakeholders in order to divest businesses and assets, and there is a risk that these approvals may not be received or that the purchaser does not complete these transactions for other reasons. In addition, some of these transactions have involved the giving of warranties and indemnities in favour of the buyer for certain pre-completion matters. Further information is set out in the ‘Risk factors’ section and Note 26.
In December 2020, Westpac announced the proposed sale of its Pacific businesses (comprised of Westpac Fiji and the Group’s 89.9% stake in Westpac Bank PNG
Limited) to Kina Securities Limited (Kina). Following the decision by Papua New Guinea’s Independent Consumer and Competition Commission to deny authorisation for the proposed acquisition, on 22 September 2021 Westpac announced the parties had agreed to terminate the sale agreements.
Westpac will continue to operate the Pacific businesses and support its customers while assessing other options.
Further detail in relation to these transactions and in relation to the terminated sale of Westpac’s Pacific businesses is available in Note 37 to the financial statements.
Westpac significant developments - New Zealand
WNZL leadership changes
On 24 September 2021, Westpac announced the appointment of Catherine McGrath as CEO of Westpac New Zealand Ltd (WNZL) subject to regulatory approvals, following the retirement of David McLean. Simon Power has been acting CEO since the end of June 2021 and will continue to do so until Catherine commences as CEO on 15 November 2021.
On 1 October 2021, Pip Greenwood was appointed Chair of the Board of WNZL following the retirement of Jan Dawson CNZM.
Reviews required under section 95 of the Reserve Bank of New Zealand Act 1989
On 23 March 2021, the RBNZ issued two notices to WNZL under section 95 of the Reserve Bank of New Zealand Act 1989 requiring WNZL to supply two external reviews to the RBNZ. The reviews are required to address prudential concerns raised by the RBNZ around WNZL’s risk governance practices and policies following various compliance issues reported over recent years. Those issues include non-compliance with the RBNZ’s liquidity, capital adequacy and outsourcing requirements and IT outages.
The first review (Liquidity Review), being undertaken by Deloitte Touche Tohmatsu, relates to the effectiveness of WNZL’s actions to improve liquidity risk management and the associated risk culture, following previously identified breaches of the RBNZ’s Liquidity Policy (BS13) and non-compliance identified through the RBNZ’s liquidity thematic review. The second review (Board Governance Review), being undertaken by Oliver Wyman Limited, requires an assessment of the effectiveness of WNZL’s risk governance, with a focus on the role played by the Board.
Separate to the section 95 reviews, WNZL has also committed to the RBNZ and FMA to address its technology issues, and to engage Deloitte to monitor progress. While work has been underway to address these areas for some time, more work is required to meet WNZL’s expectations and those of the regulator.
In addition, WNZL has identified various weaknesses in its risk management, for example control gaps in its compliance environment as well as shortcomings in its risk governance practices. WNZL is taking steps
Information on Westpac

3 FINA
NC
IAL STA
TEM
EN
TS2 G
RO
UP
PE
RFO
RM
AN
CE
75WESTPAC GROUP 2021 ANNUAL REPORT4
SHA
RE
HO
LDE
R IN
FOR
MA
TION
1 STRA
TEG
IC R
EP
OR
T
Information on Westpac
to address these matters and further issues requiring attention may be identified.
From 31 March 2021, the RBNZ amended WNZL’s conditions of registration, requiring WNZL to discount the value of its liquid assets by approximately 14% which at 30 September 2021 was NZ$2.5 billion. This overlay will apply until the RBNZ is satisfied that:
• the RBNZ’s concerns regarding liquidity risk controls have been resolved; and
• sufficient progress has been made to address risk culture issues in WNZL’s Treasury and Market and Liquidity Risk functions.
The Liquidity Review and Board Governance Review only apply to WNZL and not to Westpac in Australia or its New Zealand branch.
RBNZ capital review
On 5 December 2019, the RBNZ announced changes to the capital adequacy framework in New Zealand. The new framework includes the following components:
• Increasing total capital requirements from 10.5% of risk weighted assets (RWA) to 18% for systemically important banks (including WNZL) and 16% for all other banks;
• Setting a Tier 1 capital requirement of 16% of RWA for systemically important banks (including WNZL) and 14% for all other banks;
• Additional Tier 1 capital (AT1) can comprise no more than 2.5% of the 16% Tier 1 capital requirement;
• Eligible Tier 1 capital will comprise common equity and redeemable perpetual preference shares. Existing AT1 instruments will be phased out over a seven-year period;
• Maintaining the existing Tier 2 capital requirement of 2% of RWA; and
• Recalibrating RWA for internal rating based banks, such as WNZL, such that aggregate RWA will increase to 90% of standardised RWA.
Given current market conditions, the RBNZ delayed the start date of increases in capital until 1 July 2022, but the new definitions of eligible capital came into effect on 1 October 2021. Banks will be given up to seven years to comply with the new requirements.
The new processes for issuing Tier 2 instruments in the RBNZ’s final Banking Prudential Requirements documents apply from 1 July 2021. Several further changes to WNZL’s Conditions of Registration apply from 1 October 2021.
RBNZ review of overseas bank branches
On 20 October 2021, the RBNZ announced it is reviewing its policy for branches of overseas banks (including Westpac Banking Corporation’s New Zealand branch). The RBNZ has indicated the objective of the review is to create a simple, coherent and transparent policy framework for branches of overseas banks. The RBNZ has issued its first consultation paper on the review, and has indicated it intends to publish a second consultation paper in mid-2022, setting out its proposed approach.
Review of New Zealand business
Following a review of the Westpac New Zealand business this year, Westpac determined that a demerger was not in the best interests of shareholders and that it would retain its 100 per cent ownership of that business.
The review identified opportunities to improve service for customers and value across the Westpac New Zealand business which will be progressed with the WNZL Board and management team.
Regulatory and risk developments
Enforceable undertaking on risk governance remediation, Integrated Plan and CORE program
On 1 December 2020, APRA announced the findings from its risk governance review into Westpac, including that Westpac has an immature and reactive risk culture, unclear accountabilities, capability shortfalls and inadequate oversight relating to the management of risk. On 3 December 2020 Westpac confirmed it had entered into an enforceable undertaking with APRA in relation to Westpac’s risk governance remediation (EU). The key terms of the EU include:
• Integrated Plan: Developing a plan which outlines all major risk governance remediation activities in relation to both financial and non-financial risk, sets a clear timeline for implementation, and specifies accountability for delivery. APRA has approved Westpac’s Integrated Plan. Westpac’s Customer Outcomes and Risk Excellence (CORE) Program is delivering the Integrated Plan and supporting the strengthening of Westpac’s risk governance, accountability, and culture. Further information in relation to progress of the CORE program is set out in the ‘Strategic review’ section.
• Governance and independent oversight: Providing sufficient funding and resources to implement the Integrated Plan and establishing appropriate governance arrangements. Independent assurance over implementation of the Integrated Plan is also required. Promontory Australia has been appointed as the Independent Reviewer.
• Regular reporting: The Independent Reviewer is to provide regular updates to APRA on Westpac’s compliance with the EU and the Integrated Plan. Westpac is also required to provide regular progress reports to APRA. Promontory Australia has provided three reports to APRA so far.
• Clarity on accountability: Incorporating accountability for the delivery of the Integrated Plan into relevant Banking Executive Accountability Regime statements and remuneration scorecards, which has occurred.
Risk management
Westpac is continuing to upgrade its end-to-end management of risk. A range of significant shortcomings and areas for improvement in Westpac’s risk governance have been highlighted in recent reviews, including embedding of its risk management framework, policies and systems, regulatory reporting, data quality and management, product governance and its risk capabilities. The Group has a number of risks currently considered outside of risk appetite or that do not meet the expectations of regulators.

76 WESTPAC GROUP 2021 ANNUAL REPORT
Information on Westpac
The CORE program, discussed above, is designed to deliver improvements in many of these areas, including embedding a more proactive risk culture, embedding the three lines of defence model to establish clearer risk management accountabilities, improving the control environment, and improving risk awareness, capability and capacity through organisation-wide training and additional risk resources in the business.
Other areas of improvement are being addressed through significant investment in risk management expertise in areas such as operational risk, compliance, financial crime, stress testing, modelling, regulatory reporting and data quality and management.
Further information about risk management is set out in the ‘Risk and risk management’ section.
APRA action against Westpac for breaches of liquidity requirements
On 1 December 2020, APRA announced it was taking action for breaches by Westpac of APRA’s prudential standards on liquidity . A program of work is underway to address APRA’s requirements, including the commencement of APRA mandated reviews and remediation of shortcomings identified as part of these reviews. From 1 January 2021, APRA has required the Group to increase the value of its net cash outflows by 10% for the purpose of calculating liquidity coverage ratio (LCR). The impact of this overlay on the Group LCR as at 30 September 2021 was 13 percentage points. This overlay will be in place until the shortcomings have been rectified.
APRA phasing out reliance on Committed Liquidity Facility
On 10 September 2021, APRA announced it expects ADIs to reduce their Committed Liquidity Facility (CLF) usage to zero by 31 December 2022, and that no ADI should rely on the CLF to meet its minimum 100% LCR requirement from the beginning of 2022. Westpac’s current CLF allocation is $37 billion. Westpac expects to reduce its allocation in line with APRA’s announcement, and to meet its liquidity requirements by increasing its holdings of High Quality Liquid Assets. This is also expected to increase the capital required for Interest Rate Risk in the Banking Book to be held by the Group.
Financial crime
Westpac has continued to improve its financial crime risk management program. This involves a significant multi-year program of work to improve financial crime risk management (including AML/CTF, Sanctions, Anti-Bribery and Corruption, Foreign Account Tax Compliance Act (FATCA) and Common Reporting Standards (CRS)).
Through this work, Westpac is undertaking activities to remediate and improve controls in multiple areas including initial, enhanced and ongoing customer due diligence and associated record keeping, upgrading customer and payment screening and transaction monitoring solutions, establishing data reconciliations and checks to ensure the completeness of data feeding into its financial crime systems, and improving regulatory reporting including in relation to IFTIs,
Threshold Transaction Reports and Suspicious Matter Reports (including ‘tipping off’ controls).
With increased focus on financial crime, further issues requiring attention may be identified.
Details about the consequences of failing to comply with financial crime obligations are set out in the ‘Risk factors’ section.
Life insurance premium review
On 12 October 2021, Westpac noted it was reviewing premium increases on certain life insurance products issued by Westpac Life Insurance Services Limited. The review is ongoing and relates to life insurance products sold under Product Disclosure Statements issued in the years 2010 to 2017. See Note 26 for further information.
APRA capital requirements
Operational risk capital overlays
The following additional capital overlays are currently applied by APRA to Westpac’s operational risk capital requirement:
• $500 million in response to Westpac’s Culture, Governance and Accountability self-assessment. The overlay has applied from 30 September 2019.
• $500 million in response to the magnitude and nature of issues that were the subject of the AUSTRAC proceedings. The overlay has applied from 31 December 2019.
Both overlays have been applied through an increase in RWA. The impact on Westpac’s Level 2 common equity Tier 1 (CET1) capital ratio at 30 September 2021 was a reduction of 36 basis points.
APRA announcements affecting capital
As part of its response to the current environment, APRA made the following announcements on capital:
• Regulatory support for banks offering temporary financial assistance to borrowers impacted by COVID-19, which allowed for payment deferrals up to three months before 30 September 2021;
• On 15 December 2020, APRA issued revised capital management guidance to all ADIs and insurers that from 1 January 2021, APRA will no longer hold ADIs to a minimum level of earnings retention (previously 50% of net profit after tax in 2020). However, APRA has stated it expects banks to moderate dividend payout ratios, consider the use of dividend reinvestment plans and/or other capital management initiatives to offset the impact from dividends and conduct regular stress testing;
• Deferral of APRA’s implementation of the Basel III capital reforms by a year to January 2023; and
• Deferral of changes to APS 222 Associations with Related Entities by a year to 1 January 2022.
APRA is proposing changes to embed the ‘unquestionably strong’ level of capital in the capital framework, including implementation of Basel III reforms. On 21 July 2021 APRA released further guidance on capital buffers and the calculation of RWA including for specific asset classes. As part of the proposal, APRA intends to increase the capital

3 FINA
NC
IAL STA
TEM
EN
TS2 G
RO
UP
PE
RFO
RM
AN
CE
77WESTPAC GROUP 2021 ANNUAL REPORT4
SHA
RE
HO
LDE
R IN
FOR
MA
TION
1 STRA
TEG
IC R
EP
OR
T
Information on Westpac
conservation buffer from 2.5% to 4.0% and introduce a base level for the countercyclical capital buffer of 1.0%. As a result, the CET1 capital ratio requirement for D-SIBS is proposed to increase from 8% to 10.5% from 1 January 2023. We expect further clarity on the changes ahead of 1 January 2023.
As referenced above, on 10 September 2021 APRA announced it expects ADIs to reduce their CLF usage to zero over the 2022 calendar year. This will result in the Group increasing its holdings of High Quality Liquid Assets.
APRA’s proposed revisions to subsidiary capital investment treatment
On 5 August 2021 APRA released the final revised standard for APS 111 Capital Adequacy: Measurement of Capital which is effective from 1 January 2022. The final standard includes changes to the parent ADI’s (Level 1) treatment of equity investments in banking and insurance subsidiaries including:
• equity investments in subsidiaries (including any Additional Tier 1 and Tier 2 capital investments in subsidiaries) will be risk weighted at 250%, up to a limit of 10% of Level 1 CET1 capital per investment; and
• any equity investments in excess of the 10% limit will be fully deducted from Level 1 CET1 capital in determining Level 1 capital ratios.
The impact to the Group’s Level 1 ratio on a pro-forma basis at 30 September 2021 is an approximate reduction of 18 basis points. There is no impact from this proposal on the calculation of the Group’s reported regulatory capital ratios on a Level 2 basis.
Additional loss absorbing capacity
On 9 July 2019, APRA announced a requirement for the Australian major banks (including Westpac) to increase their total capital requirements by three percentage points of RWA as measured under the current capital adequacy framework. This increase in total capital will take full effect from 1 January 2024.
The additional capital is expected to be raised through Tier 2 Capital and is likely to be offset by a decrease in other forms of long-term wholesale funding. Westpac is continuing to make progress towards the new requirements. As at 30 September 2021, Westpac’s Tier 2 ratio was 4.21%. This compares to a target minimum Tier 2 Capital Ratio requirement of 5.0%.
APRA is still targeting an additional four to five percentage points of loss-absorbing capacity. APRA has stated that it will, over the next three years, consider feasible alternative methods for raising the remaining 1-2 percentage points.
General regulatory changes affecting our businesses
Cyber resilience
APRA, ASIC, and the Australian government have intensified their focus on cyber resilience, given the increasing number of cyber-related incidents. APRA is seeking to ensure that regulated entities improve their cyber resilience practices and has been focussing on the effective implementation of its Prudential Standard
CPS 234 on Information Security. Westpac continues to enhance its systems and processes to mitigate cybersecurity risks, including in relation to third parties.
APRA prudential standard CPS 511: remuneration
On 27 August 2021, APRA released its final revised Prudential Standard CPS 511 Remuneration. The new standard has an effective date of 1 January 2023 for significant financial institutions that are authorised deposit-taking institutions (which includes Westpac). The objective of the Standard is to ensure that APRA-regulated entities maintain remuneration arrangements which appropriately incentivise individuals to prudently manage the risks they are responsible for, and that there are appropriate consequences for poor risk outcomes. Westpac is reviewing its remuneration arrangements in line with the new requirements.
Proposed changes to lending laws and regulatory requirements
In October 2021 APRA released a letter to ADIs regarding strengthening residential mortgage lending assessments and increased the minimum interest rate buffer that it expects ADI’s to use when assessing home loan serviceability, to at least 3.0 percentage points above the loan product rate. The letter also outlines APRA’s intention to keep the level of the buffer under review and to review risk appetites for lending at high debt-to-income ratios. It also indicated it expects to release an Information Paper outlining its framework for macroprudential policy by the end of this year.
On 25 September 2020, the government announced a proposed simplification of Australia’s consumer credit regulatory regime. The proposed legislation has not yet passed the Senate, and if it does, we will make changes as appropriate.
In addition to responsible lending, consumer credit is subject to regulatory oversight through a range of mechanisms, including APRA standards and guidance on credit assessments by ADIs. Accordingly, without changes to these regulatory requirements, removal of responsible lending obligations (if this occurs) may not have a significant impact on our overall consumer credit processes.
Focus on superannuation
On 1 July 2021, the ‘Your Future, Your Super’ reforms came into effect. The key reforms involve:
• linking a person to their superannuation fund throughout their working life (unless a person chooses otherwise) to reduce people having unintended multiple superannuation accounts;
• requiring APRA to conduct an annual, objective test for MySuper products from 1 July 2021 (and for other prescribed products from 1 July 2022). Trustees that fail the test will have to notify members of the underperformance. Where a product has failed the performance test in two consecutive years, the trustee is prohibited from accepting new beneficiaries into that product. An online ATO ‘YourSuper’ comparison tool was also introduced to enable members to compare the annual performance test outcomes of all MySuper products; and

78 WESTPAC GROUP 2021 ANNUAL REPORT
Information on Westpac
Fraud
Westpac’s proceedings against Forum Finance Pty Ltd
On 28 June 2021 Westpac commenced proceedings in the Federal Court of Australia against Forum Finance Pty Ltd (Forum Finance) and has since amended its claim to join WNZL and add more respondents. This followed the discovery of a significant fraud relating to a portfolio of equipment leases with Westpac customers, arranged by Forum Finance, which were referred to Westpac’s Institutional Bank. The NSW Police, ASIC and APRA have been notified. It appears no Westpac customer has suffered a financial loss. Westpac has obtained asset freezing and search orders to preserve available assets and relevant information and has supported the appointment of external administrators to companies associated with directors of Forum Finance. Westpac is also investigating how this occurred.
Completed matters
During 2021, a number of litigation matters have been finalised, including:
ASIC’s outbound scaled advice division proceedings
On 22 December 2016, ASIC commenced Federal Court proceedings against BT Funds Management Limited (BTFM) and Westpac Securities Administration Limited (WSAL) in relation to a number of superannuation account consolidation campaigns conducted between 2013 and 2016. On 23 August 2021, the Federal Court of Australia imposed civil penalties totalling $10.5 million against BTFM ($3 million) and WSAL ($7.5 million) in relation to findings that those entities had provided personal advice in calls to 14 customers in contravention of the Corporations Act 2001 (Cth).
ASIC’s proceedings against BT Funds Management and Asgard Capital Management
On 20 August 2020, ASIC commenced proceedings in the Federal Court of Australia against BTFM and Asgard Capital Management Limited (ACML), in relation to allegations concerning the inadvertent charging of financial advisor fees to 404 clients totalling $130,006 after a request had been made to remove the financial advisor from the customers’ accounts. On 23 July 2021, the Federal Court imposed civil penalties totalling $3 million against BTFM ($1.5 million) and ACML ($1.5 million).
Class action against Westpac Banking Corporation and Westpac Life Insurance Services Limited
On 12 October 2017, a class action was filed in the Federal Court of Australia on behalf of customers who, since February 2011, obtained insurance issued by Westpac Life Insurance Services Limited on the recommendation of financial advisers employed within the Westpac Group. On 9 August 2021, the Federal Court approved the settlement of this matter, pursuant to which Westpac will pay up to $30 million to settle the claims made in the class action without any admission of liability.
• the trustee’s duty to act in the best interests of beneficiaries becoming an obligation to perform their duties and exercise their powers in the best financial interests of the beneficiaries, and reversing the burden of proof for the best financial interests duty, so the trustee has the onus of demonstrating they have met this obligation.
Two BT MySuper products (AESA MySuper and BT Super MySuper) failed the annual MySuper performance test for the year ended 30 June 2021 and the BT trustee has notified relevant members of this outcome. The annual performance assessment is based on a combined seven-year performance of the products. If those BT products also fail the next annual performance test, the BT trustee will be precluded from accepting new My Super members. Consistent with its obligations and APRA’s expectations the BT trustee is assessing the potential implications of these circumstances and exploring options for the products that are in the best financial interests of members.
ASIC and APRA are increasing their supervisory focus on superannuation providers, including BT, with an emphasis on member outcomes. Westpac’s BT superannuation entity trustee has been responding to requests for information from APRA in relation to the comparative underperformance of certain of its MySuper products, having regard to APRA’s MySuper ‘Heat Maps’. BT’s superannuation trustee is also continuing with a program of work on enhancement of member outcomes and accelerating its remediation programs.
With increased regulatory focus on superannuation, including a number of inquiries and investigations into BT’s superannuation business, further issues requiring attention may be identified.
Royal commission into the banking, superannuation and financial services industry
Implementation of the 76 express recommendations in the Final Report of the Royal Commission into Misconduct in the Banking, Superannuation and Financial Services Industry continues to be a focus of Australia’s banking and financial services entities and their regulators.
Presently, 46 recommendations apply to Westpac. The Group continues with programs of work in relation to all applicable recommendations that have been the subject of legislative activity and/or regulatory activity and, to date, has implemented 20 recommendations.
Other impacts arising from the Royal Commission include claims being brought against financial institutions in relation to matters considered during the Royal Commission, and the referral of several cases of misconduct to the financial regulators by Commissioner Hayne.
Litigation and regulatory proceedings
Our entities are defendants from time to time in legal proceedings arising from the conduct of our business. Material legal proceedings are described below and in Note 26 to the financial statements.
3 FINA
NC
IAL STA
TEM
EN
TS2 G
RO
UP
PE
RFO
RM
AN
CE
79WESTPAC GROUP 2021 ANNUAL REPORT4
SHA
RE
HO
LDE
R IN
FOR
MA
TION
1 STRA
TEG
IC R
EP
OR
T
Information on Westpac
U.S. AUSTRAC related class action
In January 2020, a U.S. class action was brought on behalf of certain investors in Westpac securities between 11 November 2015 and 19 November 2019. The claim related to market disclosure issues connected to Westpac’s monitoring of financial crime over the relevant period and matters which were the subject of the AUSTRAC proceedings. The parties agreed to settle these proceedings and Westpac agreed to pay an amount of US$3.1 million. On 12 May 2021, the District Court of Oregon made orders approving the settlement.
Class action in the U.S. relating to bank bill swap rate
In August 2016, a class action was filed in the United States District Court for the Southern District of New York against Westpac and several other Australian and international banks and brokers alleging misconduct in relation to the bank bill swap reference rate. In 2020, Westpac reached agreement with the Plaintiffs to settle this class action, agreeing to pay a settlement sum of US$25 million and to certain ongoing co-operation obligations. The settlement remains subject to Court approval.
Regulatory proceedings
ASIC’s consumer credit insurance proceedings
On 7 April 2021, ASIC commenced proceedings in the Federal Court against Westpac in relation to the sale of consumer credit insurance (CCI) products to certain customers who ASIC alleges had not requested this product. ASIC is seeking, among other things, declarations of contraventions of certain civil penalty provisions and unspecified monetary penalties relating to approximately 335 customers in the period 7 April 2015 to 27 July 2015. Westpac has filed its Response to ASIC’s Concise Statement. Westpac ceased selling CCI products in 2019.
ASIC’s civil proceedings relating to interest rate hedging activity
On 5 May 2021, ASIC filed civil proceedings against Westpac alleging that it had engaged in insider trading and unconscionable conduct and failed to comply with its Australian Financial Services Licence obligations. The allegations relate to interest rate hedging activity during Westpac’s involvement in the 2016 Ausgrid privatisation transaction. Westpac has filed its Response to ASIC’s Concise Statement.
Outstanding regulatory matters
Westpac is working with ASIC to accelerate the closure of certain investigations described in Note 26 to the financial statements under the heading ‘Compliance, regulation and remediation provisions’, which is expected to involve Court proceedings.
Class actions
Class action relating to cash in superannuation
On 5 September 2019, a class action against BTFM and WLIS was commenced in the Federal Court of Australia in relation to aspects of BTFM’s BT Super for Life cash investment option. The claim follows other industry class actions. It is alleged that BTFM failed to adhere to a number of obligations under the general law, the relevant trust deed and the Superannuation Industry (Supervision) Act 1993 (Cth), and that WLIS was knowingly concerned with BTFM’s alleged contraventions. The amount of damages claimed on behalf of group members has not yet been specified. BTFM and WLIS are defending the proceedings.
Class action relating to consumer credit insurance
On 28 February 2020, a class action was commenced against Westpac Banking Corporation, Westpac General Insurance Limited and WLIS in the Federal Court of Australia in relation to Westpac’s sale of consumer credit insurance products to customers. The claim follows other industry class actions. It is alleged the three entities failed to adhere to a number of obligations in selling CCI in conjunction with credit cards, personal loans and flexi loans. The damages sought by the claim are unspecified. The three entities are defending the proceedings.
Class action relating to payment of flex commissions to auto dealers
On 16 July 2020, a class action was commenced against Westpac Banking Corporation and St.George Finance Limited (SGF) in the Supreme Court of Victoria in relation to flex commissions paid to auto dealers from 1 March 2013 to 31 October 2018. This proceeding is one of two class actions commenced against a number of lenders in the auto finance industry.
It is alleged Westpac and SGF are liable for the unfair conduct of dealers acting as credit representatives and engaged in misleading or deceptive conduct. The damages sought are unspecified. Westpac and SGF are defending the proceedings. Another law firm publicly announced in July 2020 that it is preparing to commence a class action against Westpac entities in relation to flex commissions paid to auto dealers. Westpac has not been served with a claim from that law firm on flex commissions. Westpac has not paid flex commissions since 1 November 2018 following an industry-wide ban issued by ASIC.
Australian AUSTRAC related class action
Westpac is defending a class action proceeding which was commenced in December 2019 in the Federal Court of Australia on behalf of certain investors who acquired an interest in Westpac securities between 16 December 2013 and 19 November 2019. The proceeding involves allegations relating to market disclosure issues connected to Westpac’s monitoring of financial crime over the relevant period, and matters which were the subject of the AUSTRAC civil proceedings. The damages sought are unspecified. However, given the time period in question and the nature of the claims, it is likely any alleged damages will be significant.

80 WESTPAC GROUP 2021 ANNUAL REPORT
Information on Westpac
Potential class actions
Westpac is aware from media reports and other publicly available material that other class actions against Westpac entities are being investigated. In July 2020, a law firm publicly stated that it intends to commence a class action against BTFM alleging that since 2014, BTFM did not act in the best interests of members of certain superannuation funds when obtaining group insurance policies. In August 2020, another law firm announced it was investigating claims on behalf of persons who in the past 6 years acquired, renewed or continued to hold a financial product (including life insurance) on the advice or recommendation of a financial adviser from Magnitude Group, Securitor Financial Group or Westpac Banking Corporation. Westpac has not been served with a claim in relation to either of these matters and has no information about the proposed claims beyond the public statements issued by the law firms involved.

2 GR
OU
P P
ER
FOR
MA
NC
E3 FIN
AN
CIA
L STATE
ME
NTS
1 STRA
TEG
IC R
EP
OR
T4
SHA
RE
HO
LDE
R IN
FOR
MA
TION
81WESTPAC GROUP 2021 ANNUAL REPORT
Group performanceSECTION 2Reading this report
Review of Group operationsIncome statement review Balance sheet review Capital resources
Divisional performanceConsumer Business Westpac Institutional Bank Westpac New ZealandSpecialist BusinessesGroup Businesses
Risk and risk managementRisk managementRisk factors
Other Westpac business information

82 WESTPAC GROUP 2021 ANNUAL REPORT
Reading this report
Reading this report
Disclosure regarding forward-looking statements
This Annual Report contains statements that constitute ‘forward-looking statements’ within the meaning of Section 21E of the US Securities Exchange Act of 1934.
Forward-looking statements are statements about matters that are not historical facts. Forward-looking statements appear in a number of places in this Annual Report and include statements regarding Westpac’s intent, belief or current expectations with respect to its business and operations, market conditions, results of operations and financial condition, including, without limitation, future loan loss provisions and financial support to certain borrowers. Words such as ‘will’, ‘may’, ‘expect’, ‘intend’, ‘seek’, ‘would’, ‘should’, ‘could’, ‘continue’, ‘plan’, ‘estimate’, ‘anticipate’, ‘believe’, ‘probability’, ‘risk’, ‘aim’, ‘outlook’, ‘forecast’ or other similar words are used to identify forward-looking statements. These forward-looking statements reflect Westpac’s current views with respect to future events and are subject to change, certain risks, uncertainties and assumptions which are, in many instances, beyond Westpac’s control, and have been made based upon management’s expectations and beliefs concerning future developments and their potential effect upon Westpac. There can be no assurance that future developments will be in accordance with Westpac’s expectations or that the effect of future developments on Westpac will be those anticipated. Actual results could differ materially from those expected, depending on the outcome of various factors, including, but not limited to:
• information security breaches, including cyberattacks;
• the effect of the global COVID-19 pandemic, which has had, and may continue to have, a negative impact on our business and global economic conditions, adversely affect a wide-range of Westpac’s key suppliers, third-party contractors and customers, create increased volatility in financial markets and result in increased impairments, defaults and write-offs;
• the effect of, and changes in, laws, regulations, taxation or accounting standards or practices and government policy, particularly changes to liquidity, leverage and capital requirements;
• regulatory investigations, reviews and other actions, inquiries, litigation, fines, penalties, restrictions or other regulator imposed conditions, including as a result of our actual or alleged failure to comply with laws (such as financial crime laws), regulations or regulatory policy;
• the effectiveness of Westpac’s risk management policies, including internal processes, systems and employees, and operational risks resulting from ineffective processes and controls, as well as breakdowns in processes and procedures requiring remediation activity;
• the failure to comply with financial crime obligations, which has had, and could further have, adverse effects on our business and reputation;
• the occurrence of environmental change (including as a result of climate change) or external events in countries in which Westpac or its customers or counterparties conduct their operations;
• internal and external events which may adversely impact Westpac’s reputation;
• litigation and other legal proceedings and regulator investigations and enforcement actions;
• reliability and security of Westpac’s technology and risks associated with changes to technology systems;
• the stability of Australian and international financial systems and disruptions to financial markets and any losses or business impacts Westpac or its customers or counterparties may experience as a result;
• market volatility, including uncertain conditions in funding, equity and asset markets;
• the incidence of inadequate capital levels under stressed conditions;
• the risk that governments will default on their debt obligations or will be unable to refinance their debts as they fall due;
• changes to Westpac’s credit ratings or the methodology used by credit rating agencies;
• changes in political, social or economic conditions in any of the major markets in which Westpac or its customers or counterparties operate;
• changes in economic conditions, consumer spending, saving and borrowing habits in Australia, New Zealand and other countries (including as a result of tariffs and other protectionist trade measures) in which Westpac or its customers or counterparties conduct their operations and Westpac’s ability to maintain or to increase market share, margins and fees, and control expenses;
• adverse asset, credit or capital market conditions;
• an increase in defaults in credit exposures because of a deterioration in economic conditions;
• an increase in defaults, write-offs and provisions for credit impairments;
• the effects of competition, including from established providers of financial services and from non-financial services entities, in the geographic and business areas in which Westpac conducts its operations;
• levels of inflation, interest rates (including low or negative interest rates), exchange rates and market and monetary fluctuations and volatility;

83WESTPAC GROUP 2021 ANNUAL REPORT2 G
RO
UP
PE
RFO
RM
AN
CE
3 FINA
NC
IAL STA
TEM
EN
TS1 STR
ATE
GIC
RE
PO
RT
4 SH
AR
EH
OLD
ER
INFO
RM
ATIO
N
Reading this report
• poor data quality or poor data retention;
• strategic decisions including diversification, innovation, divestment, acquisitions or business expansion activity, including the integration of new businesses;
• changes to Westpac’s critical accounting estimates and judgements and changes to the value of Westpac’s intangible assets;
• the incidence or severity of Westpac-insured events;
• the inability to syndicate or sell down underwritten securities, particularly during times of heightened market volatility; and
• various other factors beyond Westpac’s control.
The above list is not exhaustive. For certain other factors that may impact on forward-looking statements made by Westpac, refer to ‘Risk factors’ in this Annual Report. When relying on forward-looking statements to make decisions with respect to Westpac, investors and others should carefully consider the foregoing factors and other uncertainties and events.
Westpac is under no obligation to update any forward-looking statements contained in this Annual Report, whether as a result of new information, future events or otherwise, after the date of this Annual Report.
Currency of presentation, exchange rates and certain definitions
In this Annual Report, ‘financial statements’ means our audited consolidated balance sheets as at 30 September 2021 and 30 September 2020 and income statements, statements of comprehensive income, changes in equity and cash flows for each of the years ended 30 September 2021, 2020 and 2019 together with accompanying notes which are included in this Annual Report.
Our financial year ends on 30 September. As used throughout this Annual Report, the financial year ended 30 September 2021 is referred to as 2021 and other financial years are referred to in a corresponding manner.
We publish our consolidated financial statements in Australian dollars. In this Annual Report, unless otherwise stated or the context otherwise requires, references to ‘dollars’, ‘dollar amounts’, ‘$’, ‘AUD’ or ‘A$’ are to Australian dollars and references to ‘NZ$’, ‘NZD’ or ‘NZ dollars’ are to New Zealand dollars. The Australian dollar equivalent of New Zealand dollars at 30 September 2021 was A$1.00 = NZ$1.0477, being the closing spot exchange rate on that date.
Any discrepancies between totals and sums of components in tables contained in this Annual Report are due to rounding.
Reading this report

84 WESTPAC GROUP 2021 ANNUAL REPORT
Review of Group operations
Selected consolidated financial and operating data
We have derived the following selected financial information, as of, and for the financial years ended, 30 September 2021, 2020 and 2019 from our consolidated financial statements and related notes.
This information should be read together with our audited consolidated financial statements and the accompanying notes included elsewhere in this Annual Report.
Accounting standards
The financial statements and other financial information included elsewhere in this Annual Report, unless otherwise indicated, have been prepared and presented in accordance with Australian Accounting Standards (AAS). Compliance with AAS ensures that the financial statements also comply with International Financial Reporting Standards (IFRS) as issued by the International Accounting Standards Board (IASB).
The financial statements have been prepared in accordance with the accounting policies described in the Notes to the financial statements.
Recent accounting developments
For a discussion of recent accounting developments refer to Note 1 to the financial statements.
Critical accounting assumptions and estimates
Applying the Group’s accounting policies requires the use of judgment, assumptions and estimates which impact the financial information. Note 1 (b) includes details of the areas of our critical accounting assumptions and estimates and a reference to the relevant note in the financial statements providing further information. Each of the assumptions and estimates have been discussed at our Board Audit Committee (BAC). The following is a summary of the areas involving our most critical accounting estimates.
• Note 7 Income taxes.
• Note 13 Provisions for ECL on loans and credit commitments.
• Note 15 Life insurance contract liabilities.
• Note 22 Fair value of financial instruments.
• Note 25 Goodwill.
• Note 26 Provisions (other than Provisions for ECL on loans and credit commitments).
• Note 33 Superannuation obligations.
Intangible assets – computer software
Effective from 1 October 2020, the Group made a prospective change to computer software capitalisation by increasing the threshold for capitalisation for software development costs from a total project spend of $1 million to a total project spend of $20 million. This does not have a material effect on the Group’s financial statements. The change increased operating expenses and reduced profit before income tax in the year by $191 million.
Impact of COVID-19
The COVID-19 pandemic and the measures put in place domestically and globally to control the spread of the virus continue to impact global economies and financial markets. As a result, this remains a source of uncertainty and judgement is required in relation to our critical accounting assumptions and estimates, primarily relating to:
• expected credit losses (ECL); and
• recoverable amount assessments of intangible assets.
As there is a higher than usual degree of uncertainty associated with these assumptions and estimates, the actual outcomes may differ significantly which may impact accounting estimates included in these financial statements.
Review of Group operations

85WESTPAC GROUP 2021 ANNUAL REPORT2 G
RO
UP
PE
RFO
RM
AN
CE
3 FINA
NC
IAL STA
TEM
EN
TS1 STR
ATE
GIC
RE
PO
RT
4 SH
AR
EH
OLD
ER
INFO
RM
ATIO
N
Review of Group operations
Income statement review
Consolidated income statement and key financial information1 (in $m unless otherwise indicated) 2021 2020 2019Income statements for the years ended 30 September
Net interest income 16,858 16,696 16,907
Net fee income 1,482 1,592 1,655
Net wealth management and insurance income 1,211 751 1,029
Trading income 719 895 929
Other income 952 249 129
Net operating income before operating expenses and impairment charges 21,222 20,183 20,649
Operating expenses (13,311) (12,739) (10,106)
Impairment charges 590 (3,178) (794)
Profit before income tax 8,501 4,266 9,749
Income tax expense (3,038) (1,974) (2,959)
Profit attributable to non-controlling interests (NCI) (5) (2) (6)
Net profit attributable to owners of Westpac Banking Corporation (WBC) 5,458 2,290 6,784
Key financial ratios
Shareholder value
Fully franked dividends per ordinary share (cents) 118 31 174
Dividend payout ratio (%)2 79.25 48.87 88.83
Basic earnings per share (cents)3 149.4 63.7 196.5
Diluted earnings per share (cents)4 137.8 63.7 189.5
Weighted average number of ordinary shares (millions) 3,653 3,590 3,450
Net tangible assets per ordinary share ($)5 16.90 15.67 15.36
Return on average ordinary equity (%)6 7.70 3.37 10.65
Return on average total equity (%)7 7.70 3.36 10.64
Share price ($):
High 27.12 29.81 30.05
Low 16.51 13.47 23.30
Close 26.00 16.84 29.64
Business performance
Net interest margin (%)8 2.06 2.03 2.12
Operating expenses to operating income ratio (%) 62.72 63.12 48.94
Return on average assets (%)9 0.60 0.25 0.76
Capital adequacy
Total equity to total assets (%) 7.70 7.50 7.20
Average total equity to total average assets (%) 7.83 7.40 7.13
APRA Basel III:
Common equity Tier 1 (%) 12.32 11.13 10.67
Tier 1 ratio (%) 14.65 13.23 12.84
Total capital ratio (%) 18.86 16.38 15.63
Credit quality10
Loans written off (net of recoveries) 594 977 982
Loans written off (net of recoveries) to average loans (basis points) 8 14 14
Net impaired assets to equity and collectively assessed provisions (%) 1.28 2.21 1.41
Total provisions for expected credit losses (ECL) to total loans (basis points) 70 88 54
1. Where accounting classifications have changed or where changes in accounting policy are adopted retrospectively, comparatives have been restated and may differ from results previously reported.
2. Adjusted for Treasury shares.3. Based on weighted average number of fully paid ordinary shares.4. Basic earnings per share adjusted for the impact of dilutive
potential ordinary shares.5. Total equity attributable to owners of Westpac Banking
Corporation, after deducting intangible assets divided by the number of ordinary shares outstanding, less Treasury shares.
6. Calculated by dividing net profit attributable to owners of Westpac Banking Corporation by average ordinary equity.
7. Calculated by dividing net profit attributable to owners of Westpac Banking Corporation by average ordinary equity and non-controlling interests.
8. Calculated by dividing net interest income by average interest earning assets.
9. Calculated by dividing net profit attributable to owners of Westpac Banking Corporation by average total assets.
10. Includes balances classified as held for sale.
Review of Group operations

86 WESTPAC GROUP 2021 ANNUAL REPORT
Review of Group operations
Overview of performance – 2021 v 2020
Net profit attributable to owners of WBC for 2021 was $5,458 million, an increase of $3,168 million or 138% compared to 2020.
The increase in net profit was predominantly due to a credit impairment benefit of $590 million in 2021 compared to a charge of $3,178 million in 2020. Over recent years, Westpac has incurred certain items that have been called "notable items". The net after tax impact of these items was lower in 2021 ($1,601 million) compared to 2020 ($2,619 million). 2021 items included:
• the write-down of assets (goodwill, capitalised software and certain other assets);
• additional provisions for estimated customer refunds, payments, associated costs and litigation; and
• separation and transaction costs related to divestment of the Group’s Specialist Businesses; partly offset by
• gains on sale of assets and non-core businesses.
The following is a summary of the movements in the major line items in net profit for 2021 compared to 2020.
Net interest income increased $162 million compared to 2020 reflecting a 3 basis point increase in net interest margin (to 2.06%) partly offset by a small decline in average interest earning assets of $2.3 billion (down less than 1%). The decline in average interest earning assets was mostly from lower business lending early in the year and from a decline in other overseas assets as we consolidated our operations in Asia. The rise in net interest income was predominantly due to:
• a $667 million change in unrealised gains on fair value economic hedges, from a charge of $477 million in 2020 to a benefit of $190 million in 2021; and
• lower wholesale funding and deposit costs; partly offset by
• lower spreads on mortgages and business lending from intense competition, and a shift in the mix of the portfolio to lower spread fixed rate lending; and
• reduced returns on hedged capital and liquid assets from lower interest rates.
Non-interest income increased $877 million compared to 2020. The rise was mainly due to:
• gains on sale of assets and non-core businesses; and
• higher net wealth and insurance income due to favourable life policyholder liability revaluation and lower general insurance severe weather claims; partly offset by
• lower financial markets trading income from lower volatility and the exit from energy trading; and
• lower net fee income from fee simplification initiatives.
Operating expenses increased $572 million or 4% compared to 2020. The rise was mainly due to:
• asset impairments (including goodwill and capitalised software);
• an increase in full time equivalent (FTE) employees and associated costs, principally to improve risk management as part of our Fix priority and increased mortgage volumes; partly offset by
• costs of the AUSTRAC proceedings, including a penalty, in 2020.
The Group recognised a credit impairment benefit of $590 million in 2021 compared to a charge of $3,178 million in 2020. In 2020, the Group materially increased provisions in response to the expected economic impact of COVID-19, including forecasts of prolonged deterioration in economic activity, a rise in unemployment and a decline in property prices. The improvement in asset quality along with a better economic outlook has meant that some of the provisions booked in 2020 are no longer required. The Group also fully provided for a large equipment finance fraud in 2021.
The effective tax rate of 35.7% was lower than the 2020 effective tax rate of 46.3% predominantly due to the non-deductible items in 2020.
The Board has determined a final dividend of 60 cents per ordinary share. The full year ordinary dividends of $1.18 is higher than the ordinary dividends declared in 2020 and represents a payout ratio of 79.25%. The full year ordinary dividend is fully franked.
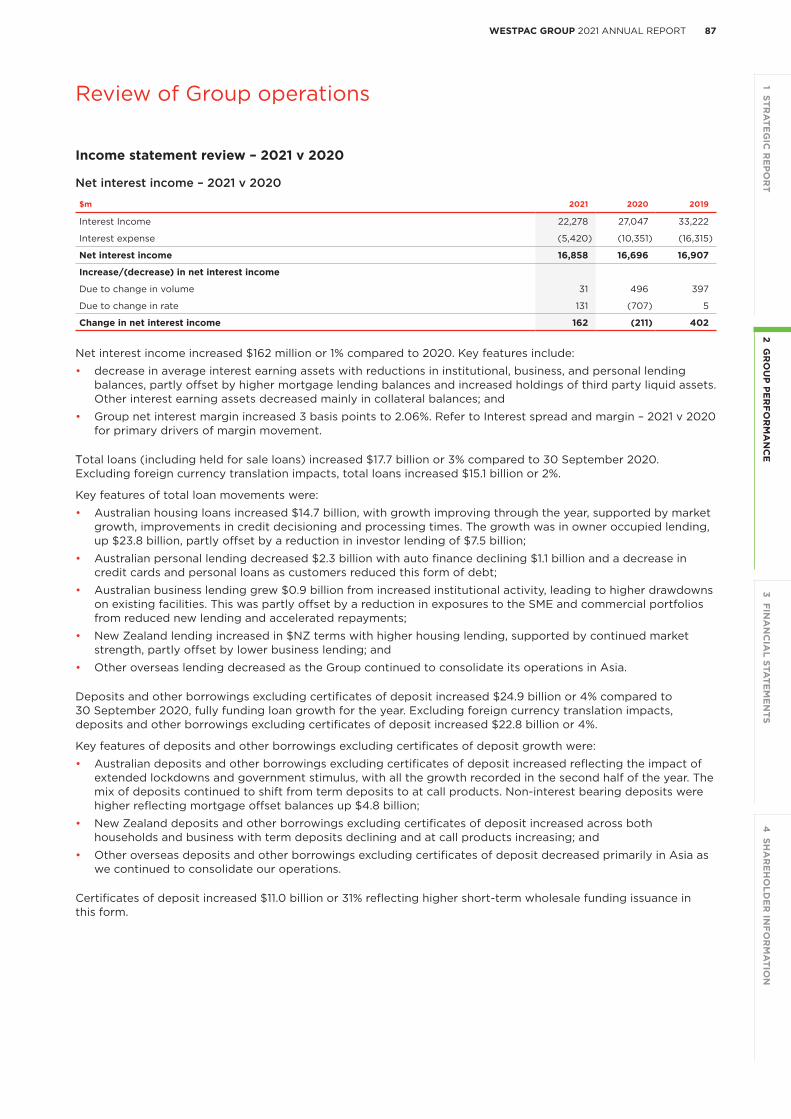
87WESTPAC GROUP 2021 ANNUAL REPORT2 G
RO
UP
PE
RFO
RM
AN
CE
3 FINA
NC
IAL STA
TEM
EN
TS1 STR
ATE
GIC
RE
PO
RT
4 SH
AR
EH
OLD
ER
INFO
RM
ATIO
N
Review of Group operations
Income statement review – 2021 v 2020
Net interest income – 2021 v 2020
$m 2021 2020 2019
Interest Income 22,278 27,047 33,222
Interest expense (5,420) (10,351) (16,315)
Net interest income 16,858 16,696 16,907
Increase/(decrease) in net interest income
Due to change in volume 31 496 397
Due to change in rate 131 (707) 5
Change in net interest income 162 (211) 402
Net interest income increased $162 million or 1% compared to 2020. Key features include:
• decrease in average interest earning assets with reductions in institutional, business, and personal lending balances, partly offset by higher mortgage lending balances and increased holdings of third party liquid assets. Other interest earning assets decreased mainly in collateral balances; and
• Group net interest margin increased 3 basis points to 2.06%. Refer to Interest spread and margin – 2021 v 2020 for primary drivers of margin movement.
Total loans (including held for sale loans) increased $17.7 billion or 3% compared to 30 September 2020. Excluding foreign currency translation impacts, total loans increased $15.1 billion or 2%.
Key features of total loan movements were:
• Australian housing loans increased $14.7 billion, with growth improving through the year, supported by market growth, improvements in credit decisioning and processing times. The growth was in owner occupied lending, up $23.8 billion, partly offset by a reduction in investor lending of $7.5 billion;
• Australian personal lending decreased $2.3 billion with auto finance declining $1.1 billion and a decrease in credit cards and personal loans as customers reduced this form of debt;
• Australian business lending grew $0.9 billion from increased institutional activity, leading to higher drawdowns on existing facilities. This was partly offset by a reduction in exposures to the SME and commercial portfolios from reduced new lending and accelerated repayments;
• New Zealand lending increased in $NZ terms with higher housing lending, supported by continued market strength, partly offset by lower business lending; and
• Other overseas lending decreased as the Group continued to consolidate its operations in Asia.
Deposits and other borrowings excluding certificates of deposit increased $24.9 billion or 4% compared to 30 September 2020, fully funding loan growth for the year. Excluding foreign currency translation impacts, deposits and other borrowings excluding certificates of deposit increased $22.8 billion or 4%.
Key features of deposits and other borrowings excluding certificates of deposit growth were:
• Australian deposits and other borrowings excluding certificates of deposit increased reflecting the impact of extended lockdowns and government stimulus, with all the growth recorded in the second half of the year. The mix of deposits continued to shift from term deposits to at call products. Non-interest bearing deposits were higher reflecting mortgage offset balances up $4.8 billion;
• New Zealand deposits and other borrowings excluding certificates of deposit increased across both households and business with term deposits declining and at call products increasing; and
• Other overseas deposits and other borrowings excluding certificates of deposit decreased primarily in Asia as we continued to consolidate our operations.
Certificates of deposit increased $11.0 billion or 31% reflecting higher short-term wholesale funding issuance in this form.

88 WESTPAC GROUP 2021 ANNUAL REPORT
Review of Group operations
Interest spread and margin – 2021 v 2020
$m 2021 2020 2019
Group
Net interest income 16,858 16,696 16,907
Average interest earning assets 819,456 821,718 798,924
Average interest bearing liabilities 736,336 745,641 734,282
Average net non-interest bearing assets, liabilities and equity 83,120 76,077 64,642
Interest spread1 1.98% 1.90% 1.94%
Benefit of net non-interest bearing assets, liabilities and equity2 0.08% 0.13% 0.18%
Net interest margin3 2.06% 2.03% 2.12%
Group net interest margin of 2.06% increased 3 basis points from 2020. Key features include:
• reduced estimated customer refunds and payments contributed to an increase in margin of 4 basis points; and
• excluding the impact of estimated customer refunds and payments, net interest margin decreased 1 basis pointdriven by:
– 7 basis point decrease from loans primarily due to lower spreads on new lending, shifts in the mortgageportfolio composition to lower spread fixed rate loans, mortgage retention pricing, contraction in businesslending spreads, and a change in portfolio mix with reductions in higher spread personal and businesslending average balances, partly offset by lower funding costs;
– 6 basis point decrease from capital and other primarily due to reduced earnings on hedged capital;
– 3 basis point decrease from higher holdings of third party liquid assets; partly offset by
– 6 basis point increase from higher Treasury and Markets contribution primarily driven by unrealised gainson fair value economic hedges and hedge ineffectiveness;
– 5 basis point increase from lower wholesale funding costs reflecting low interest rates and the TermFunding Facility; and
– 4 basis point increase from deposits primarily due to favourable shifts in portfolio composition ascustomers preferred at call products and repricing, partly offset by lower earnings on hedged deposits.
Non-interest income - 2021 v 2020
$m 2021 2020 2019
Net fee income 1,482 1,592 1,655
Net wealth management and insurance income 1,211 751 1,029
Trading income 719 895 929
Other income 952 249 129
Non-interest income 4,364 3,487 3,742
Non-interest income of $4,364 million increased $877 million or 25% compared to 2020.
Net fee income decreased $110 million or 7% primarily resulting from:
• estimated customer refunds and payments were $137 million in 2021 compared to $88 million in 2020;
• the removal of certain account and transaction fees as part of our simplification initiatives;
• the impacts of COVID-19 including a decline in international card volumes and lower customer activity;
• lower payments revenue from a reduction in correspondent banking relationships; and
• lower net contribution from ATM usage ($25 million) following the sale of our offsite ATMs to a third party in2020; partly offset by
• higher corporate and institutional fee income ($37 million) from lower utilisation of credit facilities.
1. Interest spread is the difference between the average yield on all interest earning assets and the average yield on all interestbearing liabilities.
2. The benefit of net non-interest bearing assets, liabilities and equity is determined by applying the average yield paid on all interestbearing liabilities to the average level of net non-interest bearing funds as a percentage of average interest earning assets.
3. Net interest margin is calculated by dividing net interest income by average interest earning assets.
Review of Group operations

89WESTPAC GROUP 2021 ANNUAL REPORT2 G
RO
UP
PE
RFO
RM
AN
CE
3 FINA
NC
IAL STA
TEM
EN
TS1 STR
ATE
GIC
RE
PO
RT
4 SH
AR
EH
OLD
ER
INFO
RM
ATIO
N
Review of Group operations
Net wealth management and insurance income increased $460 million or 61% primarily due to:
• higher life insurance income ($413 million) with the prior period impacted by asset impairment and deferred acquisition cost write-offs combined with a favourable movement in the valuation of life policy liabilities;
• higher Lenders Mortgage Insurance income ($81 million) reflecting increased volumes and first home buyer activity prior to the sale of the business in August 2021; and
• higher General Insurance income ($41 million) due to lower weather-related claims prior to the sale of the business in July 2021; partly offset by
• lower wealth income ($39 million) mostly from platform and superannuation pricing changes and migration of customers from legacy platforms to BT Panorama; and
• full period impact from the exit of the Advice business in 2020 ($30 million).
Trading income decreased $176 million or 20% primarily due to:
• lower non-customer income primarily due to lower fixed income and foreign exchange trading due to low market volatility and reduced commodities income following the exit of the energy desk in 2020 ($64 million); and
• losses on derivatives ($79 million) that hedge certain customer products which is mostly offset by a corresponding gain in Other income; partly offset by
• a positive movement in derivative valuation adjustments ($169 million) with 2020 impacted by wider credit spreads due to the higher potential risks that were expected to emerge from COVID-19; and
• a positive movement in offshore earnings hedges ($36 million).
Other income increased $703 million primarily due to:
• a gain on the revaluation of Coinbase ($545 million);
• a gain on the sale of Westpac General Insurance ($160 million);
• fair value gains ($78 million) on markets related customer products, with the risk associated with these instruments hedged and losses reported in trading income;
• non-recurring foreign currency translation losses incurred in the prior year following the closure of the Mumbai branch ($55 million); and
• gains on the revaluation of fintech investments ($43 million); partly offset by
• the revaluation of Zip Co Limited in the prior year ($303 million).
Operating expenses – 2021 v 2020
$m 2021 2020 2019
Staff expenses 6,034 5,015 5,038
Occupancy expenses 1,226 1,016 1,023
Technology expenses 3,128 2,643 2,319
Other expenses 2,923 4,065 1,726
Total operating expenses 13,311 12,739 10,106
Total operating expenses to net operating income ratio (%) 62.72% 63.12% 48.94%
Operating expenses were $572 million or 4% higher compared to 2020. Key items include:
• write-down of intangible assets ($737 million higher);
• asset sales and revaluations ($352 million higher);
• costs associated with estimated customer refunds, payments, costs and litigation ($197 million higher);
• partly offset by non-repeat of costs associated with AUSTRAC proceedings ($1,478 million lower).
Except for these items, operating expenses increased $764 million or 7%. The following discussion excludes the impact of these key items.
Through the year, we added 3,294 FTE mainly in response to additional resources to support our Fix strategic priority, responding to higher mortgage volumes, providing COVID-19 support, and bringing more than 1,000 previously outsourced roles back to Australia. Additionally, increased expenses from the changes to our software capitalisation policy and increased short-term incentives were partly offset by savings from organisational streamlining and reductions in our branch network.

90 WESTPAC GROUP 2021 ANNUAL REPORT
Review of Group operations
Staff expenses increased $854 million or 17% from:
• higher personnel expenses mainly driven by:
– additional resources to improve risk management and compliance;
– responding to higher mortgage volumes, providing COVID-19 support, and bringing roles back to Australia;
– increased short-term incentives as 2020 had a reduced bonus pool given risk issues; and
• changes to our software capitalisation policy resulted in a higher proportion of activity being directly expensed in the period, rather than amortised over future periods;
• partly offset by higher utilisation of leave provisions.
Occupancy expenses were $65 million or 6% lower mostly from lower distribution network costs including branch closures, partly offset by costs associated with corporate sites rationalisation.
Technology expenses were $4 million higher from impacts of changes to our software capitalisation policy partly offset by lower amortisation.
Other expenses decreased $29 million or 2% from lower third-party spend and travel and entertainment partly offset by higher costs relating to the Customer Outcomes and Risk Excellence (CORE) program.
Impairment charges – 2021 v 2020
$m 2021 2020 2019
Total impairment (benefit)/charges (590) 3,178 794
Impairment charges to average gross loans (basis points) (8) 45 11
In 2021, Westpac reported an impairment benefit of $590 million, compared to the 2020 impairment charge of $3,178 million, a $3,768 million improvement.
Total new collectively assessed provisions (CAP) in 2021 was a benefit of $803 million compared to a charge of $2,861 million in 2020. The benefit was due to:
• more positive forward-looking economic inputs in the provision calculations through 2021;
• improved asset quality metrics, including a 55 basis point reduction in the Group’s stressed exposures to TCE and lower delinquencies across the consumer portfolios; and
• lower write-offs, predominately from lower delinquencies and a reduction in our consumer unsecured portfolios.
Total individually assessed provisions (IAPs), write-backs and recoveries were $104 million lower than 2020 principally due to:
• higher recoveries and write-backs in 2021 predominately in the Consumer and Business divisions; and
• lower new IAPs. 2021 included a small number of large customers migrating to impaired while one fully provided equipment finance fraud was recorded in 2021.
Income tax expense – 2021 v 2020
$m 2021 2020 2019
Income tax expense 3,038 1,974 2,959
Tax as a percentage of profit before income tax expense (effective income tax rate) 35.74% 46.27% 30.35%
The effective tax rate of 35.74% in 2021 was significantly lower than the 2020 effective tax rate of 46.27%. The key driver for the decline in the rate is the non-deductible provisions for the penalty, and associated costs, relating to the AUSTRAC civil proceedings, being recognised in 2020 and not repeated in 2021. These have been offset by additional tax expense arising from our Insurance divestments in 2021.
The effective tax rate of 35.74% in 2021 is above the Australian corporate tax rate of 30%, with the key drivers for the increase in the rate being the non-deductible goodwill impairments and additional tax expense arising from our Insurance divestments.

91WESTPAC GROUP 2021 ANNUAL REPORT2 G
RO
UP
PE
RFO
RM
AN
CE
3 FINA
NC
IAL STA
TEM
EN
TS1 STR
ATE
GIC
RE
PO
RT
4 SH
AR
EH
OLD
ER
INFO
RM
ATIO
N
Review of Group operations
Balance sheet review
Selected consolidated balance sheet data1
The detailed components of the balance sheet are set out in the notes to the financial statements.
2021 2020As at 30 September $m $m
Cash and balances with central banks 71,353 30,129
Collateral paid 4,232 4,778
Trading securities and financial assets measured at fair value through income statement and investment securities 104,518 132,206
Derivative financial instruments 19,353 23,367
Loans 709,784 693,059
Life insurance assets - 3,593
Assets held for sale 4,188 -
All other assets 22,449 24,814
Total assets 935,877 911,946
Collateral received 2,368 2,250
Deposits and other borrowings 626,955 591,131
Other financial liabilities 50,309 40,925
Derivative financial instruments 18,059 23,054
Debt issues 128,779 150,325
Life insurance liabilities - 1,396
Liabilities held for sale 837 -
All other liabilities 7,411 10,842
Total liabilities excluding loan capital 834,718 819,923
Total loan capital 29,067 23,949
Total liabilities 863,785 843,872
Net assets 72,092 68,074
Total equity attributable to owners of WBC 72,035 68,023
NCI 57 51
Total shareholders’ equity and NCI 72,092 68,074
1. Where accounting classifications have changed or where changes in accounting policy are adopted retrospectively, comparatives have been restated and may differ from results previously reported.
Review of Group operations

92 WESTPAC GROUP 2021 ANNUAL REPORT
Review of Group operations
Balance sheet review
During 2021, the level of liquid assets was higher due to inflows from deposits outpacing loan growth, further utilisation of the Term Funding Facility (TFF), partly offset by net maturities of debt issues.
Assets – 2021 v 2020
Total assets as at 30 September 2021 were $935.9 billion, an increase of $23.9 billion or 3% compared to 30 September 2020. Significant movements during the year included:
• cash and balances with central banks increased $41.2 billion or 137% reflecting higher liquid assets held in this form;
• trading securities and financial assets measured at FVIS and investment securities decreased $27.7 billion or 21% reflecting lower balances held in this form;
• derivative assets decreased $4.0 billion or 17% mainly driven by movements in interest rate swaps;
• loans increased $16.7 billion or 2%. Refer to loan discussion in Net interest income – 2021 v 2020 for further information;
• life insurance assets decreased $3.6 billion or 100% due to the reclassification to assets held for sale;
• assets held for sale as at 30 September 2021 comprised of businesses announced to be sold in 2021 (refer to Note 37 to the financial statements). There were no businesses classified as assets held for sale as at 30 September 2020;
• all other assets decreased $2.4 billion or 10% mainly due to impairment of intangible assets, and depreciation and impairment of property and equipment.
Liabilities and equity – 2021 v 2020
Total liabilities as at 30 September 2021 were $863.8 billion, an increase of $19.9 billion or 2% compared to 30 September 2020. Significant movements during the year included:
• deposits and other borrowings increased $35.8 billion or 6%. Refer to deposits and other borrowings discussion in Net interest income - 2021 v 2020 for further information;
• other financial liabilities increased $9.4 billion or 23% mainly driven by higher securities sold under agreements to repurchase as the Group accessed the TFF;
• derivative liabilities decreased $5.0 billion or 22% driven by movements in interest rate and cross currency swaps;
• debt issues decreased $21.5 billion or 14%. Excluding foreign currency and other non-cash impacts, debt issues decreased $18.5 billion or 12%, representing net maturities;
• life insurance liabilities decreased $1.4 billion or 100% due to the reclassification to liabilities held for sale;
• loan capital increased $5.1 billion or 21% mainly due to $1.0 billion net issuance of Additional Tier 1 instruments, and $5.1 billion net issuance of Tier 2 instruments, partly offset by $1.0 billion foreign currency translation and fair value hedging impacts;
• liabilities held for sale as at 30 September 2021 comprised of businesses announced to be sold in 2021 (refer to Note 37 to the financial statements). There were no businesses classified as liabilities held for sale as at 30 September 2020; and
• all other liabilities decreased $3.4 billion or 32% due to reduction in provisions to settle the AUSTRAC civil proceedings and lower insurance related liabilities which formed part of businesses disposed and settled in second half of 2021.
Equity attributable to owners of Westpac Banking Corporation increased $4.0 billion or 6% reflecting retained profits in 2021.
Loan quality - 2021 v 2020
Housing and personal loans that were past due can be disaggregated based on days overdue as follows:
Consolidated 2021 2020$m 30-89 days 90+ days Total 30-89 days 90+ days Total
Loans
Loans - housing 5,373 5,081 10,454 2,682 7,399 10,081
Loans - personal 214 247 461 260 347 607
Total 5,587 5,328 10,915 2,942 7,746 10,688

93WESTPAC GROUP 2021 ANNUAL REPORT2 G
RO
UP
PE
RFO
RM
AN
CE
3 FINA
NC
IAL STA
TEM
EN
TS1 STR
ATE
GIC
RE
PO
RT
4 SH
AR
EH
OLD
ER
INFO
RM
ATIO
N
Review of Group operations
Capital resources
APRA measures an ADI’s regulatory capital using three measures:
• Common Equity Tier 1 Capital (CET1) comprises the highest quality components of capital that consists of paid-up share capital, retained profits and certain reserves, less certain intangible assets, capitalised expenses and software, and investments and retained profits in insurance and funds management subsidiaries that are not consolidated for capital adequacy purposes;
• Tier 1 Capital being the sum of CET1 and Additional Tier 1 Capital. Additional Tier 1 Capital comprises high quality components of capital that consist of certain securities not included in CET1, but which include loss absorbing characteristics; and
• Total Regulatory Capital being the sum of Tier 1 Capital and Tier 2 Capital. Tier 2 Capital includes subordinated instruments and other components of capital that, to varying degrees, do not meet the criteria for Tier 1 Capital, but nonetheless contribute to the overall strength of an ADI and its capacity to absorb losses.
Under APRA’s Prudential Standards, Australian ADIs, including Westpac, are required to maintain a minimum CET 1 ratio of at least 4.5%, Tier 1 Capital ratio of at least 6.0% and Total Regulatory Capital ratio of at least 8.0%. APRA may also require ADIs, including Westpac, to meet Prudential Capital Requirements (PCRs) above the industry PCRs. APRA does not allow the PCRs for individual ADIs to be disclosed.
APRA also requires ADIs to hold additional CET1 buffers comprising of:
• a capital conservation buffer (CCB) of 3.5% for ADIs designated by APRA as domestic systemically important banks (D-SIBs) unless otherwise determined by APRA, which includes a 1.0% surcharge for D-SIBs. APRA has determined that Westpac is a D-SIB; and
• a countercyclical capital buffer. The countercyclical buffer is set on a jurisdictional basis and APRA is responsible for setting the requirement in Australia. The countercyclical buffer requirement is currently set to zero for Australia and New Zealand.
Collectively, the above buffers are referred to as the Capital Buffer (CB). Should the CET1 capital ratio fall within the capital buffer range restrictions on the distributions of earnings will apply. This includes restrictions on the amount of earnings that can be distributed through dividends, Additional Tier 1 Capital distributions and discretionary staff bonuses.
APRA announcements on capital
In Second Half 2021 APRA made the following announcements relevant to their capital framework:
• On 19 July 2021 APRA announced regulatory support for banks offering temporary financial assistance to borrowers impacted by COVID-191. APRA has outlined that for eligible borrowers, ADIs do not need to treat the period of deferral as a period of arrears or loan restructuring. This applied to loans granted a repayment deferral of up to three months before the end of September 20212. ADIs must continue to provision for these loans under accounting standards.
• APRA has released the final revised standard for APS 111 Capital Adequacy: Measurement of Capital, effective from 1 January 20223. The final standard includes changes to the parent ADI’s (Level 1) treatment of equity investments in banking and insurance subsidiaries including:
– Equity investments in subsidiaries (including any Additional Tier 1 and Tier 2 capital investments in subsidiaries) will be risk weighted at 250%, up to a limit of 10% of Level 1 CET1 capital per investment; and
– Any equity investments in excess of the 10% limit will be fully deducted from Level 1 CET1 capital in determining Level 1 capital ratios.
The impact to the Group’s Level 1 ratio on a pro forma basis at 30 September 2021 is an approximate reduction of 18 basis points. There is no impact from this proposal on the calculation of the Group’s reported regulatory capital ratios on a Level 2 basis.
• APRA is proposing changes to embed the ‘unquestionably strong’ level of capital in the capital framework, including implementation of Basel III reforms4. On 21 July 2021 APRA released further guidance on capital buffers and the calculation of RWA including for specific asset classes. As part of the proposal, APRA intend to increase the capital conservation buffer from 2.5% to 4.0% and introduce a base level for the countercyclical capital buffer of 1.0%.As a result, the CET1 capital ratio requirement for D-SIBs is proposed to increase from 8% to 10.5% from 1 January 2023. We expect further clarity on the changes ahead of 1 January 2023.
Review of Group operations
1. APRA announcement – “APRA announces further regulatory support for loans impacted by COVID-19” dated 19 July 2021.2. Letter to all authorised deposit taking institutions – “Regulatory support for loans impacted by COVID-19” dated 25 August 2021.3. Letter to all authorised deposit taking institutions – “Final revised Prudential Standard: APS 111 Capital Adequacy - Measurement of
Capital” dated 5 August 2021.4. Letter to all authorised deposit taking institutions – “Bank Capital Reforms: Update” dated 21 July 2021.

94 WESTPAC GROUP 2021 ANNUAL REPORT
Review of Group operations
• On 10 September 2021, APRA announced it expects ADIs to reduce their Committed Liquidity Facility (CLF) usage to zero by 31 December 20221. Westpac’s current CLF allocation is $37 billion. Westpac expects to reduce its allocation in line with APRA’s announcement, and to meet its liquidity requirements by increasing its holdings of High Quality Liquid Assets.
Further details of regulatory changes are in the Significant Developments in Section 1 of the Annual Report.
Capital management strategy
Westpac’s approach to capital management seeks to ensure that it is adequately capitalised as an ADI. Westpac evaluates its approach to capital management through an Internal Capital Adequacy Assessment Process (ICAAP), the key features of which include:
• the development of a capital management strategy, including consideration of regulatory minimums, capital buffers and contingency plans. The current regulatory capital minimums together with the capital conservation buffer (CCB) are the Total CET1 Requirement. The Total CET1 Requirement for Westpac is at least 8.0%, based on an industry minimum CET1 requirement of 4.5% plus a capital buffer of at least 3.5% applicable to D-SIBs2,3;
• consideration of both regulatory and economic capital requirements;
• a stress testing framework that challenges the capital measures, coverage and requirements including the impact of adverse economic scenarios; and
• consideration of the perspectives of external stakeholders including rating agencies as well as equity and debt investors.
Given the above and in light of proposed changes to APRA’s capital management framework under which the CET1 capital ratio requirement for D-SIBs is to increase from 8% to 10.5% (including the capital conservation buffer and the countercyclical capital buffer), Westpac will seek to operate with a CET1 capital ratio above 10.5% as measured under the existing capital framework4. Capital settings may be reviewed if more challenging or uncertain conditions emerge, or if APRA’s proposals change significantly.
1. Letter to locally incorporated LCR authorised deposit taking institutions – Committed Liquidity Facility update dated 10 September 2021.
2. Noting that APRA may apply higher CET1 requirements for an individual ADI.3. If an ADI’s CET1 ratio falls below the Total CET1 Requirement (at least 8%), they face restrictions on the distribution of earnings, such
as dividends, distribution payments on AT1 capital instruments and discretionary staff bonuses.4. Allowing for quarterly volatility of capital ratios due to the half yearly cycle of ordinary dividend payments.

95WESTPAC GROUP 2021 ANNUAL REPORT2 G
RO
UP
PE
RFO
RM
AN
CE
3 FINA
NC
IAL STA
TEM
EN
TS1 STR
ATE
GIC
RE
PO
RT
4 SH
AR
EH
OLD
ER
INFO
RM
ATIO
N
Review of Group operations
Basel Capital Accord
APRA’s Prudential Standards are generally consistent with the International Regulatory Framework for Banks, also known as Basel III, issued by the Basel Committee on Banking Supervision (BCBS), except where APRA has exercised certain discretions. On balance, the application of these discretions acts to reduce capital ratios reported under APRA’s Prudential Standards relative to the BCBS approach and to those reported in some other jurisdictions.
Westpac is accredited by APRA to apply advanced models permitted by the Basel III global capital adequacy regime to the measurement of its regulatory capital requirements. Westpac uses the Advanced Internal Ratings Based approach for credit risk, the Advanced Measurement Approach (AMA) for operational risk and the internal model approach for Interest Rate Risk in the Banking Book (IRRBB).
Westpac’s Level 2 regulatory capital ratios as at 30 September are summarised in the table below. As the table summarises Westpac’s Level 2 regulatory capital structure, the capital amounts shown are not the same as the Westpac Group’s consolidated financial statements. Westpac’s Pillar 3 Report provides further details regarding Westpac’s capital structure.
$m 2021 2020
Common equity 70,817 67,039
Deductions from common equity (17,009) (18,306)
Total common equity after deductions 53,808 48,733
Additional Tier 1 capital 10,180 9,206
Deductions from Additional Tier 1 capital (25) -
Net Tier 1 regulatory capital 63,963 57,939
Tier 2 capital 18,766 14,052
Deductions from Tier 2 capital (361) (261)
Total Tier 2 capital after deductions 18,405 13,791
Total regulatory capital 82,368 71,730
Credit risk 357,295 359,389
Market risk 6,662 8,761
Operational risk 55,875 54,090
Interest rate risk in the banking book 11,446 9,124
Other assets 5,372 6,541
Total risk weighted assets 436,650 437,905
Common Equity Tier 1 capital ratio 12.32% 11.13%
Additional Tier 1 capital ratio 2.33% 2.10%
Tier 1 capital ratio 14.65% 13.23%
Tier 2 capital ratio 4.21% 3.15%
Total regulatory capital ratio 18.86% 16.38%

96 WESTPAC GROUP 2021 ANNUAL REPORT
Divisional performance
Divisional performance
Divisional performance – 2021 v 2020
The accounting standard AASB 8 Operating Segments requires segment results to be presented on a basis that is consistent with information provided internally to Westpac’s key decision makers. In assessing financial performance, including divisional results, Westpac Group uses a measure of performance referred to as ‘cash earnings’. Cash earnings is viewed as a measure of the level of profit that is generated by ongoing operations and is therefore typically considered in assessing distributions, including dividends. Cash earnings is neither a measure of cash flow nor net profit determined on a cash accounting basis, as it includes both cash and non-cash adjustments to net profit attributable to owners of Westpac Banking Corporation.
Management believes this allows the Group to more effectively assess performance for the current year against prior years and to compare performance across business divisions and across peer companies.
A reconciliation of cash earnings to net profit attributable to owners of Westpac Banking Corporation for each business division is set out in Note 2 to the Financial Statements.
To determine cash earnings, three categories of adjustments are made to statutory results:
• material items that key decision makers at the Westpac Group believe do not reflect the Group’s ongoingoperations;
• items that are not typically considered when dividends are recommended, mainly economic hedging impacts;and
• accounting reclassifications between individual line items that do not impact statutory results.
The discussion of our divisional performance in this section is presented on a cash earnings basis unless otherwise stated. Cash earnings is not directly comparable to statutory results presented in other parts of this Annual Report.
On 17 March 2021, Westpac announced that it was bringing together the leadership of its Consumer and Business divisions into a new Consumer and Business Banking division. No change has been made for the 2021 Annual Report as these changes are not yet reflected in the internal reporting to Westpac’s key decision makers.
Outlined below are the cash earnings adjustments to the reported result:
• fair value (gain)/loss on economic hedges (which do not qualify for hedge accounting under AAS) comprise:
– the unrealised fair value (gain)/loss on hedges of accrual accounted term funding transactions are reversedin deriving cash earnings as they may create a material timing difference on reported results but do notaffect the Group’s earnings over the life of the hedge; and
– the unrealised fair value (gain)/loss on foreign exchange hedges of future New Zealand earnings impactingnon-interest income is reversed in deriving cash earnings as they may create a material timing difference onreported results but do not affect the Group’s earnings over the life of the hedge;
• ineffective hedges: The unrealised (gain)/loss on ineffective hedges is reversed in deriving cash earningsbecause the gain or loss arising from the fair value movement in these hedges reverses over time and does notaffect the Group’s profits over time;
• adjustment related to Pendal: Westpac disposed of its holdings in 2020. As a result, no further adjustments willbe recognised in future years. In prior years this item was treated as a cash earnings adjustment given its sizeand that it did not reflect ongoing operations;
• Treasury shares: Treasury shares held by the Group in managed funds and life businesses were disposed of in2020; and
• accounting reclassifications between individual line items that do not impact reported results comprise:
– operating leases: Under AAS rental income on operating leases is presented gross of the depreciation ofthe assets subject to the lease. These amounts are offset in deriving non-interest income and operatingexpenses on a cash earnings basis; and
– policyholder tax recoveries: Income and tax amounts that are grossed up to comply with the AAS coveringLife Insurance Business (policyholder tax recoveries) are reversed in deriving income and taxation expenseon a cash earnings basis.
The guidance provided in Australian Securities and Investments Commission (ASIC) Regulatory Guide 230 has been followed when presenting this information.

97WESTPAC GROUP 2021 ANNUAL REPORT2 G
RO
UP
PE
RFO
RM
AN
CE
3 FINA
NC
IAL STA
TEM
EN
TS1 STR
ATE
GIC
RE
PO
RT
4 SH
AR
EH
OLD
ER
INFO
RM
ATIO
N
Divisional performance
Cash earnings by division
The following table presents, for each of the key divisions of our business, the cash earnings at the end of the financial years ended 30 September 2021, 2020 and 2019. Refer to Note 2 to the financial statements for the disclosure of our geographic and business segments and the reconciliation to net profit attributable to owners of Westpac Banking Corporation.
$m 2021 2020 2019
Consumer 3,081 2,746 3,116
Business 1,789 734 1,946
Westpac Institutional Bank (670) 332 925
Westpac New Zealand 950 612 985
Specialist Businesses 193 (506) 712
Group Businesses 9 (1,310) (835)
Total cash earnings 5,352 2,608 6,849
In presenting divisional results on a management reporting basis, internal charges and transfer pricing adjustments are included in the performance of each division reflecting the management structure rather than the legal entity (these results cannot be compared to results for individual legal entities). Where management reporting structures or accounting classifications have changed, financial results for comparative years have been revised and may differ from results previously reported.
Our internal transfer pricing frameworks facilitate risk transfer, profitability measurement, capital allocation and business unit alignment, tailored to the jurisdictions in which we operate. Transfer pricing allows us to measure the relative contribution of our products and divisions to the Group’s interest margin and other dimensions of performance. Key components of our transfer pricing frameworks are funds transfer pricing for interest rate and liquidity risk and allocation of basis and contingent liquidity costs, including capital allocation.

98 WESTPAC GROUP 2021 ANNUAL REPORT
Divisional performance
Over recent years, a number of large items have impacted results. These items do not include COVID-19 impacts despite the significant effect on our results this year. These can be divided into four categories:
CategoryCash earnings
impact FY21 $m Detail
1. Provisions and costs related to the AUSTRAC proceedings
- • There were no costs or provisions associated with the AUSTRAC proceedings in 2021, these proceedings were settled in 2020.
2. Provisions for estimated customer refunds and repayments, associated costs and litigation costs
$448 million reduction
• Additional provisions for estimated customer refunds in 2021 included:
– fees paid to aligned and salaried advisors;
– customer remediation in Westpac New Zealand;
– some customers on our platforms who were not advised of certain corporate actions; partly offset by
– release of provisions for business customers provided with a business loan instead of a consumer loan regulated by the National Consumer Credit Protection Act and National Credit Code.
• Additional costs for our remediation program.
• Costs of litigation matters, including to resolve outstanding investigations should a regulator decide to bring civil penalty proceeding.
• Costs associated with ending the Group’s service agreement with IOOF.
3. The write-down of assets, including goodwill and capitalised software
$1,164 million reduction
• Write-down of assets in WIB following an annual impairment test as the value of WIB’s forward cash flows no longer supported the carrying value of these assets. This was partly due to reducing risk in the division through the exit of energy trading, consolidating our Asian operations and reducing our correspondent banking relationships which have all impacted earnings. At the same time, medium term expectations of prolonged low interest rates, subdued financial markets income and elevated compliance expenses have impacted WIB’s earnings outlook. The pre-tax impact of assets written down included goodwill ($487 million), capitalised software ($344 million) and other assets, mostly property leases ($325 million).
• Write-down and impairment of capitalised software balances.
• Write-down of goodwill in the Group’s Lenders Mortgage Insurance business as part of its sale.
4. The impact of asset sales and revaluations
$11 million benefit
• Gain on the divestment of the Group’s stake in Coinbase Inc. (Coinbase)held in the Reinventure fund 1 of $283 million (after tax), along with an additional gain on the sale of our holding in Zip Co Limited.
• Gain on sale of Westpac General Insurance.
• Post-sale adjustments from earn out payments associated with the sale of the Group’s Vendor Finance business.
• Separation and transaction costs along with a deferred tax asset write-off related to the agreed sale of Westpac Life Insurance Services Limited (WLIS).
• Write-down of assets associated with Westpac Pacific as the division was held for sale during First Half 2021.
• Other costs associated with the divestment of the Group’s Specialist Businesses.

99WESTPAC GROUP 2021 ANNUAL REPORT2 G
RO
UP
PE
RFO
RM
AN
CE
3 FINA
NC
IAL STA
TEM
EN
TS1 STR
ATE
GIC
RE
PO
RT
4 SH
AR
EH
OLD
ER
INFO
RM
ATIO
N
Divisional performance
$mAUSTRAC
proceedings
Refunds, payments, costs, and litigation
Write-downs of
intangibles
Asset sales and
revaluations Total
2021
Net interest income - 131 - (4) 127
Net fee income - (137) - - (137)
Net wealth management and insurance income - (106) - - (106)
Trading income - - - - -
Other income - (4) - 764 760
Non-interest income - (247) - 764 517
Staff expenses - (116) - (175) (291)
Occupancy expenses - - (232) (43) (275)
Technology expenses - (3) (579) (68) (650)
Other expenses - (352) (594) (185) (1,131)
Operating expenses - (471) (1,405) (471) (2,347)
Profit before impairment charges and income tax expense - (587) (1,405) 289 (1,703)
Tax and NCI - 139 241 (278) 102
Cash earnings - (448) (1,164) 11 (1,601)
2020
Net interest income - (143) - - (143)
Net fee income - (88) - - (88)
Net wealth management and insurance income - (121) - (357) (478)
Trading income - - - - -
Other income - - - 303 303
Non-interest income - (209) - (54) (263)
Staff expenses - (123) - (3) (126)
Occupancy expenses - - - - -
Technology expenses - (4) (161) (4) (169)
Other expenses (1,478) (147) (507) (112) (2,244)
Operating expenses (1,478) (274) (668) (119) (2,539)
Profit before impairment charges and income tax expense (1,478) (626) (668) (173) (2,945)
Tax and NCI 36 186 54 50 326
Cash earnings (1,442) (440) (614) (123) (2,619)
2019
Net interest income - (344) - - (344)
Net fee income - (283) - - (283)
Net wealth management and insurance income - (537) - - (537)
Trading income - - - - -
Other income - - - 83 83
Non-interest income - (820) - 83 (737)
Staff expenses - (99) - (169) (268)
Occupancy expenses - - - - -
Technology expenses - (11) - (24) (35)
Other expenses - (110) - (48) (158)
Operating expenses - (220) - (241) (461)
Profit before impairment charges and income tax expense - (1,384) - (158) (1,542)
Tax and NCI - 426 - 69 495
Cash earnings - (958) - (89) (1,047)

100 WESTPAC GROUP 2021 ANNUAL REPORT
Divisional performance
A number of large items impacted 2021, 2020 and 2019 results. The impact to net interest income, non-interest income and operating expenses is summarised below.
2021
Net interest income increased by $127 million as some customer remediation provisions were no longer required for business customers that were not provided regulated consumer loans. These provision releases were partly offset by additional provisions for customer remediation in Westpac New Zealand.
Non-interest income increased by $517 million and comprised:
• a $760 million benefit to other income from a gain on our stake in Coinbase, the gain on sale of Westpac General Insurance, post-sale earn out payments from the sale of Vendor Finance and a small gain from finalising the sale of our holding in Zip Co Limited; partly offset by
• a $137 million reduction to net fee income for additional provisions related to salaried advice remediation and for some customers on our platforms who were not advised of certain corporate actions; and
• a $106 million reduction to net wealth management and insurance income for additional provisions for aligned dealer group advice remediation.
Operating expenses increased by $2,347 million in 2021 and comprised:
• staff expenses of $291 million for implementation of our remediation program, and separation costs related to the sale of WLIS;
• occupancy expenses of $275 million related to the write-down of WIB property leases and from the write-down of assets in Westpac Pacific;
• technology expenses of $650 million mainly from the write-down and impairment of capitalised software, the majority of which was associated with WIB, and costs related to the sale of WLIS; and
• other expenses of $1,131 million including;
– the write-down of goodwill in WIB following annual impairment testing along with goodwill in Westpac Lenders Mortgage Insurance and other assets in Westpac Pacific;
– Reinventure performance fees paid that were linked to the divestment of Coinbase; and
– other costs linked to completing our remediation programs and litigation matters.
Income tax expense and NCI reduced by $102 million. This was mainly from the tax benefit from certain large items discussed above recognised in operating expenses, partly offset by higher tax from the divestment of Coinbase, the sale of Westpac General Insurance and the write-off of a deferred tax asset in WLIS.
2020
Net interest income reduced by $143 million from an increase in provisions for Business customers that were provided business loans but should have been provided regulated consumer loans, partly offset by the release of provisions no longer required for interest only loans that did not automatically switch, when required, to principal and interest loans.
Non-interest income reduced by $263 million from:
• a reduction to net fee income of $88 million for provisions for some customers on our platforms who were not advised of certain corporate actions;
• A $478 million reduction of net wealth management and insurance income from the write-off of intangibles including insurance liabilities and deferred acquisition costs associated with WLIS and provisions for aligned dealer group advice remediation; partly offset by
• A $303 million benefit to other income from a revaluation gain related to the divestment of the Group’s stake in Zip Co Limited.
Operating expenses increased by $2,539 million in 2020 and comprised:
• staff expenses of $126 million for implementation of our remediation program;
• technology expenses of $169 million from the write-down of capitalised software; and
• other expenses of $2,244 million including costs associated with the AUSTRAC matter (including a $1.3 billion penalty), the write-down of goodwill for WLIS and the Group’s Auto business, an accounting loss on sale of our Vendor Finance business, and costs linked to our remediation programs and litigation.
Income tax expense and NCI reduced by $326 million from the tax benefit of the above items (excluding penalties and goodwill write-downs that were non-deductible), partly offset by tax on the revaluation gain associated with the divestment of Zip Co Limited.

101WESTPAC GROUP 2021 ANNUAL REPORT2 G
RO
UP
PE
RFO
RM
AN
CE
3 FINA
NC
IAL STA
TEM
EN
TS1 STR
ATE
GIC
RE
PO
RT
4 SH
AR
EH
OLD
ER
INFO
RM
ATIO
N
Divisional performance
2019
Net interest income reduced by $344 million, mainly from an increase in provisions for customer interest only loans that did not automatically switch, when required, to principal and interest loans along with provisions for Business customers that were provided business loans but should have been provided regulated consumer loans.
Non-interest income reduced by $737 million from:
• a reduction to net fee income of $283 million from provisions related to salaried advice remediation;
• a $537 million reduction of net wealth management and insurance income as we raised provisions for aligned dealer group advice remediation; partly offset by
• an $83 million benefit to other income from gains on sale associated with the divestment of the Group’s holding in Paymark and the sale of a Sydney CBD property.
Operating expenses increased by $461 million in 2019 and comprised:
• staff expenses of $268 million, mainly related to the Group’s decision to exit Financial Advice along with costs associated with advice remediation programs;
• technology expenses of $35 million also related to the exit of Financial advice and advice remediation programs; and
• other expenses of $158 million related to the exit of Financial advice along with costs for completing our remediation programs and litigation matters.
Income tax expense was reduced by $495 million reflecting the tax benefit of the above items.

102 WESTPAC GROUP 2021 ANNUAL REPORT
Divisional performance
Westpac WestpacInstitutional New Zealand Specialist Group
$m Consumer Business Bank ($A) Businesses Businesses Group
2021
Net interest income 3 177 - (35) (18) - 127
Net fee income (3) 1 - (12) 8 (131) (137)
Net wealth management and insurance income - - - - (4) (102) (106)
Trading income - - - - - - -
Other income - - - 1 195 564 760
Non-interest income (3) 1 - (11) 199 331 517
Operating expenses (136) (59) (1,193) (23) (640) (296) (2,347)
Profit before impairment charges and income tax expense (136) 119 (1,193) (69) (459) 35 (1,703)
Tax and NCI 36 (39) 202 17 (81) (33) 102
Cash earnings (100) 80 (991) (52) (540) 2 (1,601)
2020
Net interest income 5 (141) - (7) - - (143)
Net fee income 4 2 - (7) (7) (80) (88)
Net wealth management and insurance income - - - - (402) (76) (478)
Trading income -
Other income - - - - - 303 303
Non-interest income 4 2 - (7) (409) 147 (263)
Operating expenses (64) (130) - 1 (694) (1,652) (2,539)
Profit before impairment charges and income tax expense (55) (269) - (13) (1,103) (1,505) (2,945)
Tax and NCI 16 81 - 4 181 44 326
Cash earnings (39) (188) - (9) (922) (1,461) (2,619)
2019
Net interest income (85) (246) - (13) - - (344)
Net fee income (2) (12) - (4) (43) (222) (283)
Net wealth management and insurance income - - - - - (537) (537)
Trading income - - - - - - -
Other income - - - 38 3 42 83
Non-interest income (2) (12) - 34 (40) (717) (737)
Operating expenses 25 (57) - (15) (30) (384) (461)
Profit before impairment charges and income tax expense (62) (315) - 6 (70) (1,101) (1,542)
Tax and NCI 29 95 - 9 23 339 495
Cash earnings (33) (220) - 15 (47) (762) (1,047)

103WESTPAC GROUP 2021 ANNUAL REPORT2 G
RO
UP
PE
RFO
RM
AN
CE
3 FINA
NC
IAL STA
TEM
EN
TS1 STR
ATE
GIC
RE
PO
RT
4 SH
AR
EH
OLD
ER
INFO
RM
ATIO
N
Divisional performance
Consumer
Consumer provides banking products, including mortgages, credit cards, personal loans, and savings and deposit products to consumers in Australia. Products are provided under the Westpac, St.George, BankSA, Bank of Melbourne, and RAMS brands. Consumer works with the other operating divisions in Australia in the sales, service, and referral of certain specialist financial services such as auto lending and foreign exchange.
Financial performance
$m 2021 2020 2019
Net interest income 8,405 8,547 8,130
Non-interest income 488 573 695
Net operating income before operating expenses and impairment (charges)/benefits 8,893 9,120 8,825
Operating expenses (4,622) (4,176) (3,794)
Impairment (charges)/benefits 125 (1,015) (582)
Profit before income tax expense 4,396 3,929 4,449
Income tax expense (1,315) (1,183) (1,333)
Cash earnings 3,081 2,746 3,116
Net cash earnings adjustments - - -
Net profit attributable to owners of WBC 3,081 2,746 3,116
$bn
Deposits and other borrowings 235.6 219.3 207.6
Net loans 407.8 389.8 399.3
Total assets 415.7 398.3 407.0
Total operating expenses to net operating income ratio 51.97% 45.79% 42.99%
2021 v 2020
Cash earnings of $3,081 million were $335 million or 12% higher than 2020 mostly due to an impairment benefit in Full Year 2021 compared to an impairment charge in Full Year 2020, partly offset by lower operating income and higher expenses.
Net interest income down $142 million, 2%
• Net loans were 5% (or $18.0 billion) higher over the year, with a 5% (or $19.1 billion)increase in mortgages partly offset by a $1.4 billion decline in other personal lending;
• Deposits increased 7% (or $16.3 billion), with growth in at call and offset accounts; and
• Net interest margin was 3 basis points lower from competitive pricing to attract andretain customers, portfolio mix effects in mortgages, as well as lower other personallending. These declines were partly offset by mix benefits in deposits (switching fromterm deposits to at call) and repricing.
Non-interest income down $85 million, 15%
• Removal of certain fees as part of our simplification strategy; and
• COVID-19 restrictions have reduced activity contributing to lower foreign currencytransaction fees and lower net ATM fees.
Operating expenses up $446 million, 11%
• The increase in expenses was mostly due to higher spend on risk and complianceprograms, including financial crime, fraud prevention and the CORE program.Additional resources to support customers in particular those experiencing hardshipand increased mortgage processing costs from higher volumes as well as from bringingjobs onshore also contributed to the increase; and
• Rationalisation of a further 80 branches and 129 ATMs, and the increased use of digitalchannels partly offset the increase in expenses. FTE was 3% lower over the year.
Impairment benefit of $125 million versus impairment charge of $1,015 million
• Impairment benefit was due to large collectively assessed provisions booked in 2020that were no longer required, including from better credit quality metrics and animproved economic outlook; and
• Mortgage 90+ day delinquencies were down 54 basis points to 1.06%, predominantlyfrom lower hardship. Other consumer 90+ day delinquencies were relatively flat (down1 basis point) with improving credit quality metrics partly offset by a decline in otherpersonal lending.

104 WESTPAC GROUP 2021 ANNUAL REPORT
Divisional performance
Business
Business provides banking products for Australian SME and Commercial businesses (including Agribusiness) generally up to $200 million in exposure. The division also includes Private Wealth, meeting the personal banking needs of high net worth individuals. The division offers a wide range of banking products and services to support customers’ borrowing, savings and transaction needs. Specialist services including cash flow finance, trade finance, equipment finance and property finance are also provided. Business operates under the Westpac, St.George, BankSA, and Bank of Melbourne brands. Business works with the other operating divisions for select products and services including financial risk management products, corporate superannuation and mortgages.
Financial performance $m 2021 2020 2019
Net interest income 4,065 4,163 4,456
Non-interest income 549 560 594
Net operating income before operating expenses and impairment (charges)/benefits 4,614 4,723 5,050
Operating expenses (2,530) (2,298) (2,094)
Impairment (charges)/benefits 484 (1,371) (172)
Profit before income tax expense 2,568 1,054 2,784
Income tax expense (779) (320) (838)
Cash earnings 1,789 734 1,946
Net cash earnings adjustments - - -
Net profit attributable to owners of WBC 1,789 734 1,946
$bn
Deposits and other borrowings 158.7 151.9 142.6
Net loans 134.0 140.7 146.9
Total assets 138.5 145.8 151.6
Total operating expenses to net operating income ratio 54.83% 48.66% 41.47%
2021 v 2020
Cash earnings of $1,789 million were $1,055 million higher than 2020. Most of the improvement was due to a turnaround in impairment charges with a benefit of $484 million compared to an impairment charge of $1,371 million in 2020. This was partly offset by lower operating income and an increase in expenses mostly to support an uplift in the division’s risk capability.
Net interest income down $98 million, 2%
• Net interest income benefited from the write-back of provisions related to customer refunds and payments ($177 million), while in Full Year 2020 this was a charge of $141 million. Excluding this impact, net interest income was down $416 million (or 10%);
• Net loans declined by 5% (or $6.7 billion) due mostly to lower mortgages and a 4% decline in business lending. Business lending was lower across most sectors with the largest decline in professional services;
• Deposits were up 4% (or $6.8 billion) over the year with a 19% (or $19.2 billion) rise in at call balances supported by government stimulus packages while term deposit balances declined by 24% (or $12.4 billion) reflecting a shift in customer preference; and
• Net interest margin improved 13 basis points. Excluding the benefit from the provision write-back noted above, the net interest margin was 11 basis points lower. This was mostly from lower loan spreads due to competitive pricing and special low interest rates on certain products as part of our COVID-19 support. This was partly offset by higher deposit spreads from repricing and portfolio mix benefit.
Non-interest income down $11 million, 2%
• Most of the decline reflected lower activity due to COVID-19 restrictions. Lending fees were also down from lower new lending.
Operating expenses up $232 million, 10%
• The increase was due to higher spend on risk and compliance programs including financial crime, fraud prevention, and our CORE program. Costs were also higher from an increase in front line risk capability including additional bankers; and
• Partly offset by a decline in costs associated with customer remediation and payments.
Impairment benefit of $484 million compared to an impairment charge of $1,371 million
• Impairment benefit was due to additional collectively assessed provisions booked in 2020 that were no longer required, including from better credit quality metrics and an improved economic outlook; and
• Stressed exposures to TCE decreased 78 basis points to 3.92% mostly from lower watchlist exposures.

105WESTPAC GROUP 2021 ANNUAL REPORT2 G
RO
UP
PE
RFO
RM
AN
CE
3 FINA
NC
IAL STA
TEM
EN
TS1 STR
ATE
GIC
RE
PO
RT
4 SH
AR
EH
OLD
ER
INFO
RM
ATIO
N
Divisional performance
Westpac Institutional Bank
Westpac Institutional Bank (WIB) delivers a broad range of financial products and services to corporate, institutional and government customers operating in, or with connections to, Australia and New Zealand. WIB operates through dedicated industry relationship and specialist product teams, with expert knowledge in financing, transactional banking, and financial and debt capital markets. Customers are supported throughout Australia and via branches and subsidiaries located in New Zealand, the US, the UK and Asia. WIB works with all the Group’s operating divisions in the provision of markets’ related financial needs including foreign exchange and fixed interest solutions.
Financial performance
$m 2021 2020 2019
Net interest income 919 1,111 1,337
Non-interest income 1,102 1,182 1,195
Net operating income before operating expenses and impairment (charges)/benefits 2,021 2,293 2,532
Operating expenses (2,574) (1,316) (1,220)
Impairment (charges)/benefits (162) (404) (31)
Profit before income tax expense (715) 573 1,281
Income tax expense 45 (241) (356)
Cash earnings (670) 332 925
Net cash earnings adjustments - - -
Net profit attributable to owners of WBC (670) 332 925
$bn $bn $bn
Deposits and other borrowings 97.8 102.9 99.0
Net loans 67.0 66.2 73.6
Total assets 82.1 75.5 95.0
Total operating expenses to net operating income ratio 127.36% 57.39% 48.18%

106 WESTPAC GROUP 2021 ANNUAL REPORT
Divisional performance
2021 v 2020
Cash earnings were a loss of $670 million for 2021 compared to a profit of $332 million in 2020. This was mostly due to write-down of assets (goodwill, capitalised software and other assets) following their annual impairment test, which reduced cash earnings by $991 million. Excluding this impact, cash earnings for 2021 were $321 million, 3% or $11 million lower than 2020. A 9 basis point decline in net interest margin, lower income from exiting certain businesses and fee and product simplification were largely offset by a reduction in impairment charges.
Net interest income down $192 million, 17%
• Net loans increased $0.8 billion, or 1%. Higher onshore balances (up $4.8 billion) from an increase in new lending and higher utilisation of structured finance facilities, were partly offset by a $4.0 billion decrease in offshore lending, primarily in Asia, as the division began consolidating its operations;
• Deposits reduced $5.1 billion, or 5%. Offshore deposits were $3.9 billion lower, mostly from the decision to consolidate our operations in Asia. Disciplined pricing and customers seeking higher yield in the low interest rate environment contributed to the decline in onshore deposits; and
• Net interest margin declined 9 basis points to 1.26% with lower interest rates reducing deposit spreads and earnings on capital. This was partly offset by more disciplined lending and deposit pricing, and benefits from changes in the lending and deposit mix.
Non-interest income down $80 million, 7%
• Excluding the impact of derivative valuation adjustments (a $174 million positive movement), non-interest income was down $254 million over the year;
• Lower non-customer Markets income ($219 million) across foreign exchange and commodities including from the closure of the energy desk along with lower customer Markets income ($64 million) from reduced foreign exchange sales and a decline in income in Asia; and
• Payments revenue declined from the impact of exiting certain correspondent banking relationships. This was partly offset by higher loan fees from an increase in undrawn balances.
Operating expenses up $1,258 million, 96%
• The write-down of assets following their annual impairment test increased expenses $1,156 million. Excluding this impact, expenses were increased $65 million (or 5%) with most of the increase due to higher risk and compliance costs, and higher software amortisation expenses; and
• Partly offset by productivity benefits from the consolidation of international operations, product and process simplification, and operating model changes. FTE was 6% lower over the year.
Impairment charges down $242 million, 60%
• Lower impairment charge was due to a higher collectively assessed provision benefit from better credit quality metrics and the improved economic outlook partly offset by a large individually assessed provision related to a fraud; and
• Stressed exposures to TCE of 0.64%, down 39 basis points compared to September 2020, mainly due to upgrades in watchlist facilities.
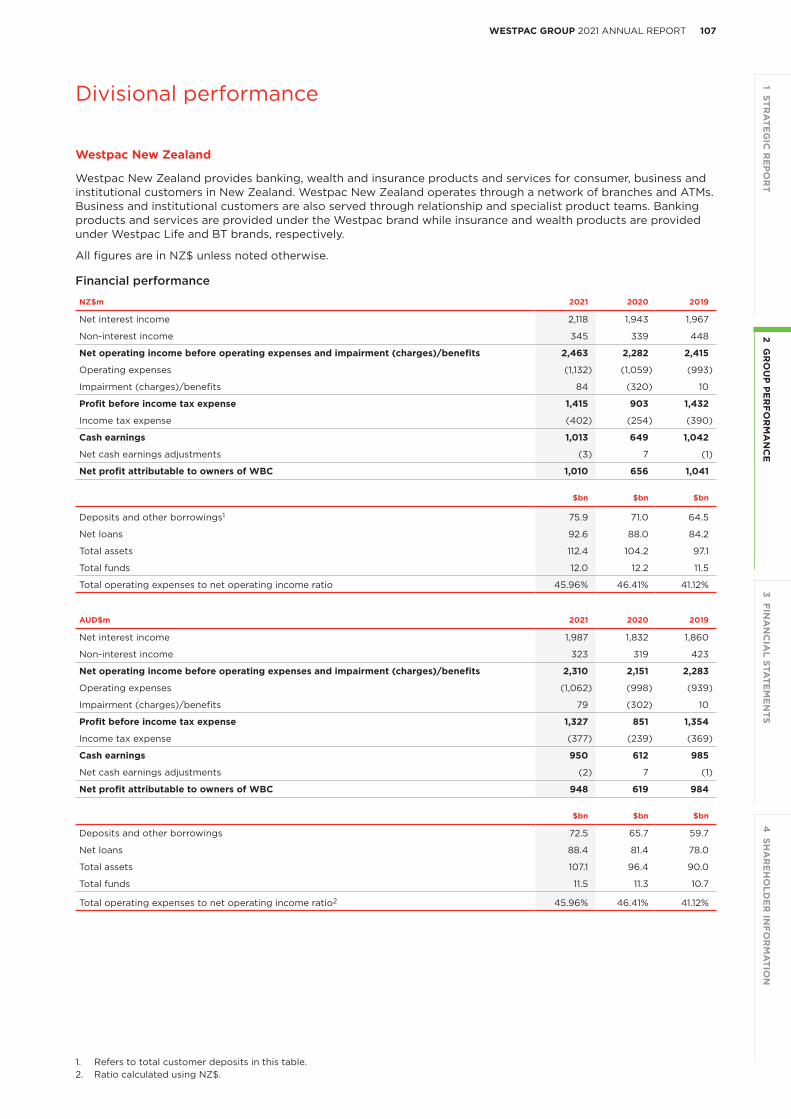
107WESTPAC GROUP 2021 ANNUAL REPORT2 G
RO
UP
PE
RFO
RM
AN
CE
3 FINA
NC
IAL STA
TEM
EN
TS1 STR
ATE
GIC
RE
PO
RT
4 SH
AR
EH
OLD
ER
INFO
RM
ATIO
N
Divisional performance
Westpac New Zealand
Westpac New Zealand provides banking, wealth and insurance products and services for consumer, business and institutional customers in New Zealand. Westpac New Zealand operates through a network of branches and ATMs. Business and institutional customers are also served through relationship and specialist product teams. Banking products and services are provided under the Westpac brand while insurance and wealth products are provided under Westpac Life and BT brands, respectively.
All figures are in NZ$ unless noted otherwise.
Financial performance
NZ$m 2021 2020 2019
Net interest income 2,118 1,943 1,967
Non-interest income 345 339 448
Net operating income before operating expenses and impairment (charges)/benefits 2,463 2,282 2,415
Operating expenses (1,132) (1,059) (993)
Impairment (charges)/benefits 84 (320) 10
Profit before income tax expense 1,415 903 1,432
Income tax expense (402) (254) (390)
Cash earnings 1,013 649 1,042
Net cash earnings adjustments (3) 7 (1)
Net profit attributable to owners of WBC 1,010 656 1,041
$bn $bn $bn
Deposits and other borrowings1 75.9 71.0 64.5
Net loans 92.6 88.0 84.2
Total assets 112.4 104.2 97.1
Total funds 12.0 12.2 11.5
Total operating expenses to net operating income ratio 45.96% 46.41% 41.12%
AUD$m 2021 2020 2019
Net interest income 1,987 1,832 1,860
Non-interest income 323 319 423
Net operating income before operating expenses and impairment (charges)/benefits 2,310 2,151 2,283
Operating expenses (1,062) (998) (939)
Impairment (charges)/benefits 79 (302) 10
Profit before income tax expense 1,327 851 1,354
Income tax expense (377) (239) (369)
Cash earnings 950 612 985
Net cash earnings adjustments (2) 7 (1)
Net profit attributable to owners of WBC 948 619 984
$bn $bn $bn
Deposits and other borrowings 72.5 65.7 59.7
Net loans 88.4 81.4 78.0
Total assets 107.1 96.4 90.0
Total funds 11.5 11.3 10.7
Total operating expenses to net operating income ratio2 45.96% 46.41% 41.12%
1. Refers to total customer deposits in this table.2. Ratio calculated using NZ$.

108 WESTPAC GROUP 2021 ANNUAL REPORT
Divisional performance
2021 v 2020
Cash earnings of NZ$1,013 million increased NZ$364 million or 56% compared to 2020, primarily driven by a $404 million turnaround in impairment charges. Net operating income before impairment (charges)/benefits was also higher from a 3 basis point increase in net interest margin and balance sheet growth partly offset by higher expenses.
Net interest income up NZ$175 million, 9%
• Provisions for customer refunds and payments reduced net interest income by NZ$29 million, excluding this, net interest income increased NZ$204 million or 10%;
• Net loans increased 5%, or NZ$4.6 billion, with NZ$5.7 billion of mortgage growth partly offset by NZ$0.9 billion decrease in business loans as institutional customers reduced their gearing;
• Deposits increased 7% or NZ$4.9 billion, fully funding loan growth and lifting the deposit to loan ratio to 82%. Growth was in at call accounts across businesses and households. Term deposits were lower as retail customers preferred to retain funds in at call accounts; and
• Net interest margin increased 3 basis points (5 basis points higher excluding customer refunds and payments) mostly from higher deposit spreads due to repricing and portfolio mix (more funds in at call) and lower funding costs. This was partly offset by lower mortgage spreads and the impact of changes in the portfolio mix (decline in personal lending). Higher holdings of liquid assets also reduced margin.
Non-interest income up NZ$6 million, 2%
• Non-interest income increased NZ$12 million mostly from a gain on sale of the Wealth Advisory business (NZ$8 million). This was partly offset by an increase in provisions for customer refunds and payments.
Operating expenses up NZ$73 million, 7%
• Costs related to the announced sale of Westpac-NZ-Life, write down of intangible asset and costs associated with managing customer remediation programs increased expenses NZ$24 million; and
• Excluding this impact, expenses increased NZ$49 million primarily due to increased spend on technology, risk, regulatory and compliance projects (including compliance with RBNZ’s BS11 Outsourcing Policy and Section 95 requirements on liquidity and risk governance). The number of FTE increased by 476 during the year.
Impairment benefit of NZ$84 million compared to an impairment charge of NZ$320 million
• Impairment benefit of $84 million was mostly due to a collectively assessed provision benefit as provisions booked in 2020 were no longer required consistent with better credit quality metrics and the improved economic outlook; and
• Stressed exposures to TCE of 1.19% were down 40 basis points. The decline was due to a reduction in lower rated business facilities and lower mortgage 90+ day delinquencies which were down 22 basis points.

109WESTPAC GROUP 2021 ANNUAL REPORT2 G
RO
UP
PE
RFO
RM
AN
CE
3 FINA
NC
IAL STA
TEM
EN
TS1 STR
ATE
GIC
RE
PO
RT
4 SH
AR
EH
OLD
ER
INFO
RM
ATIO
N
Divisional performance
Specialist Businesses
Specialist Businesses comprises the businesses that Westpac ultimately plans to exit with agreements in place for the sale of Westpac Life Insurance and motor vehicle dealer finance and novated leasing businesses. These sales are expected to finalise in 2022, subject to regulatory approvals. During the year, Westpac finalised the sales of Westpac General Insurance, Vendor Finance and Westpac Lenders Mortgage Insurance. Other operations include investment product and services (including margin lending and equities broking), superannuation and retirement products as well as wealth administration platforms. The division also manages Westpac Pacific which provides a full range of banking services in Fiji and Papua New Guinea. The division operates under the Westpac, St.George, BankSA, Bank of Melbourne, and BT brands. Specialist Businesses works with Consumer, Business and WIB in the provision of select financial services and products. Businesses where an agreement is in place for sale are treated as held for sale assets and the contribution of those businesses are included in Specialist Businesses results. Details of the cash earnings contribution of these businesses are shown within this section.
$m 2021 2020 2019
Net interest income 503 534 555
Non-interest income 1,490 762 1,412
Net operating income before operating expenses and impairment (charges)/benefits 1,993 1,296 1,967
Operating expenses (1,477) (1,548) (847)
Impairment (charges)/benefits 66 (255) (111)
Profit before income tax expense 582 (507) 1,009
Income tax expense (387) 3 (292)
Profit attributable to NCI (2) (2) (5)
Cash earnings 193 (506) 712
Net cash earnings adjustments - (31) (45)
Net profit attributable to owners of WBC 193 (537) 667
$bn $bn $bn
Deposits and other borrowings 11.0 9.3 9.3
Net loans1 13.6 14.9 17.2
Total assets 15.5 22.8 31.1
Total funds 227.4 193.0 207.2
Total operating expenses to net operating income ratio 74.11% 119.44% 43.06%
1. Include loans classified as asset held for sale.

110 WESTPAC GROUP 2021 ANNUAL REPORT
Divisional performance
2021 vs 2020
Cash earnings for 2021 were $193 million compared to a loss of $506 million in 2020. The division’s cash earnings in 2021 and 2020 have been impacted by expenses associated with the sales and revaluations of businesses either sold or held for sale, and customer refunds, payments, litigation and associated costs. These have been partly offset by gains on sales. In 2021 these items reduced cash earnings by $540 million and in 2020 by $922 million. Excluding the impact of these significant items cash earnings increased $317 million over the year, with higher insurance income, and an impairment benefit of $66 million compared to an impairment charge of $255 million in 2020 the key drivers of the improved underlying performance.
Earnings were also impacted by the sale of Westpac General Insurance (July 2021), Vendor Finance (July 2021) and Westpac Lenders Mortgage Insurance (August 2021).
Net interest income down $31 million, 6%
• Provisions for customer refunds and payments reduced net interest income $18 million. Excluding this impact, net interest income decreased $13 million or 2%;
• Net loans decreased 9% (or $1.3 billion) with $0.3 billion due the sale of Vendor Finance in July 2021. Auto Finance and Westpac Pacific lending were also lower reflecting reduced demand;
• Deposits increased 18% (or $1.7 billion) mostly from the migration of funds from legacy platforms to Panorama; and
• Net interest margin was up 14 basis points mostly from the roll off of interest rate reductions related to COVID-19 support. Net interest margin also increased following a reversal of provisions that were no longer required.
Non-interest income up $728 million, 96%
• Non-interest income benefited from a gain on the sale of Westpac General Insurance and from a reduction in customer refunds and payments and the non-repeat of losses associated with revaluations of insurance liabilities. Excluding these items, non-interest income increased $120 million or 10%;
• Insurance income was up $180 million or 61% from:
– LMI contribution was higher from growth in mortgages and lower claims;
– GI revenue was higher from a reduction in severe weather event claims; and
– Life Insurance revenue was higher with favourable valuation movements in life insurance policyholder liabilities from changes in the discount rate partly offset by exiting Group Life, higher claims, and higher reinsurance costs.
• Superannuation, Platforms and Investments contribution was down $19 million or 3% mostly from platform and superannuation pricing changes and the migration of customers from legacy platforms to Panorama. Revenue from managed cash balances was also lower; and
• Banking income was down $41 million or 29% mostly from lower activity, including lower revenue in Westpac Pacific from the impact of COVID-19 restrictions on tourism and associated merchant fees and foreign exchange income.
Operating expenses down $71 million, 5%
• Expenses associated with the write-down of goodwill and other intangible assets in 2021 were $54 million lower than 2020. Excluding these items, expenses were $17 million or 2% lower; and
• The decrease was due to lower project spend and benefits from organisational redesign.
Impairment benefit of $66 million compared to an impairment charge of $255 million
• Impairment benefit from lower collectively assessed provisions driven by improving credit quality metrics and the better economic outlook; and
• Auto 90+ day delinquencies were 1.97%, down 83 basis points, from lower hardship volumes and a focus on reducing long-overdue accounts.
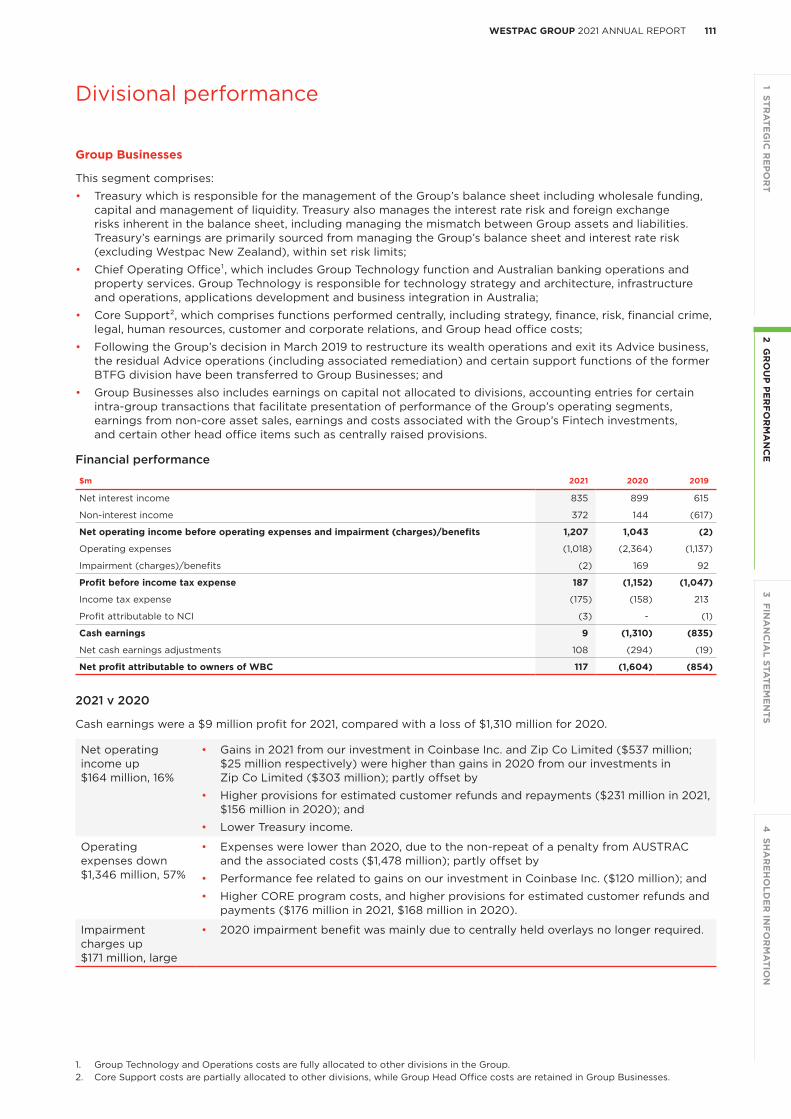
111WESTPAC GROUP 2021 ANNUAL REPORT2 G
RO
UP
PE
RFO
RM
AN
CE
3 FINA
NC
IAL STA
TEM
EN
TS1 STR
ATE
GIC
RE
PO
RT
4 SH
AR
EH
OLD
ER
INFO
RM
ATIO
N
Divisional performance
Group Businesses
This segment comprises:
• Treasury which is responsible for the management of the Group’s balance sheet including wholesale funding, capital and management of liquidity. Treasury also manages the interest rate risk and foreign exchange risks inherent in the balance sheet, including managing the mismatch between Group assets and liabilities. Treasury’s earnings are primarily sourced from managing the Group’s balance sheet and interest rate risk (excluding Westpac New Zealand), within set risk limits;
• Chief Operating Office¹, which includes Group Technology function and Australian banking operations and property services. Group Technology is responsible for technology strategy and architecture, infrastructure and operations, applications development and business integration in Australia;
• Core Support², which comprises functions performed centrally, including strategy, finance, risk, financial crime, legal, human resources, customer and corporate relations, and Group head office costs;
• Following the Group’s decision in March 2019 to restructure its wealth operations and exit its Advice business, the residual Advice operations (including associated remediation) and certain support functions of the former BTFG division have been transferred to Group Businesses; and
• Group Businesses also includes earnings on capital not allocated to divisions, accounting entries for certain intra-group transactions that facilitate presentation of performance of the Group’s operating segments, earnings from non-core asset sales, earnings and costs associated with the Group’s Fintech investments, and certain other head office items such as centrally raised provisions.
Financial performance
$m 2021 2020 2019
Net interest income 835 899 615
Non-interest income 372 144 (617)
Net operating income before operating expenses and impairment (charges)/benefits 1,207 1,043 (2)
Operating expenses (1,018) (2,364) (1,137)
Impairment (charges)/benefits (2) 169 92
Profit before income tax expense 187 (1,152) (1,047)
Income tax expense (175) (158) 213
Profit attributable to NCI (3) - (1)
Cash earnings 9 (1,310) (835)
Net cash earnings adjustments 108 (294) (19)
Net profit attributable to owners of WBC 117 (1,604) (854)
2021 v 2020
Cash earnings were a $9 million profit for 2021, compared with a loss of $1,310 million for 2020.
Net operating income up $164 million, 16%
• Gains in 2021 from our investment in Coinbase Inc. and Zip Co Limited ($537 million; $25 million respectively) were higher than gains in 2020 from our investments in Zip Co Limited ($303 million); partly offset by
• Higher provisions for estimated customer refunds and repayments ($231 million in 2021, $156 million in 2020); and
• Lower Treasury income.
Operating expenses down $1,346 million, 57%
• Expenses were lower than 2020, due to the non-repeat of a penalty from AUSTRAC and the associated costs ($1,478 million); partly offset by
• Performance fee related to gains on our investment in Coinbase Inc. ($120 million); and
• Higher CORE program costs, and higher provisions for estimated customer refunds and payments ($176 million in 2021, $168 million in 2020).
Impairment charges up $171 million, large
• 2020 impairment benefit was mainly due to centrally held overlays no longer required.
1. Group Technology and Operations costs are fully allocated to other divisions in the Group.2. Core Support costs are partially allocated to other divisions, while Group Head Office costs are retained in Group Businesses.

112 WESTPAC GROUP 2021 ANNUAL REPORT
Risk and risk management
Risk and risk management
Risk management
As a Bank we face many different risks, and the management of risk is integral to achieving our purpose of helping Australians and New Zealanders succeed and our strategy. The key risks we face and manage across Westpac are detailed below.
The issues identified by our own analysis of Culture, Governance and Accountability and APRA’s subsequent risk governance review, which resulted in Westpac entering into an Enforceable Undertaking with APRA in December 2020, have highlighted that we must improve the management of our risk, particularly non-financial risk. We continue to work through a significant program to address our shortcomings in management of risk, to strengthen accountability for end-to-end risk management and to mature our risk culture, as we become a simpler and stronger bank.
How we manage risk
Our Risk Management Framework outlines our activities to manage our risks, as set out in the diagram below. This Framework provides structure and discipline for our risk management activities. Effective risk management requires all the elements of the framework to operate holistically and independently. Critical to effective risk management is a strong risk culture, including clear accountability for identifying and managing risks through the three lines of defence.
RISK MANAGEMENT FRAMEWORK
WIB Global Forum
Governance and
Management Control
Business Strategy
Risk Identification
Risk Appetite
Stress and Scenarios Analysis
People and Infrastructure
Control Definition and Effectiveness
Monitoring and
Reporting
Actions and Response
Ensuring that appropriate data, analysis and recommendations flow to the right people and forums on a timely basis to support decision making
Westpac ’s business plans are shaped considering the risks associated with its strategic objectives
Identifying new and emerging risks in our business from internal and external environments
Setting risk appetite to provide clarity on the level of risk we are prepared to take
Performingstress tests to
assess potentialimpacts that changes to
existing risks and new risks may have on the
Group, including on our capital
Having the right capability , people , data and systems
to support effective risk management and decision
making
Embedding appropriate Frameworks, policies , standards and controls to manage the risks we take
Risks are assessed through ongoing monitoring , management , reporting and assurance
Appropriate action plans are implemented to improve our risk profile
The Risk Management Framework has nine components starting with our ‘Business Strategy’, which defines the markets and businesses the Group operates in. We are an Australian and New Zealand bank, with a predominant focus on retail, business and targeted institutional segments. We also operate wealth, insurance and ancillary banking operations; these are managed in our Specialist Businesses division.

113WESTPAC GROUP 2021 ANNUAL REPORT2 G
RO
UP
PE
RFO
RM
AN
CE
3 FINA
NC
IAL STA
TEM
EN
TS1 STR
ATE
GIC
RE
PO
RT
4 SH
AR
EH
OLD
ER
INFO
RM
ATIO
N
Risk and risk management
The activities in our Risk Management Framework include identification of risks, setting appropriate risk appetite and managing risks within appetite.
Some of our risks are stress tested and/or subject to scenario analysis to assess how major events and changing operating conditions could impact on our operations, financial performance, balance sheet or reputation. Stress tests are particularly relevant in the loan portfolios where we assess the impact of changing economic scenarios on customers’ and our financial position.
The current environment demonstrates the importance of stress testing given the potential impacts from the COVID-19 pandemic.
We need to have capable people and sound systems to manage risk, and underpin this with our frameworks, policies, procedures and standards. For example, our Risk Culture Framework sets out how we define, measure, monitor and manage risk culture.
Risk frameworks, policies, procedures and standards may operate at the Group level, across major risk categories as well as for individual regulated entities or divisions.
We also have processes in place to monitor and report risks, incidents, issues and actions. These include reporting limit breaches. We are focused on resolving long-standing issues, taking action to bring risks back within appetite, and assessing the effectiveness of controls to manage risks.
We have a formal risk governance structure to support our risk management framework by providing appropriate data, analysis and recommendations to the right people and forums on a timely basis to support decision making. Risk activities are overseen by established committees (including at Board level, Executive Management, major risk type Committees, Divisional and Specialist Committees).
Risk Culture
A strong risk culture is essential for the Group’s Risk Management Framework to operate effectively. We have a Group-wide transformation program to strengthen the management of risk across the entire bank. The Program supports the delivery of activities that will uplift and reinforce our understanding and capability when it comes to managing risk and is inclusive of risk culture.
Westpac aspires to a mature risk culture that pro-actively identifies, manages and mitigates risks, learns from risk events and continuously anticipates new risks and opportunities. To track progress towards our aspiration, we utilise several risk culture tools and processes designed to assist management better measure, monitor and manage our risk culture:
• Risk Culture Framework – embedded a framework, articulating the roles and responsibilities for moving ourrisk culture maturity towards Westpac’s aspiration, through the use of the tools and processes;
• Risk Culture Maturity Self-Assessment – deployment of an online tool allowing Divisions to annually assesstheir current risk culture maturity relative to Westpac’s aspiration, helping to identify and prioritise areas forimprovement;
• Risk Culture Insights Program – undertake a second line deep-dive program of each Division’s risk culture,identifying the factors that positively and negatively influence the Division’s approach to risk management; and
• Risk Culture Dashboard – provision of a comprehensive database of risk culture metrics, to support an onlineautomated Risk Culture Dashboard rolled out to Divisions, enabling risk culture to be measured, monitored andreported in a consistent way across the Group.
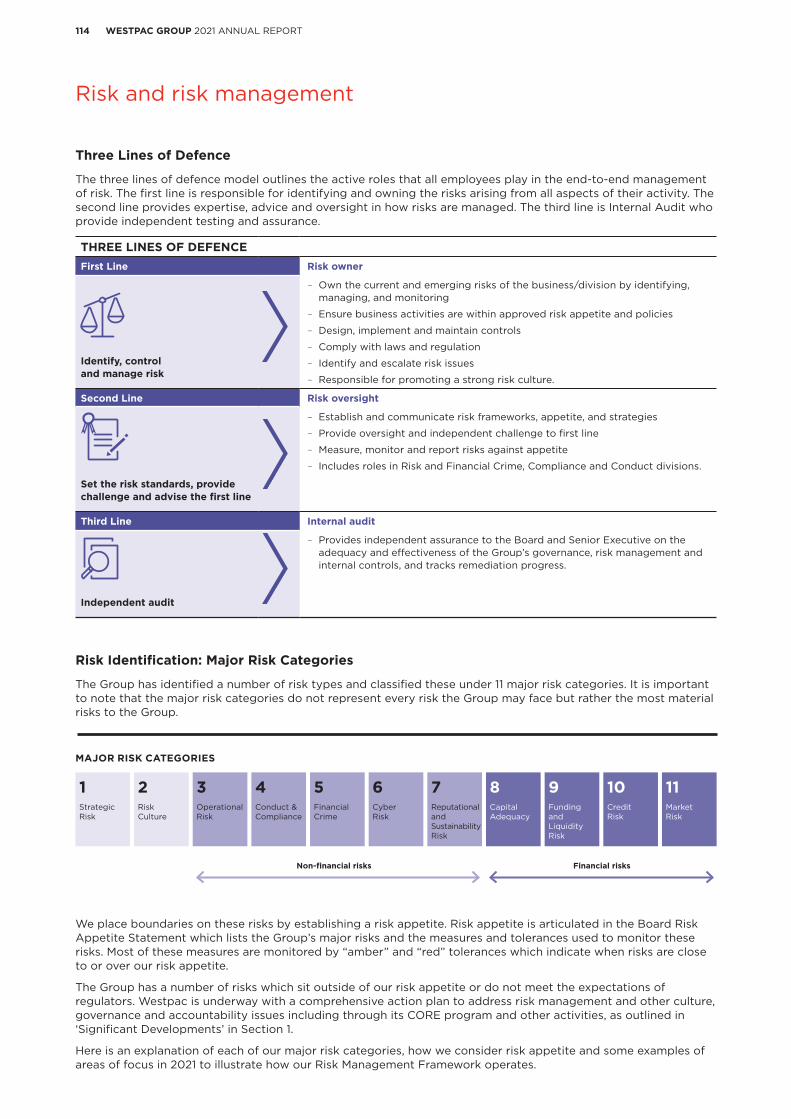
114 WESTPAC GROUP 2021 ANNUAL REPORT
Risk and risk management
Three Lines of Defence
The three lines of defence model outlines the active roles that all employees play in the end-to-end management of risk. The first line is responsible for identifying and owning the risks arising from all aspects of their activity. The second line provides expertise, advice and oversight in how risks are managed. The third line is Internal Audit who provide independent testing and assurance.
THREE LINES OF DEFENCEFirst Line Risk owner
Identify, control and manage risk
– Own the current and emerging risks of the business/division by identifying, managing, and monitoring
– Ensure business activities are within approved risk appetite and policies
– Design, implement and maintain controls
– Comply with laws and regulation
– Identify and escalate risk issues
– Responsible for promoting a strong risk culture.
Second Line Risk oversight
Set the risk standards, provide challenge and advise the first line
– Establish and communicate risk frameworks, appetite, and strategies
– Provide oversight and independent challenge to first line
– Measure, monitor and report risks against appetite
– Includes roles in Risk and Financial Crime, Compliance and Conduct divisions.
Third Line Internal audit
Independent audit
– Provides independent assurance to the Board and Senior Executive on the adequacy and effectiveness of the Group’s governance, risk management and internal controls, and tracks remediation progress.
Risk Identification: Major Risk Categories
The Group has identified a number of risk types and classified these under 11 major risk categories. It is important to note that the major risk categories do not represent every risk the Group may face but rather the most material risks to the Group.
1Strategic Risk
2Risk Culture
3Operational Risk
4Conduct & Compliance
5Financial Crime
6Cyber Risk
7Reputational and Sustainability Risk
8Capital Adequacy
9Funding and Liquidity Risk
10Credit Risk
11Market Risk
Non-financial risks Financial risks
MAJOR RISK CATEGORIES
We place boundaries on these risks by establishing a risk appetite. Risk appetite is articulated in the Board Risk Appetite Statement which lists the Group’s major risks and the measures and tolerances used to monitor these risks. Most of these measures are monitored by “amber” and “red” tolerances which indicate when risks are close to or over our risk appetite.
The Group has a number of risks which sit outside of our risk appetite or do not meet the expectations of regulators. Westpac is underway with a comprehensive action plan to address risk management and other culture, governance and accountability issues including through its CORE program and other activities, as outlined in ‘Significant Developments’ in Section 1.
Here is an explanation of each of our major risk categories, how we consider risk appetite and some examples of areas of focus in 2021 to illustrate how our Risk Management Framework operates.

115WESTPAC GROUP 2021 ANNUAL REPORT2 G
RO
UP
PE
RFO
RM
AN
CE
3 FINA
NC
IAL STA
TEM
EN
TS1 STR
ATE
GIC
RE
PO
RT
4 SH
AR
EH
OLD
ER
INFO
RM
ATIO
N
Risk and risk management
MAJOR RISK CATEGORIES
1Strategic risk
The risk that the Group makes inappropriate strategic choices, does not implement its strategies successfully, or does not respond effectively to changes in the operating environment.
Risk Appetite and Mitigation
We seek to grow our business through a strategy aligned with the Group’s risk appetite.
We seek to manage the impact of threats, driven by changes in the operating environment, which could have a significant impact on our ability to implement our strategy.
We must continually evaluate our performance against our plans and in light of changes in internal and external factors, and we must respond in a timely manner.
Some areas of focus include:– Exit of specialist businesses, including transactions
that do not complete.
– The impact of COVID-19.
Example of a Risk Appetite measure
– Actual ROE versus target ROE.
2Risk culture
The risk that our culture does not promote and reinforce behavioural expectations and structures to identify, understand, discuss and act on risks.
Risk Appetite and Mitigation
We promote a risk culture which supports our purpose, vision and values and our ability to manage risk effectively.
We only have appetite for a risk culture which is regularly assessed and is supported by initiatives that seek to reinforce behavioural expectations and structures to ensure our people identify, understand, discuss and act on risks.
Some areas of focus include:– Board approved Risk Culture Framework.
– Deployment of Risk Fundamentals training.
– Year-on-year Risk Culture Maturity self-assessments.
Example of a Risk Appetite measure
– Internal survey results - % of respondents who feelsafe calling out risks and/or concerns.
3Operational Risk
The risk of loss resulting from inadequate or failed internal processes, people and systems or from external events.
Risk Appetite and Mitigation
We recognise that operational risk is a necessary part of doing business. We seek to be resilient to operational risk, and minimise the impact of inadequate processes, people and systems and of external events through robust processes and controls.
While we recognise that breakdowns in processes and controls will occur, material issues and incidents arising from these breakdowns must be quickly and effectively remediated.
Some areas of focus include:– Managing risks in line with value chain process
management.
– Strengthening the control environment, includingrationalisation and automation of controls.
– Strengthening focus on fraud prevention and themanagement of key risks such as Data Risk andThird-Parties risk (including suppliers and COVID-19impacts).
– Use of AI and analytics to provide real-timeactionable insights to proactively manage risks.
Example of a Risk Appetite measure
– Timely recording and ownership of incidentsidentified.
– Effective and adequate management of the qualityof critical data.

116 WESTPAC GROUP 2021 ANNUAL REPORT
Risk and risk management
MAJOR RISK CATEGORIES
4Conduct and compliance
The risk of failing to abide by compliance obligations required of us or otherwise failing to have behaviours and practices that deliver suitable, fair and clear outcomes for our customers and that support market integrity.
Risk Appetite and Mitigation
We comply with relevant laws and regulations, and conduct our business in a way that delivers suitable, fair and clear outcomes for our customers and supports the integrity of the markets in which we operate. To achieve this, we establish robust controls and systems to manage conduct and compliance risk. In doing so, we have no appetite for:
– Deliberate or reckless breaches of regulatory requirements
– Conduct that deliberately or recklessly causes unsuitable, unfair or unclear customer outcomes or adversely impacts the integrity of financial markets; or
– Systems or processes that lead to systemic or material breaches of regulatory requirements.
Non-compliance will occur from time to time and we have no appetite for the failure to promptly own, investigate and remediate incidents of non-compliance.
Some areas of focus include:
– The CORE program which is designed to embed a strong and proactive risk management culture. Key compliance and conduct workstreams include obligations management, breach reporting, regulatory commitments and conduct risk.
Example of a Risk Appetite measure
– Prevalence of customer remediations with inaccurate estimates of end dates.
5Financial crime
The risk that the Group fails to prevent financial crime and comply with applicable financial crime obligations.
Financial Crime includes Anti-Money Laundering, Counter Terrorism Finance, Sanctions, Anti-bribery and corruption, Foreign Account Tax Compliance Act and the Common Reporting Standard.
Risk Appetite and Mitigation
We help prevent financial crime by pro-actively identifying, assessing, mitigating and reporting financial crime risks and complying with all applicable global and local financial crime obligations. This means that our financial crime risks must be managed through robust controls and systems, and that we promptly own, investigate and remediate financial crime incidents where they do occur.
This means managing our financial crime risks through robust controls and systems, and promptly owning, investigating and remediating financial crime incidents where they occur.
Some areas of focus include:
– Continuing our program to strengthen areas of control weaknesses and to enhance our management of financial crime risk.
– Strengthening our financial crime team’s capability, including through additional training
– Embedding new and enhanced systems and controls to identify, mitigate and manage financial crime risk.
Example of a Risk Appetite measure
– Number of AML/CTF & Sanctions exemptions granted related to risk appetite or policies and standards.

117WESTPAC GROUP 2021 ANNUAL REPORT2 G
RO
UP
PE
RFO
RM
AN
CE
3 FINA
NC
IAL STA
TEM
EN
TS1 STR
ATE
GIC
RE
PO
RT
4 SH
AR
EH
OLD
ER
INFO
RM
ATIO
N
Risk and risk management
MAJOR RISK CATEGORIES
6Cyber risk
The risk that the Group’s or its third parties’ data or technology are inappropriately accessed, manipulated or damaged from cybersecurity threats or vulnerabilities.
Risk Appetite and Mitigation
We proactively manage cyber risk to limit the likelihood of inappropriate access, manipulation or damage to our and our third parties’ data and technology, to protect stakeholders and customers data and to ensure that we are resilient to cybersecurity threats and vulnerabilities.
In managing our cyber risk, we seek to ensure that:
– We manage our risks within the appropriate regulatory frameworks
– We do not undermine our strategic, financial, reputational or regulatory standing, and
– We implement cyber controls commensurate to the cyber threats we respond to.
Some areas of focus include:
– Accelerating delivery of a program to enhance cybersecurity capability including data protection controls, and identity and access management.
– Developing a cyber risk management framework to provide a consistent approach to the management of cyber risk across the Group.
Example of a Risk Appetite measure
– Control effectiveness against external cyber threats.
– Number of employees who acted appropriately during simulated malicious email attacks.
7Reputational and sustainability risk
Reputation Risk
Reputation Risk is the risk of key stakeholders forming negative perceptions, beliefs or unrealistic expectations of the Group.
Sustainability Risk
Sustainability (or ESG) risk is the risk of loss or negative impact from the failure to recognise or address environmental, social or governance (ESG) issues.
Risk Appetite and Mitigation
Reputation and Sustainability Risk
We seek to maintain the confidence of all stakeholders, including to cultivate trust in our integrity and competence.
We have little appetite for actions, inactions, transactions, investments and events which may affect the Group’s integrity or competence.
The principles that govern our approach include:
– Acting with integrity
– Doing the right thing by our customers
– Balancing needs and expectations of stakeholders and the potential impacts on people or the environment.
Some areas of focus include:
Lift the consideration or Reputation and Sustainability Risk across the Group.
Reputation Risk
– Culture reset program.
Sustainability Risk
– Advancing our Paris-aligned financing strategies and portfolio targets, particularly for sectors representing the majority of our financed emissions. This includes working to reduce our Thermal Coal Mining exposure to zero by 2030.
– APRA Climate Vulnerability Assessment stress testing and scenario analysis.
– Provide business customers with a range of innovative sustainable finance solutions including green deposits, green bonds and sustainability-linked loans targeting improved ESG performance.
– Capability uplift to support better identification and management of ESG risk, covering climate change and human rights, including modern slavery.
Example of a Risk Appetite measure
Reputation Risk
– Employee engagement
– RepTrak Standing – RepTrak is an external benchmark used by corporations such as Westpac to measure their reputation, based on consumer surveys and media coverage
Sustainability Risk
– Sustainalytics ESG Rating

118 WESTPAC GROUP 2021 ANNUAL REPORT
Risk and risk management
MAJOR RISK CATEGORIES
8Capital adequacy
The risk of an inadequate level or composition of capital to support our business and meet regulatory requirements under both normal or stressed conditions.
Risk Appetite and Mitigation
We seek to maintain a strong balance sheet, including in stress scenarios.
We evaluate our approach to Capital management through an Internal Capital Adequacy Assessment Process, the key features of which include:
– A capital management strategy
– Considering economic and regulatory requirements
– Stress testing
– Considering the perspectives of external stakeholders.
Some areas of focus include:
– $3.5bn Additional Tier 1 capital and $6.3bn Tier 2 capital instruments raised during FY21.
– Applying a mortgage risk weight floor to 25% in June 2021 to reflect the anticipated unwind of temporary COVID-19 stimulus effects and our expectation that mortgage risk weights will rise from APRA’s capital changes.
Example of a Risk Appetite measure
– Common equity tier 1 (CET1) ratio – a measure which shows a bank’s capacity to absorb losses.
9Funding and liquidity
The risk that the Group cannot meet its payment obligations or that it does not have the appropriate amount, tenor and composition of funding and liquidity to support our business.
Risk Appetite and Mitigation
We seek to manage our balance sheet such that we:
– Maintained a diversified, stable and cost-effective funding base;
– Can source funding as and when we need it;
– Have sufficient securable assets to meet our funding and repo requirements; and
– Fund new lending growth with stable funding sources.
Some areas of focus include:
– Fully utilising our Term Funding Facility allowance of $30 billion.
– Respond to the removal of Committed Liquidity Facility by the end of 2022.
– Further information on is contained in Note 21 to the financial statements.
Example of a Risk Appetite measure
– Net Stable Funding Ratio (NSFR).
– Liquidity coverage ratio (LCR).
10Credit risk
The risk of financial loss where a customer or counterparty fails to meet their financial obligations to Westpac.
Risk Appetite and Mitigation
We have appetite for credit risk where:
– We have sufficient expertise to make appropriate credit decisions
– We understand and are comfortable with possible downsides
– No excessive exposure concentrations.
We manage credit risk using Program- managed (high-volume homogeneous credit risk) and Transaction-managed (individual customer and transactions) approaches.
Management of credit risk is also supported by a range of policies, processes, systems, risk delegated authorities and Board-approved credit risk limits.
Some areas of focus include:
– Heightened credit risk from COVID-19 including provisions for expected credit losses
– Climate change and sustainability
– Further information is contained in Notes 13 and 21 to the financial statements, and in Westpac’s Pillar 3 reports.
Example of a Risk Appetite measure
– Top 10 exposures to Corporates and NBFIs as a % of Total Committed Exposure.
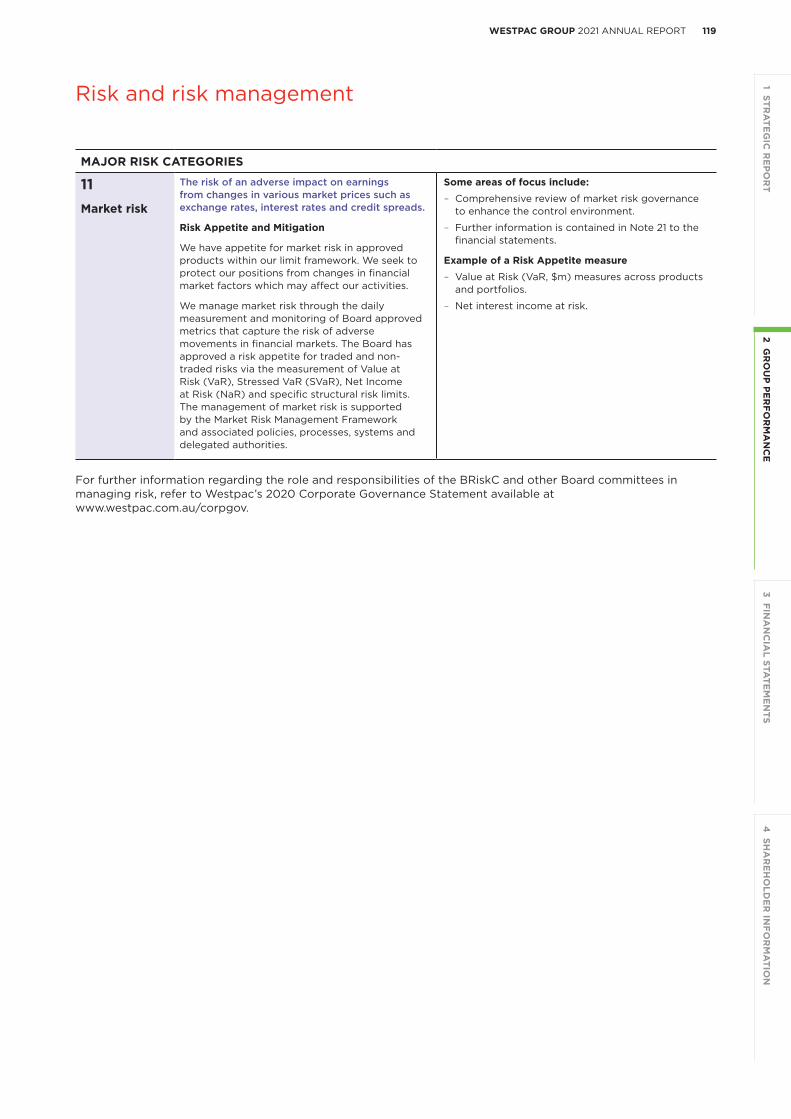
119WESTPAC GROUP 2021 ANNUAL REPORT2 G
RO
UP
PE
RFO
RM
AN
CE
3 FINA
NC
IAL STA
TEM
EN
TS1 STR
ATE
GIC
RE
PO
RT
4 SH
AR
EH
OLD
ER
INFO
RM
ATIO
N
Risk and risk management
MAJOR RISK CATEGORIES
11Market risk
The risk of an adverse impact on earnings from changes in various market prices such as exchange rates, interest rates and credit spreads.
Risk Appetite and Mitigation
We have appetite for market risk in approved products within our limit framework. We seek to protect our positions from changes in financial market factors which may affect our activities.
We manage market risk through the daily measurement and monitoring of Board approved metrics that capture the risk of adverse movements in financial markets. The Board has approved a risk appetite for traded and non-traded risks via the measurement of Value at Risk (VaR), Stressed VaR (SVaR), Net Income at Risk (NaR) and specific structural risk limits. The management of market risk is supported by the Market Risk Management Framework and associated policies, processes, systems and delegated authorities.
Some areas of focus include:
– Comprehensive review of market risk governance to enhance the control environment.
– Further information is contained in Note 21 to the financial statements.
Example of a Risk Appetite measure
– Value at Risk (VaR, $m) measures across products and portfolios.
– Net interest income at risk.
For further information regarding the role and responsibilities of the BRiskC and other Board committees in managing risk, refer to Westpac’s 2020 Corporate Governance Statement available at www.westpac.com.au/corpgov.

120 WESTPAC GROUP 2021 ANNUAL REPORT
Risk and risk management
Risk and risk management
Risk factors
Our business is subject to risks that can adversely impact our financial performance, financial condition and future performance. If any of the following risks occur, our business, prospects, reputation, financial performance or financial condition could be materially adversely affected, with the result that the trading price of our securities could decline and as a security holder you could lose all, or part, of your investment. You should carefully consider the risks described and the other information in this Annual Report before investing in our securities. The risks and uncertainties described below are not the only ones we face. Additional risks and uncertainties that we are unaware of, or that we currently deem to be immaterial, may also become important factors that affect us.
Risks relating to our business
We have suffered, and could in the future suffer, information security risks, including cyberattacks
The Group (and its external service providers) is subject to information security risks. These risks are heightened by:
• new technologies and increased digital service options;
• increased use of the internet and telecommunications to conduct financial transactions;
• the growing sophistication of attackers, and the global increase in cyber crime;
• the COVID-19 pandemic, which has resulted in many Westpac employees (and staff of service providers) and customers working remotely or from other sites; and
• other external events such as biological hazards, climate change, natural disasters or acts of terrorism, which could interrupt the usual operations of the Group, its customer and suppliers, potentially providing increased opportunities for cyber threat actors to exploit.
These risks could result in information security risks such as cyberattacks, espionage and/or errors happening at an unprecedented pace, scale and reach. Cyberattacks have the potential to cause financial system instability and could result in serious disruption to customer banking services, or compromise customer data privacy. While Westpac has systems in place to protect against, detect and respond to cyberattacks, these systems have not always been, and may not always be, effective. Westpac and its customers could suffer losses from cyberattacks, information security breaches or ineffective cyber resilience. The Group may not be able to anticipate and prevent a cyberattack, effectively respond to a cyberattack and/or rectify or minimise damage resulting from a cyberattack. Our external service providers, and other parties that facilitate our activities, financial platforms and infrastructure (such as payment systems and exchanges) are also subject to the risk of cyberattacks, which could in turn impact Westpac.
Our operations rely on the secure processing, storage and transmission of information on our computer systems and networks, and the systems and networks of external suppliers. Although we implement measures to protect the confidentiality and integrity of our information, there is a risk that the computer systems, software and networks on which we, or our service providers, rely may be subject to security breaches, unauthorised access, malicious software, external attacks or internal breaches that could have an adverse impact on our confidential information or that of our customers and counterparties.
A range of potential consequences could arise from a successful cyberattack, such as:
• damage to technology infrastructure;
• disruptions or other adverse impacts to network access, operations or availability of services;
• loss of customers and market share or reputational damage;
• loss of data or information;
• customer remediation and/or claims for compensation;
• breach of applicable privacy laws or data protection regulations;
• litigation and adverse regulatory action including fines or penalties and increased regulatory scrutiny; and
• increased need for significant additional resources to modify or enhance our systems or to investigate and remediate any vulnerabilities or incidents.
All these potential consequences could negatively affect our business, prospects, reputation, financial performance or financial condition.
As cyber threats evolve, we may need to spend significant resources to modify or enhance our systems or investigate and remediate any vulnerabilities or incidents.
121WESTPAC GROUP 2021 ANNUAL REPORT2 G
RO
UP
PE
RFO
RM
AN
CE
3 FINA
NC
IAL STA
TEM
EN
TS1 STR
ATE
GIC
RE
PO
RT
4 SH
AR
EH
OLD
ER
INFO
RM
ATIO
N
Risk and risk management
COVID-19 has had, and may continue to have (and a pandemic like COVID-19 could in the future have), an adverse effect on the Group
The Group is vulnerable to the impacts of a communicable disease outbreak or a pandemic. The COVID-19 pandemic has had, and may continue to have, a negative impact on our customers, shareholders, employees, third party suppliers and financial performance, among other adverse effects. The COVID-19 pandemic also heightens other risks described in this ‘Risk Factors’ section.
The COVID-19 pandemic has disrupted, and will continue to disrupt, numerous industries and global supply chains, while important measures to mitigate its impact have had, and may continue to have, a negative effect on economic activity.
There continues to be uncertainty associated with the COVID-19 pandemic, including the ultimate course, duration and severity of the disease, emergence of new variants and the availability and effectiveness of vaccination programs or other medical treatments. There is also uncertainty in relation to future actions that may be taken by governments, regulators and businesses to attempt to contain the virus or mitigate its impact and the effectiveness of such actions, as well as the timing and speed of economic recovery. Such uncertainty has the potential for longer term impacts on Westpac’s customers, business and operations.
Reduction in economic activity over the latter half of 2021 due to these COVID-19 induced factors has affected, and may in the future affect, demand for Westpac’s products and services. The associated financial stress on Westpac’s customers has, and is expected to, increase impairments, defaults and write-offs. Westpac has COVID-19 related overlays to allow for the potential emergence of losses once the effect of support and stimulus measures reduces in its business portfolios, however, further outlays may be required. For more information refer to Note 13 and Note 21 to the financial statements.
Westpac has supported customers by lowering interest rates on certain products, waiving certain fees and granting short term deferrals for certain mortgages, personal loans and small business loans. These initiatives have had and may continue to have a negative impact on the Group’s financial performance and may see the Group assume greater risk than it would have normally. There is also the potential for further government or regulator intervention to support the economy which may require banks (including Westpac) to support those interventions.
When outbreaks or pandemics occur, Westpac has adjusted and may need to adjust its risk appetite, policies or controls to respond to outbreaks or pandemics (like the COVID-19 pandemic) and protect the well-being of staff and customers who visit our premises. These changes could have unforeseen consequences and expose the Group to increased regulatory focus, media scrutiny and an increased risk of litigation.
Further, to respond to the COVID-19 pandemic, Westpac has implemented (and may in the future implement) new measures in very short periods of time. Taking this type of action may increase the risk that an operational or compliance breakdown occurs, potentially leading to financial losses, impacts on customer service or regulatory and/or legal action.
The COVID-19 pandemic has impacted the Group’s ability to pay dividends and the Group elected not to pay an interim dividend last financial year given the desire to retain a strong balance sheet and the ongoing uncertainty in the operating environment. It is possible that the COVID-19 pandemic, or another communicable disease outbreak or pandemic, will negatively impact the Group’s ability to pay future dividends or make capital distributions. It could also impact the Group’s ability to raise capital, and have an adverse impact on our financial condition.
We could be adversely affected by legal or regulatory change
The Group’s business, prospects, reputation, financial performance and financial condition have been, and could in the future be, adversely affected by changes to law, regulation, policies, supervisory activities and the expectations of our regulators. The Group operates in an environment where there is increased regulation and scrutiny of financial services providers.
Regulatory change has directly and adversely affected the Group’s financial performance and financial condition and could do so in the future. In recent years, laws and regulations have been introduced requiring Westpac to hold more liquidity and higher capital, and a Bank Levy (based on liabilities) has been imposed on Australia’s largest banks.
Regulatory changes may also affect how we operate and has altered the way we provide our products and services, in some cases requiring us to change or discontinue our offerings. Regulation could also limit our flexibility, require us to incur substantial costs, impact the profitability of our businesses, result in the Group being unable to increase or maintain market share and/or create pressure on margins and fees.
Regulation impacting our business may not always be released in a timely manner before its date of implementation. Similarly, early announcements of regulatory change may not be specific and significantly differ from the final regulation. In those cases, the Group may not be able to effectively manage its compliance design in the timeframes available. Further, increases in the volume of regulatory change being managed simultaneously has and will continue to create risk through challenging our ability to access required subject matter expertise and the execution risks associated with implementing simultaneous change.

122 WESTPAC GROUP 2021 ANNUAL REPORT
Risk and risk management
Relevant governments or regulators could also revise their application of regulatory policies, thereby impacting our business (such as macro-prudential limits on lending, as indicated by APRA in its letter to ADIs released in October 2021 which sets out APRA’s expectations for ADIs to use an interest rate that is at least 3.0 percentage points above the loan product rate to assess new borrowers’ ability to meet their loan repayments).
It is critical the Group manages regulatory change effectively. The failure to do so has resulted, and could in the future result, in the Group not meeting its compliance obligations, the risks of which are set out below. We expect that we will continue to invest significantly in compliance and the management and implementation of regulatory change. Significant management attention and resources may be required to update existing, or implement new, processes to comply with such new regulations.
There is additional information on certain aspects of regulatory changes affecting the Group in ‘Significant developments’ and the sections ‘Critical accounting assumptions and estimates’ and ‘Future developments in accounting standards’ in Note 1 to the financial statements.
We have been and could be adversely affected by failing to comply with laws, regulations or regulatory policy
We are responsible for ensuring that we comply with all applicable legal and regulatory requirements and industry codes of practice in the jurisdictions in which we operate or obtain funding.
The Group is subject to conduct and compliance risk. These risks are exacerbated by the increasing complexity and volume of regulation, including where we interpret our obligations and rights differently to regulators or a Court, tribunal or other body. The potential for this is heightened when regulation is new, untested or is not accompanied by extensive regulatory guidance.
The Group’s compliance management system is designed to identify, assess and manage compliance risk. However, this system has not always been, and may not always be, effective. Breakdowns have, and may in the future, occur due to flaws in the design or implementation of controls or processes. This has resulted in, and may in the future result in, potential breaches of compliance obligations as well as poor customer outcomes.
Conduct risk could occur through the provision of products and services to customers that do not meet their needs or do not meet the expectations of the market, as well as the poor conduct of our employees, contractors, agents, authorised representatives and external services providers. This could occur through a failure to meet professional obligations to specific clients (including fiduciary and suitability requirements), weakness in risk culture, corporate governance or organisational culture, poor product design and implementation, failure to adequately consider customer needs or selling products and services outside of customer target markets. This could include deliberate, reckless or negligent actions by such individuals that could result in the circumvention of Westpac’s controls, processes and procedures. The Group depends on its people to ‘do the right thing’ to meet its compliance obligations and abide by its Code of Conduct. Inappropriate or poor conduct by these individuals such as not following a policy or engaging in misconduct has resulted, and could result, in poor customer outcomes and a failure by the Group to meet its compliance obligations.
While we have frameworks, policies, processes and controls that are designed to manage poor conduct outcomes, these frameworks, policies, processes and controls have been, and may be, ineffective. This could result in financial losses (including incurring substantial remediation costs and as a result of litigation by regulators and customers) and reputational damage, which could adversely affect our business, prospects, financial performance or financial condition.
The Group’s failure, or suspected failure, to comply with a compliance obligation has in the past and could in the future lead to a regulator commencing surveillance or an investigation. ASIC’s new breach reporting regime, which commenced on 1 October 2021, significantly expands our obligation to report certain breaches (or likely breaches) to ASIC, which could give rise to additional regulatory scrutiny. The Group is currently subject to a number of investigations and reviews by regulators, and is responding to a high volume of regulatory requests from APRA, ASIC and other regulators. The Group has devoted (and will need to continue to devote) significant resources and has incurred (and will continue to incur) costs for these reviews and investigations, which may adversely affect Westpac’s business, operations, reputation and financial performance.
Depending on the circumstances, regulatory reviews and investigations have in the past and may in the future result in a regulator taking administrative or enforcement action against the Group and/or its representatives. Regulators have broad powers, and in certain circumstances, can issue directions to us (such as a direction to take remedial action). Regulators could also pursue civil or criminal proceedings, seeking substantial fines, civil penalties or other enforcement outcomes. In addition, regulatory investigations may lead to adverse findings against directors and management, including potential disqualification.
APRA can also require the Group to hold additional capital either through a capital overlay or higher risk weighted assets. APRA imposed a $500 million overlay to our operational risk capital requirement following the completion of our self-assessment into our frameworks and practices in relation to culture, governance and accountability and a further $500 million overlay following the commencement of civil penalty proceedings by AUSTRAC (both overlays were applied through an increase in risk weighted assets). If the Group incurs additional capital overlays, it may need to raise additional capital, which could have an adverse impact on our financial performance and financial condition.

123WESTPAC GROUP 2021 ANNUAL REPORT2 G
RO
UP
PE
RFO
RM
AN
CE
3 FINA
NC
IAL STA
TEM
EN
TS1 STR
ATE
GIC
RE
PO
RT
4 SH
AR
EH
OLD
ER
INFO
RM
ATIO
N
Risk and risk management
The political and regulatory environment that the Group operates in has seen (and may in the future see) our regulators (including any new regulator) receive new powers along with materially increased penalties for corporate and financial sector misconduct. For example, ASIC can commence civil penalty proceedings and seek civil penalties (currently up to $555 million per offence) against an Australian Financial Services licensee (such as Westpac) for failing to do all things necessary to ensure that financial services provided under the licence are provided efficiently, honestly and fairly. The Group may also face significant civil or criminal penalties for failing to comply with other obligations, and a failure by the Group may result in multiple contraventions leading to large penalties.
Our regulators have adjusted and may in the future continue to adjust the way they approach oversight, potentially preferring their enforcement powers over a more consultative approach. For example, APRA has committed to a revised enforcement approach (including a new Supervision Risk and Intensity Model), indicating it will use enforcement where appropriate to prevent and address serious prudential risks and hold entities and individuals to account.
There may also be a shift in the type and focus of enforcement proceedings commenced by regulators in the future. Regulators may increasingly seek to refer investigations to the Commonwealth Department of Public Prosecutions or other prosecutorial bodies for potential criminal prosecution. This may result in an increase in criminal prosecutions against institutions and/or their employees or representatives. Given the size of Westpac, these investigations could result in findings of a significant number of breaches of obligations, which could lead to significant financial and other penalties. This could also result in reputational damage and impact the willingness of customers, investors and other stakeholders to deal with Westpac.
Regulatory action commenced against the Group has exposed and may in the future expose the Group to an increased risk of litigation brought by third parties (including through class action proceedings), which may require the Group to pay compensation to third parties and/or undertake further remediation activities.
Regulatory investigations, inquiries, litigation, fines, penalties, infringement notices, revocation, suspension or variation of conditions of regulatory licences or other enforcement or administrative action or agreements (such as enforceable undertakings) could, either individually or in aggregate with other regulatory action, adversely affect our business, prospects, reputation, financial performance or financial condition. There is additional information on certain aspects of regulatory matters that may affect the Group in ‘Significant developments’ and in Note 26 to the financial statements.
We have suffered, and in the future could suffer, losses and be adversely affected by the failure to implement effective risk management
Our risk management framework has not always been, or may not in the future prove to be, effective.
This could be because the design of the framework is inadequate or that key risk management policies, controls and processes may be ineffective, due to inadequacies in their design, technology failures or because of poor implementation or high execution risk. The potential for these types of failings is heightened if the Group does not have enough appropriately skilled, trained and qualified employees in key positions.
There are also inherent limitations with any risk management framework as risks may exist, or emerge in the future, that we have not anticipated or identified, and our controls may not be effective.
The risk management framework may also prove ineffective because of weaknesses in risk culture or risk governance practices and policies, which may result in risks and control weaknesses not being identified, escalated or acted upon.
Recent analysis and reviews, in addition to regulatory feedback, have highlighted that the framework is not operating satisfactorily in a number of respects and needs to be improved. The Group has a number of risks which sit outside our risk appetite or do not meet the expectations of regulators. Many of these areas requiring improvement relate to the enforceable undertaking entered into with APRA by Westpac in December 2020. Further, the design or operation of our remuneration structures may not always encourage prudent risk management as intended, potentially resulting in staff engaging in excessive risk-taking behaviours.
As part of the Group’s risk management framework, the Group measures and monitors risks against its risk appetite. If a risk is out-of-appetite, the Group needs to take steps to bring this risk back into appetite in a timely way. However, the Group may not always be able to achieve this within proposed timeframes. This may occur because, for example, the Group experiences delays in enhancing its information technology systems or in recruiting sufficient numbers of appropriately trained staff for required activities. It is also possible that due to external factors beyond our control, certain risks may be inherently outside of appetite for periods of time. The Group is required to periodically review its risk management framework to determine if it remains appropriate.
If the Group is unable to bring risks back into appetite, or if it is determined that the Group’s risk management framework or risk governance practices and policies are no longer appropriate, the Group may incur unexpected losses and be required to undertake considerable remedial work, including incurring substantial costs. The failure to remedy this situation could result in increased scrutiny from regulators, who could require (amongst other things) that the Group hold additional capital or direct the Group to spend money to enhance its risk management

124 WESTPAC GROUP 2021 ANNUAL REPORT
Risk and risk management
systems and controls. Weaknesses in risk management systems and controls led to APRA requiring Westpac to hold additional capital following the completion of its Culture, Governance and accountability self-assessment, and the payment of a civil penalty of $1.3 billion as a result of the civil penalty proceedings brought by AUSTRAC against Westpac. In December 2020, APRA accepted an Enforceable Undertaking from Westpac, reflecting the crystallisation of many of the risks discussed above, and APRA has approved Westpac’s integrated plan in relation to risk governance. In March 2021 the RBNZ raised concerns in relation to WNZL’s risk governance practices and policies and as a result, external reviews are being conducted of WNZL’s risk governance and liquidity management. The RBNZ also amended WNZL’s conditions of registration in March 2021, requiring WNZL to discount the value of its liquid assets by approximately 14%. Inadequacies in addressing risks or in the Group’s risk management framework could also result in the Group failing to meet a compliance obligation and/or financial losses.
If any of our governance or risk management processes and procedures prove ineffective or inadequate or are otherwise not appropriately implemented, as has occurred, we could be exposed to higher levels of risk than expected which may result in unexpected losses, imposition of capital requirements, breaches of compliance obligations and reputational damage which could adversely affect our business, prospects, financial performance or financial condition.
For a discussion of our risk management procedures, refer to the ‘Risk management’ section.
The failure to comply with financial crime obligations has had and could have further adverse effects on our business and reputation
The Group is subject to anti-money laundering and counter-terrorism financing (AML/CTF) laws, anti-bribery and corruption laws, economic and trade sanctions laws and tax transparency laws in the jurisdictions in which it operates. These laws can be complex and, in some circumstances, impose a diverse range of obligations. As a result, regulatory, operational and compliance risks are heightened.
AML/CTF laws also require Westpac to report certain matters and transactions to regulators (including international funds transfer instructions, threshold transaction reports and suspicious matter reports) and ensure that certain information is not disclosed to third parties in a way that would contravene the ‘tipping off’ provisions in AML/CTF legislation. The failure to comply with these laws has had, and in the future may have, adverse impacts for the Group.
In recent years there has been, and there continues to be, increased focus on compliance with financial crime obligations, with regulators globally commencing large-scale investigations and taking enforcement action for identified non-compliance (often seeking significant penalties). Further, due to the Group’s large number of customers and transaction volumes, the undetected failure or the ineffective implementation, monitoring or remediation of a system, policy, process or control (including a regulatory reporting obligation) has resulted, and could in the future result, in a significant number of breaches of AML/CTF obligations. This in turn could lead to significant financial penalties and other adverse impacts for the Group, such as reputational damage.
While the Group has systems, policies, processes and controls in place designed to manage its financial crime obligations (including reporting obligations), these have not always been, and may not in the future always be, effective. This could be for a range of reasons, including, for example, a deficiency in the design of a control or a technology failure. Our analysis and reviews, in addition to regulator feedback, have highlighted that our systems, policies, processes and controls are not always operating satisfactorily in a number of respects and require improvement.
The Group is currently undertaking a significant multi-year program of work to strengthen areas of control weakness in its financial crime risk management program and to seek to rectify the management of this risk. In recent years, the Group has increased dedicated financial crime risk expertise and resources to deliver the financial crime program of work. With increased focus on financial crime, further issues requiring attention have been identified and may continue to be identified.
Although the Group provides updates to AUSTRAC, the ATO and other regulators on its remediation and other program activities, there is no assurance that AUSTRAC, the ATO or other regulators will agree that its remediation and program update activities will be adequate or effectively enhance the Group’s compliance programs.
If we fail to comply with these financial crime obligations, we could face regulatory enforcement action such as litigation, significant fines, penalties and the revocation, suspension or variation of licence conditions. Previous enforcement action by AUSTRAC has resulted in a range of outcomes, depending on the nature and severity of the relevant conduct and its consequences, including substantial financial penalties (such as the $1.3 billion civil penalty we paid as a result of civil proceedings brought by AUSTRAC in November 2019), restrictions and other regulator imposed conditions. There is additional information on financial crime matters in ‘Significant developments’.
Non-compliance or alleged non-compliance with our financial crime related obligations has also resulted in, and could lead to regulatory investigations, reviews, inquiries, proceedings or other litigation commenced by third parties (including Australian, US or other class actions), and regulatory action in non-Australian jurisdictions where we operate. Any such litigation or proceedings could cause significant financial and reputational damage to us. Reputational damage could result in the loss of customers or restrict the Group’s ability to efficiently access capital markets, which could have a material adverse effect on the Group’s business, reputation, prospects, financial performance and financial condition. Furthermore, any such effect could harm the Group’s credit ratings.

125WESTPAC GROUP 2021 ANNUAL REPORT2 G
RO
UP
PE
RFO
RM
AN
CE
3 FINA
NC
IAL STA
TEM
EN
TS1 STR
ATE
GIC
RE
PO
RT
4 SH
AR
EH
OLD
ER
INFO
RM
ATIO
N
Risk and risk management
Climate change may have adverse effects on our business
We, our customers, external suppliers and communities in which we operate, may be adversely affected by the physical risks of climate change, including increases in temperatures, rising sea levels, loss of biodiversity and ecosystem degradation and the frequency and severity of adverse climatic events including fires, storms, floods and droughts. These effects, whether acute or chronic in nature, may directly impact us and our customers through, for example, disruptions to business and economic activity or impacts on income and asset values. Adverse impacts on our customers may lead to human rights risk, and negatively impact loan serviceability and security values, as well as our profitability.
Westpac is exposed to risk arising from initiatives and trends associated with climate change mitigation (transition risks). Changes in supervisory expectations of banks, other regulatory changes and changes in investor appetite could directly impact Westpac, for example, by giving rise to higher compliance and/or funding costs and the contraction of revenue from sectors materially exposed to transition risk. Examples of regulatory change in this space include APRA’s Climate Vulnerability Assessment involving major Australian banks including Westpac; APRA’s draft Prudential Practice Guide on climate change financial risks; and the introduction of proposed legislation in New Zealand to require mandatory climate-risk reporting for the financial sector.
Westpac is also exposed to transition risk indirectly through its lending to higher risk sectors or regions. Technological developments, regulatory changes, stakeholder pressure and shifting customer preferences may place additional pressure on certain customer sectors to reduce greenhouse gas emissions, which could in turn result in additional credit risk, or loss of revenues due to changes in markets. Conversely, Westpac may not be able to reduce its lending to higher risk sectors or regions as a result of possible stakeholder requirements to continue to lend to certain customer sectors.
We may be subject, from time to time, to legal and business challenges due to actions instituted by activist shareholders or others. An example of areas which have attracted shareholder activism in Australia includes avoiding financing or interacting with businesses that are not perceived to demonstrate responsible management of environmental and social issues. Should the Group be required to respond to these challenges, this could give rise to increased costs, reputational risk and additional disclosures associated with such matters. In addition, there could be heightened litigation risk due to varying shareholder expectations or additional disclosures or commitments made by Westpac to shareholders. Perceived uncertainties as to our future direction as a result of shareholder activism may lead to the perception of a change in the direction of the business or other instability.
Further, any failure or perceived failure by Westpac to proactively manage and disclose climate change risks appropriately may in turn increase the risk of third party and shareholder litigation, or regulatory action against the Group (and/or its customers), with these types of climate-related actions becoming more common in Australia and globally. Further, we expect scrutiny from shareholders and regulators on the climate-related risk management practices and lending policies of banks and other financial institutions to remain high in Australia in coming years.
Westpac is also exposed to broader geopolitical and macro-economic impacts of climate change given its international portfolio. Climate change may remove stability from both domestic and international economic conditions and may impact customer confidence in these markets.
Failure to effectively manage and disclose direct and indirect climate-related risks including nature-related risks such as biodiversity loss and ecosystem degradation could adversely affect our business, prospects, reputation, financial performance or financial condition.
Please refer to our 2021 Sustainability Supplement for further details on the identification, assessment and management of risks relating to climate change.
Reputational damage has harmed and could in the future harm our business and prospects
Reputational risk arises where there are differences between stakeholders’ current and emerging perceptions, beliefs and expectations and our past, current and planned activities, processes, performance and behaviours.
There are various potential sources of reputational damage. For example, where our actions cause, or are perceived to cause, a negative outcome for customers, shareholders, stakeholders or the community. Reputational damage could also arise from the failure to effectively manage risks, failure to comply with legal and regulatory requirements, enforcement or supervisory action by regulators, adverse findings from regulatory reviews, failure or perceived failure to adequately respond to community, environmental, social and ethical issues, and inadequate record keeping, which may prevent Westpac from demonstrating that or determining if a past decision was appropriate at the time it was made. The AUSTRAC proceedings illustrate a number of these risks.
Westpac also recognises the potential reputational consequences (together with other potential commercial and operational consequences) of failing to appropriately identify, assess and manage environmental, social and governance related risks such as climate change risk, human rights risk including customer vulnerability, modern slavery and child safety risk, or respond effectively to evolving standards and stakeholder expectations.
Our reputation could also be adversely affected by the actions of customers, suppliers, joint-venture partners, strategic partners, or other counterparties.

126 WESTPAC GROUP 2021 ANNUAL REPORT
Risk and risk management
Failure, or perceived failure, to address issues that could or do give rise to reputational risk, has created, and could in the future create additional legal risk, subject us to regulatory investigations, regulatory enforcement actions, fines and penalties or litigation or other actions brought by third parties (including class actions), and the requirement to remediate and compensate customers, including prospective customers, investors and the market. This could adversely affect our business, prospects, financial performance or financial condition.
We have and could suffer losses due to litigation
Westpac and its subsidiaries are, from time to time, involved in legal proceedings (including class actions), regulatory actions or arbitration. Such litigation has been and could in the future be commenced by a range of plaintiffs, such as customers, shareholders, suppliers, counterparties and regulators.
In recent years, there has been an increase in class action proceedings, many of which have resulted in significant monetary settlements. The risk of class actions has been heightened by a number of factors, including regulatory enforcement actions (such as the civil penalty proceedings brought by AUSTRAC), an increase in the number of regulatory investigations and inquiries (such as the Royal Commission), a greater willingness on the part of regulators to commence court proceedings, more intense media scrutiny and the growth of third-party litigation funding and other funding arrangements. Class actions commenced against a competitor could also lead to similar proceedings against Westpac.
Litigation (including class actions) may, either individually or in aggregate, adversely affect the Group’s business, operations, prospects, reputation or financial condition. This risk is heightened by increases in the severity of penalties for certain breaches of the law. Such matters are subject to many uncertainties and the outcome may not be predicted accurately. Furthermore, the Group’s ability to respond to and defend litigation may be adversely affected by inadequate record keeping.
Depending on the outcome of any litigation, the Group has been and may in the future be required to comply with broad court orders, including compliance orders, enforcement orders or otherwise pay significant damages, fines, penalties or legal costs.
In addition, the case studies considered by the Royal Commission, and the Royal Commission’s findings, have led, and may in the future lead to, regulators commencing investigations and/or enforcement action against the Group.
There is a risk that the actual penalty or damages paid following a settlement or determination by a Court for any legal proceedings may be materially higher or lower than any relevant provision (where applicable) or that any contingent liability may be larger than anticipated. There is also a risk that additional litigation or contingent liabilities arise, all of which could adversely affect our business, prospects, reputation, financial performance or financial condition.
There is additional information on certain legal proceedings that may affect the Group in ‘Significant developments’ and in Note 26 to the financial statements.
We could suffer losses due to technology failures
Maintaining the reliability, integrity and security of our information and technology is crucial to our business.
While the Group has a number of processes in place to preserve and monitor the availability and recovery of our systems, there is a risk that our information and technology systems might fail to operate properly or result in outages, including from events wholly or partially beyond our control.
If we incur a technology failure, we may fail to meet a compliance obligation (such as retaining records and data for a certain period), or our customers may be adversely affected, including through the inability for them to access our products and services, privacy breaches or the loss of personal data. This could result in reputational damage, remediation costs and a regulator commencing an investigation and/or taking action against us. The use of legacy systems, as well as the work underway to uplift our technological capabilities, may heighten the risk of a technology failure.
We need to regularly renew and enhance our technology to deliver new products and services, comply with regulatory obligations and meet our customers’ and regulators’ expectations. Consequently, we are constantly managing new technology projects. Failure to effectively implement these projects could result in cost overruns, reduced productivity, outages, operational instability, compliance failures, reputational damage and/or the loss of market share. This could place us at a competitive disadvantage and adversely affect our business, prospects, financial performance or financial condition.
We are exposed to adverse funding market conditions
We rely on deposits, money markets and capital markets to fund our business and source liquidity. Our liquidity and costs of obtaining funding are related to funding market conditions.
127WESTPAC GROUP 2021 ANNUAL REPORT2 G
RO
UP
PE
RFO
RM
AN
CE
3 FINA
NC
IAL STA
TEM
EN
TS1 STR
ATE
GIC
RE
PO
RT
4 SH
AR
EH
OLD
ER
INFO
RM
ATIO
N
Risk and risk management
Funding markets can be unpredictable and experience extended periods of extreme volatility, disruption and decreased liquidity. The main risks we face are damage to market confidence, changes to the access and cost of funding, a slowing in global economic activity or other impacts on customers or counterparties.
A shift in investment preferences, or an unwind of the RBA’s quantitative easing measures as the economy continues to improve, could result in deposit withdrawals which could increase our need for funding from other, potentially less stable, or more expensive sources. In addition, APRA’s announcement on 10 September 2021 that ADIs should reduce their usage of the Committed Liquidity Facility to zero by the end of 2022 will increase our need for funding in the calendar year ending 31 December 2022.
If market conditions deteriorate due to economic, financial, political or other reasons, there may also be a loss of confidence in bank deposits leading to unexpected withdrawals. This could increase funding costs and our liquidity, funding and lending activities may be constrained and our financial solvency threatened.
If our current sources of funding prove to be insufficient, we may need to seek alternatives which will depend on factors such as market conditions, our credit ratings and market capacity. Even if available, these alternatives may be more expensive or on unfavourable terms, which could adversely affect our financial performance, liquidity, capital resources or financial condition.
If Westpac is unable to source appropriate funding, we may be forced to reduce lending or liquidity. This may adversely impact our business, prospects, liquidity, capital resources, financial performance or financial condition. If Westpac is unable to source appropriate funding for an extended period, or if it can no longer realise liquidity, Westpac may not be able to pay its debts as and when they fall due or meet other contractual obligations.
Westpac enters into collateralised derivative obligations, which may require Westpac to post additional collateral based on market movements, which has the potential to adversely affect Westpac’s liquidity or ability to use derivative obligations to hedge its interest rate, currency and other financial instrument risks.
For a more detailed description of liquidity risk, refer to ‘Funding and liquidity risk’ in Note 21 to the financial statements.
We could be adversely affected by the risk of inadequate capital levels under stressed conditions
The risk of an inadequate level or composition of capital to support normal business activities and to meet regulatory capital requirements under normal operating environments or stressed conditions has been highlighted by the COVID-19 pandemic. Regulatory change has led banks to hold higher capital, specifically for the implementation of future capital and risk-weighted assets regulations coming into effect from 2023. APRA requires banks to maintain bank capital ratios at above the 10.5% “unquestionably strong” benchmark to prepare for this change although the impact on each bank will be different due to different balance sheet and portfolio mix. Capital distribution constraints apply when an ADI’s Common Equity Tier 1 Capital ratio is within the capital buffer range (consisting of the Capital Conservation Buffer plus any Countercyclical Capital Buffer). Capital constraints could have an impact on Westpac’s ability to pay future dividends or make capital distributions. Adverse conditions and/or adverse regulatory change could impact Westpac’s capital adequacy, trigger capital distribution constraints, require us to make a highly dilutive capital raising or threaten our financial viability.
Sovereign risk may destabilise financial markets adversely
Sovereign risk is the risk that governments will default on their debt obligations or will be unable to refinance their debts as they fall due. Potential sovereign debt defaults and the risk that governments will nationalise parts of their economy including assets of financial institutions such as Westpac could negatively impact the value of our holdings of liquid assets. Such an event could destabilise global financial markets, adversely affecting our liquidity, financial performance or financial condition. There may also be a cascading effect to other markets and countries, the consequences of which, while difficult to predict, may be similar to or worse than those experienced during the Global Financial Crisis.
We could be adversely affected by the failure to maintain our credit ratings
Credit ratings are independent opinions on our creditworthiness. Our credit ratings can affect the cost and availability of our funding and may be important to certain customers or counterparties when evaluating our products and services.
Credit ratings assigned to us by rating agencies are based on an evaluation of several factors, including the structure of Australia’s financial system, the economy and Australia’s Sovereign credit rating, as well as our financial strength, the quality of our governance and risk appetite. A rating downgrade could be driven by a downgrade of Australia’s Sovereign credit rating, or one or more of the risks identified in this section or by other events including changes to the methodologies rating agencies use to determine credit ratings.
A credit rating or rating outlook could be downgraded or revised, where credit rating agencies believe there is a very high level of uncertainty on the impact to key rating factors from a significant event (such as a pandemic).
A downgrade to our credit ratings could have an adverse effect on our cost of funds, collateral requirements, liquidity, competitive position, our access to capital markets and our financial stability. The extent and nature of these impacts would depend on various factors, including the extent of any rating change, differences across agencies (split ratings) and whether competitors or the sector are also impacted.
128 WESTPAC GROUP 2021 ANNUAL REPORT
Risk and risk management
Our business is substantially dependent on the Australian and New Zealand economies, and could be adversely affected by a shock to these economies or other financial systems
Our revenues and earnings are dependent on domestic and international economic activity, business conditions and the level of financial services our customers require. Most of our business is conducted in Australia and New Zealand so our performance is influenced by the level and cyclical nature of activity in these countries. The financial services industry and capital markets have been, and may continue to be, adversely affected by volatility, global economic conditions, external events, geopolitical instability, political developments or a major systemic shock.
Market and economic disruptions could cause consumer and business spending to decrease, unemployment to rise and demand for our products and services to decline, thereby reducing our earnings. These events could also undermine confidence in the financial system, reduce liquidity, impair access to funding and adversely affect our customers and counterparties. In addition, any significant decrease in housing and commercial property valuations could adversely impact lending activities, possibly leading to higher credit losses.
Due to the economic relationship between Australia/New Zealand and China, particularly in the mining, resources and agricultural sectors, a slowdown in China’s economic growth and foreign government policies (including the adoption of protectionist trade measures) could negatively impact the Australian economy. Changes in commodity prices, Chinese government policies, China’s economic conditions or China’s real estate sector could reduce demand for our products and services and affect the level of economic activity and the ability of our borrowers to repay their loans.
Monetary policy can significantly impact the Group and the economic conditions of the jurisdictions we operate or obtain funding in. Interest rate settings (including low or negative rates) and other actions taken by central banks (such as quantitative easing) may adversely affect our cost of funds, the value of our lending and investments and our margins. These policies could affect demand for our products and services and/or have a negative impact on the Group’s customers and counterparties, potentially increasing the risk that they will default.
All these factors could adversely affect our business, prospects, financial performance or financial condition. The nature and consequences of any such event are difficult to predict and there is a risk that our response may be ineffective.
Declines in asset markets could adversely affect our operations or profitability
Potential declines in Australian, New Zealand or other asset markets, including equity, residential and commercial property markets, have adversely affected, and could in the future adversely affect, our operations and profitability.
Declining asset prices could also impact customers and counterparties and the value of security (including residential and commercial property) we hold. This may impact our ability to recover amounts owing to us if customers or counterparties default. It may also affect our impairment charges and provisions, in turn impacting our financial performance and financial condition.
Declining asset prices also impact our wealth management business as its earnings partly depend on fees based on the value of securities and/or assets held or managed.
An increase in defaults has adversely affected and could further adversely affect our financial performance or financial conditionWe establish provisions for credit impairment based on current information and our expectations. If economic conditions deteriorate beyond our expectations, some customers and/or counterparties could experience higher financial stress, leading to an increase in defaults and write-offs, and higher provisioning. Such events could adversely affect our liquidity, capital resources, financial performance or financial condition.
These risks have been heightened by the COVID-19 pandemic, which has negatively impacted economic activity and caused a range of customers to experience financial stress.
The long-term impact of the COVID-19 pandemic on customers and the magnitude of defaults or impairments is uncertain. For example, consumers may permanently decrease discretionary spending, which may increase the time it takes certain industries to recover.
Credit risk also arises from certain derivative, clearing and settlement contracts we enter into, and from our dealings in, and holdings of, debt securities issued by other institutions, the financial conditions of which may be affected to varying degrees by economic conditions in global financial markets.
For a discussion of our risk management, including the management of credit risk, refer to the ‘Risk management’ section and Note 21 to the financial statements.
We face intense competition in all aspects of our business
The financial services industry is highly competitive. We compete with a range of firms, including retail and commercial banks, investment banks, other financial service companies, fintech companies and businesses in other industries with financial services aspirations. This includes those competitors who are not subject to the same capital and regulatory requirements as us, which may allow those competitors to operate more flexibly.
Emerging competitors are increasingly altering the competitive environment by adopting new business models or seeking to use new technologies to disrupt existing business models.
129WESTPAC GROUP 2021 ANNUAL REPORT2 G
RO
UP
PE
RFO
RM
AN
CE
3 FINA
NC
IAL STA
TEM
EN
TS1 STR
ATE
GIC
RE
PO
RT
4 SH
AR
EH
OLD
ER
INFO
RM
ATIO
N
Risk and risk management
The competitive environment may also change as a result of increased scrutiny by regulators in the sector and legislative reforms such as ‘Open Banking’, which will stimulate competition, improve customer choice and likely give rise to increased competition from new and existing firms.
Competition in the various markets in which we operate has led, and may continue to lead, to a decline in our margins or market share.
Deposits fund a significant portion of our balance sheet and have been a relatively stable source of funding. If we are not able to successfully compete for deposits this could increase our cost of funding, lead us to seek access to other types of funding or result in us reducing our lending.
Our ability to compete depends on our ability to offer products and services that meet evolving customer preferences. Not responding to changes in customer preferences could see us lose customers. This could adversely affect our business, prospects, financial performance or financial condition.
There is additional information in ‘Competition’ in Section 1.
We have and could suffer losses due to operational risks
Operational risk includes, among other things, reputational risk, technology risk, model risk and outsourcing risk, as well as the risk of business disruption due to external events such as natural disasters, or outbreaks of communicable diseases, environmental hazards, damage to critical utilities and targeted activism and protest activity. While we have policies, processes and controls in place to manage these risks, these have not always been, or may not be, effective.
Ineffective processes and controls have resulted in, and could result in, adverse outcomes for Westpac’s customers. For example, a process breakdown or a failure to have appropriate product governance and monitoring processes in place could result in a customer not receiving a product on the terms, conditions, or pricing they agreed to, potentially to the detriment of the customer. Failed processes could also result in Westpac incurring losses because we cannot enforce our expected contractual rights. These types of operational failures may also result in financial losses, customer remediation, regulatory scrutiny and intervention and, depending on the nature of the failure, result in class action proceedings.
We have and could in the future, incur losses from fraudulent applications for loans or from incorrect or fraudulent payments and settlements. Fraudulent conduct can also arise from external parties seeking to access the bank’s systems or customer accounts. If systems, procedures and protocols for managing fraud fail, or are ineffective, they could lead to losses which could adversely affect our customers, business, prospects, reputation, financial performance or financial condition.
Westpac is also exposed to model risk, being the risk of loss arising from errors or inadequacies in data or a model, or in the control and use of a model.
Financial services entities have been increasingly sharing data with third parties, such as suppliers and regulators, to conduct their business and meet regulatory obligations. Each third party can give rise to a variety of risks, including financial crime compliance, information security, cyber, privacy, regulatory compliance, reputation, environmental and business continuity risks.
Westpac also relies on a number of suppliers, both in Australia and overseas, to provide services to it and its customers. Failures by these third-party contractors and suppliers to deliver services as required could disrupt Westpac’s ability to provide its products and services and adversely impact our operations, financial performance or reputation.
Another possible source of disruption to the Group is central banks adopting negative interest rates. If this occurred, the technology systems used by the Group, its counterparties and/or financial infrastructure providers may not operate correctly and this may cause loss or damage to the Group and/or its counterparties.
For a discussion of our risk management procedures, including the management of operational risk, refer to the ‘Risk management’ section.

130 WESTPAC GROUP 2021 ANNUAL REPORT
Risk and risk management
We could suffer losses due to market volatility
We are exposed to market risk due to our financial markets businesses, our defined benefit plan and through asset and liability management (including through volatility in prices of equity securities we hold or are exposed to). Market risk is the risk of an adverse impact on earnings resulting from changes in market factors, such as foreign exchange rates, commodity prices, equity prices, and interest rates (including low or negative interest rates and any resulting pressure placed on the Group’s interest margins). This includes interest rate risk in the banking book due to a mismatch between the duration of assets and liabilities arising from the normal course of business activities.
Changes in markets could be driven by numerous developments resulting in market volatility which could lead to substantial losses (including changes in the return on, value of or market for securities or other instruments). This may adversely affect our business, prospects, liquidity, capital resources, financial performance or financial condition.
The planned cessation of parts of the London Inter-bank Offered Rate (‘LIBOR’) regime from 1 January 2022, continuation of some U.S. Dollar LIBOR settings until 30 June 2023 and possible pre–cessation events will also continue to impact market pricing. Industry pressure to migrate to alternative reference rates is likely to occur earlier. Any future changes in the administration of LIBOR or other market benchmarks could have adverse consequences for the return on, value of and market for securities and other instruments linked to any such benchmark, including securities or other instruments issued by the Group. While we are monitoring our exposure to LIBOR, we remain dependent on market developments in relation to the LIBOR transition, which may have an impact on market pricing for, or valuations of, our LIBOR exposures and migrated alternative reference rate exposures. For further information on the Group’s LIBOR exposure, refer to Note 21 to the financial statements.
For a discussion of our risk management procedures, including the management of market risk, refer to the ‘Risk management’ section.
Poor data quality could adversely affect our business and operations
Accurate, complete and reliable data, along with appropriate data control, retention and access frameworks and processes, is critical to Westpac’s business. Data plays a key role in how we provide products and services to customers, our systems, our risk management framework and our decision-making and strategic planning.
In some areas of our business, we are affected by poor data quality. This has occurred and could arise in the future in a number of ways, including through inadequacies in systems, processes and policies, or the ineffective implementation of data management frameworks.
Poor data quality could lead to poor customer service, negative risk management outcomes, and deficiencies in credit systems and processes. Any deficiency in credit systems and processes could, in turn, have a negative impact on Westpac’s decision making in the provision of credit and the terms on which it is provided. Westpac also needs accurate data for financial and other reporting.
Poor data or poor records management has affected, currently affects and may in the future continue to affect Westpac’s ability to monitor our business, respond to regulatory notices and conduct remediation.
In addition, poor data or poor data retention has affected, currently affects and may in the future continue to affect Westpac’s ability to meet its compliance obligations (including its regulatory reporting obligations) which could lead to a regulator taking action against us. For example, APRA has raised concerns regarding Westpac’s data quality, including missing data and its increasing trend of resubmissions of regulatory reporting. The RBA and ABS also footnote that they exclude Westpac data from certain economic and financial statistics reports. Due to the importance of data, the Group has and will likely continue to incur substantial costs and devote significant effort to improving the quality of data and data frameworks and processes and remediating deficiencies where necessary.
The consequences and effects arising from poor data quality or poor data retention could have an adverse impact on the Group’s business, operations, prospects, reputation, financial performance and/or financial condition.
Breakdowns in processes and procedures have required, and could in the future require, us to undertake remediation activity
Breakdowns in Westpac’s processes and procedures have led to, and could in the future lead to, adverse outcomes for customers, employees or other third parties which Westpac is required to remediate.
The Group has, on a number of occasions, incurred significant remediation costs (including compensation payments and costs of correcting the issue), and there is a risk that similar or new issues will arise or be identified in the future requiring remediation. These may be identified as we implement the Group’s Fix and Simplify strategic priorities.
There are significant challenges and risks involved in remediation activities. Westpac’s ability to investigate the underlying issue could be impeded if the issue is old and occurred beyond our record retention period, or our records are inadequate. It may also be difficult and take significant time to properly quantify and scope a remediation activity.

131WESTPAC GROUP 2021 ANNUAL REPORT2 G
RO
UP
PE
RFO
RM
AN
CE
3 FINA
NC
IAL STA
TEM
EN
TS1 STR
ATE
GIC
RE
PO
RT
4 SH
AR
EH
OLD
ER
INFO
RM
ATIO
N
Risk and risk management
Determining how to compensate customers, employees or third parties properly and fairly can also be complicated, involving numerous stakeholders. The Group’s proposed approach to a remediation may be affected by a number of events, such as affected customers commencing a class action, or a regulator requiring a remediation to be done in a specific way or within a specific timeframe. These factors could delay Westpac in completing the remediation and may lead to a regulator commencing enforcement action against the Group. In turn, this could result in increased reputational risk, and we could be challenged by regulators, affected customers, the media and other stakeholders.
If the Group cannot effectively scope, quantify, implement or complete a remediation activity in a timely way, there could be an adverse impact on our business, prospects, reputation, financial performance or financial condition and could lead to further regulatory action and/or oversight.
Our failure to recruit and retain key executives, employees and Directors may have adverse effects on our business
Key executives, employees and Directors play an integral role in the operation of Westpac’s business and its pursuit of its strategic objectives. The unexpected departure of an individual in a key role, or the Group’s failure to recruit and retain appropriately skilled and qualified persons into these roles, could each have an adverse effect on our business, prospects, reputation, financial performance or financial condition.
We could suffer losses due to environmental factors or external events
We and our customers operate businesses and hold assets in a diverse range of geographic locations. Any significant environmental change or external event (including climate change, biodiversity loss and ecosystem degradation, drought, fire, storm, flood, earthquake, outbreaks or pandemics of communicable diseases such as the COVID-19 pandemic, civil unrest, war, heightened tension or terrorism) in any of these locations has the potential to disrupt business activities, damage property, affect asset values and impact our ability to recover amounts owing to us. In addition, such an event could have an adverse impact on economic activity, consumer and investor confidence or the levels of volatility in financial markets, all of which could adversely affect our business, prospects, financial performance or financial condition.
The high dependency of the global economy on nature means loss of biodiversity and ecosystem degradation represent a risk to Westpac, primarily through its exposure to customers in sectors that are materially dependent on biodiversity and ecosystem services. Biodiversity loss and ecosystem degradation can also contribute to, and be accelerated by, climate change. Increasing recognition and market-based responses to this risk also create expectations on Westpac. We acknowledge the goal of the Taskforce of the Nature-related Financial Disclosures is to provide a framework for organisations to report on risks from biodiversity loss and ecosystem degradation.
Certain strategic decisions may have adverse effects on our business
The Group routinely evaluates and implements strategic decisions and objectives including diversification, innovation, divestment, acquisitions or business expansion initiatives.
Each of these activities can be complex and costly. For example, they may cause reputational damage, or we may experience difficulties in completing certain transactions, separating or integrating businesses, disruptions to operations, diversion of management resources or higher than expected transaction costs. Multiple divestments and/or acquisitions at the same time may intensify these risks.
Furthermore, approvals may be required from shareholders, regulators or other stakeholders in order to divest businesses and assets, and there is a risk that these approvals may not be received, as seen recently with the attempted sale of Westpac Pacific, or that the purchaser does not complete these transactions for other reasons. In addition, our failure to successfully divest businesses or assets could result in interested parties taking action against the Group. As a result, we may not receive the anticipated business benefits and the Group could otherwise be adversely affected.
In addition, as part of the Specialist Businesses transactions we have given a number of warranties and indemnities in favour of counterparties relating to certain pre-completion matters, and made certain other contractual commitments (including in relation to transitional services). Claims under these warranties, indemnities and other contractual commitments may result in Westpac being liable to make significant payments to these counterparties. Additional operating risk capital is expected to be required to be held against the risk pursuant to APRA’s recently published guidance. The Group’s contingent liabilities are described in Note 26 to the financial statements.
Westpac also acquires and invests in businesses. These transactions involve a number of risks and costs. A business Westpac invests in may not perform as anticipated or may ultimately prove to have been overvalued when the transaction was entered into. Operational, cultural, governance, compliance and risk appetite differences between Westpac and an acquired business may lead to lengthier and more costly integration exercises.

132 WESTPAC GROUP 2021 ANNUAL REPORT
Risk and risk management
There are also risks involved in failing to appropriately respond to changes in the business environment (including changes related to economic, geopolitical, regulatory, technological, environmental, social and competitive factors). This could have a range of adverse effects on Westpac, such as being unable to increase or maintain market share or resulting pressure on margins and fees.
Any of these risks could have a negative impact on the Group’s business, prospects, reputation, engagement with regulators, financial performance or financial condition.
We could suffer losses due to impairment of capitalised software, goodwill and other intangible assets that may adversely affect our business, operations or financial condition
In certain circumstances Westpac may incur a reduction in the value of intangible assets.
Westpac is required to assess the recoverability of goodwill and other intangible asset balances at least annually or wherever an indicator of impairment exists. For this purpose, Westpac uses a discounted cash flow calculation. Changes in the methodology or assumptions in calculations together with changes in expected cash flows, could materially impact this assessment.
Estimates and assumptions used in assessing the useful life of an asset can also be affected by a range of factors including changes in strategy, changes in technology and regulatory requirements.
In the event that an asset is no longer in use, or its value has been reduced or that its estimated useful life has declined, an impairment will be recorded, adversely impacting the Group’s financial performance.
We could suffer losses due to insurance risk
Insurance risk is the risk in our licensed life insurance businesses of lapses being greater than expected, or the costs of claims being greater than expected due to a failure in product design, underwriting or reinsurance arrangements. There is also a risk of policyholders or a Court interpreting policy wording differently to the way the Group or the industry has applied it, or policy wording not being sufficiently clear.
In life insurance, risk arises primarily through mortality and morbidity (illness and injury) risks, the costs of claims relating to those risks being greater than was anticipated and policy lapses. Due to the long term nature of the life insurance business, any future adverse variation in these risks or our capacity to adjust premiums on account of these variations would be reflected in the current period. Where the business does not have adequate future profitability to offset these variations then there is a risk that accounting losses could impact our financial position.
If our reinsurance arrangements are ineffective, this could lead to more retained losses than anticipated. The Group has been unable to, and may in the future be unable to, renew reinsurance arrangements on similar terms, including in relation to the cost, duration and amount of reinsurance cover provided. There is also a risk that we will not be able to obtain and have not obtained appropriate reinsurance or insurance coverage for the risks that the Group may be exposed to.
Changes in critical accounting estimates and judgements could expose the Group to losses
The Group is required to make estimates, assumptions and judgements when applying accounting policies and preparing its financial statements, particularly in connection with the calculation of provisions (including remediation and expected credit losses) and the determination of the fair value of financial instruments. A change in a critical accounting estimate, assumption and/or judgement resulting from new information or from changes in circumstances or experience could result in the Group incurring losses greater than those anticipated or provided for.
This could have an adverse effect on the Group’s financial performance, financial condition and reputation. The Group’s financial performance and financial condition may also be impacted by changes to accounting standards or to generally accepted accounting principles.
We could suffer losses if we fail to syndicate or sell down underwritten securities
As a financial intermediary, we underwrite listed and unlisted debt and equity securities. We could suffer losses if we fail to syndicate or sell down this risk to others. This risk is more pronounced in times of heightened market volatility.

133WESTPAC GROUP 2021 ANNUAL REPORT2 G
RO
UP
PE
RFO
RM
AN
CE
3 FINA
NC
IAL STA
TEM
EN
TS1 STR
ATE
GIC
RE
PO
RT
4 SH
AR
EH
OLD
ER
INFO
RM
ATIO
N
Other Westpac business information
Non-financial summary1
Key trends across a range of non-financial areas of performance are provided in the following non-financial summary, with a more detailed account of sustainability performance included in our Sustainability Supplement and Datasheet.
(in $m unless otherwise indicated) 2021 2020 2019
Customers
Total customers (millions)2 13.9 14.1 14.2
Digitally active customers (millions)3 6.1 5.9 5.8
Branches4 997 1,105 1,145
Branches with 24/7 capability (%)5 33 36 35
ATMs⁶ 1,868 2,036 2,847
Smart ATMs (%)7 70 69 54
Change in consumer complaints (%) - Australia8 33 145 94
Change in consumer complaints (%) - New Zealand (9) 6 2
Number of approved applications for financial assistance from customers experiencing financial hardship9 81,062 75,367 52,025
Employees
Total employees (full-time equivalent)10 40,143 36,849 33,288
Voluntary attrition (%)11 11 8 11
New starter retention (%)12 83.3 85.8 84.5
Organisational Health Index (OHI)13 74 70 -
Lost Time Injury Frequency Rate (LTIFR)14 0.3 0.4 0.4
Whistleblower reporting - number of new concerns15 186 184 278
Women as percentage of the total workforce (%) 55 57 58
Women in leadership (%)16 50 50 50
Environment
Total Scope 1 and 2 emissions - (tonnes CO2-e)17 61,832 107,634 121,168
Total Scope 3 supply chain emissions - (tonnes CO2-e)18 71,738 91,616 87,262
Carbon neutrality Maintained Maintained Maintained
Sustainable lending
Climate change solutions attributable financing - Aust and NZ ($m) 10,862 10,059 9,263
Proportion of electricity generation financing in renewables including hydro - Aust and NZ (%)19 79 75 75
Electricity generation portfolio emissions intensity (tonnes CO2-e/MWh)20 0.26 0.25 0.26
Finance assessed under the Equator Principles - Group ($m)21 816 126 454
Social impact
Community investment excluding commercial sponsorships ($m) 144 153 130
Community investment as a percentage of pre-tax profits - Group (%) 1.69 3.58 1.33
Community investment as a percentage of pre-tax operating profit (cash earnings basis) 1.72 3.21 1.32
Financial education (participants)22 1,246,198 1,009,232 619,995
Supply chain
Spend with Indigenous Australian suppliers - Australia ($m)23 1.6 4.9 3.6
Other Westpac business information

134 WESTPAC GROUP 2021 ANNUAL REPORT
Other Westpac business information
1. All data represents Group performance as at 30 September unless otherwise stated.2. All customers with an active relationship (exclude channel only and potential relationships). Decrease due to the sale of some
businesses.3. Westpac Group customers who, as at 30 September, have successfully authenticated at least once into the Bank’s digital banking
platforms (including Quick zone) within the last 90 days.4. Includes all points of presence including Advisory, Community Banking Centres and Kiosks. Kiosks have been restated in comparatives.5. Branches that allow customers to self-serve 24/7 via a range of devices that allow them to withdraw and deposit cash, coin exchange
etc. (not all these services would be available at every 24/7 zone). Access determined by individual location (i.e. shopping centre opening hours may prevent 24/7 access).
6. Includes sale of 28 ATMs to Prosegur in Full Year 2021.7. ATMs with deposit taking functionality. Excludes envelope deposit machines.8. Total Australia complaints excluding WIB MyClient data. Full Year 2019 change trend reflects updates to our complaints policy and
standard which now requires people to log all complaints, even if they are resolved within five days. 9. Number of approved applications for financial assistance from Westpac Group customers experiencing financial hardship. Financial
hardship occurs when a person is willing but unable to meet their repayment obligations for a period of time due to an unexpected event or unforeseen change in circumstances, such as illness or injury, a relationship breakdown or a change in employment.
10. Full-time equivalent employees include permanent (full-time and pro-rata part-time staff) employees, and temporary (overtime, temporary and contract staff) employees.
11. Employee voluntary attrition refers to the total voluntary separation of permanent employees over the 12 months average total permanent headcount for the period (includes full time, part time and maximum term employees).
12. New starter retention over the 12 months rolling new starter headcount for the period (includes full time and part time permanent employees).
13. Organisational Health Index (OHI) is a measurement of organisational health, which is defined as the ability of an organisation to align its actions to a purpose, execute with excellence, and renew itself to achieve sustainable performance. It is measured through nine underlying outcomes, and 37 management practices, and benchmarked against a robust, global database.
14. Lost Time Injury Frequency Rate (LTIFR) measures the number of Lost Time Injuries, defined as injuries or illnesses (based on workers compensation claims accepted) resulting in an employee being unable to work for a full scheduled day (or shift) other than the day (or shift) on which the injury occurred where work was a significant contributing factor, per one million hours worked in the rolling 12 months reported.
15. Number of concerns entered into the whistleblower case management database that has come via: a direct entry by the whistleblower, the whistleblower external hotline, the Group’s Whistleblower Protection Officer, or other Eligible Recipients.
16. Women in Leadership refers to the proportion of women (permanent and maximum term) in leadership roles across the Group. It includes the CEO, Group Executives, General Managers, senior leaders with significant influence on business outcomes (direct reports to General Managers and their direct reports) large (3+) team people leaders three levels below General Manager, and Bank and Assistant Bank Managers.
17. Scope 1 emissions are the release of greenhouse gases (GHG) into the atmosphere as a result of Westpac Group’s direct operations for the period 1 July to 30 June. Australian data is prepared in accordance with the National Greenhouse and Energy Reporting Act 2007 (NGER Act). New Zealand data is prepared in accordance with the New Zealand Ministry for the Environment guidance for GHG reporting and Toitū carbonzero programme rules. Scope 2 emissions are indirect greenhouse gas emissions from consumption of purchased electricity from the Westpac’s operations for the period 1 July to 30 June. Australian data is prepared in accordance with the NGER Act 2007. New Zealand data is prepared in accordance with the New Zealand Ministry for the Environment guidance for GHG reporting and Toitū carbonzero programme rules. 2021 is the first year Westpac is reporting market-based emissions to account for renewable energy investment. The base year of our Scope 1 & 2 and Scope 3 Supply Chain GHG reduction targets is calculated applying the location-based accounting method. Historic location-based data is used as a proxy for a market-based method as electricity supplier emission factors or residual emissions factors for some international operations are not available.
18. Scope 3 emissions are indirect greenhouse gases (GHG) emitted as a consequence of Westpac Group operations but occur at sources owned or controlled by another organisation for the period 1 July to 30 June. Australian data is prepared in accordance with the Climate Active Carbon Neutral Standard for Organisations. New Zealand data is prepared in accordance with the New Zealand Ministry for the Environment guidance on GHG reporting and Toitū carbonzero programme rules. 2019 figures restated to reflect methodology update in 2020.
19. Measured as the percentage that renewables represents of Westpac Group’s indirect and direct financing (total committed exposure) to electricity generation assets in the Australian and New Zealand electricity markets.
20. Data is based on the reported exposures to electricity generation (AUD lending only). The average financed emissions intensity is calculated by weighting each loan (total committed exposures) by the emissions intensity of each company.
21. The Equator Principles is a voluntary set of standards for determining, assessing and managing social and environmental risk in project financing.
22. Total number of interactions by employees, customers and general public with financial education materials offered by the Westpac Group during the year, delivered through face to face and online platforms. Uplift from 2019 number of participants driven by the inclusion of our Life Moments and Help for your Business Education pages.
23. Annual spend with businesses that are at least 50% owned by individuals of Australian Indigenous descent and the business must be accredited by Supply Nation or listed with an Australian Indigenous Chamber of Commerce. Westpac relies on industry bodies for the verification of supplier diversity status. The 2019 and 2020 values have been adjusted due to an error identified with the accreditation process of diverse businesses, which resulted in two suppliers incorrectly flagged in the spend data. Westpac is working in collaboration with industry bodies to review and strengthen the verification processes of diverse organisations.
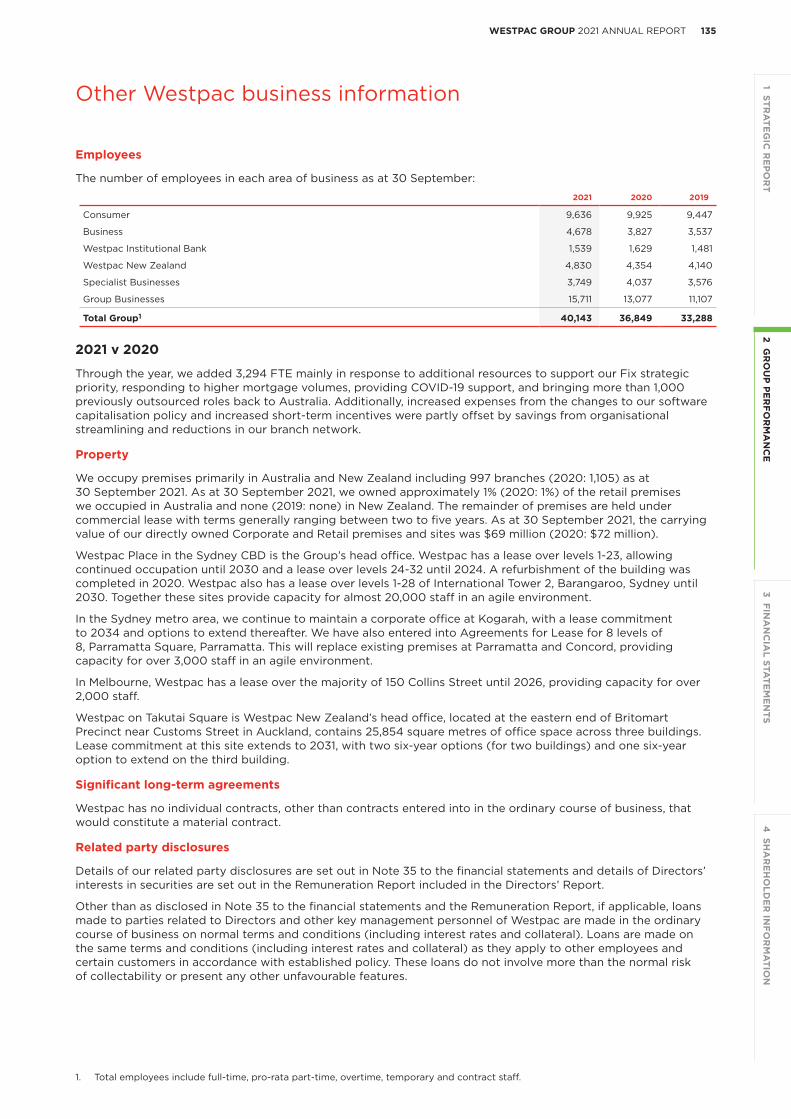
135WESTPAC GROUP 2021 ANNUAL REPORT2 G
RO
UP
PE
RFO
RM
AN
CE
3 FINA
NC
IAL STA
TEM
EN
TS1 STR
ATE
GIC
RE
PO
RT
4 SH
AR
EH
OLD
ER
INFO
RM
ATIO
N
Other Westpac business information
Employees
The number of employees in each area of business as at 30 September:
2021 2020 2019
Consumer 9,636 9,925 9,447
Business 4,678 3,827 3,537
Westpac Institutional Bank 1,539 1,629 1,481
Westpac New Zealand 4,830 4,354 4,140
Specialist Businesses 3,749 4,037 3,576
Group Businesses 15,711 13,077 11,107
Total Group1 40,143 36,849 33,288
2021 v 2020
Through the year, we added 3,294 FTE mainly in response to additional resources to support our Fix strategic priority, responding to higher mortgage volumes, providing COVID-19 support, and bringing more than 1,000 previously outsourced roles back to Australia. Additionally, increased expenses from the changes to our software capitalisation policy and increased short-term incentives were partly offset by savings from organisational streamlining and reductions in our branch network.
Property
We occupy premises primarily in Australia and New Zealand including 997 branches (2020: 1,105) as at 30 September 2021. As at 30 September 2021, we owned approximately 1% (2020: 1%) of the retail premises we occupied in Australia and none (2019: none) in New Zealand. The remainder of premises are held under commercial lease with terms generally ranging between two to five years. As at 30 September 2021, the carrying value of our directly owned Corporate and Retail premises and sites was $69 million (2020: $72 million).
Westpac Place in the Sydney CBD is the Group’s head office. Westpac has a lease over levels 1-23, allowing continued occupation until 2030 and a lease over levels 24-32 until 2024. A refurbishment of the building was completed in 2020. Westpac also has a lease over levels 1-28 of International Tower 2, Barangaroo, Sydney until 2030. Together these sites provide capacity for almost 20,000 staff in an agile environment.
In the Sydney metro area, we continue to maintain a corporate office at Kogarah, with a lease commitment to 2034 and options to extend thereafter. We have also entered into Agreements for Lease for 8 levels of 8, Parramatta Square, Parramatta. This will replace existing premises at Parramatta and Concord, providing capacity for over 3,000 staff in an agile environment.
In Melbourne, Westpac has a lease over the majority of 150 Collins Street until 2026, providing capacity for over 2,000 staff.
Westpac on Takutai Square is Westpac New Zealand’s head office, located at the eastern end of Britomart Precinct near Customs Street in Auckland, contains 25,854 square metres of office space across three buildings. Lease commitment at this site extends to 2031, with two six-year options (for two buildings) and one six-year option to extend on the third building.
Significant long-term agreements
Westpac has no individual contracts, other than contracts entered into in the ordinary course of business, that would constitute a material contract.
Related party disclosures
Details of our related party disclosures are set out in Note 35 to the financial statements and details of Directors’ interests in securities are set out in the Remuneration Report included in the Directors’ Report.
Other than as disclosed in Note 35 to the financial statements and the Remuneration Report, if applicable, loans made to parties related to Directors and other key management personnel of Westpac are made in the ordinary course of business on normal terms and conditions (including interest rates and collateral). Loans are made on the same terms and conditions (including interest rates and collateral) as they apply to other employees and certain customers in accordance with established policy. These loans do not involve more than the normal risk of collectability or present any other unfavourable features.
1. Total employees include full-time, pro-rata part-time, overtime, temporary and contract staff.

136 WESTPAC GROUP 2021 ANNUAL REPORT
Other Westpac business information
Auditor’s remuneration
Auditor’s remuneration, including goods and services tax, to the external auditor for the years ended 30 September 2021 and 2020 is provided in Note 34 to the financial statements.
Audit related services
Westpac’s Group Finance function monitors the application of the pre-approval process in respect of audit, audit-related and non-audit services provided by PricewaterhouseCoopers (PwC) under Westpac’s Pre-Approval of Engagement of PricewaterhouseCoopers for Audit or Non-Audit Services Policy (‘Pre-Approval Policy’).
Group Finance promptly brings to the attention of the Board Audit Committee any exceptions that need to be approved pursuant to paragraph (c)(7)(i)(C) of Rule 2-01 of Regulation S-X.
The Pre-Approval Policy is communicated to Westpac’s divisions through publication on the Westpac intranet.
During the year ended 30 September 2021, there were no fees paid by Westpac to PwC that required approval by the Board Audit Committee pursuant to paragraph (c)(7)(i)(C) of Rule 2-01 of Regulation S-X.
Westpac debt programs and issuing shelves
Access in a timely and flexible manner to a diverse range of debt markets and investors is provided by the following programs and issuing shelves as at 30 September 2021:
Program Limit Issuer(s) Program/Issuing Shelf Type
Australia
No limit WBC Debt Issuance Program
New Zealand
No limit WNZL Medium Term Note Program
Euro Market
USD 20 billion WBC/WSNZL¹ Euro Commercial Paper and Certificate of Deposit Program
USD 70 billion WBC Euro Medium Term Note Program
USD 10 billion WSNZL¹ Euro Medium Term Note Program
USD 40 billion WBC² Global Covered Bond Program
EUR 5 billion WSNZL³ Global Covered Bond Program
Japan
JPY 750 billion WBC Samurai shelf
JPY 750 billion WBC Uridashi shelf
United States
USD 45 billion WBC US Commercial Paper Program
USD 10 billion WSNZL¹ US Commercial Paper Program
USD 35 billion WBC US Medium Term Note Program
No limit WBC (NY Branch) Certificate of Deposit Program
No limit WBC US Securities and Exchange Commission registered shelves
1. Notes issued under this program by Westpac Securities NZ Limited, London branch are guaranteed by Westpac New Zealand Limited, its parent company.
2. Notes issued under this program are guaranteed by BNY Trust Company of Australia Limited as trustee of the Westpac Covered Bond Trust.
3. Notes issued under this program by Westpac Securities NZ Limited, London branch are guaranteed by Westpac New Zealand Limited, its parent company, and Westpac NZ Covered Bond Limited.

Financial statementsSECTION 3
3 FINA
NC
IAL STA
TEM
EN
TS2 G
RO
UP
PE
RFO
RM
AN
CE
1 STRA
TEG
IC R
EP
OR
T4
SHA
RE
HO
LDE
R IN
FOR
MA
TION
137WESTPAC GROUP 2021 ANNUAL REPORT
Income statementsStatements of comprehensive incomeBalance sheetsStatements of changes in equityCash flow statements
Note 1 Financial statements preparation
Financial performanceNote 2 Segment reportingNote 3 Net interest incomeNote 4 Non-interest incomeNote 5 Operating expensesNote 6 Impairment chargesNote 7 Income taxNote 8 Earnings per shareNote 9 Average balance sheet and interest rates
Financial assets and financial liabilitiesNote 10 Trading securities and financial assets measured
at fair value through income statement (FVIS)Note 11 Investment securitiesNote 12 LoansNote 13 Provisions for expected credit lossesNote 14 Other financial assetsNote 15 Life insurance assets and life insurance liabilitiesNote 16 Deposits and other borrowingsNote 17 Other financial liabilitiesNote 18 Debt issuesNote 19 Loan capitalNote 20 Derivative financial instrumentsNote 21 Financial riskNote 22 Fair values of financial assets and financial
liabilitiesNote 23 Offsetting financial assets and financial liabilitiesNote 24 Securitisation, covered bonds and other
transferred assets
Intangible assets, provisions, commitments and contingenciesNote 25 Intangible assetsNote 26 Provisions, contingent liabilities, contingent
assets and credit commitments
Capital and dividendsNote 27 Shareholders’ equityNote 28 Capital adequacyNote 29 Dividends
Group structureNote 30 Investments in subsidiaries and associatesNote 31 Structured entities
OtherNote 32 Share-based paymentsNote 33 Superannuation commitmentsNote 34 Auditor’s remunerationNote 35 Related party disclosuresNote 36 Notes to the cash flow statementsNote 37 Assets and liabilities held for sale Note 38 Subsequent events
Statutory statementsDirectors’ declarationIndependent auditor’s report to the members of Westpac Banking CorporationLimitation on Independent Registered Public Accounting Firm’s Liability

138 WESTPAC GROUP 2021 ANNUAL REPORT
Westpac Banking Corporation
Consolidated Parent Entity
$m Note 2021 2020 2019 2021 2020
Interest income:
Calculated using the effective interest rate method 3 22,132 26,596 32,518 21,648 26,025
Other 3 146 451 704 258 598
Total interest income 22,278 27,047 33,222 21,906 26,623
Interest expense 3 (5,420) (10,351) (16,315) (7,870) (12,539)
Net interest income 16,858 16,696 16,907 14,036 14,084
Net fee income 4 1,482 1,592 1,655 1,224 1,359
Net wealth management and insurance income 4 1,211 751 1,029 - -
Trading income 4 719 895 929 661 876
Other income 4 952 249 129 2,308 1,597
Net operating income before operating expenses and impairment (charges)/benefits 21,222 20,183 20,649 18,229 17,916
Operating expenses 5 (13,311) (12,739) (10,106) (11,915) (10,772)
Impairment (charges)/benefits 6 590 (3,178) (794) 447 (2,691)
Profit before income tax expense 8,501 4,266 9,749 6,761 4,453
Income tax expense 7 (3,038) (1,974) (2,959) (2,148) (1,795)
Net profit 5,463 2,292 6,790 4,613 2,658
Net profit attributable to non-controlling interests (NCI) (5) (2) (6) - -
Net profit attributable to owners of Westpac Banking Corporation (WBC) 5,458 2,290 6,784 4,613 2,658
Earnings per share (cents)
Basic 8 149.4 63.7 196.5
Diluted 8 137.8 63.7 189.5
The above income statements should be read in conjunction with the accompanying notes.
Income statements for the years ended 30 September

3 FINA
NC
IAL STA
TEM
EN
TS2 G
RO
UP
PE
RFO
RM
AN
CE
1 STRA
TEG
IC R
EP
OR
T4
SHA
RE
HO
LDE
R IN
FOR
MA
TION
139WESTPAC GROUP 2021 ANNUAL REPORT
Westpac Banking Corporation
Consolidated Parent Entity$m 2021 2020 2019 2021 2020
Net profit 5,463 2,292 6,790 4,613 2,658
Other comprehensive income/(expense)
Items that may be reclassified subsequently to profit or loss
Gains/(losses) recognised in equity on:
Debt securities measured at fair value through other comprehensive income (FVOCI) 578 357 (46) 729 289
Cash flow hedging instruments 296 (95) (203) 177 (28)
Transferred to income statements:
Debt securities measured at FVOCI (195) (79) (29) (195) (79)
Cash flow hedging instruments 39 218 197 (13) 150
Foreign currency translation reserve - 55 (10) - 55
Loss allowance on debt securities measured at FVOCI 2 2 - 2 2
Exchange differences on translation of foreign operations (net of associated hedges) 51 (168) 182 (1) (131)
Income tax on items taken to or transferred from equity:
Debt securities measured at FVOCI (119) (81) 20 (162) (62)
Cash flow hedging instruments (97) (36) 2 (49) (37)
Items that will not be reclassified subsequently to profit or loss
Gains/(losses) on equity instruments measured at FVOCI (net of tax) 48 (21) 11 (2) 1
Own credit adjustment on financial liabilities designated at fair value (net of tax) (10) (39) (10) (10) (39)
Remeasurement of defined benefit obligation recognised in equity (net of tax) 119 (115) (276) 108 (110)
Other comprehensive income/(expense) (net of tax) 712 (2) (162) 584 11
Total comprehensive income 6,175 2,290 6,628 5,197 2,669
Attributable to:
Owners of WBC 6,171 2,291 6,620 5,197 2,669
NCI 4 (1) 8 - -
Total comprehensive income 6,175 2,290 6,628 5,197 2,669
The above statements of comprehensive income should be read in conjunction with the accompanying notes.
Statements of comprehensive incomefor the years ended 30 September

140 WESTPAC GROUP 2021 ANNUAL REPORT
Westpac Banking Corporation
Consolidated Parent Entity$m Note 2021 2020 2021 2020
Assets
Cash and balances with central banks 36 71,353 30,129 62,754 25,436
Collateral paid 4,232 4,778 4,055 4,641
Trading securities and financial assets measured at fair value through income statement (FVIS) 10 21,101 40,667 18,779 38,030
Derivative financial instruments 20 19,353 23,367 19,127 22,794
Investment securities 11 83,417 91,539 77,863 85,826
Loans 12 709,784 693,059 618,413 607,824
Other financial assets 14 6,394 5,474 5,486 4,745
Current tax assets 31 - 22 -
Life insurance assets 15 - 3,593 - -
Due from subsidiaries - - 175,346 180,979
Investment in subsidiaries - - 6,287 6,475
Investment in associates 58 61 34 57
Property and equipment 2,853 3,910 2,386 3,447
Deferred tax assets 7 2,437 3,064 2,093 2,497
Intangible assets 25 10,109 11,497 8,530 9,630
Other assets 567 808 499 421
Assets held for sale 37 4,188 - 1,015 -
Total assets 935,877 911,946 1,002,689 992,802
Liabilities
Collateral received 2,368 2,250 2,189 1,862
Deposits and other borrowings 16 626,955 591,131 550,187 521,613
Other financial liabilities 17 50,309 40,925 47,263 40,156
Derivative financial instruments 20 18,059 23,054 17,889 22,779
Debt issues 18 128,779 150,325 108,210 127,666
Current tax liabilities 71 70 15 13
Life insurance liabilities 15 - 1,396 - -
Due to subsidiaries - - 178,816 186,263
Provisions 26 3,571 5,287 3,254 4,983
Deferred tax liabilities 7 90 126 - -
Other liabilities 3,679 5,359 2,990 3,770
Liabilities held for sale 37 837 - 10 -
Total liabilities excluding loan capital 834,718 819,923 910,823 909,105
Loan capital 19 29,067 23,949 29,067 23,949
Total liabilities 863,785 843,872 939,890 933,054 Net assets 72,092 68,074 62,799 59,748
Shareholders’ equity
Share capital:
Ordinary share capital 27 41,601 40,509 41,601 40,509
Treasury shares and Restricted Share Plan (RSP) treasury shares 27 (606) (563) (664) (621)
Reserves 27 2,227 1,544 2,148 1,576
Retained profits 28,813 26,533 19,714 18,284
Total equity attributable to owners of WBC 72,035 68,023 62,799 59,748
NCI 27 57 51 - -
Total shareholders’ equity and NCI 72,092 68,074 62,799 59,748
The above balance sheets should be read in conjunction with the accompanying notes.
Balance sheetsas at 30 September

3 FINA
NC
IAL STA
TEM
EN
TS2 G
RO
UP
PE
RFO
RM
AN
CE
1 STRA
TEG
IC R
EP
OR
T4
SHA
RE
HO
LDE
R IN
FOR
MA
TION
141WESTPAC GROUP 2021 ANNUAL REPORT
Westpac Banking Corporation
Total equity Totalattributable shareholders’
Consolidated Share capital Reserves Retained to owners NCI equity$m (Note 27) (Note 27) profits of WBC (Note 27) and NCI
Balance as at 30 September 2018 35,561 1,077 27,883 64,521 52 64,573
Impact on adoption of new accounting standards - 2 (727) (725) - (725)
Restated opening balance 35,561 1,079 27,156 63,796 52 63,848 Net profit - - 6,784 6,784 6 6,790 Net other comprehensive income/(expense) - 122 (286) (164) 2 (162)
Total comprehensive income/(expense) - 122 6,498 6,620 8 6,628 Transactions in capacity as equity holders
Dividends on ordinary shares1 - - (6,466) (6,466) - (6,466)
Dividend reinvestment plan 1,489 - - 1,489 - 1,489
Other equity movementsShare-based payment arrangements - 108 - 108 - 108
Purchase of shares (33) - - (33) - (33)
Net acquisition of treasury shares (62) - - (62) - (62)
Other - 2 - 2 (7) (5)
Total contributions and distributions 1,394 110 (6,466) (4,962) (7) (4,969)Balance as at 30 September 2019 36,955 1,311 27,188 65,454 53 65,507 Net profit - - 2,290 2,290 2 2,292 Net other comprehensive income/(expense) - 155 (154) 1 (3) (2)
Total comprehensive income/(expense) - 155 2,136 2,291 (1) 2,290 Transactions in capacity as equity holders
Share issuances 2,751 - - 2,751 - 2,751
Dividends on ordinary shares1 - - (2,791) (2,791) - (2,791)
Dividend reinvestment plan 273 - - 273 - 273
Other equity movementsShare-based payment arrangements - 78 - 78 - 78
Purchase of shares (29) - - (29) - (29)
Net acquisition of treasury shares (10) - - (10) - (10)
Other 6 - - 6 (1) 5
Total contributions and distributions 2,991 78 (2,791) 278 (1) 277 Balance as at 30 September 2020 39,946 1,544 26,533 68,023 51 68,074
Impact from a change in accounting policy2 - - (40) (40) - (40)
Restated opening balance 39,946 1,544 26,493 67,983 51 68,034 Net profit - - 5,458 5,458 5 5,463 Net other comprehensive income/(expense) - 604 109 713 (1) 712
Total comprehensive income/(expense) - 604 5,567 6,171 4 6,175 Transactions in capacity as equity holders
Dividends on ordinary shares1 - - (3,247) (3,247) - (3,247)
Dividend reinvestment plan 401 - - 401 - 401
Dividend reinvestment plan underwrite 719 - - 719 - 719
Other equity movementsShare-based payment arrangements - 86 - 86 - 86
Purchase of shares (28) - - (28) - (28)
Net acquisition of treasury shares (43) - - (43) - (43)
Other - (7) - (7) 2 (5)
Total contributions and distributions 1,049 79 (3,247) (2,119) 2 (2,117)Balance as at 30 September 2021 40,995 2,227 28,813 72,035 57 72,092
The above statements of changes in equity should be read in conjunction with the accompanying notes.
Statements of changes in equityfor the years ended 30 September
1. 2021 consisted of 2021 interim dividend of 58 cents per share ($2,127 million) and 2020 final dividend of 31 cents per share ($1,120 million) (2020: 2019 final dividend of 80 cents per share ($2,791 million), 2019: 2019 interim dividend of 94 cents per share ($3,239 million) and 2018 final dividend of 94 cents per share ($3,227 million)), all fully franked at 30%.
2. Refer to Note 1 for further details.

142 WESTPAC GROUP 2021 ANNUAL REPORT
Westpac Banking Corporation
Total equityattributable
Parent Entity Share capital Reserves Retained to owners$m (Note 27) (Note 27) profits of WBC
Balance as at 30 September 2019 36,933 1,338 18,567 56,838
Net profit - - 2,658 2,658
Net other comprehensive income/(expense) - 160 (149) 11
Total comprehensive income/(expense) - 160 2,509 2,669
Transactions in capacity as equity holders
Share issuances 2,751 - - 2,751
Dividends on ordinary shares1 - - (2,792) (2,792)
Dividend reinvestment plan 273 - - 273
Other equity movements
Share-based payment arrangements - 78 - 78
Purchase of shares (29) - - (29)
Net acquisition of treasury shares (46) - - (46)
Other 6 - - 6
Total contributions and distributions 2,955 78 (2,792) 241
Balance as at 30 September 2020 39,888 1,576 18,284 59,748
Impact from a change in accounting policy2 - - (34) (34)
Restated opening balance 39,888 1,576 18,250 59,714
Net profit - - 4,613 4,613
Net other comprehensive income/(expense) - 486 98 584
Total comprehensive income/(expense) - 486 4,711 5,197
Transactions in capacity as equity holders
Dividends on ordinary shares1 - - (3,247) (3,247)
Dividend reinvestment plan 401 - - 401
Dividend reinvestment plan underwrite 719 - - 719
Other equity movements
Share-based payment arrangements - 86 - 86
Purchase of shares (28) - - (28)
Net acquisition of treasury shares (43) - - (43)
Total contributions and distributions 1,049 86 (3,247) (2,112)
Balance as at 30 September 2021 40,937 2,148 19,714 62,799
The above statements of changes in equity should be read in conjunction with the accompanying notes.
1. 2021 consisted of 2021 interim dividend of 58 cents per share ($2,127 million) and 2020 final dividend of 31 cents per share ($1,120 million) (2020: 2019 final dividend of 80 cents per share ($2,791 million)), all fully franked at 30%.
2. Refer to Note 1 for further details.
Statements of changes in equityfor the years ended 30 September

3 FINA
NC
IAL STA
TEM
EN
TS2 G
RO
UP
PE
RFO
RM
AN
CE
1 STRA
TEG
IC R
EP
OR
T4
SHA
RE
HO
LDE
R IN
FOR
MA
TION
143WESTPAC GROUP 2021 ANNUAL REPORT
Westpac Banking Corporation
Consolidated Parent Entity$m Note 2021 2020 2019 2021 2020
Cash flows from operating activitiesInterest received 22,430 27,215 33,093 22,069 26,830 Interest paid (5,677) (11,466) (16,486) (8,054) (13,543)Dividends received excluding life business 4 16 6 1,186 763 Other non-interest income received 3,340 2,894 3,865 3,313 2,330 Operating expenses paid (10,941) (8,598) (9,080) (10,022) (6,967)Income tax paid excluding life business (2,639) (3,080) (3,406) (2,343) (2,732)Life business:
Receipts from policyholders and customers 976 2,235 2,189 - - Interest and other items of similar nature 22 21 6 - - Dividends received 12 306 553 - - Payments to policyholders and suppliers (1,168) (2,302) (2,250) - - Income tax paid (49) (6) (94) - -
Cash flows from operating activities before changes in operating assets and liabilities 6,310 7,235 8,396 6,149 6,681
Net (increase)/decrease in:Collateral paid 305 348 (847) 339 329 Trading securities and financial assets measured at FVIS 19,316 (8,756) (7,629) 18,625 (8,266)Derivative financial instruments (2,420) 1,851 7,605 (1,874) 2,103 Loans (15,098) 18,272 (4,188) (11,228) 21,273 Other financial assets (274) 273 336 258 283 Life insurance assets and life insurance liabilities (593) (277) (134) - - Other assets 6 70 (13) (23) 50
Net increase/(decrease) in:Collateral received 93 (1,096) 1,007 312 (1,072)Deposits and other borrowings 33,737 28,910 1,113 28,696 20,859 Other financial liabilities 9,036 11,817 1,463 6,500 11,866 Other liabilities (8) 4 (5) (4) (7)
Net cash provided by/(used in) operating activities 36 50,410 58,651 7,104 47,750 54,099 Cash flows from investing activities
Proceeds from investment securities 34,066 33,080 19,768 32,006 29,807 Purchase of investment securities (28,840) (51,332) (29,527) (26,955) (47,311)Net movement in amounts due to/from controlled entities - - - (1,852) (665)Proceeds from disposal of controlled entities, net of cash disposed 36 1,272 - (1) - - Net (increase)/decrease in investments in controlled entities - - - 125 (315)Proceeds from disposal of associates 45 - 45 - - Purchase of associates (8) (8) (25) (2) (6)Proceeds from disposal of property and equipment 62 58 157 38 32 Purchase of property and equipment (234) (240) (280) (156) (165)Purchase of intangible assets (740) (1,035) (906) (638) (955)
Net cash provided by/(used in) investing activities 5,623 (19,477) (10,769) 2,566 (19,578)Cash flows from financing activities
Proceeds from debt issues (net of issue costs) 46,799 34,766 61,484 37,868 27,487 Redemption of debt issues (65,272) (65,160) (63,313) (54,425) (55,761)Payments for the principal portion of lease liabilities (507) (543) - (455) (499)Issue of loan capital (net of issue costs) 7,628 2,225 4,935 7,628 2,225 Redemption of loan capital (1,548) (262) (1,662) (1,548) (262)Proceeds from issuances of shares - 2,751 - - 2,751 Proceeds from dividend reinvestment plan underwrite 719 - - 719 - Purchase of shares relating to share-based payment arrangements (28) (29) (33) (28) (29)Purchase of RSP treasury shares (43) (46) (69) (43) (46)Net sale/(purchase) of other treasury shares - 14 7 - - Payment of dividends (2,846) (2,518) (4,977) (2,846) (2,519)Dividends paid to NCI (2) (1) (5) - -
Net cash provided by/(used in) financing activities (15,100) (28,803) (3,633) (13,130) (26,653)Net increase/(decrease) in cash and balances with central banks 40,933 10,371 (7,298) 37,186 7,868 Effect of exchange rate changes on cash and balances with central banks 298 (301) 569 132 (124)Cash and balances with central banks included in assets held for sale (7) - - - - Cash and balances with central banks as at beginning of year 30,129 20,059 26,788 25,436 17,692 Cash and balances with central banks as at end of year 36 71,353 30,129 20,059 62,754 25,436
The above cash flow statements should be read in conjunction with the accompanying notes.
Cash flow statementsfor the years ended 30 September

144 WESTPAC GROUP 2021 ANNUAL REPORT
Notes to the financial statements
Note 1. Financial statements preparation
This financial report of Westpac Banking Corporation (the Parent Entity), together with its controlled entities (the Group or Westpac), for the year ended 30 September 2021, was authorised for issue by the Board of Directors on 31 October 2021. The Directors have the power to amend and reissue the financial report.
The principal accounting policies are set out below and in the relevant notes to the financial statements. The accounting policy for the recognition and derecognition of financial assets and financial liabilities precedes Note 10. These accounting policies provide details of the accounting treatments adopted for complex balances and where accounting standards provide policy choices. These policies have been consistently applied to all the years presented, unless otherwise stated.
a. Basis of preparation
(i) Basis of accounting
This financial report is a general purpose financial report prepared in accordance with:
• the requirements for an Authorised Deposit-taking Institution (ADI) under the Banking Act 1959 (as amended);
• Australian Accounting Standards (AAS) and Interpretations as issued by the Australian Accounting Standards Board (AASB); and
• the Corporations Act 2001.
Westpac Banking Corporation is a for-profit entity for the purposes of preparing this financial report.
The financial report also complies with International Financial Reporting Standards (IFRS) as issued by the International Accounting Standards Board (IASB) and Interpretations as issued by the IFRS Interpretations Committee (IFRIC). It also includes additional disclosures required for foreign registrants by the United States Securities and Exchange Commission (US SEC).
In September 2020, the SEC amended these disclosure requirements which are effective for the Group’s 30 September 2022 year end unless early adopted. The Group has early adopted these requirements for the 30 September 2021 year end. The key changes are the removal of some disclosures considered to be superseded or duplicated by other SEC reporting requirements or relevant accounting standards as well as introducing some additional disclosure requirements. The key additional disclosure requirements for the Group are more granular maturity (refer to Note 12) and write-off disclosures for loans (refer to Note 13) and disclosure of uninsured deposits, i.e. those deposits which either do not have a form of government based deposit insurance scheme or are in excess of the insurance scheme limit (refer to Note 16).
All amounts have been rounded in accordance with ASIC Corporations (Rounding in Financial/Directors’ Reports) Instrument 2016/191, to the nearest million dollars, unless otherwise stated.
(ii) Historical cost convention
The financial report has been prepared under the historical cost convention, as modified by applying fair value accounting to financial assets and financial liabilities (including derivative instruments) measured at fair value through income statement (FVIS) or in other comprehensive income (OCI).
(iii) Changes in accounting policy
Software-as-a-Service (SaaS) arrangements
The Group previously capitalised costs incurred in configuring or customising Software-as-a-Service (SaaS) arrangements as intangible assets as the Group considered that it would benefit from these implementation costs over the contract term of the SaaS arrangements. Following the IFRS Interpretations Committee (IFRIC) agenda decision on Configuration or Customisation Costs in a Cloud Computing Arrangement which was published in April 2021, the Group has reconsidered its accounting treatment and adopted the treatment set out in this IFRIC agenda decision. The revised accounting policy capitalises these costs as intangible assets only if the implementation activities create an intangible asset that the entity controls and the intangible asset meets the recognition criteria. Costs that do not meet these criteria are expensed as incurred, unless they are paid to the suppliers of the SaaS arrangement to significantly customise the cloud-based software for the Group, in which case they are recognised as a prepayment for services and amortised over the expected period of use of the SaaS arrangement.
Notes to the financial statements
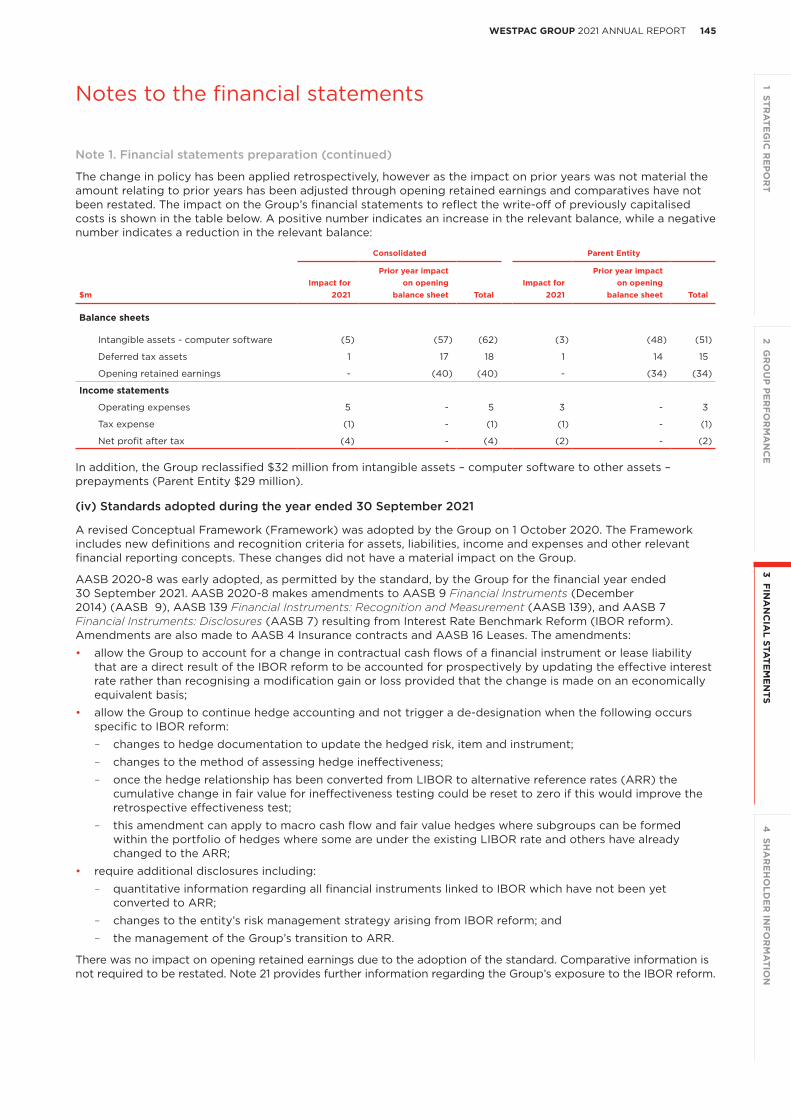
3 FINA
NC
IAL STA
TEM
EN
TS2 G
RO
UP
PE
RFO
RM
AN
CE
1 STRA
TEG
IC R
EP
OR
T4
SHA
RE
HO
LDE
R IN
FOR
MA
TION
145WESTPAC GROUP 2021 ANNUAL REPORT
Notes to the financial statements
The change in policy has been applied retrospectively, however as the impact on prior years was not material the amount relating to prior years has been adjusted through opening retained earnings and comparatives have not been restated. The impact on the Group’s financial statements to reflect the write-off of previously capitalised costs is shown in the table below. A positive number indicates an increase in the relevant balance, while a negative number indicates a reduction in the relevant balance:
Consolidated Parent Entity
Prior year impact Prior year impactImpact for on opening Impact for on opening
$m 2021 balance sheet Total 2021 balance sheet Total
Balance sheets
Intangible assets - computer software (5) (57) (62) (3) (48) (51)
Deferred tax assets 1 17 18 1 14 15
Opening retained earnings - (40) (40) - (34) (34)
Income statements
Operating expenses 5 - 5 3 - 3
Tax expense (1) - (1) (1) - (1)
Net profit after tax (4) - (4) (2) - (2)
In addition, the Group reclassified $32 million from intangible assets – computer software to other assets – prepayments (Parent Entity $29 million).
(iv) Standards adopted during the year ended 30 September 2021
A revised Conceptual Framework (Framework) was adopted by the Group on 1 October 2020. The Framework includes new definitions and recognition criteria for assets, liabilities, income and expenses and other relevant financial reporting concepts. These changes did not have a material impact on the Group.
AASB 2020-8 was early adopted, as permitted by the standard, by the Group for the financial year ended 30 September 2021. AASB 2020-8 makes amendments to AASB 9 Financial Instruments (December 2014) (AASB 9), AASB 139 Financial Instruments: Recognition and Measurement (AASB 139), and AASB 7 Financial Instruments: Disclosures (AASB 7) resulting from Interest Rate Benchmark Reform (IBOR reform). Amendments are also made to AASB 4 Insurance contracts and AASB 16 Leases. The amendments:
• allow the Group to account for a change in contractual cash flows of a financial instrument or lease liability that are a direct result of the IBOR reform to be accounted for prospectively by updating the effective interest rate rather than recognising a modification gain or loss provided that the change is made on an economically equivalent basis;
• allow the Group to continue hedge accounting and not trigger a de-designation when the following occurs specific to IBOR reform:
– changes to hedge documentation to update the hedged risk, item and instrument;
– changes to the method of assessing hedge ineffectiveness;
– once the hedge relationship has been converted from LIBOR to alternative reference rates (ARR) the cumulative change in fair value for ineffectiveness testing could be reset to zero if this would improve the retrospective effectiveness test;
– this amendment can apply to macro cash flow and fair value hedges where subgroups can be formed within the portfolio of hedges where some are under the existing LIBOR rate and others have already changed to the ARR;
• require additional disclosures including:
– quantitative information regarding all financial instruments linked to IBOR which have not been yet converted to ARR;
– changes to the entity’s risk management strategy arising from IBOR reform; and
– the management of the Group’s transition to ARR.
There was no impact on opening retained earnings due to the adoption of the standard. Comparative information is not required to be restated. Note 21 provides further information regarding the Group’s exposure to the IBOR reform.
Note 1. Financial statements preparation (continued)

146 WESTPAC GROUP 2021 ANNUAL REPORT
Notes to the financial statements
(v) Business combinations
Business combinations are accounted for using the acquisition method of accounting. Acquisition cost is measured as the aggregate of the fair value at the date of acquisition of the assets given, equity instruments issued or liabilities incurred or assumed. Acquisition-related costs are expensed as incurred (except for those costs arising on the issue of equity instruments which are recognised directly in equity).
Identifiable assets acquired and liabilities and contingent liabilities assumed in a business combination are measured at fair value on the acquisition date. Goodwill is measured as the excess of the acquisition cost, the amount of any non-controlling interest and the fair value of any previous Westpac equity interest in the acquiree, over the fair value of the identifiable net assets acquired.
(vi) Foreign currency translation
Functional and presentational currency
The consolidated financial statements are presented in Australian dollars which is the Parent Entity’s functional and presentation currency. The functional currency of offshore entities is usually the main currency of the economy it operates in.
Transactions and balances
Foreign currency transactions are translated into the functional currency of the relevant branch or subsidiary using the exchange rates prevailing at the dates of the transactions. Foreign exchange (FX) gains and losses resulting from the settlement of such transactions and from the translation at year end exchange rates of monetary assets and liabilities denominated in foreign currencies are recognised in the income statement, except when deferred in OCI for qualifying cash flow hedges and qualifying net investment hedges.
Foreign operations
Assets and liabilities of foreign branches and subsidiaries that have a functional currency other than the Australian dollar are translated at exchange rates prevailing on the balance date. Income and expenses are translated at average exchange rates prevailing during the year. Equity balances are translated at historical exchange rates.
The resulting exchange differences are recognised in the foreign currency translation reserve and in OCI.
Where the group hedges the currency translation risk arising from net investments in foreign operations, the gains or losses on the hedging instruments are also reflected in OCI to the extent the hedge is effective. When all or part of a foreign operation is disposed or borrowings that are part of the net investments are repaid, a proportionate share of such exchange differences is recognised in the income statement as part of the gain or loss on disposal or repayment of borrowing.
(vii) Comparative revisions
Comparative information has been revised where appropriate to conform to changes in presentation in the current year and to enhance comparability.
b. Critical accounting assumptions and estimates
Applying the Group’s accounting policies requires the use of judgement, assumptions and estimates which impact the financial information. The significant assumptions and estimates used are discussed in the relevant notes below:
• Note 7 Income tax
• Note 13 Provisions for expected credit losses
• Note 15 Life insurance assets and life insurance liabilities
• Note 22 Fair values of financial assets and financial liabilities
• Note 25 Intangible assets
• Note 26 Provisions, contingent liabilities, contingent assets and credit commitments
• Note 33 Superannuation commitments
Intangible assets – computer software
Effective from 1 October 2020, the Group made a prospective change to computer software capitalisation by increasing the threshold for capitalisation for software development costs from a total project spend of $1 million to a total project spend of $20 million. This does not have a material effect on the Group’s financial statements. The change increased operating expenses and reduced profit before income tax in the year by $191 million.
Note 1. Financial statements preparation (continued)

3 FINA
NC
IAL STA
TEM
EN
TS2 G
RO
UP
PE
RFO
RM
AN
CE
1 STRA
TEG
IC R
EP
OR
T4
SHA
RE
HO
LDE
R IN
FOR
MA
TION
147WESTPAC GROUP 2021 ANNUAL REPORT
Notes to the financial statements
Impact of COVID-19
The COVID-19 pandemic and the measures put in place domestically and globally to control the spread of the virus continue to impact global economies and financial markets. As a result, this remains a source of uncertainty and judgement is required in relation to our critical accounting assumptions and estimates, primarily relating to:
• expected credit losses (ECL); and
• recoverable amount assessments of intangible assets.
As there is a higher than usual degree of uncertainty associated with these assumptions and estimates, the actual outcomes may differ significantly which may impact accounting estimates included in these financial statements. The impact of COVID-19 is discussed further in each of the related notes.
c. Future developments in accounting standards
AASB 17 Insurance Contracts (AASB 17) was issued on 19 July 2017 and will be effective for the 30 September 2024 year end unless early adopted. This will replace AASB 4 Insurance Contracts (AASB 4), AASB 1023 General Insurance Contracts and AASB 1038 Life Insurance Contracts. However, the Group’s remaining insurance businesses are classified as held for sale with the sale transactions expected to complete prior to AASB 17 taking effect. As a result, we do not anticipate the standard having any impact on the Group.
Other amendments to existing standards that are not yet effective are not expected to have a material impact to the Group.
Note 1. Financial statements preparation (continued)

148 WESTPAC GROUP 2021 ANNUAL REPORT
Notes to the financial statements
FINANCIAL PERFORMANCE
Note 2. Segment reporting
Accounting policy
Operating segments are presented on a basis consistent with information provided internally to Westpac’s key decision makers and reflect the management of the business, rather than the legal structure of the Group.
Internally, Westpac uses ‘cash earnings’ in assessing the financial performance of its divisions. Management believes this allows the Group to:
• more effectively assess current year performance against prior years;
• compare performance across business divisions; and
• compare performance across peer companies.
Cash earnings is viewed as a measure of the level of profit that is generated by ongoing operations and is therefore typically considered in assessing distributions, including dividends. Cash earnings is neither a measure of cash flow nor net profit determined on a cash accounting basis, as it includes both cash and non-cash adjustments to statutory net profit.
To determine cash earnings, three categories of adjustments are made to statutory results:
• material items that key decision makers at the Westpac Group believe do not reflect ongoing operations;
• items that are not typically considered when dividends are recommended, mainly economic hedging impacts; and
• accounting reclassifications between individual line items that do not impact statutory results.
Internal charges and transfer pricing adjustments have been reflected in the performance of each operating segment. Inter-segment pricing is determined on an arm’s length basis.
Reportable operating segments
We are one of Australia and New Zealand’s leading providers of financial services, operating under multiple brands, with a small presence in Europe, North America and Asia. We operate through an extensive branch and ATM network, significant online capability, and call centres supported by specialist relationship and product managers. Our operations comprise the following key divisions:• Consumer provides banking products, including mortgages, credit cards, personal loans, and savings and
deposit products;• Business serves the banking needs of SME and Commercial customers (including Agribusiness) and provides
banking and advisory services to high net worth individuals through Private Wealth;• Westpac Institutional Bank (WIB) provides a broad range of financial products and services to corporate,
institutional and government customers;• Westpac New Zealand provides banking, wealth and insurance products and services for consumer, business
and institutional customers in New Zealand; • Specialist Businesses comprises the operations that Westpac ultimately plans to exit with agreements in place
for the sale of Westpac Life Insurance and motor vehicle dealer finance and novated leasing businesses. These sales are expected to finalise in 2022, subject to regulatory approvals. Other operations include investment products and services (including margin lending and equities broking), superannuation and retirement products as well as wealth administration platforms. It also manages Westpac Pacific which provides a full range of banking services in Fiji and Papua New Guinea; and
• Group Businesses includes the results of unallocated support functions such as Treasury, Chief Operating Office and Core Support. It also includes Group-wide elimination entries arising on consolidation, centrally raised provisions and other unallocated revenue and expenses.
On 17 March 2021, Westpac announced that it was bringing together the leadership of its Consumer and Business divisions into a new Consumer and Business Banking division. No change has been made to segment reporting for 30 September 2021 as these changes are not yet reflected in internal reporting to Westpac’s key decision makers.

3 FINA
NC
IAL STA
TEM
EN
TS2 G
RO
UP
PE
RFO
RM
AN
CE
1 STRA
TEG
IC R
EP
OR
T4
SHA
RE
HO
LDE
R IN
FOR
MA
TION
149WESTPAC GROUP 2021 ANNUAL REPORT
Notes to the financial statements
The following tables present the segment results on a cash earnings basis for the Group.
Westpac Westpac Net cashInstitutional New Specialist Group earnings Income
$m Consumer Business Bank Zealand Businesses Businesses Total adjustments statement
2021Net interest income 8,405 4,065 919 1,987 503 835 16,714 144 16,858 Net fee income 393 452 555 140 69 (127) 1,482 - 1,482 Net wealth management and insurance income - 21 - 113 1,176 (104) 1,206 5 1,211 Trading income 78 72 455 58 33 19 715 4 719 Other income 17 4 92 12 212 584 921 31 952 Net operating income before operating expenses and impairment (charges)/benefits 8,893 4,614 2,021 2,310 1,993 1,207 21,038 184 21,222
Operating expenses1 (4,622) (2,530) (2,574) (1,062) (1,477) (1,018) (13,283) (28) (13,311)Impairment (charges)/benefits 125 484 (162) 79 66 (2) 590 - 590 Profit before income tax (expense)/benefit 4,396 2,568 (715) 1,327 582 187 8,345 156 8,501 Income tax (expense)/benefit (1,315) (779) 45 (377) (387) (175) (2,988) (50) (3,038)Net profit attributable to NCI - - - - (2) (3) (5) - (5)Cash earnings 3,081 1,789 (670) 950 193 9 5,352 106 5,458 Net cash earnings adjustments - - - (2) - 108 106 Net profit attributable to owners of WBC 3,081 1,789 (670) 948 193 117 5,458 Balance sheet
Loans2 407,786 134,015 67,033 88,409 12,550 (9) 709,784 Deposits and other borrowings2 235,569 158,741 97,770 75,756 11,008 48,111 626,955
2020
Net interest income 8,547 4,163 1,111 1,832 534 899 17,086 (390) 16,696 Net fee income 471 438 544 123 89 (73) 1,592 - 1,592 Net wealth management and insurance income - 22 - 158 624 (45) 759 (8) 751 Trading income 90 97 637 27 57 20 928 (33) 895 Other income 12 3 1 11 (8) 242 261 (12) 249 Net operating income before operating expenses and impairment (charges)/benefits 9,120 4,723 2,293 2,151 1,296 1,043 20,626 (443) 20,183
Operating expenses1 (4,176) (2,298) (1,316) (998) (1,548) (2,364) (12,700) (39) (12,739)Impairment (charges)/benefits (1,015) (1,371) (404) (302) (255) 169 (3,178) - (3,178)Profit before income tax (expense)/benefit 3,929 1,054 573 851 (507) (1,152) 4,748 (482) 4,266 Income tax (expense)/benefit (1,183) (320) (241) (239) 3 (158) (2,138) 164 (1,974)Net profit attributable to NCI - - - - (2) - (2) - (2)Cash earnings 2,746 734 332 612 (506) (1,310) 2,608 (318) 2,290 Net cash earnings adjustments - - - 7 (31) (294) (318)Net profit attributable to owners of WBC 2,746 734 332 619 (537) (1,604) 2,290 Balance sheetLoans 389,793 140,698 66,192 81,434 14,942 - 693,059 Deposits and other borrowings 219,259 151,939 102,851 68,473 9,260 39,349 591,131
Note 2. Segment reporting (continued)
1. Included in the Westpac Institutional Bank division in operating expenses is $1,192 million relating to impairment of assets (including goodwill and other intangible assets) for 2021 (2020: $Nil). For Specialist Businesses division, impairment of assets (including goodwill and other intangible assets) is $141 million for 2021 (2020: $571 million). For other divisions, there is no impairment of goodwill and impairment of other intangibles assets is not material.
2. Specialist Businesses excludes balances presented as held for sale (refer to Note 37 for further details).

150 WESTPAC GROUP 2021 ANNUAL REPORT
Notes to the financial statements
Westpac Westpac Net cashInstitutional New Specialist Group earnings Income
$m Consumer Business Bank Zealand Businesses Businesses Total adjustments statement
2019Net interest income 8,130 4,456 1,337 1,860 555 615 16,953 (46) 16,907 Net fee income 594 463 570 163 44 (179) 1,655 - 1,655 Net wealth management and insurance income - 16 - 177 1,319 (489) 1,023 6 1,029 Trading income 94 109 636 37 54 (23) 907 22 929 Other income 7 6 (11) 46 (5) 74 117 12 129 Net operating income before operating expenses and impairment (charges)/benefits 8,825 5,050 2,532 2,283 1,967 (2) 20,655 (6) 20,649 Operating expenses (3,794) (2,094) (1,220) (939) (847) (1,137) (10,031) (75) (10,106)Impairment (charges)/benefits (582) (172) (31) 10 (111) 92 (794) - (794)Profit before income tax (expense)/benefit 4,449 2,784 1,281 1,354 1,009 (1,047) 9,830 (81) 9,749 Income tax (expense)/benefit (1,333) (838) (356) (369) (292) 213 (2,975) 16 (2,959)Net profit attributable to NCI - - - - (5) (1) (6) - (6)Cash earnings 3,116 1,946 925 985 712 (835) 6,849 (65) 6,784 Net cash earnings adjustments - - - (1) (45) (19) (65)Net profit attributable to owners of WBC 3,116 1,946 925 984 667 (854) 6,784 Balance sheetLoans 399,279 146,867 73,572 78,005 17,216 (169) 714,770 Deposits and other borrowings 207,578 142,558 99,005 60,801 9,277 44,028 563,247
Reconciliation of cash earnings to net profit attributable to owners of WBC
$m 2021 2020 2019
Cash earnings 5,352 2,608 6,849 Cash earnings adjustments
Fair value gain/(loss) on economic hedges 138 (362) (35)Ineffective hedges (32) 61 20 Adjustments related to Pendal - (31) (45)Treasury shares - 14 (5)
Total cash earnings adjustments (post-tax) 106 (318) (65) Net profit attributable to owners of WBC 5,458 2,290 6,784
Revenue from products and services
Details of revenue from external customers by product or service are disclosed in Notes 3 and 4. No single customer amounted to greater than 10% of the Group’s revenue.
Geographic segments
Geographic segments are based on the location of the office where the following items were recognised.
2021 2020 2019
$m % $m % $m %
RevenueAustralia 22,788 85.5 26,135 85.6 31,113 84.2 New Zealand 3,509 13.2 3,439 11.3 4,520 12.2
Other overseas1 345 1.3 960 3.1 1,331 3.6 Total 26,642 100.0 30,534 100.0 36,964 100.0
Non-current assets2
Australia 11,825 91.2 14,270 92.6 12,280 93.7 New Zealand 1,082 8.3 1,015 6.6 761 5.8
Other overseas1 55 0.5 122 0.8 67 0.5 Total 12,962 100.0 15,407 100.0 13,108 100.0
1. Other overseas included Pacific Islands, Asia, the Americas and Europe. 2. Non-current assets represent property and equipment and intangible assets.
Note 2. Segment reporting (continued)

3 FINA
NC
IAL STA
TEM
EN
TS2 G
RO
UP
PE
RFO
RM
AN
CE
1 STRA
TEG
IC R
EP
OR
T4
SHA
RE
HO
LDE
R IN
FOR
MA
TION
151WESTPAC GROUP 2021 ANNUAL REPORT
Notes to the financial statements
Note 3. Net interest income
Accounting policy
Interest income and interest expense for all interest earning financial assets and interest bearing financial liabilities at amortised cost or FVOCI, detailed within the table below, are recognised using the effective interest rate method. Net income from treasury’s interest rate and liquidity management activities and the cost of the Bank levy are included in net interest income.
The effective interest rate method calculates the amortised cost of a financial instrument by discounting the financial instrument’s estimated future cash receipts or payments to their present value and allocates the interest income or interest expense, including any fees, costs, premiums or discounts integral to the instrument, over its expected life.
Interest income is calculated based on the gross carrying amount of financial assets in stages 1 and 2 of the Group’s ECL model and on the carrying amount net of the provision for ECL for financial assets in stage 3.
Consolidated Parent Entity$m 2021 2020 2019 2021 2020
Interest income1
Calculated using the effective interest rate method
Cash and balances with central banks 30 135 334 14 122
Collateral paid 16 75 201 15 74
Investment securities 1,200 1,521 1,919 1,120 1,385
Loans 20,756 24,848 30,029 17,971 21,488
Other financial assets 2 17 35 2 16
Due from subsidiaries - - - 2,476 2,940
Assets held for sale 128 - - 50 -
Total interest income calculated using the effective interest rate method 22,132 26,596 32,518 21,648 26,025
Other
Net ineffectiveness on qualifying hedges (46) 87 28 (42) 77
Trading securities and financial assets measured at FVIS and loans 192 364 676 182 343
Due from subsidiaries - - - 118 178
Assets held for sale - - - - -
Total other 146 451 704 258 598
Total interest income 22,278 27,047 33,222 21,906 26,623
Interest expense
Calculated using the effective interest rate method
Collateral received (4) (26) (57) (3) (23)
Deposits and other borrowings (1,801) (4,652) (7,967) (1,402) (3,782)
Debt issues (1,861) (2,907) (4,706) (1,655) (2,549)
Due to subsidiaries - - - (3,219) (3,601)
Loan capital (849) (800) (776) (849) (800)
Other financial liabilities (112) (98) (274) (110) (98)
Liabilities held for sale (11) - - (9) -
Total interest expense calculated using the effective interest rate method (4,638) (8,483) (13,780) (7,247) (10,853)
Other
Deposits and other borrowings (67) (402) (978) (48) (385)
Trading liabilities2 (122) (787) (915) 297 (640)
Debt issues (64) (107) (163) (58) (74)
Bank levy (392) (408) (391) (392) (408)
Due to subsidiaries - - - (296) (29)
Other interest expense (136) (164) (88) (126) (150)
Liabilities held for sale (1) - - - -
Total other (782) (1,868) (2,535) (623) (1,686)
Total interest expense (5,420) (10,351) (16,315) (7,870) (12,539)
Total net interest income 16,858 16,696 16,907 14,036 14,084
1. Interest income included items relating to compliance, regulation and remediation costs recognised as an addition in interest income of $106 million (2020: $170 million reduction, 2019: $372 million reduction) for the Group, and an addition of $149 million (2020: $164 million reduction) for the Parent Entity. Refer to Note 26 for further details.
2. Includes net impact of Treasury balance sheet management activities.

152 WESTPAC GROUP 2021 ANNUAL REPORT
Notes to the financial statements
Note 4. Non-interest income
Accounting policy
Non-interest income includes net fee income, net wealth management and insurance income, trading income and other income.
Net fee income
When another party is involved in providing goods or services to a Group customer, the Group assesses whether the nature of the arrangement with its customer is as a principal provider or an agent of another party. Where the Group is acting as an agent for another party, the income earned by the Group is the net consideration received (i.e. the gross amount received from the customer less amounts paid to a third party provider). As an agent, the net consideration represents fee income for facilitating the transaction between the customer and the third party provider with primary responsibility for fulfilling the contract.
Fee income
Fee income is recognised when the performance obligation is satisfied by transferring the promised good or service to the customer. Fee income includes facility fees, transaction fees and other non-risk fee income.
Facility fees include certain line fees, annual credit card fees and fees for providing customer bank accounts. They are recognised over the term of the facility/period of service on a straight-line basis.
Transaction fees are earned for facilitating banking transactions such as FX fees, telegraphic transfers and issuing bank cheques. Fees for these one-off transactions are recognised once the transaction has been completed. Transaction fees are also recognised for credit card transactions including interchange fees net of scheme charges. These are recognised once the transaction has been completed, however, a component of interchange fees received is deferred as unearned income as the Group has a future service obligation to customers under the Group’s credit card reward programs.
Other non-risk fee income includes advisory and underwriting fees which are recognised when the related service is completed.
Income which forms an integral part of the effective interest rate of a financial instrument is recognised using the effective interest method and recorded in interest income (for example, loan origination fees).
Fee expenses
Fee expenses include incremental external costs that vary directly with the provision of goods or services to customers. An incremental cost is one that would not have been incurred if a specific good or service had not been provided to a specific customer. Fee expenses which form an integral part of the effective interest rate of a financial instrument are recognised using the effective interest method and recorded in net interest income. Fee expenses include the costs associated with credit card loyalty programs which are recognised as an expense when the services are provided on the redemption of points as well as merchant transaction costs.
Net wealth management and insurance income
Net wealth management income
Wealth management fees earned for the ongoing management of customer funds and investments are recognised when the performance obligation is satisfied which is over the period of management.
Insurance premium income
Insurance premium income includes premiums earned for life insurance, life investment, loan mortgage insurance and general insurance products:
• life insurance premiums with a regular due date are recognised as revenue on an accrual basis;
• life investment premiums include a management fee component which is recognised as income over the period the service is provided. The deposit components of life insurance and investment contracts are not revenue and are treated as movements in life insurance liabilities;
• general insurance premium comprises amounts charged to policyholders, excluding taxes, and is recognised based on the likely pattern in which the insured risk is likely to emerge. The portion not yet earned based on the pattern assessment is recognised as unearned premium liability.
3 FINA
NC
IAL STA
TEM
EN
TS2 G
RO
UP
PE
RFO
RM
AN
CE
1 STRA
TEG
IC R
EP
OR
T4
SHA
RE
HO
LDE
R IN
FOR
MA
TION
153WESTPAC GROUP 2021 ANNUAL REPORT
Notes to the financial statements
Accounting policy (continued)Insurance claims expense
• life and general insurance contract claims are recognised as an expense when the liability is established;
• claims incurred in respect of life investment contracts represent withdrawals and are recognised as a reduction in life insurance liabilities.
Changes in life insurance liabilities
Changes in life insurance liabilities includes the change in the value of life insurance contract liabilities calculated using the margin on services methodology (MoS), specified in the Prudential Standard LPS 340 Valuation of Policy Liabilities (for discussion on MoS and critical accounting assumptions and estimates, refer to Note 15).
Regulation, competition, interest rates, taxes, securities market conditions and general economic conditions also affect the estimation of life insurance liabilities.
Trading income
• realised and unrealised gains or losses from changes in the fair value of trading assets, liabilities and derivatives are recognised in the period in which they arise (except day one profits or losses which are deferred, refer to Note 22);
• net income related to Treasury’s interest rate and liquidity management activities is included in net interest income.
Other income - dividend income
• dividends on quoted shares are recognised on the ex-dividend date;
• dividends on unquoted shares are recognised when the Company’s right to receive payment is established.
Note 4. Non-interest income (continued)

154 WESTPAC GROUP 2021 ANNUAL REPORT
Notes to the financial statements
Consolidated Parent Entity$m 2021 2020 2019 2021 2020
Net fee income
Facility fees 717 731 730 671 672
Transaction fees 993 1,021 1,225 851 891
Other non-risk fee income - 48 (76) (123) (52)
Fee income 1,710 1,800 1,879 1,399 1,511
Credit card loyalty programs (101) (102) (121) (71) (71)
Transaction fee related expenses (127) (106) (103) (104) (81)
Fee expenses (228) (208) (224) (175) (152)
Net fee income 1,482 1,592 1,655 1,224 1,359
Net wealth management and insurance income
Net wealth management income 657 631 276 - -
Life insurance premium income 1,077 1,297 1,443 - -
General insurance and lenders mortgage insurance (LMI) net premium earned 387 499 482 - -
Life insurance investment and other income2 59 64 409 - -
General insurance and LMI investment and other income 76 42 52 - -
Total insurance premium, investment and other income 1,599 1,902 2,386 - -
Life insurance claims and changes in life insurance liabilities3 (767) (1,284) (1,266) - -
General insurance and LMI claims and other expenses (278) (498) (367) - -
Total insurance claims, changes in life insurance liabilities and other expenses (1,045) (1,782) (1,633) - -
Net wealth management and insurance income 1,211 751 1,029 - -
Trading income 719 895 929 661 876
Other income
Dividends received from subsidiaries - - - 1,184 762
Transactions with subsidiaries - - - 973 579
Dividends received from other entities 4 1 6 2 1
Net gain/(loss) on sale/derecognition of associates 43 316 38 (11) 305
Net gain/(loss) on disposal of assets 7 11 61 - 9
Net gain/(loss) on hedging of overseas operations (8) - - (150) (8)
Net gain/(loss) on derivatives held for risk management purposes4 4 4 (11) 4 4
Net gain/(loss) on financial assets measured at fair value 655 (78) (39) 118 (35)
Net gain/(loss) on disposal of controlled entities and other businesses 188 - 3 - -
Rental income on operating leases 41 54 72 21 33
Share of associates’ net profit/(loss) (6) (23) (23) (2) -
Other 24 (36) 22 169 (53)
Total other income 952 249 129 2,308 1,597
Total non-interest income 4,364 3,487 3,742 4,193 3,832
Deferred income in relation to the credit card loyalty programs for the Group was $362 million as at 30 September 2021 (2020: $361 million, 2019: $322 million) and $35 million for the Parent Entity (2020: $30 million). This will be recognised as fee income as the credit card reward points are redeemed.
There were no other material contract assets or contract liabilities for the Group or the Parent Entity.
1. Non-interest income included items relating to compliance, regulation and remediation costs recognised as a reduction in non-risk fee income, net wealth management income and other income of $320 million (2020: $225 million, 2019: $860 million) for the Group, and $278 million (2020: $190 million) for the Parent Entity. Refer to Note 26 for further details.
2. Includes policyholder tax recoveries.3. Life insurance claims and changes in life insurance liabilities are nil for the Group (2020: $260 million; 2019: nil) recognised as a
result of the liability adequacy test on life insurance contracts (refer to Note 15). 2020 balance also includes a $97 million write-off of deferred acquisition costs for the Group (2019: nil) as a result of Westpac Life Insurance Limited (WLIS) ceasing to provide group life insurance products to BT Super.
4. Income from derivatives held for risk management purposes reflects the impact of economic hedges of earnings.
Note 4. Non-interest income¹ (continued)

3 FINA
NC
IAL STA
TEM
EN
TS2 G
RO
UP
PE
RFO
RM
AN
CE
1 STRA
TEG
IC R
EP
OR
T4
SHA
RE
HO
LDE
R IN
FOR
MA
TION
155WESTPAC GROUP 2021 ANNUAL REPORT
Notes to the financial statements
Note 5. Operating expenses1
Consolidated Parent Entity$m 2021 2020 2019 2021 2020
Staff expenses
Employee remuneration, entitlements and on-costs 5,369 4,428 4,320 4,666 3,744
Superannuation expense2 475 413 378 409 351
Share-based payments 97 80 108 94 76
Restructuring costs 93 94 232 92 76
Total staff expenses 6,034 5,015 5,038 5,261 4,247
Occupancy expenses
Lease expense 164 148 658 138 123
Depreciation and impairment of property and equipment3 955 708 222 845 614
Other 107 160 143 95 145
Total occupancy expenses 1,226 1,016 1,023 1,078 882
Technology expenses
Amortisation and impairment of software assets3 1,240 970 719 1,171 896
Depreciation and impairment of IT equipment3 260 272 129 228 244
Technology services 820 698 810 764 569
Software maintenance and licences 531 398 371 463 343
Telecommunications 181 216 207 157 190
Data processing 96 89 83 96 88
Total technology expenses 3,128 2,643 2,319 2,879 2,330
Other expenses
Professional and processing services 1,410 1,374 1,060 1,236 1,184
Amortisation and impairment of intangible assets and deferred expenditure3 599 523 9 512 116
Postage and stationery 156 164 179 130 130
Advertising 220 217 245 172 172
Non-lending losses 234 1,443 58 174 1,428
Impairment of investments in subsidiaries - - - 19 272
Other 304 344 175 454 11
Total other expenses 2,923 4,065 1,726 2,697 3,313
Total operating expenses 13,311 12,739 10,106 11,915 10,772
1. Operating expenses included estimated costs associated with AUSTRAC proceedings of nil (2020: $1,478 million, 2019: nil) which included a provision for penalty of nil (2020: $1,300 million, 2019: nil) for the Group and the Parent Entity. They also included compliance, regulation and remediation costs of $359 million (2020: $317 million, 2019: $196 million) for the Group and $306 million (2020: $310 million) for the Parent Entity. Refer to Note 26 for further details.
2. Superannuation expense includes both defined contribution and defined benefit expense. Further details of the Group’s defined benefit plans are in Note 33.
3. Impairment expenses included: • $275 million (2020: $5 million, 2019: nil) for property and equipment for the Group, and $248 million (2020: $4 million) for the Parent Entity; • $485 million (2020: $171 million, 2019: $25 million) for computer software for the Group, and $475 million (2020: $165 million) for the
Parent Entity; • $45 million (2020: $23 million, 2019: nil) for IT equipment for the Group, and $41 million (2020: $23 million) for the Parent Entity. • $571 million (2020: $518 million, 2019: nil) for goodwill and other intangible assets for the Group, and $487 million (2020: $116 million) for the
Parent Entity.

156 WESTPAC GROUP 2021 ANNUAL REPORT
Notes to the financial statements
Note 6. Impairment charges
Accounting policy
Impairment charges are based on an expected loss model which measures the difference between the current carrying amount and the present value of expected future cash flows taking into account past experience, current conditions and multiple probability-weighted macroeconomic scenarios for reasonably supportable future economic conditions. Further details of the calculation of ECL and the critical accounting assumptions and estimates relating to impairment charges are included in Note 13.
Impairment charges are recognised in the income statement, with a corresponding amount recognised as follows:
• Loans, debt securities at amortised cost and due from subsidiaries balances: as a reduction of the carrying value of the financial asset through an offsetting provision account (refer to Note 13);
• Debt securities at FVOCI: in reserves in OCI with no reduction of the carrying value of the debt security (refer to Note 27); and
• Credit commitments: as a provision (refer to Note 26).
Uncollectable loans
A loan may become uncollectable in full or part if, after following the Group’s loan recovery procedures, the Group remains unable to collect that loan’s contractual repayments. Uncollectable amounts are written off against their related provision for ECL, after all possible repayments have been received.
Where loans are secured, amounts are generally written off after receiving the proceeds from the security, or in certain circumstances, where the net realisable value of the security has been determined and this indicates that there is no reasonable expectation of full recovery, write-off may be earlier. Unsecured consumer loans are generally written off after 180 days past due.
The Group may subsequently be able to recover cash flows from loans written off. In the period which these recoveries are made, they are recognised in the income statement.
The following table details impairment charges.
Consolidated Parent Entity$m 2021 2020 2019 2021 2020
Provisions raised/(released)
Performing (915) 1,437 (209) (785) 1,147
Non-performing 567 1,934 1,175 563 1,717
Recoveries (242) (193) (172) (225) (173)
Impairment charges (590) 3,178 794 (447) 2,691
of which relates to:
Loans and credit commitments (567) 3,158 794 (449) 2,689
Debt securities at amortised cost (25) 18 - - -
Debt securities at FVOCI 2 2 - 2 2
Impairment charges/(benefit) (590) 3,178 794 (447) 2,691
Further details are discussed in Note 13.

3 FINA
NC
IAL STA
TEM
EN
TS2 G
RO
UP
PE
RFO
RM
AN
CE
1 STRA
TEG
IC R
EP
OR
T4
SHA
RE
HO
LDE
R IN
FOR
MA
TION
157WESTPAC GROUP 2021 ANNUAL REPORT
Notes to the financial statements
Note 7. Income tax
Accounting policy
The tax expense for the year comprises current and deferred tax. Tax is recognised in the income statement, except to the extent that it relates to items recognised directly in OCI, in which case it is recognised in the statement of comprehensive income.
Current tax is the tax payable for the year using enacted or substantively enacted tax rates and laws for each jurisdiction. Current tax also includes adjustments to tax payable for previous years.
Deferred tax accounts for temporary differences between the carrying amounts of assets and liabilities in the financial statements and their values for taxation purposes.
Deferred tax is determined using the enacted or substantively enacted tax rates and laws for each jurisdiction which are expected to apply when the assets will be realised or the liabilities settled.
Deferred tax assets and liabilities have been offset where they relate to the same taxation authority, the same taxable entity or group, and where there is a legal right and intention to settle on a net basis.
Deferred tax assets are recognised to the extent that it is probable that future taxable profits will be available to utilise the assets.
Deferred tax is not recognised for the following temporary differences:
• the initial recognition of assets or liabilities in a transaction that is not a business combination and that affects neither the accounting nor taxable profit or loss;
• the initial recognition of goodwill in a business combination; and
• retained earnings in subsidiaries which the Parent Entity does not intend to distribute for the foreseeable future.
The Parent Entity is the head entity of a tax consolidated group with its wholly owned Australian subsidiaries. All entities in the tax consolidated group have entered into a tax sharing agreement which, in the opinion of the Directors, limits the joint and several liabilities in the case of a default by the Parent Entity.
Current and deferred tax are recognised using a ‘group allocation basis’. As head entity, the Parent Entity recognises all current tax balances and deferred tax assets arising from unused tax losses and relevant tax credits for the tax-consolidated group. The Parent Entity fully compensates/is compensated by the other members for these balances.
Critical accounting assumptions and estimates
The Group operates in multiple tax jurisdictions and significant judgement is required in determining the worldwide current tax liability. There are many transactions with uncertain tax outcomes and provisions are determined based on the expected outcomes.

158 WESTPAC GROUP 2021 ANNUAL REPORT
Notes to the financial statements
Income tax expense
The following table reconciles income tax expense to the profit before income tax expense.
Consolidated Parent Entity$m 2021 2020 2019 2021 2020
Profit before income tax expense 8,501 4,266 9,749 6,761 4,453
Tax at the Australian company tax rate of 30% 2,550 1,280 2,925 2,028 1,336
The effect of amounts which are not deductible/(assessable) in calculating taxable income
Hybrid capital distributions 59 56 72 59 56
Life insurance:
Tax adjustment on policyholder earnings 3 (17) 8 - -
Adjustment for life business tax rates - 1 (1) - -
Dividend adjustments - - (1) (355) (228)
Other non-assessable items (6) (3) (14) (5) (3)
Other non-deductible items 252 585 12 204 468
Adjustment for overseas tax rates (16) 16 (32) 9 32
Income tax (over)/under provided in prior years 3 1 (10) (2) 1
Other items 193 55 - 210 133
Total income tax expense 3,038 1,974 2,959 2,148 1,795
Income tax expense comprises:
Current income tax 2,741 2,954 3,370 2,017 2,417
Movement in deferred tax 294 (981) (401) 133 (623)
Income tax (over)/under provision in prior years 3 1 (10) (2) 1
Total income tax expense 3,038 1,974 2,959 2,148 1,795
Total Australia 2,610 1,697 2,526 2,090 1,753
Total Overseas 428 277 433 58 42
Total income tax expense1 3,038 1,974 2,959 2,148 1,795
The effective tax rate was 35.74% in 2021 (2020: 46.27%, 2019: 30.35%).
1. As the Bank levy is not a levy on income, it is not included in income tax. It is included in Note 3.
Note 7. Income tax (continued)

3 FINA
NC
IAL STA
TEM
EN
TS2 G
RO
UP
PE
RFO
RM
AN
CE
1 STRA
TEG
IC R
EP
OR
T4
SHA
RE
HO
LDE
R IN
FOR
MA
TION
159WESTPAC GROUP 2021 ANNUAL REPORT
Notes to the financial statements
Deferred tax assets
The balance comprises temporary differences attributable to:
Consolidated Parent Entity$m 2021 2020 2021 2020
Amounts recognised in the income statements and opening retained profits
Provisions for ECL on loans and credit commitments 1,481 1,788 1,269 1,507
Provision for long service leave, annual leave and other employee benefits 386 335 365 308
Financial instruments - - - -
Property and equipment 347 223 316 198
Other provisions 424 606 388 570
Lease liabilities1 743 899 665 825
All other liabilities1 331 419 300 304
Total amounts recognised in the income statements and opening retained profits 3,712 4,270 3,303 3,712
Amounts recognised directly in OCI
Investment securities - - - -
Cash flow hedges - 25 - -
Defined benefit 103 155 101 149
Total amounts recognised directly in OCI 103 180 101 149
Gross deferred tax assets 3,815 4,450 3,404 3,861
Set-off of deferred tax assets and deferred tax liabilities (1,378) (1,386) (1,311) (1,364)
Net deferred tax assets 2,437 3,064 2,093 2,497
Movements
Balance as at beginning of year 3,064 2,048 2,497 1,925
Impact on adoption of new accounting standards1 (17) 948 (14) 872
Restated opening balance 3,047 2,996 2,483 2,797
Recognised in the income statements (529) 758 (395) 507
Recognised in OCI (77) 13 (48) 9
Balances reclassified to assets held for sale (8) - - -
Balances disposed of on sale of businesses (4) - - -
Set-off of deferred tax assets and deferred tax liabilities 8 (703) 53 (816)
Balance as at end of year 2,437 3,064 2,093 2,497
1. The adoption of AASB 16 on 1 October 2019 resulted in an increase in deferred tax assets of $948 million for the Group and $872 million for the Parent Entity. A corresponding increase was also recognised in deferred tax liabilities (refer to the following table), which resulted in a net nil impact on retained profits.
Note 7. Income tax (continued)

160 WESTPAC GROUP 2021 ANNUAL REPORT
Notes to the financial statements
Deferred tax liabilities
The balance comprises temporary differences attributable to:
Consolidated Parent Entity$m 2021 2020 2021 2020
Amounts recognised in the income statements and opening retained profits
Finance lease transactions 296 253 290 232
Property and equipment1 610 933 541 864
Life insurance assets - 43 - -
All other assets 267 223 211 208
Total amounts recognised in the income statements and opening retained profits 1,173 1,452 1,042 1,304
Amounts recognised directly in OCI
Investment securities 214 51 211 51
Cash flow hedges 81 9 58 9
Total amounts recognised directly in OCI 295 60 269 60
Gross deferred tax liabilities 1,468 1,512 1,311 1,364
Set-off of deferred tax assets and deferred tax liabilities (1,378) (1,386) (1,311) (1,364)
Net deferred tax liabilities 90 126 - -
Movements
Balance as at beginning of year 126 44 - -
Impact on adoption of new accounting standards1 - 948 - 872
Restated opening balance 126 992 - 872
Recognised in the income statements (235) (223) (262) (116)
Recognised in OCI 235 60 209 60
Balances reclassified to liabilities held for sale (44) - - -
Balances disposed of on sale of businesses - - - -
Set-off of deferred tax assets and deferred tax liabilities 8 (703) 53 (816)
Balance as at end of year 90 126 - -
Unrecognised deferred tax balances
The following potential deferred tax balances have not been recognised. The tax effect of the gross balances would be based on the corporate tax rates applicable in the relevant jurisdictions, which range between 16.5% and 30%.
Consolidated Parent Entity$m 2021 2020 2021 2020
Unrecognised deferred tax asset
Tax losses on revenue account 470 335 454 264
Unrecognised deferred tax liability
Gross retained earnings of subsidiaries which the Parent Entity does not intend to distribute in the foreseeable future 55 55 - -
1. The adoption of AASB 16 on 1 October 2019 resulted in an increase in deferred tax liabilities of $948 million for the Group and $872 million for the Parent Entity, which was recognised as an opening adjustment in retained profits. A corresponding increase was also recognised in deferred tax assets (refer to the previous table), which resulted in a net nil impact on retained profits.
Note 7. Income tax (continued)

3 FINA
NC
IAL STA
TEM
EN
TS2 G
RO
UP
PE
RFO
RM
AN
CE
1 STRA
TEG
IC R
EP
OR
T4
SHA
RE
HO
LDE
R IN
FOR
MA
TION
161WESTPAC GROUP 2021 ANNUAL REPORT
Notes to the financial statements
Note 8. Earnings per share
Accounting policy
Basic earnings per share (EPS) is calculated by dividing the net profit attributable to shareholders by the weighted average number of ordinary shares on issue during the year, adjusted for treasury shares. Diluted EPS is calculated by adjusting the basic EPS by assuming all dilutive potential ordinary shares are converted. Refer to Notes 19 and 32 for further information on the potential dilutive instruments.
2021 2020 2019$m Basic Diluted Basic Diluted Basic Diluted
Net profit attributable to owners of WBC ($m) 5,458 5,458 2,290 2,290 6,784 6,784
Adjustment for RSP dividends ($m)1 (2) - (2) (2) (6) (6)
Adjustment for potential dilution:
Distributions to convertible loan capital holders ($m)2 - 218 - - - 290
Adjusted net profit attributable to owners of WBC ($m) 5,456 5,676 2,288 2,288 6,778 7,068
Weighted average number of ordinary shares (millions)
Weighted average number of ordinary shares on issue 3,657 3,657 3,595 3,595 3,456 3,456
Treasury shares (including RSP share rights)1 (4) (4) (5) (5) (6) (6)
Adjustment for potential dilution:
Share-based payments - 4 - 1 - 1
Convertible loan capital2 - 461 - - - 278
Adjusted weighted average number of ordinary shares 3,653 4,118 3,590 3,591 3,450 3,729
Earnings per ordinary share (cents) 149.4 137.8 63.7 63.7 196.5 189.5
1. RSP is explained in Note 32. Some shares under the RSP have not vested and are not outstanding ordinary shares but do receive dividends. These RSP dividends are deducted to show the profit attributable to ordinary shareholders. Shares under the RSP were dilutive in 2021 (2020: antidilutive, 2019: antidilutive).
2. The Group has issued convertible loan capital which may convert into ordinary shares in the future (refer to Note 19 for further details). These convertible loan capital instruments are potentially dilutive instruments, and diluted EPS is therefore calculated as if the instruments had been converted at the beginning of the year or, if later, the instruments’ issue dates. In 2021, all convertible loan capital instruments were dilutive (2020: antidilutive, 2019: dilutive).

162 WESTPAC GROUP 2021 ANNUAL REPORT
Notes to the financial statements
Note 9. Average balance sheet and interest rates
The daily average balances of the Group’s interest earning assets and interest bearing liabilities are shown below along with their interest income or expense.
2021 2020 2019Average Interest Average Average Interest Average Average Interest Averagebalance income rate balance income rate balance income rate
Consolidated $m $m % $m $m % $m $m %
Assets
Interest earning assets
Collateral paid:
Australia 10,748 7 0.1 13,555 56 0.4 8,428 152 1.8
New Zealand 372 - - 373 3 0.8 364 7 1.9
Other overseas 1,108 9 0.8 1,804 16 0.9 2,031 42 2.1
Trading securities and financial assets measured at FVIS:
Australia 16,659 116 0.7 20,300 217 1.1 20,691 468 2.3
New Zealand 3,881 28 0.7 4,728 47 1.0 3,862 85 2.2
Other overseas 3,251 48 1.5 4,601 95 2.1 4,521 109 2.4
Investment securities:
Australia 81,665 1,104 1.4 71,402 1,347 1.9 56,875 1,691 3.0
New Zealand 4,492 74 1.6 3,921 96 2.4 3,850 130 3.4
Other overseas 1,552 22 1.4 2,858 78 2.7 3,062 98 3.2
Loans and other receivables1:
Australia 585,416 17,859 3.1 585,643 21,315 3.6 589,427 25,931 4.4
New Zealand 91,732 2,747 3.0 85,184 3,237 3.8 79,255 3,650 4.6
Other overseas 14,437 136 0.9 27,349 540 2.0 26,558 859 3.2
Assets held for sale:
Australia 1,583 28 1.8 - - - - - -
New Zealand - - - - - - - - -
Other overseas 2,560 100 3.9 - - - - - -
Total interest earning assets and interest income 819,456 22,278 2.7 821,718 27,047 3.3 798,924 33,222 4.2
Non-interest earning assets
Derivative financial instruments 20,305 31,334 25,959
Life insurance assets 226 4,614 9,610
Assets held for sale 4,590 - -
All other assets2 61,478 62,414 60,231
Total non-interest earning assets 86,599 98,362 95,800
Total assets 906,055 920,080 894,724
1. Loans and other receivables are net of Stage 3 provision for ECL, where interest income is determined based on their carrying value. Stages 1 and 2 provisions for ECL are not included in the average interest earning assets balance, as interest income is determined based on the gross value of loans and other receivables.
2. Includes property and equipment, intangible assets, deferred tax assets, non-interest earning loans relating to mortgage offset accounts and all other non-interest earning assets.

3 FINA
NC
IAL STA
TEM
EN
TS2 G
RO
UP
PE
RFO
RM
AN
CE
1 STRA
TEG
IC R
EP
OR
T4
SHA
RE
HO
LDE
R IN
FOR
MA
TION
163WESTPAC GROUP 2021 ANNUAL REPORT
Notes to the financial statements
2021 2020 2019Average Interest Average Average Interest Average Average Interest Averagebalance expense rate balance expense rate balance expense rate
Consolidated $m $m % $m $m % $m $m %
Liabilities
Interest bearing liabilities
Collateral received:
Australia 1,914 2 0.1 2,586 11 0.4 2,039 41 2.0
New Zealand 307 - - 596 3 0.5 390 8 2.1
Other overseas 3,965 2 0.1 4,399 12 0.3 1,188 8 0.7
Repurchase agreements1
Australia 32,600 54 0.2 16,120 73 0.5 11,266 172 1.5
New Zealand 986 2 0.2 380 1 0.3 268 5 1.9
Other overseas - - - - - - 20 1 5.0
Deposits and other borrowings:
Australia 457,675 1,400 0.3 435,877 3,745 0.9 425,799 7,023 1.6
New Zealand 60,066 418 0.7 57,096 882 1.5 54,720 1,235 2.3
Other overseas 13,610 50 0.4 25,660 427 1.7 26,270 687 2.6
Loan capital:
Australia 24,573 754 3.1 19,554 663 3.4 15,080 632 4.2
New Zealand 1,653 85 5.1 1,833 94 5.1 1,777 91 5.1
Other overseas 368 10 2.7 1,324 43 3.2 1,324 53 4.0
Other interest bearing liabilities1,2:
Australia 121,338 2,234 1.8 160,830 3,776 2.3 177,470 5,765 3.2
New Zealand 15,836 368 2.3 18,130 557 3.1 15,397 570 3.7
Other overseas 110 29 26.4 1,256 64 5.1 1,274 24 1.9
Liabilities held for sale:
Australia - - - - - - - - -
New Zealand - - - - - - - - -
Other overseas 1,335 12 0.9 - - - - - -
Total interest bearing liabilities and interest expense 736,336 5,420 0.7 745,641 10,351 1.4 734,282 16,315 2.2
Non-interest bearing liabilities
Deposits and other borrowings:
Australia 49,592 45,231 42,455
New Zealand 12,426 8,760 5,996
Other overseas 7 901 819
Derivative financial instruments 20,612 33,249 26,568
Life insurance liabilities 253 2,999 7,653
Liabilities held for sale 2,728 - -
All other liabilities3 13,202 15,233 13,187
Total non-interest bearing liabilities 98,820 106,373 96,678
Total liabilities 835,156 852,014 830,960
Shareholders’ equity 70,849 68,014 63,714
NCI 50 52 50
Total equity 70,899 68,066 63,764
Total liabilities and equity 906,055 920,080 894,724
Net interest income may vary from year to year due to changes in the volume of, and interest rates associated with, interest earning assets and interest bearing liabilities. The following table allocates the change in net interest income between changes in volume and interest rate for those assets and liabilities.
1. Repurchase agreements, previously included in Other interest bearing liabilities, have been separately disclosed. Comparatives have been restated.
2. Includes net impact of Treasury balance sheet management activities and the Bank levy.3. Includes other financial liabilities, provisions, current and deferred tax liabilities and all other non-interest bearing liabilities.
Note 9. Average balance sheet and interest rates (continued)

164 WESTPAC GROUP 2021 ANNUAL REPORT
Notes to the financial statements
Calculation of variances• Volume changes are determined based on the movements in average asset and liability balances; and
• interest rate changes are determined based on the change in interest rate associated with those assets and liabilities. Variances that arise due to a combination of volume and interest rate changes are allocated to interest rate changes.
2021 2020Consolidated Change due to Change due to$m Volume Rate Total Volume Rate Total
Interest earning assets
Collateral paid:
Australia (11) (38) (49) 93 (189) (96)
New Zealand - (3) (3) - (4) (4)
Other overseas (6) (1) (7) (5) (21) (26)
Trading securities and financial assets measured at FVIS:
Australia (34) (67) (101) (9) (242) (251)
New Zealand (9) (10) (19) 19 (57) (38)
Other overseas (28) (19) (47) 2 (16) (14)
Investment securities:
Australia 202 (445) (243) 433 (777) (344)
New Zealand 14 (36) (22) 2 (36) (34)
Other overseas (20) (36) (56) (7) (13) (20)
Loans and other receivables:
Australia (469) (2,987) (3,456) (167) (4,449) (4,616)
New Zealand 151 (641) (490) 274 (687) (413)
Other overseas (241) (163) (404) 26 (345) (319)
Assets held for sale:
Australia 14 14 28 - - -
Other overseas 62 38 100 - - -
Total change in interest income (375) (4,394) (4,769) 661 (6,836) (6,175)
Interest bearing liabilities
Collateral received:
Australia (3) (6) (9) 11 (41) (30)
New Zealand (1) (2) (3) 4 (9) (5)
Other overseas (1) (9) (10) 22 (18) 4
Repurchase agreements1
Australia 87 (106) (19) 83 (182) (99)
New Zealand 2 (1) 1 2 (6) (4)
Other overseas - - - (1) - (1)
Deposits and other borrowings:
Australia 270 (2,615) (2,345) 167 (3,445) (3,278)
New Zealand 45 (509) (464) 54 (407) (353)
Other overseas (179) (198) (377) (16) (244) (260)
Loan capital:
Australia 176 (85) 91 188 (157) 31
New Zealand (9) - (9) 3 - 3
Other overseas (31) (2) (33) - (10) (10)
Other interest bearing liabilities:
Australia (716) (826) (1,542) (455) (1,534) (1,989)
New Zealand (28) (161) (189) 103 (116) (13)
Other overseas (20) (15) (35) - 40 40
Liabilities held for sale:
Other overseas 2 10 12 - - -
Total change in interest expense (406) (4,525) (4,931) 165 (6,129) (5,964)
Change in net interest income:
Australia (112) 115 3 356 (298) 58
New Zealand 147 (17) 130 129 (246) (117)
Other overseas (4) 33 29 11 (163) (152)
Total change in net interest income 31 131 162 496 (707) (211)
Note 9. Average balance sheet and interest rates (continued)
1. Repurchase agreements, previously included in Other interest bearing liabilities, have been separately disclosed. Comparatives have been restated.

3 FINA
NC
IAL STA
TEM
EN
TS2 G
RO
UP
PE
RFO
RM
AN
CE
1 STRA
TEG
IC R
EP
OR
T4
SHA
RE
HO
LDE
R IN
FOR
MA
TION
165WESTPAC GROUP 2021 ANNUAL REPORT
Notes to the financial statements
FINANCIAL ASSETS AND FINANCIAL LIABILITIES
Accounting policy
Recognition
Purchases and sales by regular way of financial assets, except for loans and receivables, are recognised on trade-date, the date on which the Group commits to purchase or sell the asset. Loans and receivables are recognised on settlement date, when cash is advanced to the borrowers.
Financial liabilities are recognised when an obligation arises.
Derecognition
Financial assets are derecognised when the rights to receive cash flows from the asset have expired, or when the Group has either transferred its rights to receive cash flows from the asset or has assumed an obligation to pay the received cash flows in full under a ‘pass through’ arrangement and transferred substantially all the risks and rewards of ownership.
There may be situations where the Group has partially transferred the risks and rewards of ownership but has neither transferred nor retained substantially all the risks and rewards of ownership. In such situations, where the Group retains control of the transferred asset, it will continue to be recognised in the balance sheet to the extent of the Group’s continuing involvement in the asset.
Financial liabilities are derecognised when the obligation is discharged, cancelled or expires. Where an existing financial liability is replaced by another from the same lender on substantially different terms, or the terms of an existing liability are substantially modified, the exchange or modification is treated as a derecognition of the original liability and the recognition of a new liability, with the difference in the respective carrying amounts recognised in the income statement.
The terms are deemed to be substantially different if the discounted present value of the cash flows under the new terms (discounted using the original effective interest rate) is at least 10% different from the discounted present value of the remaining cash flows of the original financial liability. Qualitative factors such as a change in the currency the instrument is denominated in, a change in the interest rate from fixed to floating and conversion features are also considered.
Classification and measurement
Financial assets are grouped into the following classes: cash and balances with central banks, collateral paid, trading securities and financial assets measured at FVIS, derivative financial instruments, investment securities, loans, other financial assets and life insurance assets.
Financial assets
Financial assets are classified based on a) the business model within which the assets are managed, and b) whether the contractual cash flows of the instrument represent solely payment of principal and interest (SPPI).
The Group determines the business model at the level that reflects how groups of financial assets are managed. When assessing the business model the Group considers factors including how performance and risks are managed, evaluated and reported and the frequency and volume of, and reason for, sales in previous periods and expectations of sales in future periods.
When assessing whether contractual cash flows are SPPI, interest is defined as consideration primarily for the time value of money and the credit risk of the principal outstanding. The time value of money is defined as the element of interest that provides consideration only for the passage of time and not consideration for other risks or costs associated with holding the financial asset. Terms that could change the contractual cash flows so that they may not meet the SPPI criteria include contingent and leverage features, non-recourse arrangements, and features that could modify the time value of money.
Debt instruments
If the debt instruments have contractual cash flows which represent SPPI on the principal balance outstanding they are classified at:
• amortised cost if they are held within a business model whose objective is achieved through holding the financial asset to collect these cash flows; or
• FVOCI if they are held within a business model whose objective is achieved both through collecting these cash flows or selling the financial asset; or
• FVIS if they are held within a business model whose objective is achieved through selling the financial asset.
Debt instruments are measured at FVIS where the contractual cash flows do not represent SPPI on the principal balance outstanding or where it is designated at FVIS to eliminate or reduce an accounting mismatch.

166 WESTPAC GROUP 2021 ANNUAL REPORT
Notes to the financial statements
Accounting policy (continued)
Debt instruments at amortised cost are initially recognised at fair value and subsequently measured at amortised cost using the effective interest rate method. They are presented net of provision for ECL determined using the ECL model. Refer to Notes 6 and 13 for further details.
Debt instruments at FVOCI are measured at fair value with unrealised gains and losses recognised in OCI except for interest income, impairment charges and FX gains and losses, which are recognised in the income statement. Impairment on debt instruments at FVOCI is determined using the ECL model and is recognised in the income statement with a corresponding amount in OCI. There is no reduction of the carrying value of the debt security which remains at fair value.
The cumulative gain or loss recognised in OCI is subsequently recognised in the income statement when the instrument is derecognised.
Debt instruments at FVIS are measured at fair value with subsequent changes in fair value recognised in the income statement.
Equity securities
Equity securities are measured at FVOCI where they:
• are not held for trading; and
• an irrevocable election is made by the Group.
Otherwise, they are measured at FVIS.
Equity securities at FVOCI are measured at fair value with unrealised gains and losses recognised in OCI, except for dividend income which is recognised in the income statement. The cumulative gain or loss recognised in OCI is not subsequently recognised in the income statement when the instrument is disposed.
Equity securities at FVIS are measured at fair value with subsequent changes in fair value recognised in the income statement.
Financial liabilities
Financial liabilities are grouped into the following classes: collateral received, deposits and other borrowings, other financial liabilities, derivative financial instruments, debt issues and loan capital.
Financial liabilities are measured at amortised cost if they are not held for trading or designated at FVIS, otherwise they are measured at FVIS.
Financial assets and financial liabilities measured at FVIS are recognised initially at fair value. All other financial assets and financial liabilities are recognised initially at fair value plus or minus directly attributable transaction costs, respectively.
Further details of the accounting policy for each category of financial asset or financial liability mentioned above is set out in the note for the relevant item.
The Group’s policies for determining the fair value of financial assets and financial liabilities are set out in Note 22.
FINANCIAL ASSETS AND FINANCIAL LIABILITIES (continued)

1673 FIN
AN
CIA
L STATE
ME
NTS
2 GR
OU
P P
ER
FOR
MA
NC
E1 STR
ATE
GIC
RE
PO
RT
4 SH
AR
EH
OLD
ER
INFO
RM
ATIO
NWESTPAC GROUP 2021 ANNUAL REPORT
Notes to the financial statements
Note 10. Trading securities and financial assets measured at FVIS
Accounting policy
Trading securities
Trading securities include actively traded debt (government and other) and equity instruments and those acquired for sale in the near term.
As part of its trading activities, the Group also lends and borrows securities on a collateralised basis. Securities lent remain on the Group’s balance sheet and securities borrowed are not reflected on the Group’s balance sheet, as the risks and rewards of ownership remain with the initial holder. Where cash is provided as collateral, the amount advanced to or received from third parties is recognised as a receivable in collateral paid or as a borrowing in collateral received respectively.
Reverse repurchase agreements
Securities purchased under these agreements are not recognised in the balance sheet, as Westpac has not obtained the risks and rewards of ownership. The cash consideration paid is recognised as a reverse repurchase agreement, which forms part of a trading portfolio that is measured at fair value.
Other financial assets measured at FVIS
Other financial assets measured at FVIS include:
• non-trading securities managed on a fair value basis;
• non-trading debt securities that do not have contractual cash flows that represent SPPI on the principal balance outstanding; or
• non-trading equity securities for which we have not made irrevocable designation to be measured at FVOCI.
Gains and losses on these financial assets are recognised in the income statement. Interest earned from debt securities is recognised in interest income (Note 3) while dividends on equity securities are recognised in non-interest income (Note 4).
Consolidated Parent Entity$m 2021 2020 2021 2020
Trading securities 15,019 17,776 13,018 15,519
Reverse repurchase agreements 2,937 20,401 2,763 20,401
Other financial assets measured at FVIS 3,145 2,490 2,998 2,110
Total trading securities and financial assets measured at FVIS 21,101 40,667 18,779 38,030
Trading securities include the following:
Government and semi-government securities 11,432 14,667 9,535 12,542
Other debt securities 3,064 3,044 2,960 2,913
Equity securities 3 4 3 3
Other 520 61 520 61
Total trading securities 15,019 17,776 13,018 15,519
Other financial assets measured at FVIS include:
Other debt securities 3,038 2,045 2,975 1,703
Equity securities 107 445 23 407
Total other financial assets measured at FVIS 3,145 2,490 2,998 2,110
Notes to the financial statements

168 WESTPAC GROUP 2021 ANNUAL REPORT
Notes to the financial statements
Note 11. Investment securities
Accounting policy
Investment securities include debt securities (government and other) and equity securities. It includes debt and equity securities that are measured at FVOCI and debt securities measured at amortised cost. These instruments are classified based on the criteria disclosed under the heading “Financial assets and financial liabilities” prior to Note 10.
Debt securities measured at FVOCI
Includes debt instruments that have contractual cash flows which represent SPPI on the principal balance outstanding and they are held within a business model whose objective is achieved both through collecting these cash flows or selling the financial asset.
These securities are measured at fair value with gains and losses recognised in OCI except for interest income, impairment charges, FX gains and losses and fair value hedge adjustments which are recognised in the income statement.
Impairment is measured using the same ECL model applied to financial assets measured at amortised cost. Impairment is recognised in the income statement with a corresponding amount in OCI with no reduction of the carrying value of the debt security which remains at fair value. Refer to Note 13 for further details.
The cumulative gain or loss recognised in OCI is subsequently recognised in the income statement when the instrument is disposed.
Debt securities measured at amortised cost
Include debt instruments that have contractual cash flows which represent SPPI on the principal balance outstanding and are held within a business model whose objective is achieved through holding the financial asset to collect these cash flows.
These securities are initially recognised at fair value plus directly attributable transaction costs. They are subsequently measured at amortised cost using the effective interest rate method and are presented net of any provision for ECL.
Equity securities
Equity securities are measured at FVOCI where they are not held for trading, the Group does not have control or significant influence over the investee and where an irrevocable election is made to measure them at FVOCI.
These securities are measured at fair value with unrealised gains and losses recognised in OCI except for dividend income which is recognised in the income statement. The cumulative gain or loss recognised in OCI is not subsequently recognised in the income statement when the instrument is disposed.
Consolidated Parent Entity$m 2021 2020 2021 2020
Investment securities
Investments securities measured at FVOCI
Government and semi-government debt securities 66,421 73,486 63,057 69,929
Other debt securities 15,784 16,916 14,682 15,826
Equity securities 277 153 75 68
Total investment securities measured at FVOCI1 82,482 90,555 77,814 85,823
Investment securities measured at amortised cost
Government and semi-government debt securities 900 881 48 -
Other debt securities 38 130 2 3
Total investment securities measured at amortised cost 938 1,011 50 3
Provision for ECL on debt securities at amortised cost (3) (27) (1) -
Total net investment securities measured at amortised cost 935 984 49 3
Total investment securities 83,417 91,539 77,863 85,826
1. Impairment is recognised in the income statement with a corresponding amount in OCI (refer to Note 27). There is no reduction of the carrying value of the debt securities which remains at fair value.

1693 FIN
AN
CIA
L STATE
ME
NTS
2 GR
OU
P P
ER
FOR
MA
NC
E1 STR
ATE
GIC
RE
PO
RT
4 SH
AR
EH
OLD
ER
INFO
RM
ATIO
NWESTPAC GROUP 2021 ANNUAL REPORT
Notes to the financial statements
The following table shows the maturities and the weighted average yield of the Group’s outstanding investment securities as at 30 September 2021. There are no tax-exempt securities.
Over 1 Over 5Up to year to 5 years to Over No specific Weighted1 year years 10 years 10 years maturity Total average
2021 $m % $m % $m % $m % $m % $m %
Carrying Amount
Government and semi-government securities 5,476 2.8 29,150 1.1 31,009 1.5 1,683 1.3 - - 67,318 1.4
Other debt securities 2,354 1.3 13,466 1.0 2 1.9 - - - - 15,822 1.0
Equity securities - - - - - - - - 277 - 277 -
Total by maturity 7,830 42,616 31,011 1,683 277 83,417
The maturity profile is determined based upon contractual terms for investment securities.
Note 12. Loans
Accounting policy
Loans are financial assets initially recognised at fair value plus directly attributable transaction costs and fees.
Loans are subsequently measured at amortised cost using the effective interest rate method where they have contractual cash flows which represent SPPI on the principal balance outstanding and they are held within a business model whose objective is achieved through holding the loans to collect these cash flows. They are presented net of any provision for ECL.
Loans are subsequently measured at FVIS where they do not have cash flows which represent SPPI, are held within a business model whose objective is achieved by selling the financial asset, or are designated at FVIS to eliminate or reduce an accounting mismatch.
Refer to Note 22 for balances which are measured at fair value and amortised cost.
Loan products that have both mortgage and deposit facilities are presented gross in the balance sheet, segregating the asset and liability component, because they do not meet the criteria to be offset. Interest earned on these products is presented on a net basis in the income statement as this reflects how the customer is charged.
The loan portfolio is disaggregated by location of booking office and product type, as follows.
Consolidated Parent Entity$m 2021 2020 2021 2020
Australia
Housing 455,604 440,933 455,599 440,926
Personal 14,737 17,081 14,694 16,938
Business 148,453 147,584 145,950 144,354
Total Australia 618,794 605,598 616,243 602,218
New Zealand
Housing 58,081 51,126 - -
Personal 1,175 1,360 - -
Business 29,991 29,864 384 354
Total New Zealand 89,247 82,350 384 354
Total other overseas 6,332 10,713 5,688 9,945
Total loans 714,373 698,661 622,315 612,517
Provision for ECL on loans (refer to Note 13) (4,589) (5,602) (3,902) (4,693)
Total net loans1 709,784 693,059 618,413 607,824
1. Total net loans included securitised loans of $4,829 million (2020: $7,367 million) for the Group and $129,270 million (2020: $132,506 million) for the Parent Entity. The level of securitised loans excludes loans where Westpac is the holder of related debt securities.
Note 11. Investment securities (continued)

170 WESTPAC GROUP 2021 ANNUAL REPORT
Notes to the financial statements
The following table shows the Group’s contractual maturity distribution of all loans as at 30 September 2021.
Over 1 Over 5Consolidated Up to year to years to Over$m 1 year 5 years 15 years 15 years Total
Australia
Housing 7,314 2,083 18,238 427,969 455,604
Personal 6,312 7,111 1,314 - 14,737
Business 49,367 87,774 6,867 4,445 148,453
Total Australia 62,993 96,968 26,419 432,414 618,794
New Zealand
Housing 232 630 4,797 52,422 58,081
Personal 935 228 12 - 1,175
Business 19,382 10,582 26 1 29,991
Total New Zealand 20,549 11,440 4,835 52,423 89,247
Total other overseas 2,215 3,715 402 - 6,332
Total loans 85,757 112,123 31,656 484,837 714,373
The following table shows the Group’s interest rate segmentation of loans maturing after one year as at 30 September 2021.
Loans at Loans atvariable fixed
Consolidated interest interest$m rates rates Total
Interest rate segmentation of loans maturing after one year
Australia
Housing 275,772 172,518 448,290
Personal 2,777 5,648 8,425
Business 88,670 10,416 99,086
Total Australia 367,219 188,582 555,801
New Zealand
Housing 6,826 51,023 57,849
Personal 237 3 240
Business 759 9,850 10,609
Total New Zealand 7,822 60,876 68,698
Total other overseas 3,860 257 4,117
Total loans maturing after one year 378,901 249,715 628,616
Note 12. Loans (continued)

1713 FIN
AN
CIA
L STATE
ME
NTS
2 GR
OU
P P
ER
FOR
MA
NC
E1 STR
ATE
GIC
RE
PO
RT
4 SH
AR
EH
OLD
ER
INFO
RM
ATIO
NWESTPAC GROUP 2021 ANNUAL REPORT
Notes to the financial statements
Notes to the financial statements
Note 13. Provisions for expected credit losses
Accounting policy
Note 6 provides details of impairment charges.
Impairment applies to all financial assets at amortised cost, lease receivables, debt securities measured at FVOCI, due from subsidiaries and credit commitments.
The ECL is recognised as follows:• Loans (including lease receivables), debt securities at amortised cost and due from subsidiaries: as a
reduction of the carrying value of the financial asset through an offsetting provision account (refer to Notes 11 and 12);
• Debt securities at FVOCI: in reserves in OCI with no reduction of the carrying value of the debt security itself (refer to Notes 11 and 27); and
• Credit commitments: as a provision (refer to Note 26).
Measurement
The Group calculates the provision for ECL based on a three stage approach. The provision for ECL is a probability-weighted estimate of the cash shortfalls expected to result from defaults over the relevant time frame. They are determined by evaluating a range of possible outcomes and taking into account the time value of money, past events, current conditions and forecasts of future economic conditions.
The models use three main components to determine the ECL (as well as the time value of money) including:• Probability of default (PD): the probability that a counter-party will default;• Loss given default (LGD): the loss that is expected to arise in the event of a default; and• Exposure at default (EAD): the estimated outstanding amount of credit exposure at the time of the default.
Model stages
The three stages are as follows:
Stage 1: 12 months ECL - performing
For financial assets where there has been no significant increase in credit risk since origination, a provision for 12 months ECL is recognised.
Stage 2: Lifetime ECL – performing
For financial assets where there has been a significant increase in credit risk since origination but where the asset is still performing, a provision for lifetime ECL is recognised. The indicators of a significant increase in credit risk are described on the following page.
Stage 3: Lifetime ECL – non-performing
For financial assets that are non-performing, a provision for lifetime ECL is recognised. Indicators include a breach of contract with the Group such as a default on interest or principal payments, a borrower experiencing significant financial difficulties or observable economic conditions that correlate to defaults on an individual basis.
Financial assets in Stage 3 are those that are in default. A default occurs when Westpac considers that the customer is unable to repay its credit obligations in full, irrespective of recourse by the Group to actions such as realising security, or the customer is more than 90 days past due on any material credit obligation. This definition is aligned to the Australian Prudential Regulation Authority (APRA) regulatory definition of default.
Collective and individual assessment
Financial assets that are in Stages 1 and 2 are assessed on a collective basis. This means that they are grouped in pools of similar assets with similar credit risk characteristics including the type of product and the customer risk grade. Financial assets in Stage 3 are assessed on an individual basis and calculated collectively for those below a specified threshold.
Expected life
In considering the lifetime time frame for ECL in Stages 2 and 3, the standard generally requires use of the remaining contractual life adjusted, where appropriate, for prepayments, extension and other options. For certain revolving credit facilities which include both a drawn and undrawn component (e.g. credit cards and revolving lines of credit), the Group’s contractual ability to demand repayment and cancel the undrawn commitment does not limit the exposure to credit losses to the contractual notice period. For these facilities, lifetime is based on historical behaviour.

172 WESTPAC GROUP 2021 ANNUAL REPORT
Notes to the financial statements
Accounting policy (continued)
Movement between stages
Financial assets may move in both directions through the stages of the impairment model. Financial assets previously in Stage 2 may move back to Stage 1 if it is no longer considered that there has been a significant increase in credit risk. Similarly, financial assets in Stage 3 may move back to Stage 1 or Stage 2 if they are no longer assessed to be non-performing.
Critical accounting assumptions and estimates
Key judgements include when a significant increase in credit risk has occurred, the estimation of forward-looking macroeconomic information and overlays. Other factors which can impact the provision include the borrower’s financial situation, the realisable value of collateral, the Group’s position relative to other claimants, the reliability of customer information and the likely cost and duration of recovering the loan.
Significant increase in credit risk (SICR)
Determining when a financial asset has experienced a SICR since origination is a critical accounting judgement. In the current period the Group has revised the methodology to determine a significant increase in risk from one which was primarily based on changes in internal customer risk grades since origination of the facility and based on a sliding scale to one which is directly driven by the change in the probability of default (PD) since origination. In determining whether a change in PD represents a significant increase in risk, relative changes in PD and absolute PD thresholds are both considered based on the portfolio of the exposure. This change did not have a material impact to the Group.
The Group does not rebut the presumption that instruments that are 30 days past due have experienced a SICR but this is used as a backstop rather than the primary indicator.
The deferral of payments by customers in hardship arrangements is generally treated as an indication of a SICR. In the prior year COVID-19 support packages for mortgages and business loans was not, in isolation, treated as an indication of SICR. The Group classified these deferral packages into different categories of risk which were assessed for an increased likelihood of a risk of default to determine whether a SICR has occurred. In the current year, deferral packages for mortgages and business loans are based on the specific circumstances of the customers and as such, the deferral packages could be an indication of SICR.
Forward-looking macroeconomic information
The measurement of ECL for each stage and the assessment of significant increase in credit risk consider information about past events and current conditions as well as reasonable and supportable projections of future events and economic conditions. The estimation of forward-looking information is a critical accounting judgement. The Group considers three future macroeconomic scenarios including a base case scenario along with upside and downside scenarios.
The macroeconomic variables used in these scenarios, based on current economic forecasts, include (but are not limited to) employment to population rates, real gross domestic product growth rates and residential and commercial property price indices. • Base case scenario
This scenario utilises the internal Westpac economics forecast used for strategic decision making and forecasting.
• Upside scenario This scenario represents a modest improvement on the base case scenario.
• Downside scenario The downside scenario is a more severe scenario with ECL higher than those under the current base case scenario. The more severe loss outcome for the downside is generated under a recession scenario in which the combination of negative GDP growth, declines in commercial and residential property prices and an increase in the unemployment rate simultaneously impact ECL across all portfolios from the reporting date.
The macroeconomic scenarios are weighted based on the Group’s best estimate of the relative likelihood of each scenario. The weighting applied to each of the three macroeconomic scenarios takes into account historical frequency, current trends, and forward-looking conditions.
The macroeconomic variables and probability weightings of the three macroeconomic scenarios are subject to the approval of the Group Chief Financial Officer and Group Chief Risk Officer with oversight from the Board of Directors (and its Committees).
Overlays
Where appropriate, adjustments will be made to modelled outcomes to reflect reasonable and supportable information not already incorporated in the models.
Judgements can change with time as new information becomes available which could result in changes to the provision for ECL.
Note 13. Provisions for expected credit losses (continued)

1733 FIN
AN
CIA
L STATE
ME
NTS
2 GR
OU
P P
ER
FOR
MA
NC
E1 STR
ATE
GIC
RE
PO
RT
4 SH
AR
EH
OLD
ER
INFO
RM
ATIO
NWESTPAC GROUP 2021 ANNUAL REPORT
Notes to the financial statements
Loans and credit commitments
The reconciliation of the provision for ECL tables for loans and credit commitments has been determined by an aggregation of monthly movements over the year. The key line items in the reconciliation represent the following:
• The “Transfers between stages” lines represent transfers between Stage 1, Stage 2 and Stage 3 prior to remeasurement of the provision for ECL.
• The “Business activity during the year” line represents new accounts originated during the year net of those that were de-recognised due to final repayments during the year.
• The “Net remeasurement of provision for ECL” line represents the impact on the provision for ECL due to changes in credit quality during the year (including transfers between stages), changes due to forward-looking economic scenarios, overlays and partial repayments and additional draw downs on existing facilities over the year.
• “Write-offs” represent a reduction in the provision for ECL as a result of de-recognition of exposures where there is no reasonable expectation of full recovery.
2021 2020Non- Non-
Performing performing Performing performing$m Stage 1 Stage 2 Stage 3 Total Stage 1 Stage 2 Stage 3 Total
Consolidated
Provision for ECL on loans
Housing 154 735 607 1,496 185 742 977 1,904
Personal 124 314 173 611 180 362 232 774
Business 495 822 1,172 2,489 537 1,433 954 2,924
Total provision for ECL on loans 773 1,871 1,952 4,596 902 2,537 2,163 5,602
Provisions for ECL on credit commitments
Housing 6 6 - 12 7 5 - 12
Personal 29 41 1 71 36 46 - 82
Business 128 173 19 320 139 287 10 436
Total provision for ECL on credit commitments 163 220 20 403 182 338 10 530
Total provisions for ECL on loans and credit commitments 936 2,091 1,972 4,999 1,084 2,875 2,173 6,132
Presented as provision for ECL on:
Loans (Note 12) 766 1,871 1,952 4,589 902 2,537 2,163 5,602
Loans included in assets held for sale (Note 37) 7 - - 7 - - - -
Credit commitments (Note 26) 161 220 20 401 182 338 10 530
Credit commitments included in liabilities held for sale (Note 37) 2 - - 2 - - - -
Total provisions for ECL on loans and credit commitments 936 2,091 1,972 4,999 1,084 2,875 2,173 6,132
Of which:
Individually assessed provisions - - 832 832 - - 611 611
Collectively assessed provisions 936 2,091 1,140 4,167 1,084 2,875 1,562 5,521
Total provisions for ECL on loans and credit commitments 936 2,091 1,972 4,999 1,084 2,875 2,173 6,132
Gross loans and credit commitments 828,770 76,946 9,770 915,486 812,450 71,841 11,311 895,602
Coverage ratio on loans (%) 0.12 2.70 20.56 0.64 0.14 4.02 19.50 0.80
Coverage ratio on loans and credit commitments (%) 0.11 2.72 20.18 0.55 0.13 4.00 19.21 0.68
Note 13. Provisions for expected credit losses (continued)

174 WESTPAC GROUP 2021 ANNUAL REPORT
Notes to the financial statements
2021 2020Non- Non-
Performing performing Performing performing$m Stage 1 Stage 2 Stage 3 Total Stage 1 Stage 2 Stage 3 Total
Parent Entity
Provision for ECL on loans
Housing 114 669 552 1,335 145 630 904 1,679
Personal 111 270 151 532 162 297 193 652
Business 409 607 1,026 2,042 445 1,154 763 2,362
Total provision for ECL on loans 634 1,546 1,729 3,909 752 2,081 1,860 4,693
Provision for ECL on credit commitments
Housing 4 5 - 9 4 5 - 9
Personal 23 34 - 57 28 35 - 63
Business 119 150 19 288 129 269 9 407
Total provision for ECL on credit commitments 146 189 19 354 161 309 9 479
Total provisions for ECL on loans and credit commitments 780 1,735 1,748 4,263 913 2,390 1,869 5,172
Presented as provision for ECL on:
Loans (Note 12) 627 1,546 1,729 3,902 752 2,081 1,860 4,693
Loans included in assets held for sale (Note 37) 7 - - 7 - - - -
Credit commitments (Note 26) 144 189 19 352 161 309 9 479
Credit commitments included in liabilities held for sale (Note 37) 2 - - 2 - - - -
Total provisions for ECL on loans and credit commitments 780 1,735 1,748 4,263 913 2,390 1,869 5,172
Of which:
Individually assessed provisions - - 724 724 - - 520 520
Collectively assessed provisions 780 1,735 1,024 3,539 913 2,390 1,349 4,652
Total provisions for ECL on loans and credit commitments 780 1,735 1,748 4,263 913 2,390 1,869 5,172
Gross loans and credit commitments 720,659 68,179 8,980 797,818 712,381 61,822 10,293 784,496
Coverage ratio on loans (%) 0.11 2.50 19.81 0.63 0.14 3.84 18.39 0.77
Coverage ratio on loans and credit commitments (%) 0.11 2.54 19.47 0.53 0.13 3.87 18.16 0.66
Note 13. Provisions for expected credit losses (continued)

1753 FIN
AN
CIA
L STATE
ME
NTS
2 GR
OU
P P
ER
FOR
MA
NC
E1 STR
ATE
GIC
RE
PO
RT
4 SH
AR
EH
OLD
ER
INFO
RM
ATIO
NWESTPAC GROUP 2021 ANNUAL REPORT
Notes to the financial statements
The following tables reconcile the provisions for ECL on loans and credit commitments for the Group and Parent Entity.
Movement in provision for ECL on loans and credit commitments
Consolidated Parent EntityNon- Non-
Performing performing Performing performing$m Stage 1 Stage 2 Stage 3 Total Stage 1 Stage 2 Stage 3 Total
Balance as at 30 September 2019 884 1,674 1,355 3,913 747 1,420 1,211 3,378
Transfers to Stage 1 1,578 (1,528) (50) - 1,150 (1,125) (25) -
Transfers to Stage 2 (345) 1,161 (816) - (266) 930 (664) -
Transfers to Stage 3 (7) (955) 962 - (6) (773) 779 -
Business activity during the year 212 60 (77) 195 188 64 (45) 207
Net remeasurement of provision for ECL (1,233) 2,474 1,915 3,156 (897) 1,880 1,672 2,655
Write-offs - - (1,170) (1,170) - - (1,105) (1,105)
Exchange rate and other adjustments (5) (11) 54 38 (3) (6) 46 37
Balance as at 30 September 2020 1,084 2,875 2,173 6,132 913 2,390 1,869 5,172
Transfers to Stage 1 1,246 (1,128) (118) - 1,058 (960) (98) -
Transfers to Stage 2 (200) 1,290 (1,090) - (173) 1,094 (921) -
Transfers to Stage 3 (8) (507) 515 - (7) (449) 456 -
Business activity during the year 122 (223) (343) (444) 110 (199) (298) (387)
Net remeasurement of provision for ECL (1,284) (200) 1,603 119 (1,121) (140) 1,424 163
Write-offs - - (836) (836) - - (739) (739)
Exchange rate and other adjustments (24) (16) 68 28 - (1) 55 54
Balance as at 30 September 2021 936 2,091 1,972 4,999 780 1,735 1,748 4,263
The provisions for ECL on loans and credit commitments can be further disaggregated into the following classes:
Consolidated Parent EntityNon- Non-
Performing performing Performing performing$m Stage 1 Stage 2 Stage 3 Total Stage 1 Stage 2 Stage 3 Total
Housing
Balance as at 30 September 2019 163 354 591 1,108 141 335 557 1,033
Transfers to Stage 1 566 (542) (24) - 376 (365) (11) -
Transfers to Stage 2 (68) 472 (404) - (44) 391 (347) -
Transfers to Stage 3 - (276) 276 - - (233) 233 -
Business activity during the year 25 (53) (142) (170) 19 (45) (128) (154)
Net remeasurement of provision for ECL (492) 798 772 1,078 (343) 552 686 895
Write-offs - - (120) (120) - - (111) (111)
Exchange rate and other adjustments (2) (6) 28 20 - - 25 25
Balance as at 30 September 2020 192 747 977 1,916 149 635 904 1,688
Transfers to Stage 1 283 (265) (18) - 246 (237) (9) -
Transfers to Stage 2 (36) 677 (641) - (32) 624 (592) -
Transfers to Stage 3 - (120) 120 - - (115) 115 -
Business activity during the year 42 (49) (180) (187) 39 (43) (165) (169)
Net remeasurement of provision for ECL (322) (253) 387 (188) (284) (190) 328 (146)
Write-offs - - (76) (76) - - (63) (63)
Exchange rate and other adjustments 1 4 38 43 - - 34 34
Balance as at 30 September 2021 160 741 607 1,508 118 674 552 1,344
Note 13. Provisions for expected credit losses (continued)

176 WESTPAC GROUP 2021 ANNUAL REPORT
Notes to the financial statements
Consolidated Parent EntityNon- Non-
Performing performing Performing performing$m Stage 1 Stage 2 Stage 3 Total Stage 1 Stage 2 Stage 3 Total
Personal
Balance as at 30 September 2019 268 459 248 975 229 401 213 843
Transfers to Stage 1 744 (732) (12) - 549 (547) (2) -
Transfers to Stage 2 (154) 368 (214) - (131) 313 (182) -
Transfers to Stage 3 (1) (342) 343 - (1) (307) 308 -
Business activity during the year 35 (37) (50) (52) 36 (31) (43) (38)
Net remeasurement of provision for ECL (676) 694 617 635 (492) 503 573 584
Write-offs - - (728) (728) - - (699) (699)
Exchange rate and other adjustments - (2) 28 26 - - 25 25
Balance as at 30 September 2020 216 408 232 856 190 332 193 715
Transfers to Stage 1 476 (469) (7) - 403 (401) (2) -
Transfers to Stage 2 (98) 281 (183) - (92) 251 (159) -
Transfers to Stage 3 (1) (202) 203 - (1) (182) 183 -
Business activity during the year 27 (25) (35) (33) 28 (20) (30) (22)
Net remeasurement of provision for ECL (468) 360 402 294 (394) 324 386 316
Write-offs - - (461) (461) - - (438) (438)
Exchange rate and other adjustments 1 2 23 26 - - 18 18
Balance as at 30 September 2021 153 355 174 682 134 304 151 589
Consolidated Parent EntityNon- Non-
Performing performing Performing performing$m Stage 1 Stage 2 Stage 3 Total Stage 1 Stage 2 Stage 3 Total
Business
Balance as at 30 September 2019 453 861 516 1,830 377 684 441 1,502
Transfers to Stage 1 268 (254) (14) - 225 (213) (12) -
Transfers to Stage 2 (123) 321 (198) - (91) 226 (135) -
Transfers to Stage 3 (6) (337) 343 - (5) (233) 238 -
Business activity during the year 152 150 115 417 133 140 126 399
Net remeasurement of provision for ECL (65) 982 526 1,443 (62) 825 413 1,176
Write-offs - - (322) (322) - - (295) (295)
Exchange rate and other adjustments (3) (3) (2) (8) (3) (6) (4) (13)
Balance as at 30 September 2020 676 1,720 964 3,360 574 1,423 772 2,769
Transfers to Stage 1 487 (394) (93) - 409 (322) (87) -
Transfers to Stage 2 (66) 332 (266) - (49) 219 (170) -
Transfers to Stage 3 (7) (185) 192 - (6) (152) 158 -
Business activity during the year 53 (149) (128) (224) 43 (136) (103) (196)
Net remeasurement of provision for ECL (494) (307) 814 13 (443) (274) 710 (7)
Write-offs - - (299) (299) - - (238) (238)
Exchange rate and other adjustments (26) (22) 7 (41) - (1) 3 2
Balance as at 30 September 2021 623 995 1,191 2,809 528 757 1,045 2,330
Reconciliation of impairment chargesConsolidated Parent Entity
$m 2021 2020 2021 2020
Loans and credit commitments:
Business activity during the year (444) 195 (387) 207
Net remeasurement of provision for ECL 119 3,156 163 2,655
Impairment charges for debt securities at amortised cost (25) 18 - -
Impairment charges for debt securities at FVOCI 2 2 2 2
Recoveries (242) (193) (225) (173)
Impairment charges (Note 6) (590) 3,178 (447) 2,691
Note 13. Provisions for expected credit losses (continued)

1773 FIN
AN
CIA
L STATE
ME
NTS
2 GR
OU
P P
ER
FOR
MA
NC
E1 STR
ATE
GIC
RE
PO
RT
4 SH
AR
EH
OLD
ER
INFO
RM
ATIO
NWESTPAC GROUP 2021 ANNUAL REPORT
Notes to the financial statements
Total write-offs net of recoveries to average loansConsolidated
% 2021 2020
Write-offs net of recoveries to average loans
Housing 0.01 0.02
Personal 1.46 2.75
Business 0.15 0.15
Total write-offs net of recoveries to average loans 0.08 0.14
Impact of Portfolio Overlays on the provision for ECL
The following table attributes the breakup between modelled ECL and other portfolio overlays.
Where there is increased uncertainty regarding the required forward-looking economic conditions, or areas of potential risk, including significant uncertainty, not captured in the underlying modelled ECL, overlays are used to capture that risk.
Consolidated Parent Entity$m 2021 2020 2021 2020
Modelled provision for ECL 4,352 5,480 3,712 4,659
Portfolio Overlays 647 652 551 513
Total provision for ECL 4,999 6,132 4,263 5,172
Details of these changes related to forward-looking economic inputs and portfolio overlays, which are based on reasonable and supportable information up to the date of this report are provided below.
Modelled provision for ECL
The modelled provision for ECL is a probability weighted estimate based on three scenarios which together are representative of the Group’s view of the forward-looking distribution of potential loss outcomes. The change in provisions as a result of changes in modelled ECL or overlays are reflected through the “Net remeasurement of provision for ECL” line.
The base case scenario uses current Westpac Economics forecasts and reflects the latest available forward-looking economic inputs which shows a deterioration in the short term due to the impact of recent lock downs, with a subsequent recovery. The latest view considers both the economic and societal impacts of COVID-19, the Australian Government stimulus measures implemented to cushion the impacts, and the New Zealand Government stimulus package. The Westpac Australian economics forecast assumes the following:Key macroeconomic assumptions for base case scenario 30 September 2021 30 September 2020
Annual GDP:
Australia Forecast growth of 0.1% for calendar year 2021 and 7.4% for calendar year 2022
Forecast growth of 2.5% for calendar year 2021
New Zealand Forecast growth of 5.6% for calendar year 2021 and 2.3% for calendar year 2022
Forecast growth of 3.9% for calendar year 2021
Commercial property indexForecast price contraction of 0.7% for calendar year 2021 and 4.7% for calendar year 2022
Forecast price contraction of 19.3% for calendar year 2021
Residential property prices:
Australia Forecast price appreciation of 11.8% for calendar year 2021 and 5.0% for calendar year 2022
Forecast price contraction of 0.4% for calendar year 2021
New Zealand Forecast price appreciation of 20% for calendar year 2021 and 0% for calendar year 2022
Forecast price appreciation of 8.0% for calendar year 2021
Cash rate Forecast to remain at 10bps over calendar years 2021 and 2022
Forecast to remain at 10bps over calendar year 2021
Unemployment rate:
Australia Forecast rate of 5.4% at December 2021 and 4% at December 2022
Forecast to peak at 7.9% (February 2021) and fall to 7.5% at December 2021
New ZealandForecast rate of 4.2% at December 2021 and 3.5% at December 2022
Forecast to peak at 7% (December 2020) and then fall to 6.4% at December 2021
Note 13. Provisions for expected credit losses (continued)

178 WESTPAC GROUP 2021 ANNUAL REPORT
Notes to the financial statements
The downside scenario is a more severe scenario with ECL higher than the base case scenario. The more severe loss outcome for the downside is generated under a recession scenario in which the combination of negative GDP growth, declines in commercial and residential property prices and an increase in the unemployment rate simultaneously impact ECL across all portfolios from the reporting date. The assumptions in this scenario and relativities to the base case scenario will be monitored having regard to the emerging economic conditions and updated where necessary. The upside scenario represents a modest improvement to the base case.
The decline in provisions for loans and commitments over the financial year ended 30 September 2021 was due to more positive forward-looking economic inputs, improved portfolio performance and a decline in some higher risk exposures. These declines were partly offset by higher IAPs which were driven by one matter.
The following sensitivity table shows the reported provision for ECL based on the probability weighted scenarios and what the provision for ECL would be assuming a 100% weighting is applied to the base case scenario and to the downside scenario (with all other assumptions, including customer risk grades, held constant).
Consolidated Parent Entity$m 2021 2020 2021 2020
Reported probability-weighted ECL 4,999 6,132 4,263 5,172
100% base case ECL 3,411 4,750 2,877 4,051
100% downside ECL 7,399 8,315 6,354 6,956
If 1% of the Stage 1 gross exposure from loans and credit commitments (calculated on a 12 month ECL) was reflected in Stage 2 (calculated on a lifetime ECL) the provision for ECL would increase by $252 million (2020: $296 million) for the Group and $200 million (2020: $266 million) for the Parent Entity based on applying the average provision coverage ratios by stage to the movement in the gross exposure by stage.
The following table indicates the weightings applied by the Group and Parent Entity:
Macroeconomic scenario weightings (%) 2021 2020
Upside 5.0 5.0
Base 55.0 55.0
Downside 40.0 40.0
Scenario weights have remained unchanged since 30 September 2020 mainly to reflect the high degree of risk around severe loss outcomes. Extraordinary policy measures have eased financial conditions and supported the economy, helping to contain financial stability risks. As the COVID-19 pandemic and associated impacts extend, this could lead to higher credit losses than those modelled under the base case. In particular, the current base case economic forecast indicates a relatively short and sharp economic impact from recent lock downs followed by a subsequent recovery.
The COVID-19 pandemic is leading to material structural shifts in the behaviour of the economy and customers, and unprecedented actions by banks, governments, and regulators in response. ECL models are expected to be subject to a higher than usual level of uncertainty during this period. In this environment there is a heightened need for the application of judgement to reflect these evolving relationships and risks.
This judgement has been applied in the consideration of scenario weights and COVID-19 overlays.
Note 13. Provisions for expected credit losses (continued)

1793 FIN
AN
CIA
L STATE
ME
NTS
2 GR
OU
P P
ER
FOR
MA
NC
E1 STR
ATE
GIC
RE
PO
RT
4 SH
AR
EH
OLD
ER
INFO
RM
ATIO
NWESTPAC GROUP 2021 ANNUAL REPORT
Notes to the financial statements
Portfolio Overlays
Portfolio overlays are used to address areas of potential risk, including significant uncertainty, not captured in the underlying modelled ECL. Determination of portfolio overlays requires expert judgement and is thoroughly documented and subject to comprehensive internal governance and oversight. If the risk of delayed losses is judged to have dissipated or actual stress emerges, the overlay will be removed or reduced.
The total portfolio overlays as at 30 September 2021 were $647 million (2020: $652 million) for the Group and $551 million (2020: $513 million) for the Parent Entity. Included in the total overlays were:
• $557 million (2020: $577 million) for the Group and $461 million (2020: $438 million) for the Parent Entity related to COVID-19 overlay; and
• $90 million (2020: $75 million) for the Group and $90 million (2020: $75 million) for the Parent Entity reflecting other risks. No material overlays were held for extreme weather events.
Overlays associated with COVID-19 decreased in 2021 as deferral packages which expired 31 March 2021 have had six months of performance post exit and the risk is now reflected in underlying ECL. This decrease was partially offset by new overlay for the deferral packages provided from July 2021 to cater for the recent lock downs in New South Wales and Victoria.
An overlay was introduced in 2021 to reflect the risk that some businesses may have been protected from default or stress because of COVID-19 related support packages and government stimulus and may become stressed once when these measures are removed. The overlay was retained at 30 September 2021 due to the uncertainty around the impact of recent lock downs in New South Wales and Victoria, and associated support measures, increasing the likelihood of temporarily suppressing losses. As at 30 September 2021 this overlay is $347 million for the Group and $298 million for the Parent.
Impact of changes in credit exposures on the provision for ECL• Stage 1 exposures had a net increase of $16.3 billion (2020: net decrease of $52.9 billion) for the Group and
$8.3 billion (2020: net decrease of $51.9 billion) for the Parent Entity primarily driven by increases in housing segment due to new lending and in business segment due to transfer back of exposures from Stage 2. The increase from portfolio growth is offset by an additional $11.2 billion transferred to Stage 2 to account for staging methodology changes and overlays. Stage 1 ECL has decreased mainly from impacts from revised macro-economic forecasts.
• Stage 2 credit exposures increased by $5.1 billion (2020: increased by $34.3 billion) for the Group and $6.4 billion (2020: increased by $34.3 billion) for the Parent Entity mainly driven by increases from the housing segment due to the additional $11.2 billion transferred to Stage 2 to account for staging methodology changes and overlays. Stage 2 ECL has decreased driven by the reductions in overlay and impacts from revised macro-economic forecasts.
• Stage 3 credit exposures had a net decrease of $1.5 billion (2020: increased by $4.5 billion) for the Group and $1.3 billion (2020: increased by $4.5 billion) for the Parent Entity driven by reductions in 90 days past due exposures in the housing portfolio. Stage 3 ECL has decreased in line with the decrease in Stage 3 exposures.
Note 14. Other financial assets
Consolidated Parent Entity$m 2021 2020 2021 2020
Accrued interest receivable 720 905 624 797
Securities sold not delivered 3,542 2,358 3,542 2,352
Trade debtors 574 992 397 502
Interbank lending 592 299 73 295
Clearing and settlement balances 564 630 524 558
Accrued fees and commissions 264 170 187 117
Other 138 120 139 124
Total other financial assets 6,394 5,474 5,486 4,745
Note 13. Provisions for expected credit losses (continued)

180 WESTPAC GROUP 2021 ANNUAL REPORT
Notes to the financial statements
Notes to the financial statements
Note 15. Life insurance assets and life insurance liabilities
Accounting policyThe Group conducts its life insurance business in Australia primarily through Westpac Life Insurance Services Limited and separate statutory funds registered under the Life Insurance Act 1995 (Life Act) and in New Zealand through Westpac Life-NZ-Limited which are separate statutory funds licensed under the Insurance (Prudential Supervision) Act 2010.
Life insurance assets
Life insurance assets, including investments in funds managed by the Group, are designated at FVIS. Changes in fair value are recognised in non-interest income. The determination of fair value of life insurance assets involves the same judgements as other financial assets, which are described in the critical accounting assumptions and estimates in Note 22.
The Life Act places restrictions on life insurance assets, including that they can only be used: • to meet the liabilities and expenses of that statutory fund; • to acquire investments to further the business of the statutory fund; or • as a distribution, when the statutory fund has met its solvency and capital adequacy requirements.
Life insurance liabilities
Life insurance liabilities primarily consist of life investment contract liabilities and life insurance contract liabilities. Claims incurred in respect of life investment contracts are withdrawals of customer deposits, and are recognised as a reduction in life insurance liabilities.
Life investment contract liabilities
Life investment contract liabilities are designated at FVIS. Fair value is the higher of the valuation of life insurance assets linked to the life investment contract, or the minimum current surrender value (the minimum amount the Group would pay to a policyholder if their policy is voluntarily terminated before it matures or the insured event occurs). Changes in fair value are recognised in non-interest income.
Life insurance contract liabilities
The value of life insurance contract liabilities is calculated using the margin on services methodology (MoS), specified in the Prudential Standard LPS 340 Valuation of Policy Liabilities.
MoS accounts for the associated risks and uncertainties of each type of life insurance contract written. At each reporting date, planned profit margins and an estimate of future liabilities are calculated. Profit margins are released to non-interest income over the period that life insurance is provided to policyholders (Note 4). The cost incurred of acquiring specific insurance contracts is deferred provided that these amounts are recoverable out of planned profit margins. The deferred amounts are recognised as a reduction in life insurance policy liabilities and are amortised to non-interest income over the same period as the planned profit margins.
Life insurance contract liability adequacy test
Life insurance contract policy liabilities are tested for liability adequacy by comparing them to the best estimate of future cash flows. Liabilities are grouped into related product groups and each group is tested against the best estimate of future cash flows. If the liability of a related product group is less than best estimate the liability is increased with the expense being recognised in non-interest income.
External unit holder liabilities of managed investment schemes
The life insurance statutory funds include controlling interests in managed investment schemes which are consolidated. When the managed investment scheme is consolidated, the external unit holder liabilities are recognised as a liability and included in life insurance liabilities. They are designated at FVIS.
Critical accounting assumptions and estimates
The key factors that affect the estimation of life insurance liabilities and related assets are:• the cost of providing benefits and administering contracts;• mortality and morbidity experience, which includes policyholder benefits enhancements;• discontinuance rates, which affects the Group’s ability to recover the cost of acquiring new business over
the life of the contracts; and• the discount rate of projected future cash flows.
Regulation, competition, interest rates, taxes, securities market conditions and general economic conditions also affect the estimation of life insurance liabilities.

1813 FIN
AN
CIA
L STATE
ME
NTS
2 GR
OU
P P
ER
FOR
MA
NC
E1 STR
ATE
GIC
RE
PO
RT
4 SH
AR
EH
OLD
ER
INFO
RM
ATIO
NWESTPAC GROUP 2021 ANNUAL REPORT
Notes to the financial statements
Life insurance assets
Consolidated$m 2021 2020
Investments held directly and in unit trusts
Unit trusts - 333
Debt securities - 2,818
Loans and other assets - 442
Total life Insurance assets - 3,593
In 2021, the entire life insurance assets for the Group were reclassified as assets held for sale (refer to Note 37). There were no life insurance assets in the Parent Entity as at 30 September 2021 (2020: nil).
Life insurance liabilitiesConsolidated Life investment Life insuranceReconciliation of movements in policy liabilities contracts contracts Total$m 2021 2020 2021 2020 2021 2020
Balance as at beginning of year 1,887 8,206 (491) (829) 1,396 7,377
Movements in policy liabilities reflected in the income statement 23 221 (21) 338 2 559
Contract contributions recognised in policy liabilities 1 368 - - 1 368
Contract withdrawals recognised in policy liabilities (15) (8,322) - - (15) (8,322)
Contract fees, expenses and tax recoveries (4) (44) - - (4) (44)
Change in external unit holders of managed investment schemes (933) 1,458 - - (933) 1,458
Balances reclassified to liabilities held for sale (refer to Note 37) (959) - 512 - (447) -
Balance as at end of year - 1,887 - (491) - 1,396
There were no life insurance liabilities in the Parent Entity as at 30 September 2021 (2020: nil).
Note 15. Life insurance assets and life insurance liabilities (continued)

182 WESTPAC GROUP 2021 ANNUAL REPORT
Notes to the financial statements
Note 16. Deposits and other borrowings1
Accounting policy
Deposits and other borrowings are initially recognised at fair value and subsequently either measured at amortised cost using the effective interest rate method or at fair value.
Deposits and other borrowings are designated at fair value if they are managed on a fair value basis, reduce or eliminate an accounting mismatch or contain an embedded derivative.
Where they are measured at fair value, any changes in fair value (except those due to changes in credit risk) are recognised as non-interest income. The change in the fair value that is due to changes in credit risk is recognised in OCI except where it would create an accounting mismatch, in which case it is also recognised in the income statement.
Refer to Note 22 for balances measured at fair value and amortised cost.
Interest expense incurred is recognised in net interest income using the effective interest rate method.
Consolidated Parent Entity$m 2021 2020 2021 2020
Australia
Certificates of deposit 31,506 25,647 31,506 25,647
Non-interest bearing, repayable at call 52,819 48,303 52,819 48,303
Other interest bearing at call 345,416 304,761 345,416 304,761
Other interest bearing term 102,775 125,820 102,775 125,820
Total Australia 532,516 504,531 532,516 504,531
New Zealand
Certificates of deposit 3,293 2,773 - -
Non-interest bearing, repayable at call 14,066 10,711 - -
Other interest bearing at call 31,354 26,300 - -
Other interest bearing term 27,042 28,689 - 1
Total New Zealand 75,755 68,473 - 1
Other overseas
Certificates of deposit 11,839 7,258 11,839 7,258
Non-interest bearing, repayable at call 919 868 357 333
Other interest bearing at call 1,751 1,864 1,446 1,559
Other interest bearing term 4,175 8,137 4,029 7,931
Total other overseas 18,684 18,127 17,671 17,081
Total deposits and other borrowings 626,955 591,131 550,187 521,613
The following table shows average balances and average rates in each of the past two years for major categories of deposits.
2021 2020Average Average Average Averagebalance rate balance rate
Consolidated $m % $m %
Australia
Non-interest bearing, repayable at call 49,592 45,231
Certificates of deposit 28,242 0.1 25,041 0.8
Other interest bearing at call 322,333 0.2 275,475 0.5
Other interest bearing term 107,100 0.6 135,361 1.5
Total Australia 507,267 481,108
Overseas
Non-interest bearing, repayable at call 12,433 9,661
Certificates of deposit 11,035 0.4 14,376 1.4
Other interest bearing at call 30,231 0.2 25,999 0.5
Other interest bearing term 32,410 1.1 42,381 2.3
Total overseas 86,109 92,417
1. Non-interest bearing relates to instruments which do not carry a rate of interest.

1833 FIN
AN
CIA
L STATE
ME
NTS
2 GR
OU
P P
ER
FOR
MA
NC
E1 STR
ATE
GIC
RE
PO
RT
4 SH
AR
EH
OLD
ER
INFO
RM
ATIO
NWESTPAC GROUP 2021 ANNUAL REPORT
Notes to the financial statements
Certificates of deposit and term deposits
Uninsured deposits refer to deposits that are in excess of, or ineligible for, a government based deposit insurance scheme in their relevant country of domicile. For the Group, this primarily relates to deposit in excess of, or ineligible for, the Australian Government’s Financial Claims Scheme (FCS) limit. The table below shows the balances of uninsured certificates of deposits and term deposits by remaining maturity:
Over OverConsolidated Up to 3 months to 6 months to Over$m 3 months 6 months 1 year 1 year Total
Certificates of deposit in excess of insured amounts
Australia 25,720 5,503 265 18 31,506
New Zealand 2,490 784 19 - 3,293
Other overseas 2,382 3,353 6,104 - 11,839
Total certificates of deposit in excess of insured amounts 30,592 9,640 6,388 18 46,638
Term deposits in excess of insured amounts
Australia 36,929 14,271 17,535 4,811 73,546
New Zealand 12,739 8,840 4,100 1,363 27,042
Other overseas 2,504 693 930 44 4,171
Total term deposits in excess of insured amounts 52,172 23,804 22,565 6,218 104,759
Interbank term deposits in excess of insured amounts1
Australia 2,199 1,661 50 7 3,917
New Zealand - - - - -
Other overseas 132 - - - 132
Total interbank term deposits in excess of insured amounts 2,331 1,661 50 7 4,049
Note 17. Other financial liabilities
Accounting policy
Other financial liabilities include liabilities measured at amortised cost as well as liabilities which are measured at FVIS. Financial liabilities measured at FVIS include:
• trading liabilities (i.e. securities sold short); and
• liabilities designated at FVIS (i.e. certain repurchase agreements).
Refer to Note 22 for balances measured at fair value and amortised cost.
Repurchase agreements
Where securities are sold subject to an agreement to repurchase at a predetermined price, they remain recognised in the balance sheet in their original category (i.e. ‘Trading securities’ or ‘Investment securities’).
The cash consideration received is recognised as a liability (‘Repurchase agreements’). Repurchase agreements are designated at fair value where they are managed as part of a trading portfolio, otherwise they are measured on an amortised cost basis.
Where a repurchase agreement is designated at fair value, subsequent to initial recognition, these liabilities are measured at fair value with changes in fair value (except credit risk) recognised through the income statement as they arise. The change in fair value that is attributable to credit risk is recognised in OCI except where it would create an accounting mismatch, in which case it is also recognised through the income statement.
Consolidated Parent Entity$m 2021 2020 2021 2020
Repurchase agreements 35,899 27,763 33,346 27,763
Interbank placements 4,080 4,981 4,079 4,710
Accrued interest payable 944 1,367 829 1,169
Securities purchased not delivered 3,286 2,291 3,286 2,291
Trade creditors and other accrued expenses 1,392 1,250 1,124 1,045
Settlement and clearing balances 708 1,005 695 989
Securities sold short 2,331 846 2,331 846
Other 1,669 1,422 1,573 1,343
Total other financial liabilities 50,309 40,925 47,263 40,156
Note 16. Deposits and other borrowings (continued)
1. Interbank term deposits are included in Note 17.

184 WESTPAC GROUP 2021 ANNUAL REPORT
Notes to the financial statements
Note 18. Debt issues
Accounting policy
Debt issues are bonds, notes, commercial paper and debentures that have been issued by entities in the Group.
Debt issues are initially measured at fair value and subsequently either measured at amortised cost using the effective interest rate method or at fair value.
Debt issues are designated at fair value if they reduce or eliminate an accounting mismatch or contain an embedded derivative.
The change in the fair value that is due to credit risk is recognised in OCI except where it would create an accounting mismatch, in which case it is also recognised in non-interest income.
Refer to Note 22 for balances measured at fair value and amortised cost.
Interest expense incurred is recognised within net interest income using the effective interest rate method.
In the following table, the distinction between short-term (12 months or less) and long-term (greater than 12 months) debt is based on the original maturity of the underlying security.
Consolidated Parent Entity$m 2021 2020 2021 2020
Short-term debt
Own issuances 19,595 16,477 16,752 14,160
Total short-term debt 19,595 16,477 16,752 14,160
Long-term debt
Covered bonds 31,374 36,051 27,234 31,926
Senior 72,804 89,766 64,224 81,580
Securitisation 5,000 8,000 - -
Structured notes 6 31 - -
Total long-term debt 109,184 133,848 91,458 113,506
Total debt issues 128,779 150,325 108,210 127,666
Movement reconciliation ($m)
Balance as at beginning of year 150,325 181,457 127,666 156,674
Issuances 46,799 34,766 37,868 27,487
Maturities, repayments, buy backs and reductions (65,272) (65,160) (54,425) (55,761)
Total cash movements (18,473) (30,394) (16,557) (28,274)
FX translation impact (1,428) (1,977) (1,311) (2,005)
Fair value adjustments (115) 81 (115) 81
Fair value hedge accounting adjustments (1,674) 1,038 (1,607) 1,076
Other (amortisation of bond issue costs, etc.) 144 120 134 114
Total non-cash movements (3,073) (738) (2,899) (734)
Balance as at end of year 128,779 150,325 108,210 127,666
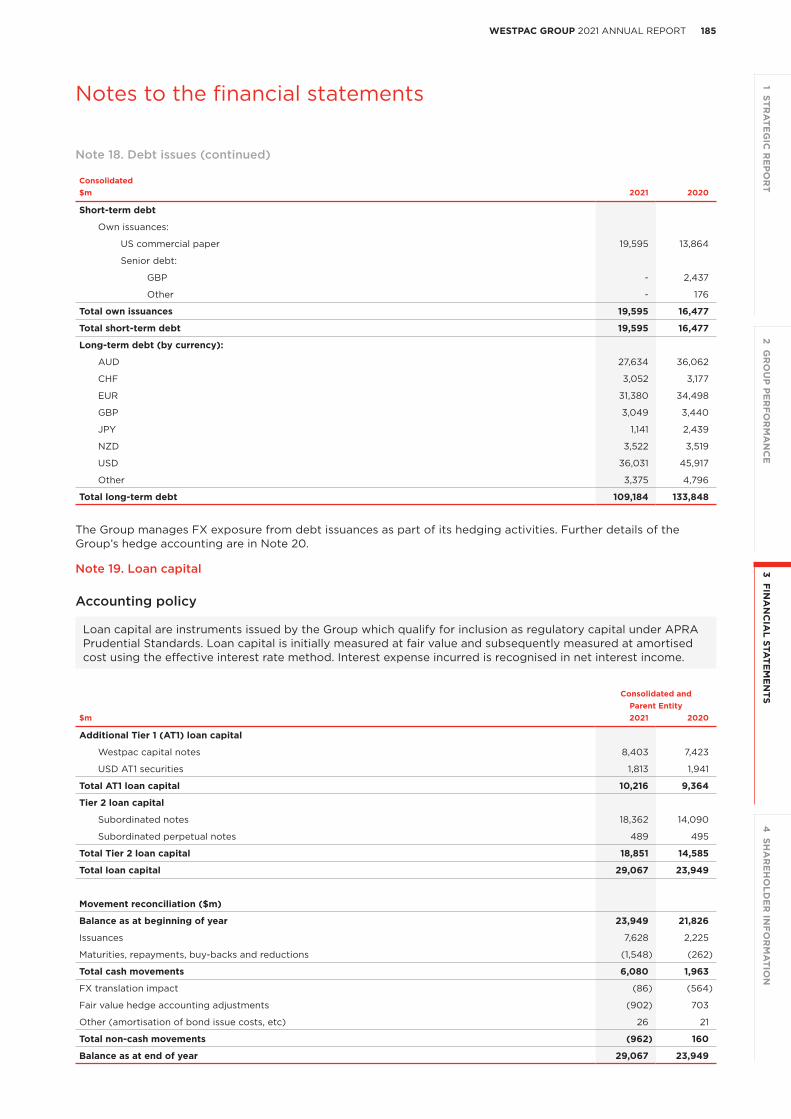
1853 FIN
AN
CIA
L STATE
ME
NTS
2 GR
OU
P P
ER
FOR
MA
NC
E1 STR
ATE
GIC
RE
PO
RT
4 SH
AR
EH
OLD
ER
INFO
RM
ATIO
NWESTPAC GROUP 2021 ANNUAL REPORT
Notes to the financial statements
Consolidated$m 2021 2020
Short-term debt
Own issuances:
US commercial paper 19,595 13,864
Senior debt:
GBP - 2,437
Other - 176
Total own issuances 19,595 16,477
Total short-term debt 19,595 16,477
Long-term debt (by currency):
AUD 27,634 36,062
CHF 3,052 3,177
EUR 31,380 34,498
GBP 3,049 3,440
JPY 1,141 2,439
NZD 3,522 3,519
USD 36,031 45,917
Other 3,375 4,796
Total long-term debt 109,184 133,848
The Group manages FX exposure from debt issuances as part of its hedging activities. Further details of the Group’s hedge accounting are in Note 20.
Note 19. Loan capital
Accounting policy
Loan capital are instruments issued by the Group which qualify for inclusion as regulatory capital under APRA Prudential Standards. Loan capital is initially measured at fair value and subsequently measured at amortised cost using the effective interest rate method. Interest expense incurred is recognised in net interest income.
Consolidated andParent Entity
$m 2021 2020
Additional Tier 1 (AT1) loan capital
Westpac capital notes 8,403 7,423
USD AT1 securities 1,813 1,941
Total AT1 loan capital 10,216 9,364
Tier 2 loan capital
Subordinated notes 18,362 14,090
Subordinated perpetual notes 489 495
Total Tier 2 loan capital 18,851 14,585
Total loan capital 29,067 23,949
Movement reconciliation ($m)
Balance as at beginning of year 23,949 21,826
Issuances 7,628 2,225
Maturities, repayments, buy-backs and reductions (1,548) (262)
Total cash movements 6,080 1,963
FX translation impact (86) (564)
Fair value hedge accounting adjustments (902) 703
Other (amortisation of bond issue costs, etc) 26 21
Total non-cash movements (962) 160
Balance as at end of year 29,067 23,949
Note 18. Debt issues (continued)

186 WESTPAC GROUP 2021 ANNUAL REPORT
Notes to the financial statements
Additional Tier 1 loan capital
A summary of the key terms and common features of AT1 instruments are provided below1.
Consolidated and Parent Entity Potential scheduled Optional
$m Distribution/Interest rate conversion date2 redemption date3 2021 2020
Westpac capital notes (WCN)AUD 1,311 million WCN2 (90 day bank bill rate + 3.05% p.a.)
x (1 - Australian corporate tax rate)23 September 2024 23 September 2022 1,309 1,307
AUD 1,324 million WCN3 (90 day bank bill rate + 4.00% p.a.) x (1 - Australian corporate tax rate)
22 March 2023 22 March 20214 - 1,323
AUD 1,702 million WCN4 (90 day bank bill rate + 4.90% p.a.) x (1 - Australian corporate tax rate)
20 December 2023 20 December 20215 549 1,698
AUD 1,690 million WCN5 (90 day bank bill rate + 3.20% p.a.) x (1 - Australian corporate tax rate)
22 September 2027 22 September 2025 1,682 1,680
AUD 1,423 million WCN6 (90 day bank bill rate + 3.70% p.a.) x (1 - Australian corporate tax rate)
31 July 2026 31 July 2024 1,417 1,415
AUD 1,723 million WCN7 (90 day bank bill rate + 3.40% p.a.) x (1 - Australian corporate tax rate)
22 March 2029 22 March 2027 1,709 -
AUD 1,750 million WCN8 (90 day bank bill rate + 2.90% p.a.) x (1 - Australian corporate tax rate)
21 June 2032 21 September 20296 1,737 -
Total Westpac capital notes 8,403 7,423 USD AT1 securitiesUSD 1,250 million securities 5.00% p.a. until but excluding 21
September 2027 (first reset date). If not redeemed, converted or written-off earlier, from, and including, each reset date7 to, but excluding, the next succeeding reset date, at a fixed rate p.a. equal to the prevailing 5-year USD midmarket swap rate plus 2.89% p.a.
n/a 21 September 20278 1,813 1,941
Total USD AT1 securities 1,813 1,941
Common features of AT1 instruments
Payment conditions
Quarterly distributions on the Westpac capital notes and semi-annual interest payments on the USD AT1 securities are discretionary and will only be paid if the payment conditions are satisfied, including that the payment will not result in a breach of Westpac’s capital requirements under APRA’s prudential standards; not result in Westpac becoming, or being likely to become, insolvent; and if APRA does not object to the payment.
Broadly, if for any reason a distribution or interest payment has not been paid in full on the relevant payment date, Westpac must not determine or pay any dividends on Westpac ordinary shares or undertake a discretionary buy-back or capital reduction of Westpac ordinary shares, unless the unpaid amount is paid in full within 20 business days of the relevant payment date or in certain other circumstances.
Note 19. Loan capital (continued)
1. AUD unless otherwise noted.2. Conversion is subject to the satisfaction of the scheduled conversion conditions. If the conversion conditions are not satisfied on
the relevant scheduled conversion date, conversion will not occur until the next distribution payment date on which the scheduled conversion conditions are satisfied.
3. Westpac may elect to redeem the relevant AT1 instrument, subject to APRA’s prior written approval.4. On 4 December 2020, AUD 866 million of WCN3 were transferred to the WCN3 nominated party for AUD 100 each pursuant to the
WCN7 reinvestment offer. Those WCN3 were subsequently redeemed and cancelled by Westpac. On 22 March 2021, the remaining AUD 458 million of WCN3 were redeemed and cancelled by Westpac for AUD 100 each.
5. On 15 September 2021, AUD 1,152 million of WCN4 were transferred to the WCN4 nominated party for AUD 100 each pursuant to the WCN8 reinvestment offer. Those WCN4 were subsequently redeemed and cancelled by Westpac. On 15 October 2021, Westpac issued a redemption notice notifying WCN4 holders that all outstanding WCN4 will be redeemed on the optional redemption date, being 20 December 2021.
6. Westpac may also elect to redeem on 21 December 2029, 21 March 2030 and 21 June 2030, each an optional redemption date.7. Every fifth anniversary after the first reset date is a reset date.8. Westpac may elect to redeem on 21 September 2027 and every fifth anniversary after the first reset date.

1873 FIN
AN
CIA
L STATE
ME
NTS
2 GR
OU
P P
ER
FOR
MA
NC
E1 STR
ATE
GIC
RE
PO
RT
4 SH
AR
EH
OLD
ER
INFO
RM
ATIO
NWESTPAC GROUP 2021 ANNUAL REPORT
Notes to the financial statements
The AT1 instruments convert into Westpac ordinary shares in the following circumstances:
• Scheduled Conversion
On the scheduled conversion date, provided certain conversion conditions are satisfied, it is expected that the relevant AT1 instrument1 will be converted and holders will receive a variable number of Westpac ordinary shares calculated using the formula described in the terms of the relevant AT1 instrument, subject to a maximum conversion number. The conversion number of Westpac ordinary shares will be calculated using the face value of the relevant AT1 instrument and the Westpac ordinary share price determined over the 20 business day period prior to the scheduled conversion date, including a 1% discount.
• Capital Trigger Event or Non-Viability Trigger Event
Westpac will be required to convert some or all AT1 instruments into a variable number of Westpac ordinary shares upon the occurrence of a capital trigger event or non-viability trigger event. No conversion conditions apply in these circumstances.
A capital trigger event occurs when Westpac determines, or APRA notifies Westpac in writing that it believes, Westpac’s Common Equity Tier 1 Capital ratio is equal to or less than 5.125% (on a level 1 or level 2 basis2).
A non-viability trigger event will occur when APRA notifies Westpac in writing that it believes conversion of all or some AT1 instruments (or conversion, write-off or write-down of relevant capital instruments of the Westpac Group), or public sector injection of capital (or equivalent support), in each case is necessary because without it, Westpac would become non-viable.
For each AT1 instrument converted, holders will receive a variable number of Westpac ordinary shares calculated using the formula described in the terms of the relevant AT1 instrument, subject to a maximum conversion number. The conversion number of Westpac ordinary shares is calculated using the face value or outstanding principal amount of the relevant AT1 instrument and the Westpac ordinary share price determined over the five business day period prior to the capital trigger event date or non-viability trigger event date and includes a 1% discount. For each AT1 instrument, the maximum conversion number is set using a Westpac ordinary share price which is broadly equivalent to 20% of the Westpac ordinary share price at the time of issue.
Following the occurrence of a capital trigger event or non-viability trigger event, if conversion of an AT1 instrument does not occur within five business days, holders’ rights in relation to the relevant AT1 instrument will be immediately and irrevocably terminated.
• Conversion in other circumstances
Westpac is able to elect to convert3, or may be required to convert3, AT1 instruments early in certain circumstances. The terms of conversion and the conversion conditions are broadly similar to scheduled conversion, however the share price floor in the maximum conversion number will depend on the conversion event.
• Early Redemption
Westpac is able to elect to redeem the relevant AT1 instrument on the optional redemption dates or for certain taxation or regulatory reasons, subject to APRA’s prior written approval.
Note 19. Loan capital (continued)
1. Scheduled conversion does not apply to USD AT1 securities.2. Level 1 comprises Westpac Banking Corporation and its subsidiary entities that have been approved by APRA as being part of a
single ‘Extended Licensed Entity’ for the purpose of measuring capital adequacy. Level 2 is the consolidation of Westpac Banking Corporation and all its subsidiary entities except those entities specifically excluded by APRA regulations. The head of the Level 2 group is Westpac Banking Corporation.
3. Excludes USD AT1 securities.

188 WESTPAC GROUP 2021 ANNUAL REPORT
Notes to the financial statements
Tier 2 loan capital
A summary of the key terms and common features of Westpac’s Tier 2 instruments is provided below1:
Consolidated and
Parent Entity Optional
$m Interest rate2 Maturity date redemption date3 2021 2020
Subordinated notesAUD 350 million subordinated notes
4.50% p.a. until but excluding 11 March 2022. Thereafter, if not redeemed, a fixed rate per annum equal to the five-year AUD semi-quarterly mid-swap reference rate plus 1.95% p.a., the sum of which will be annualised.
11 March 2027 11 March 2022 351 361
SGD 325 million subordinated notes
4.00% p.a. until but excluding 12 August 2022. Thereafter, if not redeemed, a fixed rate per annum equal to the five-year SGD swap offer rate plus 1.54% p.a.
12 August 2027 12 August 2022 337 347
AUD 175 million subordinated notes
4.80% p.a. until but excluding 14 June 2023. Thereafter, if not redeemed, a fixed rate per annum equal to the five-year AUD semi-quarterly mid-swap reference rate plus 2.65% p.a., each of which will be annualised.
14 June 2028 14 June 2023 181 185
USD 100 million subordinated notes
Fixed 5.00% p.a. 23 February 2046 n/a 148 175
AUD 700 million subordinated notes
90 day bank bill rate + 3.10% p.a. 10 March 2026 10 March 20214 - 700
JPY 20,000 million subordinated notes
Fixed 1.16% p.a. 19 May 2026 n/a 249 270
JPY 10,200 million subordinated notes
Fixed 1.16% p.a. 2 June 2026 n/a 127 137
JPY 10,000 million subordinated notes
Fixed 0.76% p.a. 9 June 2026 n/a 124 134
NZD 400 million subordinated notes
4.6950% p.a. until but excluding 1 September 2021. Thereafter, if not redeemed, a fixed rate per annum equal to the New Zealand 5-year swap rate on 1 September 2021 plus 2.60% p.a.
1 September 2026 1 September 20214 - 376
JPY 8,000 million subordinated notes
0.9225% p.a. until but excluding 7 October 2021. Thereafter, if not redeemed, a fixed rate per annum equal to the five-year JPY mid-swap rate plus 1.0005% p.a.
7 October 2026 7 October 2021 99 107
USD 1,500 million subordinated notes
4.322% p.a. until but excluding 23 November 2026. Thereafter, if not redeemed, a fixed rate per annum equal to the five-year USD mid-swap rate plus 2.236% p.a.
23 November 2031 23 November 2026 2,181 2,320
JPY 12,000 million subordinated notes
0.87% p.a. until but excluding 6 July 2022. Thereafter, if not redeemed, a fixed rate per annum equal to the five-year JPY mid-swap rate plus 0.78% p.a.
6 July 2027 6 July 2022 149 161
JPY 13,500 million subordinated notes
0.868% p.a. until but excluding 6 July 2022. Thereafter, if not redeemed, a fixed rate per annum equal to the five-year JPY mid-swap rate plus 0.778% p.a.
6 July 2027 6 July 2022 168 181
HKD 600 million subordinated notes
3.15% p.a. until but excluding 14 July 2022. Thereafter, if not redeemed, a fixed rate per annum equal to the five-year HKD mid-swap rate plus 1.34% p.a.
14 July 2027 14 July 2022 108 111
AUD 350 million subordinated notes
4.334% p.a. until but excluding 16 August 2024. Thereafter, if not redeemed, a fixed rate per annum equal to the five-year AUD semi-quarterly mid-swap reference rate plus 1.83% p.a., each of which will be annualised.
16 August 2029 16 August 2024 350 349
AUD 185 million subordinated notes
Fixed 5.00% p.a. 24 January 2048 n/a 185 185
AUD 250 million subordinated notes
90 day bank bill rate + 1.40% p.a. 16 February 2028 16 February 2023 250 250
AUD 130 million subordinated notes
Fixed 5.00% p.a. 2 March 2048 n/a 130 130
AUD 725 million subordinated notes
90 day bank bill rate + 1.80% p.a. 22 June 2028 22 June 2023 724 714
USD 1,000 million subordinated notes
Fixed 4.421% p.a. 24 July 2039 n/a 1,481 1,707
1. Excludes subordinated perpetual notes.2. Interest payments are made periodically as set out in the terms of the subordinated notes.3. Westpac may elect to redeem the relevant Tier 2 instrument on the optional redemption date or dates, subject to APRA’s prior written
approval. If not redeemed on the first optional redemption date, Westpac may elect to redeem the relevant Tier 2 instrument on any interest payment date after the first optional redemption date (except for USD 1,500 million subordinated notes with an optional redemption date in November 2026, USD 1,250 million subordinated notes with an optional redemption date in July 2029, USD 1,500 million subordinated notes with an optional redemption date in February 2025, USD 1,500 million subordinated notes with an optional redemption date in November 2030, and EUR 1,000 million subordinated notes with an optional redemption date in May 2026), subject to APRA’s prior written approval.
4. The subordinated notes were redeemed in full on the optional redemption date.
Note 19. Loan capital (continued)

1893 FIN
AN
CIA
L STATE
ME
NTS
2 GR
OU
P P
ER
FOR
MA
NC
E1 STR
ATE
GIC
RE
PO
RT
4 SH
AR
EH
OLD
ER
INFO
RM
ATIO
NWESTPAC GROUP 2021 ANNUAL REPORT
Notes to the financial statements
Tier 2 loan capital (continued)
A summary of the key terms and common features of Westpac’s Tier 2 instruments is continued below1:Consolidated andParent Entity Optional
$m Interest rate2 Maturity date redemption date3 2021 2020
Subordinated notesUSD 1,250 million subordinated notes
4.110% p.a. until but excluding 24 July 2029. Thereafter, if not redeemed a fixed rate per annum equal to the five-year USD treasury rate plus 2% p.a.
24 July 2034 24 July 2029 1,813 1,970
AUD 1,000 million subordinated notes
90 day bank bill rate + 1.98% p.a. 27 August 2029 27 August 2024 999 1,000
USD 1,500 million subordinated notes
2.894% p.a. until but excluding 4 February 2025. Thereafter, if not redeemed, a fixed rate per annum equal to the five-year USD treasury rate plus 1.350% p.a.
4 February 2030 4 February 2025 2,133 2,220
USD 1,500 million subordinated notes
2.668% p.a. until but excluding 15 November 2030. Thereafter, if not redeemed, a fixed rate per annum equal to the five-year USD treasury rate plus 1.750% p.a.
15 November 2035 15 November 2030 1,970 -
USD 1,000 million subordinated notes
Fixed 2.963% p.a. 16 November 2040 n/a 1,264 -
AUD 1,250 million subordinated notes
90 day bank bill rate + 1.55% p.a. 29 January 2031 29 January 2026 1,237 -
EUR 1,000 million subordinated notes
0.766% p.a. until but excluding 13 May 2026. Thereafter, if not redeemed, a fixed rate per annum equal to the prevailing 5-year EUR mid-market swap rate plus 1.05% p.a.
13 May 2031 13 May 2026 1,604 -
Total subordinated notes 18,362 14,090
Common features of subordinated notes
Interest payments are subject to Westpac being solvent at the time of, and immediately following, the interest payment. These subordinated notes contain non-viability loss absorption requirements.
Non-viability trigger event
Westpac will be required to convert some or all subordinated notes into a variable number of Westpac ordinary shares upon the occurrence of a non-viability trigger event. A non-viability trigger event will occur on similar terms as described under AT1 loan capital.
For each subordinated note converted, holders will receive a variable number of Westpac ordinary shares calculated using the formula described in the terms of the relevant Tier 2 instrument, subject to a maximum conversion number. The conversion number of Westpac ordinary shares will be calculated in a manner similar to that described under AT1 loan capital for a non-viability trigger event. For each Tier 2 instrument, the maximum conversion number is set using a Westpac ordinary share price which is broadly equivalent to 20% of the Westpac ordinary share price at the time of issue.
Following the occurrence of a non-viability trigger event, if conversion of a Tier 2 instrument does not occur within five business days, holders’ rights in relation to the relevant Tier 2 instrument will be immediately and irrevocably terminated.
Subordinated perpetual notes
These notes have no final maturity but Westpac can choose to redeem them at par on any interest payment date falling on or after September 1991, subject to APRA approval and certain other conditions. Interest is cumulative and payable on the notes semi-annually at a rate of 6 month US$ LIBOR plus 0.15% p.a., subject to Westpac being solvent immediately after making the payment and having paid any dividend on any class of share capital of Westpac within the prior 12-month period.
These notes qualify for transitional treatment as Tier 2 capital of Westpac under APRA’s Basel III capital adequacy framework.
The rights of the noteholders and coupon holders are subordinated to the claims of all creditors (including depositors) of Westpac other than creditors whose claims against Westpac rank equally with, or junior to, these notes.
Note 19. Loan capital (continued)
1. Excludes subordinated perpetual notes.2. Interest payments are made periodically as set out in the terms of the subordinated notes.3. Westpac may elect to redeem the relevant Tier 2 instrument on the optional redemption date or dates, subject to APRA’s prior written
approval. If not redeemed on the first optional redemption date, Westpac may elect to redeem the relevant Tier 2 instrument on any interest payment date after the first optional redemption date (except for USD 1,500 million subordinated notes with an optional redemption date in November 2026, USD 1,250 million subordinated notes with an optional redemption date in July 2029, USD 1,500 million subordinated notes with an optional redemption date in February 2025, USD 1,500 million subordinated notes with an optional redemption date in November 2030, and EUR 1,000 million subordinated notes with an optional redemption date in May 2026), subject to APRA’s prior written approval.

190 WESTPAC GROUP 2021 ANNUAL REPORT
Notes to the financial statements
Note 20. Derivative financial instruments
Accounting policy
Derivative financial instruments are instruments whose values are derived from the value of an underlying asset, reference rate or index and include forwards, futures, swaps and options.
The Group uses derivative financial instruments for meeting customers’ needs, our asset and liability risk management (ALM) activities, and undertaking market making and positioning activities.
Trading derivatives
Derivatives which are used in our ALM activities but are not designated into a hedge accounting relationship are considered economic hedges, and are adjusted for cash earnings purposes due to the accounting mismatch between the fair value of the derivatives and the accounting treatment of the underlying exposure (refer to Note 2 for further details). These derivatives, along with derivatives used for meeting customers’ needs and undertaking market making and positioning activities, are measured at FVIS and are disclosed as trading derivatives.
Hedging derivatives
Hedging derivatives are those which are used in our ALM activities and have also been designated into one of three hedge accounting relationships: fair value hedge; cash flow hedge; or hedge of a net investment in a foreign operation. These derivatives are measured at fair value. These hedge designations and the associated accounting treatment are detailed below.
For more details regarding the Group’s ALM activities, refer to Note 21.
Fair value hedges
Fair value hedges are used to hedge the exposure to changes in the fair value of an asset or liability.
Changes in the fair value of derivatives and the hedged asset or liability in fair value hedges are recognised in interest income. The carrying value of the hedged asset or liability is adjusted for the changes in fair value related to the hedged risk.
If a hedge is discontinued, any fair value adjustments to the carrying value of the asset or liability are amortised to net interest income over the period to maturity. If the asset or liability is sold, any unamortised adjustment is immediately recognised in net interest income.
Cash flow hedges
Cash flow hedges are used to hedge the exposure to variability of cash flows attributable to an asset, liability or future forecast transaction.
For effective hedges, changes in the fair value of derivatives are recognised in the cash flow hedge reserve through OCI and subsequently recognised in interest income when the cash flows attributable to the asset or liability that was hedged impact the income statement.
For hedges with some ineffectiveness, the changes in the fair value of the derivatives relating to the ineffective portion are immediately recognised in interest income.
If a hedge is discontinued, any cumulative gain or loss remains in OCI. It is amortised to net interest income over the period in which the asset or liability that was hedged also impacts the income statement.
If a hedge of a forecast transaction is no longer expected to occur, any cumulative gain or loss in OCI is immediately recognised in net interest income.
Net investment hedges
Net investment hedges are used to hedge FX risks arising from a net investment of a foreign operation.
For effective hedges, changes in the fair value of derivatives are recognised in the foreign currency translation reserve through OCI.
For hedges with some ineffectiveness, the changes in the fair value of the derivatives relating to the ineffective portion are immediately recognised in non-interest income.
If a foreign operation is disposed of, any cumulative gain or loss in OCI is immediately recognised in non-interest income.

1913 FIN
AN
CIA
L STATE
ME
NTS
2 GR
OU
P P
ER
FOR
MA
NC
E1 STR
ATE
GIC
RE
PO
RT
4 SH
AR
EH
OLD
ER
INFO
RM
ATIO
NWESTPAC GROUP 2021 ANNUAL REPORT
Notes to the financial statements
Total derivatives
The carrying values of derivative instruments are set out in the tables below.
Total derivativesConsolidated Trading Hedging carrying value$m Assets Liabilities Assets Liabilities Assets Liabilities
2021
Interest rate contracts1
Forward rate agreements 1 (1) - - 1 (1)
Swap agreements 30,491 (29,630) 3,530 (5,437) 34,021 (35,067)
Options 115 (121) - - 115 (121)
Total interest rate contracts 30,607 (29,752) 3,530 (5,437) 34,137 (35,189)
FX contracts
Spot and forward contracts 5,896 (5,554) 38 (51) 5,934 (5,605)
Cross currency swap agreements 6,433 (6,912) 749 (175) 7,182 (7,087)
Options 198 (173) - - 198 (173)
Total FX contracts 12,527 (12,639) 787 (226) 13,314 (12,865)
Credit default swaps
Credit protection bought - (15) - - - (15)
Credit protection sold 13 - - - 13 -
Total credit default swaps 13 (15) - - 13 (15)
Commodity contracts 227 (360) - - 227 (360)
Equities 2 - - - 2 -
Total of gross derivatives 43,376 (42,766) 4,317 (5,663) 47,693 (48,429)
Impact of netting arrangements (25,010) 25,240 (3,330) 5,130 (28,340) 30,370
Total of net derivatives 18,366 (17,526) 987 (533) 19,353 (18,059)
2020
Interest rate contracts1
Forward rate agreements 14 (14) - - 14 (14)
Swap agreements 44,366 (42,724) 5,916 (10,331) 50,282 (53,055)
Options 161 (165) - - 161 (165)
Total interest rate contracts 44,541 (42,903) 5,916 (10,331) 50,457 (53,234)
FX contracts
Spot and forward contracts 5,595 (4,797) 61 (46) 5,656 (4,843)
Cross currency swap agreements 4,977 (8,872) 1,450 (141) 6,427 (9,013)
Options 383 (200) - - 383 (200)
Total FX contracts 10,955 (13,869) 1,511 (187) 12,466 (14,056)
Credit default swaps
Credit protection bought - (59) - - - (59)
Credit protection sold 57 - - - 57 -
Total credit default swaps 57 (59) - - 57 (59)
Commodity contracts 352 (204) - - 352 (204)
Equities 3 - - - 3 -
Total of gross derivatives 55,908 (57,035) 7,427 (10,518) 63,335 (67,553)
Impact of netting arrangements (34,402) 34,819 (5,566) 9,680 (39,968) 44,499
Total of net derivatives 21,506 (22,216) 1,861 (838) 23,367 (23,054)
1. The fair value of futures contracts is settled daily with the exchange, and therefore have been excluded from this table.
Note 20. Derivative financial instruments (continued)
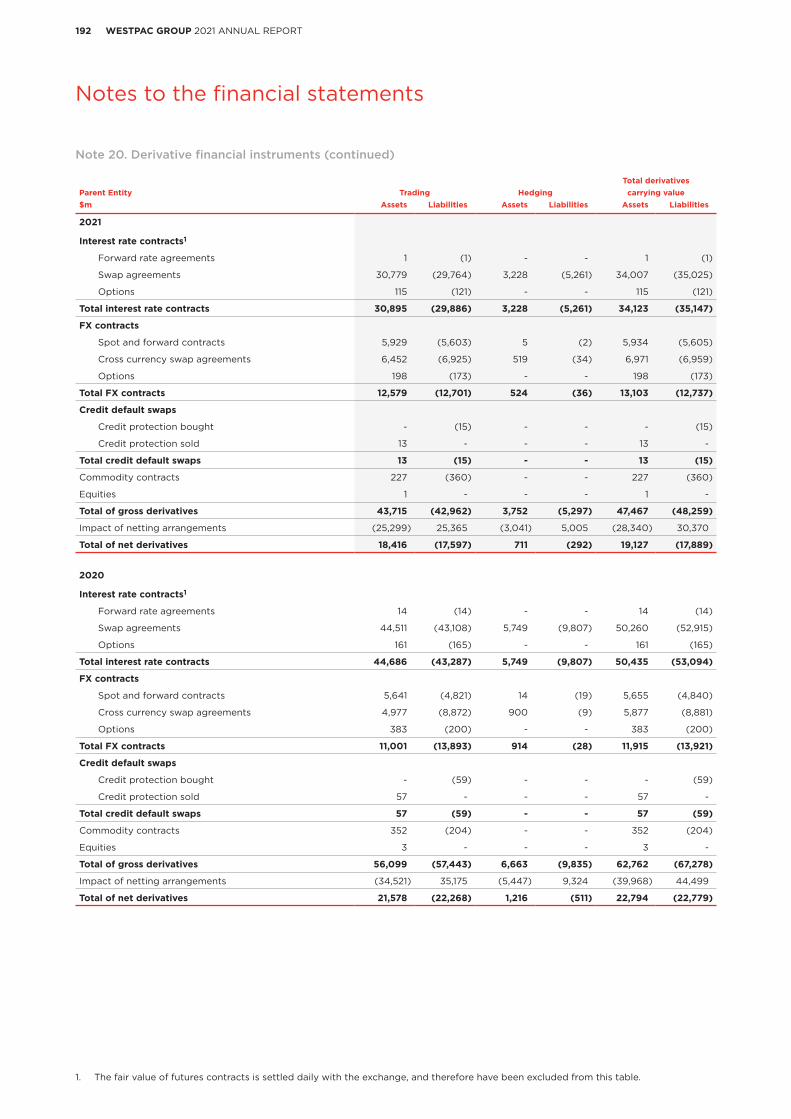
192 WESTPAC GROUP 2021 ANNUAL REPORT
Notes to the financial statements
Total derivativesParent Entity Trading Hedging carrying value$m Assets Liabilities Assets Liabilities Assets Liabilities
2021
Interest rate contracts1
Forward rate agreements 1 (1) - - 1 (1)
Swap agreements 30,779 (29,764) 3,228 (5,261) 34,007 (35,025)
Options 115 (121) - - 115 (121)
Total interest rate contracts 30,895 (29,886) 3,228 (5,261) 34,123 (35,147)
FX contracts
Spot and forward contracts 5,929 (5,603) 5 (2) 5,934 (5,605)
Cross currency swap agreements 6,452 (6,925) 519 (34) 6,971 (6,959)
Options 198 (173) - - 198 (173)
Total FX contracts 12,579 (12,701) 524 (36) 13,103 (12,737)
Credit default swaps
Credit protection bought - (15) - - - (15)
Credit protection sold 13 - - - 13 -
Total credit default swaps 13 (15) - - 13 (15)
Commodity contracts 227 (360) - - 227 (360)
Equities 1 - - - 1 -
Total of gross derivatives 43,715 (42,962) 3,752 (5,297) 47,467 (48,259)
Impact of netting arrangements (25,299) 25,365 (3,041) 5,005 (28,340) 30,370
Total of net derivatives 18,416 (17,597) 711 (292) 19,127 (17,889)
2020
Interest rate contracts1
Forward rate agreements 14 (14) - - 14 (14)
Swap agreements 44,511 (43,108) 5,749 (9,807) 50,260 (52,915)
Options 161 (165) - - 161 (165)
Total interest rate contracts 44,686 (43,287) 5,749 (9,807) 50,435 (53,094)
FX contracts
Spot and forward contracts 5,641 (4,821) 14 (19) 5,655 (4,840)
Cross currency swap agreements 4,977 (8,872) 900 (9) 5,877 (8,881)
Options 383 (200) - - 383 (200)
Total FX contracts 11,001 (13,893) 914 (28) 11,915 (13,921)
Credit default swaps
Credit protection bought - (59) - - - (59)
Credit protection sold 57 - - - 57 -
Total credit default swaps 57 (59) - - 57 (59)
Commodity contracts 352 (204) - - 352 (204)
Equities 3 - - - 3 -
Total of gross derivatives 56,099 (57,443) 6,663 (9,835) 62,762 (67,278)
Impact of netting arrangements (34,521) 35,175 (5,447) 9,324 (39,968) 44,499
Total of net derivatives 21,578 (22,268) 1,216 (511) 22,794 (22,779)
1. The fair value of futures contracts is settled daily with the exchange, and therefore have been excluded from this table.
Note 20. Derivative financial instruments (continued)

1933 FIN
AN
CIA
L STATE
ME
NTS
2 GR
OU
P P
ER
FOR
MA
NC
E1 STR
ATE
GIC
RE
PO
RT
4 SH
AR
EH
OLD
ER
INFO
RM
ATIO
NWESTPAC GROUP 2021 ANNUAL REPORT
Notes to the financial statements
Hedge accounting
The Group designates derivatives into hedge accounting relationships in order to manage the volatility in earnings and capital that would otherwise arise from interest rate and FX risks that may result from differences in the accounting treatment of derivatives and underlying exposures. These hedge accounting relationships and the risks they are used to hedge are described below.
The Group enters into one-to-one hedge relationships to manage specific exposures where the terms of the hedged item significantly match the terms of the hedging instrument. The Group also uses dynamic hedge accounting where the hedged items are part of a portfolio of assets and/or liabilities that frequently change. In this hedging strategy, the exposure being hedged and the hedging instruments may change frequently rather than there being a one-to-one hedge accounting relationship for a specific exposure.
Fair value hedges
Interest rate risk
The Group hedges its interest rate risk to reduce exposure to changes in fair value due to interest rate fluctuations over the hedging period. Interest rate risk arising from fixed rate debt issuances and fixed rate bonds classified as investment securities at FVOCI is hedged with single currency fixed to floating interest rate derivatives. The Group also hedges its benchmark interest rate risk from fixed rate foreign currency denominated debt issuances using cross currency swaps. In applying fair value hedge accounting, the Group primarily uses one-to-one hedge accounting to manage specific exposures.
The Group also uses a dynamic hedge accounting strategy for fair value portfolio hedge accounting of some fixed rate mortgages to reduce exposure to changes in fair value due to interest rate fluctuations over the hedging period. These fixed rate mortgages are allocated to time buckets based on their expected repricing dates and the fixed-to-floating interest rate derivatives are designated accordingly to the capacity in the relevant time buckets.
The Group hedges the benchmark interest rate which generally represents the most significant component of the changes in fair value. The benchmark interest rate is a component of interest rate risk that is observable in the relevant financial markets, for example, BBSW for AUD interest rates, LIBOR for USD interest rates and BKBM for NZD interest rates. Ineffectiveness may arise from timing or discounting differences on repricing between the hedged item and the derivative. For the portfolio hedge accounting ineffectiveness also arises from prepayment risk (i.e. the difference between actual and expected prepayment of loans). In order to manage the ineffectiveness from early repayments and accommodate new originations the portfolio hedges are de-designated and redesignated periodically.
Cash flow hedges
Interest rate risk
The Group’s exposure to the volatility of interest cash flows from customer deposits and loans is hedged with interest rate derivatives using a dynamic hedge accounting strategy called macro cash flow hedges. Customer deposits and loans are allocated to time buckets based on their expected repricing dates. The interest rate derivatives are designated accordingly to the gross asset or gross liability positions for the relevant time buckets. The Group hedges the benchmark interest rate which generally represents the most significant component of the changes in fair value. The benchmark interest rate is a component of interest rate risk that is observable in the relevant financial markets, for example, BBSW for AUD interest rates, LIBOR for USD interest rates and BKBM for NZD interest rates. Ineffectiveness may arise from timing or discounting differences on repricing between the hedged item and the interest rate derivative. Ineffectiveness also arises if the notional values of the interest rate derivatives exceed the capacity for the relevant time buckets. The hedge accounting relationship is reviewed on a monthly basis and the hedging relationships are de-designated and redesignated if necessary.
FX risk
The Group’s exposure to foreign currency principal and credit margin cash flows from fixed rate foreign currency debt issuances is hedged through the use of cross currency derivatives in a one-to-one hedging relationship to manage the changes between the foreign currency and AUD. In addition, for floating rate foreign currency debt issuances, the Group hedges from foreign floating to primarily AUD or NZD floating interest rates. These exposures represent the most significant components of fair value. Ineffectiveness may arise from timing or discounting differences on repricing between the hedged item and the cross currency derivative.
Note 20. Derivative financial instruments (continued)

194 WESTPAC GROUP 2021 ANNUAL REPORT
Notes to the financial statements
Net investment hedges
FX risk
Structural FX risk results from Westpac’s capital deployed in offshore branches and subsidiaries, where it is denominated in currencies other than Australian dollars. As exchange rates move, the Australian dollar equivalent of offshore capital is subject to change that could introduce significant variability to the Group’s reported financial results and capital ratios.
The Group uses FX forward contracts when hedging the currency translation risk arising from net investments in foreign operations. The Group currently applies hedge accounting to its net investment in New Zealand operations which is the most material offshore operation and therefore the hedged risk is the movement of the NZD against the AUD. Ineffectiveness only arises if the notional values of the FX forward contracts exceed the net investment in New Zealand operations.
Economic hedges
As part of the Group’s ALM activities, economic hedges may be entered into to hedge New Zealand future earnings and long-term funding transactions. These hedges do not qualify for hedge accounting and the impact on the income statement of these hedges is treated as a cash earnings adjustment. This is due to the accounting mismatch between the fair value accounting of the derivatives used in the economic hedges when compared to the recognition of the New Zealand future earnings as they are earned and the amortised cost accounting of the borrowing respectively. Refer to Note 2 for further details.
Interest Rate Benchmark Reform
The Group’s hedging relationships include hedged items and hedging instruments that are impacted by IBOR reform. Refer to Note 21.5 for further details of the Group’s exposure to IBOR reform.
Hedging instruments
The following tables show the carrying value of hedging instruments and a maturity analysis of the notional amounts of the hedging instruments in one-to-one hedge relationships categorised by the types of hedge relationships and the hedged risk.
Notional amounts
Over
Consolidated Within 1 year to Over Carrying value
$m Hedging instrument Hedged risk 1 year 5 years 5 years Total Assets Liabilities
2021One-to-one hedge relationships
Fair value hedges Interest rate swap Interest rate risk 11,674 59,022 54,250 124,946 2,402 (4,889)
Cross currency swap Interest rate risk 4,717 5,251 3,604 13,572 227 -
Cash flow hedges Cross currency swap FX risk 5,905 5,251 3,604 14,760 522 (175)
Net investment hedges Forward contracts FX risk 6,574 - - 6,574 38 (51)
Total one-to-one hedge relationships 28,870 69,524 61,458 159,852 3,189 (5,115)Macro hedge relationships
Portfolio fair value hedges Interest rate swap Interest rate risk n/a n/a n/a 28,258 60 (24)
Macro cash flow hedges Interest rate swap Interest rate risk n/a n/a n/a 201,339 1,068 (524)
Total macro hedge relationships n/a n/a n/a 229,597 1,128 (548)Total of gross hedging derivatives n/a n/a n/a 389,449 4,317 (5,663)Impact of netting arrangements n/a n/a n/a n/a (3,330) 5,130
Total of net hedging derivatives n/a n/a n/a n/a 987 (533)
Note 20. Derivative financial instruments (continued)

1953 FIN
AN
CIA
L STATE
ME
NTS
2 GR
OU
P P
ER
FOR
MA
NC
E1 STR
ATE
GIC
RE
PO
RT
4 SH
AR
EH
OLD
ER
INFO
RM
ATIO
NWESTPAC GROUP 2021 ANNUAL REPORT
Notes to the financial statements
Notional amounts
OverConsolidated Within 1 year to Over Carrying value$m Hedging instrument Hedged risk 1 year 5 years 5 years Total Assets Liabilities
2020One-to-one hedge relationships
Fair value hedges Interest rate swap Interest rate risk 16,748 60,258 56,979 133,985 4,395 (8,810)
Cross currency swap Interest rate risk 4,668 8,381 1,615 14,664 355 -
Cash flow hedges Cross currency swap FX risk 5,877 9,590 1,615 17,082 1,095 (141)
Net investment hedges Forward contracts FX risk 6,320 - - 6,320 61 (46)
Total one-to-one hedge relationships 33,613 78,229 60,209 172,051 5,906 (8,997)Macro hedge relationships
Portfolio fair value hedges Interest rate swap Interest rate risk n/a n/a n/a 19,907 - (187)
Macro cash flow hedges Interest rate swap Interest rate risk n/a n/a n/a 174,611 1,521 (1,334)
Total macro hedge relationships n/a n/a n/a 194,518 1,521 (1,521)Total of gross hedging derivatives n/a n/a n/a 366,569 7,427 (10,518)Impact of netting arrangements n/a n/a n/a n/a (5,566) 9,680
Total of net hedging derivatives n/a n/a n/a n/a 1,861 (838)
Notional amounts
OverParent Entity Within 1 year to Over Carrying value$m Hedging instrument Hedged risk 1 year 5 years 5 years Total Assets Liabilities
2021
One-to-one hedge relationships
Fair value hedges Interest rate swap Interest rate risk 11,283 57,732 54,250 123,265 2,400 (4,837)
Cross currency swap Interest rate risk 3,108 1,682 707 5,497 165 -
Cash flow hedges Cross currency swap FX risk 3,108 1,682 707 5,497 354 (34)
Net investment hedges Forward contracts FX risk 1,263 - - 1,263 5 (2)
Total one-to-one hedge relationships 18,762 61,096 55,664 135,522 2,924 (4,873)
Macro hedge relationships
Portfolio fair value hedges Interest rate swap Interest rate risk n/a n/a n/a 2,872 7 (1)
Macro cash flow hedges Interest rate swap Interest rate risk n/a n/a n/a 180,533 821 (423)
Total macro hedge relationships n/a n/a n/a 183,405 828 (424)
Total of gross hedging derivatives n/a n/a n/a 318,927 3,752 (5,297)
Impact of netting arrangements n/a n/a n/a n/a (3,041) 5,005
Total of net hedging derivatives n/a n/a n/a n/a 711 (292)
2020
One-to-one hedge relationships
Fair value hedges Interest rate swap Interest rate risk 16,125 58,628 56,979 131,732 4,390 (8,644)
Cross currency swap Interest rate risk 2,981 4,284 1,286 8,551 252 -
Cash flow hedges Cross currency swap FX risk 2,981 4,284 1,286 8,551 648 (9)
Net investment hedges Forward contracts FX risk 1,240 - - 1,240 14 (19)
Total one-to-one hedge relationships 23,327 67,196 59,551 150,074 5,304 (8,672)
Macro hedge relationships
Portfolio fair value hedges Interest rate swap Interest rate risk n/a n/a n/a - - -
Macro cash flow hedges Interest rate swap Interest rate risk n/a n/a n/a 162,033 1,359 (1,163)
Total macro hedge relationships n/a n/a n/a 162,033 1,359 (1,163)
Total of gross hedging derivatives n/a n/a n/a 312,107 6,663 (9,835)
Impact of netting arrangements n/a n/a n/a n/a (5,447) 9,324
Total of net hedging derivatives n/a n/a n/a n/a 1,216 (511)
Note 20. Derivative financial instruments (continued)

196 WESTPAC GROUP 2021 ANNUAL REPORT
Notes to the financial statements
The following tables show the weighted average FX rate related to significant hedging instruments in one-to-one hedge relationships.
Weighted average rate
Hedging instrument Hedged risk Currency pair 2021 2020
Consolidated
Cash flow hedges Cross currency swap FX risk EUR:AUD 0.6823 0.6687
JPY:AUD not material 81.4507
EUR:NZD 0.6086 0.6160
HKD:NZD not material 4.9670
Net investment hedges Forward contracts FX risk NZD:AUD 1.0505 1.0838
Parent Entity
Cash flow hedges Cross currency swap FX risk EUR:AUD 0.6823 0.6687
JPY:AUD 79.6302 81.4507
CHF:AUD 0.7679 not material
CNH:AUD 4.9359 4.9492
Net investment hedges Forward contracts FX risk NZD:AUD 1.0460 1.0904
Impact of hedge accounting in the balance sheets and reserves
The following tables show the carrying amount of hedged items in a fair value hedge relationship and the component of the carrying amount related to accumulated fair value hedge accounting adjustments (FVHA).
2021 2020FVHA FVHA
Carrying amount of included in carrying Carrying amount of included in carrying$m hedged item amount hedged item amount
Consolidated
Interest rate risk
Investment securities 60,657 117 68,862 3,285
Loans 28,340 (59) 20,290 140
Debt issues and loan capital (84,776) (1,983) (96,605) (4,559)
Parent Entity
Interest rate risk
Investment securities 59,008 101 66,529 3,175
Loans 3,009 (5) 251 8
Debt issues and loan capital (76,634) (1,931) (90,287) (4,440)
There were no (2020: nil) FVHA included in the above carrying amounts relating to hedged items that have ceased to be adjusted for hedging gains and losses.
The pre-tax impact of cash flow and net investment hedges on reserves is detailed below:
2021 2020Interest FX Interest FX
$m rate risk risk Total rate risk risk Total
Consolidated
Cash flow hedge reserve
Balance as at beginning of year 73 (132) (59) (99) (83) (182)
Net gains/(losses) from changes in fair value 352 (56) 296 (1) (94) (95)
Transferred to interest income (31) 70 39 173 45 218
Balance as at end of year 394 (118) 276 73 (132) (59)
Parent Entity
Cash flow hedge reserve
Balance as at beginning of year 83 (53) 30 (70) (22) (92)
Net gains/(losses) from changes in fair value 201 (24) 177 16 (44) (28)
Transferred to interest income (41) 28 (13) 137 13 150
Balance as at end of year 243 (49) 194 83 (53) 30
Note 20. Derivative financial instruments (continued)
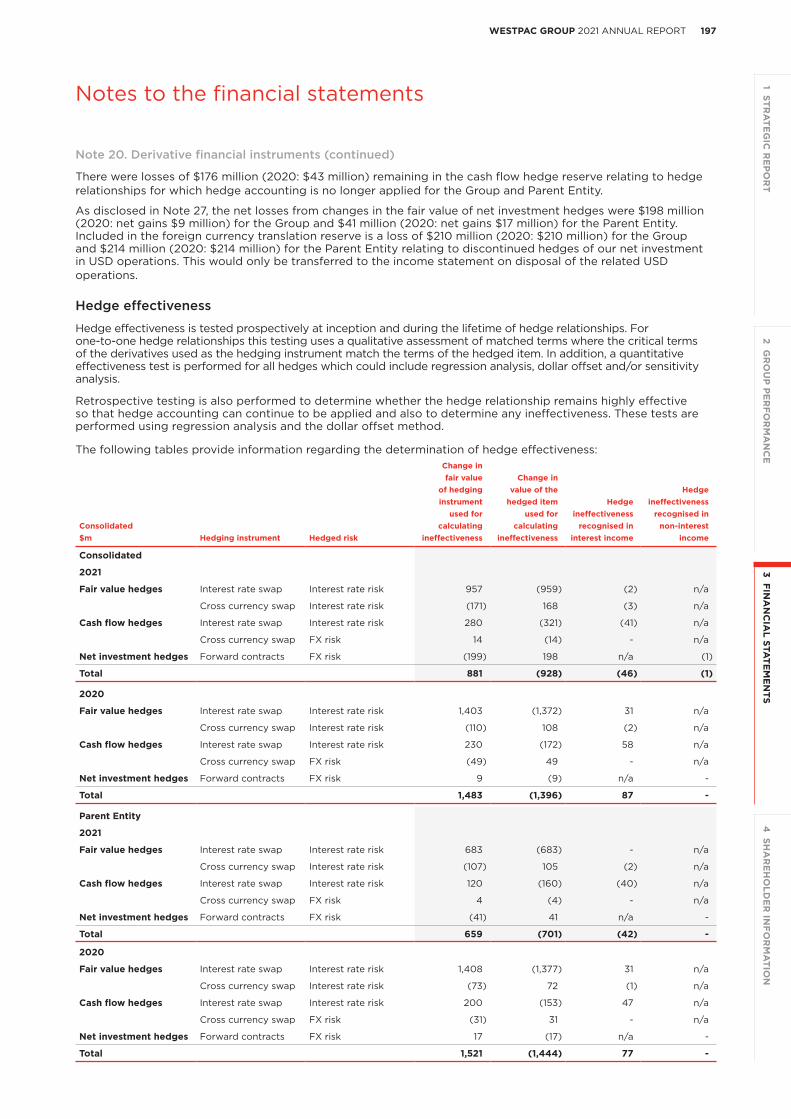
1973 FIN
AN
CIA
L STATE
ME
NTS
2 GR
OU
P P
ER
FOR
MA
NC
E1 STR
ATE
GIC
RE
PO
RT
4 SH
AR
EH
OLD
ER
INFO
RM
ATIO
NWESTPAC GROUP 2021 ANNUAL REPORT
Notes to the financial statements
There were losses of $176 million (2020: $43 million) remaining in the cash flow hedge reserve relating to hedge relationships for which hedge accounting is no longer applied for the Group and Parent Entity.
As disclosed in Note 27, the net losses from changes in the fair value of net investment hedges were $198 million (2020: net gains $9 million) for the Group and $41 million (2020: net gains $17 million) for the Parent Entity. Included in the foreign currency translation reserve is a loss of $210 million (2020: $210 million) for the Group and $214 million (2020: $214 million) for the Parent Entity relating to discontinued hedges of our net investment in USD operations. This would only be transferred to the income statement on disposal of the related USD operations.
Hedge effectiveness
Hedge effectiveness is tested prospectively at inception and during the lifetime of hedge relationships. For one-to-one hedge relationships this testing uses a qualitative assessment of matched terms where the critical terms of the derivatives used as the hedging instrument match the terms of the hedged item. In addition, a quantitative effectiveness test is performed for all hedges which could include regression analysis, dollar offset and/or sensitivity analysis.
Retrospective testing is also performed to determine whether the hedge relationship remains highly effective so that hedge accounting can continue to be applied and also to determine any ineffectiveness. These tests are performed using regression analysis and the dollar offset method.
The following tables provide information regarding the determination of hedge effectiveness:Change infair value Change in
of hedging value of the Hedgeinstrument hedged item Hedge ineffectiveness
used for used for ineffectiveness recognised inConsolidated calculating calculating recognised in non-interest$m Hedging instrument Hedged risk ineffectiveness ineffectiveness interest income income
Consolidated
2021
Fair value hedges Interest rate swap Interest rate risk 957 (959) (2) n/a
Cross currency swap Interest rate risk (171) 168 (3) n/a
Cash flow hedges Interest rate swap Interest rate risk 280 (321) (41) n/a
Cross currency swap FX risk 14 (14) - n/a
Net investment hedges Forward contracts FX risk (199) 198 n/a (1)
Total 881 (928) (46) (1)
2020
Fair value hedges Interest rate swap Interest rate risk 1,403 (1,372) 31 n/a
Cross currency swap Interest rate risk (110) 108 (2) n/a
Cash flow hedges Interest rate swap Interest rate risk 230 (172) 58 n/a
Cross currency swap FX risk (49) 49 - n/a
Net investment hedges Forward contracts FX risk 9 (9) n/a -
Total 1,483 (1,396) 87 -
Parent Entity
2021
Fair value hedges Interest rate swap Interest rate risk 683 (683) - n/a
Cross currency swap Interest rate risk (107) 105 (2) n/a
Cash flow hedges Interest rate swap Interest rate risk 120 (160) (40) n/a
Cross currency swap FX risk 4 (4) - n/a
Net investment hedges Forward contracts FX risk (41) 41 n/a -
Total 659 (701) (42) -
2020
Fair value hedges Interest rate swap Interest rate risk 1,408 (1,377) 31 n/a
Cross currency swap Interest rate risk (73) 72 (1) n/a
Cash flow hedges Interest rate swap Interest rate risk 200 (153) 47 n/a
Cross currency swap FX risk (31) 31 - n/a
Net investment hedges Forward contracts FX risk 17 (17) n/a -
Total 1,521 (1,444) 77 -
Note 20. Derivative financial instruments (continued)

198 WESTPAC GROUP 2021 ANNUAL REPORT
Notes to the financial statements
Note 21. Financial risk
Financial instruments are fundamental to the Group’s business of providing banking and financial services. The associated financial risks (including credit risk, funding and liquidity risk and market risk) are a significant proportion of the total risks faced by the Group.
This note details the financial risk management policies, practices and quantitative information of the Group’s principal financial risk exposures.
Index Note nameNote
number
Overview Risk management frameworks 21.1
Credit risk
The risk of financial loss where a customer or counterparty fails to meet their financial obligations.
Credit risk ratings system 21.2.1
Credit risk mitigation, collateral and other credit enhancements 21.2.2
Credit risk concentrations 21.2.3
Credit quality of financial assets 21.2.4
Non-performing loans and credit commitments 21.2.5
Collateral held 21.2.6
Funding and liquidity risk
The risk that Westpac cannot meet its payment obligations or that it does not have the appropriate amount, tenor and composition of funding and liquidity to support its assets.
Liquidity modelling 21.3.1
Sources of funding 21.3.2
Assets pledged as collateral 21.3.3
Contractual maturity of financial liabilities 21.3.4
Expected maturity 21.3.5
Market riskThe risk of an adverse impact on earnings resulting from changes in market factors, such as foreign exchange rates, interest rates, commodity prices or equity price.
Value-at-Risk (VaR) 21.4.1
Traded market risk 21.4.2
Non-traded market risk 21.4.3
IBOR reform Benchmark interest rate exposure 21.5
21.1 Risk management frameworks
The Board is responsible for approving the Westpac Group Risk Management Framework, Westpac Group Risk Management Strategy and Westpac Group Risk Appetite Statement and for monitoring the effectiveness of risk management by the Westpac Group. The Board has delegated to the Board Risk Committee (BRiskC) responsibility to:• review and recommend the Westpac Group Risk Management Framework, Westpac Group Risk Management
Strategy and Westpac Group Risk Appetite Statement to the Board for approval;• review and monitor the risk profile and controls of the Group consistent with Westpac Group’s Risk Appetite
Statement;• approve frameworks, policies and processes for managing risk (consistent with the Westpac Group Risk
Management Strategy and Westpac Group Risk Appetite Statement); and• review and, where appropriate, approve risks beyond the approval discretion provided to management.
The Board Legal, Regulatory & Compliance Committee (BLRCC) is a sub-committee of the BRiskC. The BLRCC oversees material legal and regulatory change relevant to the Westpac Group. In addition it oversees management of material litigation and regulatory investigations, compliance, conduct risk, financial crime risk and customer remediation activities and customer complaints. The BLRCC also reviews and approves the Compliance and Conduct Risk Management Framework and the Financial Crime Risk Management Framework.
For each of its primary financial risks, the Group maintains risk management frameworks and a number of supporting policies that define roles and responsibilities, acceptable practices, limits and key controls:
Notes to the financial statements

1993 FIN
AN
CIA
L STATE
ME
NTS
2 GR
OU
P P
ER
FOR
MA
NC
E1 STR
ATE
GIC
RE
PO
RT
4 SH
AR
EH
OLD
ER
INFO
RM
ATIO
NWESTPAC GROUP 2021 ANNUAL REPORT
Notes to the financial statements
Risk Risk management framework and controls
Credit risk • The Credit Risk Management Framework describes the principles, methodologies, systems, roles and responsibilities, reports and key controls for managing credit risk.
• The BRiskC, Westpac Group Executive Risk Committee (RISKCO) and Westpac Group Credit Risk Committee (CREDCO) monitor the risk profile, performance and management of the Group’s credit portfolio and the development and review of key credit risk policies.
• The Credit Risk Rating System Policy describes the credit risk rating system philosophy, design, key features and uses of rating outcomes.
• All models materially impacting the risk rating process are periodically reviewed in accordance with Westpac’s model risk policies.
• An annual review is performed of the Credit Risk Rating System by the BRiskC and CREDCO.• Specific credit risk estimates (including PD, LGD and EAD levels) are overseen, reviewed
annually and supported by the Credit Risk Estimates Committee (a subcommittee of CREDCO) prior to approval under delegated authority from the Chief Risk Officer.
• In determining the provision for ECL, the forward-looking economic inputs and the probability weightings of the forward-looking scenarios as well as any adjustments made to the modelled outcomes are subject to the approval of the Group Chief Financial Officer and the Chief Risk Officer with oversight from the Board of Directors (and its Committees).
• Policies for the delegation of credit approval authorities and formal limits for the extension of credit are established throughout the Group.
• Credit manuals are established throughout the Group including policies governing the origination, evaluation, approval, documentation, settlement and ongoing management of credit risks.
• Climate change related credit risks are considered in line with our Climate Change Position Statement (CCPS). Climate change risks are managed in accordance with the Group’s risk framework which is supported by the Sustainability Risk Management Framework (SRMF), Group Environmental, Social and Governance (ESG) Credit Risk Policy and Board Risk Appetite Statements (RAS). Where appropriate, these are applied at the portfolio, customer and transaction level.
• The Climate Change Financial Risk Committee oversees work to identify and manage the potential impact on credit exposures from climate change-related transition and physical risks across the Group and reports to CREDCO.
• The Group’s ESG Credit Risk Policy details the Group’s overall approach to managing ESG risks in the credit risk process for applicable transactions.
• Sector policies guide credit extension where industry-specific guidelines are considered necessary (e.g. acceptable financial ratios or permitted collateral).
• The Related Entity Risk Management Framework and supporting policies govern credit exposures to related entities, to minimise the spread of credit risk between Group entities and to comply with prudential requirements prescribed by APRA.
Note 21. Financial risk (continued)

200 WESTPAC GROUP 2021 ANNUAL REPORT
Notes to the financial statements
Risk Risk management framework and controls
Funding and liquidity risk
• Funding and liquidity risk is measured and managed in accordance with the policies and processes defined in the Board-approved Liquidity Risk Management Framework which is part of the Westpac Board-approved Risk Management Strategy.
• Responsibility for managing Westpac’s liquidity and funding positions in accordance with the Liquidity Risk Management Framework is delegated to Treasury, under the oversight of Group ALCO and Treasury Risk.
• Westpac’s Liquidity Risk Management Framework sets out Westpac’s funding and liquidity risk appetite, roles and responsibilities of key people managing funding and liquidity risk within Westpac, risk reporting and control processes and limits and targets used to manage Westpac’s balance sheet.
• Treasury undertakes an annual funding review that outlines Westpac’s balance sheet funding strategy over a three year period. This review encompasses trends in global markets, peer analysis, wholesale funding capacity, expected funding requirements and a funding risk analysis. This strategy is continuously reviewed to take account of changing market conditions, investor sentiment and estimations of asset and liability growth rates.
• Westpac monitors the composition and stability of its funding so that it remains within Westpac’s funding risk appetite. This includes compliance with both the Liquidity Coverage Ratio (LCR) and Net Stable Funding Ratio (NSFR).
• Westpac holds a portfolio of liquid assets for several purposes, including as a buffer against unforeseen funding requirements. The level of liquid assets held takes into account the liquidity requirements of Westpac’s balance sheet under normal and stress conditions.
• Treasury maintains a contingent funding plan that outlines the steps that should be taken by Westpac in the event of an emerging ‘funding crisis’. The plan is aligned with Westpac’s broader Liquidity Crisis Management Policy which is approved annually by the Board.
• Daily liquidity risk reports are reviewed by the Group’s Treasury and Treasury Risk teams. Liquidity reports are presented to Group ALCO monthly and to the Board quarterly.
Market risk • The Market Risk Framework describes the Group’s approach to managing traded and non-traded market risk.
• Traded market risk includes interest rate, FX, commodity, equity price, credit spread and volatility risks. Non-traded market risk includes interest rate and credit spread risks.
• Market risk is managed using VaR limits, Net interest income at risk (NaR) and structural risk limits (including credit spread and interest rate basis point value limits) as well as scenario analysis and stress testing.
• The BRiskC approves the risk appetite for traded and non-traded risks through the use of VaR, NaR and specific structural risk limits. This includes separate VaR sub-limits for the trading activities of Financial Markets and Treasury and for non-traded ALM activities.
• Market risk limits are assigned to business management based upon the Bank’s risk appetite and business strategies in addition to the consideration of market liquidity and concentration.
• Market risk positions are managed by the trading desks and ALM unit consistent with their delegated authorities and the nature and scale of the market risks involved.
• Daily monitoring of current exposure and limit utilisation is conducted independently by the Market Risk and Treasury Risk units, which monitor market risk exposures against VaR and structural risk limits. Daily VaR position reports are produced by risk type, by product lines and by geographic region. Quarterly reports are produced for the Westpac Group Market Risk Committee (MARCO), RISKCO and the BRiskC.
• Daily stress testing and backtesting of VaR results are performed to support model integrity and to analyse extreme or unexpected movements. A review of the potential profit and loss outcomes is also undertaken to monitor any skew created by the historical data. MARCO has ratified an approved escalation framework.
• The BRiskC has approved a framework for profit or loss escalation which considers both single day and 20 day cumulative results.
• Treasury’s ALM unit is responsible for managing the non-traded interest rate risk including risk mitigation through hedging using derivatives. This is overseen by the Treasury Risk unit and reviewed by Banking Book Risk Committee (BBRC), MARCO, RISKCO and BRiskC.
Note 21. Financial risk (continued)

2013 FIN
AN
CIA
L STATE
ME
NTS
2 GR
OU
P P
ER
FOR
MA
NC
E1 STR
ATE
GIC
RE
PO
RT
4 SH
AR
EH
OLD
ER
INFO
RM
ATIO
NWESTPAC GROUP 2021 ANNUAL REPORT
Notes to the financial statements
21.2 Credit Risk
21.2.1 Credit risk ratings system
The principal objective of the credit risk rating system is to assess the credit risk to which the Group is exposed. The Group has two main approaches to this assessment.
Transaction-managed customers
Transaction managed customers are generally customers with business lending exposures. They are individually assigned a Customer Risk Grade (CRG), corresponding to their expected PD. Each facility is assigned an LGD. The Group’s risk rating system has a tiered scale of risk grades for both non-defaulted customers and defaulted customers. Non-defaulted CRGs are mapped to Moody’s and S&P Global Ratings (S&P) external senior unsecured ratings.
The table below shows Westpac’s high level CRGs for transaction-managed portfolios mapped to the Group’s credit quality disclosure categories and to their corresponding external rating.
Transaction-managed
Financial statement disclosure Westpac CRG Moody’s Rating S&P Rating
Strong A Aaa – Aa3 AAA – AA–
B A1 – A3 A+ – A–
C Baa1 – Baa3 BBB+ – BBB–
Good/satisfactory D Ba1 – B1 BB+ – B+
Westpac RatingWeak E Watchlist
F Special Mention
Weak/default/non-performing G Substandard/Default
H Default
Program-managed portfolio
The program-managed portfolio generally includes retail products including mortgages, personal lending (including credit cards) as well as certain SME lending. These customers are grouped into pools of similar risk. Pools are created by analysing similar risk characteristics that have historically predicted that an account is likely to go into default. Customers grouped according to these predictive characteristics are assigned a PD and LGD relative to their pool. The credit quality of these pools is based on a combination of behavioural factors, delinquency trends, PD estimates and loan to valuation ratio (housing loans only).
Note 21. Financial risk (continued)
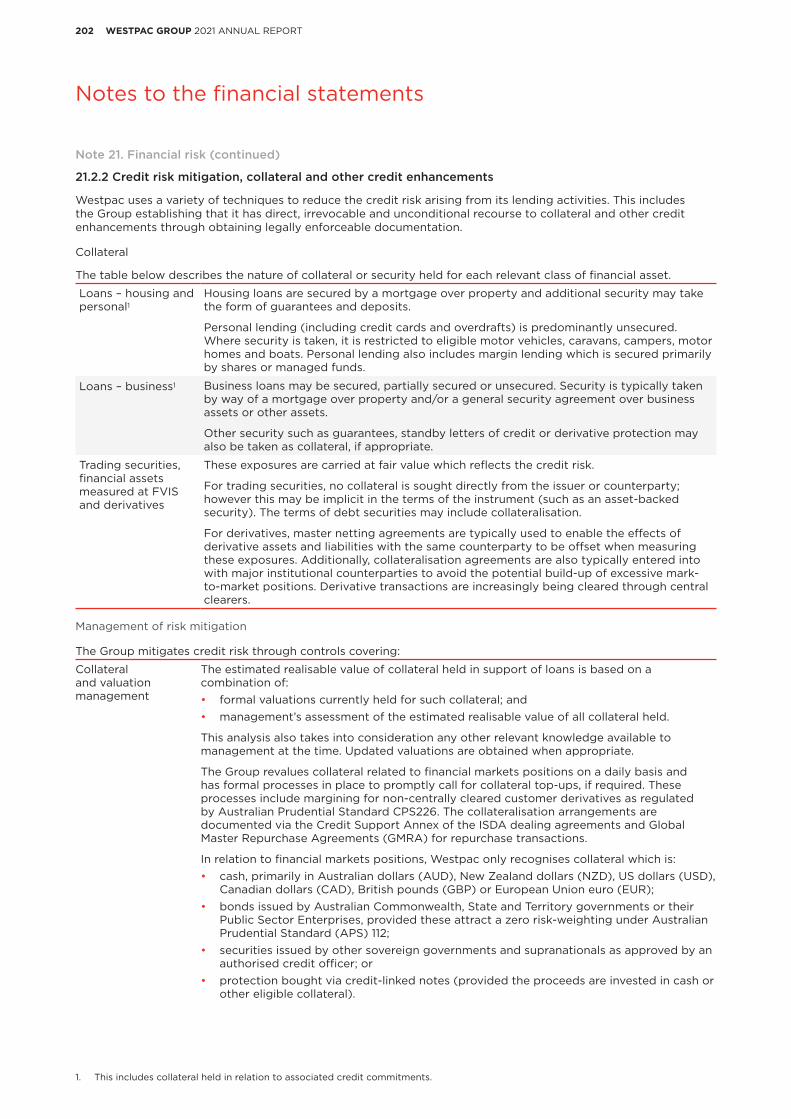
202 WESTPAC GROUP 2021 ANNUAL REPORT
Notes to the financial statements
21.2.2 Credit risk mitigation, collateral and other credit enhancements
Westpac uses a variety of techniques to reduce the credit risk arising from its lending activities. This includes the Group establishing that it has direct, irrevocable and unconditional recourse to collateral and other credit enhancements through obtaining legally enforceable documentation.
Collateral
The table below describes the nature of collateral or security held for each relevant class of financial asset.
Loans – housing and personal1
Housing loans are secured by a mortgage over property and additional security may take the form of guarantees and deposits.
Personal lending (including credit cards and overdrafts) is predominantly unsecured. Where security is taken, it is restricted to eligible motor vehicles, caravans, campers, motor homes and boats. Personal lending also includes margin lending which is secured primarily by shares or managed funds.
Loans – business1 Business loans may be secured, partially secured or unsecured. Security is typically taken by way of a mortgage over property and/or a general security agreement over business assets or other assets.
Other security such as guarantees, standby letters of credit or derivative protection may also be taken as collateral, if appropriate.
Trading securities, financial assets measured at FVIS and derivatives
These exposures are carried at fair value which reflects the credit risk.
For trading securities, no collateral is sought directly from the issuer or counterparty; however this may be implicit in the terms of the instrument (such as an asset-backed security). The terms of debt securities may include collateralisation.
For derivatives, master netting agreements are typically used to enable the effects of derivative assets and liabilities with the same counterparty to be offset when measuring these exposures. Additionally, collateralisation agreements are also typically entered into with major institutional counterparties to avoid the potential build-up of excessive mark-to-market positions. Derivative transactions are increasingly being cleared through central clearers.
Management of risk mitigation
The Group mitigates credit risk through controls covering:
Collateral and valuation management
The estimated realisable value of collateral held in support of loans is based on a combination of:• formal valuations currently held for such collateral; and• management’s assessment of the estimated realisable value of all collateral held.
This analysis also takes into consideration any other relevant knowledge available to management at the time. Updated valuations are obtained when appropriate.
The Group revalues collateral related to financial markets positions on a daily basis and has formal processes in place to promptly call for collateral top-ups, if required. These processes include margining for non-centrally cleared customer derivatives as regulated by Australian Prudential Standard CPS226. The collateralisation arrangements are documented via the Credit Support Annex of the ISDA dealing agreements and Global Master Repurchase Agreements (GMRA) for repurchase transactions.
In relation to financial markets positions, Westpac only recognises collateral which is:• cash, primarily in Australian dollars (AUD), New Zealand dollars (NZD), US dollars (USD),
Canadian dollars (CAD), British pounds (GBP) or European Union euro (EUR);• bonds issued by Australian Commonwealth, State and Territory governments or their
Public Sector Enterprises, provided these attract a zero risk-weighting under Australian Prudential Standard (APS) 112;
• securities issued by other sovereign governments and supranationals as approved by an authorised credit officer; or
• protection bought via credit-linked notes (provided the proceeds are invested in cash or other eligible collateral).
1. This includes collateral held in relation to associated credit commitments.
Note 21. Financial risk (continued)

2033 FIN
AN
CIA
L STATE
ME
NTS
2 GR
OU
P P
ER
FOR
MA
NC
E1 STR
ATE
GIC
RE
PO
RT
4 SH
AR
EH
OLD
ER
INFO
RM
ATIO
NWESTPAC GROUP 2021 ANNUAL REPORT
Notes to the financial statements
Note 21. Financial risk (continued)
Other credit enhancements
The Group only recognises guarantees, standby letters of credit, or credit derivative protection from the following entities (provided they are not related to the entity with which Westpac has a credit exposure):• Sovereign;• Australia and New Zealand public sector;• ADIs and overseas banks with a minimum risk grade equivalent of A3 / A–; and• Others with a minimum risk grade equivalent of A3 / A–.
Credit Portfolio Management (CPM) manages the Group’s corporate, sovereign and bank credit portfolios through monitoring the exposure and any offsetting hedge positions.
CPM purchases credit protection from entities meeting the criteria above and sells credit protection to diversify the Group’s credit risk.
Offsetting Creditworthy customers domiciled in Australia and New Zealand may enter into formal agreements with the Group, permitting the Group to set-off gross credit and debit balances in their nominated accounts. Cross-border set-offs are not permitted.
Close-out netting is undertaken with counterparties with whom the Group has entered into a legally enforceable master netting agreement for their off-balance sheet financial market transactions in the event of default.
Further details of offsetting are provided in Note 23.
Central clearing The Group executes derivative transactions through central clearing counterparties. Central clearing counterparties mitigate risk through stringent membership requirements, the collection of margin against all trades placed, the default fund, and an explicitly defined order of priority of payments in the event of default.
21.2.3 Credit risk concentrations
Credit risk is concentrated when a number of counterparties are engaged in similar activities, have similar economic characteristics and thus may be similarly affected by changes in economic or other conditions.
The Group monitors its credit portfolio to manage risk concentrations and rebalance the portfolio.
Individual customers or groups of related customers
The Group has large exposure limits governing the aggregate size of credit exposure normally acceptable to individual customers and groups of related customers. These limits are tiered by customer risk grade.
Specific industries
Exposures to businesses, governments and other financial institutions are classified into a number of industry clusters based on related Australian and New Zealand Standard Industrial Classification (ANZSIC) codes and are monitored against the Group’s industry risk appetite limits.
Individual countries
The Group has limits governing risks related to individual countries, such as political situations, government policies and economic conditions that may adversely affect either a customer’s ability to meet its obligations to the Group, or the Group’s ability to realise its assets in a particular country.
Maximum exposure to credit risk
The maximum exposure to credit risk (excluding collateral received) is represented by the carrying amount of on-balance sheet financial assets (which comprise cash and balances with central banks, collateral paid, trading securities and financial assets measured at FVIS, derivative financial instruments, investment securities, loans, other financial assets and certain balances included in assets held for sale) and undrawn credit commitments.
The following tables set out the credit risk concentrations to which the Group and the Parent Entity are exposed for on-balance sheet financial assets and for undrawn credit commitments.
Life insurance assets are excluded as primarily the credit risk is passed on to the policyholder and backed by the policyholder liabilities.
The balances for trading securities and financial assets measured at FVIS and investment securities exclude equity securities as the primary financial risk is not credit risk.

204 WESTPAC GROUP 2021 ANNUAL REPORT
Notes to the financial statements
Note 21. Financial risk (continued)
The credit concentrations for each significant class of financial asset are:
Trading securities and financial assets measured at FVIS (Note 10)
• 42% (2020: 64%) were issued by financial institutions for the Group; 44% (2020: 67%) for the Parent Entity.
• 53% (2020: 33%) were issued by government or semi-government authorities for the Group; 52% (2020: 31%) for the Parent Entity.
• 67% (2020: 79%) were held in Australia by the Group; 74% (2020: 84%) by the Parent Entity.
Investment securities (Note 11)
• 18% (2020: 18%) were issued by financial institutions for the Group; 19% (2020: 18%) for the Parent Entity.
• 81% (2020: 82%) were issued by government or semi-government authorities for the Group; 81% (2020: 82%) for the Parent Entity.
• 92% (2020: 92%) were held in Australia by the Group; 99% (2020: 98%) by the Parent Entity.
Loans (Note 12) • The table below provides a detailed breakdown of loans by industry and geographic classification.
Derivative financial instruments (Note 20)
• 78% (2020: 68%) were issued by financial institutions for both the Group and Parent Entity.
• 80% (2020: 76%) were held in Australia by the Group; 81% (2020: 78%) by the Parent Entity.

2053 FIN
AN
CIA
L STATE
ME
NTS
2 GR
OU
P P
ER
FOR
MA
NC
E1 STR
ATE
GIC
RE
PO
RT
4 SH
AR
EH
OLD
ER
INFO
RM
ATIO
NWESTPAC GROUP 2021 ANNUAL REPORT
Notes to the financial statements
Note 21. Financial risk (continued)
2021 2020Total all Undrawn Total all Undrawn
other on credit other on creditConsolidated balance commit- balance commit-$m Loans sheet ments Total Loans sheet ments Total
Australia
Accommodation, cafes and restaurants 7,658 13 1,294 8,965 7,933 23 1,225 9,181
Agriculture, forestry and fishing 10,501 32 2,367 12,900 10,116 43 2,219 12,378
Construction 6,214 16 3,718 9,948 6,711 15 3,643 10,369
Finance and insurance 16,026 86,412 9,664 112,102 13,348 68,154 8,954 90,456
Government, administration and defence 957 72,343 1,327 74,627 730 79,452 1,588 81,770
Manufacturing 8,067 570 6,351 14,988 8,493 755 6,477 15,725
Mining 3,003 158 3,527 6,688 2,975 427 3,735 7,137
Property 45,645 435 12,792 58,872 44,468 671 10,869 56,008
Property services and business services 11,248 100 6,544 17,892 12,562 150 7,019 19,731
Services 9,918 437 8,058 18,413 11,675 247 7,595 19,517
Trade 13,165 1,171 9,535 23,871 13,268 365 10,171 23,804
Transport and storage 7,681 777 5,734 14,192 8,218 1,174 5,136 14,528
Utilities 5,445 937 5,206 11,588 4,962 1,406 4,918 11,286
Retail lending 467,218 481 86,570 554,269 454,433 553 84,454 539,440
Other 6,048 821 2,160 9,029 5,706 1,161 2,491 9,358
Total Australia 618,794 164,703 164,847 948,344 605,598 154,596 160,494 920,688
New Zealand
Accommodation, cafes and restaurants 389 1 49 439 388 1 51 440
Agriculture, forestry and fishing 9,371 29 724 10,124 9,101 57 632 9,790
Construction 438 2 481 921 509 8 429 946
Finance and insurance 3,344 13,787 1,984 19,115 3,427 9,274 1,782 14,483
Government, administration and defence 145 6,919 767 7,831 94 7,739 865 8,698
Manufacturing 1,608 80 1,525 3,213 1,689 115 1,782 3,586
Mining 202 3 53 258 203 5 97 305
Property 6,840 625 1,239 8,704 6,667 766 977 8,410
Property services and business services 1,052 40 578 1,670 951 82 712 1,745
Services 1,683 24 1,105 2,812 2,119 49 853 3,021
Trade 2,172 32 1,368 3,572 1,949 76 1,510 3,535
Transport and storage 1,129 129 919 2,177 1,176 73 871 2,120
Utilities 1,341 435 1,599 3,375 1,303 506 1,681 3,490
Retail lending 59,341 53 13,249 72,643 52,584 61 12,596 65,241
Other 192 45 179 416 190 14 182 386
Total New Zealand 89,247 22,204 25,819 137,270 82,350 18,826 25,020 126,196
Other overseas
Accommodation, cafes and restaurants 116 - 9 125 118 - 10 128
Agriculture, forestry and fishing 10 - 2 12 124 - 5 129
Construction 51 - 111 162 51 - 118 169
Finance and insurance 1,402 16,106 2,192 19,700 2,298 16,896 2,243 21,437
Government, administration and defence 1 3,316 - 3,317 20 4,767 18 4,805
Manufacturing 580 - 2,745 3,325 1,877 31 3,443 5,351
Mining 339 - 805 1,144 336 16 1,194 1,546
Property 363 - 29 392 416 - 27 443
Property services and business services 946 41 497 1,484 1,545 107 790 2,442
Services 40 1 756 797 218 - 698 916
Trade 1,130 1 1,911 3,042 1,553 2 1,931 3,486
Transport and storage 504 11 237 752 732 23 276 1,031
Utilities 413 - 74 487 950 2 615 1,567
Retail lending 407 2 29 438 457 2 32 491
Other 30 129 28 187 18 111 27 156
Total other overseas 6,332 19,607 9,425 35,364 10,713 21,957 11,427 44,097
Total gross credit risk 714,373 206,514 200,091 1,120,978 698,661 195,379 196,941 1,090,981
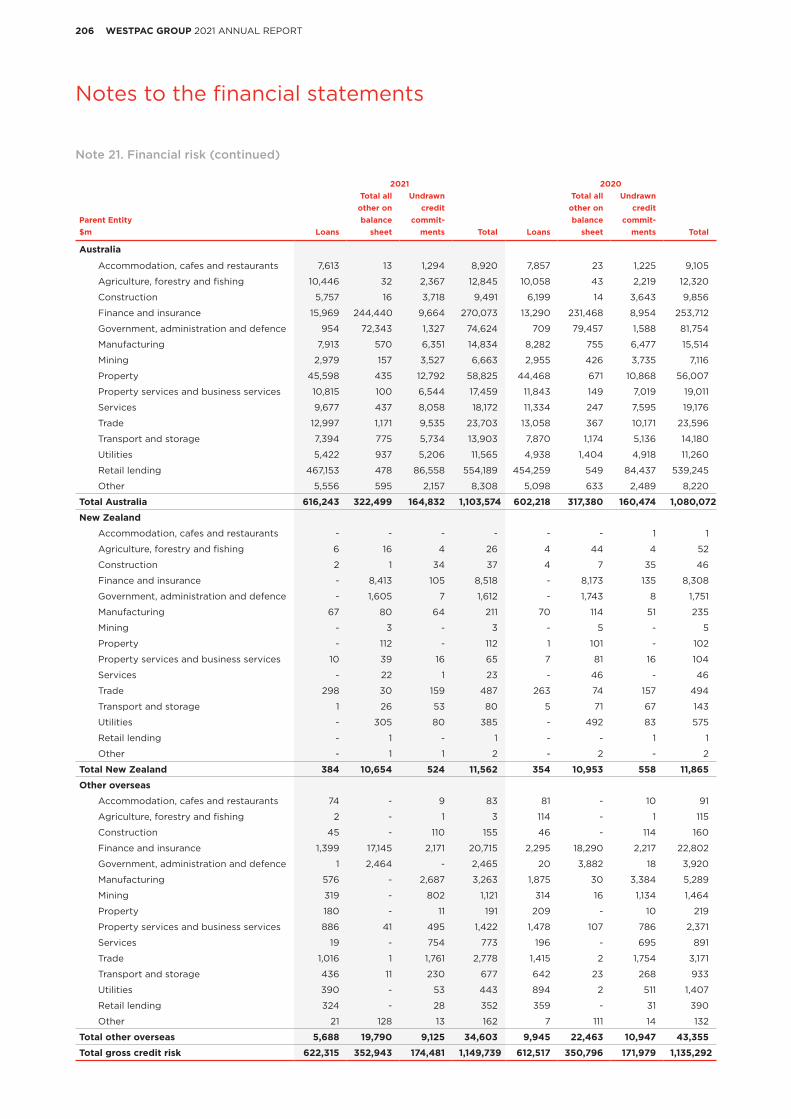
206 WESTPAC GROUP 2021 ANNUAL REPORT
Notes to the financial statements
Note 21. Financial risk (continued)
2021 2020Total all Undrawn Total all Undrawn
other on credit other on creditParent Entity balance commit- balance commit-$m Loans sheet ments Total Loans sheet ments Total
Australia
Accommodation, cafes and restaurants 7,613 13 1,294 8,920 7,857 23 1,225 9,105
Agriculture, forestry and fishing 10,446 32 2,367 12,845 10,058 43 2,219 12,320
Construction 5,757 16 3,718 9,491 6,199 14 3,643 9,856
Finance and insurance 15,969 244,440 9,664 270,073 13,290 231,468 8,954 253,712
Government, administration and defence 954 72,343 1,327 74,624 709 79,457 1,588 81,754
Manufacturing 7,913 570 6,351 14,834 8,282 755 6,477 15,514
Mining 2,979 157 3,527 6,663 2,955 426 3,735 7,116
Property 45,598 435 12,792 58,825 44,468 671 10,868 56,007
Property services and business services 10,815 100 6,544 17,459 11,843 149 7,019 19,011
Services 9,677 437 8,058 18,172 11,334 247 7,595 19,176
Trade 12,997 1,171 9,535 23,703 13,058 367 10,171 23,596
Transport and storage 7,394 775 5,734 13,903 7,870 1,174 5,136 14,180
Utilities 5,422 937 5,206 11,565 4,938 1,404 4,918 11,260
Retail lending 467,153 478 86,558 554,189 454,259 549 84,437 539,245
Other 5,556 595 2,157 8,308 5,098 633 2,489 8,220
Total Australia 616,243 322,499 164,832 1,103,574 602,218 317,380 160,474 1,080,072
New Zealand
Accommodation, cafes and restaurants - - - - - - 1 1
Agriculture, forestry and fishing 6 16 4 26 4 44 4 52
Construction 2 1 34 37 4 7 35 46
Finance and insurance - 8,413 105 8,518 - 8,173 135 8,308
Government, administration and defence - 1,605 7 1,612 - 1,743 8 1,751
Manufacturing 67 80 64 211 70 114 51 235
Mining - 3 - 3 - 5 - 5
Property - 112 - 112 1 101 - 102
Property services and business services 10 39 16 65 7 81 16 104
Services - 22 1 23 - 46 - 46
Trade 298 30 159 487 263 74 157 494
Transport and storage 1 26 53 80 5 71 67 143
Utilities - 305 80 385 - 492 83 575
Retail lending - 1 - 1 - - 1 1
Other - 1 1 2 - 2 - 2
Total New Zealand 384 10,654 524 11,562 354 10,953 558 11,865
Other overseas
Accommodation, cafes and restaurants 74 - 9 83 81 - 10 91
Agriculture, forestry and fishing 2 - 1 3 114 - 1 115
Construction 45 - 110 155 46 - 114 160
Finance and insurance 1,399 17,145 2,171 20,715 2,295 18,290 2,217 22,802
Government, administration and defence 1 2,464 - 2,465 20 3,882 18 3,920
Manufacturing 576 - 2,687 3,263 1,875 30 3,384 5,289
Mining 319 - 802 1,121 314 16 1,134 1,464
Property 180 - 11 191 209 - 10 219
Property services and business services 886 41 495 1,422 1,478 107 786 2,371
Services 19 - 754 773 196 - 695 891
Trade 1,016 1 1,761 2,778 1,415 2 1,754 3,171
Transport and storage 436 11 230 677 642 23 268 933
Utilities 390 - 53 443 894 2 511 1,407
Retail lending 324 - 28 352 359 - 31 390
Other 21 128 13 162 7 111 14 132
Total other overseas 5,688 19,790 9,125 34,603 9,945 22,463 10,947 43,355
Total gross credit risk 622,315 352,943 174,481 1,149,739 612,517 350,796 171,979 1,135,292

2073 FIN
AN
CIA
L STATE
ME
NTS
2 GR
OU
P P
ER
FOR
MA
NC
E1 STR
ATE
GIC
RE
PO
RT
4 SH
AR
EH
OLD
ER
INFO
RM
ATIO
NWESTPAC GROUP 2021 ANNUAL REPORT
Notes to the financial statements
21.2.4 Credit quality of financial assets
Credit quality disclosures1
The following tables show the credit quality of gross credit risk exposures measured at amortised cost or at FVOCI to which the impairment requirements apply. The credit quality is determined by reference to the credit risk ratings system (refer to Note 21.2.1) and expectations of future economic conditions under multiple scenarios. Consolidated 2021 2020
$m Stage 1 Stage 2 Stage 3 Total1 Stage 1 Stage 2 Stage 3 Total1
Loans - housing
Strong 398,043 21,165 - 419,208 382,892 6,629 - 389,521
Good/satisfactory 55,631 17,851 - 73,482 62,324 20,603 - 82,927
Weak 3,245 12,659 5,461 21,365 4,122 8,258 7,643 20,023
Total loans - housing 456,919 51,675 5,461 514,055 449,338 35,490 7,643 492,471
Loans - personal
Strong 4,608 69 - 4,677 4,768 146 - 4,914
Good/satisfactory 8,780 1,327 - 10,107 10,607 1,515 - 12,122
Weak 310 539 286 1,135 404 631 381 1,416
Total loans - personal 13,698 1,935 286 15,919 15,779 2,292 381 18,452
Loans - business
Strong 71,336 446 - 71,782 65,091 2,063 - 67,154
Good/satisfactory 93,457 10,674 - 104,131 94,046 16,091 - 110,137
Weak 175 4,562 3,749 8,486 180 7,200 3,067 10,447
Total loans - business 164,968 15,682 3,749 184,399 159,317 25,354 3,067 187,738
Debt securities
Strong 82,536 - - 82,536 90,461 365 - 90,826
Good/satisfactory - 48 - 48 - - - -
Weak - 559 - 559 - 587 - 587
Total debt securities2 82,536 607 - 83,143 90,461 952 - 91,413
Assets held for sale
Strong 206 - - 206 - - - -
Good/satisfactory 786 56 - 842 - - - -
Weak - - - - - - - -
Total assets held for sale 992 56 - 1,048 - - - -
All other financial assets
Strong 81,563 - - 81,563 39,871 - - 39,871
Good/satisfactory 386 - - 386 470 - - 470
Weak 30 - - 30 40 - - 40
Total all other financial assets 81,979 - - 81,979 40,381 - - 40,381
Undrawn credit commitments
Strong 153,712 1,546 - 155,258 149,778 2,384 - 152,162
Good/satisfactory 38,377 5,119 - 43,496 38,121 4,713 - 42,834
Weak 130 933 274 1,337 117 1,608 220 1,945
Total undrawn credit commitments3 192,219 7,598 274 200,091 188,016 8,705 220 196,941
Total strong 792,004 23,226 - 815,230 732,861 11,587 - 744,448
Total good/satisfactory 197,417 35,075 - 232,492 205,568 42,922 - 248,490
Total weak 3,890 19,252 9,770 32,912 4,863 18,284 11,311 34,458
Total on and off-balance sheet 993,311 77,553 9,770 1,080,634 943,292 72,793 11,311 1,027,396
1. This credit quality disclosure differs to that of credit risk concentration as it relates only to financial assets measured at amortised cost or at FVOCI and therefore excludes trading securities and financial assets measured at FVIS, and derivative financial instruments.
2. Debt securities included $938 million (2020: $1,011 million) at amortised cost. $331 million (2020: $424 million) of these are classified as strong, $48 million (2020: nil) were classified as good/satisfactory and $559 million (2020: $587 million) are classified as weak.
3. Includes credit commitments on held for sale assets of $828 million (2020: nil).
Note 21. Financial risk (continued)

208 WESTPAC GROUP 2021 ANNUAL REPORT
Notes to the financial statements
Details of collateral held in support of these balances are provided in Note 21.2.6.Parent Entity 2021 2020
$m Stage 1 Stage 2 Stage 3 Total1 Stage 1 Stage 2 Stage 3 Total1
Loans - housing
Strong 352,163 19,540 - 371,703 345,662 5,805 - 351,467
Good/satisfactory 47,301 16,725 - 64,026 54,065 19,001 - 73,066
Weak 2,925 12,186 5,064 20,175 3,066 6,467 7,195 16,728
Total loans - housing 402,389 48,451 5,064 455,904 402,793 31,273 7,195 441,261
Loans - personal
Strong 4,204 42 - 4,246 4,292 135 - 4,427
Good/satisfactory 8,386 1,178 - 9,564 10,071 1,376 - 11,447
Weak 231 400 258 889 294 449 329 1,072
Total loans - personal 12,821 1,620 258 14,699 14,657 1,960 329 16,946
Loans - business
Strong 59,224 393 - 59,617 53,321 1,761 - 55,082
Good/satisfactory 77,251 7,798 - 85,049 77,330 13,275 - 90,605
Weak 142 3,496 3,408 7,046 135 5,899 2,589 8,623
Total loans - business 136,617 11,687 3,408 151,712 130,786 20,935 2,589 154,310
Debt securities
Strong 77,741 - - 77,741 85,434 324 - 85,758
Good/satisfactory - 48 - 48 - - - -
Weak - - - - - - - -
Total debt securities2 77,741 48 - 77,789 85,434 324 - 85,758
Assets held for sale
Strong 180 - - 180 - - - -
Good/satisfactory 786 56 - 842 - - - -
Weak - - - - - - - -
Total assets held for sale 966 56 - 1,022 - - - -
All other financial assets
Strong 235,953 - - 235,953 204,239 - - 204,239
Good/satisfactory 273 - - 273 354 - - 354
Weak 26 - - 26 31 - - 31
Total all other financial assets 236,252 - - 236,252 204,624 - - 204,624
Undrawn credit commitments
Strong 133,404 1,327 - 134,731 130,494 2,111 - 132,605
Good/satisfactory 34,365 4,242 - 38,607 33,552 4,117 - 37,669
Weak 97 796 250 1,143 99 1,426 180 1,705
Total undrawn credit commitments3 167,866 6,365 250 174,481 164,145 7,654 180 171,979
Total strong 862,869 21,302 - 884,171 823,442 10,136 - 833,578
Total good/satisfactory 168,362 30,047 - 198,409 175,372 37,769 - 213,141
Total weak 3,421 16,878 8,980 29,279 3,625 14,241 10,293 28,159
Total on and off-balance sheet 1,034,652 68,227 8,980 1,111,859 1,002,439 62,146 10,293 1,074,878
Details of collateral held in support of these balances are provided in Note 21.2.6.
1. This credit quality disclosure differs to that of credit risk concentration as it relates only to financial assets measured at amortised cost or at FVOCI and therefore excludes trading securities and financial assets measured at FVIS, and derivative financial instruments.
2. Debt securities included $50 million (2020: $3 million) at amortised cost. $2 million (2020: $3 million) of these are classified as strong, $48 million (2020: nil) were classified as good/satisfactory.
3. Includes $0.8 billion (2020: nil) of undrawn credit commitments related to facilities classified as held for sale.
Note 21. Financial risk (continued)

2093 FIN
AN
CIA
L STATE
ME
NTS
2 GR
OU
P P
ER
FOR
MA
NC
E1 STR
ATE
GIC
RE
PO
RT
4 SH
AR
EH
OLD
ER
INFO
RM
ATIO
NWESTPAC GROUP 2021 ANNUAL REPORT
Notes to the financial statements
21.2.5 Non-performing loans and credit commitments
The loans and credit commitments balance in Stage 3 (non-performing) is represented by those loans and credit commitments which are in default. A default occurs when Westpac considered that the customer is unlikely to repay its credit obligations in full, irrespective of recourse by the Group to actions such as realising security, or the customer is more than 90 days past due on any material credit obligation. This definition of default is aligned to the APRA regulatory definition of default. These can be disaggregated into impaired loans and credit commitments (which is where the customer is unlikely to pay its credit obligations in full including restructured loans) and items 90 days past due, or otherwise in default but not impaired.
Impaired loans and credit commitments include:• housing and business loans with insufficient security to cover the principal and interest payments owing
(aligned to an impaired internal credit risk grade);• personal loans which are greater than 90 days past due; and• restructured loans (the original contractual terms have been modified to provide for concessions for a
customer facing financial difficulties).
Items 90 days past due, or otherwise in default but not impaired include:
• currently 90 days or more past due but well secured1;• assets that were, but are no longer 90 days past due but are yet to satisfactorily demonstrate sustained
improvement to allow reclassification; and• other assets in default and not impaired, including those where an order for bankruptcy or similar legal action
has been taken (e.g. appointment of an Administrator or Receiver).
The determination of the provisions for ECL is one of the Group’s critical accounting assumptions and estimates. Details of this and the Group’s accounting policy for the provision for ECL are discussed in Notes 6 and 13, along with the total provisions for ECL on loans and credit commitments and the total for those loans that are considered non-performing (i.e. Stage 3).
The gross amount of impaired exposures, along with the provisions for ECL is summarised in the following table:
Consolidated$m 2021 2020
Total impaired exposures
Gross exposures:
Australia 1,868 2,231
New Zealand 148 193
Other overseas 126 355
Total gross exposures 2,142 2,779 Provision:
Australia (1,009) (900)
New Zealand (85) (96)
Other overseas (72) (156)
Total provision (1,166) (1,152)
Total net impaired exposures2,3 976 1,627
21.2.6 Collateral held
Loans
The Group analyses the coverage of the loan portfolio which is secured by the collateral that it holds. Coverage is measured as follows:
Coverage Secured loan to collateral value ratio
Fully secured Less than or equal to 100%
Partially secured Greater than 100% but not more than 150%
Unsecured Greater than 150%, or no security held (e.g. can include credit cards, personal loans, and exposure to highly rated corporate entities)
1. The estimated net realisable value of security to which the Group has recourse is sufficient to cover all principal and interest.2. Included restructured loans and credit commitments amounting to $18 million (2020: $16 million), with a related provision of $1 million
(2020: $4 million).3. Gross amount included $nil million of loans in assets held for sale (2020: nil), with undrawn credit commitments of $nil million
(2020: nil). Provision includes $nil million in assets held for sale (2020: nil) and nil in liabilities held for sale (2020: nil).
Note 21. Financial risk (continued)

210 WESTPAC GROUP 2021 ANNUAL REPORT
Notes to the financial statements
The Group and the Parent Entity’s loan portfolio have the following coverage from collateral held:
2021 2020Housing Personal Business Assets held Housing Personal Business
% loans1 loans loans for sale Total loans1 loans loans Total
Performing loans
Consolidated
Fully secured 100.0 9.9 66.2 5.9 89.2 100.0 8.0 62.8 87.6
Partially secured - 31.2 15.6 92.5 4.8 - 32.5 18.9 5.9
Unsecured - 58.9 18.2 1.6 6.0 - 59.5 18.3 6.5
Total 100.0 100.0 100.0 100.0 100.0 100.0 100.0 100.0 100.0
Parent Entity
Fully secured 100.0 10.6 66.6 5.9 89.7 100.0 8.7 63.7 88.3
Partially secured - 33.5 14.8 92.5 4.5 - 34.6 17.7 5.4
Unsecured - 55.9 18.6 1.6 5.8 - 56.7 18.6 6.3
Total 100.0 100.0 100.0 100.0 100.0 100.0 100.0 100.0 100.0
Non-performing
loans
Consolidated
Fully secured 94.6 - 44.9 - 72.2 95.2 - 39.2 76.4
Partially secured 5.4 45.7 21.9 - 13.1 4.8 49.4 30.7 13.5
Unsecured - 54.3 33.2 - 14.7 - 50.6 30.1 10.1
Total 100.0 100.0 100.0 - 100.0 100.0 100.0 100.0 100.0
Parent Entity
Fully secured 94.7 - 47.1 - 73.3 95.2 - 44.1 79.0
Partially secured 5.3 47.8 21.2 - 12.8 4.8 50.7 26.4 11.8
Unsecured - 52.2 31.7 - 13.9 - 49.3 29.5 9.2
Total 100.0 100.0 100.0 - 100.0 100.0 100.0 100.0 100.0
Details of the carrying value and associated provision for ECL are disclosed in Notes 12 and 13 respectively. The credit quality of loans is disclosed in Note 21.2.4.
Collateral held against financial assets other than loans
Consolidated Parent Entity$m 2021 2020 2021 2020
Cash, primarily for derivatives 2,370 2,252 2,191 1,864
Securities under reverse repurchase agreements2 2,916 20,501 2,744 20,501
Securities under derivatives and stock borrowing2 9 32 9 32
Total other collateral held 5,295 22,785 4,944 22,397
21.3 Funding and liquidity risk
21.3.1 Liquidity modelling
In managing liquidity for Westpac, Treasury utilises balance sheet forecasts and the maturity profile of Westpac’s wholesale funding portfolio to project liquidity outcomes. Local liquidity limits are also used by Westpac in applicable jurisdictions to ensure liquidity is managed efficiently and prudently.
In addition, Westpac conducts regular stress testing to assess its ability to meet cash flow obligations under a range of market conditions and scenarios. These scenarios inform liquidity limits and strategic planning.
1. For the purpose of collateral classification, housing loans are classified as fully secured, unless they are non-performing in which case they may be classified as partially secured.
2. Securities received as collateral are not recognised in the Group and Parent Entity’s balance sheet.
Note 21. Financial risk (continued)

2113 FIN
AN
CIA
L STATE
ME
NTS
2 GR
OU
P P
ER
FOR
MA
NC
E1 STR
ATE
GIC
RE
PO
RT
4 SH
AR
EH
OLD
ER
INFO
RM
ATIO
NWESTPAC GROUP 2021 ANNUAL REPORT
Notes to the financial statements
1. Loans are self-originated AAA rated mortgage backed securities which are eligible for repurchase with the RBA and Reserve Bank of New Zealand.
21.3.2 Sources of funding
Sources of funding are regularly reviewed to maintain a wide diversification by currency, geography, product and term. Sources include, but are not limited to:
• deposits;
• debt issues;
• proceeds from sale of marketable securities;
• repurchase agreements with central banks;
• principal repayments on loans; • interest income; and• fee income.
Liquid assets
Treasury holds a portfolio of high-quality liquid assets as a buffer against unforeseen funding requirements. These assets are held in cash, or are otherwise eligible for repurchase agreements with the Reserve Bank of Australia or another central bank and include Government, State Government and highly rated investment grade securities. The level of liquid asset holdings is reviewed frequently and is consistent with both the requirements of the balance sheet and market conditions.
A summary of the Group’s liquid asset holdings is as follows:
Consolidated2021 2020
$m Actual Average Actual Average
Cash 70,381 42,862 29,099 28,157 Trading securities and financial assets measured at FVIS 6,940 10,436 29,364 14,789 Investment securities 83,032 90,248 91,097 82,678
Loans1 66,610 65,558 71,616 66,512 Other financial assets 590 282 - 468 Total liquid assets 227,553 209,386 221,176 192,604
Group’s funding composition
The Group monitors the composition and stability of its funding so that it remains within the Group’s funding risk appetite. This includes compliance with both the LCR and NSFR.
% 2021 2020
Customer deposits 65.0 65.0
Wholesale term funding with residual maturity greater than 12 months 15.6 15.7
Wholesale funding with a residual maturity less than 12 months 10.8 10.4
Securitisation 0.6 0.9
Equity 8.0 8.0
Group’s total funding 100.0 100.0
Movements in the Group’s funding composition in 2021 included:
• Customer deposits accounted for 65.0% of the Group’s total funding (including equity) at 30 September 2021. Over the year, customer deposits increased by $25 billion and fully funded the bank’s new lending growth. This saw an increase in the Group’s customer deposit to loan ratio to 82% from 80% at 30 September 2020;
• Long-term funding with a residual maturity greater than 12 months accounted for 15.6% of the Group’s total funding at 30 September 2021. The Group raised $34.6 billion of long term wholesale funding over the year, including $12 billion drawn down from the TFF prior to the end of the facility on 30 June 2021. In line with the closure of the TFF, the Group also began returning to its more usual funding activities, accessing senior unsecured and covered bond markets in the second half of the year. New long term funding during the year also included $3.5 billion in Additional Tier 1 and $6.2 billion in Tier 2 capital securities, the latter contributing to the Group’s Total Loss Absorbing Capital (TLAC) requirements that become effective on 1 January 2024;
• As 30 September 2021, funding from securitisation accounted for 0.6% of total funding;
• Wholesale funding with a residual maturity less than 12 months accounted for 10.8% of the Group’s total funding at 30 September 2021. This portfolio, including long term to short term scroll, had a weighted average maturity of 138 days.
• Funding from equity increased by $3.4 billion and accounted for 8.0% of total funding.
Note 21. Financial risk (continued)
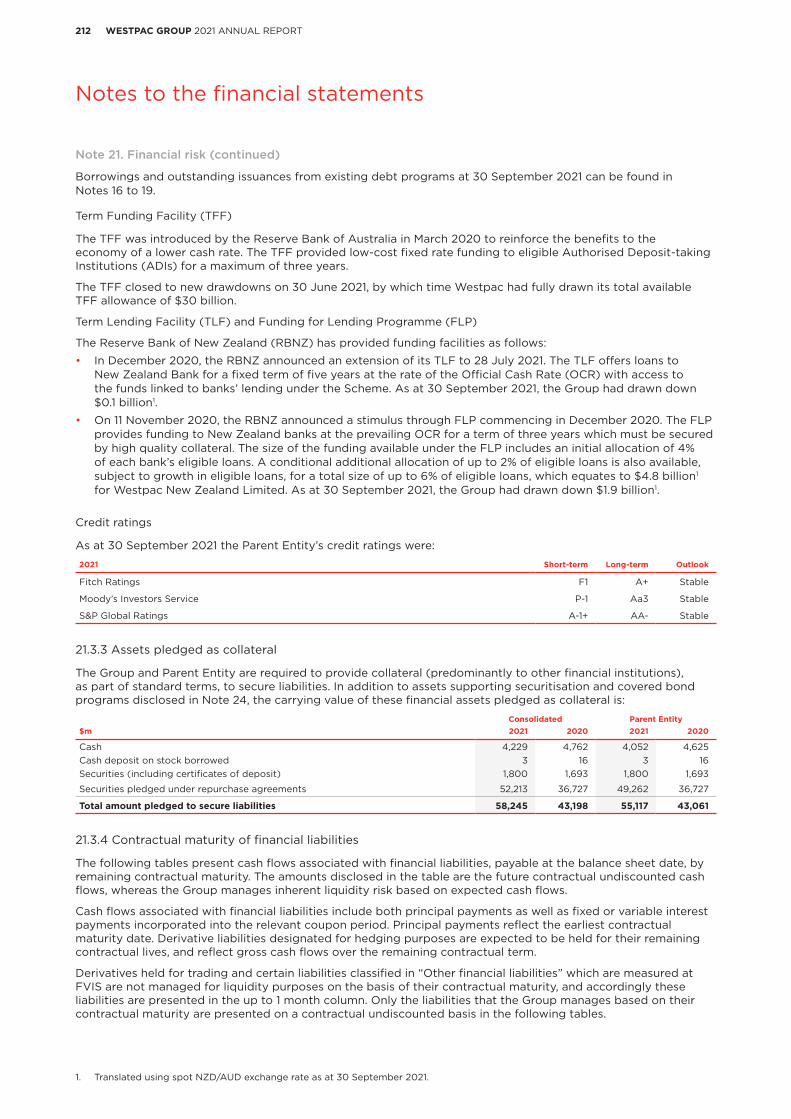
212 WESTPAC GROUP 2021 ANNUAL REPORT
Notes to the financial statements
Borrowings and outstanding issuances from existing debt programs at 30 September 2021 can be found in Notes 16 to 19.
Term Funding Facility (TFF)
The TFF was introduced by the Reserve Bank of Australia in March 2020 to reinforce the benefits to the economy of a lower cash rate. The TFF provided low-cost fixed rate funding to eligible Authorised Deposit-taking Institutions (ADIs) for a maximum of three years.
The TFF closed to new drawdowns on 30 June 2021, by which time Westpac had fully drawn its total available TFF allowance of $30 billion.
Term Lending Facility (TLF) and Funding for Lending Programme (FLP)
The Reserve Bank of New Zealand (RBNZ) has provided funding facilities as follows:
• In December 2020, the RBNZ announced an extension of its TLF to 28 July 2021. The TLF offers loans to New Zealand Bank for a fixed term of five years at the rate of the Official Cash Rate (OCR) with access to the funds linked to banks’ lending under the Scheme. As at 30 September 2021, the Group had drawn down $0.1 billion1.
• On 11 November 2020, the RBNZ announced a stimulus through FLP commencing in December 2020. The FLP provides funding to New Zealand banks at the prevailing OCR for a term of three years which must be secured by high quality collateral. The size of the funding available under the FLP includes an initial allocation of 4% of each bank’s eligible loans. A conditional additional allocation of up to 2% of eligible loans is also available, subject to growth in eligible loans, for a total size of up to 6% of eligible loans, which equates to $4.8 billion1 for Westpac New Zealand Limited. As at 30 September 2021, the Group had drawn down $1.9 billion1.
Credit ratings
As at 30 September 2021 the Parent Entity’s credit ratings were:
2021 Short-term Long-term Outlook
Fitch Ratings F1 A+ Stable
Moody’s Investors Service P-1 Aa3 Stable
S&P Global Ratings A-1+ AA- Stable
21.3.3 Assets pledged as collateral
The Group and Parent Entity are required to provide collateral (predominantly to other financial institutions), as part of standard terms, to secure liabilities. In addition to assets supporting securitisation and covered bond programs disclosed in Note 24, the carrying value of these financial assets pledged as collateral is:
Consolidated Parent Entity$m 2021 2020 2021 2020
Cash 4,229 4,762 4,052 4,625 Cash deposit on stock borrowed 3 16 3 16 Securities (including certificates of deposit) 1,800 1,693 1,800 1,693
Securities pledged under repurchase agreements 52,213 36,727 49,262 36,727
Total amount pledged to secure liabilities 58,245 43,198 55,117 43,061
21.3.4 Contractual maturity of financial liabilities
The following tables present cash flows associated with financial liabilities, payable at the balance sheet date, by remaining contractual maturity. The amounts disclosed in the table are the future contractual undiscounted cash flows, whereas the Group manages inherent liquidity risk based on expected cash flows.
Cash flows associated with financial liabilities include both principal payments as well as fixed or variable interest payments incorporated into the relevant coupon period. Principal payments reflect the earliest contractual maturity date. Derivative liabilities designated for hedging purposes are expected to be held for their remaining contractual lives, and reflect gross cash flows over the remaining contractual term.
Derivatives held for trading and certain liabilities classified in “Other financial liabilities” which are measured at FVIS are not managed for liquidity purposes on the basis of their contractual maturity, and accordingly these liabilities are presented in the up to 1 month column. Only the liabilities that the Group manages based on their contractual maturity are presented on a contractual undiscounted basis in the following tables.
Note 21. Financial risk (continued)
1. Translated using spot NZD/AUD exchange rate as at 30 September 2021.

2133 FIN
AN
CIA
L STATE
ME
NTS
2 GR
OU
P P
ER
FOR
MA
NC
E1 STR
ATE
GIC
RE
PO
RT
4 SH
AR
EH
OLD
ER
INFO
RM
ATIO
NWESTPAC GROUP 2021 ANNUAL REPORT
Notes to the financial statements
Consolidated Up to Over 1 monthOver 3
months Over 1 year to Over$m 1 month to 3 months to 1 year 5 years 5 years Total
2021
Financial liabilities
Collateral received 2,368 - - - - 2,368
Deposits and other borrowings 482,084 58,731 80,350 6,369 67 627,601
Other financial liabilities 14,621 1,243 1,803 31,870 - 49,537
Derivative financial instruments:
Held for trading 17,526 - - - - 17,526
Held for hedging purposes (net settled) 24 23 119 128 14 308
Held for hedging purposes (gross settled):
Cash outflow 2,933 88 1,361 2,572 2,669 9,623
Cash inflow (2,874) (76) (1,201) (2,148) (2,577) (8,876)
Debt issues 2,370 3,661 38,821 65,465 25,828 136,145
Liabilities held for sale 28 - - - - 28
Total financial liabilities excluding loan capital 519,080 63,670 121,253 104,256 26,001 834,260
Loan capital 6 105 1,034 6,517 30,623 38,285
Total undiscounted financial liabilities 519,086 63,775 122,287 110,773 56,624 872,545
Total contingent liabilities and commitments
Letters of credit and guarantees 11,323 - - - - 11,323
Commitments to extend credit 188,768 - - - - 188,768
Total undiscounted contingent liabilities and commitments 200,091 - - - - 200,091
2020
Financial liabilities
Collateral received 2,251 - - - - 2,251
Deposits and other borrowings 432,005 67,944 86,421 10,408 63 596,841
Other financial liabilities 20,275 1,129 94 18,065 - 39,563
Derivative financial instruments:
Held for trading 22,216 - - - - 22,216
Held for hedging purposes (net settled) 29 43 179 379 22 652
Held for hedging purposes (gross settled):
Cash outflow 204 5,645 1,785 1,704 - 9,338
Cash inflow (200) (5,595) (1,709) (1,651) - (9,155)
Debt issues 6,920 11,264 32,715 79,797 25,623 156,319
Total financial liabilities excluding loan capital 483,700 80,430 119,485 108,702 25,708 818,025
Loan capital 1 68 387 6,665 21,410 28,531
Total undiscounted financial liabilities 483,701 80,498 119,872 115,367 47,118 846,556
Total contingent liabilities and commitments
Letters of credit and guarantees 12,610 - - - - 12,610
Commitments to extend credit 184,064 - - - - 184,064
Other commitments 267 - - - - 267
Total undiscounted contingent liabilities and commitments 196,941 - - - - 196,941
Note 21. Financial risk (continued)

214 WESTPAC GROUP 2021 ANNUAL REPORT
Notes to the financial statements
Parent Entity Up to Over 1 monthOver 3
months Over 1 year to Over$m 1 month to 3 months to 1 year 5 years 5 years Total
2021
Financial liabilities
Collateral received 2,189 - - - - 2,189
Deposits and other borrowings 430,949 48,187 66,438 4,966 67 550,607
Other financial liabilities 13,689 1,243 1,712 29,961 - 46,605
Derivative financial instruments:
Held for trading 17,597 - - - - 17,597
Held for hedging purposes (net settled) 17 17 106 104 14 258
Held for hedging purposes (gross settled):
Cash outflow 105 67 11 577 - 760
Cash inflow (103) (65) (3) (520) - (691)
Debt issues 1,543 2,593 32,270 55,824 22,900 115,130
Due to subsidiaries 23,412 964 3,702 15,347 157,506 200,931
Liabilities held for sale 3 - - - - 3
Total financial liabilities excluding loan capital 489,401 53,006 104,236 106,259 180,487 933,389
Loan capital 6 105 1,034 6,517 30,623 38,285
Total undiscounted financial liabilities 489,407 53,111 105,270 112,776 211,110 971,674
Total contingent liabilities and commitments
Letters of credit and guarantees 10,796 - - - - 10,796
Commitments to extend credit 163,685 - - - - 163,685
Total undiscounted contingent liabilities and commitments 174,481 - - - - 174,481
2020
Financial liabilities
Collateral received 1,863 - - - - 1,863
Deposits and other borrowings 389,498 57,543 71,368 8,466 63 526,938
Other financial liabilities 19,704 1,129 94 18,065 - 38,992
Derivative financial instruments:
Held for trading 22,268 - - - - 22,268
Held for hedging purposes (net settled) 21 28 137 277 22 485
Held for hedging purposes (gross settled):
Cash outflow 7 2,110 9 455 - 2,581
Cash inflow (7) (2,088) (21) (437) - (2,553)
Debt issues 6,596 10,915 24,980 66,305 24,370 133,166
Due to subsidiaries 18,610 934 4,390 18,529 171,240 213,703
Total financial liabilities excluding loan capital 458,560 70,571 100,957 111,660 195,695 937,443
Loan capital 1 68 387 6,665 21,410 28,531
Total undiscounted financial liabilities 458,561 70,639 101,344 118,325 217,105 965,974
Total contingent liabilities and commitments
Letters of credit and guarantees 12,069 - - - - 12,069
Commitments to extend credit 159,644 - - - - 159,644
Other commitments 266 - - - - 266
Total undiscounted contingent liabilities and commitments 171,979 - - - - 171,979
Note 21. Financial risk (continued)

2153 FIN
AN
CIA
L STATE
ME
NTS
2 GR
OU
P P
ER
FOR
MA
NC
E1 STR
ATE
GIC
RE
PO
RT
4 SH
AR
EH
OLD
ER
INFO
RM
ATIO
NWESTPAC GROUP 2021 ANNUAL REPORT
Notes to the financial statements
21.3.5 Expected maturity
The following tables present the balance sheet based on expected maturity dates. The liability balances in the following tables will not agree to the contractual maturity tables (Note 21.3.4) due to the analysis below being based on expected rather than contractual maturities, the impact of discounting and the exclusion of interest accruals beyond the reporting period. Included in the following tables are equity securities classified as trading securities, investment securities and life insurance assets that have no specific maturity. These assets have been classified based on the expected period of disposal. Deposits are presented in the following table on a contractual basis, however as part of our normal banking operations, the Group would expect a large proportion of these balances to be retained.
2021 2020Consolidated Due within Greater than Due within Greater than$m 12 months 12 months Total 12 months 12 months Total
Assets
Cash and balances with central banks 71,353 - 71,353 30,129 - 30,129
Collateral paid 4,232 - 4,232 4,778 - 4,778
Trading securities and financial assets measured at FVIS 14,010 7,091 21,101 32,591 8,076 40,667
Derivative financial instruments 9,955 9,398 19,353 13,583 9,784 23,367
Investment securities 8,064 75,353 83,417 6,824 84,715 91,539
Loans (net of provisions) 84,187 625,597 709,784 90,856 602,203 693,059
Other financial assets 6,394 - 6,394 5,474 - 5,474
Life insurance assets - - - 3,450 143 3,593
Investment in associates - 58 58 - 61 61
Assets held for sale 4,188 - 4,188 - - -
All other assets 1,367 14,630 15,997 1,400 17,879 19,279
Total assets 203,750 732,127 935,877 189,085 722,861 911,946
Liabilities
Collateral received 2,368 - 2,368 2,250 - 2,250
Deposits and other borrowings 622,505 4,450 626,955 584,037 7,094 591,131
Other financial liabilities 18,610 31,699 50,309 22,861 18,064 40,925
Derivative financial instruments 9,990 8,069 18,059 13,157 9,897 23,054
Debt issues 43,356 85,423 128,779 49,070 101,255 150,325
Life insurance liabilities - - - 1,809 (413) 1,396
Liabilities held for sale 837 - 837 - - -
All other liabilities 3,502 3,909 7,411 5,395 5,447 10,842
Total liabilities excluding loan capital 701,168 133,550 834,718 678,579 141,344 819,923
Loan capital 3,070 25,997 29,067 1,323 22,626 23,949
Total liabilities 704,238 159,547 863,785 679,902 163,970 843,872
Net assets/(liabilities) (500,488) 572,580 72,092 (490,817) 558,891 68,074
Note 21. Financial risk (continued)

216 WESTPAC GROUP 2021 ANNUAL REPORT
Notes to the financial statements
2021 2020Parent Entity Due within Greater than Due within Greater than$m 12 months 12 months Total 12 months 12 months Total
Assets
Cash and balances with central banks 62,754 - 62,754 25,436 - 25,436
Collateral paid 4,055 - 4,055 4,641 - 4,641
Trading securities and financial assets measured at FVIS 11,853 6,926 18,779 30,550 7,480 38,030
Derivative financial instruments 9,545 9,582 19,127 13,349 9,445 22,794
Investment securities 6,677 71,186 77,863 5,120 80,706 85,826
Loans (net of provisions) 63,725 554,688 618,413 70,453 537,371 607,824
Other financial assets 5,486 - 5,486 4,745 - 4,745
Due from subsidiaries 10,628 164,718 175,346 10,420 170,559 180,979
Investment in subsidiaries - 6,287 6,287 - 6,475 6,475
Investment in associates - 34 34 - 57 57
Assets held for sale 1,015 - 1,015 - - -
All other assets 596 12,934 13,530 796 15,199 15,995
Total assets 176,334 826,355 1,002,689 165,510 827,292 992,802
Liabilities
Collateral received 2,189 - 2,189 1,862 - 1,862
Deposits and other borrowings 547,101 3,086 550,187 516,391 5,222 521,613
Other financial liabilities 17,473 29,790 47,263 22,092 18,064 40,156
Derivative financial instruments 9,804 8,085 17,889 12,805 9,974 22,779
Debt issues 35,084 73,126 108,210 40,886 86,780 127,666
Due to subsidiaries 25,053 153,763 178,816 20,551 165,712 186,263
Liabilities held for sale 10 - 10 - - -
All other liabilities 2,897 3,362 6,259 3,770 4,996 8,766
Total liabilities excluding loan capital 639,611 271,212 910,823 618,357 290,748 909,105
Loan capital 3,070 25,997 29,067 1,323 22,626 23,949
Total liabilities 642,681 297,209 939,890 619,680 313,374 933,054
Net assets/(liabilities) (466,347) 529,146 62,799 (454,170) 513,918 59,748
21.4 Market risk
21.4.1 Value-at-Risk
The Group uses VaR as one of the mechanisms for controlling both traded and non-traded market risk.
VaR is a statistical estimate of the potential loss in earnings over a specified period of time and to a given level of confidence based on historical market movements. The confidence level indicates the probability that the loss will not exceed the VaR estimate on any given day.
VaR seeks to take account of all material market variables that may cause a change in the value of the portfolio, including interest rates, FX rates, price changes, volatility and the correlations between these variables. Daily monitoring of current exposure and limit utilisation is conducted independently by the Market Risk and Treasury Risk units which monitor market risk exposures against VaR and structural concentration limits. These are supplemented by escalation triggers for material profits or losses and stress testing of risks beyond the 99% confidence interval.
The key parameters of VaR are:
Holding period 1 day
Confidence level 99%
Period of historical data used 1 year
Note 21. Financial risk (continued)

2173 FIN
AN
CIA
L STATE
ME
NTS
2 GR
OU
P P
ER
FOR
MA
NC
E1 STR
ATE
GIC
RE
PO
RT
4 SH
AR
EH
OLD
ER
INFO
RM
ATIO
NWESTPAC GROUP 2021 ANNUAL REPORT
Notes to the financial statements
21.4.2 Traded market risk
The following table depicts the aggregate VaR, by risk type:
Consolidated and Parent Entity 2021 2020 2019$m High Low Average High Low Average High Low Average
Interest rate risk 28.7 5.1 12.9 25.5 7.0 14.6 14.9 6.6 10.9 FX risk 8.7 0.6 2.0 11.7 0.5 4.0 8.6 0.8 4.1 Equity risk 3.2 0.0 0.2 0.7 0.0 0.2 0.2 0.0 0.0
Commodity risk1 7.9 0.4 1.2 3.4 0.6 1.9 42.0 1.7 8.2
Other market risks2 23.8 1.6 10.3 32.9 2.4 14.6 5.5 2.0 3.5 Diversification effect n/a n/a (8.7) n/a n/a (14.9) n/a n/a (12.3)Net market risk 41.5 5.9 17.9 42.0 7.1 20.4 45.3 7.9 14.4
21.4.3 Non-traded market risk
Non-traded market risk includes Interest Rate Risk in the Banking Book (IRRBB) – the risk to net interest income or the economic value on banking book items as interest rates change.
Net interest income (NII) sensitivity is managed in terms of the NaR. A simulation model is used to calculate Westpac’s potential NaR. This combines the underlying balance sheet data with assumptions about run-off and new business, expected repricing behaviour and changes in wholesale market interest rates. To provide a series of potential future NII outcomes, simulations use a range of interest rate scenarios over one to three year time horizons. This includes 100 and 200 basis point shifts up and down from the current market yield curves in Australia and New Zealand. Additional stressed interest rate scenarios are also considered and modelled.
A comparison between the NII outcomes from these modelled scenarios indicates the sensitivity to interest rate changes.
Net interest income-at-Risk (NaR)
The following table depicts potential NII outcomes assuming a worst case 100 basis point rate shock (up and down) with a 12 month time horizon (expressed as a percentage of reported NII):
2021 2020Maximum Minimum Average Maximum Minimum Average
% (increase)/decrease in NII As at exposure exposure exposure As at exposure exposure exposure
Consolidated 3.35 3.35 (0.12) 1.04 (0.27) 3.09 (1.22) (0.25)Parent Entity 2.86 2.86 (0.30) 0.51 (0.38) 2.35 (0.89) (0.10)
Value at Risk - IRRBB
The table below depicts VaR for IRRBB:
2021 2020$m As at High Low Average As at High Low Average
Consolidated 63.7 224.3 59.7 127.8 202.4 219.7 31.0 126.7
As at 30 September 2021 the Value at Risk – IRRBB for the Parent Entity was $60 million (2020: $208 million).
Risk mitigation
IRRBB stems from the ordinary course of banking activities, including structural interest rate risk (the mismatch between the duration of assets and liabilities) and capital management.
The Group hedges its exposure to such interest rate risk using derivatives. Further details on the Group’s hedge accounting are discussed in Note 20.
The same controls used to monitor traded market risk allow management to continuously monitor and manage IRRBB.
Structural FX risk
Structural FX risk results from the generation of foreign currency denominated earnings and from Westpac’s capital deployed in offshore branches and subsidiaries, where it is denominated in currencies other than Australian dollars. As exchange rates move, the Australian dollar equivalent of offshore earnings and capital is subject to change that could introduce significant variability to the Bank’s reported financial results and capital ratios. Note 20 includes details of the Group’s ALM activities including details of the hedge accounting and economic hedges used to manage this risk.
1. Includes electricity risk. Closure of the electricity business was completed in FY20.2. Includes prepayment risk and credit spread risk (exposure to movements in generic credit rating bands).
Note 21. Financial risk (continued)

218 WESTPAC GROUP 2021 ANNUAL REPORT
Notes to the financial statements
21.5 Interest rate benchmark reform
Overview
Interbank Offered Rates (IBORs) are interest rate benchmarks which are referenced in many financial instruments across various currencies and tenors. In recent years, financial regulators have reviewed the use of IBORs and recommended either a reform of the benchmark rate to reference market observable transactions (e.g. EURIBOR) or a transition of certain IBORs to more observable, risk-free alternative reference rates (ARR).
On 5 March 2021, the UK regulator, the Financial Conduct Authority (FCA), confirmed the transition dates for LIBORs to ARR. The transition dates can be summarised as follows:
• a cessation date of 31 December 2021 for most LIBORs;
• a cessation date of 30 June 2023 for certain settings of USD LIBOR (i.e. overnight and 12-months) and for synthetic benchmarks which use USD LIBOR in their calculation process including SGD SOR;
• a non-representative date of 31 December 2021 for both GBP LIBOR and JPY LIBOR for the 1-month, 3-month and 6-month settings; and
• a non-representative date of 30 June 2023 for USD LIBOR 1-month, 3-month and 6-month settings.
Risks
These IBOR reforms result in various risks to the Group including:
• Operational risk: relating to any adverse impacts from the implementation of the IBOR reform on the business, compliance, customers or and technology;
• Market risk: including adverse impacts to the Group and its customers if the markets are disrupted by the IBOR reform; and
• Accounting risk: A key assumption made when performing hedge accounting at the reporting date is that both the hedged item and instrument will be amended from existing LIBOR linked floating rates to new ARRs on the same date. Where actual differences between those dates arise, hedge ineffectiveness will be recorded in the income statement. Also, as current IBOR becomes less observable due to transition to ARR consideration will need to be given to the appropriate fair valuation hierarchy level used to classify impacted financial instruments.
The Group does not expect material changes to its business-as-usual risk management frameworks and controls due to IBOR. The Group has a working group in place to manage any transition related risks resulting from IBOR to ARR which is discussed further below.
Governance
The Group established an enterprise-wide IBORs Transition Program to manage the impacts of IBOR reform. The scope of the program is to address the impact of transition from IBORs to ARRs including business, compliance, customer and technology impacts. The Governance structure of the program is well established to include a Steering Committee that includes senior executives from Finance, Legal, Technology, Compliance, Risk and all impacted business units.
Significant activities underway include development of ARR product variations, changes required for implementing the International Swaps and Derivatives Association (ISDA) Protocol, Customer Outreach including management of conduct risk in customer transition and technology changes required to ensure the Group’s systems can transact, value and perform the necessary accounting (including hedging) requirements once contracts transition from LIBOR to ARR. These activities focus on two broad areas including:
• developing new alternative risk-free rate products; and
• amending existing LIBOR products to reference alternative risk-free rates.
The Group is actively engaging with customers and counterparties to transition or include appropriate fallback provisions. Fallback provisions refer to contractual provisions that lay out the process through which a replacement rate can be identified if a benchmark rate is not available.
Note 21. Financial risk (continued)

2193 FIN
AN
CIA
L STATE
ME
NTS
2 GR
OU
P P
ER
FOR
MA
NC
E1 STR
ATE
GIC
RE
PO
RT
4 SH
AR
EH
OLD
ER
INFO
RM
ATIO
NWESTPAC GROUP 2021 ANNUAL REPORT
Notes to the financial statements
1. The Group’s primary exposure to USD LIBOR is to settings with a transition date of 30 June 2023. The Group has no material exposures to USD LIBOR that have a 31 December 2021 transition date (i.e. 1-week and 2-month settings).
2. Included in the table above are cross currency swaps with a total carrying amount of $321 million derivative assets and $325 million derivative liabilities for Consolidated and Parent Entity that have exposure to IBOR reform on both the currencies referenced in the swap arrangement. The carrying amount has been included in the table based on the currency of the receive leg of the swap and is primarily comprised of USD/GBP LIBOR swaps with a carrying amount of $240 million derivative assets and $282 million derivative liabilities for Consolidated and Parent Entity. Other currency pairs have a carrying value of $81 million derivative assets and $43 million derivative liabilities for Consolidated and Parent Entity.
3. The notional balances for 30 September 2020 have been restated to reflect the change in cessation date of certain USD LIBOR settings from 31 December 2021 to 30 June 2023.
4. Where a multi-currency facility has been partially drawn down and references a benchmark rate impacted by the IBOR reform, the undrawn balance has been included in the table above for undrawn credit commitments impacted by IBOR reform based on the currency of the drawn portion. These balances do not include balances for multi-currency facilities which are yet to be drawn down and where it is not known whether a customer will choose to drawn down funds linked to an IBOR benchmark.
Financial instruments impacted by IBOR reform post transition date
Derivatives
The following table summarises the Group’s derivative financial instrument exposures currently maturing after the relevant IBOR transition dates noted above that are yet to transition to ARR. While these exposures reference benchmark rates impacted by the IBOR reform as at 30 September 2021, almost all have bilateral adherence from our counterparties to the fallback clauses issued by the International Swaps and Derivatives Association (ISDA) in the ISDA 2020 IBOR Fallbacks Protocol which provides a standardised process to identify the appropriate ARR at the relevant benchmark transition date.
2021 20203
Trading Hedging Hedging
Benchmark Asset Liability Asset Liability(Carrying (Carrying (Carrying (Carrying Notional Notional
$m amount) amount) amount) amount) amount amount
Consolidated and Parent Entity
USD LIBOR1 6,696 4,907 1,219 221 36,004 31,507
GBP LIBOR 315 527 37 - 2,099 2,031
Other 212 111 37 - 2,823 2,962
Total impacted by IBOR reform post transition date2 7,223 5,545 1,293 221 40,926 36,500
For hedging derivatives, the extent of the risk exposure also reflects the notional amounts of related hedging instruments.
Non-derivatives
The following tables summarise the Group’s non-derivative financial instrument exposures currently maturing after the relevant IBOR transition dates noted above that are yet to transition to ARR. The Group is engaging with its customers and counterparties to transition or include appropriate fallback provisions. Due to the nature of these contracts, these fallback provisions will be determined bilaterally with the customer or counterparty rather than the standardised basis provided by the ISDA protocols applicable to our derivative contracts.
2021 Non-derivative exposures
Benchmark Financial assets Financial liabilities Undrawn credit commitments4
$m (Carrying amount) (Carrying amount) (Notional contractual amount)
Consolidated
USD LIBOR1 3,083 1,399 366
GBP LIBOR 267 - 182
Other 33 - 5
Total impacted by IBOR reform post transition date 3,383 1,399 553 Parent Entity
USD LIBOR1 2,846 1,344 364
GBP LIBOR 254 - 181
Other 15 - 4
Total impacted by IBOR reform post transition date 3,115 1,344 549
Note 21. Financial risk (continued)

220 WESTPAC GROUP 2021 ANNUAL REPORT
Notes to the financial statements
Note 22. Fair values of financial assets and financial liabilities
Accounting policy
The fair value of a financial instrument is the price that would be received to sell an asset or paid to transfer a liability in an orderly transaction between market participants at the measurement date.
On initial recognition, the transaction price generally represents the fair value of the financial instrument unless there is observable information from an active market to the contrary. Where unobservable information is used, the difference between the transaction price and the fair value (day one profit or loss) is recognised in the income statement over the life of the instrument when the inputs become observable.
Critical accounting assumptions and estimates
The majority of valuation models used by the Group employ only observable market data as inputs. However, for certain financial instruments data may be employed which is not readily observable in current markets.
The availability of observable inputs is influenced by factors such as:
• product type;
• depth of market activity;
• maturity of market models; and
• complexity of the transaction.
Where unobservable market data is used, more judgement is required to determine fair value. The significance of these judgements depends on the significance of the unobservable input to the overall valuation. Unobservable inputs are generally derived from other relevant market data and adjusted against:
• standard industry practice;
• economic models; and
• observed transaction prices.
In order to determine a reliable fair value for a financial instrument, management may apply adjustments to the techniques previously described. These adjustments reflect the Group’s assessment of factors that market participants would consider in setting the fair value.
These adjustments incorporate bid/offer spreads, credit valuation adjustments (CVA) and funding valuation adjustments (FVA).
Fair Valuation Control Framework
The Group uses a Fair Valuation Control Framework where the fair value is either determined or validated by a function independent of the transaction. This framework formalises the policies and procedures used to achieve compliance with relevant accounting, industry and regulatory standards. The framework includes specific controls relating to:
• the revaluation of financial instruments;
• independent price verification;
• fair value adjustments; and
• financial reporting.
A key element of the framework is the Revaluation Committee, comprising senior valuation specialists from within the Group. The Revaluation Committee reviews the application of the agreed policies and procedures to assess that a fair value measurement basis has been applied.
The method of determining fair value differs depending on the information available.
Fair value hierarchy
A financial instrument’s categorisation within the valuation hierarchy is based on the lowest level input that is significant to the fair value measurement.
The Group categorises all fair value instruments according to the hierarchy described below.
Valuation techniques
The Group applies market accepted valuation techniques in determining the fair valuation of over the counter (OTC) derivatives. This includes CVA and FVA, which incorporate credit risk and funding costs and benefits that arise in relation to uncollateralised derivative positions, respectively.
Notes to the financial statements

2213 FIN
AN
CIA
L STATE
ME
NTS
2 GR
OU
P P
ER
FOR
MA
NC
E1 STR
ATE
GIC
RE
PO
RT
4 SH
AR
EH
OLD
ER
INFO
RM
ATIO
NWESTPAC GROUP 2021 ANNUAL REPORT
Notes to the financial statements
The specific valuation techniques, the observability of the inputs used in valuation models and the subsequent classification for each significant product category are outlined as follows:
Level 1 instruments (Level 1)
The fair value of financial instruments traded in active markets is based on recent unadjusted quoted prices. These prices are based on actual arm’s length basis transactions.
The valuations of Level 1 instruments require little or no management judgement.
Instrument Balance sheet category Includes Valuation
Exchange traded products
Derivatives Exchange traded interest rate futures and options and commodity and carbon futures
All these instruments are traded in liquid, active markets where prices are readily observable. No modelling or assumptions are used in the valuation.
FX products Derivatives FX spot and futures contracts
Equity products Derivatives
Trading securities and financial assets measured at FVIS
Other financial liabilities
Listed equities and equity indices
Non-asset backed debt instruments
Trading securities and financial assets measured at FVIS
Investment securities
Other financial liabilities
Australian Commonwealth and New Zealand government bonds
Life insurance assets and liabilities
Life insurance assets
Life insurance liabilities
Listed equities, exchange traded derivatives and short sale of listed equities within controlled managed investment schemes
Level 2 instruments (Level 2)
The fair value for financial instruments that are not actively traded is determined using valuation techniques which maximise the use of observable market prices. Valuation techniques include:
• the use of market standard discounting methodologies;
• option pricing models; and
• other valuation techniques widely used and accepted by market participants.
Instrument Balance sheet category Includes Valuation
Interest rate products
Derivatives Interest rate and inflation swaps, swaptions, caps, floors, collars and other non-vanilla interest rate derivatives
Industry standard valuation models are used to calculate the expected future value of payments by product, which is discounted back to a present value. The model’s interest rate inputs are benchmark and active quoted interest rates in the swap, bond and futures markets. Interest rate volatilities are sourced from brokers and consensus data providers. If consensus prices are not available, these are classified as Level 3 instruments.
FX products Derivatives FX swap, FX forward contracts, FX options and other non-vanilla FX derivatives
Derived from market observable inputs or consensus pricing providers using industry standard models.
Other credit products
Derivatives Single name and index credit default swaps (CDS)
Valued using an industry standard model that incorporates the credit spread as its principal input. Credit spreads are obtained from consensus data providers. If consensus prices are not available, these are classified as Level 3 instruments.
Note 22. Fair values of financial assets and financial liabilities (continued)

222 WESTPAC GROUP 2021 ANNUAL REPORT
Notes to the financial statements
Instrument Balance sheet category Includes Valuation
Commodity products
Derivatives Commodity and carbon derivatives
Valued using industry standard models.
The models calculate the expected future value of deliveries and payments and discount them back to a present value. The model inputs include forward curves, volatilities implied from market observable inputs, discount curves and underlying spot and futures prices. The significant inputs are market observable or available through a consensus data service. If consensus prices are not available, these are classified as Level 3 instruments.
Equity products
Derivatives Exchange traded equity options, OTC equity options and equity warrants
Due to low liquidity, exchange traded options are Level 2.
Valued using industry standard models based on observable parameters such as stock prices, dividends, volatilities and interest rates.
Asset backed debt instruments
Trading securities and financial assets measured at FVIS
Investment securities
Australian residential mortgage backed securities (RMBS) and other asset backed securities (ABS)
Valued using an industry approach to value floating rate debt with prepayment features. Australian RMBS are valued using prices sourced from a consensus data provider. If consensus prices are not available these are classified as Level 3 instruments.
Non-asset backed debt instruments
Trading securities and financial assets measured at FVIS
Investment securities
Other financial liabilities
State and other government bonds, corporate bonds and commercial paper
Repurchase agreements and reverse repurchase agreements over non-asset backed debt securities
Valued using observable market prices, which are sourced from independent pricing services, broker quotes or inter-dealer prices.
Loans at fair value
Loans Fixed rate bills and syndicated loans
Discounted cash flow approach, using a discount rate which reflects the terms of the instrument and the timing of cash flows, adjusted for creditworthiness, or expected sale amount.
Certificates of deposit
Deposits and other borrowings
Certificates of deposit Discounted cash flow using market rates offered for deposits of similar remaining maturities.
Debt issues at fair value
Debt issues Debt issues Discounted cash flows, using a discount rate which reflects the terms of the instrument and the timing of cash flows adjusted for market observable changes in Westpac’s implied credit worthiness.
Life insurance assets and liabilities
Life insurance assets included in assets held for sale
Life insurance liabilities included in liabilities held for sale
Corporate bonds, OTC derivatives, units in unlisted unit trusts, life insurance contract liabilities, life investment contract liabilities and external liabilities of managed investment schemes controlled by statutory life funds
Valued using observable market prices or other widely used and accepted valuation techniques utilising observable market input.
Level 2 instruments (Level 2) (continued)
Note 22. Fair values of financial assets and financial liabilities (continued)

2233 FIN
AN
CIA
L STATE
ME
NTS
2 GR
OU
P P
ER
FOR
MA
NC
E1 STR
ATE
GIC
RE
PO
RT
4 SH
AR
EH
OLD
ER
INFO
RM
ATIO
NWESTPAC GROUP 2021 ANNUAL REPORT
Notes to the financial statements
Level 3 instruments (Level 3)
Financial instruments valued where at least one input that could have a significant effect on the instrument’s valuation is not based on observable market data due to illiquidity or complexity of the product. These inputs are generally derived and extrapolated from other relevant market data and calibrated against current market trends and historical transactions.
These valuations are calculated using a high degree of management judgement.
Instrument Balance sheet category Includes Valuation
Debt instruments
Trading securities and financial assets measured at FVIS
Investment securities
Certain ABS, offshore non-ABS and debt securities issued via private placement
These securities are evaluated by an independent pricing service or based on third party revaluations. Due to their illiquidity and/or complexity these are classified as Level 3 assets.
Equity instruments
Trading securities and financial assets measured at FVIS
Investment securities
Strategic equity investments
Valued using valuation techniques appropriate to the instrument, including the use of recent arm’s length transactions where available, discounted cash flow approach or reference to the net assets of the entity.
Due to their illiquidity, complexity and/or use of unobservable inputs into valuation models, they are classified as Level 3 assets.
Finance leases Assets held for sale Finance leases Valuation reflects the expected sales price before transaction costs based on the terms of sales contract. As the expected sales price includes judgements regarding the estimation of variable consideration, they are classified as Level 3 assets.
Note 22. Fair values of financial assets and financial liabilities (continued)

224 WESTPAC GROUP 2021 ANNUAL REPORT
Notes to the financial statements
The following tables summarise the attribution of financial instruments measured at fair value to the fair value hierarchy.
2021 2020$m Level 1 Level 2 Level 3 Total Level 1 Level 2 Level 3 Total
Consolidated
Financial assets measured at fair value on a recurring basis
Trading securities and financial assets measured at FVIS 6,221 14,875 5 21,101 8,059 32,387 221 40,667
Derivative financial instruments 22 19,305 26 19,353 10 23,353 4 23,367
Investment securities 19,282 62,923 277 82,482 18,032 72,370 153 90,555
Loans - 74 36 110 - 540 21 561
Life insurance assets - - - - 617 2,976 - 3,593
Assets held for sale 1,309 1,663 - 2,972 - - - -
Total financial assets measured at fair value on a recurring basis 26,834 98,840 344 126,018 26,718 131,626 399 158,743
Financial liabilities measured at fair value on a recurring basis
Deposits and other borrowings1 - 46,665 - 46,665 - 35,764 - 35,764
Other financial liabilities2 1,478 4,968 - 6,446 420 4,229 - 4,649
Derivative financial instruments 35 17,992 32 18,059 10 23,031 13 23,054
Debt issues3 - 5,514 - 5,514 - 5,333 - 5,333
Life insurance liabilities - - - - - 1,396 - 1,396
Liabilities held for sale - 447 - 447 - - - -
Total financial liabilities measured at fair value on a recurring basis 1,513 75,586 32 77,131 430 69,753 13 70,196
Parent Entity
Financial assets measured at fair value on a recurring basis
Trading securities and financial assets measured at FVIS 5,542 13,233 4 18,779 7,074 30,763 193 38,030
Derivative financial instruments 22 19,081 24 19,127 10 22,781 3 22,794
Investment securities 17,228 60,511 75 77,814 15,714 70,040 69 85,823
Loans - 74 17 91 - 540 21 561
Due from subsidiaries - 1,163 - 1,163 - 663 - 663
Total financial assets measured at fair value on a recurring basis 22,792 94,062 120 116,974 22,798 124,787 286 147,871
Financial liabilities measured at fair value on a recurring basis
Deposits and other borrowings1 - 43,372 - 43,372 - 32,991 - 32,991
Other financial liabilities2 1,478 4,415 - 5,893 420 4,229 - 4,649
Derivative financial instruments 35 17,822 32 17,889 10 22,756 13 22,779
Debt issues3 - 2,664 - 2,664 - 2,986 - 2,986
Due to subsidiaries - 867 - 867 - 239 - 239
Total financial liabilities measured at fair value on a recurring basis 1,513 69,140 32 70,685 430 63,201 13 63,644
Note 22. Fair values of financial assets and financial liabilities (continued)
1. The contractual outstanding amount payable at maturity was $46,661 million (2020: $35,764 million) for the Group and $43,367 million (2020: $32,990 million) for the Parent Entity.
2. The contractual outstanding amount payable at maturity for the Group is $6,446 million (2020: $4,649 million) and $5,893 million for the Parent Entity (2020: $4,649 million).
3. The contractual outstanding amount payable at maturity was $5,357 million (2020: $5,062 million) for the Group and $2,507 million (2020: $2,714 million) for the Parent Entity. The cumulative change in the fair value of debt issues attributable to changes in Westpac’s own credit risk was $14 million increase (2020: $5 million increase) for the Group and Parent Entity.
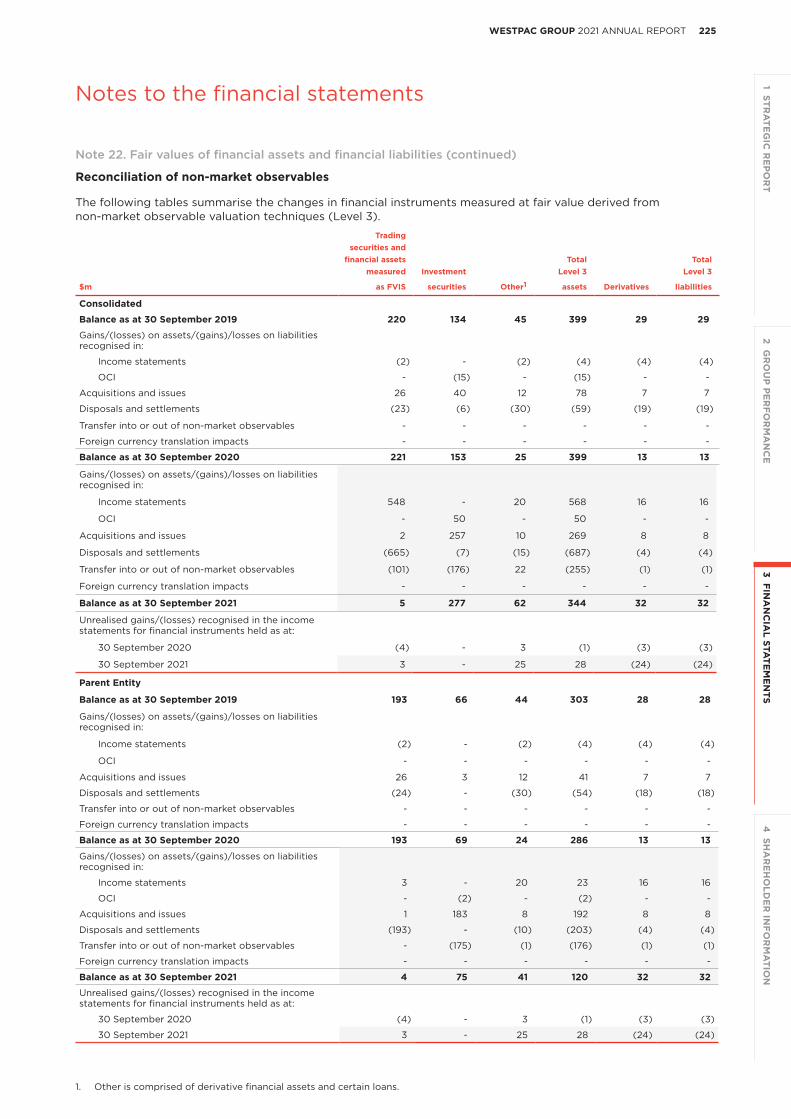
2253 FIN
AN
CIA
L STATE
ME
NTS
2 GR
OU
P P
ER
FOR
MA
NC
E1 STR
ATE
GIC
RE
PO
RT
4 SH
AR
EH
OLD
ER
INFO
RM
ATIO
NWESTPAC GROUP 2021 ANNUAL REPORT
Notes to the financial statements
Reconciliation of non-market observables
The following tables summarise the changes in financial instruments measured at fair value derived from non-market observable valuation techniques (Level 3).
Tradingsecurities and
financial assets Total Totalmeasured Investment Level 3 Level 3
$m as FVIS securities Other1 assets Derivatives liabilities
Consolidated
Balance as at 30 September 2019 220 134 45 399 29 29
Gains/(losses) on assets/(gains)/losses on liabilities recognised in:
Income statements (2) - (2) (4) (4) (4)
OCI - (15) - (15) - -
Acquisitions and issues 26 40 12 78 7 7
Disposals and settlements (23) (6) (30) (59) (19) (19)
Transfer into or out of non-market observables - - - - - -
Foreign currency translation impacts - - - - - -
Balance as at 30 September 2020 221 153 25 399 13 13
Gains/(losses) on assets/(gains)/losses on liabilities recognised in:
Income statements 548 - 20 568 16 16
OCI - 50 - 50 - -
Acquisitions and issues 2 257 10 269 8 8
Disposals and settlements (665) (7) (15) (687) (4) (4)
Transfer into or out of non-market observables (101) (176) 22 (255) (1) (1)
Foreign currency translation impacts - - - - - -
Balance as at 30 September 2021 5 277 62 344 32 32
Unrealised gains/(losses) recognised in the income statements for financial instruments held as at:
30 September 2020 (4) - 3 (1) (3) (3)
30 September 2021 3 - 25 28 (24) (24)
Parent Entity
Balance as at 30 September 2019 193 66 44 303 28 28
Gains/(losses) on assets/(gains)/losses on liabilities recognised in:
Income statements (2) - (2) (4) (4) (4)
OCI - - - - - -
Acquisitions and issues 26 3 12 41 7 7
Disposals and settlements (24) - (30) (54) (18) (18)
Transfer into or out of non-market observables - - - - - -
Foreign currency translation impacts - - - - - -
Balance as at 30 September 2020 193 69 24 286 13 13
Gains/(losses) on assets/(gains)/losses on liabilities recognised in:
Income statements 3 - 20 23 16 16
OCI - (2) - (2) - -
Acquisitions and issues 1 183 8 192 8 8
Disposals and settlements (193) - (10) (203) (4) (4)
Transfer into or out of non-market observables - (175) (1) (176) (1) (1)
Foreign currency translation impacts - - - - - -
Balance as at 30 September 2021 4 75 41 120 32 32
Unrealised gains/(losses) recognised in the income statements for financial instruments held as at:
30 September 2020 (4) - 3 (1) (3) (3)
30 September 2021 3 - 25 28 (24) (24)
1. Other is comprised of derivative financial assets and certain loans.
Note 22. Fair values of financial assets and financial liabilities (continued)

226 WESTPAC GROUP 2021 ANNUAL REPORT
Notes to the financial statements
Transfers into and out of Level 3 have occurred due to changes in observability in the significant inputs into the valuation models used to determine the fair value of the related financial instruments. Transfers in and transfers out are reported using the end of year fair values.
Significant unobservable inputs
Sensitivities to reasonably possible changes in non-market observable valuation assumptions would not have a material impact on the Group’s reported results.
Day one profit or loss
The closing balance of unrecognised day one profit for both the Group and the Parent Entity for the year was $1 million (2020: $4 million).
Financial instruments not measured at fair value
For financial instruments not measured at fair value on a recurring basis, fair value has been derived as follows:
Instrument Valuation
Loans Where available, the fair value of loans is based on observable market transactions, otherwise fair value is estimated using discounted cash flow models. For variable rate loans, the discount rate used is the current effective interest rate. The discount rate applied for fixed rate loans reflects the market rate for the maturity of the loan and the credit worthiness of the borrower.
Investment securities
The carrying value approximates the fair value. The balance principally relates to government securities from illiquid markets. Fair value is monitored by reference to recent issuances.
Deposits and other borrowings
Fair values of deposit liabilities payable on demand (non-interest bearing, interest bearing and savings deposits) approximate their carrying value. Fair values for term deposits are estimated using discounted cash flows, applying market rates offered for deposits of similar remaining maturities.
Debt issues and loan capital
Fair values are calculated using a discounted cash flow model. The discount rates applied reflect the terms of the instruments, the timing of the estimated cash flows and are adjusted for any changes in Westpac’s credit spreads.
Assets and liabilities held for sale
Valuation reflects the expected sales price before transaction costs based on the terms of the sales contract.
All other financial assets and liabilities
For all other financial assets and liabilities, the carrying value approximates the fair value. These items are either short-term in nature, re-price frequently or are of a high credit rating.
Note 22. Fair values of financial assets and financial liabilities (continued)

2273 FIN
AN
CIA
L STATE
ME
NTS
2 GR
OU
P P
ER
FOR
MA
NC
E1 STR
ATE
GIC
RE
PO
RT
4 SH
AR
EH
OLD
ER
INFO
RM
ATIO
NWESTPAC GROUP 2021 ANNUAL REPORT
Notes to the financial statements
The following tables summarise the estimated fair value and fair value hierarchy of financial instruments not measured at fair value
Estimated fair value
Consolidated Carrying$m amount Level 1 Level 2 Level 3 Total
2021
Financial assets not measured at fair value
Cash and balances with central banks 71,353 71,353 - - 71,353
Collateral paid 4,232 4,232 - - 4,232
Investment securities 935 - 331 604 935
Loans 709,674 - - 710,284 710,284
Other financial assets 6,394 - 6,394 - 6,394
Assets held for sale 1,041 7 19 1,015 1,041
Total financial assets not measured at fair value 793,629 75,592 6,744 711,903 794,239
Financial liabilities not measured at fair value
Collateral received 2,368 2,368 - - 2,368
Deposits and other borrowings 580,290 - 576,293 3,819 580,112
Other financial liabilities 43,863 - 43,863 - 43,863
Debt issues1 123,265 - 123,826 743 124,569
Loan capital1 29,067 - 30,147 - 30,147
Liabilities held for sale 28 - 28 - 28
Total financial liabilities not measured at fair value 778,881 2,368 774,157 4,562 781,087
2020
Financial assets not measured at fair value
Cash and balances with central banks 30,129 30,129 - - 30,129
Collateral paid 4,778 4,778 - - 4,778
Investment securities 984 - 424 560 984
Loans 692,498 - - 694,264 694,264
Other financial assets 5,474 - 5,474 - 5,474
Total financial assets not measured at fair value 733,863 34,907 5,898 694,824 735,629
Financial liabilities not measured at fair value
Collateral received 2,250 2,250 - - 2,250
Deposits and other borrowings 555,367 - 552,192 3,429 555,621
Other financial liabilities 36,276 - 36,276 - 36,276
Debt issues1 144,992 - 144,660 1,742 146,402
Loan capital1 23,949 - 23,934 - 23,934
Total financial liabilities not measured at fair value 762,834 2,250 757,062 5,171 764,483
Note 22. Fair values of financial assets and financial liabilities (continued)
1. The estimated fair values of debt issues and loan capital include the impact of changes in Westpac’s credit spreads since origination.

228 WESTPAC GROUP 2021 ANNUAL REPORT
Notes to the financial statements
Estimated fair value
Parent Entity Carrying$m amount Level 1 Level 2 Level 3 Total
2021
Financial assets not measured at fair value
Cash and balances with central banks 62,754 62,754 - - 62,754
Collateral paid 4,055 4,055 - - 4,055
Investment securities 49 - 2 47 49
Loans 618,322 - - 619,061 619,061
Due from subsidiaries1 162,794 - 123,164 34,525 157,689
Other financial assets 5,486 - 5,486 - 5,486
Assets held for sale 1,015 - - 1,015 1,015
Total financial assets not measured at fair value 854,475 66,809 128,652 654,648 850,109
Financial liabilities not measured at fair value
Collateral received 2,189 2,189 - - 2,189
Deposits and other borrowings 506,815 - 505,367 1,241 506,608
Other financial liabilities 41,370 - 41,370 - 41,370
Debt issues2 105,546 - 106,713 - 106,713
Due to subsidiaries 177,949 - 7,569 170,380 177,949
Loan capital2 29,067 - 30,147 - 30,147
Liabilities held for sale 3 - 3 - 3
Total financial liabilities not measured at fair value 862,939 2,189 691,169 171,621 864,979
2020
Financial assets not measured at fair value
Cash and balances with central banks 25,436 25,436 - - 25,436
Collateral paid 4,641 4,641 - - 4,641
Investment securities 3 - 3 - 3
Loans 607,263 - - 608,602 608,602
Due from subsidiaries1 169,139 - 126,623 43,669 170,292
Other financial assets 4,745 - 4,745 - 4,745
Total financial assets not measured at fair value 811,227 30,077 131,371 652,271 813,719
Financial liabilities not measured at fair value
Collateral received 1,862 1,862 - - 1,862
Deposits and other borrowings 488,622 - 487,452 1,292 488,744
Other financial liabilities 35,507 - 35,507 - 35,507
Debt issues2 124,680 - 125,896 - 125,896
Due to subsidiaries 186,024 - 6,805 179,219 186,024
Loan capital2 23,949 - 23,934 - 23,934
Total financial liabilities not measured at fair value 860,644 1,862 679,594 180,511 861,967
1. Due from subsidiaries excluded $11,389 million (2020: $11,177 million) of long-term debt instruments with equity-like characteristics which are part of the total investment in subsidiaries.
2. The estimated fair values of debt issues and loan capital include the impact of changes in Westpac’s credit spreads since origination.
Note 22. Fair values of financial assets and financial liabilities (continued)
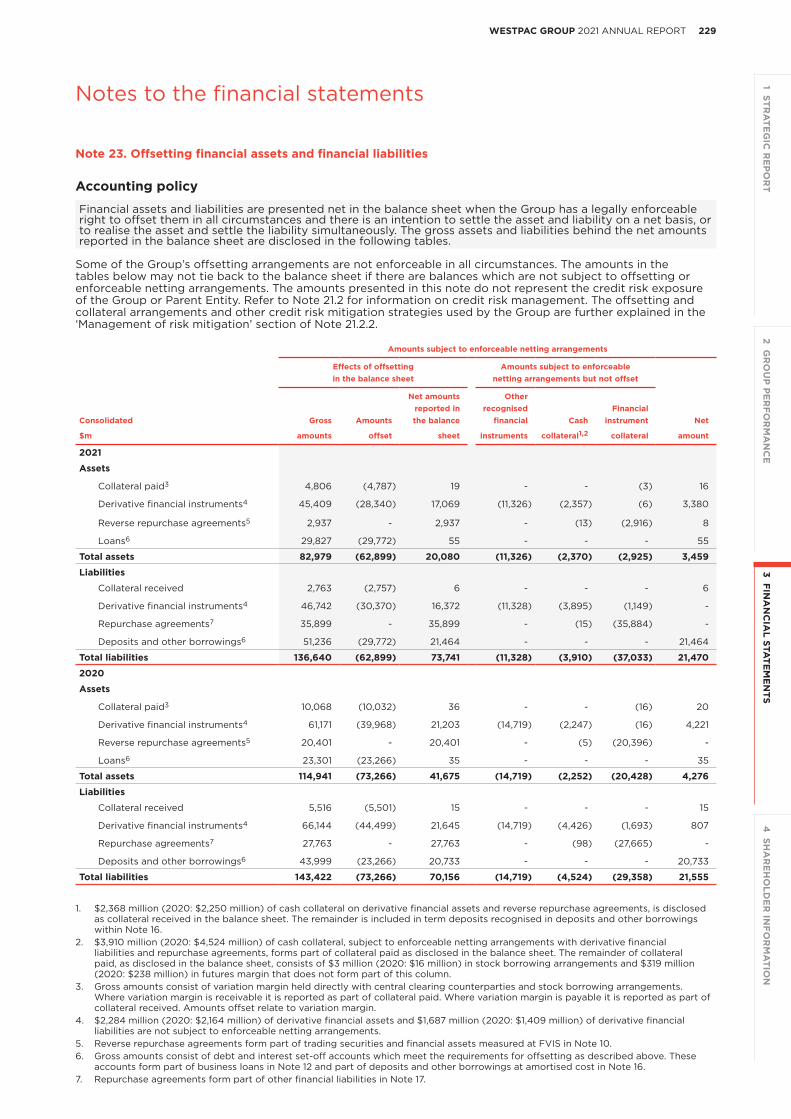
2293 FIN
AN
CIA
L STATE
ME
NTS
2 GR
OU
P P
ER
FOR
MA
NC
E1 STR
ATE
GIC
RE
PO
RT
4 SH
AR
EH
OLD
ER
INFO
RM
ATIO
NWESTPAC GROUP 2021 ANNUAL REPORT
Notes to the financial statements
Note 23. Offsetting financial assets and financial liabilities
Accounting policy
Financial assets and liabilities are presented net in the balance sheet when the Group has a legally enforceable right to offset them in all circumstances and there is an intention to settle the asset and liability on a net basis, or to realise the asset and settle the liability simultaneously. The gross assets and liabilities behind the net amounts reported in the balance sheet are disclosed in the following tables.
Some of the Group’s offsetting arrangements are not enforceable in all circumstances. The amounts in the tables below may not tie back to the balance sheet if there are balances which are not subject to offsetting or enforceable netting arrangements. The amounts presented in this note do not represent the credit risk exposure of the Group or Parent Entity. Refer to Note 21.2 for information on credit risk management. The offsetting and collateral arrangements and other credit risk mitigation strategies used by the Group are further explained in the ‘Management of risk mitigation’ section of Note 21.2.2.
Amounts subject to enforceable netting arrangements
Effects of offsetting Amounts subject to enforceablein the balance sheet netting arrangements but not offset
Net amounts Otherreported in recognised Financial
Consolidated Gross Amounts the balance financial Cash instrument Net
$m amounts offset sheet instruments collateral1,2 collateral amount
2021
Assets
Collateral paid3 4,806 (4,787) 19 - - (3) 16
Derivative financial instruments4 45,409 (28,340) 17,069 (11,326) (2,357) (6) 3,380
Reverse repurchase agreements5 2,937 - 2,937 - (13) (2,916) 8
Loans6 29,827 (29,772) 55 - - - 55
Total assets 82,979 (62,899) 20,080 (11,326) (2,370) (2,925) 3,459
Liabilities
Collateral received 2,763 (2,757) 6 - - - 6
Derivative financial instruments4 46,742 (30,370) 16,372 (11,328) (3,895) (1,149) -
Repurchase agreements7 35,899 - 35,899 - (15) (35,884) -
Deposits and other borrowings6 51,236 (29,772) 21,464 - - - 21,464
Total liabilities 136,640 (62,899) 73,741 (11,328) (3,910) (37,033) 21,470
2020
Assets
Collateral paid3 10,068 (10,032) 36 - - (16) 20
Derivative financial instruments4 61,171 (39,968) 21,203 (14,719) (2,247) (16) 4,221
Reverse repurchase agreements5 20,401 - 20,401 - (5) (20,396) -
Loans6 23,301 (23,266) 35 - - - 35
Total assets 114,941 (73,266) 41,675 (14,719) (2,252) (20,428) 4,276
Liabilities
Collateral received 5,516 (5,501) 15 - - - 15
Derivative financial instruments4 66,144 (44,499) 21,645 (14,719) (4,426) (1,693) 807
Repurchase agreements7 27,763 - 27,763 - (98) (27,665) -
Deposits and other borrowings6 43,999 (23,266) 20,733 - - - 20,733
Total liabilities 143,422 (73,266) 70,156 (14,719) (4,524) (29,358) 21,555
1. $2,368 million (2020: $2,250 million) of cash collateral on derivative financial assets and reverse repurchase agreements, is disclosed as collateral received in the balance sheet. The remainder is included in term deposits recognised in deposits and other borrowings within Note 16.
2. $3,910 million (2020: $4,524 million) of cash collateral, subject to enforceable netting arrangements with derivative financial liabilities and repurchase agreements, forms part of collateral paid as disclosed in the balance sheet. The remainder of collateral paid, as disclosed in the balance sheet, consists of $3 million (2020: $16 million) in stock borrowing arrangements and $319 million (2020: $238 million) in futures margin that does not form part of this column.
3. Gross amounts consist of variation margin held directly with central clearing counterparties and stock borrowing arrangements. Where variation margin is receivable it is reported as part of collateral paid. Where variation margin is payable it is reported as part of collateral received. Amounts offset relate to variation margin.
4. $2,284 million (2020: $2,164 million) of derivative financial assets and $1,687 million (2020: $1,409 million) of derivative financial liabilities are not subject to enforceable netting arrangements.
5. Reverse repurchase agreements form part of trading securities and financial assets measured at FVIS in Note 10.6. Gross amounts consist of debt and interest set-off accounts which meet the requirements for offsetting as described above. These
accounts form part of business loans in Note 12 and part of deposits and other borrowings at amortised cost in Note 16.7. Repurchase agreements form part of other financial liabilities in Note 17.
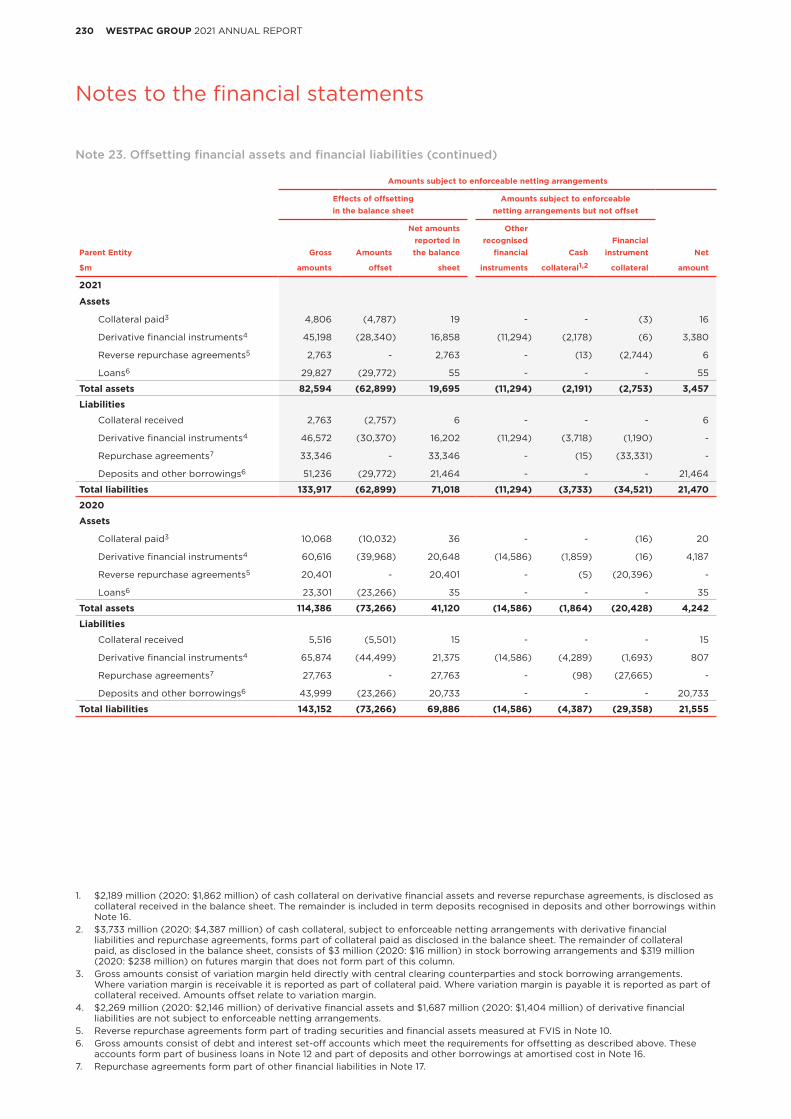
230 WESTPAC GROUP 2021 ANNUAL REPORT
Notes to the financial statements
Amounts subject to enforceable netting arrangements
Effects of offsetting Amounts subject to enforceablein the balance sheet netting arrangements but not offset
Net amounts Otherreported in recognised Financial
Parent Entity Gross Amounts the balance financial Cash instrument Net
$m amounts offset sheet instruments collateral1,2 collateral amount
2021
Assets
Collateral paid3 4,806 (4,787) 19 - - (3) 16
Derivative financial instruments4 45,198 (28,340) 16,858 (11,294) (2,178) (6) 3,380
Reverse repurchase agreements5 2,763 - 2,763 - (13) (2,744) 6
Loans6 29,827 (29,772) 55 - - - 55
Total assets 82,594 (62,899) 19,695 (11,294) (2,191) (2,753) 3,457
Liabilities
Collateral received 2,763 (2,757) 6 - - - 6
Derivative financial instruments4 46,572 (30,370) 16,202 (11,294) (3,718) (1,190) -
Repurchase agreements7 33,346 - 33,346 - (15) (33,331) -
Deposits and other borrowings6 51,236 (29,772) 21,464 - - - 21,464
Total liabilities 133,917 (62,899) 71,018 (11,294) (3,733) (34,521) 21,470
2020
Assets
Collateral paid3 10,068 (10,032) 36 - - (16) 20
Derivative financial instruments4 60,616 (39,968) 20,648 (14,586) (1,859) (16) 4,187
Reverse repurchase agreements5 20,401 - 20,401 - (5) (20,396) -
Loans6 23,301 (23,266) 35 - - - 35
Total assets 114,386 (73,266) 41,120 (14,586) (1,864) (20,428) 4,242
Liabilities
Collateral received 5,516 (5,501) 15 - - - 15
Derivative financial instruments4 65,874 (44,499) 21,375 (14,586) (4,289) (1,693) 807
Repurchase agreements7 27,763 - 27,763 - (98) (27,665) -
Deposits and other borrowings6 43,999 (23,266) 20,733 - - - 20,733
Total liabilities 143,152 (73,266) 69,886 (14,586) (4,387) (29,358) 21,555
1. $2,189 million (2020: $1,862 million) of cash collateral on derivative financial assets and reverse repurchase agreements, is disclosed as collateral received in the balance sheet. The remainder is included in term deposits recognised in deposits and other borrowings within Note 16.
2. $3,733 million (2020: $4,387 million) of cash collateral, subject to enforceable netting arrangements with derivative financial liabilities and repurchase agreements, forms part of collateral paid as disclosed in the balance sheet. The remainder of collateral paid, as disclosed in the balance sheet, consists of $3 million (2020: $16 million) in stock borrowing arrangements and $319 million (2020: $238 million) on futures margin that does not form part of this column.
3. Gross amounts consist of variation margin held directly with central clearing counterparties and stock borrowing arrangements. Where variation margin is receivable it is reported as part of collateral paid. Where variation margin is payable it is reported as part of collateral received. Amounts offset relate to variation margin.
4. $2,269 million (2020: $2,146 million) of derivative financial assets and $1,687 million (2020: $1,404 million) of derivative financial liabilities are not subject to enforceable netting arrangements.
5. Reverse repurchase agreements form part of trading securities and financial assets measured at FVIS in Note 10.6. Gross amounts consist of debt and interest set-off accounts which meet the requirements for offsetting as described above. These
accounts form part of business loans in Note 12 and part of deposits and other borrowings at amortised cost in Note 16.7. Repurchase agreements form part of other financial liabilities in Note 17.
Note 23. Offsetting financial assets and financial liabilities (continued)

2313 FIN
AN
CIA
L STATE
ME
NTS
2 GR
OU
P P
ER
FOR
MA
NC
E1 STR
ATE
GIC
RE
PO
RT
4 SH
AR
EH
OLD
ER
INFO
RM
ATIO
NWESTPAC GROUP 2021 ANNUAL REPORT
Notes to the financial statements
Other recognised financial instruments
These financial assets and liabilities are subject to master netting agreements which are not enforceable in all circumstances, so they are recognised gross in the balance sheet. The offsetting rights of the master netting arrangements can only be enforced if a predetermined event occurs in the future, such as a counterparty defaulting.
Cash collateral and financial instrument collateral
These amounts are received or pledged under master netting arrangements against the gross amounts of assets and liabilities. Financial instrument collateral typically comprises securities which can be readily liquidated in the event of counterparty default. The offsetting rights of the master netting arrangement can only be enforced if a predetermined event occurs in the future, such as a counterparty defaulting.
Note 24. Securitisation, covered bonds and other transferred assets
The Group enters into transactions in the normal course of business by which financial assets are transferred to counterparties or structured entities. Depending on the circumstances, these transfers may result in derecognition of the assets in their entirety, partial derecognition or no derecognition of the assets subject to the transfer. For the Group’s accounting policy on derecognition of financial assets refer to the notes to the financial statements section before Note 10 titled ‘Financial assets and financial liabilities’.
Securitisation
Securitisation is the transferring of assets (or an interest in either the assets or the cash flows arising from the assets) to a structured entity which then issues the majority of interest bearing debt securities to third party investors for funding deals and to Westpac for liquidity deals.
Securitisation of its own assets is used by Westpac as a funding and liquidity tool.
For securitisation structured entities which Westpac controls, as defined in Note 31, the structured entities are classified as subsidiaries and consolidated. When assessing whether Westpac controls a structured entity, it considers its exposure to and ability to affect variable returns. Westpac may have variable returns from a structured entity through ongoing exposures to the risks and rewards associated with the assets, the provision of derivatives, liquidity facilities, trust management and operational services.
Undrawn funding and liquidity facilities of $435 million (2020: $492 million) were provided by Westpac for the securitisation of its own assets.
Covered bonds
The Group has two covered bond programs relating to Australian residential mortgages (Australian Program) and New Zealand residential mortgages (New Zealand Program). Under these programs, selected pools of residential mortgages are assigned to bankruptcy remote structured entities which provide guarantees on the payments to bondholders. Through the guarantees and derivatives with the structured entities, Westpac has variable returns from these structured entities and consolidates them.
Repurchase agreements
Where securities are sold subject to an agreement to repurchase at a predetermined price, they remain recognised in the balance sheet in their original category (i.e. Trading securities or Investment securities).
The cash consideration received is recognised as a liability (Repurchase agreements). Refer to Note 17 for further details.
Note 23. Offsetting financial assets and financial liabilities (continued)
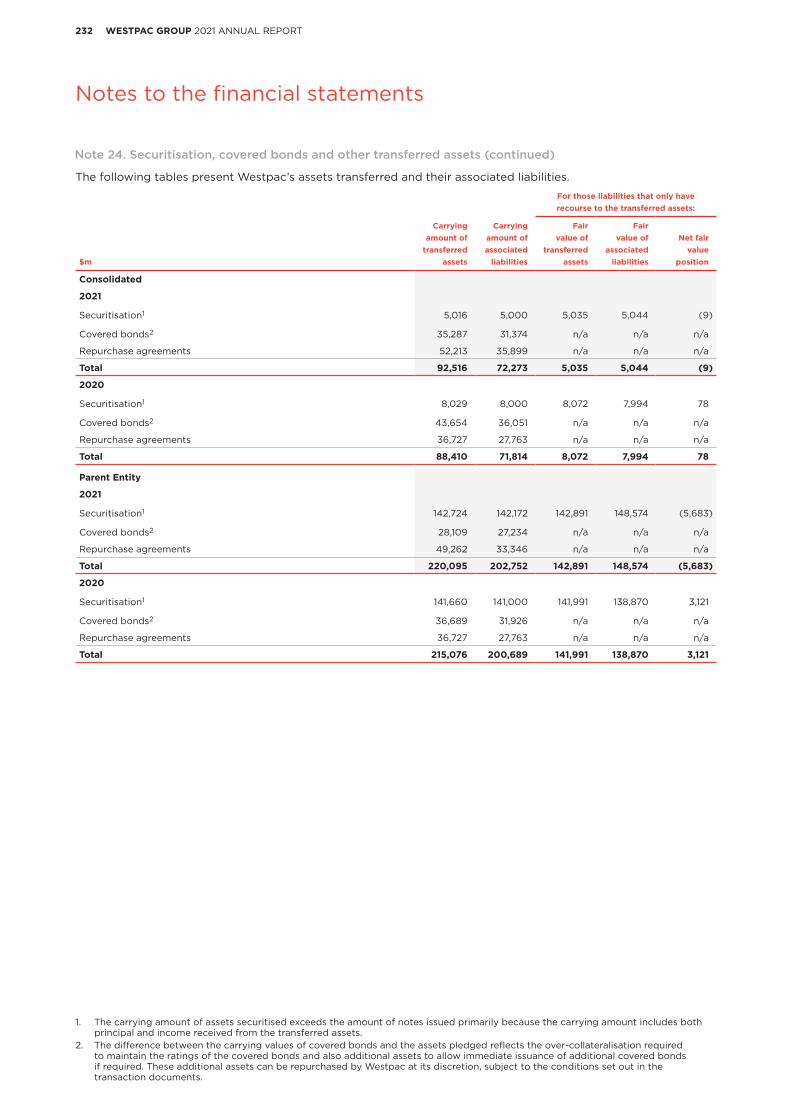
232 WESTPAC GROUP 2021 ANNUAL REPORT
Notes to the financial statements
The following tables present Westpac’s assets transferred and their associated liabilities.
For those liabilities that only haverecourse to the transferred assets:
Carrying Carrying Fair Fairamount of amount of value of value of Net fair
transferred associated transferred associated value$m assets liabilities assets liabilities position
Consolidated
2021
Securitisation1 5,016 5,000 5,035 5,044 (9)
Covered bonds2 35,287 31,374 n/a n/a n/a
Repurchase agreements 52,213 35,899 n/a n/a n/a
Total 92,516 72,273 5,035 5,044 (9)
2020
Securitisation1 8,029 8,000 8,072 7,994 78
Covered bonds2 43,654 36,051 n/a n/a n/a
Repurchase agreements 36,727 27,763 n/a n/a n/a
Total 88,410 71,814 8,072 7,994 78
Parent Entity
2021
Securitisation1 142,724 142,172 142,891 148,574 (5,683)
Covered bonds2 28,109 27,234 n/a n/a n/a
Repurchase agreements 49,262 33,346 n/a n/a n/a
Total 220,095 202,752 142,891 148,574 (5,683)
2020
Securitisation1 141,660 141,000 141,991 138,870 3,121
Covered bonds2 36,689 31,926 n/a n/a n/a
Repurchase agreements 36,727 27,763 n/a n/a n/a
Total 215,076 200,689 141,991 138,870 3,121
1. The carrying amount of assets securitised exceeds the amount of notes issued primarily because the carrying amount includes both principal and income received from the transferred assets.
2. The difference between the carrying values of covered bonds and the assets pledged reflects the over-collateralisation required to maintain the ratings of the covered bonds and also additional assets to allow immediate issuance of additional covered bonds if required. These additional assets can be repurchased by Westpac at its discretion, subject to the conditions set out in the transaction documents.
Note 24. Securitisation, covered bonds and other transferred assets (continued)

2333 FIN
AN
CIA
L STATE
ME
NTS
2 GR
OU
P P
ER
FOR
MA
NC
E1 STR
ATE
GIC
RE
PO
RT
4 SH
AR
EH
OLD
ER
INFO
RM
ATIO
NWESTPAC GROUP 2021 ANNUAL REPORT
Notes to the financial statements
INTANGIBLE ASSETS, PROVISIONS, COMMITMENTS AND CONTINGENCIES
Note 25. Intangible assets
Accounting policy
Indefinite life intangible assets
Goodwill
Goodwill acquired in a business combination is initially measured at cost, generally being the excess of:
(i) the consideration paid; over
(ii) the net fair value of the identifiable assets, liabilities and contingent liabilities acquired.
Subsequently, goodwill is not amortised but rather tested for impairment. Impairment is tested at least annually or whenever there is an indication of impairment. An impairment charge is recognised when a cash generating unit’s (CGU) carrying value exceeds its recoverable amount. Recoverable amount means the higher of the CGU’s fair value less costs to sell and its value-in-use.
The Group’s CGUs represent the smallest identifiable group of assets that generate cash inflows that are largely independent of the cash inflows from other assets or groups of assets. They reflect the level at which the Group monitors and manages its operations.
Brand names
Brand names acquired in a business combination including St.George, BT, BankSA and RAMS, are recognised at cost. Subsequently brand names are not amortised but tested for impairment at least annually or whenever there is an indication of impairment.
Finite life intangible assets
Finite life intangibles, such as computer software, are recognised initially at cost and subsequently at amortised cost less any impairment.
Intangible Useful life Depreciation method
Goodwill Indefinite Not applicable
Brand names Indefinite Not applicable
Computer software 3 to 10 years Straight-line or the diminishing balance method (using the Sum of the Years Digits)
Critical accounting assumptions and estimates
Judgement is required in determining the fair value of assets and liabilities acquired in a business combination. A different assessment of fair values would have resulted in a different goodwill balance and different post-acquisition performance of the acquired entity.
When assessing impairment of intangible assets, significant judgement is needed to determine the appropriate cash flows and discount rates to be applied to the calculations. The significant assumptions applied to the value-in-use calculations are outlined below.

234 WESTPAC GROUP 2021 ANNUAL REPORT
Notes to the financial statements
Consolidated Parent Entity$m 2021 2020 2021 2020
Goodwill
Balance as at beginning of year 8,397 8,895 6,728 6,844
Disposals (refer to Note 36) (243) - - -
Impairment (571) (498) (487) (116)
Other adjustments 16 - - -
Balance as at end of year 7,599 8,397 6,241 6,728
Computer software
Balance as at beginning of year 2,430 2,365 2,266 2,207
Additions 740 1,035 638 955
Impairment1 (485) (171) (475) (165)
Amortisation (755) (799) (696) (731)
Other adjustments2 (90) - (80) -
Balance as at end of year 1,840 2,430 1,653 2,266
Cost 7,770 7,370 6,681 6,372
Accumulated amortisation and impairment (5,930) (4,940) (5,028) (4,106)
Carrying amount 1,840 2,430 1,653 2,266
Brand names 670 670 636 636
Total intangible assets 10,109 11,497 8,530 9,630
Goodwill has been allocated to the following CGUs3:
Consumer 3,359 3,359 3,144 3,144
Business 3,205 3,205 3,022 3,022
Westpac Institutional Bank - 487 - 487
New Zealand 504 488 - -
Specialist Businesses 531 858 75 75
Total goodwill 7,599 8,397 6,241 6,728
In addition, brand names of $670 million for the Group have been allocated as $382 million to Consumer, $286 million to Business and $2 million to Specialist Businesses as at 30 September 2021 and 30 September 2020. Brand names of $636 million for the Parent Entity have been allocated as $350 million to Consumer and $286 million to Business as at 30 September 2021 and 30 September 2020.
Note 25. Intangible assets (continued)
1. Includes impairment of $380 million for the Group and Parent Entity from the WIB CGU ($344 million as a result of the annual impairment test).
2. Includes the impact of a change in accounting policy in 2021 with respect to the treatment of configuring or customising SaaS arrangements amounting to $94 million for the Group and $80 million for the Parent Entity (refer to Note 1).
3. The Specialist Businesses segment comprises individual CGUs (Superannuation, Platforms, Investments) to which goodwill has been allocated. The carrying amount of goodwill allocated to these individual CGUs is not significant compared to total Group goodwill.

2353 FIN
AN
CIA
L STATE
ME
NTS
2 GR
OU
P P
ER
FOR
MA
NC
E1 STR
ATE
GIC
RE
PO
RT
4 SH
AR
EH
OLD
ER
INFO
RM
ATIO
NWESTPAC GROUP 2021 ANNUAL REPORT
Notes to the financial statements
Impairment testing and results
Impairment testing is performed at least once a year, or whenever there is an indication of impairment, by comparing the recoverable amount of each CGU with the carrying amount. The primary test for the recoverable amount is determined based on value-in-use which refers to the present value of expected cash flows under its current use. Fair value less costs to sell was also considered for those CGUs where value-in-use was lower than carrying value. In these cases, there was no change to the result of the impairment test.
In the current year, as a result of the annual impairment test, the Group recognised impairment of intangible assets of $831 million for the Group and the Parent Entity from the Westpac Institutional Bank (WIB) CGU ($487 million of goodwill and $344 million of computer software)1. In addition, goodwill of $84 million ($nil for Parent Entity) allocated to the Lenders Mortgage Insurance CGU was written down as impaired on reclassification of the business to held for sale (refer to Note 37). No goodwill remains for these CGUs.
The impairment of the WIB CGU resulted from a combination of factors which have impacted earnings, including reducing risk in the division through the exit of the energy trading business, consolidating Asian operations and reducing correspondent banking relationships. At the same time, medium term expectations of a prolonged low interest rate environment, subdued financial markets income and elevated compliance expenses have impacted WIB’s earnings outlook. WIB’s forecasts are also highly responsive to changes in assumptions particularly with respect to credit losses, capital retention requirements and interest rates. To address the uncertainty resulting from these assumptions, a range of probability weighted scenarios were used to calculate the recoverable amount.
Significant assumptions used in recoverable amount calculations
The assumptions made for goodwill impairment testing for each relevant significant CGU are provided in the following table and are based on past experience and management’s expectations for the future. In the current year and given the present economic environment, the Group has reassessed these assumptions and revised them where necessary in order to provide a reasonable estimate of the value-in-use of the CGUs and Group.
Discount rate
Post-tax rate/Pre-tax rate
Cash flows
Forecast period/terminal growth rate2021 2020 2021 2020
Westpac Institutional Bank 10.4% / 13.8% 11.0% / 14.4% 5 years / 1.8% 5 years / 2%
New Zealand 9% / 12.2% 11.0% / 14.5% 3 years / 2% 3 years / 2%
All other significant CGUs 9% / 12.5% 11.0% / 15-15.2% 3 years / 2% 3 years / 2%
For CGUs other than WIB, the Group discounts the projected cash flows by its adjusted pre-tax equity rate. For WIB, a probability weighted discount rate was used (based on the Group’s pre-tax equity rate and using a range of reasonable additional risk premiums to reflect the inherent risk of the underlying cash flows).
The cash flows used are based on management approved forecasts. These forecasts utilise information about current and future economic conditions, observable historical information and management expectations of future business performance. The terminal value growth rate represents the growth rate applied to extrapolate cash flows beyond the forecast period and reflects the lower end of the RBA’s target long-term inflation rate band.
For all CGUs other than WIB, the recoverability of goodwill is not reliant on any one particular assumption. There are no reasonably possible changes in assumptions for any significant CGU that would result in an indication of impairment or have a material impact on the Group’s reported results.
Note 25. Intangible assets (continued)
1. $325 million of other assets in the WIB CGU (included in Property and equipment, and Other assets) were also written down as impaired as a result of the annual impairment test.

236 WESTPAC GROUP 2021 ANNUAL REPORT
Notes to the financial statements
Note 26. Provisions, contingent liabilities, contingent assets and credit commitments
Accounting policy
Provisions
Provisions are recognised for present obligations arising from past events where a payment (or other economic transfer) is likely to be necessary to settle the obligation and can be reliably estimated.
Employee benefits – long service leave provision
Long service leave is granted to certain employees in Australia and New Zealand. The provision is calculated based on the expected payments. When payments are expected to be more than one year in the future, the payments factor in expected employee service periods and average salary increases are then discounted.
Employee benefits – annual leave and other employee benefits provision
The provision for annual leave and other employee benefits (including wages and salaries, inclusive of non-monetary benefits, and any associated on-costs (e.g. payroll tax)) is calculated based on expected payments.
Provision for ECL on credit commitments
The Group is committed to provide facilities and guarantees as explained below. If it is probable that a facility will be drawn and the resulting asset will be less than the drawn amount then a provision for impairment is recognised. The provision for ECL is calculated using the methodology described in Note 13.
Compliance, Regulation and Remediation provisions
The compliance, regulation and remediation provisions relate to matters of potential misconduct in providing services to our customers identified both as a result of regulatory action and internal reviews. An assessment of the likely cost of these matters to the Group (including applicable customer refunds) is made on a case-by-case basis and specific provisions are made where appropriate.
Contingent liabilities
Contingent liabilities are possible obligations whose existence will be confirmed only by uncertain future events, and present obligations where the transfer of economic resources is not probable or cannot be reliably measured. Contingent liabilities are not recognised in the balance sheet but are disclosed unless the outflow of economic resources is remote.
Undrawn credit commitments
The Group enters into various arrangements with customers which are only recognised in the balance sheet when called upon. These arrangements include commitments to extend credit, bill endorsements, financial guarantees, standby letters of credit and underwriting facilities.
Contingent assets
Contingent assets are possible assets whose existence will be confirmed only by uncertain future events. Contingent assets are not recognised in the balance sheet but are disclosed if an inflow of economic benefits is probable.
Critical accounting assumptions and estimates
The financial reporting of provisions for litigation and non-lending losses and for compliance, regulation and remediation matters involves a significant degree of judgement in relation to identifying whether a present obligation exists and also in estimating the probability, timing, nature and quantum of the outflows that may arise from past events. These judgements are made based on the specific facts and circumstances relating to individual events. Specific judgements in respect of material items are included in the discussion below.
Provisions carried for long service leave are supported by an independent actuarial report.
Notes to the financial statements

2373 FIN
AN
CIA
L STATE
ME
NTS
2 GR
OU
P P
ER
FOR
MA
NC
E1 STR
ATE
GIC
RE
PO
RT
4 SH
AR
EH
OLD
ER
INFO
RM
ATIO
NWESTPAC GROUP 2021 ANNUAL REPORT
Notes to the financial statements
Provisions
Annual leave Litigation Provision for Compliance,
Long and other and non- ECL Lease Restructuring regulation and
service employee lending on credit restoration and other remediation$m leave benefits losses commitments obligations provisions provisions Total
Consolidated
Balance as at 30 September 2020 511 596 1,371 530 208 176 1,895 5,287
Additions 92 986 155 - 4 371 889 2,497
Utilisation (42) (743) (1,377) - (11) (121) (1,308) (3,602)
Reversal of unutilised provisions (22) (25) (27) (127) - (50) (316) (567)
Transferred to purchaser on settlement of assets and liabilities held for sale (1) - (4) - - - (4) (9)
Balances reclassified to liabilities held for sale (Note 37) (7) (11) (1) (2) - - (14) (35)
Balance as at 30 September 2021 531 803 117 401 201 376 1,142 3,571
Parent Entity
Balance as at 30 September 2020 482 540 1,343 479 179 142 1,818 4,983
Additions 92 936 150 - 2 363 716 2,259
Utilisation (40) (711) (1,364) - (9) (103) (1,257) (3,484)
Reversal of unutilised provisions (22) (25) (15) (125) - (29) (281) (497)
Balances reclassified to liabilities held for sale (Note 37) (4) (1) - (2) - - - (7)
Balance as at 30 September 2021 508 739 114 352 172 373 996 3,254
Legislative liabilities
The Group had the following assessed liabilities as at 30 September 2021:
• $22 million (2020: $22 million) based on an actuarial assessment as a self-insurer under the Workers’ Compensation Act 1987 and the Workplace Injury Management and Workers’ Compensation Act 1998 (New South Wales);
• $7 million (2020: $7 million) based on actuarial assessment as a self-insurer under the Accident Compensation Act 1985 (Victoria);
• $7 million (2020: $6 million) based on actuarial assessment as a self-insurer under the Workers’ Rehabilitation and Compensation Act 1986 (South Australia);
• $1 million (2020: $1 million) based on an actuarial assessment as a self-insurer under the Workers’ Compensation and Rehabilitation Act 2003 (Queensland);
• $nil (2020: $nil) based on an actuarial assessment as a self-insurer under the Workers’ Compensation Act 1951 (Australian Capital Territory);
• $nil (2020: $nil) based on an actuarial assessment as a self-insurer under the Return to Work Act 1986 (Northern Territory);
• $1 million (2020: $1 million) based on an actuarial assessment as a self-insurer under the Workers’ Compensation and Injury Management Act 1981 (Western Australia); and
• $1 million (2020: $1 million) based on an actuarial assessment as a self-insurer under the Workers’ Rehabilitation and Compensation Act 1988 (Tasmania).
Adequate provision has been made for these liabilities in the provision for annual leave and other employee benefits above.
Note 26. Provisions, contingent liabilities, contingent assets and credit commitments (continued)

238 WESTPAC GROUP 2021 ANNUAL REPORT
Notes to the financial statements
Provisions
Litigation and non-lending loss provisions
At 30 September 2020 the Group held a provision for penalties in relation to the AUSTRAC civil proceedings of $1,300 million. This penalty has subsequently been paid.
Compliance, regulation and remediation provisions
Provisions for 2021 in respect of compliance, regulation and remediation include estimates of:
• customer refunds associated with matters of potential historical misconduct;
• costs of completing remediation programs; and
• potential non-lending losses and costs connected with certain litigation and regulatory investigations.
The provisions held include estimated customer refunds and program costs associated with the following major customer remediation programs:
• certain ongoing advice service fees charged by the Group’s salaried financial planners; and
• certain ongoing advice service fees charged by authorised representatives of the Group’s wholly owned subsidiaries Securitor Financial Group Limited and Magnitude Group Pty Ltd.
During the year, significant progress has been made towards finalising a number of the Group’s major remediation programs, including those noted above relating to ongoing advice services. Given the progress made, the degree of estimation uncertainty inherent in these major remediation provisions has reduced significantly.
It is possible that the final outcome could be below or above the provision, if the actual outcome differs from the assumptions used in estimating the provision. Remediation processes may change over time as further facts emerge and such changes could result in a change to the final exposure.
Certain litigation and regulatory investigations
At 30 September 2021, the Group held provisions in respect of potential non-lending losses and costs connected with certain litigation and regulatory investigations including:
• ASIC proceedings in the Federal Court of Australia against Westpac in relation to the sale of consumer credit insurance (CCI) products to customers;
• a class action against BTFM and WLIS in the Federal Court of Australia in relation to aspects of BTFM’s BT Super for Life former cash investment option;
• ASIC’s investigation into the continued charging of advice service fees to customer accounts following the death of the relevant account holder;
• ASIC’s investigation into the sale and assignment of credit card and flexi loan debts to third party debt purchasers;
• ASIC’s investigation into Westpac’s systems and processes in relation to accounts held by deregistered companies and Westpac’s approach to rectification and remediation of the relevant issues;
• ASIC’s investigation into the adequacy of disclosure of contributions fees charged for certain of our products and services;
• ASIC’s investigation into the provision of home and contents insurance, including where some customers received duplicate policies or were issued policies without their consent; and
• ASIC’s investigation into arrangements concerning the provision of insurance to some superannuation customers (including the charging of adviser insurance commissions in superannuation).
Westpac is working with ASIC to accelerate the closure of the investigations described above, which is expected to involve Court proceedings.
Provisions for these matters have been recognised in circumstances where there remains considerable uncertainty as to the expenses that may be associated with each matter and, in particular, the approach a Court may take in assessing any appropriate penalties or damages. This includes where the parties may agree a proposed penalty or settlement amount and submit it to the Court on an agreed basis (which the Court would have regard to but not be obliged to accept). The actual aggregate expense to Westpac associated with either the agreed or court determined resolution of the matters may be materially higher or lower than the provision.
Restructuring provisions
The Group carries restructuring provisions in relation to changes in business restructures primarily for separation and redundancy costs. The primary increase in the current year relates to business sales entered into or completed during the year. Refer to Note 37 for further details.
Note 26. Provisions, contingent liabilities, contingent assets and credit commitments (continued)

2393 FIN
AN
CIA
L STATE
ME
NTS
2 GR
OU
P P
ER
FOR
MA
NC
E1 STR
ATE
GIC
RE
PO
RT
4 SH
AR
EH
OLD
ER
INFO
RM
ATIO
NWESTPAC GROUP 2021 ANNUAL REPORT
Notes to the financial statements
Lease restoration obligations
The addition to the lease restoration provision reflects a reassessment of the cost of making good leasehold premises at the end of the Group’s property leases. The increase in the expected make-good cost has been treated as an addition to the right-of-use asset and is being depreciated over the remaining life of those assets.
Contingent liabilities
Contingent liabilities are possible obligations whose existence will be confirmed only by uncertain future events and present obligations where the transfer of economic resources is not probable or cannot be reliably measured. Contingent liabilities are not recognised on the balance sheet but are disclosed unless the outflow of economic resource is remote.
Regulatory investigations, reviews and inquiries
Regulators, statutory authorities and other bodies routinely conduct investigations, reviews and inquiries involving the financial services sector, both in Australia and overseas. These regulatory actions may consider a range of subject matters, and in Australia, a number of regulatory investigations and reviews are currently considering potential misconduct in relation to credit and financial services. Matters the subject of regulatory reviews are also assessed for their impact on customers, with customer remediation undertaken where appropriate in accordance with our Westpac Group Customer Remediation Policy.
Domestic regulators such as ASIC, APRA, ACCC, AUSTRAC, the OAIC, the ATO and the Fair Work Ombudsman, as well as certain international regulators such as the Reserve Bank of New Zealand, Financial Markets Authority and Commerce Commission in New Zealand and Hong Kong Monetary Authority are currently conducting investigations covering a range of matters involving the Group, that may include potential civil and criminal contraventions.
These include:
• investigations by the OAIC in relation to certain practices and systems for compliance with the Privacy Act 1988 (Cth);
• the provision of superannuation (including the adequacy of arrangements for the provision of written reasons to complainants about the payment of death benefits, insurance in superannuation and compliance with the Superannuation Industry (Supervision) Act 1993 in connection with MySuper investment performance); and
• other areas such as: risk governance; RBNZ liquidity policy and associated risk culture; credit portfolio management; prudential standards compliance; and anti-money laundering and counter-terrorism financing processes and procedures.
It is uncertain what (if any) actions will result following the conclusion of the investigations set out above. No provisions have yet been made in relation to any financial penalty that might arise in the event proceedings are pursued in relation to the matters outlined above, as any potential future liability of that kind cannot be reliably estimated at this time.
These investigations may result (or have resulted) in litigation (including class action proceedings and criminal proceedings), significant fines and penalties, infringement notices, enforceable undertakings, referral to the relevant Commonwealth or State Director of Public Prosecutions for consideration for criminal prosecution, imposition of capital or liquidity requirements, licence revocation or variation, or other action being taken by regulators or other parties. Given the size of Westpac, these investigations have in some instances resulted, and could in the future result, in findings of a significant number of breaches of obligations. This in turn could lead to significant financial and other penalties.
Litigation
There are ongoing Court proceedings, claims and possible claims for and against the Group. Contingent liabilities exist in respect of actual and potential claims and proceedings, including those listed below. An assessment of the Group’s likely loss has been made on a case-by-case basis for the purpose of the financial statements but cannot always be reliably estimated, including in relation to those listed below. No provision has been recognised for potential losses that may arise in relation to the matters below because liability is not certain and cannot be reliably estimated.
Regulatory litigation
• On 5 May 2021, ASIC filed civil proceedings against Westpac alleging that it had engaged in insider trading and unconscionable conduct, and had failed to comply with its Australian Financial Services Licence obligations. The allegations relate to interest rate hedging activity during the course of Westpac’s involvement in the 2016 Ausgrid privatisation transaction. Westpac has filed its Response to ASIC’s Concise Statement.
Note 26. Provisions, contingent liabilities, contingent assets and credit commitments (continued)

240 WESTPAC GROUP 2021 ANNUAL REPORT
Notes to the financial statements
Class actions
• Westpac is defending a class action proceeding which was commenced in December 2019 in the Federal Court of Australia on behalf of certain investors who acquired an interest in Westpac securities between 16 December 2013 and 19 November 2019. The proceeding involves allegations relating to market disclosure issues connected to Westpac’s monitoring of financial crime over the relevant period and matters which were the subject of the recent AUSTRAC proceedings. The damages sought are unspecified. However, given the time period in question and the nature of the claims, it is likely that any alleged damages will be significant.
• On 28 February 2020, a class action was commenced against Westpac, Westpac General Insurance Limited and WLIS in the Federal Court of Australia in relation to Westpac’s sale of CCI. The claim follows other industry class actions. It is alleged that the three entities failed to adhere to a number of obligations in selling CCI in conjunction with credit cards, personal loans and flexi loans. The damages sought are unspecified. The three entities are defending the proceedings.
• On 16 July 2020, a class action was commenced against Westpac and St.George Finance Limited (SGF) in the Supreme Court of Victoria in relation to flex commissions paid to auto dealers from 1 March 2013 to 31 October 2018. This proceeding is one of two class actions commenced against a number of lenders in the auto finance industry. It is alleged that Westpac and SGF are liable for the unfair conduct of dealers acting as credit representatives and engaged in misleading or deceptive conduct. The damages sought are unspecified. Westpac and SGF are defending the proceedings. Another law firm publicly announced in July 2020 that it is preparing to commence a class action against Westpac entities for similar conduct. Westpac has not been served with a claim from that law firm on flex commissions. Westpac has not paid flex commissions since 1 November 2018 following an industry-wide ban issued by ASIC.
Westpac is aware from media reports and other publicly available material that other class actions against Westpac entities are being investigated. In July 2020, a law firm publicly stated that it intends to commence a class action against BTFM alleging that since 2014, BTFM did not act in the best interests of members of certain superannuation funds when obtaining group insurance policies. In August 2020, another law firm announced that it is investigating claims on behalf of persons who in the past six years acquired, renewed or continued to hold a financial product (including life insurance) on the advice or recommendation of a financial adviser from Magnitude Group, Securitor Financial Group or Westpac. Westpac has not been served with a claim in relation to either of these matters and has no further information about the proposed claims beyond the public statements issued by the law firms involved.
Exposures relating to divested businesses
The Group has potential exposures relating to warranties, indemnities and other commitments it has provided to other parties in connection with various divestments of businesses and assets and other transactions. The warranties, indemnities and other commitments cover a range of matters and risks, including certain compliance, regulatory investigations and litigation matters outlined in this Note 26.
Internal reviews and remediation
As in prior periods, Westpac is continuing to undertake a number of reviews to identify and resolve issues that have the potential to impact our customers, employees, other relevant stakeholders and reputation. These internal reviews continue to identify a number of issues in respect of which we are taking steps or will take steps to put things right so that our customers and employees (as applicable) are not disadvantaged from certain past practices, including making compensation/remediation payments and providing refunds where identified. These issues include, among other things, compliance with lending obligations (including responsible lending), payroll processes, regulatory reporting, compliance with client monies requirements and impacts from inadequate product governance including the way some product terms and conditions are operationalised.
The Group’s APRA regulated insurer WLIS is reviewing premium increases on certain life insurance products following a number of customer complaints. This review relates to Product Disclosure Statements for life insurance products issued in the years 2010 to 2017. This is a complex review where the outcomes are currently uncertain. As such, there is a risk that customer remediation may be required in the future in relation to prior premium increases. The review will also consider the premium increases that can and should be made in the future, and there is a risk that the outcomes of the review could impact the financial and/or capital position of WLIS.
In addition, our New Zealand business is reviewing its processes for some products relating to the requirements of the New Zealand Credit Contracts and Consumer Finance Act 2003. The outcome of this complex review is uncertain and could result in customer remediation, regulatory action and litigation.
By undertaking these reviews, we can also improve our processes and controls. An assessment of the Group’s likely loss has been made on a case-by-case basis for the purpose of the financial statements but cannot always be reliably estimated. Contingent liabilities may exist in respect of actual or potential claims or proceedings (which could be brought by customers, regulators or criminal prosecutors), compensation/remediation payments and/or refunds identified as part of these reviews.
Note 26. Provisions, contingent liabilities, contingent assets and credit commitments (continued)

2413 FIN
AN
CIA
L STATE
ME
NTS
2 GR
OU
P P
ER
FOR
MA
NC
E1 STR
ATE
GIC
RE
PO
RT
4 SH
AR
EH
OLD
ER
INFO
RM
ATIO
NWESTPAC GROUP 2021 ANNUAL REPORT
Notes to the financial statements
Australian Financial Complaints Authority
Contingent liabilities may also exist in relation to customer complaints brought before the Australian Financial Complaints Authority (AFCA). AFCA has the power to make determinations about complaints and can award compensation up to certain thresholds. AFCA has a broader jurisdiction than previous dispute resolution bodies which it has replaced.
Financial Claims Scheme
Under the Financial Claims Scheme (FCS), the Australian Government provides depositors a free guarantee of deposits in eligible ADIs up to and including $250,000. The FCS applies to an eligible ADI if APRA has applied for the winding up of the ADI and the responsible Australian Government minister has declared that the FCS applies to the ADI.
The Financial Claims Scheme (ADIs) Levy Act 2008 (Cth) provides for the imposition of a levy to fund the excess of certain APRA FCS costs connected to an ADI, including payments by APRA to deposit holders in a failed ADI. The levy would be imposed on liabilities of eligible ADIs to their depositors and cannot be more than 0.5% of the amount of those liabilities. A contingent liability may exist in respect of any levy imposed under the FCS.
Contingent tax risk
Tax and regulatory authorities in Australia and in other jurisdictions are reviewing the taxation treatment of certain transactions (both historical and present-day transactions) undertaken by the Group in the course of normal business activities and the claiming of tax incentives and indirect taxes such as GST. The Group also responds to various notices and requests for information it receives from tax and regulatory authorities.
These reviews, notices and requests may result in additional tax liabilities (including interest and penalties).
The Group has assessed these and other taxation claims arising in Australia and elsewhere, including seeking independent advice.
Settlement risk
The Group is subject to a credit risk exposure in the event that another counterparty fails to settle for its payments clearing activities (including foreign exchange). The Group seeks to minimise credit risk arising from settlement risk in the payments system by aligning our processing method with the legal certainty of settlement in the relevant clearing mechanism.
Parent Entity guarantees and undertakings
The Parent Entity makes the following guarantees and undertakings to subsidiaries:
• letters of comfort for certain subsidiaries which recognise that Westpac has a responsibility that those subsidiaries continue to meet their obligations; and
• guarantees to certain wholly owned subsidiaries which are Australian financial services or credit licensees to comply with legislative requirements. All but two guarantees are capped at $20 million per year (with an automatic reinstatement for another $20 million) and two specific guarantees are capped at $2 million (with an automatic reinstatement for another $2 million).
Note 26. Provisions, contingent liabilities, contingent assets and credit commitments (continued)

242 WESTPAC GROUP 2021 ANNUAL REPORT
Notes to the financial statements
Undrawn credit commitments
The Group enters into various arrangements with customers which are only recognised in the balance sheet when called upon. These arrangements include commitments to extend credit, bill endorsements, financial guarantees, standby letters of credit and underwriting facilities.
They expose the Group to liquidity risk when called upon and also to credit risk if the customer fails to repay the amounts owed at the due date. The maximum exposure to credit loss is the contractual or notional amount of the instruments. Some of the arrangements can be cancelled by the Group at any time and a significant portion is expected to expire without being drawn. The actual liquidity and credit risk exposure varies in line with amounts drawn and may be less than the amounts disclosed.
The Group uses the same credit policies when entering into these arrangements as it does for on-balance sheet instruments. Refer to Note 21 for further details of liquidity risk and credit risk management.
Undrawn credit commitments excluding derivatives are as follows:
Consolidated Parent Entity$m 2021 2020 2021 2020
Undrawn credit commitments
Letters of credit and guarantees1 11,323 12,610 10,796 12,069
Commitments to extend credit2 188,768 184,064 163,685 159,644
Other - 267 - 266
Total undrawn credit commitments3 200,091 196,941 174,481 171,979
Contingent assets
The credit commitments shown in the table above also constitute contingent assets. These commitments would be classified as loans in the balance sheet on the contingent event occurring.
1. Standby letters of credit are undertakings to pay, against presentation documents, an obligation in the event of a default by a customer. Guarantees are unconditional undertakings given to support the obligations of a customer to third parties. The Group may hold cash as collateral for certain guarantees issued.
2. Commitments to extend credit include all obligations on the part of the Group to provide credit facilities. As facilities may expire without being drawn upon, the notional amounts do not necessarily reflect future cash requirements. In addition to the commitments disclosed above, at 30 September 2021 the Group had offered $9.7 billion (2020: $4.9 billion) of facilities to customers, which had not yet been accepted.
3. Include $0.8 billion (2020: nil) of undrawn credit commitments related to facilities which are held for sale.
Note 26. Provisions, contingent liabilities, contingent assets and credit commitments (continued)
2433 FIN
AN
CIA
L STATE
ME
NTS
2 GR
OU
P P
ER
FOR
MA
NC
E1 STR
ATE
GIC
RE
PO
RT
4 SH
AR
EH
OLD
ER
INFO
RM
ATIO
NWESTPAC GROUP 2021 ANNUAL REPORT
Notes to the financial statements
CAPITAL AND DIVIDENDS
Note 27. Shareholders’ equity
Accounting policy
Share capital
Ordinary shares are recognised at the amount paid up per ordinary share, net of directly attributable issue costs. Treasury shares are shares in the Parent Entity, purchased by the Parent Entity or other entities within the Group. These shares are adjusted against share capital as the net of the consideration paid to purchase the shares and, where applicable, any consideration received from the subsequent sale or reissue of these shares.
Non-controlling interests
Non-controlling interests represent the share in the net assets of subsidiaries attributable to equity interests that are not owned directly or indirectly by the Parent Entity.
Reserves
Foreign currency translation reserve
Exchange differences arising on translation of the Group’s foreign operations, and any offsetting gains or losses on hedging the net investment are reflected in the foreign currency translation reserve. A cumulative credit balance in this reserve would not normally be regarded as being available for payment of dividends until such gains are realised and recognised in the income statement on sale or disposal of the foreign operation.
Debt securities at FVOCI reserve
This reserve comprises the changes in fair value of debt securities measured at FVOCI (except for interest income, impairment charges and FX gains and losses which are recognised in the income statement), net of any related hedge accounting adjustments and tax. These changes are transferred to non-interest income in the income statement when the asset is disposed.
Equity securities at FVOCI reserve
This reserve comprises the changes in fair value of equity securities measured at FVOCI, net of tax. These changes are not transferred to the income statement when the asset is disposed.
Cash flow hedge reserve
This comprises the fair value gains and losses associated with the effective portion of designated cash flow hedging instruments, net of tax.
Share-based payment reserve
This comprises the fair value of equity-settled share-based payments recognised as an expense.
Other reserves
Other reserves for the Parent Entity relate to certain historic internal group restructurings performed at fair value. The reserve is eliminated on consolidation.
Other reserves for the Group consist of transactions relating to changes in the Parent Entity’s ownership of a subsidiary that do not result in a loss of control.
The amount recorded in other reserves reflects the difference between the amount by which NCI are adjusted and the fair value of any consideration paid or received.
Notes to the financial statements

244 WESTPAC GROUP 2021 ANNUAL REPORT
Notes to the financial statements
Consolidated Parent Entity$m 2021 2020 2021 2020
Share capital
Ordinary share capital, fully paid 41,601 40,509 41,601 40,509
RSP treasury shares1 (661) (618) (661) (618)
Other treasury shares2 55 55 (3) (3)
Total treasury shares (606) (563) (664) (621)
Total share capital 40,995 39,946 40,937 39,888
NCI 57 51 - -
Ordinary shares
Westpac does not have authorised capital and the ordinary shares have no par value. Ordinary shares entitle the holder to participate in dividends and, in the event of Westpac winding up, to a share of the proceeds in proportion to the number of and amounts paid on the shares held.
Each ordinary share entitles the holder to one vote, either in person or by proxy, at a shareholder meeting.
Reconciliation of movement in number of ordinary shares Consolidated and Parent Entity(number) 2021 2020
Opening balance 3,611,684,870 3,489,928,773
Share issuances3 - 110,919,861
Dividend reinvestment plan4 20,213,205 10,836,236
Dividend reinvestment plan underwrite5 36,693,733 -
Closing balance 3,668,591,808 3,611,684,870
Ordinary shares purchased on-market2021
Consolidated and Parent Entity Number Average Price ($)
For share-based payment arrangements:
Employee share plan (ESP) 1,178,527 19.09
RSP6 2,052,825 21.09
Westpac Performance Plan (WPP) - share rights exercised 231,913 21.89
Total number of ordinary shares purchased on-market 3,463,265
For details of the share-based payment arrangements refer to Note 32.
1. 2021: 4,363,329 unvested shares held (2020: 4,588,277).2. 2021: nil shares held (2020: nil).3. The average price per share for the share issuance in 2020 was $24.81.4. The DRP for the 2021 interim dividend had no impact on the number of ordinary shares on issue as Westpac arranged for the purchase
of the necessary shares from the market and transfer to participants of 9,085,937 ordinary shares at an average price of $25.98. The price per share for the issuance of shares in relation to the dividend reinvestment plan for the 2020 final dividend was $19.83 (2020: 2019 final dividend was $25.17).
5. The Group entered into an arrangement to fully underwrite the 2020 final dividend, referred to as a DRP underwrite. The arrangement ensured that the capital impact of the dividend was negated as new shares of equivalent value to the amount of dividend that was paid to shareholders in cash were purchased by the DRP underwriter. The price per share for the issuance of shares in relation to the 2020 DRP underwrite was $19.59.
6. Ordinary shares allocated to employees under the RSP are classified as treasury shares until the shares vest.
Note 27. Shareholders’ equity (continued)

2453 FIN
AN
CIA
L STATE
ME
NTS
2 GR
OU
P P
ER
FOR
MA
NC
E1 STR
ATE
GIC
RE
PO
RT
4 SH
AR
EH
OLD
ER
INFO
RM
ATIO
NWESTPAC GROUP 2021 ANNUAL REPORT
Notes to the financial statements
Reconciliation of movement in reserves Consolidated Parent Entity
$m 2021 2020 2021 2020
Debt securities at FVOCI reserve
Balance as at beginning of year 177 (22) 125 (25)
Net gains/(losses) from changes in fair value 578 360 730 292
Income tax effect (177) (96) (220) (77)
Transferred to income statements (195) (79) (195) (79)
Income tax effect 58 15 58 15
Loss allowance on debt securities measured at FVOCI 2 2 2 2
Exchange differences - (3) (1) (3)
Balance as at end of year 443 177 499 125
Equity securities at FVOCI reserve
Balance as at beginning of year (4) 17 - (1)
Net gains/(losses) from changes in fair value 50 (21) (2) 1
Income tax effect (2) - - -
Balance as at end of year 44 (4) (2) -
Share-based payment reserve
Balance as at beginning of year 1,720 1,642 1,611 1,533
Share-based payment expense 86 78 86 78
Balance as at end of year 1,806 1,720 1,697 1,611
Cash flow hedge reserve
Balance as at beginning of year (42) (129) 20 (65)
Net gains/(losses) from changes in fair value 296 (95) 177 (28)
Income tax effect (86) 28 (53) 9
Transferred to income statements 39 218 (13) 150
Income tax effect (11) (64) 4 (46)
Balance as at end of year 196 (42) 135 20
Foreign currency translation reserve
Balance as at beginning of year (292) (179) (221) (145)
Exchange differences on translation of foreign operations 249 (177) 40 (148)
Gains/(losses) on net investment hedges (198) 9 (41) 17
Transferred to income statements - 55 - 55
Balance as at end of year (241) (292) (222) (221)
Other reserves
Balance as at beginning of year (15) (18) 41 41
Transactions with owners (6) 3 - -
Balance as at end of year (21) (15) 41 41
Total reserves 2,227 1,544 2,148 1,576
Note 27. Shareholders’ equity (continued)

246 WESTPAC GROUP 2021 ANNUAL REPORT
Notes to the financial statements
Note 28. Capital adequacy
APRA measures an ADI’s regulatory capital using three measures:Level of capital Definition
Common Equity Tier 1 Capital (CET1) Comprises the highest quality components of capital that consists of paid-up share capital, retained profits and certain reserves, less certain intangible assets, capitalised expenses and software, and investments and retained profits in insurance and funds management subsidiaries that are not consolidated for capital adequacy purposes.
Tier 1 Capital The sum of CET 1 and AT1 Capital. AT1 Capital comprises high quality components of capital that consist of certain securities not included in CET 1, but which include loss absorbing characteristics.
Total Regulatory Capital The sum of Tier 1 Capital and Tier 2 Capital. Tier 2 Capital includes subordinated instruments and other components of capital that, to varying degrees, do not meet the criteria for Tier 1 Capital, but nonetheless contribute to the overall strength of an ADI and its capacity to absorb losses.
Under APRA’s Prudential Standards, Australian ADIs, including Westpac, are required to maintain a minimum CET1 ratio of at least 4.5%, Tier 1 Capital ratio of at least 6.0% and Total Regulatory Capital ratio of at least 8.0%. APRA may also require ADIs, including Westpac, to meet Prudential Capital Requirements (PCRs) above the industry PCRs. APRA does not allow the PCRs for individual ADIs to be disclosed.
APRA also requires ADIs to hold additional CET1 buffers comprising of:• a capital conservation buffer (CCB) of 3.5% for ADIs designated by APRA as domestic systemically important
banks (D-SIBs) unless otherwise determined by APRA, which includes a 1.0% surcharge for D-SIBs. APRA has determined that Westpac is a D-SIB; and
• a countercyclical capital buffer. The countercyclical buffer is set on a jurisdictional basis and APRA is responsible for setting the requirement in Australia. The countercyclical buffer requirement is currently set to zero for Australia and New Zealand.
Collectively, the above buffers are referred to as the “Capital Buffer” (CB). Should the CET 1 capital ratio fall within the capital buffer range restrictions on the distributions of earnings will apply. This includes restrictions on the amount of earnings that can be distributed through dividends, AT1 Capital distributions and discretionary staff bonuses.
APRA announcements on capital
APRA made the following announcements relevant to its capital framework:
• On 19 July 2021 APRA announced regulatory support for banks offering temporary financial assistance to borrowers impacted by COVID-191. APRA has outlined that for eligible borrowers, ADIs do not need to treat the period of deferral as a period of arrears or loan restructuring. This applied to loans granted a repayment deferral of up to three months before the end of September 20212. ADIs must continue to provision for these loans under accounting standards.
• APRA has released the final revised standard for APS 111 Capital Adequacy: Measurement of Capital, effective from 1 January 20223. The final standard includes changes to the parent ADI’s (Level 1) treatment of equity investments in banking and insurance subsidiaries including:
– Equity investments in subsidiaries (including any Additional Tier 1 and Tier 2 capital investments in subsidiaries) will be risk weighted at 250%, up to a limit of 10% of Level 1 CET1 capital per investment; and
– Any equity investments in excess of the 10% limit will be fully deducted from Level 1 CET1 capital in determining Level 1 capital ratios.
• APRA is proposing changes to embed the ‘unquestionably strong’ level of capital in the capital framework, including implementation of Basel III reforms. On 21 July 2021 APRA released further guidance on capital buffers and the calculation of RWA including for specific asset classes4. As part of the proposal, APRA intends to increase the capital conservation buffer from 2.5% to 4.0% and introduce a base level for the countercyclical capital buffer of 1.0%. As a result, the CET1 capital ratio requirement for D-SIBs is proposed to increase from 8% to 10.5% from 1 January 2023. We expect further clarity on the changes ahead of 1 January 2023.
1. APRA announcement – “APRA announces further regulatory support for loans impacted by COVID-19” dated 19 July 2021.2. Letter to all authorised deposit taking institutions – “Regulatory support for loans impacted by COVID-19” dated 25 August 2021.3. Letter to all authorised deposit taking institutions – “Final revised Prudential Standard: APS 111 Capital Adequacy - Measurement of
Capital” dated 5 August 2021.4. Letter to all authorised deposit taking institutions – “Bank Capital Reforms: Update” dated 21 July 2021.

2473 FIN
AN
CIA
L STATE
ME
NTS
2 GR
OU
P P
ER
FOR
MA
NC
E1 STR
ATE
GIC
RE
PO
RT
4 SH
AR
EH
OLD
ER
INFO
RM
ATIO
NWESTPAC GROUP 2021 ANNUAL REPORT
Notes to the financial statements
• On 10 September 2021, APRA announced it expects ADIs to reduce their Committed Liquidity Facility (CLF) usage to zero by 31 December 20221. Westpac’s current CLF allocation is $37 billion. Westpac expects to reduce its allocation in line with APRA’s announcement, and to meet its liquidity requirements by increasing its holdings of High Quality Liquid Assets.
Capital management strategy
Westpac’s approach to capital management seeks to ensure that it is adequately capitalised as an ADI. Westpac evaluates its approach to capital management through an Internal Capital Adequacy Assessment Process (ICAAP), the key features of which include:
• the development of a capital management strategy, including consideration of regulatory minimums, capital buffers and contingency plans. The current regulatory capital minimums together with the capital conservation buffer (CCB) are the Total CET1 Requirement. The Total CET1 Requirement for Westpac is at least 8.0%, based on an industry minimum CET1 requirement of 4.5% plus a capital buffer of at least 3.5% applicable to D-SIBs2,3;
• consideration of both regulatory and economic capital requirements;
• a stress testing framework that challenges the capital measures, coverage and requirements including the impact of adverse economic scenarios; and
• consideration of the perspectives of external stakeholders including rating agencies as well as equity and debt investors.
Given the above and in light of proposed changes to APRA’s capital management framework under which the CET1 capital ratio requirement for D-SIBs is to increase from 8% to 10.5% (including the capital conservation buffer and the countercyclical capital buffer), Westpac will seek to operate with a CET1 capital ratio above 10.5% as measured under the existing capital framework4. Capital settings may be reviewed if more challenging or uncertain conditions emerge, or if APRA’s proposals change significantly.
Note 29. Dividends
Consolidated Parent Entity$m 2021 2020 2019 2021 2020
Dividends not recognised at year end
Since year end the Directors have proposed the following dividends:
Final dividend 60 cents per share (2020: 31 cents, 2019: 80 cents) all fully franked at 30% 2,201 1,120 2,791 2,201 1,120
Total dividends not recognised at year end 2,201 1,120 2,791 2,201 1,120
The Board has determined a final fully franked dividend of 60 cents per share, to be paid on 21 December 2021 to shareholders on the register at the record date of 8 November 2021.
Shareholders can choose to receive their dividends as cash or reinvest for an equivalent number of shares under the Dividend Reinvestment Plan (DRP).
The Board has determined to satisfy the DRP for the 2021 final dividend by arranging for the purchase of shares in the market by a third party. The market price used to determine the number of shares allocated to DRP participants will be set over the 10 trading days commencing 11 November 2021 and will not include a discount.
Details of dividends recognised during the year are provided in the statement of changes in equity.
Westpac has announced an off-market buy-back of up to $3.5 billion worth of Westpac shares. Westpac’s operating performance and progress on strategic priorities, including the completion of a number of divestments, have contributed to a strong capital position, allowing Westpac to return capital to shareholders.
Australian franking credits available to the Parent Entity for subsequent years are $3,857 million (2020: $3,448 million, 2019: $1,558 million). This is calculated as the year end franking credit balance, adjusted for the Australian current tax liability and the proposed 2021 final dividend.
New Zealand imputation creditsNew Zealand imputation credits of NZ$ 0.07 (2020: NZ$0.07, 2019: NZ$0.07) per share will be attached to the proposed 2021 final dividend. New Zealand imputation credits available to the Parent Entity for subsequent years are NZ$820 million (2020: NZ$980 million, 2019: NZ$860 million). This is calculated on the same basis as the Australian franking credits but using the New Zealand current tax liability.
1. Letter to locally incorporated LCR authorised deposit taking institutions – “Committed Liquidity Facility update” dated 10 September 2021.
2. Noting that APRA may apply higher CET1 requirements for an individual ADI.3. If an ADI’s CET1 ratio falls below the Total CET1 Requirement (at least 8%), they face restrictions on the distribution of earnings, such
as dividends, distribution payments on AT1 capital instruments and discretionary staff bonuses.4. Allowing for quarterly volatility of capital ratios due to the half yearly cycle of ordinary dividend payments.
Note 28. Capital adequacy (continued)

248 WESTPAC GROUP 2021 ANNUAL REPORT
Notes to the financial statements
GROUP STRUCTURE
Note 30. Investments in subsidiaries and associates
Accounting policy
Subsidiaries
Westpac’s subsidiaries are entities which it controls and consolidates as it is exposed to, or has rights to, variable returns from the entity, and can affect those returns through its power over the entity.
When the Group ceases to control a subsidiary, any retained interest in the entity is remeasured to fair value, with any resulting gain or loss recognised in the income statement.
Changes in the Group’s ownership interest in a subsidiary which do not result in a loss of control are accounted for as transactions with equity holders in their capacity as equity holders.
In the Parent Entity’s financial statements, investments in subsidiaries are initially recorded at cost and are subsequently held at the lower of cost and recoverable amount.
All transactions between Group entities are eliminated on consolidation.
Associates
Associates are entities in which the Group has significant influence, but not control, over the operating and financial policies. The Group accounts for associates using the equity method. The investments are initially recognised at cost (except where recognised at fair value due to a loss of control of a subsidiary), and increased (or decreased) each year by the Group’s share of the associate’s profit (or loss). Dividends received from the associate reduce the investment in associate.
Overseas companies predominantly carry on business in the country of incorporation. For unincorporated entities, ‘Country of incorporation’ refers to the country where business is carried on. The financial years of all controlled entities are the same as that of Westpac unless otherwise stated. From time to time, the Group consolidates a number of unit trusts where the Group has variable returns from its involvement with the trusts, and has the ability to affect those returns through its power over the trusts. These unit trusts are excluded from the table.
The following table includes the principal controlled entities of the Group as at 30 September 2021.
Name
Country of
incorporation Name
Country of
incorporation
Advance Asset Management Limited Australia Westpac Financial Services Group Limited Australia
Asgard Capital Management Limited Australia Westpac Life Insurance Services Limited1 Australia
BT Financial Group Pty Limited Australia Westpac Overseas Holdings No. 2 Pty Limited Australia
BT Funds Management Limited Australia Westpac Securitisation Holdings Pty Limited Australia
BT Portfolio Services Limited Australia Westpac Life-NZ-Limited1 New Zealand
Capital Finance Australia Limited Australia Westpac New Zealand Group Limited New Zealand
Crusade Trust No.2P of 2008 Australia Westpac New Zealand Limited (WNZL) New Zealand
Reinventure Fund, I.L.P. Australia Westpac NZ Covered Bond Limited2 New Zealand
Series 2008-1M WST Australia Westpac NZ Securitisation Limited2 New Zealand
St.George Finance Holdings Limited Australia Westpac Securities NZ Limited New Zealand
Westpac Covered Bond Trust Australia Westpac Bank-PNG-Limited Papua New Guinea
Westpac Equity Holdings Pty Limited Australia
The following controlled entities have been granted relief from compliance with the balance date synchronisation provisions in the Corporations Act 2001: Westpac Cash PIE Fund; Westpac Notice Saver PIE Fund; and Westpac Term PIE Fund.
The following material controlled entities are not wholly owned: Percentage Owned 2021 2020
Reinventure Fund, I.L.P. 99.0% 99.0%
Westpac Bank-PNG-Limited 89.9% 89.9%
Westpac NZ Covered Bond Limited 19.0% 19.0%
Westpac NZ Securitisation Limited 19.0% 19.0%
1. Refer to Note 37 for details of assets and liabilities held for sale.2. The Group indirectly owns 19% of Westpac NZ Covered Bond Limited (WNZCBL) and Westpac NZ Securitisation Limited (WNZSL),
however, due to contractual and structural arrangements both WNZCBL and WNZSL are considered to be controlled entities within the Group.

2493 FIN
AN
CIA
L STATE
ME
NTS
2 GR
OU
P P
ER
FOR
MA
NC
E1 STR
ATE
GIC
RE
PO
RT
4 SH
AR
EH
OLD
ER
INFO
RM
ATIO
NWESTPAC GROUP 2021 ANNUAL REPORT
Notes to the financial statements
Non-controlling interests
Details of the balance of NCIs are set out in Note 27. There are no NCIs that are material to the Group.
Significant restrictions
On 2 April 2020, a decision was made by the RBNZ to freeze distribution of dividends on ordinary shares by all banks in New Zealand during the period of uncertainty caused by COVID-19. With effect from 29 April 2021, these dividend restrictions were eased to allow New Zealand banks to pay up to a maximum of 50% of their earnings as dividend. This 50% dividend restriction will remain in place until 1 July 2022. As a result there is currently a restriction on the payment of dividends by WNZL, the Group’s New Zealand subsidiary.
There were no other significant restrictions on the ability to transfer cash or other assets, pay dividends or other capital distributions, provide or repay loans and advances between the entities within the Group. There were also no significant restrictions on Westpac’s ability to access or use the assets and settle the liabilities of the Group resulting from protective rights of NCIs.
Associates
There are no associates that are material to the Group.
Changes in ownership of subsidiaries
Businesses disposed during the year ending 30 September 2021
Westpac sold its interest in the following business during the year:
• Westpac General Insurance Limited (sold on 1 July 2021)
• Westpac General Insurance Services Limited (sold on 1 July 2021)
• Westpac Vendor Finance business (sold on 31 July 2021)
• Westpac Lenders Mortgage Insurance Limited (sold on 31 August 2021).
Refer to Notes 36 and 37 for further details of businesses disposed in 2021.
Businesses disposed during the year ending 30 September 2020
No businesses were sold in 2020.
Businesses disposed during the year ending 30 September 2019
Westpac sold its interest in Ascalon Capital Managers (Asia) Limited and Ascalon Capital Managers Limited on 8 February 2019 for a combined profit of $3 million recognised in non-interest income (refer to Note 36).
Note 31. Structured entities
Accounting policy
Structured entities are generally created to achieve a specific, defined objective and their operations are restricted such as only purchasing specific assets. Structured entities are commonly financed by debt or equity securities that are collateralised by and/or indexed to their underlying assets. The debt and equity securities issued by structured entities may include tranches with varying levels of subordination.
Structured entities are classified as subsidiaries and consolidated if they meet the definition in Note 30. If the Group does not control a structured entity then it will not be consolidated.
The Group engages in various transactions with both consolidated and unconsolidated structured entities that are mainly involved in securitisations, asset backed and other financing structures and managed funds.
Consolidated structured entities
Securitisation and covered bonds
The Group uses structured entities to securitise its financial assets, including two covered bond programs, to assign pools of residential mortgages to bankruptcy remote structured entities.
Refer to Note 24 for further details.
Note 30. Investments in subsidiaries and associates (continued)

250 WESTPAC GROUP 2021 ANNUAL REPORT
Notes to the financial statements
Group managed funds
The Group acts as the responsible entity and/or fund manager for various investment management funds. As fund manager, if the Group is deemed to be acting as a principal rather than an agent then it consolidates the fund. The principal versus agent decision requires judgement of whether the Group has sufficient exposure to variable returns.
Non-contractual financial support
The Group does not provide non-contractual financial support to these consolidated structured entities.
Unconsolidated structured entities
The Group has interests in various unconsolidated structured entities including debt or equity instruments, guarantees, liquidity and other credit support arrangements, lending, loan commitments, certain derivatives and investment management agreements.
Interests exclude non-complex derivatives (e.g. interest rate or currency swaps), instruments that create, rather than absorb, variability in the entity (e.g. credit protection under a credit default swap), and lending to a structured entity with recourse to a wider operating entity, not just the structured entity.
The Group’s main interests in unconsolidated structured entities, which arise in the normal course of business, are:
Trading securities The Group actively trades interests in structured entities and normally has no other involvement with the structured entity. The Group earns interest income on these securities and also recognises fair value changes through trading income in non-interest income.
Investment securities The Group holds mortgage-backed securities for liquidity purposes and the Group normally has no other involvement with the structured entity. These assets are highly-rated, investment grade and eligible for repurchase agreements with the RBA or another central bank. The Group earns interest income and net gains or losses on selling these assets are recognised in the income statements.
Loans and other credit commitments
The Group lends to unconsolidated structured entities, subject to the Group’s collateral and credit approval processes, in order to earn interest and fee income. The structured entities are mainly property trusts, securitisation entities and those associated with project and property financing transactions.
Investment management agreements
The Group manages funds that provide customers with investment opportunities. The Group also manages superannuation funds for its employees. The Group earns management and performance fee income which is recognised in non-interest income.
The Group may also retain units in these investment management funds, primarily through life insurance subsidiaries. The Group earns fund distribution income and recognises fair value movements through non-interest income.
The following tables show the Group’s interests in unconsolidated structured entities and its maximum exposure to loss in relation to those interests. The maximum exposure does not take into account any collateral or hedges that will reduce the risk of loss.
• For on-balance sheet instruments, including debt and equity instruments in and loans to unconsolidated structured entities, the maximum exposure to loss is the carrying value.
• For off-balance sheet instruments, including liquidity facilities, loan and other credit commitments and guarantees, the maximum exposure to loss is the notional amounts.
Note 31. Structured entities (continued)

2513 FIN
AN
CIA
L STATE
ME
NTS
2 GR
OU
P P
ER
FOR
MA
NC
E1 STR
ATE
GIC
RE
PO
RT
4 SH
AR
EH
OLD
ER
INFO
RM
ATIO
NWESTPAC GROUP 2021 ANNUAL REPORT
Notes to the financial statements
Investment inthird party
mortgage and Interestother Financing to Group in other
Consolidated asset-backed securitisation managed structured
$m securities1 vehicles funds entities Total
2021
Assets
Trading securities and financial assets measured at FVIS 2,694 - - 40 2,734
Investment securities 5,352 - - - 5,352
Loans - 23,028 - 18,415 41,443
Life insurance assets2 - - - - -
Other assets - - 55 - 55
Assets held for sale - - 232 695 927
Total on-balance sheet exposures 8,046 23,028 287 19,150 50,511
Total notional amounts of off-balance sheet exposures - 6,609 15 8,553 15,177
Maximum exposure to loss 8,046 29,637 302 27,703 65,688
Size of structured entities3 74,925 29,637 77,036 48,309 229,907
2020
Assets
Trading securities and financial assets measured at FVIS 1,526 - - 34 1,560
Investment securities 6,105 - - - 6,105
Loans - 20,094 - 16,955 37,049
Life insurance assets - - 204 129 333
Other assets - - 52 - 52
Total on-balance sheet exposures 7,631 20,094 256 17,118 45,099
Total notional amounts of off-balance sheet exposures - 6,122 44 7,768 13,934
Maximum exposure to loss 7,631 26,216 300 24,886 59,033
Size of structured entities3 59,324 26,216 67,423 40,209 193,172
Non-contractual financial support
The Group does not provide non-contractual financial support to these unconsolidated structured entities.
1. The Group’s interests in third-party mortgages and other asset-backed securities are senior tranches of notes and are investment grade rated.
2. Balances reclassified to assets held for sale.3. Represents either the total assets or market capitalisation of the entity, or if not available, the Group’s total committed exposure (for
lending arrangements and external debt and equity holdings), funds under management (for Group managed funds) or the total value of notes on issue (for investments in third-party asset-backed securities).
Note 31. Structured entities (continued)
252 WESTPAC GROUP 2021 ANNUAL REPORT
Notes to the financial statements
Note 32. Share-based payments
Accounting policy
The Group enters into various share-based payment arrangements with its employees as a component of overall compensation for services provided. Share-based payment arrangements comprise rights to receive shares for free (share rights) and restricted shares (issued at no cost). Share-based payment arrangements typically require a specified period of continuing employment (the service period or vesting period) and may include performance targets (vesting conditions). Specific details of each arrangement are provided below.
Share-based payments must be classified as either cash-settled or equity-settled arrangements. The Group’s significant arrangements are equity-settled, as the Group is not obliged to settle in cash.
Share rights
Share rights are equity-settled arrangements. The fair value is measured at grant date and is recognised as an expense over the service period, with a corresponding increase in the share-based payment reserve in equity.
The fair values of share rights are estimated at grant date using a binomial/Monte Carlo simulation pricing model which incorporates the vesting and market-related performance targets of the grants. The fair value of share rights excludes non-market vesting conditions such as employees’ continuing employment by the Group. The non-market vesting conditions are instead incorporated in estimating the number of share rights that are expected to vest and are therefore recognised as an expense. At each reporting date the non-market vesting assumptions are revised and the expense recognised each year takes into account the most recent estimates. The market-related assumptions are not revised each year as the fair value is not re-estimated after the grant date.
Restricted share plan (RSP)The RSP is accounted for as an equity-settled arrangement. The fair value of shares allocated to employees for nil consideration is recognised as an expense over the vesting period with a corresponding increase in the share-based payments reserve in equity. The fair value of ordinary shares issued to satisfy the obligation to employees is measured at grant date and is recognised as a separate component of equity.
Employee share plan (ESP)The value of shares expected to be allocated to employees for nil consideration is recognised as an expense over the financial year and provided for as other employee benefits. The fair value of any ordinary shares issued to satisfy the obligation to employees is recognised in equity. Alternatively, shares may be purchased on-market to satisfy the obligation to employees.
Scheme nameWestpac Long Term Variable Reward Plan (LTVR) Westpac Performance Plan (WPP)
Restricted Share Plan (RSP)
Employee Share Plan (ESP)
Type of share-based payment
Share rights (allocated at no cost).
Share rights (allocated at no cost). Westpac ordinary shares (allocated at no cost).
Westpac ordinary shares (allocated at no cost) of up to $1,000 per employee per year.
How it is used Aligns executive remuneration and accountability with shareholder interests over the long term.
Primarily used for mandatory deferral of a portion of short-term variable reward for New Zealand employees and key employees based outside Australia.
Primarily used to reward key employees and for mandatory deferral of a portion of short-term variable reward for Australian employees and some other offshore jurisdictions.
To reward eligible Australian employees (unless they have already been provided instruments under another scheme for the previous year).
Exercise price Nil Nil n/a n/a
Performance hurdles
For the 2020 and 2021 awards: relative Total Shareholder return (TSR) over a four-year performance period.
For the 2017, 2018 and 2019 awards: TSR over a four-year performance period and average cash Return on Equity (cash ROE) over a three-year performance period plus one-year holding lock, each applying to half of the award.
None None None
OTHER

2533 FIN
AN
CIA
L STATE
ME
NTS
2 GR
OU
P P
ER
FOR
MA
NC
E1 STR
ATE
GIC
RE
PO
RT
4 SH
AR
EH
OLD
ER
INFO
RM
ATIO
NWESTPAC GROUP 2021 ANNUAL REPORT
Notes to the financial statements
Scheme nameWestpac Long Term Variable Reward Plan (LTVR) Westpac Performance Plan (WPP)
Restricted Share Plan (RSP)
Employee Share Plan (ESP)
Service conditions
Continued employment throughout the vesting period or as determined by the Board.
Continued employment throughout the vesting period or as determined by the Board.
Continued employment throughout the restriction period or as determined by the Board.
Shares must normally remain within the ESP for three years from granting unless the employee leaves Westpac.
Vesting period (period over which expenses are recognised)
4 years Defined period set out at time of grant.
Defined period set out at time of grant.
1 year
Treatment at end of term
Automatically exercised at the end of the term.
Automatically exercised at the end of the term.
Vested shares are released from the RSP at the end of the vesting period.
Shares are released at the end of the restriction period or when the employee leaves Westpac.
Does the employee receive dividends and voting rights during the vesting period?
No No Yes Yes
Each share-based payment scheme is quantified below.
(i) Westpac Long-Term Variable Reward Plan (LTVR)
Outstanding Outstandingas at beginning Granted during Exercised Lapsed during Outstanding as at and exercisable
of year the year during the year the year end of year as at end of year
2021
Share rights 3,066,326 1,383,986 1,571 788,911 3,659,830 2,148
Weighted average remaining contractual life 12.4 years 12.7 years
2020
Share rights 4,554,589 779,581 - 2,267,844 3,066,326 3,719
The weighted average fair value at grant date of LTVR share rights issued during the year was $6.56 (2020: $28.44).
(ii) Westpac Performance Plan (WPP)
Outstanding Outstandingas at beginning Granted during Exercised Lapsed during Outstanding as at and exercisable
of year the year during the year the year end of year as at end of year
2021
Share rights
One-year vesting period 206,241 33,145 83,204 36,041 120,141 86,996
Two-year vesting period 292,941 34,352 85,090 40,433 201,770 63,704
Three-year vesting period 76,848 9,281 29,179 630 56,320 9,796
Four-year vesting period 381,105 164,742 42,724 14,783 488,340 11,065
Total share rights 957,135 241,520 240,197 91,887 866,571 171,561
Weighted average remaining contractual life 12.8 years 12.6 years
2020
Share rights 786,466 438,858 175,957 92,232 957,135 164,219
The weighted average fair value at grant date of WPP share rights issued during the year was $18.27 (2020: $24.68).
Note 32. Share-based payments (continued)
254 WESTPAC GROUP 2021 ANNUAL REPORT
Notes to the financial statements
(iii) Restricted Share Plan (RSP) Outstanding
as at beginning Granted during Forfeited Outstanding as atAllocation date of year the year Released during the year end of year
2021 4,389,161 2,165,046 2,012,519 226,613 4,315,075
2020 4,773,171 2,100,030 2,081,545 402,495 4,389,161
The weighted average fair value at grant date of RSP shares issued during the year was $20.63 (2020: $23.88).
(iv) Employee Share Plan (ESP)
Averagenumber
of shares Total numberAllocation Number of allocated per of shares Market Total
date participants participant allocated price per share1 fair value
2021 20 November 2020 27,078 52 1,408,056 $19.20 $27,034,675
2020 21 November 2019 25,725 38 977,550 $26.20 $25,611,810
The 2020 ESP award was satisfied through the purchase of shares on-market.
The liability accrued for the ESP at 30 September 2021 is $28 million (2020: $28 million) and is provided for as other employee benefits.
(v) Other plans
Westpac also provides plans for small, specialised parts of the Group. The benefits under these plans are directly linked to growth and performance of the relevant part of the business. The plans, individually and in aggregate, are not material to the Group in terms of expenses and dilution of earnings.
The names of all persons who hold share options and/or rights currently on issue are entered in Westpac’s register of option holders which may be inspected at Link Market Services, Level 12, 680 George Street, Sydney, New South Wales.
(vi) Fair value assumptions
The fair values of share rights have been independently calculated at their respective grant dates.
The fair value of share rights with performance targets based on relative TSR takes into account the average TSR outcome determined using a Monte Carlo simulation pricing model.
The fair values of share rights without TSR based performance targets (i.e. share rights with cash EPS compound annual growth rate (CAGR), economic profit and cash ROE performance targets) have been determined with reference to the share price at grant date and a discount rate reflecting the expected dividend yield over their vesting periods.
Other significant assumptions include:
• a risk free rate of return of 0.2%, applied to TSR-hurdled grants;
• a dividend yield on Westpac shares of 6.0%, applied to TSR and ROE-hurdled grants;
• volatility in Westpac’s TSR of 25%, applied to TSR-hurdled grants; and
• volatilities of, and correlation factors between, TSR of the comparator group and Westpac for TSR-hurdled grants.
1. The market price per share for the allocation is based on the five day volume-weighted average price up to the grant date.
Note 32. Share-based payments (continued)

2553 FIN
AN
CIA
L STATE
ME
NTS
2 GR
OU
P P
ER
FOR
MA
NC
E1 STR
ATE
GIC
RE
PO
RT
4 SH
AR
EH
OLD
ER
INFO
RM
ATIO
NWESTPAC GROUP 2021 ANNUAL REPORT
Notes to the financial statements
Note 33. Superannuation commitments
Accounting policy
The Group recognises an asset or a liability for its defined benefit schemes, being the net of the defined benefit obligations and the fair value of the schemes’ assets. The defined benefit obligation is calculated as the present value of the estimated future cash flows, discounted using high-quality long dated corporate bond rates.
The superannuation expense is recognised in operating expenses and remeasurements are recognised through OCI.
Critical accounting assumptions and estimates
The actuarial valuation of plan obligations is dependent upon a series of assumptions, principally price inflation, salary growth, mortality, morbidity, discount rate and investment returns. Different assumptions could significantly alter the valuation of the plan assets and obligations and the resulting remeasurement recognised in OCI and the superannuation expense recognised in the income statement.
Westpac had the following defined benefit plans at 30 September 2021:
Name of plan Type Form of benefitDate of last actuarial assessment of
the funding status
Westpac Group Plan (WGP)1 Defined benefit and accumulation
Indexed pension and lump sum 30 June 2018
Westpac New Zealand Superannuation Scheme (WNZS)
Defined benefit and accumulation
Indexed pension and lump sum 30 June 2020
Westpac Banking Corporation UK
Staff Superannuation Scheme (UKSS)1
Defined benefit Indexed pension and lump sum 5 April 2018
Westpac UK Medical Benefits Scheme Defined benefit Medical benefits n/a
The defined benefit sections of the schemes are closed to new members. The Group has no obligation beyond the annual contributions for the accumulation or defined contribution sections of the schemes.
The WGP is the Group’s principal defined benefit plan and is managed and administered in accordance with the terms of its trust deed and relevant legislation in Australia. Its defined benefit liabilities are based on salary and length of membership for active members and inflation in the case of pensioners.
The defined benefit schemes expose the Group to the following risks:
• discount rate – reductions in the discount rate would increase the present value of the future payments;
• inflation rate – increases in the inflation rate would increase the payments to pensioners;
• investment risk – lower investment returns would increase the contributions needed to offset the shortfall;
• mortality risk – members may live longer than expected extending the cash flows payable by the Group;
• behavioural risk – higher proportion of members taking some of their benefits as a pension rather than a lump sum would increase the cash flows payable by the Group; and
• legislative risk – legislative changes could be made which increase the cost of providing defined benefits.
Investment risk is managed by setting benchmarks for the allocation of plan assets between asset classes. The long-term investment strategy will often adopt relatively high levels of equity investment in order to:
• secure attractive long-term investment returns; and
• provide an opportunity for capital appreciation and dividend growth, which gives some protection against inflation.
Funding recommendations for the WGP, WNZS and the UKSS are made based on triennial actuarial valuations. The funding valuations of the defined benefit plans are based on different assumptions to the calculation of the defined benefit surplus/deficit for accounting purposes. Based on the most recent valuations, the defined benefit plan assets are adequate to cover the present value of the accrued benefits of all members with a combined surplus of $143 million (2020: $154 million). Current contribution rates are as follows:
• WGP – contributions are made to the WGP at the rate of 15.4% of members’ salaries;
• WNZS – contributions are made to the WNZS at the rate of 17% of members’ salaries; and
• UKSS – not required to make contributions under the 2018 actuarial assessment.
1. The 2021 final actuarial assessment of the funding status for WGP and UKSS will be available in 2022.

256 WESTPAC GROUP 2021 ANNUAL REPORT
Notes to the financial statements
Note 33. Superannuation commitments (continued)
ContributionsConsolidated Parent Entity
$m 2021 2020 2021 2020
Employer contributions 33 26 31 26
Member contributions 10 10 10 10
Expected employer contributions for the year ended 30 September 2022 are $23 million.
Expense recognisedConsolidated Parent Entity
$m 2021 2020 2019 2021 2020
Current service cost 45 44 33 44 43
Net interest cost on net benefit liability 12 8 (2) 12 8
Total defined benefit expense 57 52 31 56 51
Defined benefit balances recognisedConsolidated Parent Entity
$m 2021 2020 2021 2020
Benefit obligation as at end of year 2,953 2,880 2,877 2,790
Fair value of plan assets as at end of year 2,582 2,350 2,524 2,295
Net surplus/(deficit) (371) (530) (353) (495)
Defined benefit surplus included in other assets 64 71 64 71
Defined benefit deficit included in other liabilities (435) (601) (417) (566)
Net surplus/(deficit) (371) (530) (353) (495)
The average duration of the defined benefit obligation is 15 years (2020: 14 years).
Significant assumptions2021 2020
Australian Overseas Australian OverseasConsolidated and Parent Entity funds funds funds funds
Discount rate 3.1% 2.1%-2.2% 2.6% 0.7%-1.5%
Salary increases 3.2% 3.0%-5.2% 2.7% 3.0%-4.6%
Inflation rate (pensioners received inflationary increase) 2.2% 2.0%-3.6% 1.7% 2.0%-3.1%
Life expectancy of a 60-year-old male 31.4 28.1-28.4 31.3 28.1-28.2
Life expectancy of a 60-year-old female 34.3 29.6-29.7 34.2 29.5-29.6
Sensitivity to changes in significant assumptions
The following table shows the impact of changes in assumptions on the defined benefit obligation for the WGP. No reasonably possible changes in the assumptions of the Group’s other defined benefit plans would have a material impact on the defined benefit obligation.
Increase in obligation
$m 2021 2020
0.5% decrease in discount rate 235 230
0.5% increase in annual salary increases 12 19
0.5% increase in inflation rate (pensioners receive inflationary increase) 215 201
1 year increase in life expectancy 71 68

2573 FIN
AN
CIA
L STATE
ME
NTS
2 GR
OU
P P
ER
FOR
MA
NC
E1 STR
ATE
GIC
RE
PO
RT
4 SH
AR
EH
OLD
ER
INFO
RM
ATIO
NWESTPAC GROUP 2021 ANNUAL REPORT
Notes to the financial statements
Note 33. Superannuation commitments (continued)
Asset allocation
The table below provides a breakdown of the schemes’ investments by asset class.
2021 2020Australian Overseas Australian Overseas
$m funds funds funds funds
Cash 5% 2% 6% 1%
Equity instruments 47% 7% 45% 9%
Debt instruments 25% 5% 25% 4%
Property 8% 2% 8% 1%
Other assets 15% 84% 16% 85%
Total 100% 100% 100% 100%
Equity and debt instruments are mainly quoted assets while property and other assets are mainly unquoted. Other assets include infrastructure funds and private equity funds.
Note 34. Auditor’s remuneration
The fees payable to the auditor, PricewaterhouseCoopers (PwC), and overseas firms belonging to the PwC network of firms were:
Consolidated Parent Entity$’000 2021 2020 2021 2020
Audit and audit-related fees
Audit fees
PwC Australia 29,306 27,667 29,148 27,667
Overseas PwC network firms 4,310 5,295 536 705
Total audit fees 33,616 32,962 29,684 28,372
Audit-related fees
PwC Australia 1,456 4,404 1,456 4,404
Overseas PwC network firms 221 107 - -
Total audit-related fees 1,677 4,511 1,456 4,404
Total audit and audit-related fees 35,293 37,473 31,140 32,776
Tax fees
PwC Australia 35 57 35 57
Total tax fees 35 57 35 57
Total audit and non-audit fees 35,328 37,530 31,175 32,833
Fees payable to the auditor have been categorised as follows:
Audit The year end audit, half-year review and comfort letters associated with debt issues and capital raisings.
Audit-related Consultations regarding accounting standards and reporting requirements, regulatory compliance reviews and assurance related to debt and capital offerings.
Tax Tax compliance and tax advisory services.
It is Westpac’s policy to engage PwC on assignments additional to its statutory audit duties only if its independence is not impaired or seen to be impaired and where its expertise and experience with Westpac is important. All services were approved by the Board Audit Committee in accordance with Westpac’s Pre-Approval of Engagement of PricewaterhouseCoopers for Audit or Non-Audit Services Policy.
PwC also received fees of $9.6 million (2020: $6.1 million) for various entities which are related to Westpac but not consolidated. These non-consolidated entities include entities sponsored by the Group, trusts of which a Westpac Group entity is trustee, manager or responsible entity, superannuation funds and pension funds.

258 WESTPAC GROUP 2021 ANNUAL REPORT
Notes to the financial statements
Note 35. Related party disclosures
Related parties
Westpac’s related parties are those it controls or can exert significant influence over. Examples include subsidiaries, associates, joint ventures and superannuation plans as well as key management personnel and their related parties.
Key management personnel (KMP)
Key management personnel are those who, directly or indirectly, have authority and responsibility for planning, directing and controlling the activities of Westpac. This includes all Executives and Non-Executive Directors.
Parent Entity
Westpac Banking Corporation is the ultimate parent company of the Group.
Subsidiaries - Note 30
The Parent Entity has the following related party transactions and balances with subsidiaries:
Type of transaction/balance Details disclosed in
Balances due to/from subsidiaries Balance Sheet
Dividend income/Transactions with subsidiaries Note 4
Interest income and Interest expense Note 3
Tax consolidated group transactions and undertakings Note 7
Guarantees and undertakings Note 26
The balances due to/from subsidiaries include a wide range of banking and other financial facilities.
The terms and conditions of related party transactions between the Parent Entity and subsidiaries are sometimes different to commercial terms and conditions. Related party transactions between the Parent Entity and subsidiaries eliminate on consolidation.
Associates - Note 30
The Group provides a wide range of banking and other financial facilities and funds management activities to its associates on commercial terms and conditions.
Superannuation plans
The Group contributed $418 million (2020: $361 million) to defined contribution plans and $33 million (2020: $26 million) to defined benefit plans. Refer to Note 33.
Remuneration of KMP
Total remuneration1 of the KMP was:
Post Other long-Short-term employment term Termination Share-based
$ benefits benefits benefits benefits payments Total
Consolidated
2021 28,469,165 730,700 (29,003) 3,101,006 10,832,584 43,104,452
2020 22,506,249 967,898 657,375 1,176,487 2,654,510 27,962,519
Parent Entity
2021 27,108,174 607,503 (29,003) 2,421,267 9,631,777 39,739,718
2020 21,513,543 873,350 657,375 1,176,487 2,147,884 26,368,639
1. Comparative amounts have been revised to align to current year presentation. The revisions primarily relate to changes in interpretation as to the appropriate period over which to expense the fair value of certain grants and to the appropriate grant date on which to value grants where there is an opt-out period.

2593 FIN
AN
CIA
L STATE
ME
NTS
2 GR
OU
P P
ER
FOR
MA
NC
E1 STR
ATE
GIC
RE
PO
RT
4 SH
AR
EH
OLD
ER
INFO
RM
ATIO
NWESTPAC GROUP 2021 ANNUAL REPORT
Notes to the financial statements
Note 35. Related party disclosures (continued)
Other transactions with KMP
KMP receive personal banking and financial investment services from the Group in the ordinary course of business. The terms and conditions, for example interest rates and collateral, and the risks to Westpac are comparable to transactions with other employees and did not involve more than the normal risk of repayment or present other unfavourable features.
Details of loans provided and the related interest charged to KMP and their related parties are as follows:
Interest Number ofpayable for Closing loan KMP with
$ the year balance loans
2021 403,893 28,924,924 12
2020 549,257 15,779,157 8
Share rights holdings
For compliance with SEC disclosure requirements, the following table sets out certain details of the performance share rights and unhurdled share rights held at 30 September 2021 by the CEO and other key management personnel (including their related parties):
Latest Date of ExerciseNumber of
Share Rights
Managing Director and Chief Executive Officer
Peter King Ranges from 1 October 2032 to 1 October 2035 460,630
Group Executives
Scott Collary 1 October 2035 120,614
Chris De Bruin 1 October 2035 100,676
Carolyn McCann Ranges from 1 October 2032 to 1 October 2035 174,136
Anthony Miller 1 October 2035 120,492
Christine Parker Ranges from 1 October 2032 to 1 October 2035 280,816
Simon Power Ranges from 1 October 2032 to 1 October 2035 38,122
Michael Rowland 1 October 2035 99,415
David Stephen Ranges from 1 October 2032 to 1 October 2035 514,052
Les Vance Ranges from 2 April 2035 to 1 October 2035 98,441
Jason Yetton Ranges from 2 April 2035 to 1 October 2035 180,201
Former Group Executive
Richard Burton n/a -
Guil Lima 1 October 2034 179,017
David McLean Ranges from 1 October 2022 to 1 October 2035 422,413
Gary Thursby Ranges from 1 October 2032 to 1 October 2034 191,760
Alastair Welsh n/a -
Curt Zuber n/a -
The Group has not issued any options during the year and there are no outstanding options as at 30 September 2021.

260 WESTPAC GROUP 2021 ANNUAL REPORT
Notes to the financial statements
Note 36. Notes to the cash flow statements
Accounting policy
Cash and balances with central banks include cash held at branches and in ATMs, balances with overseas banks in their local currency and balances with central banks including accounts with the RBA and accounts with overseas central banks.
Reconciliation of net cash provided by/(used in) operating activities to net profit for the year is set out below.
Consolidated Parent Entity$m 2021 2020 2019 2021 2020
Net profit for the year 5,463 2,292 6,790 4,613 2,658
Adjustments:
Depreciation, amortisation and impairment 3,054 2,473 1,079 2,775 2,142
Impairment charges (348) 3,371 966 (222) 2,864
Net decrease/(increase) in current and deferred tax 350 (1,112) (541) (195) (937)
(Increase)/decrease in accrued interest receivable 183 239 132 173 208
(Decrease)/increase in accrued interest payable (423) (1,260) (341) (340) (1,143)
(Decrease)/increase in provisions (1,716) 1,925 1,143 (1,722) 2,003
Other non-cash items (253) (693) (832) 1,067 (1,114)
Cash flows from operating activities before changes in operating assets and liabilities 6,310 7,235 8,396 6,149 6,681
Net (increase)/decrease in:
Collateral paid 305 348 (847) 339 329
Trading securities and other financial assets measured at FVIS 19,316 (8,756) (7,629) 18,625 (8,266)
Derivative financial instruments (2,420) 1,851 7,605 (1,874) 2,103
Loans (15,098) 18,272 (4,188) (11,228) 21,273
Other financial assets (274) 273 336 258 283
Life insurance assets and life insurance liabilities (593) (277) (134) - -
Other assets 6 70 (13) (23) 50
Net increase/(decrease) in:
Collateral received 93 (1,096) 1,007 312 (1,072)
Deposits and other borrowings 33,737 28,910 1,113 28,696 20,859
Other financial liabilities 9,036 11,817 1,463 6,500 11,866
Other liabilities (8) 4 (5) (4) (7)
Net cash provided by/(used in) operating activities 50,410 58,651 7,104 47,750 54,099
2613 FIN
AN
CIA
L STATE
ME
NTS
2 GR
OU
P P
ER
FOR
MA
NC
E1 STR
ATE
GIC
RE
PO
RT
4 SH
AR
EH
OLD
ER
INFO
RM
ATIO
NWESTPAC GROUP 2021 ANNUAL REPORT
Notes to the financial statements
Details of the assets and liabilities over which control ceased
Details of the entities over which control ceased are provided in Note 37.
Consolidated Parent Entity$m 2021 2020 2019 2021 2020
Assets:
Cash and balances with central banks 50 - 3 - -
Trading securities and other financial assets measured at FVIS 409 - 3 - -
Loans 369 - - - -
Other financial assets 688 - 3 - -
Property and equipment 29 - - - -
Deferred tax assets 4 - - - -
Intangible assets 243 - - - -
Other assets 226 - - - -
Total assets 2,018 - 9 - -
Liabilities:
Other financial liabilities 110 - - - -
Provisions 9 - - - -
Other liabilities 720 - - - -
Total liabilities 839 - - - -
Total equity attributable to owners of WBC 1,179 - 9 - -
Cash proceeds received (net of transaction costs) 1,322 - 2 - -
Expected receivable (completion settlement) 8 - - - -
Deferred consideration 37 - - - -
Total consideration 1,367 - 2 - -
Reserves reclassified to the income statement - - 10 - -
Gain/(loss) on disposal 188 - 3 - -
Reconciliation of cash proceeds from disposal:
Cash proceeds received (net of transaction costs) 1,322 - 2 - -
Less: Cash deconsolidated (50) - (3) - -
Cash consideration (paid)/received (net of transaction costs and cash held) 1,272 - (1) - -
Non-cash financing activitiesShares issued under the dividend reinvestment plan 401 273 1,489 401 273
Increase in lease liabilities 199 177 - 114 173
On 4 December 2020, $866 million of Westpac Capital Notes (WCN) 3 were transferred to the WCN 3 nominated party for $100 each pursuant to the WCN 7 reinvestment offer. Those WCN 3 were subsequently redeemed and cancelled by Westpac. On 22 March 2021, the remaining $458 million of WCN 3 were redeemed and cancelled by Westpac for $100 each.
On 15 September 2021, $1,152 million of WCN4 were transferred to the WCN4 nominated party for $100 each pursuant to the WCN8 reinvestment offer. Those WCN4 were subsequently redeemed and cancelled by Westpac. On 15 October 2021, Westpac issued a redemption notice notifying WCN4 holders that all outstanding WCN4 will be redeemed on the optional redemption date, being 20 December 2021.
Cash and balances with central banks
The following table provides the breakdown of cash and cash balances with central banks.
Consolidated Parent Entity$m 2021 2020 2021 2020
Cash and cash at bank 16,504 15,865 16,156 15,335
Exchange settlement accounts 54,587 13,978 46,412 9,892
Regulatory deposits with central banks 262 286 186 209
Total cash and balances with central banks 71,353 30,129 62,754 25,436
Note 36. Notes to the cash flow statements (continued)

262 WESTPAC GROUP 2021 ANNUAL REPORT
Notes to the financial statements
Restricted cash
Certain of our foreign operations are required to maintain reserves or minimum balances with central banks in their respective countries of operation, totalling $445 million (2020: $457 million) for the Group and $369 million (2020: $380 million) for the Parent Entity which are included in cash and balances with central banks.
Note 37. Assets and liabilities held for sale
Accounting policy
Assets and liabilities held for sale
Non-current assets or disposal groups are classified as held for sale if they will be recovered primarily through sale rather than through continuing use and a sale is considered highly probable. Non-current assets or disposal groups held for sale are measured at the lower of their existing carrying amount and fair value less costs to sell, except for liabilities and certain assets such as deferred tax assets, financial assets and contractual rights under insurance contracts, which are specifically exempt from this requirement and continue to be recognised at their existing carrying value.
An impairment loss is recognised for any initial or subsequent write-down of the asset (or disposal group) to fair value less costs to sell. A gain is recognised for any subsequent increases in fair value less costs to sell of an asset (or disposal group), but not in excess of any cumulative impairment loss previously recognised. A gain or loss not previously recognised by the date of the sale of the non-current asset (or disposal group) is recognised at the date of derecognition.
Non-current assets are not depreciated or amortised while they are classified as held for sale. Non-current assets classified as held for sale and the assets of a disposal group classified as held for sale are presented separately from the other assets in the balance sheet. The liabilities of a disposal group classified as held for sale are presented separately from other liabilities in the balance sheet.
During the year ending 30 September 2021, the assets and liabilities of certain businesses were classified as held for sale. As these businesses do not constitute a major line of business for the Group, they have not been classified as discontinued operations.
Details of the businesses which were classified as held for sale during the financial year are as follows:
Businesses held for sale as at 30 September 2021
Westpac Motor Vehicle Dealer Finance and Novated Leasing business
On 28 June 2021, the Group announced that it expects to sell its motor vehicle dealer finance and novated leasing business to Angle Auto Finance Pty Ltd, a portfolio company of Cerberus Capital Management, L.P. As part of the sale, Westpac will transfer:
• Auto dealer and introducer agreements together with wholesale dealer loans of approximately $1 billion;
• Strategic alliance agreements with vehicle manufacturers; and
• Novated lease origination capability and related agreements.
Westpac will retain its existing retail auto loans of around $10 billion originated by the businesses being transferred. The loans will run down in the normal course of business over the life of those loans. Westpac will also progressively cease new retail auto loan originations from these three channels with customers still able to use the Group’s Consumer and Business lending products to help buy motor vehicles.
The sale agreement includes initial payment on completion based on the final value of the portfolio transferred and deferred consideration payable over the two-year period following completion. Completion of the transaction will occur over several stages to allow for a smooth transition. Final completion of the transaction is expected by no later than 31 March 2022, at which time a small gain on sale is expected to be recognised in non-interest income.
The business is currently included in the Group’s Specialist Businesses division.
Westpac New Zealand Life Insurance business
On 6 July 2021, the Group announced that it had entered into an agreement to sell Westpac Life-NZ-Limited to Fidelity Life Assurance Company Limited and enter into an exclusive 15-year agreement for the distribution of life insurance products to Westpac’s New Zealand customers. This entity is currently included in the Group’s Westpac New Zealand division.
Note 36. Notes to the cash flow statements (continued)
2633 FIN
AN
CIA
L STATE
ME
NTS
2 GR
OU
P P
ER
FOR
MA
NC
E1 STR
ATE
GIC
RE
PO
RT
4 SH
AR
EH
OLD
ER
INFO
RM
ATIO
NWESTPAC GROUP 2021 ANNUAL REPORT
Notes to the financial statements
The sale price of NZ$400 million (approximately A$375 million1) is expected to result in a small post-tax gain on sale. The transaction also includes ongoing payments to Westpac in accordance with the distribution agreement.
Completion of the transaction is subject to various regulatory approvals and is expected to occur by first half 2022 , at which time the gain will be recognised in non-interest income.
Westpac Australian Life Insurance business
On 9 August 2021, the Group announced that it will sell Westpac Life Insurance Services Limited to TAL Dai-ichi Life Australia Pty Limited (TAL) and enter into an exclusive 20-year strategic alliance for the provision of life insurance products to Westpac’s Australian customers. This entity is currently included in the Group’s Specialist Businesses division.
The sale price is $900 million and is estimated to result in a pre-tax loss on sale of $1.3 billion. For the year ended 30 September 2021, a loss of $224 million has been recognised in operating expenses reflecting expected separation and transaction costs. The remaining loss will be recognised on completion of the sale. The transaction also includes ongoing payments to Westpac in accordance with the distribution agreement.
Westpac will retain responsibility for certain pre-completion matters and provide protection to TAL through a combination of provisions, warranties and indemnities.
Completion of the transaction is subject to various regulatory approvals and is expected to occur in the second half of the 2022 calendar year.
Businesses no longer held for sale as at 30 September 2021
Westpac General Insurance Limited and Westpac General Insurance Services Limited
On 2 December 2020, the Group announced it would sell Westpac General Insurance Limited and Westpac General Insurance Services Limited to Allianz and enter into an exclusive 20-year agreement for the distribution of general insurance products to Westpac’s customers. The sale was completed on 1 July 2021 for $725 million and resulted in a pre-tax gain on sale of $160 million (net of transaction and separation costs) recognised in non-interest income. A further payment of $25 million is expected to be received by Westpac by 31 December 2021 subject to an integration milestone, with contingent payments over the next five years in addition to ongoing payments under the distribution agreement.
Westpac will retain responsibility for certain pre-completion matters and provide protection to Allianz through a combination of customary warranties and indemnities.
These entities were included in the Group’s Specialist Businesses division.
Westpac Vendor Finance business
On 21 August 2020, the Group announced that it had entered into an agreement for the sale of its Vendor Finance business to Angle Auto Finance Pty Ltd, a portfolio company of Cerberus Management, L.P. The sale was completed on 31 July 2021 resulting in a pre-tax gain on sale of $29 million recognised at this date in non-interest income. A pre-tax loss of $81 million was previously recognised in operating expenses prior to completion date, reflecting a writedown of assets held for sale to their estimated fair value less costs to sell and recognition of related separation and transaction costs.
The business was included in the Group’s Specialist Businesses division.
Westpac Lenders Mortgage Insurance Limited
On 18 March 2021, the Group announced it would sell Westpac Lenders Mortgage Insurance Limited (WLMI) to Arch Capital Group (Arch) and enter into a 10-year exclusive supply agreement for Arch to provide Lenders Mortgage Insurance (LMI) to the Group. The sale was completed on 31 August 2021 with nil gain on sale recognised at this date as the sales price reflected the book value of the business transferred. A loss of $110 million was previously recognised in the first half of 2021 in operating expenses reflecting the write-down of goodwill and recognition of related transaction and separation costs. Ongoing fixed annual payments will be received under the distribution agreement.
Westpac will retain responsibility for certain legacy matters and provide protection to Arch through a combination of customary warranties and indemnities.
WLMI was included in the Group’s Specialist Businesses division.
Note 37 Assets and liabilities held for sale (continued)
1 Translated using a year-to-date average NZD/AUD exchange rate.
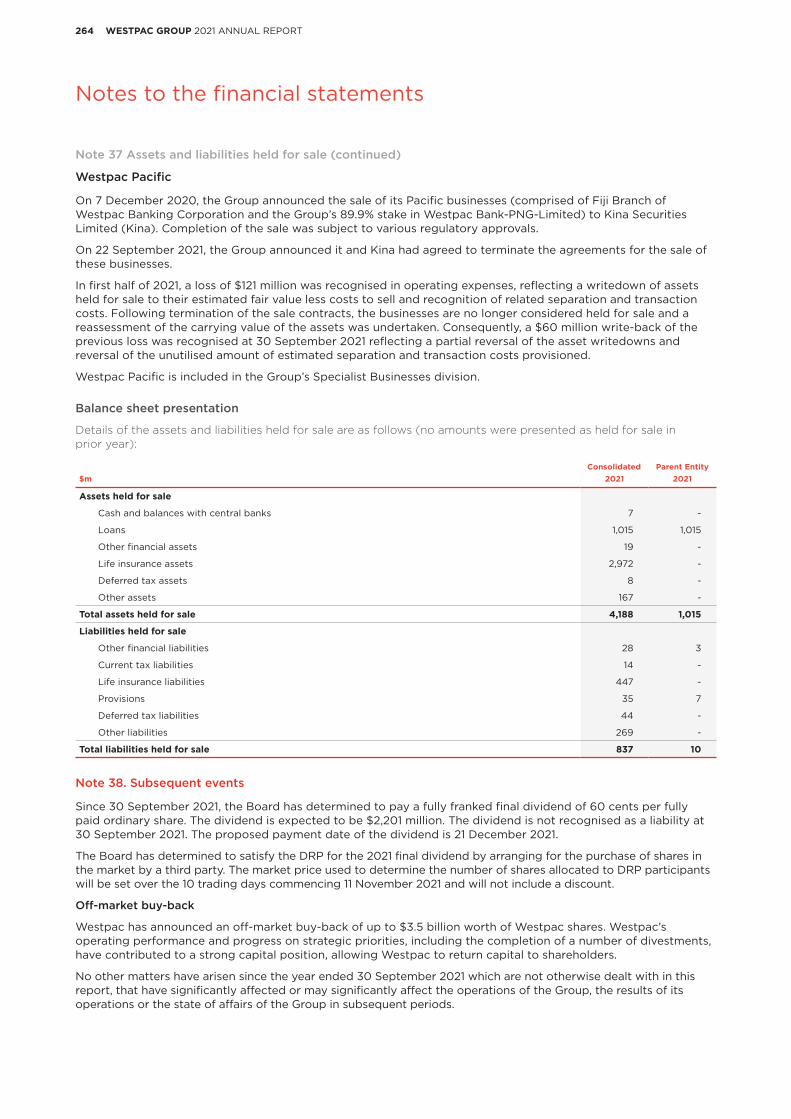
264 WESTPAC GROUP 2021 ANNUAL REPORT
Notes to the financial statements
Westpac Pacific
On 7 December 2020, the Group announced the sale of its Pacific businesses (comprised of Fiji Branch of Westpac Banking Corporation and the Group’s 89.9% stake in Westpac Bank-PNG-Limited) to Kina Securities Limited (Kina). Completion of the sale was subject to various regulatory approvals.
On 22 September 2021, the Group announced it and Kina had agreed to terminate the agreements for the sale of these businesses.
In first half of 2021, a loss of $121 million was recognised in operating expenses, reflecting a writedown of assets held for sale to their estimated fair value less costs to sell and recognition of related separation and transaction costs. Following termination of the sale contracts, the businesses are no longer considered held for sale and a reassessment of the carrying value of the assets was undertaken. Consequently, a $60 million write-back of the previous loss was recognised at 30 September 2021 reflecting a partial reversal of the asset writedowns and reversal of the unutilised amount of estimated separation and transaction costs provisioned.
Westpac Pacific is included in the Group’s Specialist Businesses division.
Balance sheet presentation
Details of the assets and liabilities held for sale are as follows (no amounts were presented as held for sale in prior year):
Consolidated Parent Entity$m 2021 2021
Assets held for sale
Cash and balances with central banks 7 -
Loans 1,015 1,015
Other financial assets 19 -
Life insurance assets 2,972 -
Deferred tax assets 8 -
Other assets 167 -
Total assets held for sale 4,188 1,015
Liabilities held for sale
Other financial liabilities 28 3
Current tax liabilities 14 -
Life insurance liabilities 447 -
Provisions 35 7
Deferred tax liabilities 44 -
Other liabilities 269 -
Total liabilities held for sale 837 10
Note 38. Subsequent events
Since 30 September 2021, the Board has determined to pay a fully franked final dividend of 60 cents per fully paid ordinary share. The dividend is expected to be $2,201 million. The dividend is not recognised as a liability at 30 September 2021. The proposed payment date of the dividend is 21 December 2021.
The Board has determined to satisfy the DRP for the 2021 final dividend by arranging for the purchase of shares in the market by a third party. The market price used to determine the number of shares allocated to DRP participants will be set over the 10 trading days commencing 11 November 2021 and will not include a discount.
Off-market buy-back
Westpac has announced an off-market buy-back of up to $3.5 billion worth of Westpac shares. Westpac’s operating performance and progress on strategic priorities, including the completion of a number of divestments, have contributed to a strong capital position, allowing Westpac to return capital to shareholders.
No other matters have arisen since the year ended 30 September 2021 which are not otherwise dealt with in this report, that have significantly affected or may significantly affect the operations of the Group, the results of its operations or the state of affairs of the Group in subsequent periods.
Note 37 Assets and liabilities held for sale (continued)
2653 FIN
AN
CIA
L STATE
ME
NTS
2 GR
OU
P P
ER
FOR
MA
NC
E1 STR
ATE
GIC
RE
PO
RT
4 SH
AR
EH
OLD
ER
INFO
RM
ATIO
NWESTPAC GROUP 2021 ANNUAL REPORT
Statutory statements
Westpac Pacific
On 7 December 2020, the Group announced the sale of its Pacific businesses (comprised of Fiji Branch of Westpac Banking Corporation and the Group’s 89.9% stake in Westpac Bank-PNG-Limited) to Kina Securities Limited (Kina). Completion of the sale was subject to various regulatory approvals.
On 22 September 2021, the Group announced it and Kina had agreed to terminate the agreements for the sale of these businesses.
In first half of 2021, a loss of $121 million was recognised in operating expenses, reflecting a writedown of assets held for sale to their estimated fair value less costs to sell and recognition of related separation and transaction costs. Following termination of the sale contracts, the businesses are no longer considered held for sale and a reassessment of the carrying value of the assets was undertaken. Consequently, a $60 million write-back of the previous loss was recognised at 30 September 2021 reflecting a partial reversal of the asset writedowns and reversal of the unutilised amount of estimated separation and transaction costs provisioned.
Westpac Pacific is included in the Group’s Specialist Businesses division.
Balance sheet presentation
Details of the assets and liabilities held for sale are as follows (no amounts were presented as held for sale in prior year):
Consolidated Parent Entity$m 2021 2021
Assets held for sale
Cash and balances with central banks 7 -
Loans 1,015 1,015
Other financial assets 19 -
Life insurance assets 2,972 -
Deferred tax assets 8 -
Other assets 167 -
Total assets held for sale 4,188 1,015
Liabilities held for sale
Other financial liabilities 28 3
Current tax liabilities 14 -
Life insurance liabilities 447 -
Provisions 35 7
Deferred tax liabilities 44 -
Other liabilities 269 -
Total liabilities held for sale 837 10
Note 38. Subsequent events
Since 30 September 2021, the Board has determined to pay a fully franked final dividend of 60 cents per fully paid ordinary share. The dividend is expected to be $2,201 million. The dividend is not recognised as a liability at 30 September 2021. The proposed payment date of the dividend is 21 December 2021.
The Board has determined to satisfy the DRP for the 2021 final dividend by arranging for the purchase of shares in the market by a third party. The market price used to determine the number of shares allocated to DRP participants will be set over the 10 trading days commencing 11 November 2021 and will not include a discount.
Off-market buy-back
Westpac has announced an off-market buy-back of up to $3.5 billion worth of Westpac shares. Westpac’s operating performance and progress on strategic priorities, including the completion of a number of divestments, have contributed to a strong capital position, allowing Westpac to return capital to shareholders.
No other matters have arisen since the year ended 30 September 2021 which are not otherwise dealt with in this report, that have significantly affected or may significantly affect the operations of the Group, the results of its operations or the state of affairs of the Group in subsequent periods.
Directors’ declaration
In the Directors’ opinion:
(a) the financial statements and notes set out in ‘Section 3 – Financial report for the year ended 30 September 2021 are in accordance with the Corporations Act 2001, including:
(i) complying with Australian Accounting Standards, the Corporations Regulations 2001 and other mandatory professional reporting requirements; and
(ii) giving a true and fair view of Westpac Banking Corporation and the Group’s financial position as at 30 September 2021 and of their performance for the financial year ended on that date; and
(b) there are reasonable grounds to believe that Westpac will be able to pay its debts as and when they become due and payable.
Note 1 (a) includes a statement that the financial report also complies with International Financial Reporting Standards as issued by the International Accounting Standards Board.
The Directors have been given the declaration by the Chief Executive Officer and the Chief Financial Officer required by section 295A of the Corporations Act 2001.
This declaration is made in accordance with a resolution of the Directors.
For and on behalf of the Board.
John McFarlane Chairman
Sydney
31 October 2021
Peter King Managing Director and Chief Executive Officer
Statutory statements

266 WESTPAC GROUP 2021 ANNUAL REPORT
Statutory statements
PricewaterhouseCoopers, ABN 52 780 433 757 One International Towers Sydney, Watermans Quay, Barangaroo, GPO BOX 2650, SYDNEY NSW 2001 T: +61 2 8266 0000, F: +61 2 8266 9999, www.pwc.com.au
Liability limited by a scheme approved under Professional Standards Legislation.
(a)
(b)
• • • • • • •

2673 FIN
AN
CIA
L STATE
ME
NTS
2 GR
OU
P P
ER
FOR
MA
NC
E1 STR
ATE
GIC
RE
PO
RT
4 SH
AR
EH
OLD
ER
INFO
RM
ATIO
NWESTPAC GROUP 2021 ANNUAL REPORT
Statutory statements
•
•
•
•
•
•
•
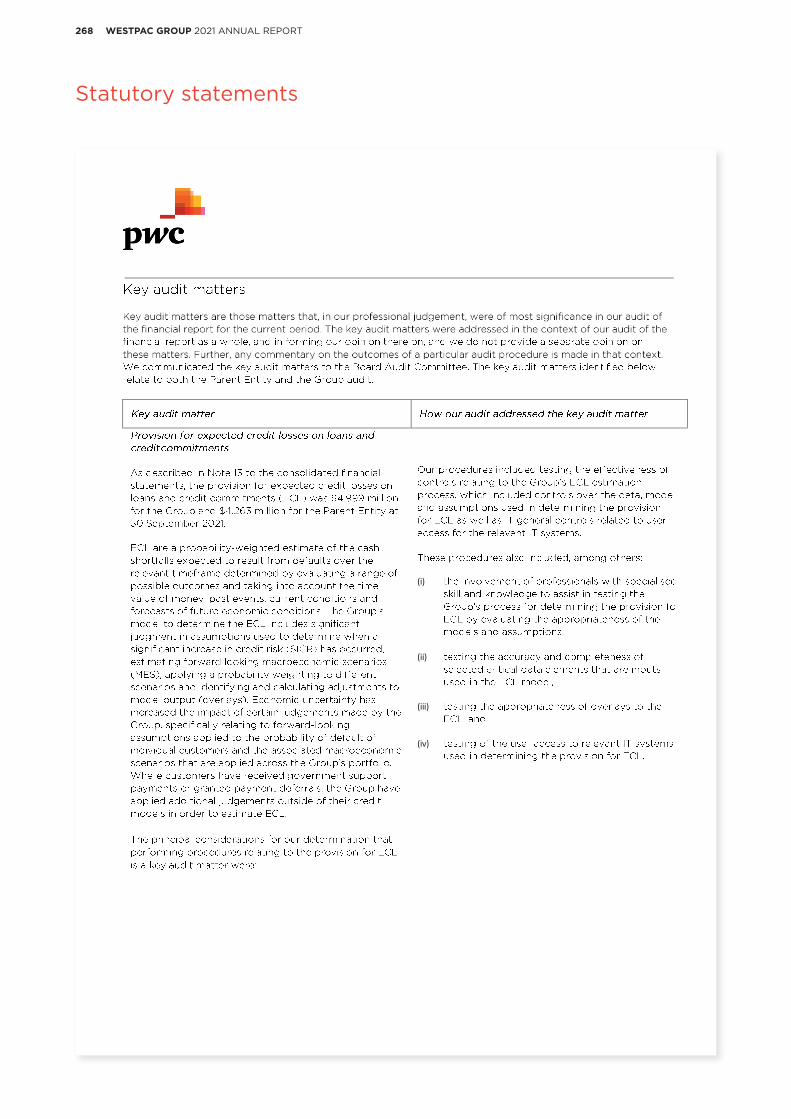
268 WESTPAC GROUP 2021 ANNUAL REPORT
Statutory statements
(i)
(ii)
(iii)
(iv)

2693 FIN
AN
CIA
L STATE
ME
NTS
2 GR
OU
P P
ER
FOR
MA
NC
E1 STR
ATE
GIC
RE
PO
RT
4 SH
AR
EH
OLD
ER
INFO
RM
ATIO
NWESTPAC GROUP 2021 ANNUAL REPORT
Statutory statements
(i)
(ii)

270 WESTPAC GROUP 2021 ANNUAL REPORT
Statutory statements
(i)
(ii)
(iii)
(i)
(ii)
(iii)

2713 FIN
AN
CIA
L STATE
ME
NTS
2 GR
OU
P P
ER
FOR
MA
NC
E1 STR
ATE
GIC
RE
PO
RT
4 SH
AR
EH
OLD
ER
INFO
RM
ATIO
NWESTPAC GROUP 2021 ANNUAL REPORT
Statutory statements
(i)
(ii)
(i)
(ii)
(iii)
(i)
(ii)
(iii)
272 WESTPAC GROUP 2021 ANNUAL REPORT
Statutory statements

2733 FIN
AN
CIA
L STATE
ME
NTS
2 GR
OU
P P
ER
FOR
MA
NC
E1 STR
ATE
GIC
RE
PO
RT
4 SH
AR
EH
OLD
ER
INFO
RM
ATIO
NWESTPAC GROUP 2021 ANNUAL REPORT
Statutory statements

274 WESTPAC GROUP 2021 ANNUAL REPORT
Statutory statements
Limitation on Independent Registered Public Accounting Firm’s Liability
The liability of PricewaterhouseCoopers (an Australian partnership which we refer to as PwC Australia), with respect to claims arising out of its audit report included in this Annual Report, is subject to the limitations set forth in the Professional Standards Act 1994 of New South Wales, Australia, as amended (the Professional Standards Act) and Chartered Accountants Australia and New Zealand (NSW) scheme adopted by Chartered Accountants Australia and New Zealand and approved by the New South Wales Professional Standards Council pursuant to the Professional Standards Act (the NSW Accountants Scheme). For matters occurring on or prior to 8 October 2019, the liability of PwC Australia may be subject to the limitations set forth in predecessor schemes. The current NSW Accountants Scheme expires on 7 October 2024 unless further extended or replaced.
The Professional Standards Act and the NSW Accountants Scheme may limit the liability of PwC Australia for damages with respect to certain civil claims arising in, or governed by the laws of, New South Wales directly or vicariously from anything done or omitted to be done in the performance of its professional services for us, including, without limitation, its audits of our financial statements.
The extent of the limitation depends on the timing of the relevant matter and is:
• in relation to matters occurring on or after 8 October 2013, a maximum liability for audit work of A$75 million; or
• in relation to matters occurring on or prior to 7 October 2013, the lesser of (in the case of audit services) ten times the reasonable charge for the service provided and a maximum liability for audit work of A$75 million.
The limitations do not apply to claims for breach of trust, fraud or dishonesty.
In addition, there is equivalent professional standards legislation in place in other states and territories in Australia and amendments have been made to a number of Australian federal statutes to limit liability under those statutes to the same extent as liability is limited under state and territory laws by professional standards legislation. Accordingly, liability for acts or omissions by PwC Australia in Australian states or territories other than New South Wales may be limited in a manner similar to that in New South Wales.
These limitations of liability may limit recovery upon the enforcement in Australian courts of any judgment under US or other foreign laws rendered against PwC Australia based on or related to its audit report on our financial statements. Substantially all of PwC Australia’s assets are located in Australia. However, the Professional Standards Act and the NSW Accountants Scheme have not been subject to extensive judicial consideration and therefore how the limitation might be applied by the courts and the effect of the limitation remain untested in a number of respects, including its effect in respect of the enforcement of foreign judgments.

Shareholder informationSECTION 4Shareholding information
Additional information
Information for shareholders
Glossary of abbreviations and defined terms
3 FINA
NC
IAL STA
TEM
EN
TS1 STR
ATE
GIC
RE
PO
RT
4 SH
AR
EH
OLD
ER
INFO
RM
ATIO
N2 G
RO
UP
PE
RFO
RM
AN
CE
275WESTPAC GROUP 2021 ANNUAL REPORT

276 WESTPAC GROUP 2021 ANNUAL REPORT
Shareholding information
Westpac ordinary shares
Top 20 ordinary shareholders as at 1 October 2021
Number of
Fully Paid Ordinary Shares % Held
HSBC Custody Nominees (Australia) Limited 832,515,440 22.69
J P Morgan Nominees Australia Pty Limited 535,476,465 14.60
Citicorp Nominees Pty Limited 243,347,363 6.63
National Nominees Limited 111,965,892 3.05
BNP Paribas Nominees Pty Ltd <Agency Lending DRP A/C> 65,358,435 1.78
BNP Paribas NOMS Pty Ltd <DRP> 41,347,287 1.13
Citicorp Nominees Pty Limited <Colonial First State Inv A/C> 34,261,232 0.93
HSBC Custody Nominees (Australia) Limited <NT-Comnwlth Super Corp A/C> 25,962,499 0.71
Australian Foundation Investment Company Limited 15,545,000 0.42
Pacific Custodians Pty Limited <WBC Plans Ctrl A/C> 15,031,955 0.41
Netwealth Investments Limited <Wrap Services A/C> 10,171,510 0.28
Milton Corporation Limited 9,994,212 0.27
BNP Paribas Nominees Pty Ltd HUB24 Custodial Serv Ltd <DRP A/C> 8,740,693 0.24
Argo Investments Limited 8,407,648 0.23
BNP Paribas Nominees Pty Ltd Six Sis Ltd <DRP A/C> 7,571,617 0.21
AMP Life Limited 5,060,127 0.14
BNP Paribas NOMS (NZ) Ltd <DRP> 4,410,749 0.12
BNP Paribas NOMS Pty Ltd BP2S Proplend Assets <DRP A/C> 4,379,913 0.12
Navigator Australia Ltd <MLC Investment Sett A/C> 4,303,947 0.12
National Nominees Limited <N A/C> 4,275,020 0.11
Total of Top 20 registered shareholders1 1,988,127,004 54.19
As at 1 October 2021 there were 657,581 holders of our ordinary shares compared to 671,057 holders in 2020 and 610,334 holders in 2019. Ordinary shareholders with a registered address in Australia held approximately 98% of our fully paid share capital at 1 October 2021 (approximately 98% in 2020 and 96% in 2019).
Substantial shareholders as at 1 October 2021
As at 1 October 2021 BlackRock Group (comprised of BlackRock Inc. and its subsidiaries) and The Vanguard Group, Inc. (including its subsidiary Vanguard Investments Australia Ltd.) had a ‘substantial holding’ of our shares within the meaning of the Corporations Act. A person has a substantial holding of our shares if the total votes attached to our voting shares in which they or their associates have relevant interests is 5% or more of the total number of votes attached to all our voting shares. The above table of the Top 20 ordinary shareholders includes shareholders that may hold shares for the benefit of third parties.
BlackRock Group has been a substantial shareholder since 4 April 2017 (221,964,794 equity securities as at 24 March 2020) and The Vanguard Group, Inc. has been a substantial shareholder since 17 July 2018 (216,778,699 equity securities as at 17 November 2020).
Analysis by range of holdings of ordinary shares as at 1 October 2021
Number of Shares
Number of Holders of Fully Paid
Ordinary Shares %Number of Fully Paid
Ordinary Shares %
Number of Holders of Share Options
and Rights
1 – 1,000 369,840 56.24 134,889,346 3.68 24,344
1,001 – 5,000 218,678 33.26 511,990,925 13.96 232
5,001 – 10,000 41,232 6.27 288,518,652 7.86 82
10,001 – 100,000 27,165 4.13 571,777,085 15.58 106
100,001 and over 666 0.10 2,161,415,800 58.92 19
Totals 657,581 100 3,668,591,808 100 24,783
There were 14,014 shareholders holding less than a marketable parcel ($500) based on a market price of $25.41 at the close of trading on 1 October 2021.
1. As recorded on the share register by holder reference number.
Shareholding information

3 FINA
NC
IAL STA
TEM
EN
TS1 STR
ATE
GIC
RE
PO
RT
4 SH
AR
EH
OLD
ER
INFO
RM
ATIO
N2 G
RO
UP
PE
RFO
RM
AN
CE
277WESTPAC GROUP 2021 ANNUAL REPORT
Shareholding information
Voting rights of ordinary shares
Holders of our fully paid ordinary shares have, at general meetings (including special general meetings), one vote on a show of hands and, upon a poll, one vote for each fully paid ordinary share held by them.
Westpac Capital Notes 2
Top 20 holders of Westpac Capital Notes 2 as at 1 October 2021
Number of Westpac
Capital Notes 2 % Held
HSBC Custody Nominees (Australia) Limited 1,002,716 7.65
Citicorp Nominees Pty Limited 584,847 4.46
J P Morgan Nominees Australia Pty Limited 276,790 2.11
Bond Street Custodians Limited <BENQLD - D79696 A/C> 250,000 1.91
BNP Paribas Nominees Pty Ltd HUB24 Custodial Serv Ltd <DRP A/C> 236,493 1.81
Netwealth Investments Limited <Wrap Services A/C> 223,471 1.71
Netwealth Investments Limited <Super Services A/C> 205,779 1.57
HSBC Custody Nominees (Australia) Limited - A/C 2 165,509 1.26
BNP Paribas Nominees Pty Ltd <Agency Lending DRP A/C> 131,573 1.00
Navigator Australia Ltd <MLC Investment Sett A/C> 124,781 0.95
Nulis Nominees (Australia) Limited <Navigator Mast Plan Sett A/C> 118,785 0.91
BNP Paribas NOMS Pty Ltd <DRP> 93,414 0.71
BNP Paribas Nominees Pty Ltd <Pitcher Partners DRP> 72,158 0.55
Australian Executor Trustees Limited <IPS Super A/C> 63,116 0.48
Mutual Trust Pty Ltd 57,808 0.44
Dimbulu Pty Ltd 51,000 0.39
Royal Freemasons Benevolent Institution 50,000 0.38
Marrosan Investments Pty Ltd 50,000 0.38
Alsop Pty Ltd 45,000 0.35
BNP Paribas Nominees Pty Ltd <IB AU NOMS Retail Client DRP> 31,483 0.24
Total of Top 20 registered holders1 3,834,723 29.26
Analysis by range of holdings of Westpac Capital Notes 2 as at 1 October 2021
Number of Securities
Number of Holders of Westpac Capital
Notes 2 %Number of Westpac
Capital Notes 2 %
1 – 1,000 13,084 89.00 4,485,249 34.22
1,001 – 5,000 1,423 9.68 2,958,928 22.58
5,001 – 10,000 119 0.81 861,463 6.57
10,001 – 100,000 65 0.44 1,479,321 11.29
100,001 and over 11 0.07 3,320,744 25.34
Totals 14,702 100 13,105,705 100
There were eight security holders holding less than a marketable parcel ($500) of Westpac Capital Notes 2 based on a market price of $101.70 at the close of trading on 1 October 2021.
1. As recorded on the holder register by holder reference number.

278 WESTPAC GROUP 2021 ANNUAL REPORT
Shareholding information
Westpac Capital Notes 4
Top 20 holders of Westpac Capital Notes 4 as at 1 October 2021
Number of Westpac
Capital Notes 4 % Held
HSBC Custody Nominees (Australia) Limited 434,337 7.90
J P Morgan Nominees Australia Pty Limited 405,553 7.38
Citicorp Nominees Pty Limited 160,349 2.92
Berne No 132 Nominees Pty Ltd <684168 A/C> 119,524 2.17
Netwealth Investments Limited <Wrap Services A/C> 65,726 1.20
Willimbury Pty Ltd 60,000 1.09
Mutual Trust Pty Ltd 50,200 0.91
New Regency Pty Ltd 50,000 0.91
Nulis Nominees (Australia) Limited <Navigator Mast Plan Sett A/C> 44,428 0.81
Navigator Australia Ltd <JB Were List Fix Int Sma A/C> 43,013 0.78
Fulton Holdings Pty Ltd <Bunker Family A/C> 40,000 0.73
BNP Paribas Nominees Pty Ltd HUB24 Custodial Serv Ltd <DRP A/C> 39,066 0.71
Navigator Australia Ltd <MLC Investment Sett A/C> 33,045 0.60
Est Mrs Fay Cleo Martin-Weber 30,000 0.55
Australian Executor Trustees Limited <No 1 Account> 28,895 0.53
Merchant Foundation Pty Ltd < Merchant Charitable Fnd A/C> 28,482 0.52
Australian Executor Trustees Limited <IPS Super A/C> 23,731 0.43
Bond Street Custodians Limited <P03V7 - D78636 A/C> 20,000 0.36
Bytenew Pty Limited <Tertini Fam Sett No 2 A/C> 20,000 0.36
Jemido Pty Ltd 20,000 0.36
Total of Top 20 registered holders1 1,716,349 31.22
1. As recorded on the holder register by holder reference number.
Analysis by range of holdings of Westpac Capital Notes 4 as at 1 October 2021
Number of Securities
Number of Holders of Westpac Capital
Notes 4 %Number of Westpac
Capital Notes 4 %
1 – 1,000 6416 90.39 1,885,573 34.3
1,001 – 5,000 595 8.38 1,292,589 23.52
5,001 – 10,000 51 0.72 389,412 7.08
10,001 – 100,000 32 0.45 809,462 14.73
100,001 and over 4 0.06 1,119,763 20.37
Totals 7,098 100 5,496,799 100
There were seven security holders holding less than a marketable parcel ($500) of Westpac Capital Notes 4 based on a market price of $100.151 at the close of trading on 1 October 2021.

3 FINA
NC
IAL STA
TEM
EN
TS1 STR
ATE
GIC
RE
PO
RT
4 SH
AR
EH
OLD
ER
INFO
RM
ATIO
N2 G
RO
UP
PE
RFO
RM
AN
CE
279WESTPAC GROUP 2021 ANNUAL REPORT
Shareholding information
Westpac Capital Notes 5
Top 20 holders of Westpac Capital Notes 5 as at 1 October 2021
Number of Westpac
Capital Notes 5 % Held
HSBC Custody Nominees (Australia) Limited 1,277,699 7.56
Citicorp Nominees Pty Limited 838,459 4.96
J P Morgan Nominees Australia Pty Limited 555,504 3.29
BNP Paribas Nominees Pty Ltd HUB24 Custodial Serv Ltd <DRP A/C> 273,787 1.62
Netwealth Investments Limited <Wrap Services A/C> 249,452 1.48
HSBC Custody Nominees (Australia) Limited - A/C 2 228,615 1.35
Diocese Development Fund - Catholic Diocese of Parramatta 226,241 1.34
Australian Executor Trustees Limited <IPS Super A/C> 211,301 1.25
National Nominees Limited 181,884 1.08
Navigator Australia Ltd <MLC Investment Sett A/C> 147,327 0.87
BNP Paribas Nominees Pty Ltd <Agency Lending DRP A/C> 146,055 0.86
BNP Paribas Nominees Pty Ltd <Pitcher Partners DRP> 133,622 0.79
Netwealth Investments Limited <Super Services A/C> 119,105 0.71
Nulis Nominees (Australia) Limited <Navigator Mast Plan Sett A/C> 102,771 0.61
Mutual Trust Pty Ltd 100,057 0.59
Dimbulu Pty Ltd 100,000 0.59
Marrosan Investments Pty Ltd 92,000 0.54
Australian Executor Trustees Limited <No 1 Account> 61,961 0.37
Royal Freemasons' Benevolent Institution 60,000 0.35
Mrs Linda Anne Van Lieshout 60,000 0.35
Total of Top 20 registered holders1 5,165,840 30.56
1. As recorded on the holder register by holder reference number.
Analysis by range of holdings of Westpac Capital Notes 5 as at 1 October 2021
Number of Securities
Number of Holders of Westpac Capital
Notes 5 %Number of Westpac
Capital Notes 5 %
1 – 1,000 14,608 87.68 5,213,514 30.84
1,001 – 5,000 1,806 10.84 3,751,486 22.19
5,001 – 10,000 140 0.84 1,016,938 6.02
10,001 – 100,000 91 0.55 2,129,566 12.60
100,001 and over 15 0.09 4,791,879 28.35
Totals 16,660 100 16,903,383 100
There were four security holders holding less than a marketable parcel ($500) of Westpac Capital Notes 5 based on a market price of $103.70 at the close of trading on 1 October 2021.
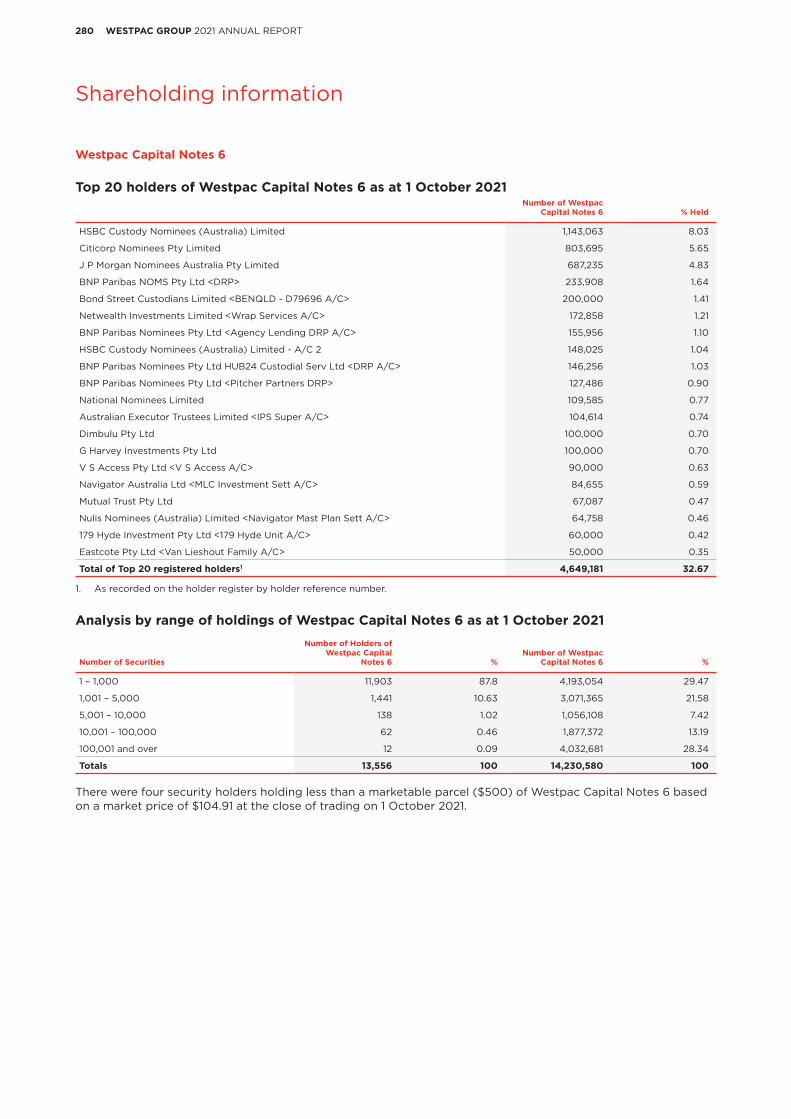
280 WESTPAC GROUP 2021 ANNUAL REPORT
Shareholding information
Westpac Capital Notes 6
Top 20 holders of Westpac Capital Notes 6 as at 1 October 2021
Number of Westpac
Capital Notes 6 % Held
HSBC Custody Nominees (Australia) Limited 1,143,063 8.03
Citicorp Nominees Pty Limited 803,695 5.65
J P Morgan Nominees Australia Pty Limited 687,235 4.83
BNP Paribas NOMS Pty Ltd <DRP> 233,908 1.64
Bond Street Custodians Limited <BENQLD - D79696 A/C> 200,000 1.41
Netwealth Investments Limited <Wrap Services A/C> 172,858 1.21
BNP Paribas Nominees Pty Ltd <Agency Lending DRP A/C> 155,956 1.10
HSBC Custody Nominees (Australia) Limited - A/C 2 148,025 1.04
BNP Paribas Nominees Pty Ltd HUB24 Custodial Serv Ltd <DRP A/C> 146,256 1.03
BNP Paribas Nominees Pty Ltd <Pitcher Partners DRP> 127,486 0.90
National Nominees Limited 109,585 0.77
Australian Executor Trustees Limited <IPS Super A/C> 104,614 0.74
Dimbulu Pty Ltd 100,000 0.70
G Harvey Investments Pty Ltd 100,000 0.70
V S Access Pty Ltd <V S Access A/C> 90,000 0.63
Navigator Australia Ltd <MLC Investment Sett A/C> 84,655 0.59
Mutual Trust Pty Ltd 67,087 0.47
Nulis Nominees (Australia) Limited <Navigator Mast Plan Sett A/C> 64,758 0.46
179 Hyde Investment Pty Ltd <179 Hyde Unit A/C> 60,000 0.42
Eastcote Pty Ltd <Van Lieshout Family A/C> 50,000 0.35
Total of Top 20 registered holders1 4,649,181 32.67
1. As recorded on the holder register by holder reference number.
Analysis by range of holdings of Westpac Capital Notes 6 as at 1 October 2021
Number of Securities
Number of Holders of Westpac Capital
Notes 6 %Number of Westpac
Capital Notes 6 %
1 – 1,000 11,903 87.8 4,193,054 29.47
1,001 – 5,000 1,441 10.63 3,071,365 21.58
5,001 – 10,000 138 1.02 1,056,108 7.42
10,001 – 100,000 62 0.46 1,877,372 13.19
100,001 and over 12 0.09 4,032,681 28.34
Totals 13,556 100 14,230,580 100
There were four security holders holding less than a marketable parcel ($500) of Westpac Capital Notes 6 based on a market price of $104.91 at the close of trading on 1 October 2021.

3 FINA
NC
IAL STA
TEM
EN
TS1 STR
ATE
GIC
RE
PO
RT
4 SH
AR
EH
OLD
ER
INFO
RM
ATIO
N2 G
RO
UP
PE
RFO
RM
AN
CE
281WESTPAC GROUP 2021 ANNUAL REPORT
Shareholding information
Westpac Capital Notes 7
Top 20 holders of Westpac Capital Notes 7 as at 1 October 2021
Number of Westpac
Capital Notes 7 % Held
HSBC Custody Nominees (Australia) Limited 1,635,575 9.49
J P Morgan Nominees Australia Pty Limited 843,145 4.89
Citicorp Nominees Pty Limited 744,247 4.32
National Nominees Limited 302,972 1.76
Netwealth Investments Limited <Wrap Services A/C> 228,072 1.32
BNP Paribas Nominees Pty Ltd HUB24 Custodial Serv Ltd <DRP A/C> 179,653 1.04
BNP Paribas Nominees Pty Ltd <Agency Lending DRP A/C> 163,813 0.95
BNP Paribas NOMS Pty Ltd <DRP> 151,990 0.88
Dimbulu Pty Ltd 150,000 0.87
Mutual Trust Pty Ltd 126,611 0.74
Marrosan Investments Pty Ltd 110,000 0.64
Bond Street Custodians Limited <BENQLD - D79772 A/C> 100,000 0.58
BNP Paribas Nominees Pty Ltd <Pitcher Partners DRP> 91,047 0.53
Netwealth Investments Limited <Super Services A/C> 86,580 0.50
Taverners No 11 Pty Ltd <Brencorp No 11 Unit A/C> 79,614 0.46
Valtellina Properties Pty Ltd 70,800 0.41
HSBC Custody Nominees (Australia) Limited - A/C 2 70,338 0.41
Navigator Australia Ltd <MLC Investment Sett A/C> 65,218 0.38
V S Access Pty Ltd <V S Access A/C> 64,624 0.38
Eastcote Pty Ltd <Van Lieshout Family A/C> 61,619 0.36
Total of Top 20 registered holders1 5,325,918 30.91
1. As recorded on the holder register by holder reference number.
Analysis by range of holdings of Westpac Capital Notes 7 as at 1 October 2021
Number of Securities
Number of Holders of Westpac Capital
Notes 7 %Number of Westpac
Capital Notes 7 %
1 – 1,000 17,045 89.71 5,519,783 32.04
1,001 – 5,000 1,720 9.05 3,744,685 21.73
5,001 – 10,000 149 0.78 1,150,505 6.68
10,001 – 100,000 75 0.40 2,178,312 12.64
100,001 and over 11 0.06 4,636,078 26.91
Totals 19,000 100 17,229,363 100
There was one security holder holding less than a marketable parcel ($500) of Westpac Capital Notes 7 based on a market price of $104.90 at the close of trading on 1 October 2021.

282 WESTPAC GROUP 2021 ANNUAL REPORT
Shareholding information
Westpac Capital Notes 8
Top 20 holders of Westpac Capital Notes 8 as at 1 October 2021
Number of Westpac
Capital Notes 8 % Held
BNP Paribas Nominees Pty Ltd <Agency Lending DRP A/C> 3,692,331 21.10
HSBC Custody Nominees (Australia) Limited 1,190,279 6.80
Citicorp Nominees Pty Limited 757,462 4.33
J P Morgan Nominees Australia Pty Limited 570,535 3.26
National Nominees Limited 261,326 1.49
Mutual Trust Pty Ltd 209,661 1.20
Dimbulu Pty Ltd 200,000 1.14
BNP Paribas NOMS Pty Ltd <DRP> 197,674 1.13
Netwealth Investments Limited <Wrap Services A/C> 161,111 0.92
BNP Paribas Nominees Pty Ltd HUB24 Custodial Serv Ltd <DRP A/C> 153,738 0.88
Taverners No 11 Pty Ltd <Brencorp No 11 Unit A/C> 131,700 0.75
HSBC Custody Nominees (Australia) Limited - A/C 2 105,483 0.60
Netwealth Investments Limited <Super Services A/C> 63,742 0.36
V S Access Pty Ltd <V S Access A/C> 51,570 0.30
Invia Custodian Pty Limited <Income Pool A/C> 39,900 0.23
Nulis Nominees (Australia) Limited <Navigator Mast Plan Sett A/C> 39,733 0.23
BNP Paribas Nominees Pty Ltd <Pitcher Partners DRP> 37,110 0.21
Navigator Australia Ltd <MLC Investment Sett A/C> 34,813 0.20
Australian Executor Trustees Limited <No 1 Account> 33,954 0.19
Adirel Holdings Pty Ltd 33,000 0.19
Total of Top 20 registered holders1 7,965,122 45.51
1. As recorded on the holder register by holder reference number.
Analysis by range of holdings of Westpac Capital Notes 8 as at 1 October 2021
Number of Securities
Number of Holders of Westpac Capital
Notes 8 %Number of Westpac
Capital Notes 8 %
1 – 1,000 14,720 89.31 4,769,626 27.26
1,001 – 5,000 1,558 9.45 3,080,745 17.60
5,001 – 10,000 138 0.84 986,538 5.64
10,001 – 100,000 54 0.33 1,031,791 5.90
100,001 and over 12 0.07 7,631,300 43.61
Totals 16,482 100 17,500,000 100
There was one security holder holding less than a marketable parcel ($500) of Westpac Capital Notes 8 based on a market price of $100.95 at the close of trading on 1 October 2021.
Voting rights of Westpac Capital Notes 2, Westpac Capital Notes 41, Westpac Capital Notes 5, Westpac Capital Notes 6, Westpac Capital Notes 7 and Westpac Capital Notes 8
In accordance with the terms of issue, holders of Westpac Capital Notes 2, Westpac Capital Notes 4, Westpac Capital Notes 5, Westpac Capital Notes 6, Westpac Capital Notes 7 and Westpac Capital Notes 8 have no right to vote at any general meeting of Westpac before conversion into Westpac ordinary shares.
If conversion occurs (in accordance with the applicable terms of the relevant AT1 instrument), holders of Westpac Capital Notes 2, Westpac Capital Notes 4, Westpac Capital Notes 5, Westpac Capital Notes 6, Westpac Capital Notes 7 or Westpac Capital Notes 8 (as applicable) will become holders of Westpac ordinary shares and have the voting rights that attach to Westpac ordinary shares.
Unquoted securities
Westpac also has the following unquoted securities on issue: USD 1.25 billion AT1 securities (comprised of 3 individual notes) which are all held by Cede & Co. as nominee for the Depository Trust Company. See Note 19 to the financial statements for further information.1 On 15 October 2021, Westpac issued a redemption notice notifying WCN4 holders that all outstanding WCN4 will be redeemed on the
optional redemption date, being 20 December 2021.
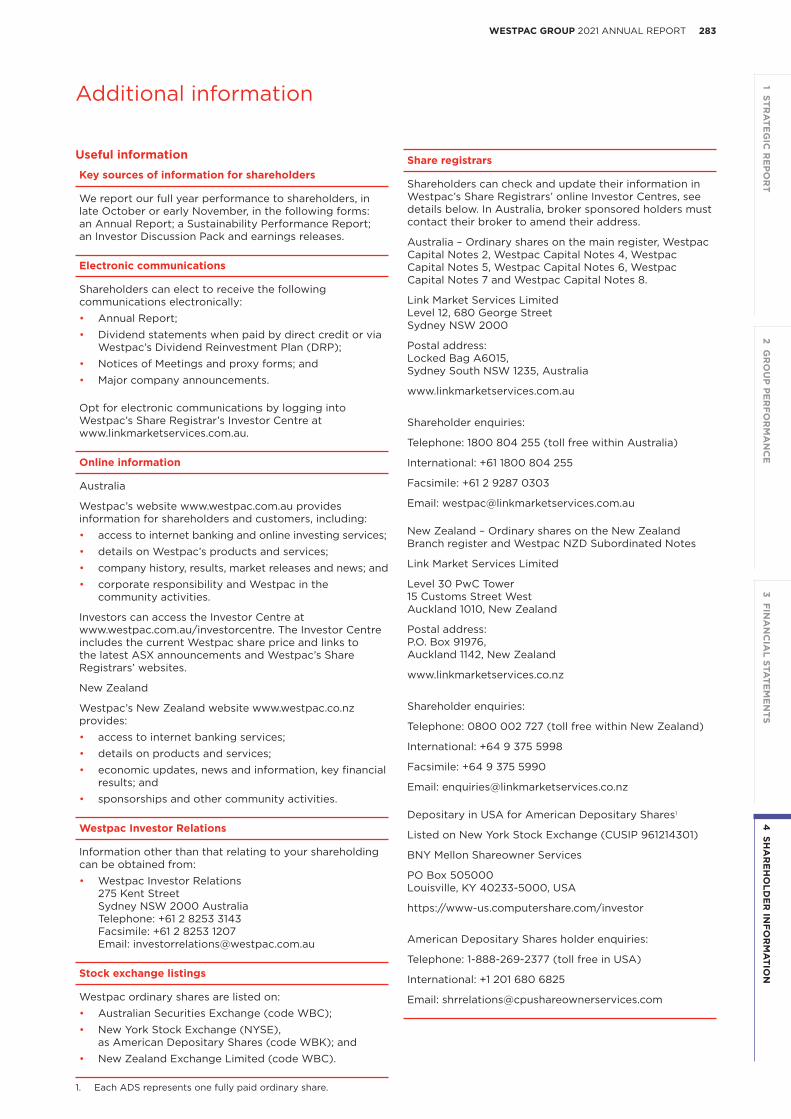
2833 FIN
AN
CIA
L STATE
ME
NTS
1 STRA
TEG
IC R
EP
OR
T4
SHA
RE
HO
LDE
R IN
FOR
MA
TION
2 GR
OU
P P
ER
FOR
MA
NC
EWESTPAC GROUP 2021 ANNUAL REPORT
Additional information
Useful information
Key sources of information for shareholders
We report our full year performance to shareholders, in late October or early November, in the following forms: an Annual Report; a Sustainability Performance Report; an Investor Discussion Pack and earnings releases.
Electronic communications
Shareholders can elect to receive the following communications electronically:• Annual Report;• Dividend statements when paid by direct credit or via
Westpac’s Dividend Reinvestment Plan (DRP);• Notices of Meetings and proxy forms; and• Major company announcements.
Opt for electronic communications by logging into Westpac’s Share Registrar’s Investor Centre at www.linkmarketservices.com.au.
Online information
Australia
Westpac’s website www.westpac.com.au provides information for shareholders and customers, including:• access to internet banking and online investing services;• details on Westpac’s products and services;• company history, results, market releases and news; and• corporate responsibility and Westpac in the
community activities.
Investors can access the Investor Centre at www.westpac.com.au/investorcentre. The Investor Centre includes the current Westpac share price and links to the latest ASX announcements and Westpac’s Share Registrars’ websites.
New Zealand
Westpac’s New Zealand website www.westpac.co.nz provides:• access to internet banking services;• details on products and services;• economic updates, news and information, key financial
results; and• sponsorships and other community activities.
Westpac Investor Relations
Information other than that relating to your shareholding can be obtained from:• Westpac Investor Relations
275 Kent Street Sydney NSW 2000 Australia Telephone: +61 2 8253 3143 Facsimile: +61 2 8253 1207 Email: [email protected]
Stock exchange listings
Westpac ordinary shares are listed on:• Australian Securities Exchange (code WBC);• New York Stock Exchange (NYSE),
as American Depositary Shares (code WBK); and• New Zealand Exchange Limited (code WBC).
Share registrars
Shareholders can check and update their information in Westpac’s Share Registrars’ online Investor Centres, see details below. In Australia, broker sponsored holders must contact their broker to amend their address.
Australia – Ordinary shares on the main register, Westpac Capital Notes 2, Westpac Capital Notes 4, Westpac Capital Notes 5, Westpac Capital Notes 6, Westpac Capital Notes 7 and Westpac Capital Notes 8.
Link Market Services Limited Level 12, 680 George Street Sydney NSW 2000
Postal address: Locked Bag A6015, Sydney South NSW 1235, Australia
www.linkmarketservices.com.au
Shareholder enquiries:
Telephone: 1800 804 255 (toll free within Australia)
International: +61 1800 804 255
Facsimile: +61 2 9287 0303
Email: [email protected]
New Zealand – Ordinary shares on the New Zealand Branch register and Westpac NZD Subordinated Notes
Link Market Services Limited
Level 30 PwC Tower 15 Customs Street West Auckland 1010, New Zealand
Postal address: P.O. Box 91976, Auckland 1142, New Zealand
www.linkmarketservices.co.nz
Shareholder enquiries:
Telephone: 0800 002 727 (toll free within New Zealand)
International: +64 9 375 5998
Facsimile: +64 9 375 5990
Email: [email protected]
Depositary in USA for American Depositary Shares1
Listed on New York Stock Exchange (CUSIP 961214301)
BNY Mellon Shareowner Services
PO Box 505000 Louisville, KY 40233-5000, USA
https://www-us.computershare.com/investor
American Depositary Shares holder enquiries:
Telephone: 1-888-269-2377 (toll free in USA)
International: +1 201 680 6825
Email: [email protected]
1. Each ADS represents one fully paid ordinary share.
Additional information

284 WESTPAC GROUP 2021 ANNUAL REPORT
Glossary of abbreviations and defined terms
AAS Australian Accounting Standards
AASB Australian Accounting Standards Board
ABS Asset-backed securities
ACCC Australian Competition and Consumer Commission
ADI Authorised Deposit-taking Institution
ADRs American Depositary Receipts
ADS American Depositary Shares
Advanced IRB Advanced Internal Ratings Based
AGM Annual General Meeting
ALCO Westpac Asset and Liability Committee
ALM Asset and Liability Management
AMA Advanced Measurement Approach
ANZSIC Australian and New Zealand Standard Industrial Classification
APRA Australian Prudential Regulation Authority
ASIC Australian Securities and Investments Commission
ASX Australian Securities Exchange
ASXCGC ASX Corporate Governance Council
AT1 Additional Tier 1
ATMs Automatic teller machines
ATO Australian Taxation Office
AUSTRAC Australian Transaction Reports and Analysis Centre
BAC Board Audit Committee
BankSA Bank of South Australia
BBSW Bank Bill Swap Reference Rate
BCBS Basel Committee on Banking Supervision
bps Basis points
BRCC Board Risk and Compliance Committee
CAGR Compound annual growth rate
CAPs Collectively assessed provisions
Cash EPS Cash earnings per share
CCB Capital Conservation Buffer
CDS Credit default swap
CEO Chief Executive Officer
CET1 Common Equity Tier 1
CFO Chief Financial Officer
CGU Cash Generating Unit
CHF Swiss franc
CLF Committed Liquidity Facility
Corporations Act Corporations Act 2001 (Cth)
COSO Committee of Sponsoring Organizations of the Treadway Commission
CPM Credit Portfolio Management
CRG Customer Risk Grade
CRO Chief Risk Officer
CRS Common Reporting Standard
CVA Credit valuation adjustment
DFAT Department of Foreign Affairs and Trade
D-SIB Domestic Systemically Important Banks
EAD Exposure at default
ECL Expected credit loss
EPS Earnings per share
ESG Environmental, social and governance
ESP Employee Share Plan
FBT Fringe benefits tax
FCA Financial Conduct Authority
FCS Financial Claims Scheme
FMA Financial Markets Authority
FTE Full time equivalent employees
FVA Funding Valuation Adjustment
FVIS Fair value through income statement
FX Foreign Exchange
GHG Greenhouse gas
Hastings Hastings Funds Management Limited
IAPs Individually Assessed Provisions
IASB International Accounting Standards Board
ICAAP Internal Capital Adequacy Assessment Process
IFRS International Financial Reporting Standards
Glossary of abbreviations and defined terms

2853 FIN
AN
CIA
L STATE
ME
NTS
1 STRA
TEG
IC R
EP
OR
T4
SHA
RE
HO
LDE
R IN
FOR
MA
TION
2 GR
OU
P P
ER
FOR
MA
NC
EWESTPAC GROUP 2021 ANNUAL REPORT
Glossary of abbreviations and defined terms
IFTI International Funds Transfer Instructions
IRRBB Interest Rate Risk in the Banking Book
IRS Internal Revenue Service
ISDA International Swaps and Derivatives Association
KMP Key Management Personnel
LCR Liquidity Coverage Ratio
LGBTIQ+ Lesbian, gay, bisexual, transgender, intersex and queer
LGD Loss given default
LIBOR London InterBank Offer Rate
LMI Lenders mortgage insurance
LTIFR Lost Time Injury Frequency Rate
LTVR Long Term Variable Reward
LVR Loan to value ratio
Moody’s Moody’s Investors Service
NaR Net interest income-at-risk
NCI Non-controlling interests
NII Net interest income
NYSE New York Stock Exchange
NSFR Net Stable Funding Ratio
NZX New Zealand Exchange Limited
OCC Office of the Comptroller of the Currency
OCI Other comprehensive income
OFAC Office of Foreign Assets Control
OTC Over the counter
PD Probability of default
PFIC Passive foreign investment company
PNG Papua New Guinea
RAMS RAMS Home Loans
RBA Reserve Bank of Australia
RBNZ Reserve Bank of New Zealand
RISKCO Westpac Group Executive Risk Committee
RMBS Residential Mortgage Backed Securities
ROE Return on equity
Cash ROE Return on equity on a cash earnings basis
RSP Restricted Share Plan
RWA Risk-weighted assets
S&P Standard & Poor’s
SaaS Software-as-a-Service
SEC US Securities and Exchange Commission
SME Small to medium enterprises
SOx Sarbanes-Oxley Act of 2002
STVR Short-Term Variable Reward
TCE Total committed exposures
TLAC Total Loss Absorbing Capacity
TSR Total Shareholder Return
UK United Kingdom
UKSS Westpac Banking Corporation UK Staff Superannuation Scheme
UNSC United Nations Security Council
US United States
VaR Value at Risk
VWAP Volume weighted average price
Westpac CPS Westpac Convertible Preference Shares
WGP Westpac Group Plan
WHS Workplace Health and Safety
WIB Westpac Institutional Bank
WNZL Westpac New Zealand Limited
WNZS Westpac New Zealand Superannuation Scheme
WPP Westpac Performance Plan
WSNZL Westpac Securities NZ Limited

286 WESTPAC GROUP 2021 ANNUAL REPORT
This page has been intentionally left blank.

Westpac Group Registered office275 Kent Street,Sydney NSW 2000 AustraliaTelephone: +61 2 9155 7713 Facsimile: +61 2 8253 4128International payments Telephone: +61 2 9155 7700Website: www.westpac.com.au/westpacgroup
Westpac Telephone – Consumer: 132 032 Telephone – Business: 132 142 From outside Australia: +61 2 9155 7700Website: www.westpac.com.au
St.George Bank St.George House 4-16 Montgomery StreetKogarah NSW 2217 AustraliaMail: Locked Bag 1Kogarah NSW 1485 AustraliaTelephone: 13 33 30Website: www.stgeorge.com.au
Bank of Melbourne Level 10, 150 Collins StreetMelbourne VIC 3000 AustraliaTelephone: 13 22 66From outside Australia: +61 3 8536 7870Website: www.bankofmelbourne.com.au
BankSA Level 8, 97 King William Street,Adelaide SA 5000 AustraliaMail: GPO Box 399,Adelaide SA 5001 AustraliaTelephone: 131 376From outside Australia: +61 2 9155 7850Website: www.banksa.com.au
RAMS RAMS Financial Group Pty LtdLevel 12, 321 Kent StreetSydney NSW 2000 AustraliaMail: GPO Box 4008, Sydney NSW 2001 AustraliaTelephone: +61 2 8218 7000Email: [email protected] Website: www.rams.com.au
BT Level 18, 275 Kent Street,Sydney NSW 2000 AustraliaTelephone: 132 135From outside Australia: +61 2 9155 4070Email: [email protected] Website: www.bt.com.au
Westpac Institutional Bank Telephone: 132 032Website: www.westpac.com.au
Institutional Bank LocationsHong KongPeople’s Republic of China– Beijing– ShanghaiRepublic of Singapore – SingaporeUnited States of America – New YorkUnited Kingdom – London
Westpac Pacific www.westpac.com.au/pacific
Westpac PNGLevel 4, Harbourside West BuildingStanley EsplanadePO Box 706, Port Moresby,NCD, Papua New GuineaTelephone: +675 322 0522Email: [email protected]
Westpac FijiLevel 1, Westpac House1 Thomson StreetSuva, FijiTelephone: +67 9 132 032 From overseas: (679) 321 7800Email: [email protected]
Westpac New Zealand 16 Takutai Square,Auckland 1010 New ZealandTelephone: +64 9 912 8000Website: www.westpac.co.nz Email: [email protected]
Global locationsSpecific contact details for the many locations globally can be located on our website at www.westpac.com.au. Select ‘About Westpac’ from the top menu bar, then ‘Global Locations’ from the ‘Explore’ menu.
Share Registrar Link Market Services Limited680 George StreetSydney NSW 2000AustraliaMail: Locked Bag A6015, Sydney South NSW 1235Telephone: 1800 804 255Facsimile: +61 2 9287 0303Email: [email protected] Website: www.linkmarketservices.com.au
Westpac Group SustainabilityEmail: [email protected] For further information on Westpac Group’s sustainability approach, policies and performance please visit www.westpac.com.au/sustainability. If you have feedback or a complaint related to sustainability, please visit www.westpac.com.au/contact-us/feedback-complaints/
Contact us
The 2021 Westpac Group Annual Report is printed on PEFC certified paper. Compliance with the certification criteria set out by the Programme for the Endorsement of Forest Certification (PEFC) means that the paper fibre is sourced from sustainable forests.

westpac.com.au