simplify a historically challenging measurement - olis,...
TRANSCRIPT
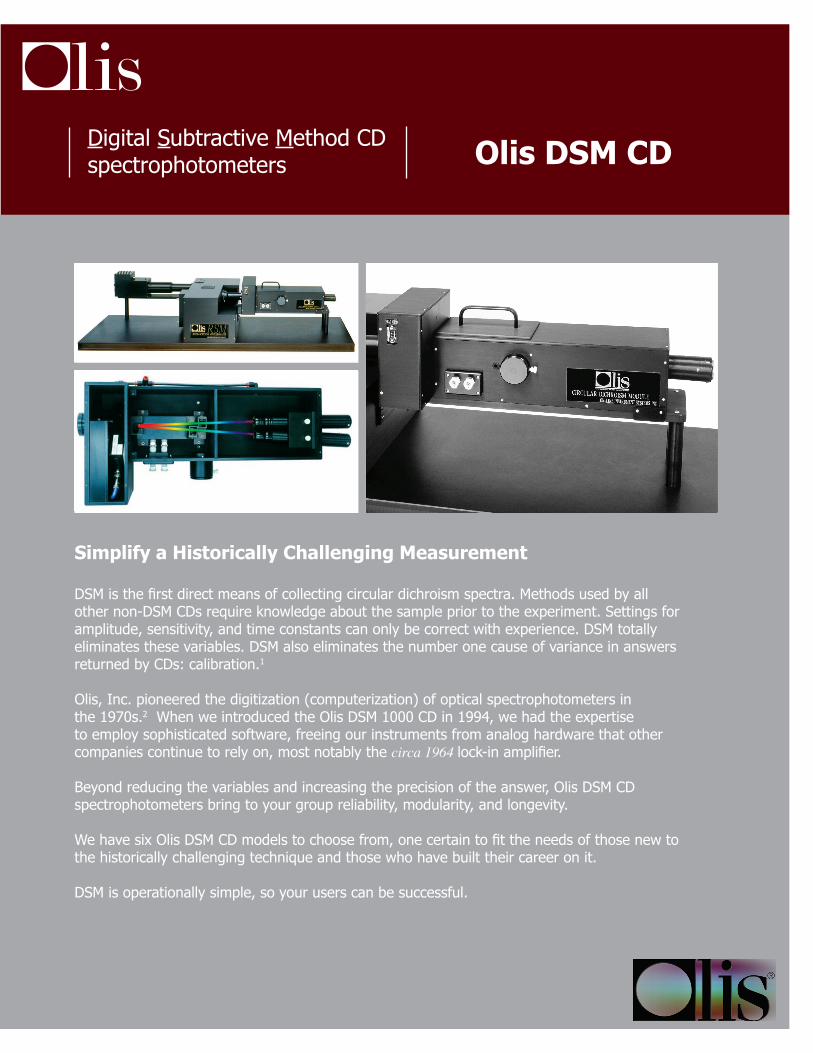
Simplify a Historically Challenging Measurement
DSM is the first direct means of collecting circular dichroism spectra. Methods used by all other non-DSM CDs require knowledge about the sample prior to the experiment. Settings for amplitude, sensitivity, and time constants can only be correct with experience. DSM totally eliminates these variables. DSM also eliminates the number one cause of variance in answers returned by CDs: calibration.1
Olis, Inc. pioneered the digitization (computerization) of optical spectrophotometers in the 1970s.2 When we introduced the Olis DSM 1000 CD in 1994, we had the expertise to employ sophisticated software, freeing our instruments from analog hardware that other companies continue to rely on, most notably the circa 1964 lock-in amplifier.
Beyond reducing the variables and increasing the precision of the answer, Olis DSM CD spectrophotometers bring to your group reliability, modularity, and longevity.
We have six Olis DSM CD models to choose from, one certain to fit the needs of those new to the historically challenging technique and those who have built their career on it.
DSM is operationally simple, so your users can be successful.
Olis DSM CD
lisDigital Subtractive Method CD spectrophotometers

2
Conspiring VariablesOlis DSM CD: Simple, direct, and error-free
Circular dichroism (CD) is an inherently difficult measurement to make. A large CD signal is 0.0001 AU. For the number one application, protein secondary structure, the spectral region of most interest is within 260-190 nm, where the light level is very low.
Challenges inherent to CDThe absorbing nature of the buffers used, the critical need for an ideal sample concentration, and patience and attention required while handling the sample in short (0.1-2 mm) pathlength cuvettes are other physical realities challenging those who choose to use CD in their studies.
Challenges unique to prior technology CDsHistorically designed CD spectrometers add other annoyances, including calibration variations plus lock-in amplifier settings for amplitude, time constants, and sensitivity. Other variables that contribute to the (in)accuracy of the measurements include baseline drift and finite linearity.
Calibration
A manual process conducted by a trained technician and required by all non-DSM CDs. The answer is only as good as the calibration, which is perfectly temporarily or, if done poorly, never. Confounding the issue, one cannot determine from a CD spectrum whether it was collected under perfect calibration conditions. And, correcting the error is not possible. Olis DSM requires no calibration. Ever.
Lock-in amplifier settings
Because we know how to find and collect the abs(L) and abs(R), we have eliminated the need for a lock-in amplifier and its time constant, amplitude, and sensitivity settings. These settings can only be correct with experience. Eliminating them removes the need for any prior knowledge about the sample. This asset’s value increases as the variety of samples increases (think shared equipment or core facility cases).
What could be more direct and obvious than acquisition by definition?
3
Olis DSM CD
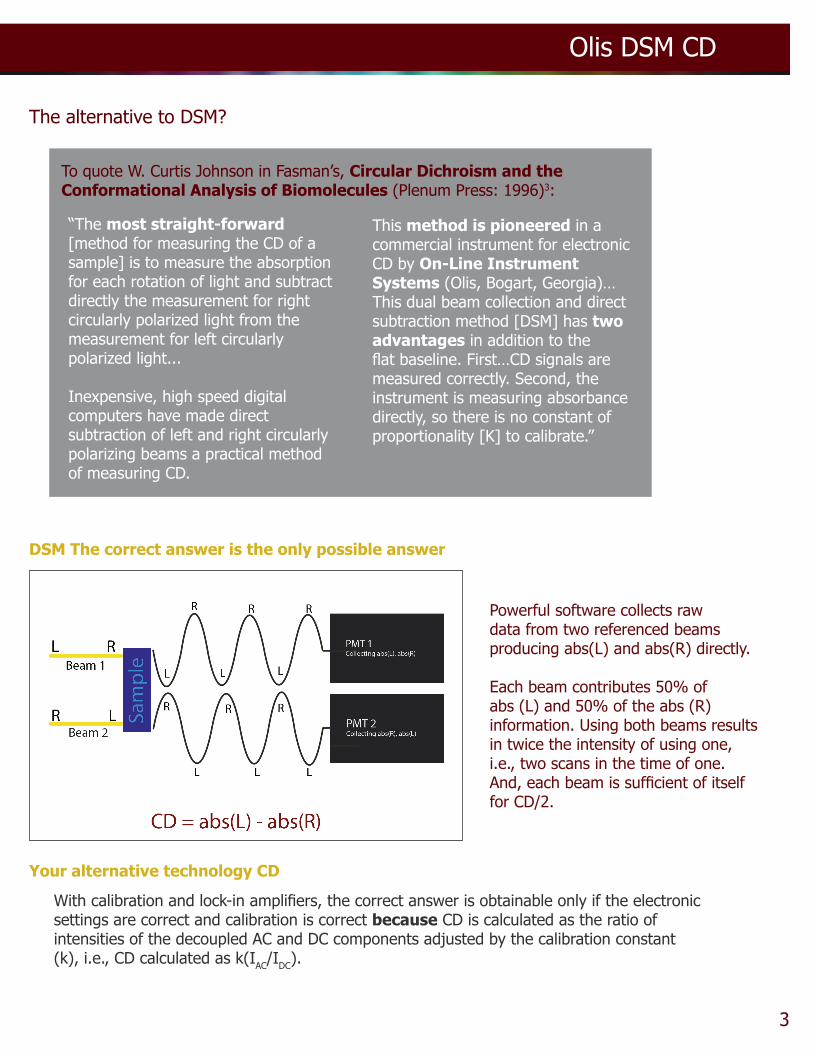
Powerful software collects raw data from two referenced beams producing abs(L) and abs(R) directly.
Each beam contributes 50% of abs (L) and 50% of the abs (R) information. Using both beams results in twice the intensity of using one, i.e., two scans in the time of one. And, each beam is sufficient of itself for CD/2.
With calibration and lock-in amplifiers, the correct answer is obtainable only if the electronic settings are correct and calibration is correct because CD is calculated as the ratio of intensities of the decoupled AC and DC components adjusted by the calibration constant (k), i.e., CD calculated as k(IAC/IDC).
The alternative to DSM?
“The most straight-forward [method for measuring the CD of a sample] is to measure the absorption for each rotation of light and subtract directly the measurement for right circularly polarized light from the measurement for left circularly polarized light...
Inexpensive, high speed digital computers have made direct subtraction of left and right circularly polarizing beams a practical method of measuring CD.
To quote W. Curtis Johnson in Fasman’s, Circular Dichroism and the Conformational Analysis of Biomolecules (Plenum Press: 1996)3:
This method is pioneered in a commercial instrument for electronic CD by On-Line Instrument Systems (Olis, Bogart, Georgia)…This dual beam collection and direct subtraction method [DSM] has two advantages in addition to the flat baseline. First…CD signals are measured correctly. Second, the instrument is measuring absorbance directly, so there is no constant of proportionality [K] to calibrate.”
DSM The correct answer is the only possible answer
Your alternative technology CD
4
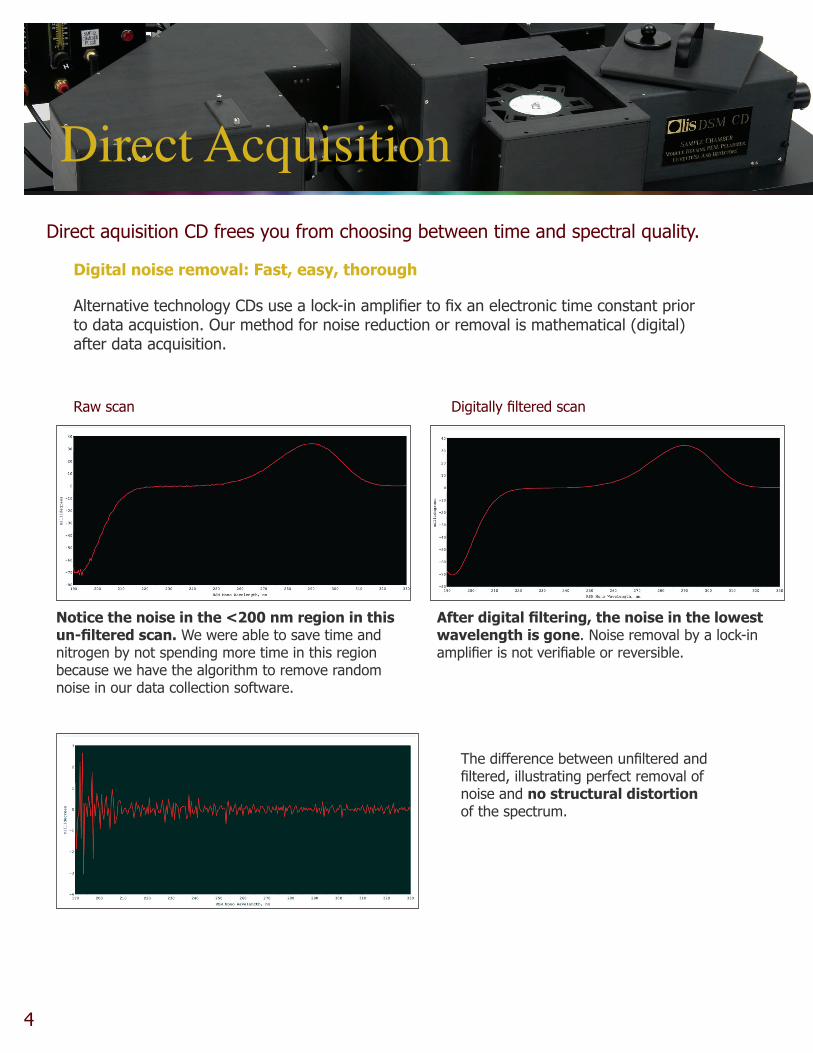
Digital noise removal: Fast, easy, thorough
Alternative technology CDs use a lock-in amplifier to fix an electronic time constant prior to data acquistion. Our method for noise reduction or removal is mathematical (digital) after data acquisition.
Notice the noise in the <200 nm region in this un-filtered scan. We were able to save time and nitrogen by not spending more time in this region because we have the algorithm to remove random noise in our data collection software.
After digital filtering, the noise in the lowest wavelength is gone. Noise removal by a lock-in amplifier is not verifiable or reversible.
The difference between unfiltered and filtered, illustrating perfect removal of noise and no structural distortion of the spectrum.
Raw scan Digitally filtered scan
Direct aquisition CD frees you from choosing between time and spectral quality.
Direct Acquisition

5
Olis DSM CD
Analyzing temperature dependent scans4
For decades, thermal denaturation studies have been isolated to single wavelength traces because of the tremendous difference in time, energy, nitrogen, and data handling between one and many wavelengths. Scanning quickly without concern about noise makes 3D acquisition much more attractive.
The data analysis software that comes with every Olis DSM CD not only calculates
the transition temperature and enthalpy from the raw data but includes another mathematical means of noise removal:
singular value decomposition. (If you don’t know about SVD, now is the time to learn!)
Temperature dependent scans shown in Olis SpectralWorks software; three
selected wavelength traces in right panel.
Eigenvector presentation, suggesting the presence of two species, as shown in the
first two columns of the plots.
Non-structured data, noise, is isolated and removed in this step. Noise “scans” fill the
remaining four columns of plots.
Numeric values beneath the graphic eigenvectors aid in analysis.
Results of spectral reconstruction fit: Starting and final form of protein (left) and
temperature dependence (right).
Also returned are the transition temperature and enthalpy values, plus
standard deviation values.
Results of SVD

6
Olis DSM 17 CD spectrophotometer
Dual beam, superior NIR performance
Built around the classic Cary 14/17 UV/Vis • [NIR] monochromatorWidest available spectral range, ≤185-• 2600 nmComputer-controlled slit width • Full use of Cary prism-grating monochromator • for dual beam absorbance and CD
Olis DSM 20 CD spectrophotometer
Closest to the competition
Built around the Olis Hummingbird subtractive • double monochromatorSmallest CD available• Brilliant light throughput, 170 - 700 nm• Ideal for most common CD applications•
Olis DSM 1000 CD spectrophotometer
Highest light throughput of any Olis CD
Built around the Olis RSM 1000, featuring • the singular DeSa monochromatorTrue dual beam detection• Maximum modularity• Upgradeable to FDCD, CPL, LD• Spectral range from vacuum UV to NIR; • default 170-540 nm Only rapid-scanning CD instrument • available, up to 62 scans/sec are practical in the >220 nm regions, including optional NIR
Models & Configurations

7
Olis DSM CD
Olis MultiScan, aka, mini “Protein Machine”
Save time, sample, and energy
Simultaneous CD, fluorescence emission and • excitation spectra, light scatter, second derivative spectra, absorbance (and CD) spectraOne software package• Optimal collection time• Minimal sample • High throughput means of capturing data on • samples undergoing thermal denaturationAutomatic “Data Tree” data storage oragnizes all • data into manageable folders for easy analysis
Olis DSM 172 CD spectrophotometer
Single beam detection• Optically identical to Olis DSM 17 CD• Easily positioned polarizers and • PEM, extending uses to CD, CPL, FDCD, polarization of fluorescence, anistropy, absorbance, ORDScanning emission monochromator, optional•
Modular polarization hardware
Olis DSM 17 MCD spectrophotometer
Optics, your cryogenic magnet, detector chamber
Single beam detection• PEM external to the optical bench• Optically identical to the Olis DSM 172 CD• Automatic detector changeover from Vis to • NIR, optionalOlis software for computerized control of • magnet, optional

8
NIR Circular Dichroism
Non-DSM CD spectrophotometers have great difficulty dealing with the sharp and dramatic intensity variations in the NIR of the xenon arc lamp because they operate by decoupling the AC and DC components of the light. Thus, there are very few commercial NIR CDs and none which operate above 1100 nm.
The Olis DSM models – collecting CD not from an AC/DC ratio but from direct acquisition of abs(L) and abs(R) – handle these strong emission lines correctly and easily. And, because there is so much light at these wavelengths, the lowest noise regions in a NIR scan are actually where the normally confounding sharp intensity peaks are!
Olis CDs can be dedicated to NIR or configurable for both UV/Vis and NIR. In the model 17, the only change from one spectral region to the next is the detector: PMT for UV/Vis and InGaAs for NIR, with the changeover computerized or manual. In the model 20, the decision as to the spectral range must be made at time of manufacture. In the model 1000, both the detectors and the optical surfaces that determine the spectral range – the gratings – must be exchanged between UV/Vis and NIR studies. These changes are quick, simple, and tool-free.
Success working with turbid samples
Without integrating spheres, moving sample stages, or other complication, the Olis DSM CD acquires credible spectra from particulate sample preparations. (Biochemistry 2002, 41, 7391-7399)
Olis DSM Techniques

9
Olis DSM CD
Common Olis CD accessories
MCD Made Economical and Accessible
Not every MCD experiment needs to be done with a high field $100K magnet. In 2006, we introduced the DeSa Magnet, a 1.4 Tesla model which is perfect for many experimental cases. To quote one owner: “The data are wonderful and the magnet is certainly worth its weight … it does a great job.”4 And, given that it is 1/20th the cost of a superconducting magnet, MCD in a pedagogical environment is now entirely practical. See the Olis DeSa Magnet brochure for more details.
DeSa 1.4 Tesla Permanent Magnet
Short Pathlength Titrators
Pipetting into any dual beam Olis DSM CD can be done with the sample compartment lid off, because the ambient room light will be seen equally in the two beams and thus is subtracted out like the other non-CD specific information. But, when many titrations are anticipated and for use with the single beam Olis CDs, choose one of the four Olis titrators. Designed expressly for use in CD, these titrators can be used with all pathlength cuvettes, including < 2 mm. Mixing is done within the titrator, so mixing within the cuvette is not necessary. Many other benefits accrue; see the titrator brochure for more details.
Olis Titrator
Millisecond Kinetic Studies, aka Stopped-flow
Olis, Inc. was established on the founder’s expertise in stopped-flow kinetics.2 Our stopped-flow for dual beam CD employs a cylindrical 2 mm quartz window and dead time of under 5 ms. “Simple, Useful, and Affordable”, this mixing device can be used with all Olis DSM CDs (shown here on the model 20). Algorithms within the Olis software are provided for fitting 2D and 3D data to exponential and poly-exponential equations.
Olis Stopped-flow

10
Algorithms for Determination of Protein Secondary Structure
CDSSTR, CONTINLL, and SELCON3 as pull-down fits
These secondary structure determination algorithms are mathematically as their authors wrote them. Olis, Inc. reproduced them from the public literature6 and public domain site of Narashima Sreerama, CDPro7, and made them easily accessible under the ‘Fits’ menu of the Olis GlobalWorks and SpectralWorks programs.
All three algorithms use variable selection of known secondary structure to achieve estimation of secondary structure composition from an unknown CD spectrum.
Secondary structure fit results
The results of a protein secondary structure determination are presented as fractional composition of secondary structure motifs.
These include:alpha-helix• beta-strand• turns• proline-turns• unordered segments• Graphical representations of the • spectra and residuals
Far more information on the Olis DSM CD technology instrumentation is available on our very extensive and technically rich website, www.olisweb.com. And please, ask about any parameter that is not addressed in this brochure or website which interests you.
Algorithms

11
Olis DSM CD
Transform any Olis DSM CD spectrophotometer into Olis CLARiTY
See these and many other “first” experiments at http://olisweb.com/Products/Absorbance/Clarity.html
Exchange the CD sample compartment (see front cover, lower left photograph) for the CLARiTY sample compartment shown here, change to the appropriate software package, and you have created an absorbance spectrophotometer that is perfectly immune to scatter and thus useful for work with living cell suspensions, nanoparticles, and other “impossibly” turbid samples.
The Olis CLARiTY 1000, which employs the DeSa rapid-scanning monochromator, has the extraordinary ability to scan hundreds of nanometers each millisecond.
Difference spectra capturing the classic reduced-oxidized spectra, plus another 60 nm into the UV, showing the NADP peak, acquired from living yeast cells in suspension on an Olis CLARiTY 1000A.
No longer a CD, your Olis becomes a UV/Vis NIR for dynamic study of suspensions
Olis CLARiTY data

For more details about Olis DSM CD spectrophotometers and other Olis products:
[email protected] (Worldwide) 1-800-852-3504 (US & Canada)
Olis, Inc. | 130 Conway Drive | Suites A, B, & C | Bogart, GA 30622 | USA
“No calibration did it for me.”
Marc Pusey, NASA Flight Center
Footnotes
Pinpointing calibration as #1 and inaccurate pathlength as #2 is the 2010 publication from NPL: “International comparability in spectroscopic measurements of protein structure by circular
dichroism: CCQM-P59.1”
Olis founder, Dr. Richard J. DeSa, is recognized as the first to publish computerized data acquisition:”A Practical Automatic Data Acquisition System for Stopped-flow Spectrophotometry,”
R. J. DeSa and Q. H. Gibson, Computers and Biomedical Research, 2, 494-505 (1969).
Johnson, W. C. (1996). Circular dichroism instrumentation. In G. Fasman (Ed.), Circular Dichroism and the Conformational Analysis of Biomolecules (pp. 640, 644-645).
New York: Plenum Press.
See these data in high resolution at http://olisweb.com/Products/CircularDichroism/data/temperaturedata.html.
Also, these data are included as demonstration files when you download our free 30 day trial version of Olis GlobalWorks, http://olisweb.com/Olis-Download-Software.html
Written communication from Martin Stillman, February 2011. He continued, “As far as I can tell it doesn’t interfere with the Jasco at all - as we normally put my 5.5T supercon magnet in,
this is less hazardous!”
Reviews that are available in the literature compare these determinations.
http://lamar.colostate.edu/~sreeram/CDPro
1.
2.
3.
4.
5.
6.
7.