simplifying administration of health insurance · pdf filesimplifying administration of health...
TRANSCRIPT

Simplifying Administration of Health Insurance
by Mark Merlis
January 2009

Table of Contents Introduction .............................................................................................................................. 1 Defining and classifying administrative costs ..................................................................... 2 Estimates of Administrative Costs ........................................................................................ 5
National Health Expenditures ........................................................................................... 5 Private insurance administrative costs ............................................................................. 8 Provider costs ....................................................................................................................... 9 Employer costs ..................................................................................................................... 9
Simplifying insurance-related transactions ....................................................................... 10 Pre-HIPAA initiatives ....................................................................................................... 10 HIPAA and ASCA ............................................................................................................. 12 Progress and barriers......................................................................................................... 13 Policy options ..................................................................................................................... 15
Reform proposals with implications for administrative complexity or costs............... 17 Open FEHB or similar exchange to general public....................................................... 17 Guaranteed issue and community rating....................................................................... 18 Minimum loss ratio............................................................................................................ 19 Single payer ........................................................................................................................ 20 Reinsurance......................................................................................................................... 21 Interstate sale of insurance and association plans ........................................................ 22 Encourage health savings accounts or higher deductible plans ................................. 23
Conclusion .............................................................................................................................. 23 Appendix: Detailed Estimates of Administrative Costs .................................................. 25
Health plan costs ................................................................................................................ 25 Physicians............................................................................................................................ 28 Hospitals.............................................................................................................................. 29 International comparison.................................................................................................. 30
References ............................................................................................................................... 32
Comments on a previous draft of this paper were provided by members and staff of the National Academy of Public Administration and National Academy of Social Insurance joint study panel on Management Analysis of Approaches for Expanding Access to Health Care. Opinions expressed in this paper are the author’s and not those of the panel or of the academies.

Simplifying Administration of Health Insurance
Introduction The high administrative costs of America’s health insurance system, with its thousands of insuring entities and over a million providers and practitioners, have been a focus of policy discussion for decades. Advocates of single-payer options have often pointed to the lower costs in other countries’ systems or in our own Medicare program and have suggested that savings on administrative spending from adoption of universal public insurance could finance much of the cost of care for the uninsured. Conversely, those who favor a reduced role for insurance in medical care financing—for example, through the promotion of high-deductible insurance plans—contend that this approach would save money because a third party would not be interposed in many routine consumer-provider transactions. In effect, both those views point toward a utopia of simplicity in which there would no insurance-related costs. At one extreme might be, not universal insurance, but a claims-free system of budgets and salaries—perhaps the pre-Thatcher British National Health Service. At the other extreme, all costs of health care would be paid directly by the consumer. Some individual practitioners and entire sectors—for example, hearing aids and related care—still operate in this prelapsarian way. This report assumes that, whatever shape health reform might take, there will still be at least one insurer, doing some of the things insurers currently do. It begins with a review of some ways of defining or classifying administrative costs, both of insurers and of other participants in the system, and the fragmentary estimates of how large these costs are. This is followed by a discussion of current efforts to reduce administrative costs, many of which have focused on standardizing and simplifying transactions among insurers, providers, and employers. It then considers how various health care reform proposals, whether or not directly targeted at administrative costs, might reduce—or add to--the complexity of the current system.
Simplifying Administration Page 1

Defining and classifying administrative costs
Administrative costs of the health insurance system include (a) spending by public and private health insurers other than actual payments to providers and (b) costs incurred by other system participants, including providers, employers, and consumers, in dealing with insurers. Identifying and estimating the second class of costs has proved elusive, but even the first is less clear-cut than it appears.
In an influential 1992 article, Kenneth Thorpe suggested that
administrative costs could be classified in terms of four functions or components and showed how they could be assigned to different sectors of the system (table 1).
Table 1. Administrative Costs by Function and Sector of the US Health Care System
Function/ component
Health insurance
Hospitals Nursing homes
Physicians Firms Consumers/ individuals
Transaction- related
Claims processing
Admitting, billing
Admitting, billing
Billing Tracking employee hires/ terminations
Submitting claims
Benefits management
Statistical analyses, quality assistance [sic], plan design
Management information systems
Management information systems
Management information systems
Internal analyses
Tracking expenses eligible for reimbursement
Selling and marketing
Underwriting, risk/ premiums, advertising
Strategic planning, advertising
Strategic planning
Advertising Flexible benefit programs
Search costs
Regulatory/ compliance
Premium taxes, reserve requirements
Waste management
Discharge planning
Licensing requirements
Filing summary plan descriptions, COBRA obligations
Mandated benefit laws
Source: Thorpe.
Simplifying Administration Page 2

Some of the specific items or their placement may be open to question.1 More important for the purpose of this paper, many of the costs cited, while clearly administrative, are not related to the insurance system. For example, providers would advertise to attract patients even in an insurance-free, cash on the table system. (Indeed, they might advertise more, because they could not rely on insurers to steer patients to them through network arrangements.) Still, the formulation is useful in emphasizing that health insurance imposes costs on many different actors and that some of these are intangible opportunity costs—such as the time spent by consumers in finding a health insurer and picking from among available benefit choices.
Perhaps a simpler way of thinking about insurance-related administrative
costs is to enumerate all the activities that people or organizations must perform that they would not perform in a cash-only universe. As table 2 suggests, many of these can be characterized as transactions or as exchanges of information between two different parties in the system. Other columns or rows could be added—for example, for transactions with government, as regulator or tax collector, and for the brand-new world of transactions with the financial institutions that hold health savings account deposits. And there certainly might be more items in each cell.
1 For example, state mandated benefit laws impose costs on consumers by preventing them from selecting less extensive and less costly benefit packages, but it is hard to see how these are administrative costs. And some provider functions, such as waste management, might easily be classed as patient care rather than administration.
Simplifying Administration Page 3

Table 2. Insurance-related transactions or information exchanges Employer Insurer or ASO
(agents/brokers may be involved in some functions)
Provider
Consumer Plan selection, enrollment, status changes. Payroll deduction. Complaint resolution. COBRA.
Marketing, nongroup plan selection and enrollment. Underwriting. Process, reimburse non-assigned claims. EOBs. Info about covered dependents. Grievances, appeals.
Obtain insurance information. Collect copays, balance billing. Provide/obtain required referrals. Provide info needed by consumer for non-assigned claim.
Employer (other than employer acting as insurer)
Select, contract with insurer(s). Provide enrollment, status change info. Pay premiums. May require quality, P4P, or other reporting.
[Some possible contacts in the context of worker’s compensation claims, which will not be considered here]
Insurer (includes self-insured employer or its administrative service organization, ASO)
Insurer-to-insurer: coordination of benefits
Contracting, price negotiation. Verify insurance enrollment, service coverage. Credentialing. Claims. Pre-authorization, UR, and disease management. Quality and P4P reporting.
In an insurance-free world, the table would have only one cell—
provider/consumer—and there would only be one kind of transaction, billing and collection. Even this would be dramatically simplified: the bill might just read “Saw Mrs. Jones, $150.” In a world with just one insurer, such as a Canadian provincial health plan, the employer column would disappear (unless
Simplifying Administration Page 4

private supplementary coverage were permitted, an important qualification to be discussed later). In a multi-insurer world with employer-based coverage, all the cells remain. The goal of simplification in this context is to eliminate some of the transactions in a given cell or make it possible to complete them more easily or expeditiously.
Estimates of Administrative Costs
There are numerous estimates of the administrative costs of health plans and public insurance programs, as well as a few attempts to estimate costs borne by providers and employers. This section begins with the most commonly cited figures, those in the National Health Expenditures (NHE) series developed by the Centers for Medicare and Medicaid Services (CMS). It then briefly summarizes some of the other estimates of private insurance and provider costs. More details of individual results are furnished in the appendix.
National Health Expenditures The NHE has a category denoted as “administrative costs and net costs of
private insurance.” For public programs, such as Medicare and Medicaid, the figure is derived from Treasury documents, additional CMS data, and state reports. The private insurance figure, constructed from a variety of sources, is meant to equal total premium revenue minus benefit payments; it thus includes administrative costs, other expenses such as taxes, and surplus or profit. Non-premium revenues, such as investment income, are omitted (CMS 2006).2
Figure 1 shows the NHE estimates for private insurance and Medicare
from 1966 through 2005. The numbers are administrative costs and profit as a percent of total costs. Note that the NHE does not include estimates of provider administrative costs.
2 The sources do not include data on administrative costs of self-insured plans, such as fees paid to administrative service organizations. These costs are implicitly present, because the method incorporates total benefit/cost ratios derived from insurance company data, but they may be overstated to the extent that the ratio is lower in large, self-insured plans than under commercial coverage.
Simplifying Administration Page 5

Figure 1. Administrative Costs and Net Cost of Private Insurance as a Percent of Total Cost, 1996-2005
Source: CMS National Health Expenditures series, available at http://www.cms.hhs.gov/NationalHealthExpendData/downloads/nhe2006.zip. As America’s Health Insurance Plans (AHIP) have pointed out, the
private insurance number varies considerably, ranging from 9% to 15% over the years (Lemieux). This may reflect fluctuations in profitability. Health insurance was long thought to be subject to a 6-year “underwriting cycle,” with years of higher profits followed by years of lower ones. This cycle has clearly moderated in recent years, and some analysts contend it no longer exists. One possible factor is increasing consolidation in the health insurance industry, an issue to be considered below. Declining competition in many markets may make it easier for insurers to pass rising benefit costs to purchasers instead of accepting reduced profit margins.
The total Medicare estimate includes payments to Medicare Advantage
plans, and the Medicare administrative costs include the administrative component of MA plan bids—on average, about 8% of the bid.3 If MA costs are excluded, administrative costs for original Medicare in 2005 drop from the 3% shown in the figure to about 2%. Implementation of the new Part D prescription drug program in 2006 has probably increased Medicare’s administrative cost percentage, but estimates are not yet available.
3 Personal communication, Anne B. Martin, CMS, to Paul van de Water, NASI, October 2007.
Simplifying Administration Page 6

Some analysts believe that the Medicare figures are understated, or that comparisons between Medicare and private insurance are inappropriate, for various reasons (Litow; Zycher; Lemieux):
• The NHE estimates fail to allocate to Medicare some program-related
costs incurred by other federal agencies (such as prosecution of Medicare fraud by the Justice Department or policymaking by Congress, equivalent to private insurance management). While this is true, analysts’ attempts to allocate these outside costs are not very persuasive.
• Medicare has lower claims processing costs relative to benefit costs than
private insurance, because the average Medicare claim is larger. This is definitely not true of inpatient care—beneficiaries have more discharges at a lower cost per discharge—and probably not for other services. On the other hand, it is the case that Medicare’s fixed costs are being compared to a larger amount of aggregate benefit spending, resulting in a lower percentage.
• Medicare spends too little on valuable administrative activities such as
disease management, member education, and customer service.
Whatever the merit of these objections, it is clear that private insurers incur some costs, such as for marketing and underwriting, that are not incurred by public programs. And of course even nonprofit health plans seek to achieve some surplus, as a cushion against future losses or to fund capital spending. Whether profits should be included in estimates of administrative cost is debatable. Some of the estimates described in the next section include profit and others do not.
Some analysts also attempt comparisons of US administrative costs,
drawn from the NHE and other sources. The appendix discusses one frequently cited study comparing costs in the US and Canada.
Simplifying Administration Page 7

Private insurance administrative costs
Estimates of insurance costs are derived from surveys of insurers or from insurer filings with state insurance departments. Total costs for Blue Cross plans and commercial insurers across all lines of business, not including profit or surplus, tend to be about 12% of premiums. (One lower estimate in the appendix excludes some sales costs.) Although there is a longstanding perception that HMOs have higher costs because of their more intensive care management activities, one study of the Blues’ commercial business found that HMOs’ costs were actually slightly below those for indemnity/PPO plans and higher than those for POS plans. This may because all types of plans have now adopted some HMO-like management practices.
Breaking down insurers’ costs is quite difficult, because each of the
available studies has a different way of categorizing functional components. Very roughly, claims processing and customer service account for 2% to 4% of premiums. Direct sales and marketing expenses, including underwriting costs, are 3% to 4% of premiums, although one study that tries to estimate the share of non-marketing cost centers that might be considered as marketing-related gives an indirect marketing cost estimate of 8%. State premium tax rates range from zero to 4.3%, but are commonly in the 2% to 3% range (ARC). These taxes are sometimes waived for the Blues and are never paid by self-insured employers.
Administrative costs are much higher for small employer groups—often
in the range of 20% to 30% of premiums—than for larger ones, for several reasons. First, marketing costs are higher. While larger groups commonly deal directly with the insurer, small groups are enrolled by agents and brokers who are paid on commission.4 Second, because expenses for small groups are difficult to predict, insurers often demand higher risk reserves. Third, small group carriers in most states still engage in underwriting, with its attendant costs, to set each group’s premium rate. For all these reasons, costs in the nongroup market may be even higher, although there are no reliable data.
Larger employers who self-insure generally contract with insurers or
other third party administrators on an administrative services only (ASO) basis. Blue Cross ASO charges range from 8% to 9% of total health benefit spending; non-insurer third party administrators may charge less. In either case, costs are lower than for insured groups of the same size, because marketing expenses are negligible, the plan pays no premium taxes, and the contractor establishes no risk reserves. In addition, the employers themselves usually perform some functions,
4 Agents typically sell the products of one insurance company, while brokers offer several carriers’ products.
Simplifying Administration Page 8

such as processing enrollments and collecting premiums, that would otherwise be performed by an insurer.
Provider costs Overall administrative costs for physicians are in the range of 25%-30% of
practice revenues. Hospital administrative costs appear to be slightly lower, although the distinction between patient care and administrative costs may be fuzzy. Separating out insurance-related costs is difficult—especially for physician offices, where the same employee may be scheduling appointments (non-insurance), obtaining coverage information from patients (insurance), and so on.
For physicians, one study found costs related to claims and utilization
management amounting to 10% of practice revenues. Another study, which estimated insurance-related costs in more cost centers and included an estimate of physicians’ time spent on insurance matters, estimated costs for a primary care office of 15% of revenues. For hospitals, insurance-related costs may be in the range of 7% to 11% of total patient revenues. It should be noted, however, that the available studies are all based on costs in California. Total hospital spending in California, per capita, was $1,613 in 2004, compared to a national average of $1,931.5 If fixed costs are being spread across smaller total revenues in California than elsewhere, they might be higher as a percent of revenues than national averages.
Employer costs Larger employers—those with 200 or more workers—often perform
enrollment and premium collection functions that would otherwise be performed by an insurer or ASO contractor. A study in 2000 estimated that these employers were spending $250 per covered worker to administer health benefits (Kaiser/HRET). This would have been about 10% of health benefit costs for single coverage and 4% of costs for family coverage in that year. (This assumes that the employer’s administrative costs are about the same for both coverage types.) As compensation of human resources personnel has probably not kept pace with rising health care costs, these percentages are likely to have dropped in more recent years.
5 NHE estimate, available at http://www.cms.hhs.gov/NationalHealthExpendData/downloads/res-us.pdf.
Simplifying Administration Page 9

Simplifying insurance-related transactions
There has been substantial progress toward standardization of provider-insurer and employer-insurer information exchanges, partly spurred by the 1996 enactment of the Health Insurance Portability and Accountability Act (HIPAA). While HIPAA has now been largely implemented, there remain many complications and some areas in which uniformity remains a distant goal. Less has been done to simplify transactions between consumers and the other actors, partly because most efforts have focused on electronic exchanges to which consumers are rarely a party. (This could well change, as it is easy to imagine that some consumers will eventually expect to be able to perform some functions on-line, such as adding a dependent to their coverage or filing a non-assigned claim.)
It is important to distinguish the information exchanges discussed in this
section, which involve insurance-related transactions, from electronic health information (EHI) exchange among different providers. There is currently considerable interest in the development of computerized medical records and interoperability standards that would allow exchange of these records among providers, to improve coordination, reduce medical errors, and so on. While insurance-related exchange and EHI are not entirely unrelated—for example, information needed to file a claim could be derived from a medical record entry—EHI is a much grander and more difficult undertaking than the measures considered here.
Pre-HIPAA initiatives Standardization began with the development of uniform claims forms.
Work in this area began in 1968, just after the implementation of Medicare and Medicaid. The first standard form, the UB-82 for institutional services, was finally approved by the National Uniform Billing Committee in 1982; its successor, the UB-92, is now in more or less universal use. The parallel form for practitioner services was the HCFA-1500 (now the NUCC-1500, for the National Uniform Claim Committee).
While many payers and providers adopted these paper forms, their use was by no means universal, and the transition to electronic billing and payment was hindered by the existence of numerous different processing systems, each with its own expectations about what fields needed to be completed and how data were to be coded. Private and sometimes public clearinghouses emerged—in effect, translation services that converted data submitted by one party to the form preferred by the other and, as necessary, requested additional needed
Simplifying Administration Page 10

information. The American National Standards Institute (ANSI) and other organizations began to develop uniform data standards, but their adoption was voluntary. A 1995 survey of insurers found that, while 55% of insurers could accept some claims electronically, they were using data sets from different standard-setting organizations or proprietary systems of their own (HIAA). Meanwhile, there were still many payers, and many more providers, who continued to use only paper forms.
There were some state-level efforts to encourage or impose
standardization. In New York, the state health department, with funding from the Robert Wood Johnson Foundation, established Universal New York Health Care in 1990 (Beauchamp and Rouse). Under UNY-Care, all hospitals in one region of the state were to submit their claims to a single entity (actually two contracting clearinghouses), which would pay the claims and then obtain reimbursement from insurers.6 The initiative was voluntary and ended with the expiration of the grant in 1993. The following year, New York passed a law phasing in a requirement that all providers submit claims electronically and developed its own standard forms. (Maryland passed a similar law in 1993, but repealed it after realizing that providers were incapable of complying; cited, Maine Task Force.)
In Utah, the Utah Health Information Network (UHIN) was established in
1993 as a voluntary coalition of government, payers, and providers. Initial participants contributed start-up funding, and data standards were developed by consensus. UHIN now functions as the clearinghouse for eligibility, claims, and other transactions between over 450 payers (including Medicare and Medicaid) and 100% of Utah hospitals and 90% of Utah physicians. Providers pay an annual membership fee, while payers pay a per transaction fee. The program is now working toward clinical data interchange (Sundwall).
Under a 1994 law, Minnesota required insurers, providers, and employers
who used electronic data interchange to conform to a set of state-developed specifications based on ANSI standards. No one was required to submit claims or other transactions electronically; only parties that chose to do so were subject to the standards (Maine Task Force). A 2007 law will require electronic filing by 2009.7
6 This was known as the “single payer demonstration,” but only in the sense that all providers were sending their claims to one mailing address. 7 Minnesota Statutes 2007, Chapter 62J.536.
Simplifying Administration Page 11

HIPAA and ASCA HIPAA, enacted in 1996, required the Secretary of HHS to develop
standard forms and uniform data elements for electronic transmission of nine common transactions:
• Health claims or equivalent encounter information; • Health claims attachments [i.e., detailed information on conditions or
procedures needed for adjudication of a claim]; • Enrollment and disenrollment in a health plan; • Eligibility for a health plan; • Health care payment and remittance advice; • Health plan premium payments; • First report of injury [for workers’ compensation cases]; • Health claim status; • Referral certification and authorization.
All health plans and health care clearinghouses would have to accept
electronic transactions in standard format from any employer or provider. Note that the rule was one-way. Plans had to accept standardized transactions; that is, they could not refuse electronic submissions or impose alternate formats. But the standards applied to employers and providers only if they chose to submit transactions electronically. Providers could still choose to do all their business on paper.
To date, standards have been finalized for all the transactions except first
report of injury and health claims attachments; the latter raise difficult issues, to be considered below. After a complicated phase-in, compliance with the published standards is now mandatory for all covered entities. The Secretary was also required to develop unique health identifiers for individuals, employers, health plans, and health care providers. Identifiers for health plans and providers have been adopted, and use will be fully mandatory by mid-2008. A proposed rule on health plan identifiers has been postponed, and Congress has since 1998 repeatedly specified that HHS appropriations may not be used to develop individual identifiers, because of privacy concerns and also because some people viewed an individual ID as providing “a key element needed for a government takeover of health care (Armey).”
In 2001, the Administrative Simplification Compliance Act (ASCA) required all Medicare providers and suppliers to submit Medicare claims electronically and in compliance with HIPAA standards by October 2003. While
Simplifying Administration Page 12

the rule applies only to Medicare, possibly providers shifting to electronic filing for one payer would be more prone to do so for others. However, providers with fewer than 25 employees and practitioners or other suppliers with fewer than 10 employees are exempt.8 This exception exempts an estimated 71% of physician offices and 69% of home health agencies (CMS 2003).
Progress and barriers
Even before HIPAA, large payers and providers had made considerable progress in electronic claims processing. Surveys by AHIP and its predecessor HIAA have found that the percent of claims submitted electronically went from 2% in 1990 to 40% in 1999 and 44% in 2002 (AHIP 2006a). Of the one billion claims submitted to Medicare in FY 2002, before the effective date of ASCA, all but 13.9 percent were submitted electronically (CMS 2003). As of 2006, the AHIP survey finds that 75% of claims to private insurers were submitted electronically. This might indicate that HIPAA and ASCA accelerated the move to electronic claims, but also suggests that there is still limited take-up by small providers and practices. There are no equivalent data for other key HIPAA transactions, such as transmission of enrollment data by employers and eligibility verification.
Payers and providers are also working outside the HIPAA framework to
further expedite common transactions. The Council on Affordable Quality Healthcare (CAQH) has developed standards for real-time verification of eligibility and benefits and certifies vendors whose systems meet those standards. Providers who use one of the certified vendors can obtain coverage information from any of the health plans participating in the program.
Some individual insurers have developed systems, available to their
network providers only at this point, that move beyond verification toward something resembling real-time claims adjudication. In CIGNA’s HealthePass program, for example, the provider swipes a member ID card, enters the procedures performed, and learns immediately what will be paid and the amount of the patient’s liability. (Humana has a similar system.) As with a credit card charge, the transaction is processed for payment without a further claim from the provider. The service is promoted as especially useful for patients with health savings accounts (HSAs); the insurer ID card can function as a debit card that draws the required patient contribution from the patient’s
8 In Medicare parlance, “providers” include hospitals, home health agencies, ESRD facilities, and SNFs; practitioners and suppliers include physicians, ambulatory surgical centers, clinical labs, and all other practitioners.
Simplifying Administration Page 13

account. More controversially, for non-HSA patients the ID can function as a credit card, with patient liability added to a running debt balance.
There are also efforts to address transactions not yet subject to HIPAA
standardization. For example, CAQH has developed a universal credentialing database. Providers anywhere in the US can enter credentialing information on a single standard form, and participating plans and hospitals can use this information for initial applications, re-credentialing, and other functions. At least one state is reportedly working on its own to develop a unique patient identifier, the original HIPAA goal blocked by congressional action.9
Whatever further progress may be made by private groups or state
governments, the HIPAA process has revealed at least two key barriers to simplification.
First, the HIPAA standards do not establish absolute uniformity in payers’ systems. Standards for a particular transaction specify a set of fields, formats, and a range of possible entries for the field. But a health plan may require that certain fields be completed, forbid the completion of others, and specify that only certain codes are valid within a given field. These requirements are spelled out in “companion documents” issued by individual payers. (One organization has compiled over 1,000 of these documents.)10 Even Medicare carriers in different regions issue separate companion documents. This means that, despite HIPAA, even the largest providers are continuing to rely on clearinghouses to format and transmit their data to multiple payers. Second, there may be some amount of irreducible complexity in insurance-related transactions. Some kinds of transactions are comparatively straightforward. In the case of pharmacy services, the claim is for a particular quantity of a drug with a specific NDC code, and the payer can write simple decision rules for each code. (This is why real-time adjudication is already a reality for drug benefits.) For other kinds of services, pre-authorization or claims processing may require more extensive communications between provider and payer. Payers may require detailed information on patient medical history, diagnostic test results, or past treatment to make coverage decisions. These information exchanges are the subject of the key HIPAA-specified transaction for which final standards have not yet been issued, claims attachments. Part of the
9 Hawaii, as reported by NASCIO, but not otherwise verifiable. Note that a single-state individual ID may be more practicable in Hawaii than elsewhere, because patients are not typically crossing state lines for care. 10 Claredi estimate, https://www.claredi.com/solutions/payerCompanion.php?PHPSESSID=f93575120f26e92004d4983faad9f5a9, accessed June 2008.
Simplifying Administration Page 14

problem is that much of the information needed cannot be readily reduced to a few codes on a standard form, and that few providers would be capable of coding the information even if such a form could be devised. (The CMS draft rules would have required insurers to accept scanned documents, natural language text, or coded information, whichever the provider chose; CMS 2005.)
Even if forms and coding could be standardized, these transactions are likely to continue to require staff or professional time at both ends. Payers have to be able to say exactly what they need, the provider has to figure out what to send and extract the specific information needed, and the payer has to manually review what was sent and determine if further information is needed.11 It is not certain how many claims can be processed simply and routinely and how many require some further information. In its proposed rule, CMS cited a 1993 estimate by the Workgroup for Electronic Data Interchange that 25% of all health care claims require additional documentation; CMS guessed that half these documentation requests might be met by the standard formats it was proposing. Some commenters on the rule contended that these estimates were too high.
Policy options
Policymakers could take a number of steps to simplify or expedite insurance-related transactions.
National clearinghouse. There is an entire industry of private clearinghouses that function as intermediaries between payers and providers, and some states are following Utah in developing a statewide clearinghouse system. However, no single clearinghouse can yet undertake to match every provider with every payer. Even Utah’s system, which includes every in-state insurer, can process transactions for people covered by some out-of-state insurers but not others. Wicks, Meyer, and Silow-Carroll have suggested that there should be a single national clearinghouse. All insurers and health plans would have to participate, and ongoing operations would be funded by contributions from insurers and self-insured employer plans. Health plans would issue enrollees a standardized card, resembling the CIGNA HealthePass, which could be read by any provider.
This would certainly fill some of the holes in the current ad hoc system,
and might be especially helpful in streamlining coordination-of-benefit transactions involving more than one insurer. To be fully effective, however, it
11 This iterative process might at least be shortened if providers could simply send every record they had about the patient. But a total record dump would violate HIPAA privacy requirements, a source of complexity beyond the scope of this paper.
Simplifying Administration Page 15

would need to resolve some of the HIPAA problems discussed earlier, and there might still be many small providers operating outside the electronic universe. In addition, insurers might question why they should bear the entire funding burden. (Currently providers pay clearinghouses; anecdotally, the charge is somewhere in the range of 15 to 20 cents a claim, or more if the provider submits paper documents or its submissions need extensive massaging. Providers must also pay the clearinghouse to receive a remittance advice back from the insurer.)
Require electronic filing. As noted earlier, ASCA applies only to
Medicare transactions, and a large number of small providers and suppliers are exempt. Minnesota’s new universal electronic transaction law has no such exemption, and federal law could similarly apply to all providers and all payers. (Possibly the law could be limited to some subset of common transactions, such as eligibility inquiries—perhaps the easiest—and claims not requiring attachments.) Such a rule would place an initial investment burden on small providers, but they would save money over time. And ultimately, if the larger goal of electronic health interchange is ever to be achieved, all providers are going to have to enter the computer age sooner or later.
Fully standardize transactions. One drawback to a universal filing
requirement is the continuing non-uniformity of payers’ implementation of HIPAA. Given the current situation, it may seem unduly burdensome to compel small providers to pay a clearinghouse to deal with complexities that were created by payers. Minnesota’s law requires everyone to conform to a set of standard coding rules developed by the state and explicitly forbids payers to issue companion documents or other supplemental instructions. Why couldn’t HIPAA standards go further, so that all providers and payers used identical coding and no intermediary translator was necessary? One obvious answer is cost: it is less expensive for both sides to pay a clearinghouse than to modify existing systems. In addition, shifting to a new, uniform system could require redesign of internal processes, not just external transactions, and possibly render institutions’ pre-redesign data unusable. Another factor may be that payers’ coding rules can embody policies, rather than just data formats—for example, rules about coverage of assistant surgeons or physician extenders, or about which services may be billed separately and which may be bundled (Vermont Commission).
Some people would argue that consolidation in the health insurance
industry could gradually make any of these large government initiatives less necessary or urgent. One recent study found that the Blue Cross Blue Shield plans (including the large multistate plans) and three major non-Blues carriers (Aetna, CIGNA, and UnitedHealth) control more than 60% of the market in 34 states and more than 70% in 23 states (Robinson). This means that, for many
Simplifying Administration Page 16

providers, a substantial majority of their claims are going to just a few payers (including the local Medicare carrier and Medicaid agency or intermediary). The author contends that consolidation is likely to continue, as the big plans swallow little ones, new plans face barriers to market entry, and for other reasons. Whatever the overall advantages or disadvantages of industry concentration, it is clearly easier for providers and clearinghouses to deal with a few plans, rather than many.
Reform proposals with implications for administrative complexity or costs So far this paper has focused on measures intended to streamline insurance-related transactions. Generally, these measures do not actually eliminate any transactions, but merely make them easier and (perhaps) less costly to conduct. However, there are also numerous proposals that would change the way the insurance market operates and that have implications for administrative costs of insurers, employers, or consumers. Some of these proposals target administrative costs directly. Others are offered in the context of general health care reform plans but incidentally might have some effect, whether or not intended, on insurance-related administrative costs.
This section considers the possible administrative effects of seven proposals or components of proposals that might affect administrative costs and complexity. The list is meant only to include ideas that have received widespread discussion and/or support: each of the ideas was endorsed by one or more of the original field of 2008 Democratic and Republican presidential contenders. (Two elements of many plans that would obviously affect administrative costs and complexity—premium subsidies and employer or individual mandates—are omitted here because they are the subject of other papers for this project.) The discussion here considers only the proposals’ administrative implications and not their likely effects on improving access to coverage, control of health care spending, or other goals.
Open FEHBP or similar exchange to general public
Some proposals would either open the Federal Employees Health Benefits Program (FEHBP) to individuals or small groups or would create a similar national program or set of regional programs. While these proposals are chiefly intended to assure access to insurance and provide a range of coverage choices, their proponents also tend to assume that they would reduce administrative costs.
Simplifying Administration Page 17

The Office of Personnel Management (OPM) spent $27 million—less than
one-tenth of 1% of total FEHBP spending—to administer the program in 2007 (OMB). However, OPM only negotiates and oversees carrier contracts and directly processes enrollment transactions for federal annuitants. The other functions of a large employer, such as processing new enrollments and enrollment changes and collecting and transmitting employee and employer premium contributions, are performed by the employing agencies. Costs are in each agency’s budget for personnel operations. In addition, administrative costs for each participating carrier are included in premiums. OPM estimated in 2003 that Blue Cross and the other national plans spent about 7 percent of premiums on administration (Block). The figure for HMOs is probably comparable to their administrative loading for their other large group business. Based on the estimates supplied earlier, combined total FEHBP administrative costs might be in the range of 15%, roughly the same as those for other very large groups.
Costs would certainly be higher if FEHBP or a similar exchange had to
deal with a great many small groups or individual enrollees. Whether they would approach the 25% range typical of small group coverage would depend on several factors. Marketing costs would be lower if most applicants dealt directly with the exchange. However, as Wicks has pointed out, most state-level exchanges have wound up paying commissions to agents and brokers. All the proposals assume guaranteed issue and at least adjusted community rating, so underwriting costs would be reduced or disappear (at the price of possible adverse selection, unless similar rules were imposed in the non-exchange market). At least at the outset, however, carriers would likely demand much higher risk reserves, as they faced hordes of new enrollees for whom no experience data were available. Overall, the expectation that an exchange could reduce administrative costs may depend on an assumption of some economies of scale that might or might not materialize.
Guaranteed issue and community rating
Some proposals would establish some form of federal standards governing the underwriting and rating practices of all insurers, rather than just those participating in an exchange arrangement. Whatever their effects on general costs and availability, these options could be expected to reduce insurers’ administrative costs to the extent that they eliminate the practice of examining applicants’ health status or claims history.
While underwriting costs cannot be isolated in any of the available studies, they might be 2% or more of total premiums for small group and
Simplifying Administration Page 18

nongroup carriers. In addition, agents and brokers may sometimes function as the first line in underwriting, screening out some applicants and obtaining health information about others. These functions are implicitly included in commissions—and sometimes explicitly, if an insurer rewards agents for sending on only insurable applicants.
Savings on underwriting costs would materialize only if insurers were
required to use full community rating (no premium variation for any reason) or adjusted community rating (premium variation based on geographic or demographic factors, but not health status). If instead the federal or state rules involve rating bands—allowing some specified percentage variation in rates based on health status or a combination of factors including health status—then insurers would continue to evaluate individuals, and there might be no underwriting savings.
Minimum loss ratio Some people have proposed establishing a fixed minimum loss ratio,
perhaps 85%, for health insurance plans. That is, 85 cents of every premium dollar would have to be paid out in benefits, meaning that administrative costs and profits could not exceed 15% of premiums.12 Many states have set minimum loss ratios for small group or nongroup coverage or for specific classes of plans, such as HMOs, but usually at much lower levels, such as 55% to 65%. In some states, there is no absolute rule, but plans meeting a specified limit are deemed to have “reasonable” rates, while plans not meeting it will be subject to greater scrutiny. Federal law requires that Medicare supplemental policies, or Medigap, have a minimum loss ratio of 65% for individual policies and 75% for group policies.13
The available estimates of insurer costs would suggest that an 85% loss
ratio in the individual and small group markets is simply unattainable, even if insurers were to forgo any profit at all. Possibly some major insurers could meet the target if they were allowed to average their losses across all lines of business, including large group. But large employers would simply be driven to self-insure if they were expected to cross-subsidize administrative costs in the other market sectors. Conceivably a national minimum loss ratio set at some lower
12 At least two recent state reform proposals, Gov. Rendell’s proposal for Pennsylvania and Gov. Schwarzenegger’s for California, had similar provisions. 13 The Children’s Health and Medicare Protection Act of 2007 as passed by the House would have reduced payments for, and ultimately terminated contracts with, Medicare Advantage plans that had a loss ratio below 85%. The provision was dropped, along with all Medicare provisions, in the conference agreement on the SCHIP legislation.
Simplifying Administration Page 19

level could squeeze out excess administrative costs and profits in states that that have not already imposed these requirements. However, while loss ratios may be useful to regulators and buyers as general guidelines for assessing the reasonableness of insurers’ premium rates, there are several arguments against fixed loss ratio rules.14
First, a minimum loss ratio potentially penalizes an insurer that is
controlling health benefit costs through added administrative activities, such as utilization review, case management, or value-based selection of network providers. If insurer A spends $850 on benefits and $150 on administration, while insurer B spends $750 on benefits and $200 on administration, it is the more “efficient” insurer B that fails an 85% test. (Of course, B could also fail the test if it wrongly denied valid claims.) Second, there are numerous problems of accounting and of comparison across carriers. Which activities are clearly administrative as opposed to patient care-related? What if some administrative costs borne by insurers in the small group market are shifted to employers in the large group market? How should reinsurance and claims reserves be treated? Finally, loss ratios can fluctuate over time, because of unpredictable changes in utilization or provider charges; a minimum ratio is especially problematic if it is applied over a limited time period to every block of business an insurer sells.
Single payer A single payer plan would obviously produce savings in both health plan
administrative costs and provider transaction costs, with the possible trade-offs in access or care management cited by critics of this approach. Whatever the overall pros and cons of single-payer proposals, it is important to note that there are several single-payer models with different potential effects on administrative complexity.
Some plans, such as H.R. 676 (Conyers), would be on the Canadian model, with global budgets for hospitals and fee-for-service payment to practitioners; there would be no patient cost-sharing for covered services. Staff-model HMOs could contract to provide care on a capitated basis, but no other insurers could participate, and they would be permitted to offer supplemental policies only for non-covered services such as cosmetic surgery. On the other hand, Rep. Stark’s plan (H.R. 1841) would provide Medicare for all.15 Providers would be paid under current systems, with modifications, and beneficiaries required to pay cost-sharing, again with some changes from current rules. Insurers could sell the 14 For an overview, see American Academy of Actuaries 1998. 15 Some proposals would provide voluntary universal access to Medicare or another public program. These are not single-payer proposals, because buyers could instead choose to obtain private coverage outside the program. (See, for example, Anderson 2007.)
Simplifying Administration Page 20

equivalent of Medigap supplemental plans; employers could provide supplemental coverage; and private health plans could contract to provide covered benefits in the same way as Medicare Advantage plans (except program payments would be limited to average fee-for-service costs).
The Conyers plan would eliminate billing by hospitals; other providers would still have to bill for services, but would not have to collect patient cost-sharing or deal with supplemental insurers. Under the Stark approach, providers would still have to deal with contracting private health plans, incurring costs for eligibility verification, credentialing, claims filing, and so on, as well as with supplemental carriers and employer groups. And consumers—including those now in employer groups, frequently offered no choice of health plans—would have to perform the complicated tasks that now sometimes baffle Medicare beneficiaries, such as choosing from an array of coverage options and (for those selecting supplemental coverage) deciphering explanations of benefits from two payers for the same service. The plan would thus retain some of the complexity of the current system.
Reinsurance
Several proposals seek to hold down premiums by providing federal reinsurance for all insurers or for some subset, such as retiree health plans. All of these plans involve reimbursement of catastrophic losses on specific cases, rather than aggregate stop-loss coverage, and thus entail at least administrative costs for the review of individual claims. In addition, as Wicks has noted, reinsurance is difficult to administer fairly if participating plans have different benefit packages. Suppose, for example, that the catastrophic threshold is $25,000 and a patient incurs $35,000 in total costs. If the patient is in a plan with a $1,000 deductible, the insurer will spend $34,000 and the reinsurance will pay out $9,000. If the patient is in a plan with no deductible, the insurer will spend $35,000 and the reinsurance will pay out $10,000. This problem could arise under any proposal that does not combine reinsurance with benefit standardization. There are some options for addressing this problem, but at the expense of greater complexity. One would be for the reinsurance program to apply its catastrophic threshold to total spending, by both the insurer and the enrollee; this would provide equal subsidies for people with equal costs, regardless of the specifics of their benefit package. A second option would be to recalculate the insurer’s costs using a sort of virtual standard benefit: what would the insurer have paid out if the deductible were x and the coinsurance were y? Either of these approaches might effectively require the reinsurer (or the claiming primary
Simplifying Administration Page 21

insurer) to recalculate every single claim, doubling the claims processing costs for high-cost enrollees.
Interstate sale of insurance and association plans
Proposals for interstate sale would allow a health plan licensed in any one state to sell coverage in all other states under the rules of the licensing state. Proposals for association plans would exempt insurers selling coverage to groups of multiple employers or other affinity groups from various state rules governing the small group market, such as benefit mandates or restrictions on premium variation. Both types of proposals are really focused on reducing benefit costs for all buyers (by eliminating mandates or by allowing multiple groups to bargain jointly) or for low-risk groups (by eliminating rating restrictions). However, there are also claims that these approaches would reduce administrative complexity and costs. Interstate sale would reduce insurers’ administrative costs by eliminating the need to deal with multiple state regulators. Underwriting costs would probably rise, assuming insurers would make their home in states with the least restrictive enrollment and rating requirements. Supporters of this approach contend that it would also have more general effects on insurers’ administrative costs and profits by promoting national competition. However, it is uncertain how creation of a national market would play out. It might accelerate consolidation of the insurance market, perhaps leading to smaller administrative costs but higher profit margins. The effects of allowing association plans are unclear. As Wicks has noted, the association must have substantial enrollment to achieve any economies of scale in administrative options. But a large association would also have a heterogeneous population—especially if, as in some of the more recent proposals, an association could not exclude a high-risk applicant who otherwise qualified for membership. As one of the underlying points of the association plan approach is to allow formation of homogeneously low-risk pools that would benefit from an association-specific premium, the associations that would emerge might be quite small, perhaps focusing on one or more lower-risk occupational groups. While they might realize savings on benefit costs, savings on administration might be negligible.
Simplifying Administration Page 22

Encourage health savings accounts or higher deductible plans
In theory, if everyone had only some form of catastrophic coverage, the volume of insurance-related transactions would drop dramatically. If the coverage threshold were high enough, many people would never meet it and would receive all their care on a cash basis. Ultimately, however, providers would need to submit and payers would need to adjudicate all the sub-threshold claims for the minority of patients who met the threshold. Conceivably this could be done retrospectively and only for those patients whose spending was approaching the deductible. However, this would create situations in which consumers who were merrily spending their way up to, say, a $5,000 deductible would learn only after the fact that the insurer was going to disallow $3,000 of what they had already paid. In the old indemnity world, people could keep their receipts in the proverbial shoebox and be confident that they would be compensated when the deductible was reached. In a world of utilization management, high-deductible plans are likely to be tolerated only if pre-deductible spending has already been cleared by the insurer. This means filing of all claims for all participants, negating any supposed savings from reduced transaction volume.
Once a high-deductible plan is combined with a health savings account,
administrative costs are likely to rise. Most current HDHP/HSA plans offer enrollees some assistance in tracking expenses; often the plan is linked to an associated financial institution that manages the account and pays out the enrollee’s liability as it is incurred. All of this makes eligibility and claims processing transactions more, rather than less, complex. This is one of the reasons for initiatives like CIGNA’s HealthePass. If, on the other hand, consumers are left to manage their own finances, they will incur nonquantifiable administrative costs of their own, as well as possible actual financial losses from failure to claim appropriate reimbursement.
Conclusion Despite years of effort to simplify the administration of insurance, little is known about whether any of the actors—insurers, providers, or employers—have actually seen any savings. What Thorpe called the “black box” of administrative costs is still quite opaque. Any efficiencies that have been achieved may be offset in future years by new complications, such as pay-for-performance systems (with associated reporting) or health savings accounts. Meanwhile, little has been done to make things simpler for the fourth set of
Simplifying Administration Page 23

actors, the consumers, although some insurers have been working to provide clearer explanations of benefits and other improved communications.
Policymakers will need to determine what role government should play in pursuing simplification. Government as regulator can mandate change, as in the case of HIPAA, but this built on years of private efforts, and can be seen to some extent as codifying rather than innovating. Government as the largest purchaser of health services—through Medicare, Medicaid, FEHBP, and other programs—can promote change by deciding what it wants to buy. It has the greatest leverage with providers, but the growth of Medicare Advantage and Medicaid managed care gives it considerable influence on health plans as well. Finally, government may need to finance change, to provide the capital and training needed to move hundreds of thousands of smaller providers beyond the realm of paper and typewriters.
Meanwhile, it is important to recall that one person’s complexity is another person’s income. In 2004, health plans employed 470,000 people, not counting independent agents and brokers (AHIP 2006b). And there has arisen an entire industry of intermediaries between insurers and providers—not just clearinghouses, but also, for example, consultants who help providers maximize, and insurers minimize, claims. None of these players are likely to wish to be simplified out of a job. Ultimately, complexity is not just a byproduct of the insurance system: it is what insurers are selling. The value-added of the managed care industry consists of the very features that make insurance complicated: different coverage rules and formularies, authorization requirements and careful scrutiny of claims, and so on. The variations are what differentiate one plan from another, and competition and uniformity may be conflicting goals.
Simplifying Administration Page 24

Appendix: Detailed Estimates of Administrative Costs
This appendix provides details of the administrative cost studies summarized in this paper. It should be noted that many of the tables have been recalculated, using data from the original sources, to improve presentation or ease comparison.
Health plan costs
The Sherlock Company conducts annual surveys of Blue Cross Blue Shield plans. Plans report costs both for their insured business and for their ASO contracts with self-insured employers. Table 3 shows costs by function across all contract types (HMO/PPO/POS, commercial/Medicare/Medicaid, etc.).
Table 3. Median Administrative Costs as Percent of Premium Equivalents, Blue Cross Blue Shield Plans, by Function, 2006
Function
Median percent of premium
equivalents Marketing 3.0% Provider and medical management 1.3% Account and member administration 4.4% Corporate services 2.6% Total 11.9%
Source: Sherlock Company. Note: Premium equivalents include premiums for insured plans and the sum of ASO charges and
benefit payments for self-insured plans. The marketing function includes rating and underwriting, as well as broker commissions and other marketing costs.
Simplifying Administration Page 25
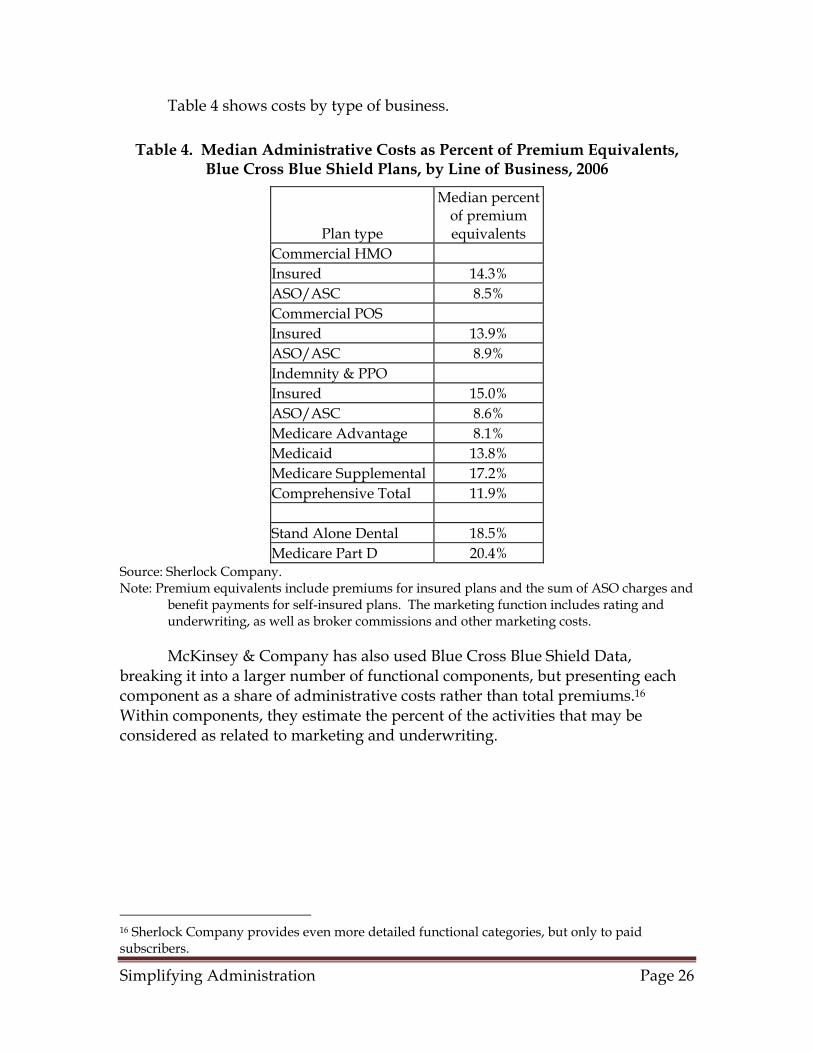
Table 4 shows costs by type of business.
Table 4. Median Administrative Costs as Percent of Premium Equivalents, Blue Cross Blue Shield Plans, by Line of Business, 2006
Plan type
Median percent of premium equivalents
Commercial HMO Insured 14.3% ASO/ASC 8.5% Commercial POS Insured 13.9% ASO/ASC 8.9% Indemnity & PPO Insured 15.0% ASO/ASC 8.6% Medicare Advantage 8.1% Medicaid 13.8% Medicare Supplemental 17.2% Comprehensive Total 11.9% Stand Alone Dental 18.5% Medicare Part D 20.4%
Source: Sherlock Company. Note: Premium equivalents include premiums for insured plans and the sum of ASO charges and
benefit payments for self-insured plans. The marketing function includes rating and underwriting, as well as broker commissions and other marketing costs.
McKinsey & Company has also used Blue Cross Blue Shield Data, breaking it into a larger number of functional components, but presenting each component as a share of administrative costs rather than total premiums.16 Within components, they estimate the percent of the activities that may be considered as related to marketing and underwriting.
16 Sherlock Company provides even more detailed functional categories, but only to paid subscribers.
Simplifying Administration Page 26

Table 5. Distribution of Administrative Costs as a Percent of Premiums by Function, Blue Cross Blue Shield Plans, 2004
Total Marketing and underwriting
related Sales and marketing 37% 37% Customer service 8% 4% Medical management 7% 0% Actuarial 2% 2% IT 20% 10% Management/overhead 17% 11% Claims 7% 0% HIPAA/government 2% 0% Total 100% 64%
Source: McKinsey & Company Kahn et al. use data from commercial insurers surveyed by Milliman USA. Overall costs are smaller than those reported by the Blues, but this may reflect a different distribution of enrollment among lines of business.
Table 6. Administrative Costs as a Percent of Premiums, Commercial Insurers, 1996-2001
Function Percent of premiums
Claims billing/payment 2% Sales & marketing 2% Finance & underwriting 1% Membership & billing 0% Provider services & credentialing 1% Customer service 1% Information systems 1% Medical (UR, case management, etc.) 2% General administration 1% Total 10%
Source: Kahn et al., based on data from Milliman USA Note: Sales and marketing does not include payments to brokers. Actuarial Research Corporation collected data on small group costs from insurers’ reports to state insurance departments in two states. Although their report includes averages, they are unweighted and hence not very helpful; table 8 instead uses minimum and maximum values for each component. Note that this is the only table in the section that includes offsets from investment income and profits/risk reserves. The generally higher costs in Colorado are chiefly driven by higher agent/broker commissions.
Simplifying Administration Page 27

Table 7. Administrative Expenses and Profit as Percent of Premiums, Small Group Carriers in West Virginia and Colorado, Various Years, 1999-2002
West Virginia Colorado Minimum Maximum Minimum Maximum General administration 10% 12% 9% 14% Commissions 2% 5% 4% 21% Taxes and license fees 2% 5% 2% 4% Investment income -3% 0% -3% -1% Profit and contingency 2% 6% 3% 8% Total administrative expenses 20% 30% 21% 38%
Source: Actuarial Research Corporation, based on filings with state insurance departments. Note: Small groups in West Virginia had 2-50 employees; Colorado includes groups of one.
Components do not sum to totals, because an insurer that reported the minimum expense in one category might not have the minimum in all categories
Pauly and Nichols (2002), using data from insurers’ filings with state insurance commissioners, report that administrative costs and profit for nongroup carriers range from 30% to 40% of premiums. They note that these costs dropped during the 1990s and that the gap between nongroup and group administrative loadings narrowed during the same period.
Physicians
Two studies, nine years apart, use data from the Medical Group Management Association to estimate physician administrative costs. Kahn et al. estimate the share of insurance-related costs within non-insurance functional components and include physician’s time; Sheils, Young, and Rubin do not. Note that the Kahn estimates shown are for primary care practices; the figures for single-specialty surgical groups are lower, perhaps because comparable administrative spending is measured against higher practice revenue.
Simplifying Administration Page 28

Table 8. Billing and Insurance-Related Costs as a Percent of Practice Revenues, Physicians in Single-Specialty Primary Care Practice, Western US,
2000
Function
Percent of practice revenue
Claims billing/payment 4% Medical receptionists 2% Managed care admin. 1% Information technology 1% Med. secretaries/transcribers 0% Medical records 0% Providers (insurance-related activities) 4% All other billing and insurance-related 3% Non-BIR administrative 12% Total 27%
Source: Kahn et al. Totals based on data from Medical Group Management Association; allocation to billing-related functions from various sources.
Table 9. Physician Administrative Costs as Percent of Net Revenues, US, 1991
General administration 13% Marketing, interest, and other expenses 8% Claims filing, billing 6% Claims adjudication 2% Utilization management 1% Utilization review 1% Facilities and equipment 2% Total 32%
Source : Sheils, Young, and Rubin, based on 1990 data from Medical Group Management Association.
Hospitals
The available studies are again Kahn et al. and Sheils, Young, and Rubin, with the same differences in methodology and time frames as for the physician estimates. Kahn et al. found allocation of costs to insurance-related functions more difficult for hospitals than for physicians and report low to high ranges for some components.
Simplifying Administration Page 29

Table 10. Billing and Insurance-Related Costs as Percent of Revenues, California Hospitals, 1999
Claims billing/payment 3% Admitting 1% Outpatient registration 0% Utilization management 1% Medical records 0% All other administrative 2%-6% Non-BIR administrative 10%-14% Total 21%
Source: Kahn et al., authors’ estimated allocations of data from California Office of Statewide Health Planning and Development.
Table 11. Hospital Administrative Costs as Percent of Net Revenues, California, 1991
Patient accounting/collections 3% Patient admitting 1% General accounting and other fiscal services 2% All other 29% Total administration 33%
Source: Sheils, Young, and Rubin, based on data from California Office of Statewide Health Planning and Development
International comparison
Woolhandler and various colleagues have been offering comparisons of US and Canadian administrative costs for many years. Table 13 is drawn from the most recent of these studies. The insurance estimate for the US merges private, Medicare, and Medicaid costs. The US hospital and physician estimates are comparable to the totals reported in the other studies cited here, but do not include any functional breakout. So there is no way of knowing whether the lower costs in Canada reflect less insurance-related activity or less of other administrative activities.
Simplifying Administration Page 30

Table 12. Costs of Health Care Administration as percent of total spending, 1999
US Canada Insurance overhead/total health spending 6% 2% Hospital administration/total hospital spending 24% 13% Physician time and administrative costs/total physician income 27% 16% Total insurer, employer, and provider administration/total health spending 31% 17% Source: Woolhandler, Campbell, and Himmelstein
Aaron (2003) has noted: “Canadian regulation of physicians’ fees and the use of global budgets to control hospital spending make it likely that more of this added bang for the Canadian buck arises because Canada is squeezing the salaries of doctors, who have few opportunities outside the health care sector, rather than the salaries of secretaries and accountants, who can easily find work anywhere in the economy.” Aaron also criticizes, on several grounds, the authors’ presentation of the differences as dollar amounts. For this reason, the estimates have been recalculated as percentages in this table.
Simplifying Administration Page 31

References Note: All URLs verified June 2008. Aaron, Henry J. “The Costs of Health Care Administration in the United States
and Canada—Questionable Answers to a Questionable Question,” NEJM, v. 349, no. 8 (Aug. 21, 2003), pp. 801-803.
Actuarial Research Corporation (ARC). Study of the Administrative Costs and
Actuarial Values of Small Health Plans, Annandale, VA, 2003, http://www.sba.gov/advo/research/rs224tot.pdf.
America’s Health Insurance Plans (AHIP) 2006a. An Updated Survey of Health
Care Claims Receipt and Processing Times, May 2006, Washington, 2006, http://www.ahipresearch.org/pdfs/PromptPayFinalDraft.pdf.
AHIP 2006b. Health Insurance: Overview and Economic Impact in the States,
Washington, 2006, http://www.ahipresearch.org/PDFs/StateData/StateDataFullReport.pdf.
American Academy of Actuaries, Loss Ratio Work Group. Loss Ratios and Health
Coverages, Washington, 1998, http://www.actuary.org/pdf/health/lossratios.pdf.
Anderson, Gerard F., and Hugh R. Waters. Achieving Universal Coverage Through
Medicare Part E(veryone), Washington, The Hamilton Project (Brookings Institution), 2007, http://www.brookings.edu/papers/2007/07useconomics_anderson.aspx
Armey, Dick. Letter to Tommy G. Thompson, Secretary of HHS, May 15, 2001,
http://www.techlawjournal.com/cong107/privacy/idnumbers/20010515armey.asp.
Beauchamp, D.E., and R.L. Rouse, “Universal New York Health Care: A Single-
Payer Strategy Linking Cost Control and Universal Access,” NEJM, v. 323, n. 10 (Sep. 6, 1990), p. 640-644.
Block, Abby, Senior Advisor for Employee and Family Policy, OPM , testimony
before the Senate Finance Committee, Apr. 3, 2003.
Simplifying Administration Page 32

Centers for Medicare and Medicaid Services (CMS) 2003. “Medicare Program; Electronic Submission of Medicare Claims,” interim final rule, Federal Register, v. 68, n. 158 (Aug. 15, 2003), p. 48805-48813.
CMS 2005. “HIPAA Administrative Simplification: Standards for Electronic
Health Care Claims Attachments,” proposed rule, Federal Register, v. 70, n. 184 (Sep. 23, 2005), p. 55990-56025.
CMS 2006. National Health Expenditures Accounts: Definitions, Sources, and
Methods, 2006. Baltimore, 2006, http://www.cms.hhs.gov/NationalHealthExpendData/downloads/dsm-06.pdf.
Health Insurance Association of America (HIAA). Testimony presented to
National Committee on Vital and Health Statistics (NCVHS), Subcommittee on Health Data Needs, Standards and Security, Apr. 15-16, 1997.
Kaiser Family Foundation and Health Research and Educational Trust
(Kaiser/HRET). Employer Health Benefits: 2000 Annual Survey, Menlo Park, CA, and Chicago, 2000, http://www.kff.org/insurance/20000907a-index.cfm.
Kahn, James G., et al. “The Cost of Health Insurance Administration in
California,” Health Affairs, v. 24, no. 6 (Nov.-Dec. 2005), pp. 1629-1639. Lemieux, Jeff. Perspective: Administrative Costs of Private Health Insurance Plans,
Washington, AHIP, 2005, http://www.ahipresearch.org/pdfs/Administrative_Costs_030705.pdf.
Litow, Mark. Medicare versus Private Health Insurance: The Cost of Administration,
n.p. Milliman, 2006, http://www.cahi.org/cahi_contents/resources/pdf/CAHIMedicareTechnicalPaper.pdf.
Maine Task Force to Study the Feasibility of a Single Claims Processing System
for 3rd-party Payors of Health Care Benefits. Final Report, Augusta, ME, 1998.
McKinsey & Company, Accounting for the Cost of Health Care in the United States,
Jan. 2007, http://www.mckinsey.com/mgi/rp/healthcare/accounting_cost_healthcare.asp (registration required).
Simplifying Administration Page 33

National Association of State Chief Information Officers (NASCIO). Profiles of
Progress II: State Health IT Initiatives, Washington, 2007, http://www.nascio.org/publications/documents/NASCIO-ProfilesOfProgress2.pdf.
Office of Management and Budget (OMB), Budget of the United States, 2008:
Budget Appendix, p. 999-1011. Robinson, James. “Consolidation And The Transformation Of Competition In
Health Insurance,” Health Affairs, v. 23, n. 6 (Nov./Dec. 2004), p. 11-24. Pauly, Mark V., and Len M. Nichols. “The Nongroup Health Insurance Market:
Short on Facts, Long on Opinions and Policy Disputes,” Health Affairs, web exclusive, Oct. 2002, pp. W325-W344.
Sheils, John F., Gary J. Young, and Robert J. Rubin, “O Canada: Do We Expect
Too Much From Its Health System?” Health Affairs, v. 11, no. 1 (spring 1992), pp. 7-20.
Sherlock Company, “New Performance Benchmarks for Blues Released by
Sherlock Company,” Plan Management Navigator, July 2007, http://www.sherlockco.com/docs/navigator/navigator-07-07.pdf.
Sundwall, David N. eHealth in Utah: Medicaid, Health IT and RHIO, presentation
to HHS Medicaid Commission, July 12, 2006, http://aspe.hhs.gov/medicaid/july06/sDavid%20Sundwall.pdf.
Thorpe, Kenneth. “Inside the Black Box of Administrative Costs,” Health Affairs,
v. 11, n. 2 (summer 1992), p. 41-55. Vermont Commission on Health Care Reform, Common Claims Work Group,
Interim Report, Concord, VT, 2007. Wicks, Elliot, Jack Meyer, and Sharon Silow-Carroll. “Wicks, Meyer, and Silow-
Carroll Proposal: Key Elements,” in Covering America: Real Remedies for the Uninsured, volume 1, Washington, Economic and Social Research Institute, 2001, http://www.esresearch.org/RWJ11PDF/wicks.pdf.
Wicks, Elliot. Restructuring Insurance Markets, report prepared for the National
Academy of Public Administration and the National Academy of Social Insurance, draft, 2007.
Simplifying Administration Page 34

Woolhandler, Steffie, Terry Campbell, and David U. Himmelstein, “Costs of Health Care Administration in the United States and Canada,” NEJM, v. 349, no. 8 (Aug. 21, 2003), pp. 768-775.
Zycher, Benjamin. Comparing Public and Private Health Insurance: Would A Single-
Payer System Save Enough to Cover the Uninsured? New York, Manhattan Institute for Policy Research, 2007, http://www.manhattan-institute.org/html/mpr_05.htm.
Simplifying Administration Page 35