sims 247 information visualization and presentation marti hearst october 24, 2000
Post on 21-Dec-2015
215 views
TRANSCRIPT
SIMS 247SIMS 247Information Visualization Information Visualization
and Presentation and Presentation
Marti HearstMarti Hearst
October 24, 2000October 24, 2000

TodayToday
• Panning and ZoomingPanning and Zooming– Space-Scale Diagrams
– Semantic Zoom
– How useful it is?
• Distortion-based ViewsDistortion-based Views– Focus+context
– Fisheye views• Application to graphs/networks

Pan and ZoomPan and Zoom
How to show a lot of information in How to show a lot of information in a small space?a small space?– Multiple Levels of Resolution
• The view changes depending on the “distance” from the viewer to the objects
– Distortion-based techniques• Keep a steady overview, make some
objects larger while simultaneously shrinking others

Pad++Pad++
• An infinite 2D planeAn infinite 2D plane• Can get infinitely close to the surface Can get infinitely close to the surface
tootoo• Navigate by panning and zoomingNavigate by panning and zooming• Pan: Pan:
– move around on the plane• Zoom:Zoom:
– move closer to and farther from the plane

Pad++ ExamplesPad++ Examples

Pad++ ExamplesPad++ Examples

Pad++ ExamplesPad++ Examples

Pad++ ExamplesPad++ Examples
1. http://found.cs.nyu.edu/fox/siggraph93/cal.html2. http://found.cs.nyu.edu/fox/siggraph93/tree.html3. http://found.cs.nyu.edu/fox/siggraph93/marcade.html

Semantic ZoomingSemantic Zooming
• Geometric (standard) zooming:Geometric (standard) zooming:– The view depends on the physical
properties of what is being viewed• Semantic Zooming:Semantic Zooming:
– When zooming away, instead of seeing a scaled-down version of an object, see a different representation
– The representation shown depends on the meaning to be imparted.

Examples of Semantic ZoomExamples of Semantic Zoom
• Infinitely scalable painting programInfinitely scalable painting program– close in, see flecks of paint– farther away, see paint strokes– farther still, see the wholistic
impression of the painting– farther still, see the artist sitting at
the easel

Examples of Semantic ZoomExamples of Semantic Zoom
• Information MapsInformation Maps– zoom into restaurant
• see the interior• see what is served there
– maybe zoom based on price instead!• see expensive restaurants first• keep zooming till you get to your price range
• Browsing an information serviceBrowsing an information service– Charge user successively higher rates for
successively more detailed information

Jazz – the new Pad++Jazz – the new Pad++
• Pad++ was written in tcl/tkPad++ was written in tcl/tk– Was very easy to use– Is no longer supported
• Jazz is the followonJazz is the followon– Written in java by Ben Bederson– Formal, complex architecture– http://www.cs.umd.edu/hcil/jazz/

Revisit Assignment 3Revisit Assignment 3
• Why wasn’t using the scrollbars in Why wasn’t using the scrollbars in Spotfire an example of zooming?Spotfire an example of zooming?– More like a filter– Only changed one axis at a time– Both x and y should change together– Real zoom was built in (right mouse)

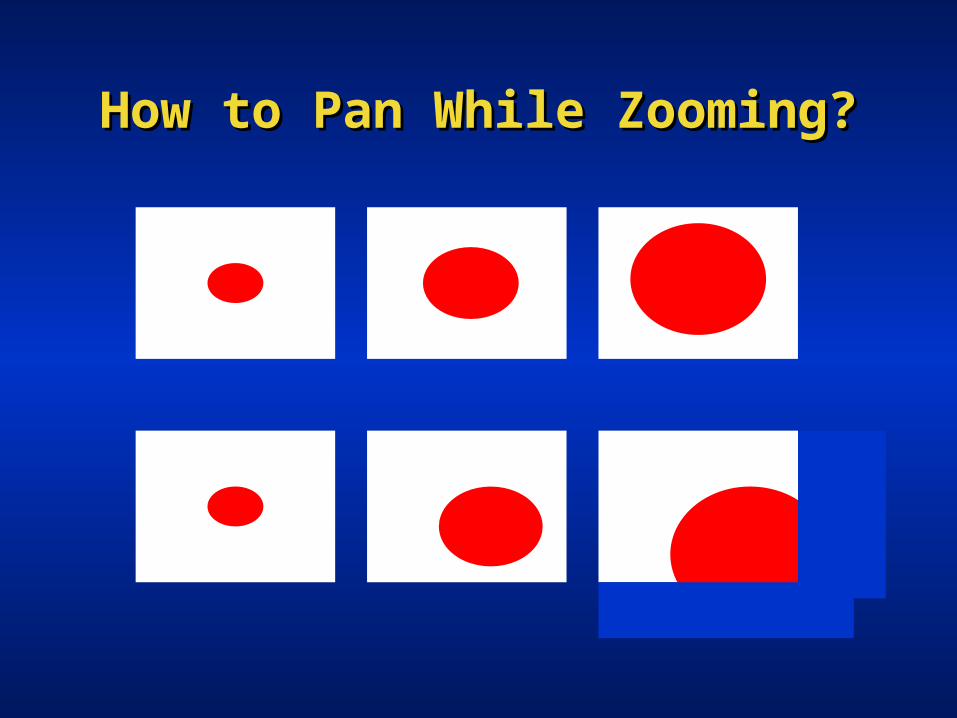
How to Pan While Zooming?How to Pan While Zooming?
How to Pan While Zooming?How to Pan While Zooming?

Space-Scale DiagramsSpace-Scale Diagrams(Furnas & Bederson 95)(Furnas & Bederson 95)
• Original figure, shown at various scalesOriginal figure, shown at various scales• Horizontal axis is standard, vertical is Horizontal axis is standard, vertical is
scalescale

Space-Scale DiagramsSpace-Scale Diagrams(Furnas & Bederson 95)(Furnas & Bederson 95)
• User has a fixed-sized viewing windowUser has a fixed-sized viewing window• Moving it through 3D space yields all Moving it through 3D space yields all
possible sequences of pan & zoompossible sequences of pan & zoom

Space-Scale DiagramsSpace-Scale Diagrams(Furnas & Bederson 95)(Furnas & Bederson 95)
• A point is transformed to a rayA point is transformed to a ray• Circular regions become conesCircular regions become cones

Space-Scale DiagramsSpace-Scale Diagrams(Furnas & Bederson 95)(Furnas & Bederson 95)
• If you move the origin of the 2D plane, the If you move the origin of the 2D plane, the properties of the original 2D picture do not properties of the original 2D picture do not changechange
• Therefore, the absolute angles between the Therefore, the absolute angles between the rays should not be assigned any meaningrays should not be assigned any meaning

Space-Scale DiagramsSpace-Scale Diagrams(Furnas & Bederson 95)(Furnas & Bederson 95)
• We can think of this in terms of 1D tooWe can think of this in terms of 1D too• When zoomed out, you can see wider When zoomed out, you can see wider
set of pointsset of points

Space-Scale DiagramsSpace-Scale Diagrams(Furnas & Bederson 95)(Furnas & Bederson 95)
• Pure pan (a)Pure pan (a)• Pure zoom (b)Pure zoom (b)• Pan and zoom keeping q in same Pan and zoom keeping q in same
position in the viewing window (c) position in the viewing window (c)

Space-Scale DiagramsSpace-Scale Diagrams(Furnas & Bederson 95)(Furnas & Bederson 95)
What about panning and zooming at the What about panning and zooming at the same time?same time?– Panning is linear– Zooming is logarithmic– The two effects interact
• If you compute the two separately and run them in parallel you get problems
• When zooming in, things go exponentially fast• Panning can’t keep up
– The target “runs away” out of view

Navigation in Pad++Navigation in Pad++
• How to keep from getting lost?How to keep from getting lost?– Animate the traversal from one object
to another using “hyperlinks”• If the target is more than one screen
away, zoom out, pan over, and zoom back in
– Goal: help user maintain context

Space-Scale DiagramsSpace-Scale Diagrams(Furnas & Bederson 95)(Furnas & Bederson 95)
• Zooming covers more ground faster than Zooming covers more ground faster than panningpanning– zooming is logarithmic, panning is linear
• Alternative way to navigate:Alternative way to navigate:– Instead of a long pan– Do a big zoom, a short pan, a big zoom– (count the number of arrows each way)

Space-Scale DiagramsSpace-Scale Diagrams(Furnas & Bederson 95)(Furnas & Bederson 95)
• Combining space-scale zooming Combining space-scale zooming and distortion-based techniquesand distortion-based techniques– Instead of a horizontal slice through scale-
space, take a step up and a step down– The points in the middle have more room;
those on the periphery are squished together

Space-Scale DiagramsSpace-Scale Diagrams(Furnas & Bederson 95)(Furnas & Bederson 95)
• Solution: space-scale diagramSolution: space-scale diagram• Goal: go from (x1,z1) to (x2,z2)Goal: go from (x1,z1) to (x2,z2)• Must stay within the parallelogramMust stay within the parallelogram
if you go out onthis side, thetarget x2is further fromx1 than when you began
if you go out onthis side, you overshot the target
if you go out onthe top, you zoomed past x2
if you go out onthe bottom, you backed up from x1

Space-Scale DiagramsSpace-Scale Diagrams(Furnas & Bederson 95)(Furnas & Bederson 95)
• Combining space-scale zooming Combining space-scale zooming and distortion-based techniquesand distortion-based techniques
• The original fisheye view:The original fisheye view:

Space-Scale DiagramsSpace-Scale Diagrams(Furnas & Bederson 95)(Furnas & Bederson 95)
• Implementing semantic zoomingImplementing semantic zooming
standardgeometriczooming(a grey line)
semantic zoom:too far, see nothingzoom in, see dashed lineget closer, see solid lineget too close, see nothing

The Role of PortalsThe Role of Portals
• All this panning and zooming can get All this panning and zooming can get confusing (maybe even dizzying)confusing (maybe even dizzying)
• Portals allow for zooming a small piece of Portals allow for zooming a small piece of the dataset while keeping everything else the dataset while keeping everything else in the same positionin the same position– Pad++ is one big stretchy sheet– A portal is more like a special window into a
piece of the sheet – That window behaves independently of the
rest

Panning and ZoomingPanning and Zooming
• Is it actually useful?Is it actually useful?– Is it better to show multiple
simultaneous views?– Is it better to use distortion
techniques?
• Would keeping a separate global Would keeping a separate global overview help with navigation?overview help with navigation?

Distortion-based ViewsDistortion-based Views
– focus+context
– views

Focus + ContextFocus + Context
– Show a lot of information at once• Details are too small to be visible
– Focus on a subset of interest• Make this subset large enough to be
viewed

Distortion TypesDistortion Types
• Different distortions for different Different distortions for different data types yield different effectsdata types yield different effects– cartesian, polar coordinates,
hyperbolic
• Leung & Apperley’s TaxonomyLeung & Apperley’s Taxonomy– distinguish focus+context from
distortion• f+c requires a POI function

Table Lens Table Lens (Rao & Card 94)(Rao & Card 94)
• Focus on the records of interestFocus on the records of interest• Context: other recordsContext: other records
– depicted graphically– view patterns in both nominal and
quantititive data types– interaction via sorting for pattern
discovery– nearly keyboardless interface

Viewing Huge Tables:Viewing Huge Tables:Table Lens Table Lens (Rao & Card 94)(Rao & Card 94)

ViewsViews
• A variation on Focus + ContextA variation on Focus + Context– Make objects of interest large, detailed– Less important objects successively
smaller• Goal: Goal:
– Smooth integration of local detail and global context
• Technique:Technique:– Reposition and resize objects

Noik’s DemonstrationNoik’s Demonstration

Elements of Fisheye ViewsElements of Fisheye Views
• Focus, or Point of Interest (POI)Focus, or Point of Interest (POI)– user-selected
• Importance Function (API)Importance Function (API)– user-specified or pre-determined
• number of railway connections• height in hierarchy• population of city
• Function for measuring distance Function for measuring distance between objectsbetween objects

Distortion TechniquesDistortion Techniques
• Computation must take care not to Computation must take care not to let the magnified part overlap or let the magnified part overlap or cover up the de-magnified partcover up the de-magnified part
• Must consider the boundary between Must consider the boundary between the magnified and the demagnifiedthe magnified and the demagnified– Some techniques have an abrupt
boundary– Some are more gradual

Perspective Wall Perspective Wall (Mackinlay et al 91)(Mackinlay et al 91)
• Idea: Idea: – focus on a subpart of a table– show the rest of the table in the
periphery
• Goal:Goal:– help user retain an understanding of
the context of the part of the table they are focusing on

Perspective Wall Perspective Wall (Mackinlay et al. 91)(Mackinlay et al. 91)

Document Lens Document Lens (Robertson & Mackinlay 93)(Robertson & Mackinlay 93)
• Goal: show a long document in contextGoal: show a long document in context• Approach: Approach:
– lay pages out in a grid (on a “table”)– focus view on one page– show rest of pages distorted into a
pyramid-like layout– use greeking and other techniques to
simply suggest what is on the other pages

How many ways can we view a graph?How many ways can we view a graph?• Expand/contract hierarchy Expand/contract hierarchy
– like a mac or windows file browser
• Hyperbolic tree browserHyperbolic tree browser• Layout via dynamic arrangementLayout via dynamic arrangement
– 2D/3D force-directed placement– Simulated annealing
• Cluster tree hierarchiesCluster tree hierarchies• MultitreesMultitrees• Cone TreesCone Trees• TreemapsTreemaps

Hyperbolic BrowserHyperbolic Browser
• Focus + Context TechniqueFocus + Context Technique– detailed view blended with a global view
• First lay out the hierarchy on Poincare’ First lay out the hierarchy on Poincare’ mapping of the hyperbolic planemapping of the hyperbolic plane
• Then map this plane to a diskThen map this plane to a disk• Use animation to navigate along this Use animation to navigate along this
representation of the planerepresentation of the plane• Start with the tree’s root at the centerStart with the tree’s root at the center

Hyperbolic Tree Browser Hyperbolic Tree Browser (Lamping et al. 95)(Lamping et al. 95)
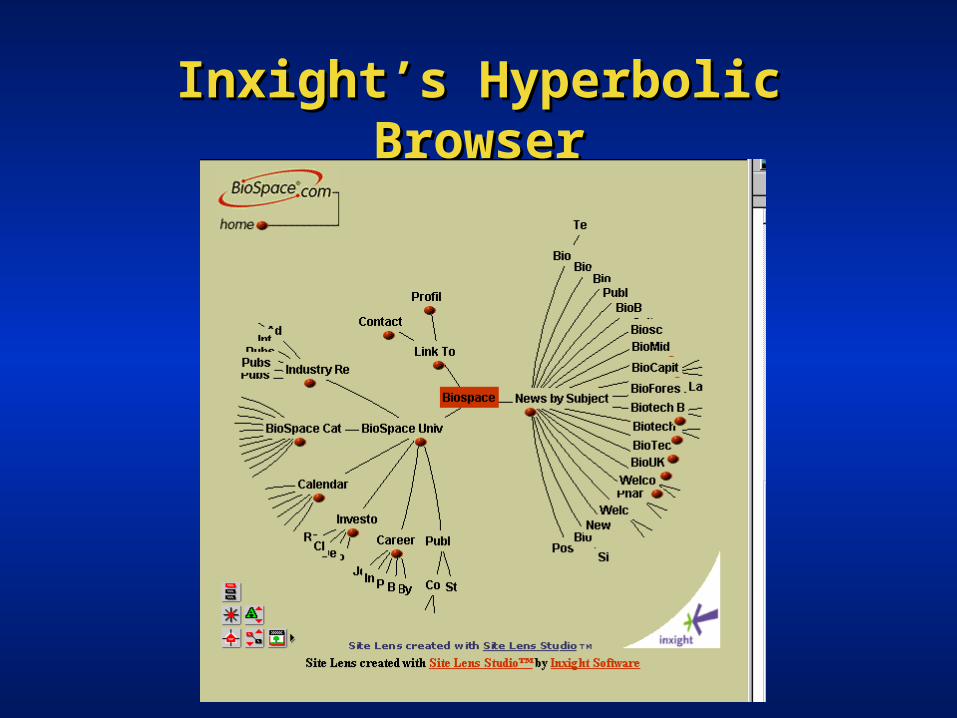
Inxight’s Hyperbolic BrowserInxight’s Hyperbolic Browser

Hyperbolic Tree ViewsHyperbolic Tree Views
• Nice demos on the web nowNice demos on the web now– www.inxight.com– www.thebrain.com
• This is a variation on it that might be more interesting
• Decides dynamically which subsets of the data to show

Thebrain.comThebrain.com
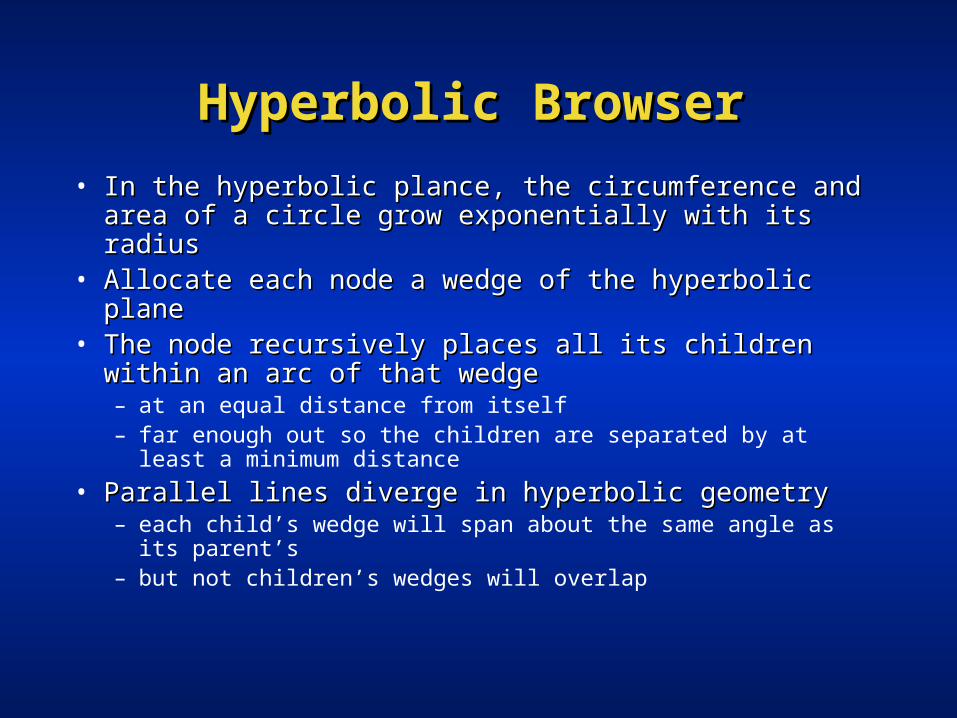
Hyperbolic BrowserHyperbolic Browser
• In the hyperbolic plance, the circumference and In the hyperbolic plance, the circumference and area of a circle grow exponentially with its radiusarea of a circle grow exponentially with its radius
• Allocate each node a wedge of the hyperbolic Allocate each node a wedge of the hyperbolic planeplane
• The node recursively places all its children within The node recursively places all its children within an arc of that wedge an arc of that wedge – at an equal distance from itself– far enough out so the children are separated by at least a
minimum distance
• Parallel lines diverge in hyperbolic geometryParallel lines diverge in hyperbolic geometry– each child’s wedge will span about the same angle as its
parent’s– but not children’s wedges will overlap

Hyperbolic ConeTreesHyperbolic ConeTrees (Munzner et al. 96)(Munzner et al. 96)
Use more of the “surface” than standard cone treesUse more of the “surface” than standard cone trees

Hyp
erb
olic
Con
eTre
esH
yper
bol
ic C
oneT
rees
(Mu
nzn
er e
t al
. 96)
(Mu
nzn
er e
t al
. 96)
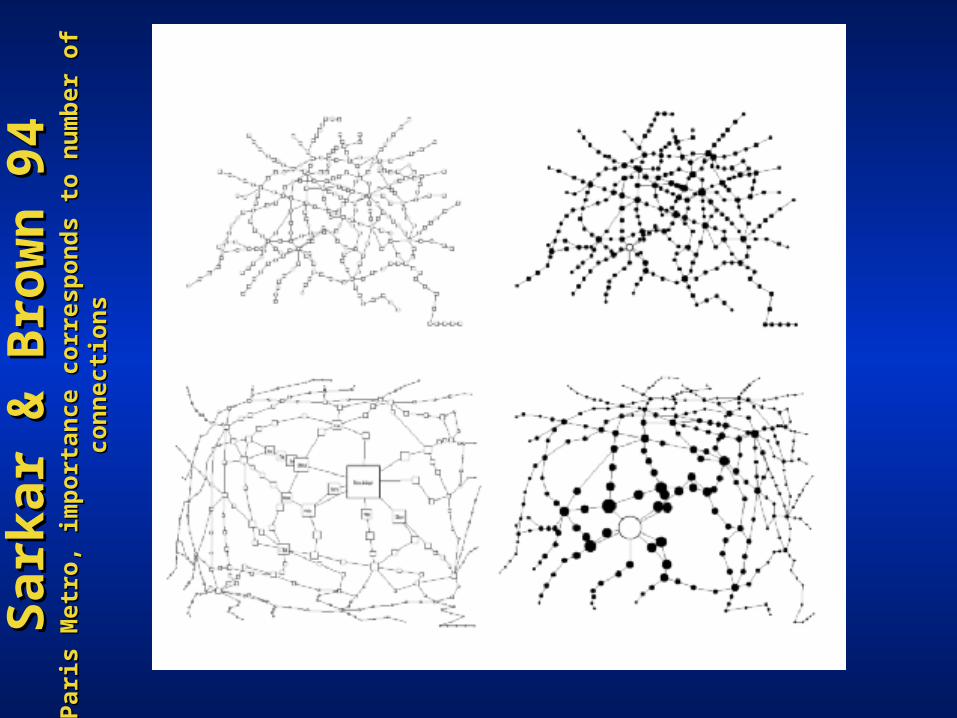
Sar
kar
& B
row
n 9
4S
ark
ar &
Bro
wn
94
Par
is M
etro
, im
port
ance
cor
resp
onds
to
num
ber
of c
onne
ctio
ns
Par
is M
etro
, im
port
ance
cor
resp
onds
to
num
ber
of c
onne
ctio
ns
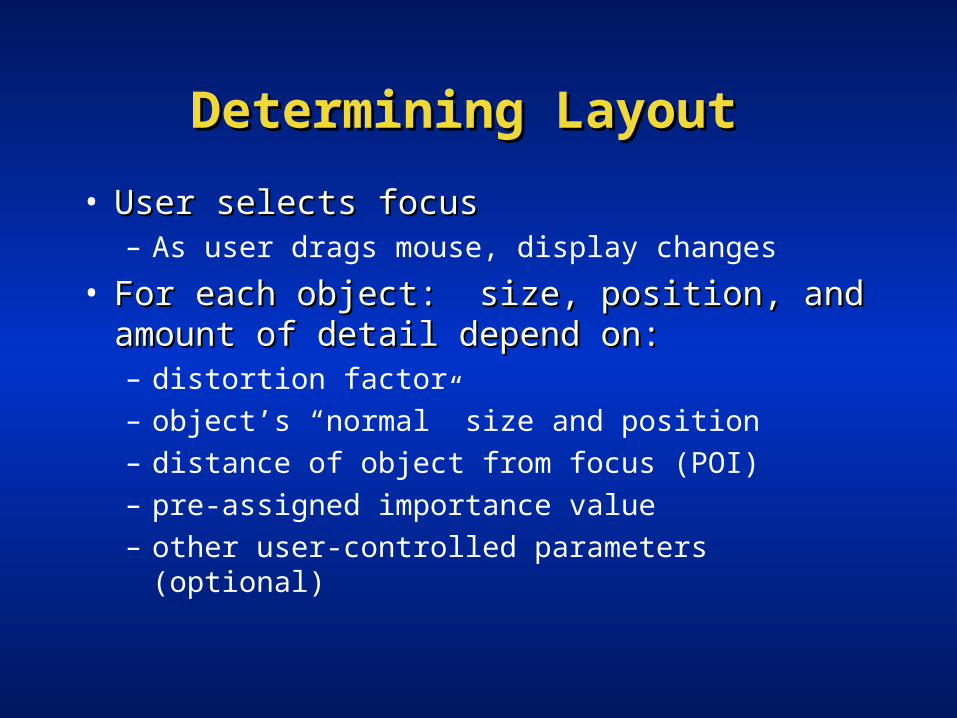
Determining Layout Determining Layout
• User selects focusUser selects focus– As user drags mouse, display changes
• For each object: size, position, and For each object: size, position, and amount of detail depend on:amount of detail depend on:– distortion factor– object’s “normal” size and position– distance of object from focus (POI)– pre-assigned importance value– other user-controlled parameters (optional)
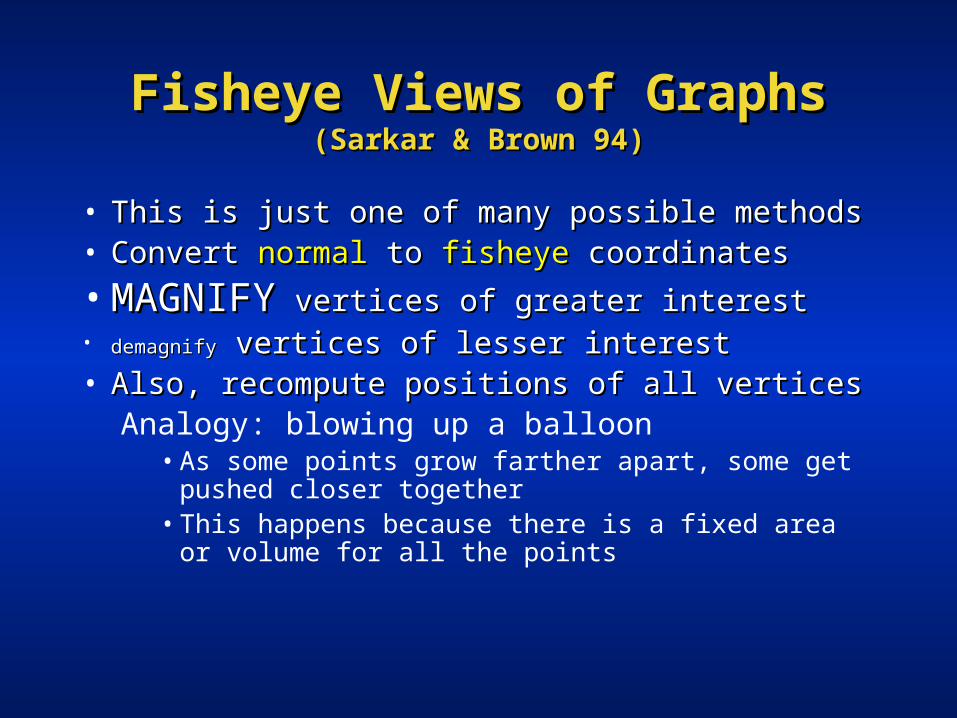
Fisheye Views of GraphsFisheye Views of Graphs(Sarkar & Brown 94)(Sarkar & Brown 94)
• This is just one of many possible methodsThis is just one of many possible methods• Convert Convert normalnormal to to fisheyefisheye coordinates coordinates
• MAGNIFYMAGNIFY vertices of greater interest vertices of greater interest• demagnifydemagnify vertices of lesser interest vertices of lesser interest• Also, recompute positions of all verticesAlso, recompute positions of all vertices
Analogy: blowing up a balloon• As some points grow farther apart, some get
pushed closer together• This happens because there is a fixed area or
volume for all the points

Converting from Normal to Converting from Normal to Fisheye CoordinatesFisheye Coordinates
• Determine the current focus.Determine the current focus.• Then, for each vertex in the graph:Then, for each vertex in the graph:
– Compute new position– Compute new size– Determine amount of detail to be shown– Compute visual worth:
• Importance (API) +• Distance from the focus point• -> Even a very important node may be small if it
is very far from the focus point

Computing New Vertex PositionComputing New Vertex Position
• A vertex’s new position is a A vertex’s new position is a function of its normal position and function of its normal position and that of the focusthat of the focus
• Distortion factor determines how Distortion factor determines how far points are spread out from the far points are spread out from the focusfocus

Compute New Vertex PositionCompute New Vertex Position
focus theand formed trans
being vertex ebetween th distance horizontal
focus theand
boundary screen ebetween th distance horizontal 1
)1()(
,
))(),((),(
max
maxmax
maxmax
1
x
x
yy
y
y
xx
x
x
normal
focus
normal
focusnormal
normalnormalfisheye
D
Ddx
xdxG
PDD
DGPD
D
DG
fPvPFfvP
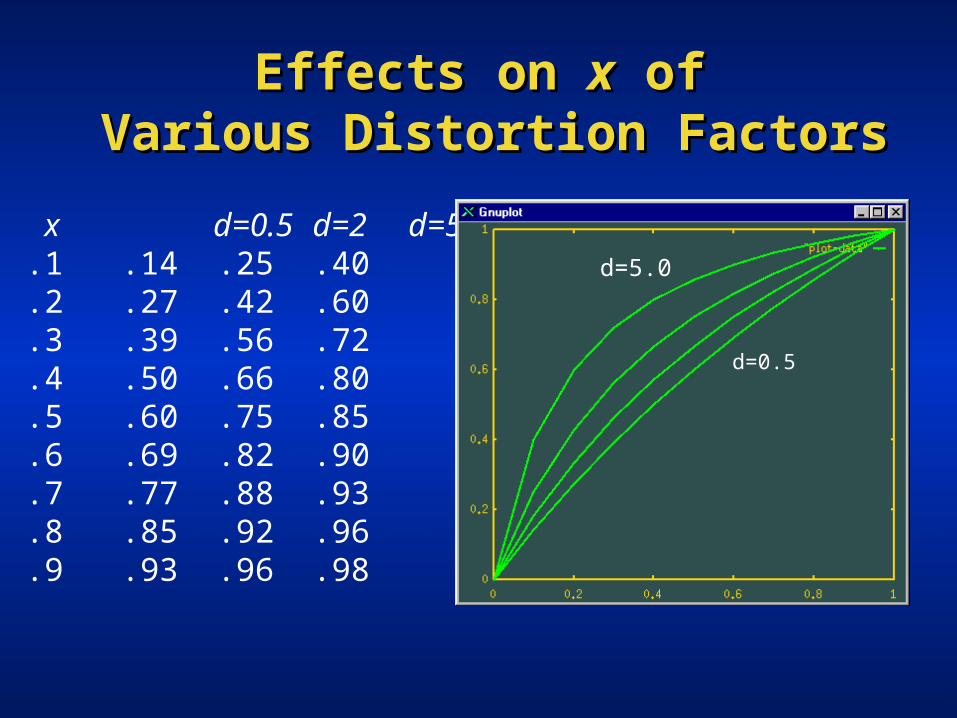
Effects on Effects on xx of of Various Distortion FactorsVarious Distortion Factors
x d=0.5 d=2 d=5.1 .14 .25 .40.2 .27 .42 .60.3 .39 .56 .72.4 .50 .66 .80.5 .60 .75 .85.6 .69 .82 .90.7 .77 .88 .93.8 .85 .92 .96.9 .93 .96 .98
d=5.0
d=0.5
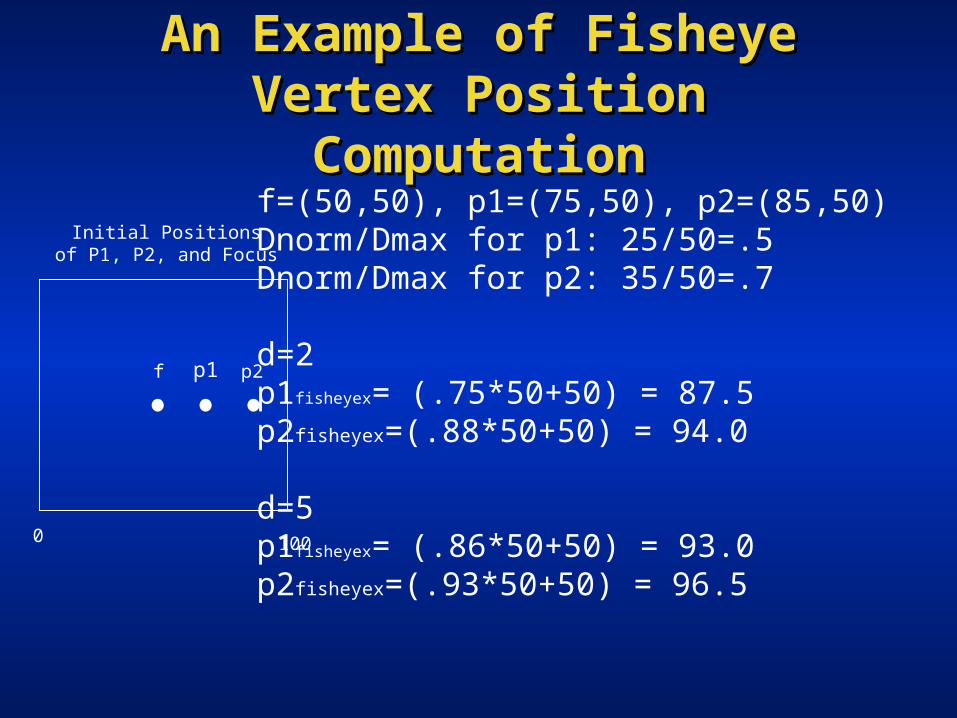
An Example of FisheyeAn Example of FisheyeVertex Position ComputationVertex Position Computation
f p1 p2
f=(50,50), p1=(75,50), p2=(85,50)Dnorm/Dmax for p1: 25/50=.5Dnorm/Dmax for p2: 35/50=.7
d=2p1fisheyex= (.75*50+50) = 87.5p2fisheyex=(.88*50+50) = 94.0
d=5p1fisheyex= (.86*50+50) = 93.0p2fisheyex=(.93*50+50) = 96.5
0 100
Initial Positionsof P1, P2, and Focus
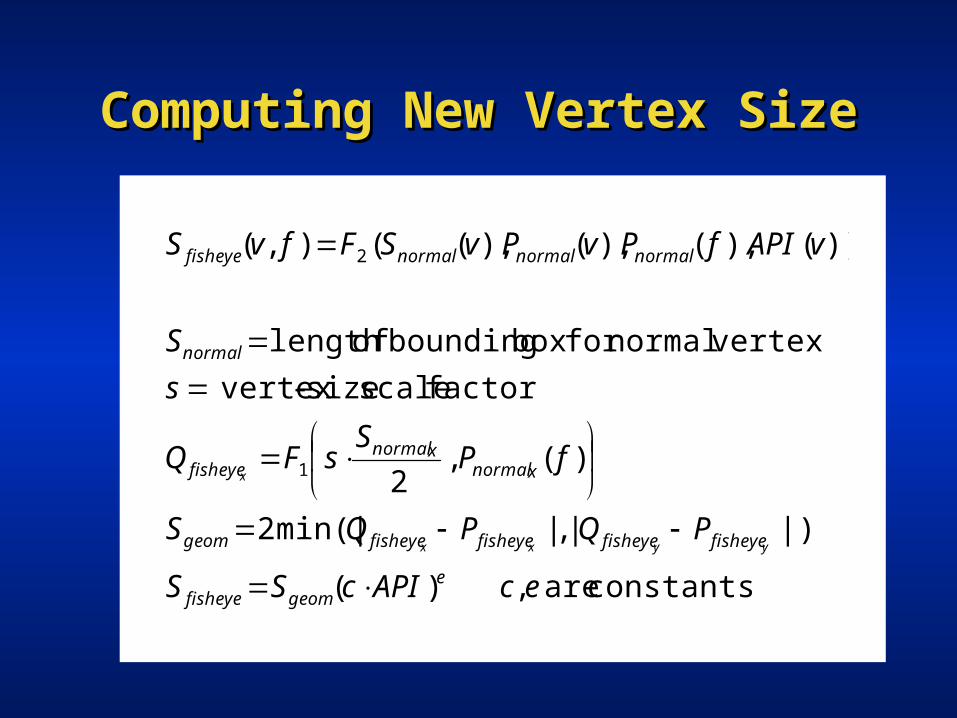
Computing New Vertex SizeComputing New Vertex Size
constants are , )(
|)| , |min(|2
)(,2
factor scale size- vertex
vertexnormalfor box bounding oflength
))(),(),(),((),(
1
2
ecAPIcSS
PQPQS
fPS
sFQ
s
S
vAPIfPvPvSFfvS
egeomfisheye
fisheyefisheyefisheyefisheyegeom
xnormalxnormal
fisheye
normal
normalnormalnormalfisheye
yyxx
x

Computing New Vertex SizeComputing New Vertex Size
Vertex size is a function of the normal Vertex size is a function of the normal size, the distance from the focus, and size, the distance from the focus, and the API of the vertexthe API of the vertex– look at length of side of bounding box– find a point that is
• s* length/2 away from center of vertex• s is a vertex-size scale factor• move in direction opposite of the focus
– convert to fisheye coordinates– scale by API

Sar
kar
& B
row
n 9
4S
ark
ar &
Bro
wn
94

Sar
kar
& B
row
n 9
4S
ark
ar &
Bro
wn
94

Sar
kar
& B
row
n 9
4S
ark
ar &
Bro
wn
94
dis
tort
ion
leve
l 5 v
s. 2
dis
tort
ion
leve
l 5 v
s. 2

Computing DetailComputing Detail
• The amount of detail is The amount of detail is proportional to the size of the proportional to the size of the vertex in the fisheye coordinatesvertex in the fisheye coordinates
• But must not exceed a maximum But must not exceed a maximum amount of detailamount of detail– determine font size– determine size of nodes to avoid
overlap– determine resolution of an image

Computing Visual WorthComputing Visual Worth
• A cutoff that determines whether A cutoff that determines whether or not a node is shown at allor not a node is shown at all
• A function of the size of the node A function of the size of the node and a set of constantsand a set of constants

Sar
kar
& B
row
n 9
4S
ark
ar &
Bro
wn
94
mor
e em
ph
asis
on
imp
orta
nce
mea
sure
mor
e em
ph
asis
on
imp
orta
nce
mea
sure

Sar
kar
& B
row
n 9
4S
ark
ar &
Bro
wn
94

Sar
kar
& B
row
n 9
4S
ark
ar &
Bro
wn
94

Dynamic Grouping and ClusteringDynamic Grouping and Clustering
• Start with an initial (random) organizationStart with an initial (random) organization• Apply a function to change the layoutApply a function to change the layout• Repeat until some stopping condition is Repeat until some stopping condition is
reachedreached• Two common techniquesTwo common techniques
– nodes and springs• aka attraction and repulsion forces• aka force-directed placement
– simulated annealing

Force-Directed PlacementForce-Directed Placement(Fruchterman & Rheingold 90)(Fruchterman & Rheingold 90)
• Also called attraction and repulsion and nodes-and-Also called attraction and repulsion and nodes-and-springssprings
• Works well on sparse graphsWorks well on sparse graphs• Edges modeled as springs that cause the vertices on Edges modeled as springs that cause the vertices on
either end to be attracted to each othereither end to be attracted to each other• Vertices are repulsive forcesVertices are repulsive forces• The repulsive forces balance the attractive forces to The repulsive forces balance the attractive forces to
keep vertices from ending up too close togetherkeep vertices from ending up too close together• The procedure iterates:The procedure iterates:
– start with random placement– compute attraction/repulsion– do a new layout– repeat until some stopping threshold is met

Force-Directed PlacementForce-Directed Placement(Amir 93, based on Fruchterman and Rheingold 90)(Amir 93, based on Fruchterman and Rheingold 90)

Force-Directed PlacementForce-Directed Placement(Amir 93, based on Fruchterman and Rheingold 90)(Amir 93, based on Fruchterman and Rheingold 90)

Computing Layout Computing Layout • The procedure iterates:The procedure iterates:
– start with random placement– compute attraction/repulsion– do a new layout– repeat until some stopping threshold is met
• Given two vertices v1 and v2• Distance between v1 and v2 is x
display theofgeometry by the determined is
verticesofnumber is
5.2
Initially
)(21
2
221
C
nn
Ckk
xkf
x
kkf
ve
eattractive
vvrepulsive
m

3D Force-Directed Placement3D Force-Directed Placement
• Hendley et al. paper shows 3D Hendley et al. paper shows 3D versions of force-directed versions of force-directed placementplacement
• They also group close-together They also group close-together nodes into super-nodesnodes into super-nodes