simulated calculation of bullheading method when the well
TRANSCRIPT

9 Copyright © Canadian Research & Development Center of Sciences and Cultures
ISSN 1925-542X [Print] ISSN 1925-5438 [Online]
www.cscanada.netwww.cscanada.org
Advances in Petroleum Exploration and DevelopmentVol. 17, No.1, 2019, pp. 9-15DOI:10.3968/10995
Simulated Calculation of Bullheading Method When the Well is Empty
GONG Peibin[a]; HE Long[b]; WANG Shujiang[a]; FAN Xilian[b]; CHEN Yang[a]; SUN Baojiang[c]
[a]Drilling Technology Research Institute, Shengli Petroleum Engineering Ltd., Sinopec, Dongying, China.[b]Southwest Oil & Gas Branch Company, Sinopec, Chengdu ,China.[c]Scholl of Petroleum engineering, China University of Petroleum (Huadong), Qingdao, China.*Corresponding author.
Received 1 November 2018; accepted 8 March 2019Published online 22 April 2019
AbstractIn the case of drilling mud completely erupted out of wellbore in high pressure gas wells, a series of fluid flowing governing equations are established in the consideration of coupling relationship between gas in well bore and formation. The change in casing pressure and bottom hole pressure with time was numerically simulated during shut in and well killing process. The results show that casing pressure and bottom hole pressure can achieve stable value quickly after shut in. The casing pressure increases rapidly first and then decreases to zero in well killing process. The earlier a well killing is performed, the smaller the peak value of casing pressure will occur under the same kill rate. A high kill rate can generate a small peak value of casing pressure after the well killing starts.Key words: Gas well; Empty well; Well Control; Bullheading; Numerical simulation
Gong, P. B. , He, L. , Wang, S . J . , Fan, X. L. , Chen, Y. , & Sun , B . J . (2019) . S imula ted Ca lcu la t ion o f Bul lhead ing Method When the Wel l i s Empty. Advances in Pe tro leum Exploration and Development , 17 (1), 9-15. Available from: http:/ /www.cscanada.net/ index.php/aped/art icle/view/10995 DOI: http://dx.doi.org/10.3968/10995
INTRODUCTIONIn drilling engineering, if a high pressure reservoir is encountered and unreasonable steps are taken to control
the complication, the amount of formation gas with high pressure may invade the wellbore abruptly in a short time (Hao and Liu, 1988; Oudeman and Avest, 1994; Blount and Soeiinah, 1981). This can erupt the mud out of the well and make the well empty. A similar event can also occur in gas drilling. When a high-pressure formation is drilled with gas drilling, the formation gas will flood into the well without control because there is no mud in the wellbore to form a hydrostatic column pressure. Once the blowout occurs, the gas well production can reach millions, even tens of millions cubic meters per day (Blount and Soeiinah, 1981; Oudeman, 1999). To deal with this complication, weighted mud is usually pumped into the drill pipe to kill the blowout. But in some cases, mud pumped into the drill pipe cannot be circulated out of the well because the nozzle is plugged or there is only very short drill stem in the well. So the conventional well control method cannot be applied to kill the well (O’Brien and Goins, 1960; Grace, 2003; Ely and Holditch, 1987). Bullheading method is an unconventional kill method to solve this complicated situation, which is suitable to the blowout gas well with sound BOPs (Lei and Li, 2000; Li, et al. (2010; Lei and Lin, 1997; Hao, 1992). In this operation, firstly the BOPs are closed to seal the well and then a high pressure kill mud is pumped into the well to push the formation gas back into the formation. Bullheading is conducted until the whole gas is forced into the formation. Due to the complex fluid flow process in the well, there is not much research on this method and bullheading is ordinarily used by experience in field practice, which limits the application scale of the method to a large extent.
In this paper, nodal analysis is adapted to calculate the gas flow rate with open BOPs by computer simulation which is used as the initial condition of shut in and well killing simulation. Dynamic change of casing pressure and bottom hole pressure is calculated during shut in and well killing process. Then key parameters of bullheading

10Copyright © Canadian Research & Development Center of Sciences and Cultures
Simulated Calculation of Bullheading Method When the Well is Empty
such as kill rate and shut-in moment are analyzed. The simulation results can supply a theory evidence for the field practice.
1 . PR INCIPLE OF BULLHEADING METHODBullheading is an unconventional well control method and the whole process of killing gas wells is divided into three stages.
Stage one (shown in Figure 1-a): The well is shut in and weighted mud is pumped into the well from the kill line or drill stem or both of them simultaneously. Natural gas in the well is compressed. Formation pressure is still higher than the bottom hole pressure, that will result in a continuous gas inflow to the well until the sum of
casing pressure, mud hydrostatic pressure and gas column pressure is equal to formation pressure. And then the formation gas stops to flow to the wellbore.
Stage two (shown in Figure 1-b): Continue to pump the mud into wellbore. The bottom hole pressure is slightly higher than formation pressure and the gas in the well is pushed into the porous formation. As the mud column is gradually built, the casing pressure will show a lasting decrease.
Stage three (shown in Figure 1-c): Continue to pump the mud into the well. As the mud hydrostatic column pressure is higher than the formation pressure, casing pressure becomes zero and the gas is forced to the porous formation by the mud only. When the gas in wellbore is wholly pushed into the formation, bullheading operation is achieved and the well killing is successful.
Figure 1 Process of bullheading well control
A constant pump rate is usual ly required to implement an effective application of bullheading. Other applied conditions include deep casing depth and high permeability of open hole formation. In addition, density and viscosity of kill mud, composition of natural gas, wellbore size, formation pressure and fracture pressure are all influencing factors of a bullheading operation (Otutu, et al., 2005).
2. GOVERNING EQUATIONS OF FLUIDS IN WELLBOREWhen the well is empty, there is only gas phase in wellbore. Then well killing is implemented and the kill fluid is at the top of wellbore with the gas at the bottom. To simplify the calculation of the equations, the following assumption is made.
• The gas or kill mud in the well is one-dimensional flow because the wellbore size is much smaller than the well depth.
• When the well is empty (without mud), the loss of gas kinetic energy is ignored compared with the total energy loss (v·dv = 0).
• After the kill mud is pumped into the well, the mud pushes the gas to formation at a constant speed. The interface between gas and mud is thin and no mixture two-phase flow occurs.
• Permeability of porous formation at the bottom hole is isotropic and gas flow in the reservoir is calculated by plane radial flow formula.
2.1 Continuity Equation
Gas phase: ( )g
ggg qsv
t=
∂
∂+
∂
∂ ρρ (1-a)
Liquid phase: ( )0=
∂∂
+∂∂
sv
tkkk ρρ (1-b)
Where ρg and ρk are the gas density and kill mud density respectively in kg/m3, vg and vk are the gas velocity and kill mud velocity respectively in m/s, s is the depth of the well in m; qg is gas production in kg/(m·s).

11 Copyright © Canadian Research & Development Center of Sciences and Cultures
GONG Peibin; HE Long; WANG Shujiang; FAN Xilian; CHEN Yang; SUN Baojiang (2019). Advances in Petroleum Exploration and Development, 17(1), 9-15
2.2 Momentum EquationWhen there is no mud in the well or the mud is absolutely
erupted out of the well, the gas is the only fluid in the well. So the momentum equation is shown as Eq. (2).
(2)
When bullheading begins, the momentum equation of kill mud is shown as Eq. (3).
(3)
Where:P is the pressure in the wellbore, Pa;g is the acceleration of gravity, m/s2; α is deviation angle,°;ρk is kill mud density, kg/m3;vk is the velocity of kill mud, m/s; f1 and f2 are friction resistance of gas and kill mud respectively, Pa/m.
2.3 Gas Production EquationConsidering the high production of formation gas, the gas flow in the porous rocks belongs to non-Darcy seepage behavior. And the gas production equation is as follows (Vallejo-Arrieta, 2002; Yang, 1992).
(4)
(5)
(6)
During the stage two and three of bullheading, gas in wellbore is forced to the formation. The gas flow rate to the formation is equal to the kill rate which is Darcy seepage behavior and the gas flow rate can be calculated by Eq. (7).
(7)
Where is the reservoir pressure in Mpa,
is the bottom hole pressure in MPa, Qsc is the gas production rate at the standard condition in m3/d, qsi is the flow rate of compressed gas pushed into formation in m3/s, A and B are Darcy and non-Darcy coefficient respectively, T is the temperature at the calculation point in K, μg is the gas viscosity in Pa·s, Z is gas compression factor, k is permeability for gas in m2, h is the height of gas formation drilled in m, rw and re are the radius of wellbore and reservoir respectively in m, S is skin factor of borehole, β is velocity coefficient in m-1.
2.4 Auxiliary EquationsW e l l b o r e t e m p e r a t u r e f i e l d e q u a t i o n :
sTTT grandg ⋅+= 0 (8)
Gas equation of state: ZT
p gg
γρ
3484=
(9)
Deviation angle equation: α = α (s) (10)Where: T is wellbore temperature at the depth of s,
K; Tg0 is gas temperature at wellhead in K; Tgrad is gas temperature gradient in K/m.
3. NUMERICAL SOLUTION METHOD
3.1 Definite Solution ConditionThe definite solution condition includes pressure boundary and temperature boundary at bottom hole and wellhead (Sun, et al., 2011; Wang, et al., 2009). The simulation of bullheading can be divided into three parts which are absolute open flow, shut-in and well killing. The initial and boundary conditions for the three period are as follows.
Absolute open flow: pa = 105 Pa,T(t,i) = FT(t,i)Shut-in: qg (t,i)= qsc(t,i)/rsc, T(t,i) = FT(t,i)Well killing: qg (t,i) = qsc(t,i)/rsc , T(t,i) = FT(t,i)(Stage
one;qsi=Qk,T(t,i) = FT(t,i)(stage two to three)Where Pa is casing pressure in Pa, Qk is kill mud
pump rate in m3/s, rsc is the natural gas density at standard condition in kg/m3, FT is wellbore temperature function.
3.2 Solution ProcedureFinite difference method is adopted to solve the differential equations. Space domain is the whole wellbore and the time domain is the bullheading time. Then the grid division of definite area is completed and all the grid points are used to simulated the whole time-space domain. During the calculation, the difference quotient is adopted instead of calculating the value of derivative in governing equations. Discrete all the governing equations and we can calculate the parameter value at each node. Repeat the above calculation in the entire time domain and all the parameters at any time and location of the well can be obtained (Gao, et al., 2008).

12Copyright © Canadian Research & Development Center of Sciences and Cultures
Simulated Calculation of Bullheading Method When the Well is Empty
Take the well killing operation as an example to demonstrate the calculation process shown in Figure 2. Where Pmax is the maximum allowed casing pressure, Vk
is the kill mud volume and Vwell is the volume of whole wellbore.
Figure 2 Flow chart of bullheading calculation simulation
4. SIMULATED EXAMPLE AND RESULT ANALYSISIn this subsection, the developed methodology has been applied to simulate the whole process of bullheading in a 1200 m well. The basic drilling parameters of the well are tabulated in Table 1. Besides, we assume that there is no drill stem in wellbore when the gas well blowout occurs and the BOPs are all in perfect working order. The well can be shut in to implement a bullheading well killing. The simulated results are described from Figure 3 to Figure 8.
Table 1Calculation Data of Bullheading
Drill parameters Value Drill parameters Value
Well depth (m) 1200 Reservoir height drilled (m) 4
Deviation angel (°) 0 Gas density ratio 0.75
Casing size (mm) 244.5 Skin factor 0
Casing depth (m) 1170 Temperature at surface (℃) 21
Formation pressure (MPa) 13.7 Temperature gradient
(℃/m) 0.03
Fracture pressure (MPa) 15.9 Kill mud density (g/
cm3) 1.3
R a d i u m o f g a s reservoir (m) 20 Kill mud viscosity
(Pa·s) 0.013
Permeability (mD) 400 Allowed casing pressure (MPa) 15
4.1 Absolute Open Gas Flow
Figure 3 Gas production in absolute open flow of gas well
Figure 3 shows the calculation of gas production in absolute open hole by nodal analysis. The bottom hole is selected as the nodal and its pressure value can be obtained either through gas momentum equation Eq. (2) or gas production equation including Eq. (4), Eq. (5) and Eq. (6). The curve from the former method is called Outflow Performance Relationship Curve (OPR curve) which is calculated from wellhead to bottom hole. And the curve from the later method is called Inflow Performance Relationship Curve (IPR curve) which is calculated from the reservoir to bottom hole.

13 Copyright © Canadian Research & Development Center of Sciences and Cultures
GONG Peibin; HE Long; WANG Shujiang; FAN Xilian; CHEN Yang; SUN Baojiang (2019). Advances in Petroleum Exploration and Development, 17(1), 9-15
As can be seen from Figure 3 the bottom hole pressure decreases with the increase of gas production in IPR curve, but it increases with the increase of gas production in OPR curve. The intersection of the two curves indicates the gas flow rate and the corresponding pressure at bottom hole. The gas flow rate is 6.525×10⁶ m3/d and the flow pressure at bottom hole is 3.77 MPa.
4.2 Shut-in ProcessOnce the well is shut-in, the formation gas will continue to flow to the wellbore initially. The gas in wellbore is then compressed and the bottom hole pressure keep rising, which in turn reduces the invasion of formation gas. At last, a state of equilibrium is reached and there is no gas flowing to the wellbore.
The dynamic change of casing pressure and bottom hole pressure is shown in Figure 4. It can be seen from the diagram that both the casing pressure and bottom hole pressure increase after shut in. After about 125 seconds, the casing pressure and bottom hole pressure became constant until the 180 seconds. It reveals that the amount of gas invading the well in a short time can increases the casing pressure and bottom hole pressure after shut-in. At the same time, the growth of bottom hole pressure reduces the gas production from reservoir. As a result, the growth rate of gas production becomes lower and lower with time. And that can be seen from the slope of curve in Figure 4.
Figure 4 Casing pressure and bottom hole pressure change after shut in4.3 Bullheading Well Killing4.3.1 Influence of Kill MomentKill moment here is defined as any moment after the shut in of a well. Figure 5 and Figure 6 show the casing pressure and bottom hole pressure change respectively when the kill moment is 10s, 30s, 60s, 90s and 120s with the kill rate of 80L/s. From Figure 5 we can see that the casing pressure first increase and then starts to decrease after its peak value. The hydrostatic column
value is slightly higher than the formation pressure at the moment of 615s and the casing pressure became 0 till the bullheading is over. Figure 6 shows the similar change law that the bottom hole pressure first increase till the casing pressure reaches the maximum value. Then the bottom hole pressure grows slightly higher than formation pressure and that value lasts until the bullheading is over.
It can be seen from the comparison of Figure 5 and Figure 6 that the earlier the kill moment is, the lower the maximum casing pressure occurs. And a lower pressure level of wellhead equipment is needed when bullheading is applied.
Figure 5 Effect of kill moments on casing pressure
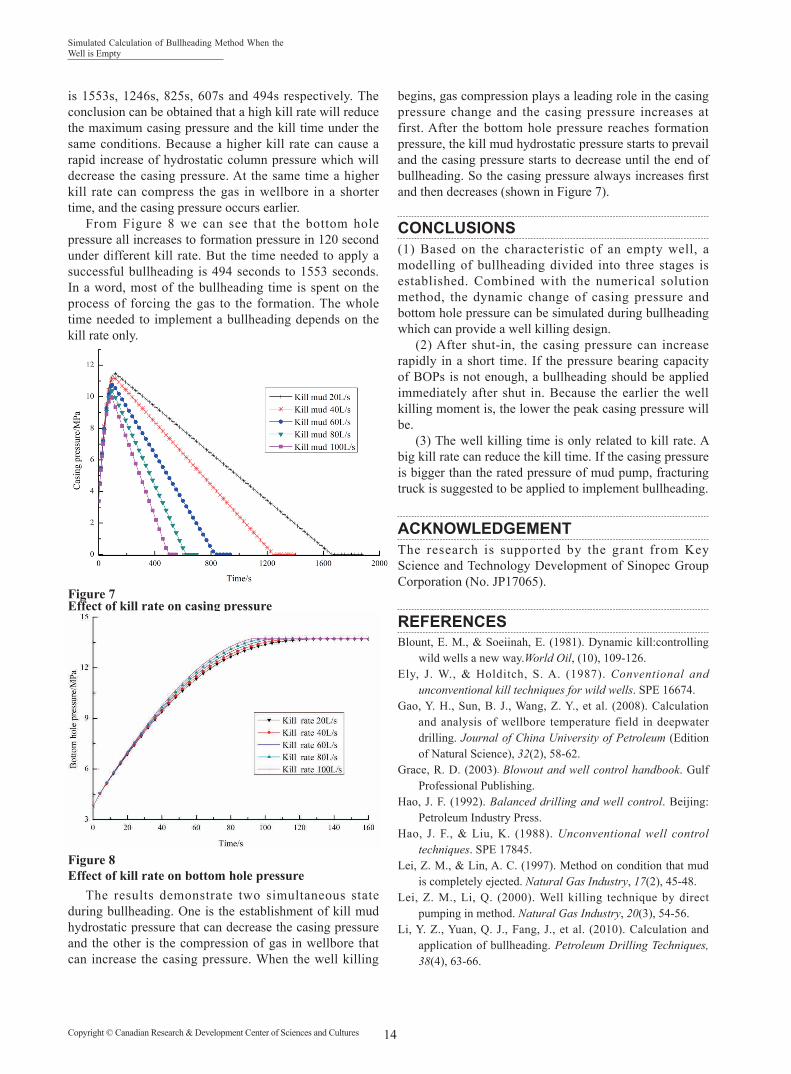
Figure 6 Effect of kill moments on bottom hole pressure4.3.2 Influence of kill rateFigure 7 and Figure 8 show the casing pressure and bottom hole pressure change respectively when the kill rate is 20 L/s, 40 L/s, 60 L/s, 80 L/s and 100 L/s with the kill moment of 0 s. That means well killing is implemented immediately after shut in. From Figure 7 the maximum casing pressure is 11.6MPa, 11.3MPa, 10.9MPa, 10.7MPa, 10.4MPa and 10.1MPa when the kill rate is 20L/s, 40L/s, 60L/s, 80L/s and 100L/s. And the corresponding time needed to complete bullheading
14Copyright © Canadian Research & Development Center of Sciences and Cultures
Simulated Calculation of Bullheading Method When the Well is Empty
is 1553s, 1246s, 825s, 607s and 494s respectively. The conclusion can be obtained that a high kill rate will reduce the maximum casing pressure and the kill time under the same conditions. Because a higher kill rate can cause a rapid increase of hydrostatic column pressure which will decrease the casing pressure. At the same time a higher kill rate can compress the gas in wellbore in a shorter time, and the casing pressure occurs earlier.
From Figure 8 we can see that the bottom hole pressure all increases to formation pressure in 120 second under different kill rate. But the time needed to apply a successful bullheading is 494 seconds to 1553 seconds. In a word, most of the bullheading time is spent on the process of forcing the gas to the formation. The whole time needed to implement a bullheading depends on the kill rate only.
Figure 7 Effect of kill rate on casing pressure
Figure 8Effect of kill rate on bottom hole pressure
The results demonstrate two simultaneous state during bullheading. One is the establishment of kill mud hydrostatic pressure that can decrease the casing pressure and the other is the compression of gas in wellbore that can increase the casing pressure. When the well killing
begins, gas compression plays a leading role in the casing pressure change and the casing pressure increases at first. After the bottom hole pressure reaches formation pressure, the kill mud hydrostatic pressure starts to prevail and the casing pressure starts to decrease until the end of bullheading. So the casing pressure always increases first and then decreases (shown in Figure 7).
CONCLUSIONS(1) Based on the characteristic of an empty well, a modelling of bullheading divided into three stages is established. Combined with the numerical solution method, the dynamic change of casing pressure and bottom hole pressure can be simulated during bullheading which can provide a well killing design.
(2) After shut-in, the casing pressure can increase rapidly in a short time. If the pressure bearing capacity of BOPs is not enough, a bullheading should be applied immediately after shut in. Because the earlier the well killing moment is, the lower the peak casing pressure will be.
(3) The well killing time is only related to kill rate. A big kill rate can reduce the kill time. If the casing pressure is bigger than the rated pressure of mud pump, fracturing truck is suggested to be applied to implement bullheading.
ACKNOWLEDGEMENTThe research is supported by the grant from Key Science and Technology Development of Sinopec Group Corporation (No. JP17065).
REFERENCESBlount, E. M., & Soeiinah, E. (1981). Dynamic kill:controlling
wild wells a new way.World Oil, (10), 109-126.Ely, J. W., & Holditch, S. A. (1987). Conventional and
unconventional kill techniques for wild wells. SPE 16674.Gao, Y. H., Sun, B. J., Wang, Z. Y., et al. (2008). Calculation
and analysis of wellbore temperature field in deepwater drilling. Journal of China University of Petroleum (Edition of Natural Science), 32(2), 58-62.
Grace, R. D. (2003). Blowout and well control handbook. Gulf Professional Publishing.
Hao, J. F. (1992). Balanced drilling and well control. Beijing: Petroleum Industry Press.
Hao, J. F., & Liu, K. (1988). Unconventional well control techniques. SPE 17845.
Lei, Z. M., & Lin, A. C. (1997). Method on condition that mud is completely ejected. Natural Gas Industry, 17(2), 45-48.
Lei, Z. M., Li, Q. (2000). Well killing technique by direct pumping in method. Natural Gas Industry, 20(3), 54-56.
Li, Y. Z., Yuan, Q. J., Fang, J., et al. (2010). Calculation and application of bullheading. Petroleum Drilling Techniques, 38(4), 63-66.

15 Copyright © Canadian Research & Development Center of Sciences and Cultures
GONG Peibin; HE Long; WANG Shujiang; FAN Xilian; CHEN Yang; SUN Baojiang (2019). Advances in Petroleum Exploration and Development, 17(1), 9-15
O’Brien, T. B., & Goins, W. C. (1960). The mechanics of blowouts and how to control them. API, Drilling and production practice.
Otutu, F., Alli, M., Ogunkoya, A., et al. (2005). Modelling and management of annular surface blowouts-an SPDC case study. SPE 98793.
Oudeman, P. (1999). Kill procedures to avoid formation damage in the high rate gas wells of an underground storage project. SPE 54761.
Oudeman, P., & Avest, D. T. (1994). Bull heading to kill live gas wells.SPE 28896.
Sun, B. J., Wang, Z. Y., Gong, P. B., et al. (2011). Application
of a seven-component multiphase flow model to deep water well control. Acta Petrolei Sinica, 32(6), 1042-1049.
Vallejo-Arrieta, V. G. (2002). Analytical model to control off-bottom blowouts utilizing the concept of simultaneous dynamic seal and bullheading. Dissertation, Louisiana State University.
Wang, Z. Y., Sun, B. J., & Cheng, H. Q. (2009). Prediction of gas hydrate formation region in the wellbore of deepwater well control. Chinese Journal of Applied Mechanics, 26(2), 224-229.
Yang, J. S. (1992). Fundamentals of gas recovery. Beijing: Petroleum Industry Press.