simulating climate change effects on tree distributions at ... · distributions at wind cave...
TRANSCRIPT

Simulating Climate Change Effects on TreeDistributions at Wind Cave National Park, SD with a
Dynamic Global Vegetation Model:Implications for Species Range Shifts
David King Biological and Ecological Engineering, OSU
Dominique Bachelet Conservation Biology Institute & OSU
Amy Symstad US Geological Survey
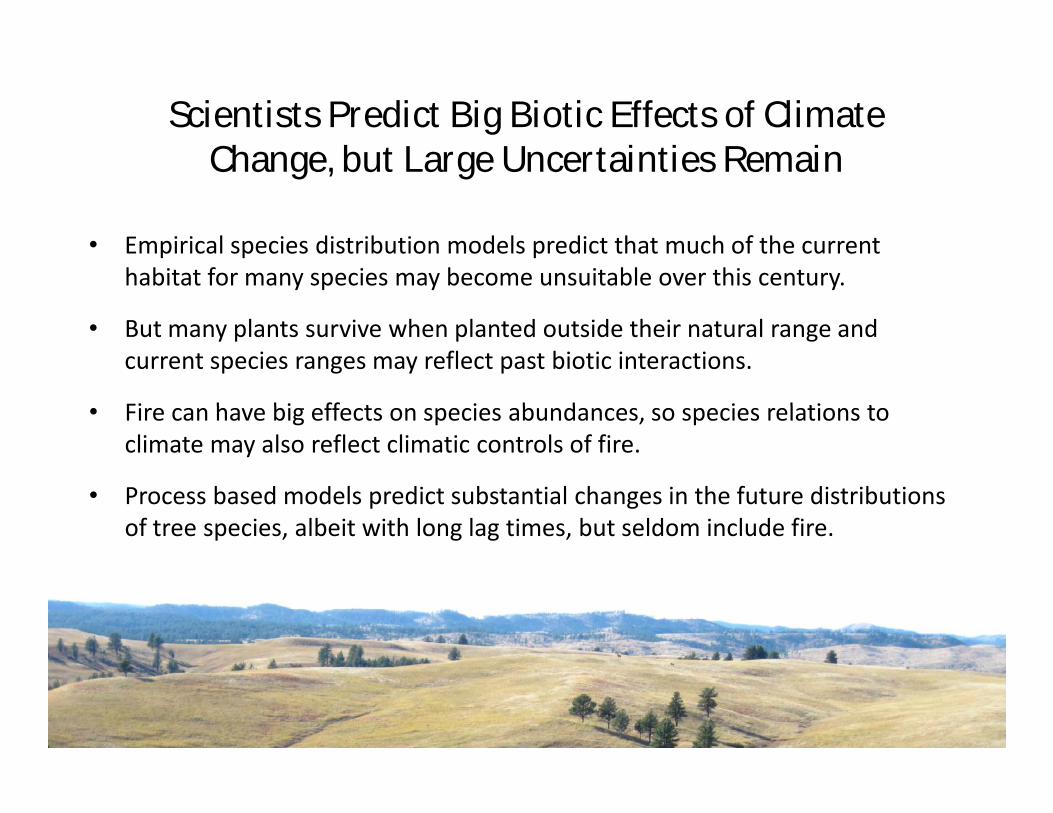
Scientists Predict Big Biotic Effects of ClimateChange, but Large Uncertainties Remain• Empirical species distribution models predict that much of the current
habitat for many species may become unsuitable over this century.
• But many plants survive when planted outside their natural range andcurrent species ranges may reflect past biotic interactions.
• Fire can have big effects on species abundances, so species relations toclimate may also reflect climatic controls of fire.
• Process based models predict substantial changes in the future distributionsof tree species, albeit with long lag times, but seldom include fire.
• Empirical species distribution models predict that much of the currenthabitat for many species may become unsuitable over this century.
• But many plants survive when planted outside their natural range andcurrent species ranges may reflect past biotic interactions.
• Fire can have big effects on species abundances, so species relations toclimate may also reflect climatic controls of fire.
• Process based models predict substantial changes in the future distributionsof tree species, albeit with long lag times, but seldom include fire.
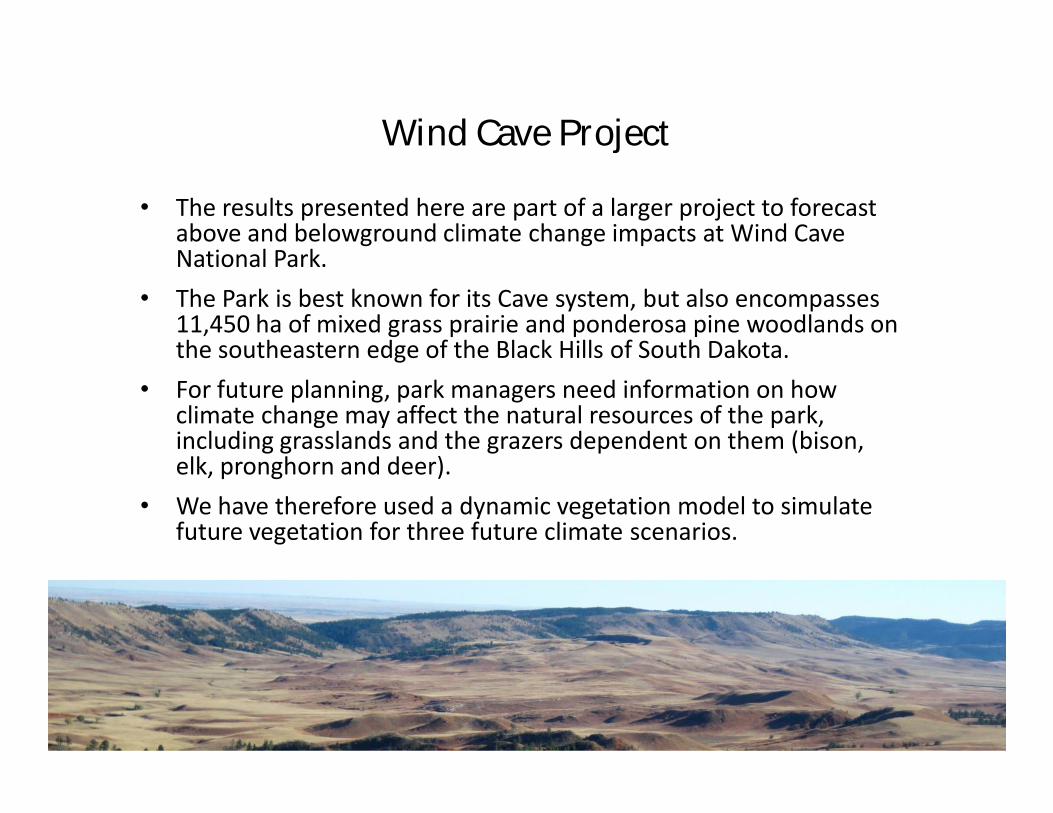
Wind Cave Project• The results presented here are part of a larger project to forecast
above and belowground climate change impacts at Wind CaveNational Park.
• The Park is best known for its Cave system, but also encompasses11,450 ha of mixed grass prairie and ponderosa pine woodlands onthe southeastern edge of the Black Hills of South Dakota.
• For future planning, park managers need information on howclimate change may affect the natural resources of the park,including grasslands and the grazers dependent on them (bison,elk, pronghorn and deer).
• We have therefore used a dynamic vegetation model to simulatefuture vegetation for three future climate scenarios.
• The results presented here are part of a larger project to forecastabove and belowground climate change impacts at Wind CaveNational Park.
• The Park is best known for its Cave system, but also encompasses11,450 ha of mixed grass prairie and ponderosa pine woodlands onthe southeastern edge of the Black Hills of South Dakota.
• For future planning, park managers need information on howclimate change may affect the natural resources of the park,including grasslands and the grazers dependent on them (bison,elk, pronghorn and deer).
• We have therefore used a dynamic vegetation model to simulatefuture vegetation for three future climate scenarios.

Approach1. Adjust a dynamic global vegetation model (MC1) to
project observed proportions of grasslands andponderosa pine woodlands at Wind Cave
2. Project future vegetation for three future climateprojections derived from downscaled global climatemodels.
3. Compare results to those of an empirical speciesdistribution model for ponderosa pine
1. Adjust a dynamic global vegetation model (MC1) toproject observed proportions of grasslands andponderosa pine woodlands at Wind Cave
2. Project future vegetation for three future climateprojections derived from downscaled global climatemodels.
3. Compare results to those of an empirical speciesdistribution model for ponderosa pine

MC1 Dynamic Global Vegetation ModelCarbon, H2O &
Nutrient Cycling(CENTURY)
VegetationDistribution
(MAPSS)
MonthlyCLIMATEMonthlyCLIMATE
DynamicWildfire
MonthlyCLIMATE
Original modeling team: Chris Daly, James Lenihan, Dominique Bachelet, and Ron Neilson
MC1 is designed to simulate natural vegetationand is hence appropriate for a national park

SOME MODELASSUMPTIONSTrees shade grasses (lightcompetition)
Saturated water flow between soillayers (bucket model)
Different rooting depths betweentrees and grasses determinecompetition for water andnutrients
Plant parts have fixed min and maxC/N, depending on lifeform
Fire consumes abovegroundbiomass; 20% of the N is returnedto the system
Century “Savanna” modealways tree AND grass
Plant Functional Typestree, decid. or evergreen;needleleaf or broadleaf;grass (C4 or C3).
MC1 SOME MODELASSUMPTIONSTrees shade grasses (lightcompetition)
Saturated water flow between soillayers (bucket model)
Different rooting depths betweentrees and grasses determinecompetition for water andnutrients
Plant parts have fixed min and maxC/N, depending on lifeform
Fire consumes abovegroundbiomass; 20% of the N is returnedto the system
H2O, NProcessescarbon, N, & water uptake;tree-grass competition
(light, water, N);decomposition;fire effects (consumption,
mortality).

Ponderosa pine is the dominant tree at Wind Cave
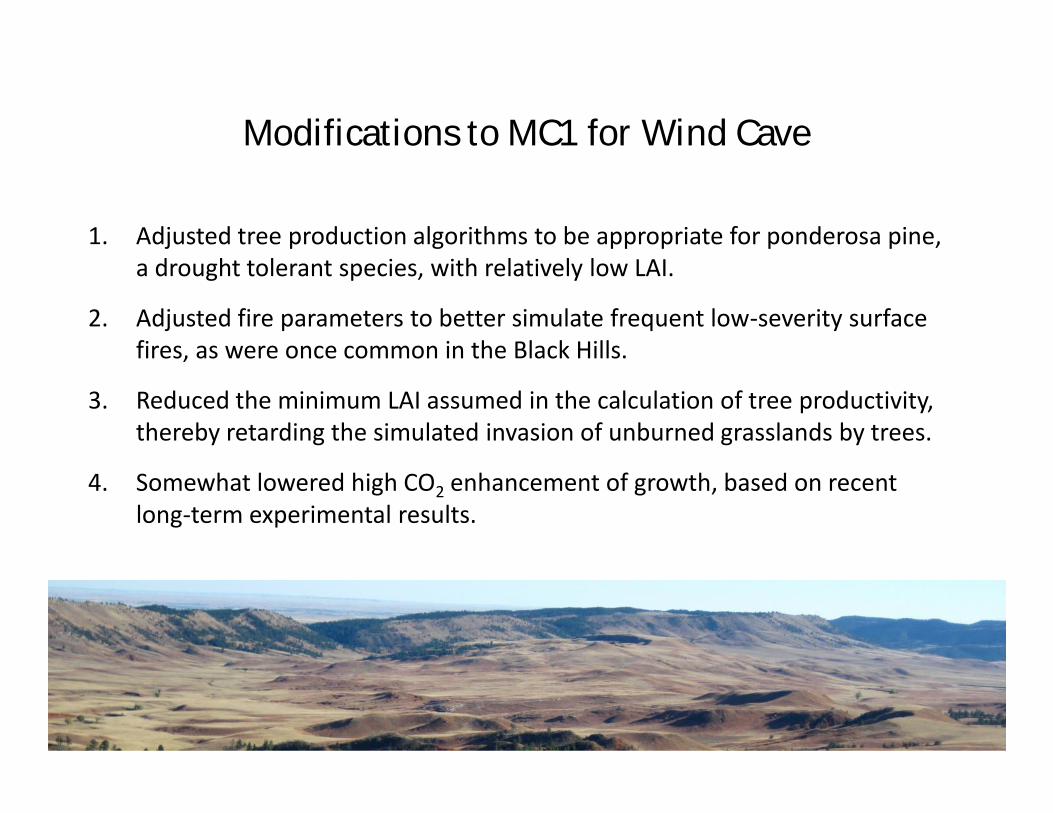
Modifications to MC1 for Wind Cave1. Adjusted tree production algorithms to be appropriate for ponderosa pine,
a drought tolerant species, with relatively low LAI.
2. Adjusted fire parameters to better simulate frequent low-severity surfacefires, as were once common in the Black Hills.
3. Reduced the minimum LAI assumed in the calculation of tree productivity,thereby retarding the simulated invasion of unburned grasslands by trees.
4. Somewhat lowered high CO2 enhancement of growth, based on recentlong-term experimental results.
1. Adjusted tree production algorithms to be appropriate for ponderosa pine,a drought tolerant species, with relatively low LAI.
2. Adjusted fire parameters to better simulate frequent low-severity surfacefires, as were once common in the Black Hills.
3. Reduced the minimum LAI assumed in the calculation of tree productivity,thereby retarding the simulated invasion of unburned grasslands by trees.
4. Somewhat lowered high CO2 enhancement of growth, based on recentlong-term experimental results.

Simulation Details• Input data:
Elevation, soil properties and depth.Monthly climate inputs of precipitation, Tmax, Tmin and either dewpointtemperature or vapor pressure.Annual atmospheric CO2 concentrations.
• Scale of simulation: In this case, 30-arc second grid cells (670m E-W x 930mN-S at latitude of Wind Cave).
• Four simulation stages:Equilibrium run initializes veg and carbon pools;Spinup run includes dynamic fire effects, based on detrended and loopedhistorical climate;1895-2000 historical run uses PRISM climate data;2001-2100 future runs based on downscaled climate inputs from generalcirculation models (GCMs)
• Input data:Elevation, soil properties and depth.Monthly climate inputs of precipitation, Tmax, Tmin and either dewpointtemperature or vapor pressure.Annual atmospheric CO2 concentrations.
• Scale of simulation: In this case, 30-arc second grid cells (670m E-W x 930mN-S at latitude of Wind Cave).
• Four simulation stages:Equilibrium run initializes veg and carbon pools;Spinup run includes dynamic fire effects, based on detrended and loopedhistorical climate;1895-2000 historical run uses PRISM climate data;2001-2100 future runs based on downscaled climate inputs from generalcirculation models (GCMs)

Projected live tree carbon vs. observed tree distributionElevation PET
Live aboveground wood CRange: 0 (blue) – 9000 (red) g /m2
Elevation Range: 1020 (black)– 1560 (white) m
Google Earth image of Wind Cave N P
Mean annual potential evapotranspiration (PET)Range: 106 (blue) – 140 (red) cm/yr
Tree C

Simulated mean historical live tree C per grid cell vs. meanclimate with fire (left side) and without fire (right side)
7.2 7.6 8.0 8.47.2 7.6 8.0 8.4
44 46 48 5044 46 48 50

Climate change scenarios1. Climate projections from the CSIRO Mk3, Hadley CM3
and MIROC 3.2. Medres GCMs, run with the A2emission scenario.
2. Representative range of temperature scenarios.
3. GCM values for monthly precipitation and meanmonthly Tmax, Tmin and dewpoint temperaturedownscaled to ~800m with anomaly/delta methodusing PRISM 800m baseline (1971-2000).
1. Climate projections from the CSIRO Mk3, Hadley CM3and MIROC 3.2. Medres GCMs, run with the A2emission scenario.
2. Representative range of temperature scenarios.
3. GCM values for monthly precipitation and meanmonthly Tmax, Tmin and dewpoint temperaturedownscaled to ~800m with anomaly/delta methodusing PRISM 800m baseline (1971-2000).

Climate change scenarios:3 downscaled GCM projectionsfor Wind Cave

Aboveground live tree carbon simulated with natural fire
Initial state - 2000
CSIRO(Warm & wet)
Hadley(Hot)
Range:0 (violet) – 5000 (green) – 10000 (red) g /m2 2050 2100
MIROC(Hot & dry)
Hadley(Hot)

Aboveground live tree carbonsimulated with fire suppression beginning in 1941
Some tree spread by 2000
CSIRO(Warm & wet)
Hadley(Hot)
2050 2100Range:0 (violet) – 5000 (green) – 10000 (red) g/m2
MIROC(Hot & dry)
Hadley(Hot)

Prescribed fire effects on aboveground live tree carbon:10 year interval, 20% tree mortality
CSIRO(Warm & wet)
Hadley(Hot)
Initial state - 2000
2050 2100Range:0 (violet) – 5000 (green) – 10000 (red) g/m2
MIROC(Hot & dry)
Hadley(Hot)
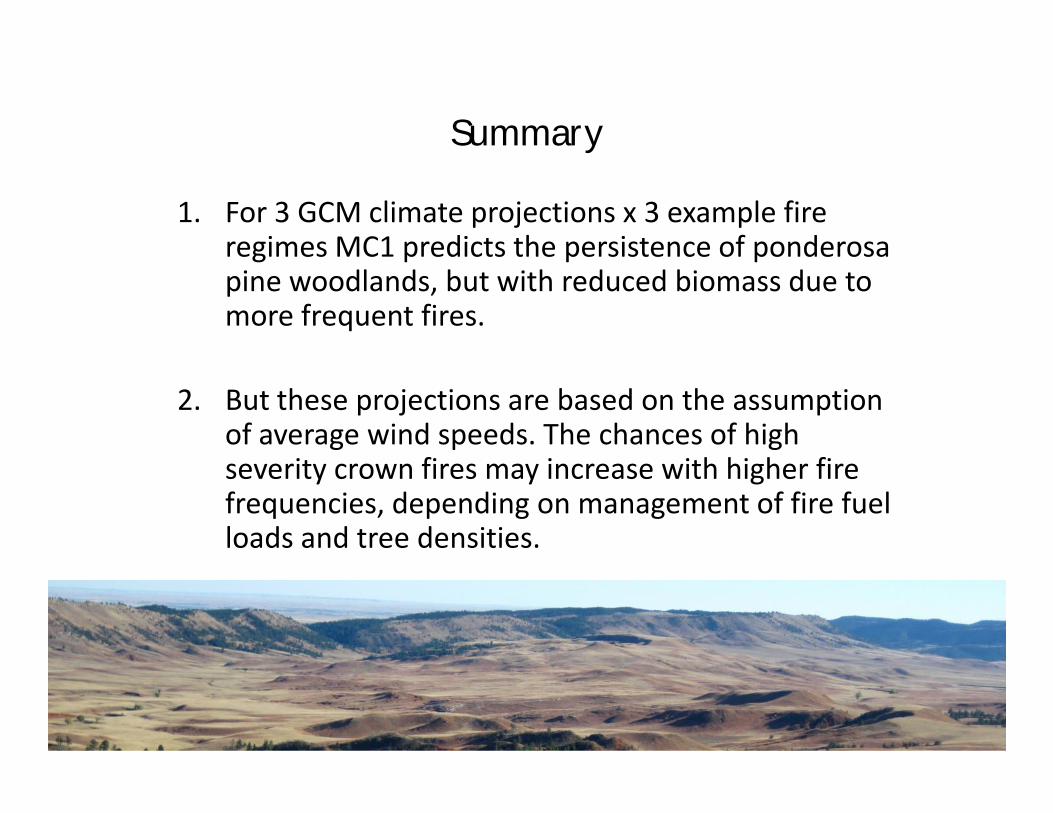
Summary1. For 3 GCM climate projections x 3 example fire
regimes MC1 predicts the persistence of ponderosapine woodlands, but with reduced biomass due tomore frequent fires.
2. But these projections are based on the assumptionof average wind speeds. The chances of highseverity crown fires may increase with higher firefrequencies, depending on management of fire fuelloads and tree densities.
1. For 3 GCM climate projections x 3 example fireregimes MC1 predicts the persistence of ponderosapine woodlands, but with reduced biomass due tomore frequent fires.
2. But these projections are based on the assumptionof average wind speeds. The chances of highseverity crown fires may increase with higher firefrequencies, depending on management of fire fuelloads and tree densities.


Modeled bioclimate profile of ponderosa pine (in color) compared to therange limits mapped by Little (1971) (black lines).
WYO
SDBlack Hills
WYO
from Rehfeldt et al. [Int. J. Plant Sci. 167(6):1123–1150. 2006]
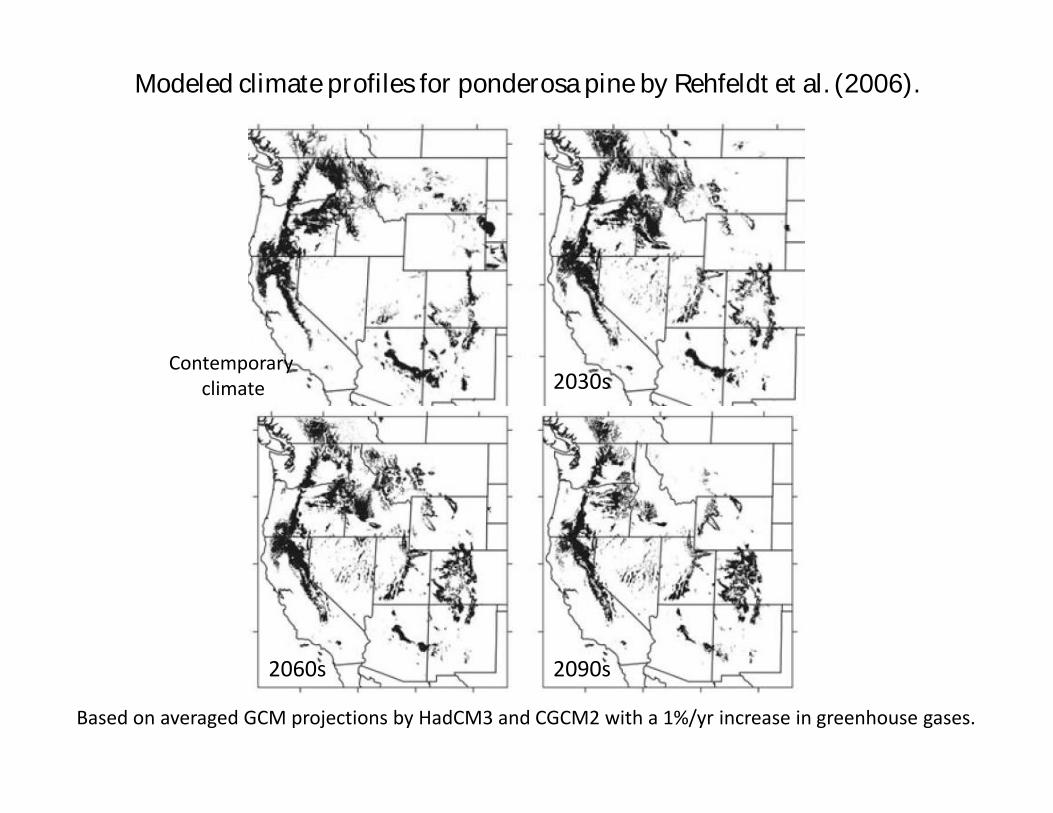
Modeled climate profiles for ponderosa pine by Rehfeldt et al. (2006).
Contemporaryclimate 2030s
2060s 2090s
Based on averaged GCM projections by HadCM3 and CGCM2 with a 1%/yr increase in greenhouse gases.
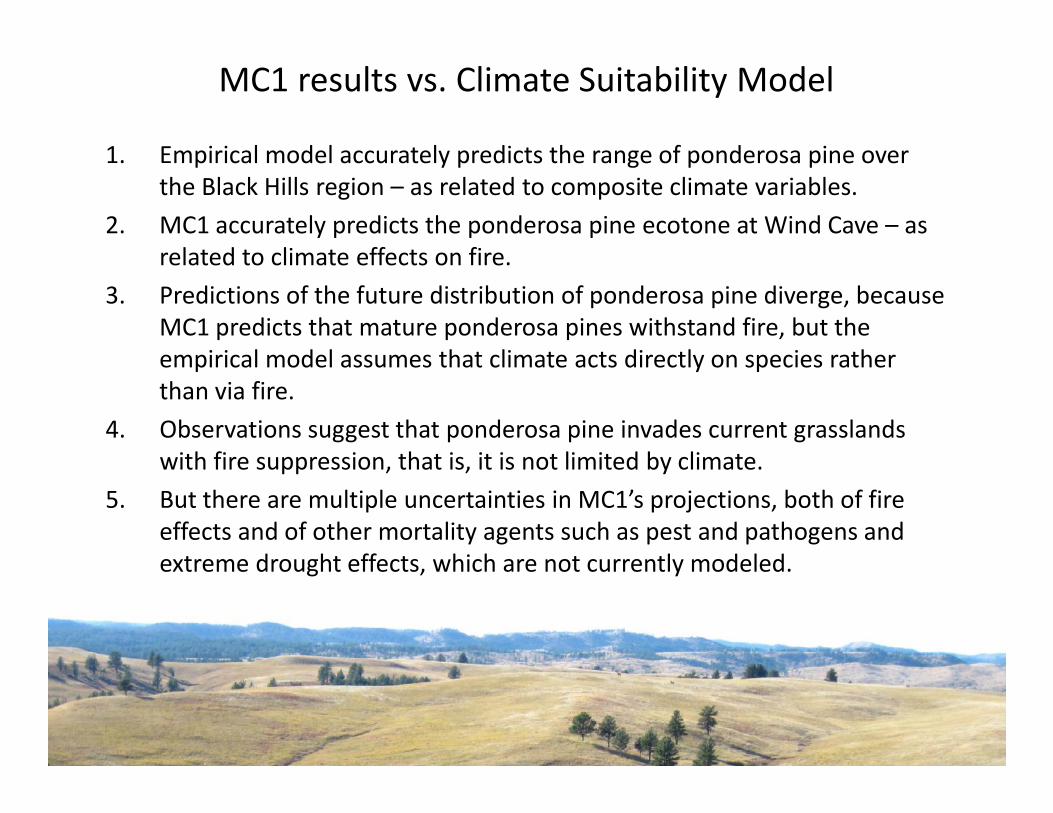
MC1 results vs. Climate Suitability Model
1. Empirical model accurately predicts the range of ponderosa pine overthe Black Hills region – as related to composite climate variables.
2. MC1 accurately predicts the ponderosa pine ecotone at Wind Cave – asrelated to climate effects on fire.
3. Predictions of the future distribution of ponderosa pine diverge, becauseMC1 predicts that mature ponderosa pines withstand fire, but theempirical model assumes that climate acts directly on species ratherthan via fire.
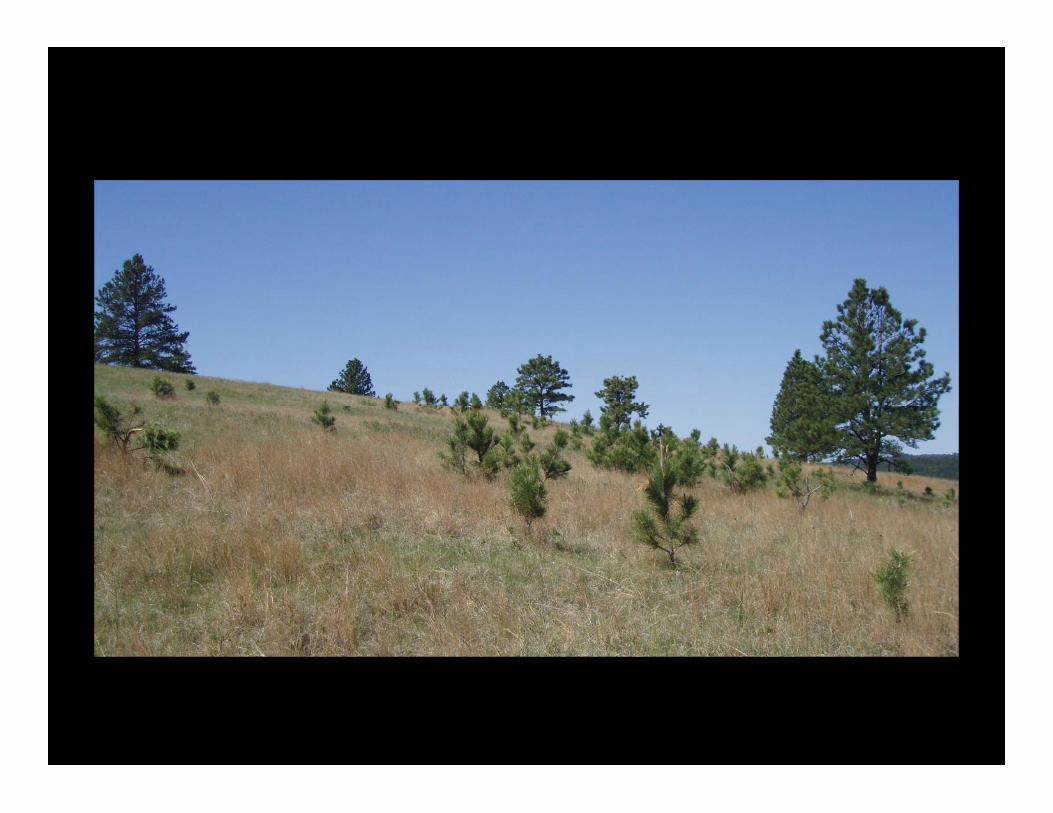
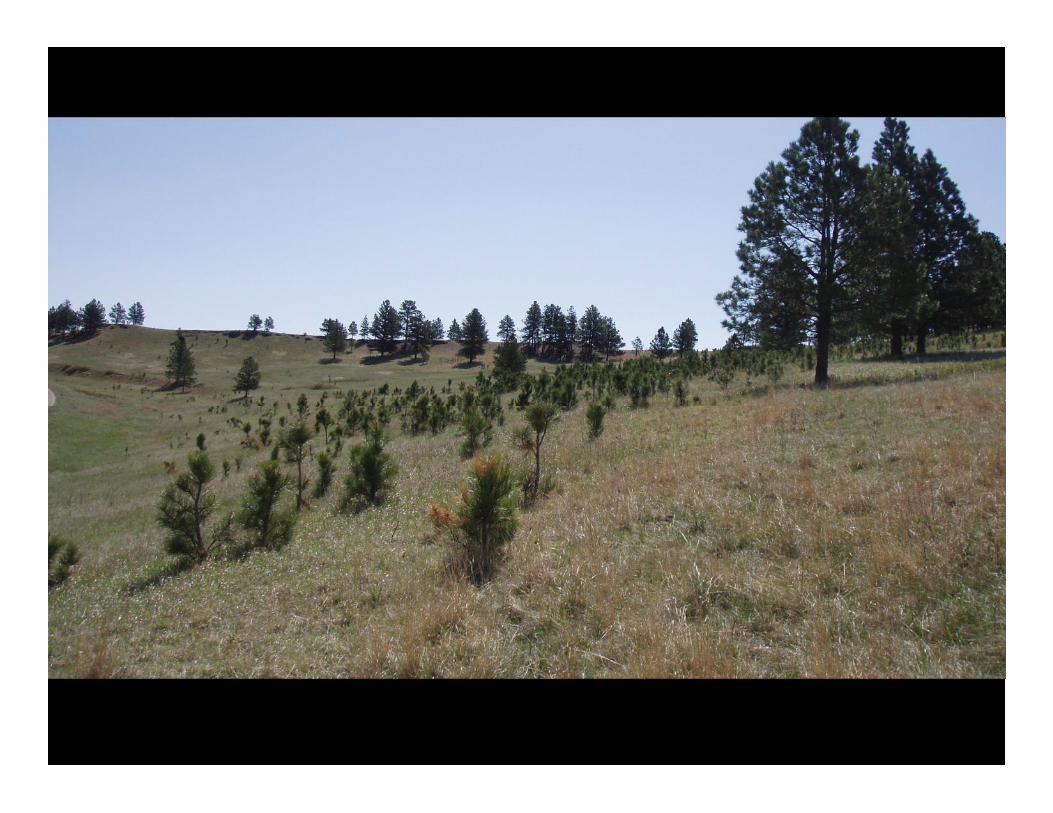
4. Observations suggest that ponderosa pine invades current grasslandswith fire suppression, that is, it is not limited by climate.
5. But there are multiple uncertainties in MC1’s projections, both of fireeffects and of other mortality agents such as pest and pathogens andextreme drought effects, which are not currently modeled.
1. Empirical model accurately predicts the range of ponderosa pine overthe Black Hills region – as related to composite climate variables.
2. MC1 accurately predicts the ponderosa pine ecotone at Wind Cave – asrelated to climate effects on fire.
3. Predictions of the future distribution of ponderosa pine diverge, becauseMC1 predicts that mature ponderosa pines withstand fire, but theempirical model assumes that climate acts directly on species ratherthan via fire.
4. Observations suggest that ponderosa pine invades current grasslandswith fire suppression, that is, it is not limited by climate.
5. But there are multiple uncertainties in MC1’s projections, both of fireeffects and of other mortality agents such as pest and pathogens andextreme drought effects, which are not currently modeled.

Conclusions• Both mechanistic process models and empirical habitat
suitability models have important roles to play inassessing climate change effects on the biota.
• Comparisons between these two approaches are highlyinstructive.
• Our simulations show that fire-climate relations can behighly important.
• These results are consistent with the growing awarenessthat fire suppression over the past century has had largeimpacts on species abundances across North America.
• Both mechanistic process models and empirical habitatsuitability models have important roles to play inassessing climate change effects on the biota.
• Comparisons between these two approaches are highlyinstructive.
• Our simulations show that fire-climate relations can behighly important.
• These results are consistent with the growing awarenessthat fire suppression over the past century has had largeimpacts on species abundances across North America.

AcknowledgementsThanks to Dave Conklin and Ken Ferschweiler (CBI) for
programming aid in running MC1and
the National Park Service Climate Change Response Programfor financial support.
Thanks to Dave Conklin and Ken Ferschweiler (CBI) forprogramming aid in running MC1
andthe National Park Service Climate Change Response Program
for financial support.

Buildup index of 80 is one of two thresholds used to simulate natural fires.