simulating geographies of happiness dimitris ballas social and spatial inequalities group department...
TRANSCRIPT

Simulating Geographies of Happiness
Dimitris Ballas Social and Spatial Inequalities groupDepartment of Geography, University of Sheffieldhttp://sasi.group.shef.ac.uk/
RES-163-27-1013
UPTAP conference, University of Leeds, 17-19 March 2008

Outline
• Measuring happiness and well-being
• Individual-level and contextual factors that may be affecting subjective happiness
• Happiness and major life events
• Happy People or Happy Places? – a multilevel problem
• Spatial microsimulation of happiness
• Concluding comments
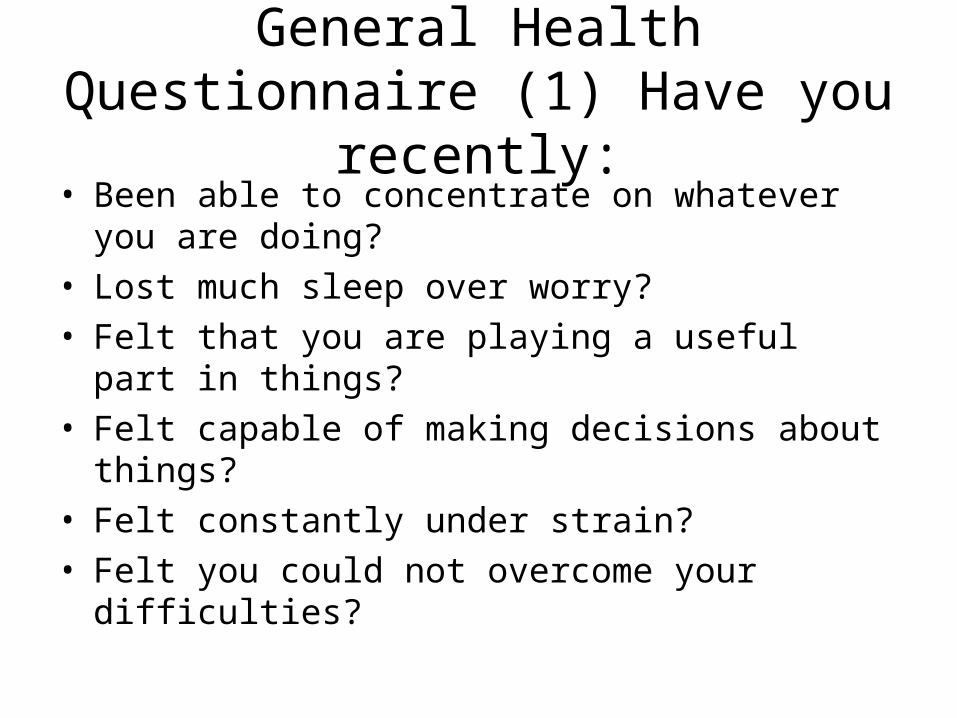
General Health Questionnaire (1) Have you recently:
• Been able to concentrate on whatever you are doing?
• Lost much sleep over worry?
• Felt that you are playing a useful part in things?
• Felt capable of making decisions about things?
• Felt constantly under strain?
• Felt you could not overcome your difficulties?
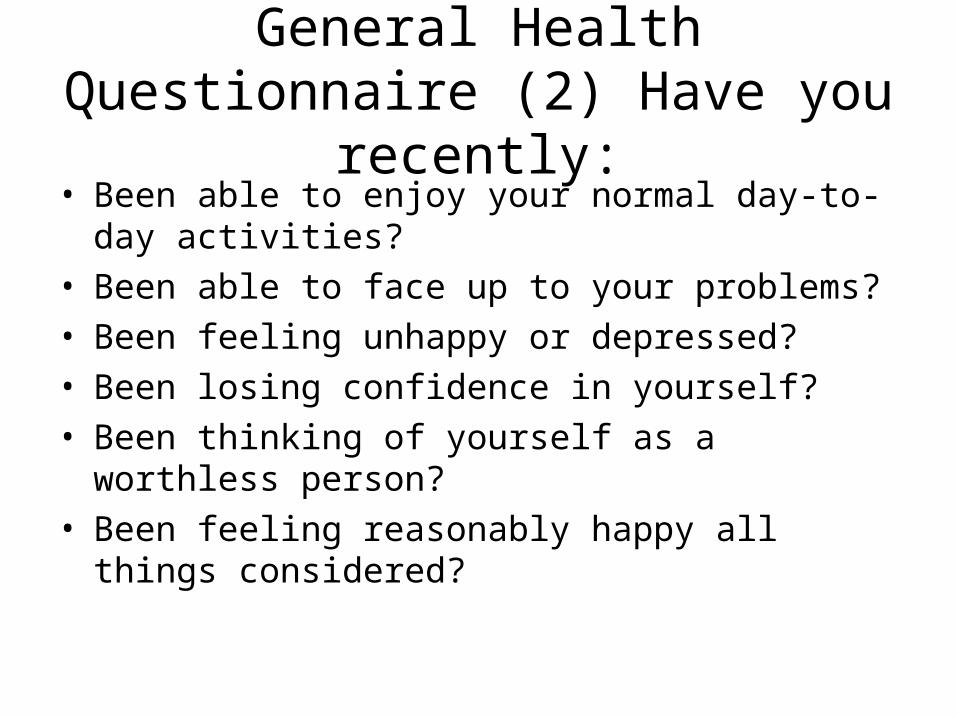
General Health Questionnaire (2) Have you recently:
• Been able to enjoy your normal day-to-day activities?
• Been able to face up to your problems?
• Been feeling unhappy or depressed?
• Been losing confidence in yourself?
• Been thinking of yourself as a worthless person?
• Been feeling reasonably happy all things considered?

Subjective happiness measure: HLGHQ1
This measure converts valid answers to questions wGHQA to wGHQL to a single scale by recoding so that the scale for individual variables runs from 0 to 3 instead of 1 to 4, and then summing, giving a scale running from 0 (the least distressed) to 36 (the most distressed). See Cox, B.D et al, The Health and Lifestyle Survey. (London: Health Promotion Research Trust, 1987).

Factors and variables linked to subjective happiness (individual level studies)
• Age• Education• Social Class• Income• Marital status/relationships• Employment• Leisure• Religion• Health• Life events and activities
Can happiness be measured?
• Positive and negative feelings are inversely correlated
• Happiness can be thought of as a single variable (Layard, 2005; Frey and Stutzer, 2002)

"Event" "Valuation”
Employment to unemployment -£23,000.00
Single to married £6,000.00
Married to separated -£11,000.00
Married to widowed -£14,000.00
Health excellent to Health good -£12,000.00
Health excellent to Health fair -£41,000.00
After Clark, A, Oswald, A, (2002), A Simple Statistical Method for Measuring How Life Events affect Happiness, International Journal of Epidemiology, 2002, 31(6), 1139-1144.

Life-events and happiness
• BHPS: What has happened to you (or your family) which has stood out as important?
• 145,408 major life events recorded between 1992-1995
Ballas, D., Dorling, D. (2007) Measuring the impact of major life events upon happiness, International Journal of Epidemiology, 36, 1244-1252. doi:10.1093/ije/dym182
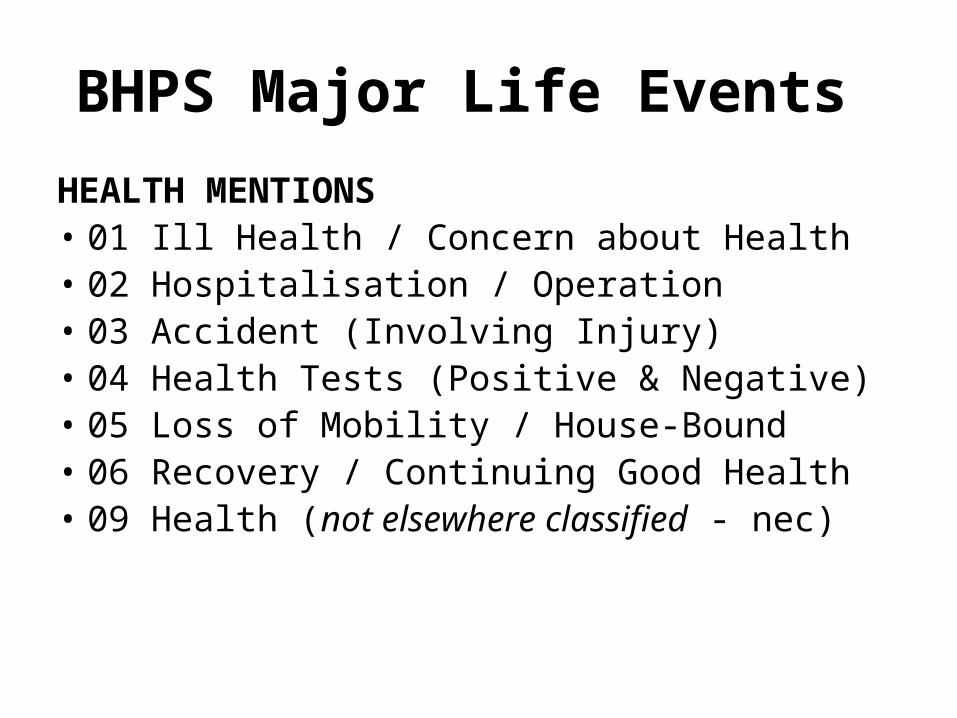
BHPS Major Life Events
HEALTH MENTIONS• 01 Ill Health / Concern about Health• 02 Hospitalisation / Operation• 03 Accident (Involving Injury)• 04 Health Tests (Positive & Negative)• 05 Loss of Mobility / House-Bound• 06 Recovery / Continuing Good Health• 09 Health (not elsewhere classified - nec)

BHPS Major Life Events
CARING
• 10 Caring Responsibilities - Not Childcare (i.e. Who is Cared For?)
• 11 Babysitting (ie Who is the Sitter?)
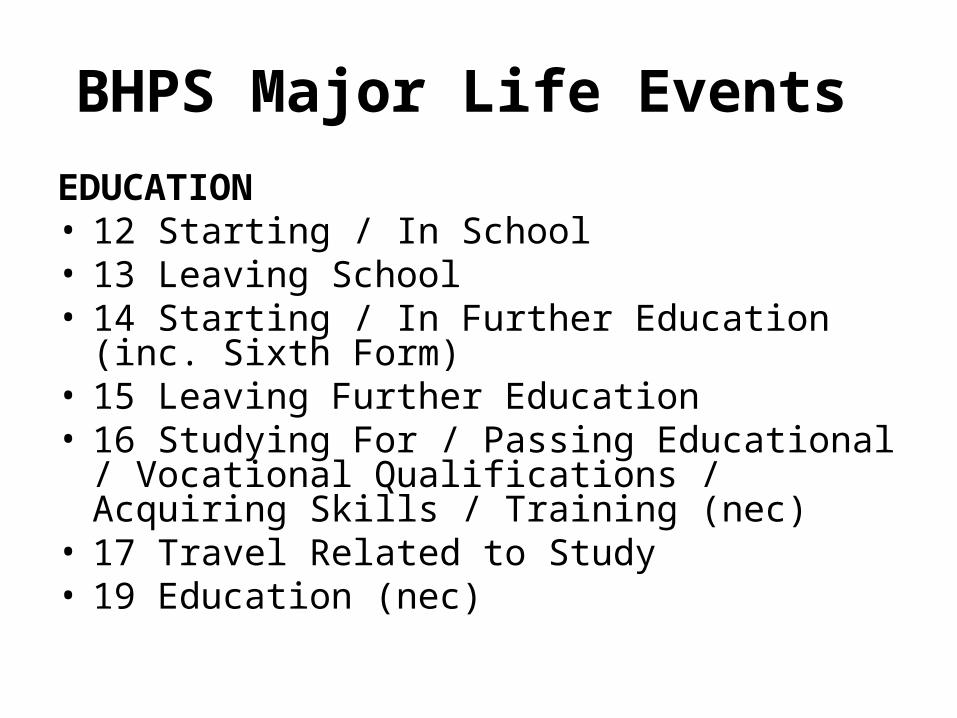
BHPS Major Life Events
EDUCATION• 12 Starting / In School• 13 Leaving School• 14 Starting / In Further Education (inc. Sixth
Form)• 15 Leaving Further Education• 16 Studying For / Passing Educational /
Vocational Qualifications / Acquiring Skills / Training (nec)
• 17 Travel Related to Study• 19 Education (nec)
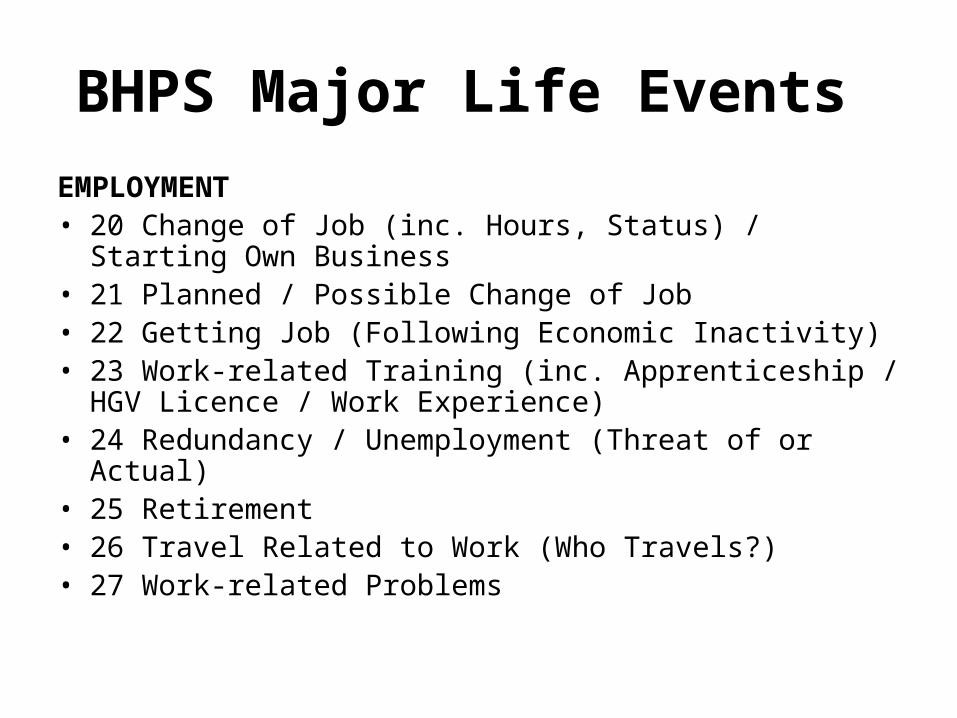
BHPS Major Life Events
EMPLOYMENT• 20 Change of Job (inc. Hours, Status) / Starting Own
Business• 21 Planned / Possible Change of Job• 22 Getting Job (Following Economic Inactivity)• 23 Work-related Training (inc. Apprenticeship / HGV
Licence / Work Experience)• 24 Redundancy / Unemployment (Threat of or Actual)• 25 Retirement• 26 Travel Related to Work (Who Travels?)• 27 Work-related Problems

BHPS Major Life Events
LEISURE / POLITICAL• 30 Vacation / Travel (nec)• 31 Leisure Activities• 32 Learning to Drive / Passing Test (not
HGV)• 33 Political Participation / Voluntary Work
(inc Committee Work)• 34 Reference to National / World Events
(who is Concerned by Event?)
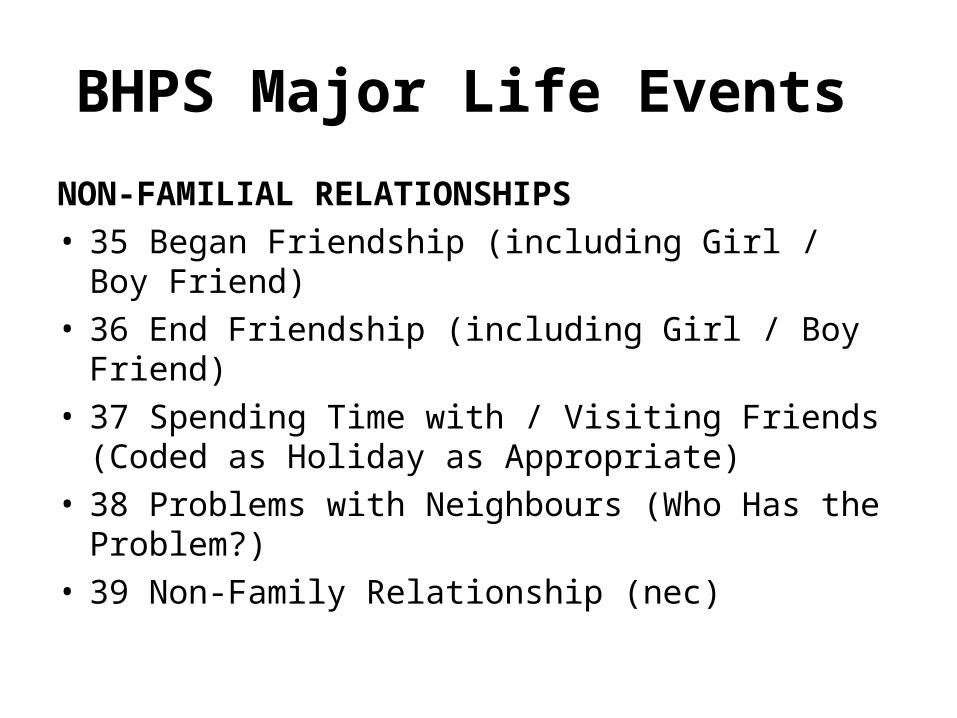
BHPS Major Life Events
NON-FAMILIAL RELATIONSHIPS• 35 Began Friendship (including Girl / Boy Friend)• 36 End Friendship (including Girl / Boy Friend)• 37 Spending Time with / Visiting Friends (Coded
as Holiday as Appropriate)• 38 Problems with Neighbours (Who Has the
Problem?)• 39 Non-Family Relationship (nec)
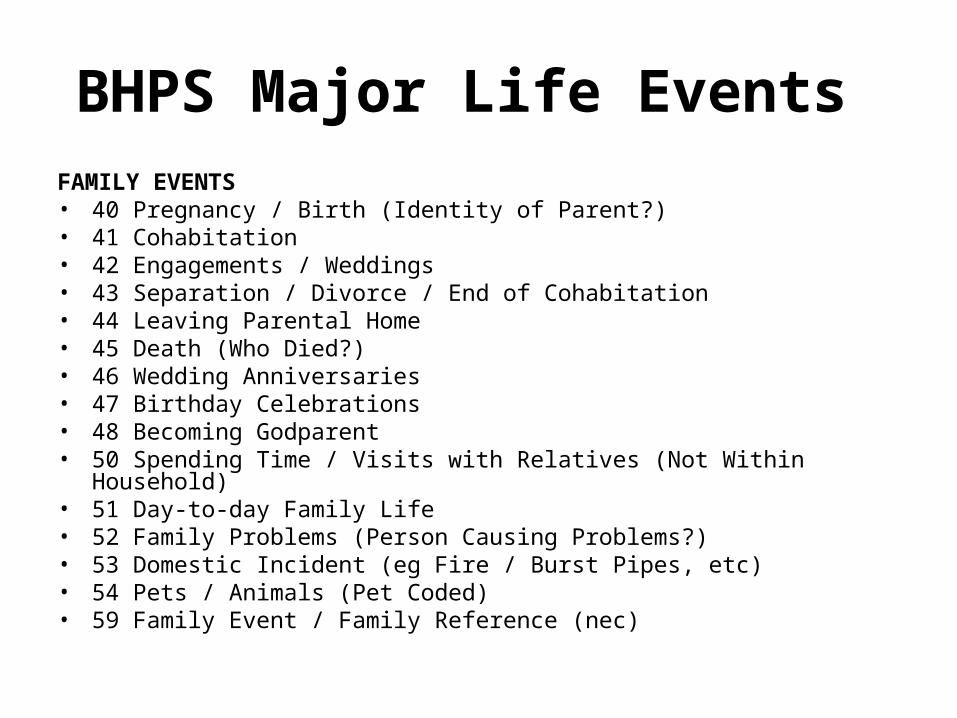
BHPS Major Life Events FAMILY EVENTS• 40 Pregnancy / Birth (Identity of Parent?)• 41 Cohabitation• 42 Engagements / Weddings• 43 Separation / Divorce / End of Cohabitation• 44 Leaving Parental Home• 45 Death (Who Died?)• 46 Wedding Anniversaries• 47 Birthday Celebrations• 48 Becoming Godparent• 50 Spending Time / Visits with Relatives (Not Within Household)• 51 Day-to-day Family Life• 52 Family Problems (Person Causing Problems?)• 53 Domestic Incident (eg Fire / Burst Pipes, etc)• 54 Pets / Animals (Pet Coded)• 59 Family Event / Family Reference (nec)

BHPS Major Life Events
FINANCIAL MATTERS• 60 Money Problems / Drop in Income /
Debt• 61 Forced Move (Repossession / Eviction)
(Residential Move Not Included)• 62 Improved Financial Situation• 63 Received Money (Inheritance /
Compensation / Pools)• 69 Financial Other (nec)

BHPS Major Life Events
CONSUMPTION• 70 Bought / Buying Vehicle (Car, Caravan, etc)• 71 Bought / Buying / Building House• 72 Household Repairs / Improvements /
Appliances• 73 Won Prize (Not Cash) / Award• 74 Received Present (from whom ?)• 79 Other Purchases (nec)
BHPS Major Life Events
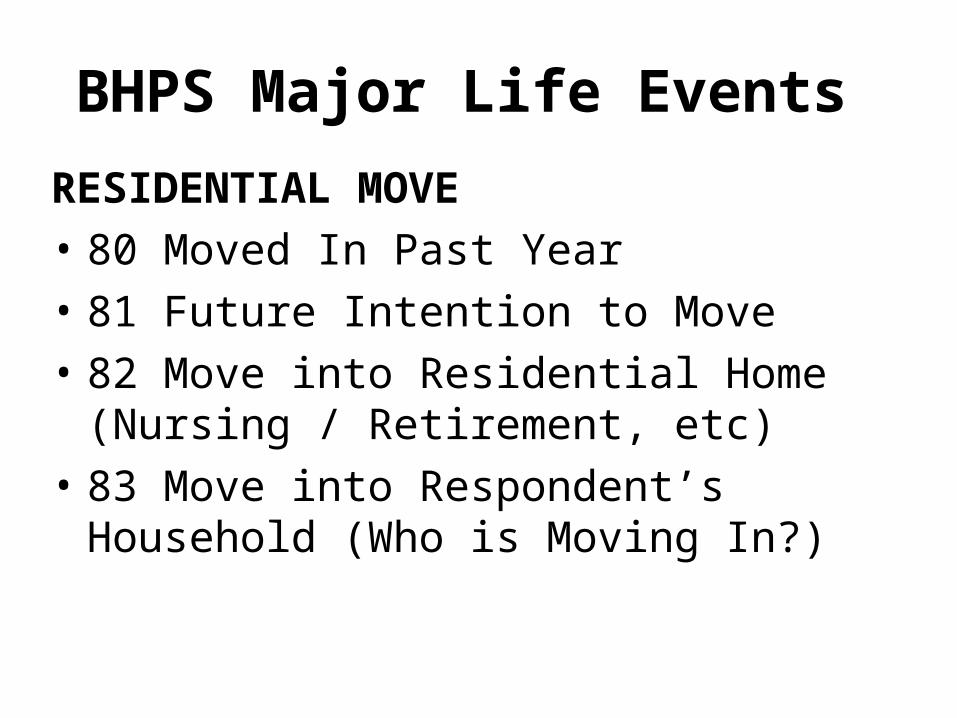
RESIDENTIAL MOVE
• 80 Moved In Past Year
• 81 Future Intention to Move
• 82 Move into Residential Home (Nursing / Retirement, etc)
• 83 Move into Respondent’s Household (Who is Moving In?)
BHPS Major Life Events
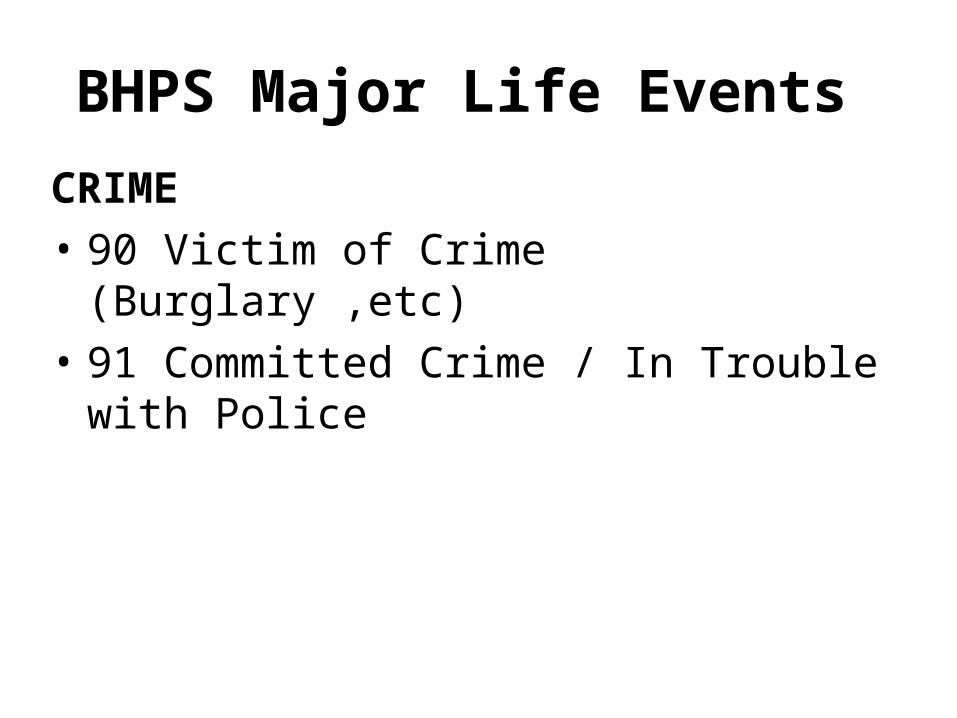
CRIME
• 90 Victim of Crime (Burglary ,etc)
• 91 Committed Crime / In Trouble with Police

BHPS Major Life Events RELIGION• 92 Joined / Changed Religion• 93 Other Religious Reference (Not Confirmation /
Baptism of Children)• 94 Plan Not Fulfilled/ Something That Didn’t Happen (eg
Didn’t Have a Holiday)• 95 Civil Court Action / Battles with Bureaucracy• 96 Other Occurrence (nec) given low priority• 97 Nothing Happened• -1 Don’t Know• -9 Missing

Subject of event topic• 00 Not Mentioned• 01 ’We’/ Household• 02 Self (Explicit or Inferred or
No Pronoun)• 03 Spouse /Partner• 04 Daughter(s)• 05 Son(s)• 06 Child(ren) (nec)• 07 Son / Daughter in-law• 08 Mother• 09 Father• 10 Parents (both or not
specified)
• 11 Parent(s) in-law• 12 Siblings (sister / brother)• 13 Sister-in-law / Brother-in-
law• 14 Grandparent(s)• 15 Grandchild(ren)• 16 Other Family Members /
Family Members Unspecified• 17 Friend / Colleague /
Neighbour / Employer• 18 Other• 19 Pet• 20 Not Specified

Combining “Event” and “Event Subject” 34 events
1 14.7% Nothing important happened (96-99)
Health
2 7.6% health (other 1-9)
3 2.6% health (mine 1-9)
4 1.0% health (partner 1-9)
5 1.2% health (child 1-9)
6 1.2% health (parent 1-9)

Education
7 4.6% education (other 12-19)
8 1.4% education (mine 12-19)
9 2.5% education (child 12-19)
Employment
10 3.0% employment (other 23,26-29)
11 4.0% employment (job change 20-21)
12 1.8% employment (job gain 22)
13 2.7% employment (job loss 24)
Leisure
14 3.0% leisure (other 30-31)
15 5.3% leisure (our holiday 30)
16 2.7% leisure (my holiday 30)

Births and Deaths
17 1.4% pregnancy (other 40)
18 1.3% pregnancy (mine 40)
19 2.3% pregnancy (child's 40)
20 1.4% pregnancy (family 40)
21 1.0% death (other 45)
22 1.6% death (parent 45)
23 1.8% death (family 45)
Relationships
24 2.0% relationships (family 35,41-42)
25 2.2% relationships (mine starting 35,42)
26 1.1% relationships (child's starting 35,42)
27 1.4% relationships (mine ending 36,43)
28 6.5% relationships (family, 46-53,55-59)
29 1.3% relationships (with pet 54 & subject)
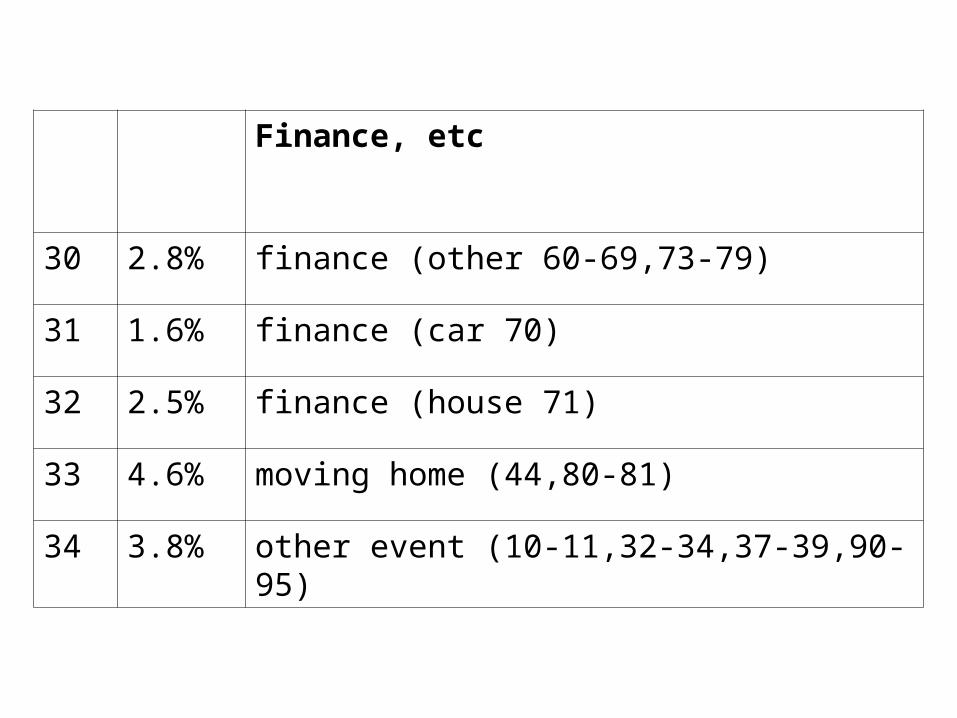
Finance, etc
30 2.8% finance (other 60-69,73-79)
31 1.6% finance (car 70)
32 2.5% finance (house 71)
33 4.6% moving home (44,80-81)
34 3.8% other event (10-11,32-34,37-39,90-95)
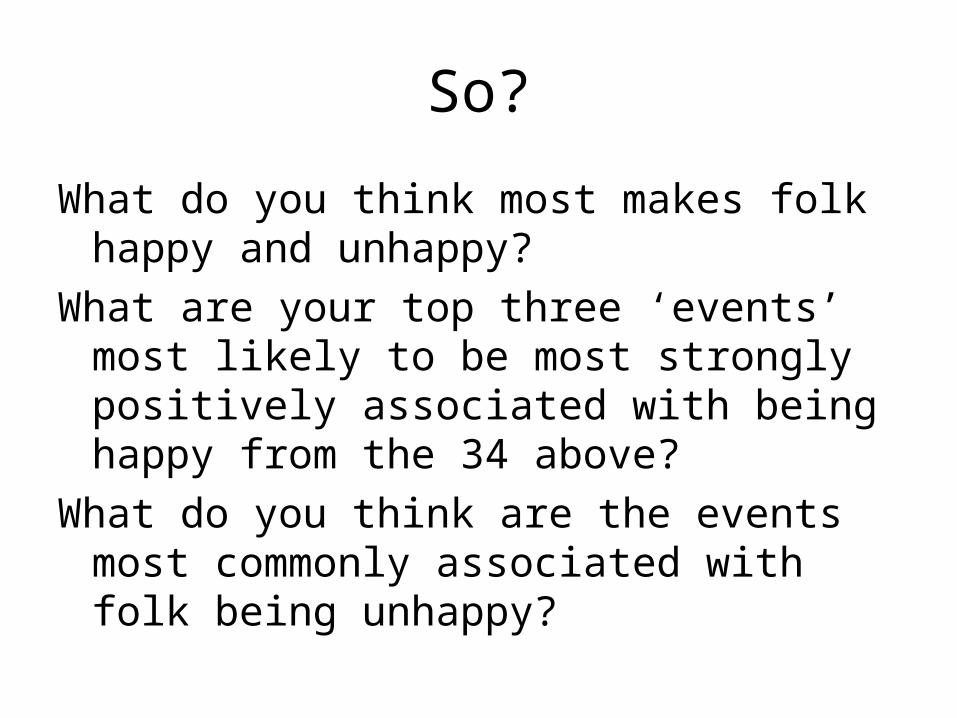
So?
What do you think most makes folk happy and unhappy?
What are your top three ‘events’ most likely to be most strongly positively associated with being happy from the 34 above?
What do you think are the events most commonly associated with folk being unhappy?

Life Event Coefficient P value
RELATIONSHIPS (MINE ENDING 36,43) -0.178 0.00
DEATH (PARENT, 45) -0.166 0.00
HEALTHPARENT (1-9) -0.139 0.00
DEATH (OTHER 45) -0.137 0.00
EMPLOYMENT JOB LOSS 24 -0.129 0.00
HEALTH MINE (1-9) -0.117 0.00
DEATH (FAMILY 45) -0.098 0.00
HEALTH PARTNER (1-9) -0.092 0.00
HEALTH CHILD (1-9) -0.084 0.00
HEALTH OTHER (1-9) -0.073 0.00
EDUCATION CHILD (12-19) -0.029 0.12
EMPLOYMENT OTHER (23,26-29) -0.028 0.13
OTHER EVENT (10-11;32-34;37-39;90-95) -0.026 0.14
NOTHING IMPORTANT HAPPENED -0.022 0.11
RELATIONSHIPS (WITH PET 54 AND SUBJECT) -0.020 0.44
FINANCE (OTHER 60-69;73-79) -0.019 0.27
RELATIONSHIPS FAMILY (46-53;55-59) -0.014 0.39
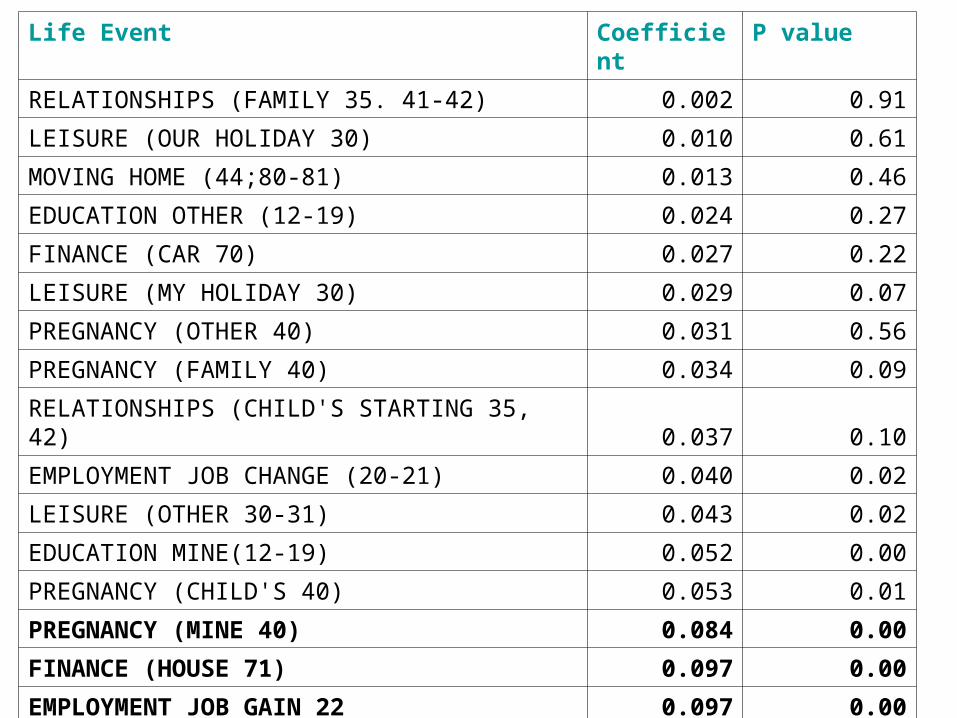
Life Event Coefficient P value
RELATIONSHIPS (FAMILY 35. 41-42) 0.002 0.91
LEISURE (OUR HOLIDAY 30) 0.010 0.61
MOVING HOME (44;80-81) 0.013 0.46
EDUCATION OTHER (12-19) 0.024 0.27
FINANCE (CAR 70) 0.027 0.22
LEISURE (MY HOLIDAY 30) 0.029 0.07
PREGNANCY (OTHER 40) 0.031 0.56
PREGNANCY (FAMILY 40) 0.034 0.09
RELATIONSHIPS (CHILD'S STARTING 35, 42) 0.037 0.10
EMPLOYMENT JOB CHANGE (20-21) 0.040 0.02
LEISURE (OTHER 30-31) 0.043 0.02
EDUCATION MINE(12-19) 0.052 0.00
PREGNANCY (CHILD'S 40) 0.053 0.01
PREGNANCY (MINE 40) 0.084 0.00
FINANCE (HOUSE 71) 0.097 0.00
EMPLOYMENT JOB GAIN 22 0.097 0.00
RELATIONSHIPS (MINE STARTING 35. 42) 0.160 0.00

97
93
90
87
84
81
78
75
72
69
66
63
60
57
54
51
48
45
42
39
36
33
30
27
24
21
18
15
Ag
e
6.0%5.0%4.0%3.0%2.0%1.0%0.0%
Percent
Finance etc
Relationships
Births and Deaths
Leisure
Employment
Education
HealthEvent theme

Happiness and social comparisons
“A house may be large or small; as long as the surrounding houses are equally small it satisfies all social demands for a dwelling. But if a palace arises beside the little house, the little house shrinks to a hovel… [and]… the dweller will feel more and more uncomfortable, dissatisfied and cramped within its four walls.”
(Marx, 1847)

Happiness and inequality
“When we are at home, most of us like to live in roughly the same style as our friends or neighbours, or better. If our friends start giving more elaborate parties, we feel we should do the same. Likewise if they have bigger houses or bigger cars.”
(Layard, 2005: 43)
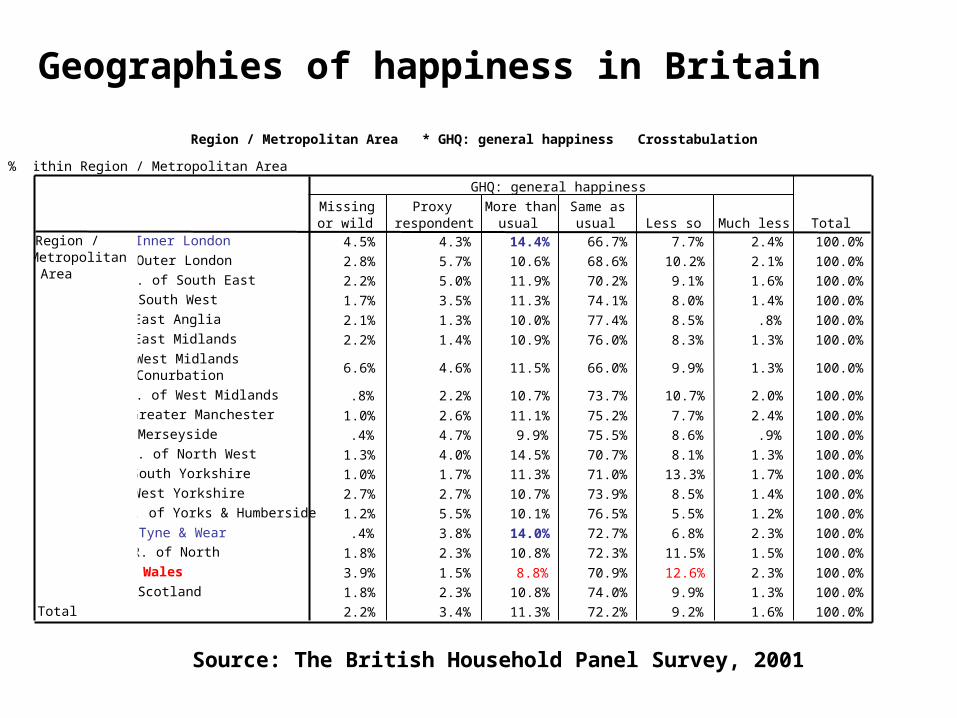
Geographies of happiness in Britain
Source: The British Household Panel Survey, 2001
Region / Metropolitan Area * GHQ: general happiness Crosstabulation
% within Region / Metropolitan Area
4.5% 4.3% 14.4% 66.7% 7.7% 2.4% 100.0%
2.8% 5.7% 10.6% 68.6% 10.2% 2.1% 100.0%
2.2% 5.0% 11.9% 70.2% 9.1% 1.6% 100.0%
1.7% 3.5% 11.3% 74.1% 8.0% 1.4% 100.0%
2.1% 1.3% 10.0% 77.4% 8.5% .8% 100.0%
2.2% 1.4% 10.9% 76.0% 8.3% 1.3% 100.0%
6.6% 4.6% 11.5% 66.0% 9.9% 1.3% 100.0%
.8% 2.2% 10.7% 73.7% 10.7% 2.0% 100.0%
1.0% 2.6% 11.1% 75.2% 7.7% 2.4% 100.0%
.4% 4.7% 9.9% 75.5% 8.6% .9% 100.0%
1.3% 4.0% 14.5% 70.7% 8.1% 1.3% 100.0%
1.0% 1.7% 11.3% 71.0% 13.3% 1.7% 100.0%
2.7% 2.7% 10.7% 73.9% 8.5% 1.4% 100.0%
1.2% 5.5% 10.1% 76.5% 5.5% 1.2% 100.0%
.4% 3.8% 14.0% 72.7% 6.8% 2.3% 100.0%
1.8% 2.3% 10.8% 72.3% 11.5% 1.5% 100.0%
3.9% 1.5% 8.8% 70.9% 12.6% 2.3% 100.0%
1.8% 2.3% 10.8% 74.0% 9.9% 1.3% 100.0%
2.2% 3.4% 11.3% 72.2% 9.2% 1.6% 100.0%
Inner London
Outer London
R. of South East
South West
East Anglia
East Midlands
West MidlandsConurbation
R. of West Midlands
Greater Manchester
Merseyside
R. of North West
South Yorkshire
West Yorkshire
R. of Yorks & Humberside
Tyne & Wear
R. of North
Wales
Scotland
Region /MetropolitanArea
Total
Missingor wild
Proxyrespondent
More thanusual
Same asusual Less so Much less
GHQ: general happiness
Total

(%) happy more than usual
8.8 - 10.110.1 - 10.910.9 - 11.511.5 - 11.911.9 - 14.5
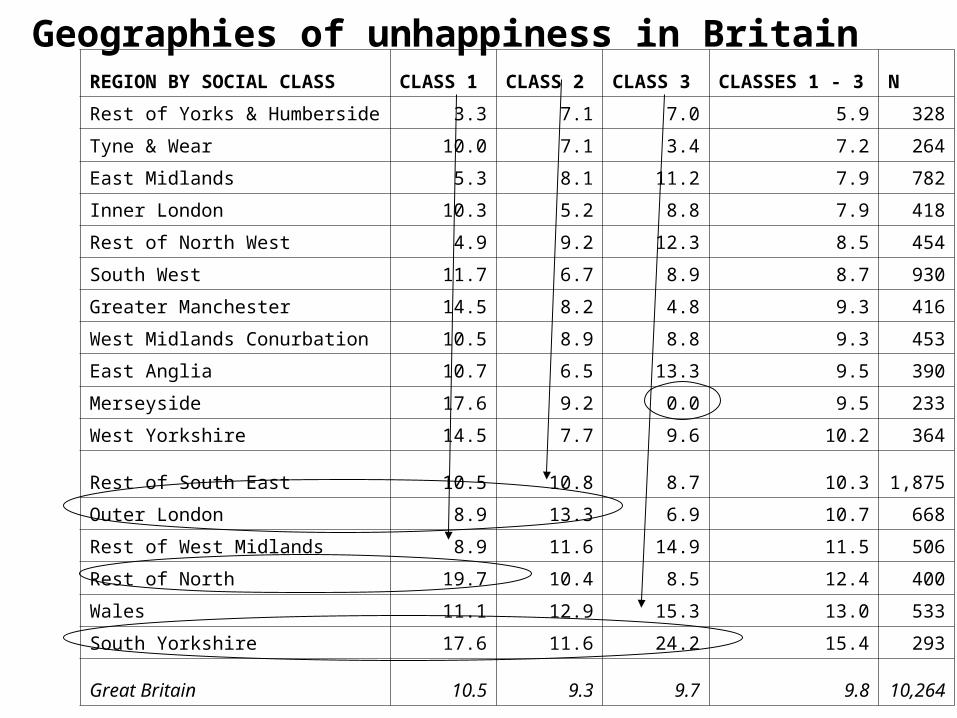
REGION BY SOCIAL CLASS CLASS 1 CLASS 2 CLASS 3 CLASSES 1 - 3 N
Rest of Yorks & Humberside 3.3 7.1 7.0 5.9 328
Tyne & Wear 10.0 7.1 3.4 7.2 264
East Midlands 5.3 8.1 11.2 7.9 782
Inner London 10.3 5.2 8.8 7.9 418
Rest of North West 4.9 9.2 12.3 8.5 454
South West 11.7 6.7 8.9 8.7 930
Greater Manchester 14.5 8.2 4.8 9.3 416
West Midlands Conurbation 10.5 8.9 8.8 9.3 453
East Anglia 10.7 6.5 13.3 9.5 390
Merseyside 17.6 9.2 0.0 9.5 233
West Yorkshire 14.5 7.7 9.6 10.2 364
Rest of South East 10.5 10.8 8.7 10.3 1,875
Outer London 8.9 13.3 6.9 10.7 668
Rest of West Midlands 8.9 11.6 14.9 11.5 506
Rest of North 19.7 10.4 8.5 12.4 400
Wales 11.1 12.9 15.3 13.0 533
South Yorkshire 17.6 11.6 24.2 15.4 293
Great Britain 10.5 9.3 9.7 9.8 10,264
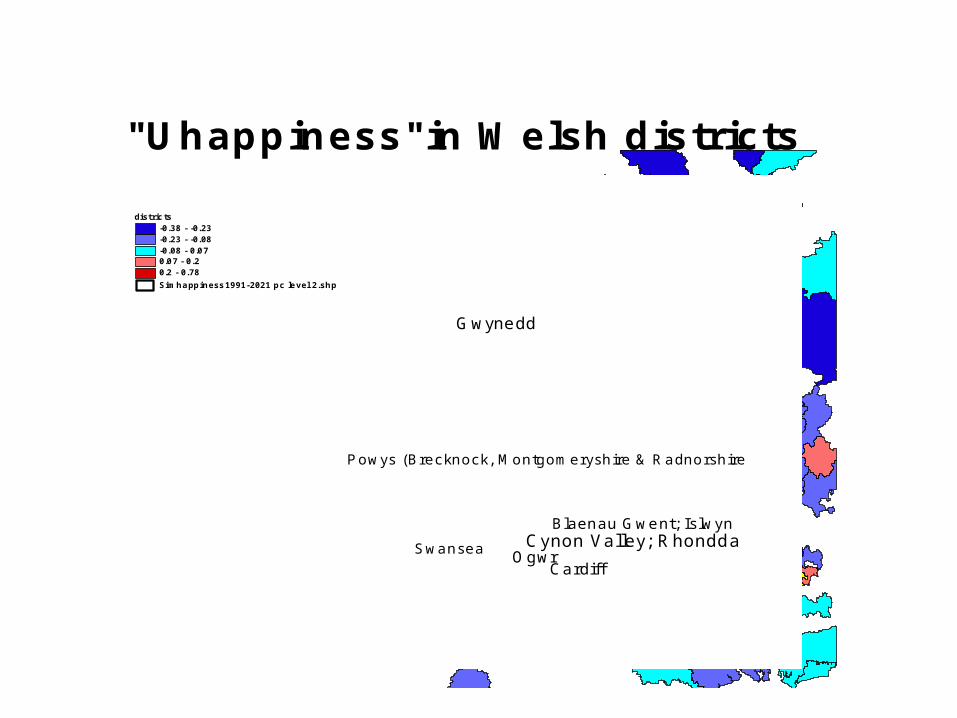
Geographies of unhappiness in Britain

Powys (Brecknock, Montgomeryshire & Radnorshire
Swansea Cynon Valley; RhonddaOgwr
Blaenau Gwent; Islwyn
Britain3.shpSimhappiness1991-2021 pc level 2.shp
districts-0.38 - -0.23-0.23 - -0.08-0.08 - 0.070.07 - 0.20.2 - 0.78
Distribution of "Uhappiness"
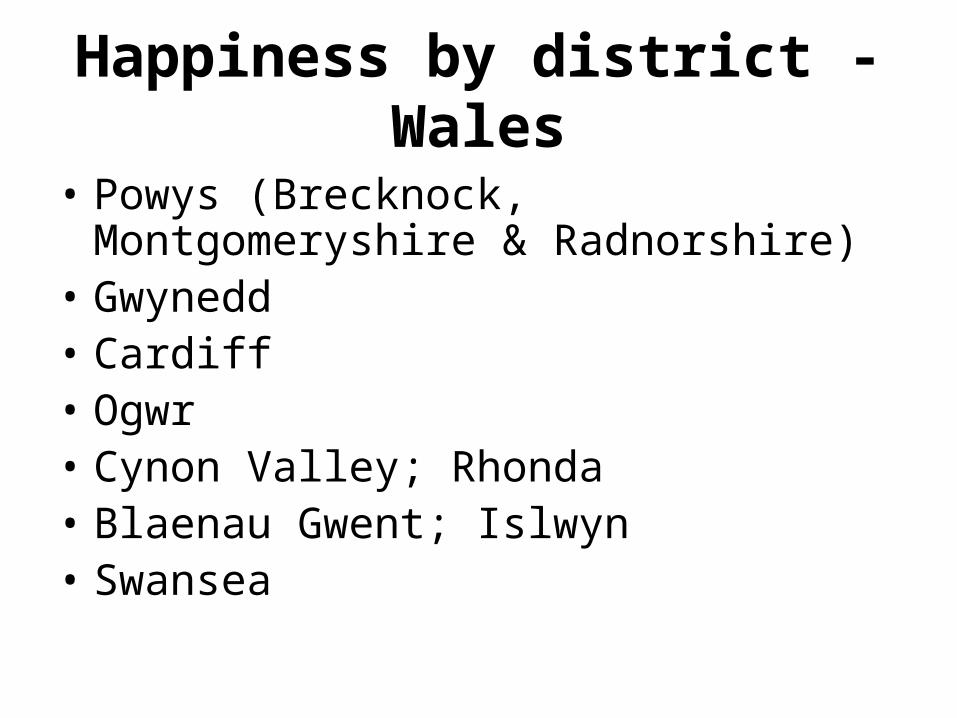
Happiness by district - Wales
• Powys (Brecknock, Montgomeryshire & Radnorshire)
• Gwynedd• Cardiff• Ogwr• Cynon Valley; Rhonda• Blaenau Gwent; Islwyn• Swansea
Powys (Brecknock, Montgomeryshire & Radnorshire
Swansea Cynon Valley; RhonddaOgwr
Blaenau Gwent; Islwyn
Gwynedd
Cardiff
Simhappiness1991-2021 pc level 2.shp
districts-0.38 - -0.23-0.23 - -0.08-0.08 - 0.070.07 - 0.20.2 - 0.78
"Uhappiness"in Welsh districts

Research questions to be addressed:
• What are the factors that influence different types of individuals’ happiness?
• Is the source of happiness or unhappiness purely personal or do contextual factors matter? (and if they do, to what extent?)
• If social comparisons are important, what is the spatial scale at which people make their social comparisons?
• Happy People or Happy Places?
Research methods:
• Regression modellingsingle level analysis to investigate the
association between “subjective happiness” and individual level explanatory variables
• Multi-level modellingAssesing variation in happiness at several
levels simultaneously• Spatial Microsimulation creating small area microdata

Multilevel Analysis
World Nation Region DistrictElectoral Wards Neighbourhood Household Individual
Multilevel modelling enables the analysis of data with complex patterns of variability – suitable to explore the variability of happiness at different levels

Multilevel Analysis
World Nation Region DistrictElectoral Wards Neighbourhood Household Individual
Multilevel modelling enables the analysis of data with complex patterns of variability – suitable to explore the variability of happiness at different levels

Combining Data
1991 & 2001 Census of UK population:
100% coverage
fine geographical detail
small area data available only in tabular format with limited variables to preserve confidentiality
British Household Panel Survey:
sample size: more than 5,000 households
annual surveys since 1991
individual data
more variables than census
coarse geography
household attrition
Modelling happiness and well-being: individual level models
1. Demography
2. Socio-economic
3. Health
4. Social context – interaction variables (e.g. “unemployed or not” dummy variable x “district unemployment rate” variable

Dependent variable: "unhappiness" BStd. Error Sig.
Constant -0.886 0.123 0.000
Age 0.033 0.006 0.000
Agesq 0.000 0.000 0.000
Female 0.195 0.024 0.000
Individual level LLTI 0.525 0.050 0.000
University degree 0.024 0.040 0.549
Unemployed (reference group = "employed or self employed") 0.891 0.234 0.000
Retired (reference group = "employed or self employed") 0.019 0.345 0.957
Family care (reference group = "employed or self employed") 0.273 0.223 0.220
Student (reference group = "employed or self employed") -0.054 0.081 0.505
Sick/disabled (reference group = "employed or self employed") -0.657 0.589 0.265
On maternity leave (reference group = "employed or self employed") -0.474 0.312 0.129
On a government scheme (reference group = "employed or self employed") -0.307 0.185 0.098
Other job status (reference group = "employed or self employed") 0.242 0.448 0.590
Household income -0.046 0.013 0.001
Couple no child (reference = "single") -0.089 0.050 0.078
Couple with dependent children (reference = "single") -0.025 0.050 0.619
Couple with no dependent children (reference = "single") -0.063 0.056 0.262
Lone parent (reference = "single") 0.157 0.082 0.054
Lone parent non dependent children (reference = "single") 0.077 0.073 0.295
Other household type (reference = "single") -0.025 0.074 0.732
Renting (reference = "owner occupier") 0.015 0.047 0.753
Local authority housing (reference = "owner occupier") 0.058 0.040 0.150
One car (reference = "no car") 0.049 0.040 0.218
Two cars (reference = "no car") 0.062 0.044 0.161
Three or more cars (reference = "no car") 0.038 0.056 0.497

Dependent variable: "unhappiness" B Std. Error Sig.
Constant -0.886 0.123 0.000
District ratesUnemployment rate 0.016 0.039 0.692
Lone parent 0.010 0.028 0.710
Social housing 0.035 0.034 0.296
Sick/disabled 0.014 0.021 0.500
% "affluent" 0.060 0.040 0.132
% "poor" 0.013 0.026 0.630
% "households with one car" 0.002 0.026 0.926
% "households with two cars" 0.012 0.075 0.874
% "households with three cars" -0.007 0.067 0.914
Interaction variables
unemployment -0.846 0.235 0.000
no car -0.031 0.033 0.353
students -0.056 0.073 0.440
social housing -0.070 0.042 0.093
private renting -0.032 0.029 0.275
owner occupier 0.028 0.032 0.381
age 20-24 0.065 0.036 0.068
aged over 75 -0.127 0.251 0.612
"affluent" -0.007 0.033 0.841
"middle" -0.007 0.027 0.785
"poor" 0.001 0.026 0.963
sick/disabled 0.163 0.295 0.580
Modelling happiness and well-being: multilevel (Ballas and Tranmer, 2007)
1. “Null model” – extent of variation
2. Demographic variables – random intercepts
3. Socio-economic variables and health – random intercepts
4. Social context – interaction variables

model 1: null

Level Variance Variance (%) SE
Region 0.002 0.21 0.002
District 0.007 0.73 0.003
Household 0.141 14.63 0.014
Individual 0.814 84.44 0.017
Model 1 variance component estimates
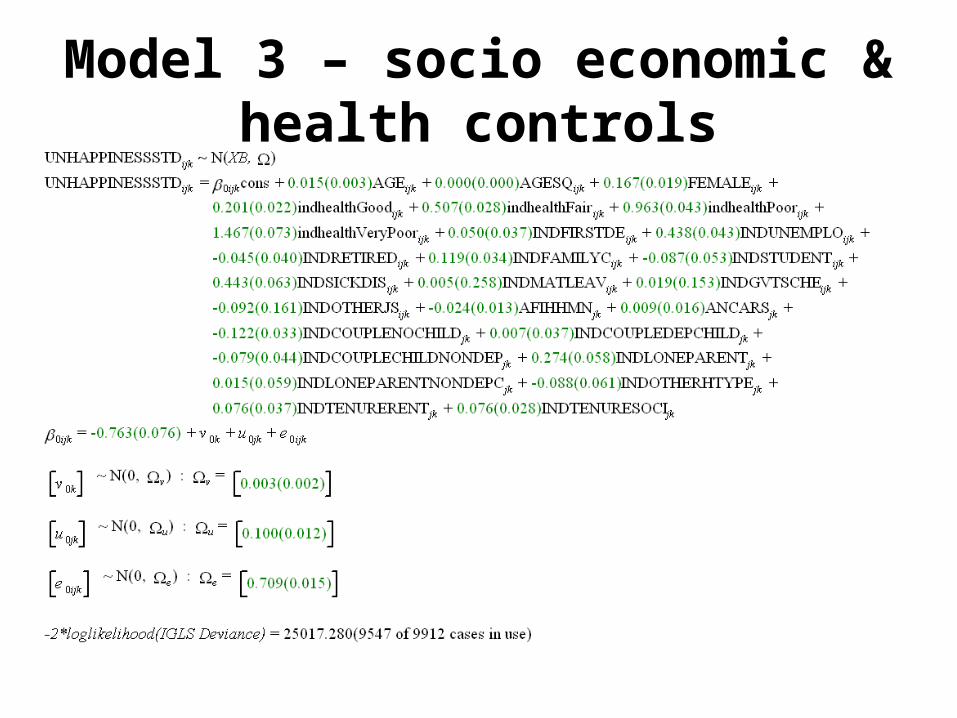
Model 3 – socio economic & health controls

Model 3 significant main effects
• Age +• Female +• Health less than very good +• Unemployed +• Family Carer +• Sick disabled +• Couple no child –• Lone parent +• Rent +

All variables – random intercepts

-0.15
-0.1
-0.05
0
0.05
0.1
0.15
0.2
-0.15 -0.1 -0.05 0 0.05 0.1 0.15 0.2
Full model residuals
Nu
ll m
od
el r
esid
ual
s
Model 3 vs model 1 district level residuals

Powys (Brecknock, Montgomeryshire & Radnorshire
Swansea Cynon Valley; RhonddaOgwr
Blaenau Gwent; Islwyn
Gwynedd
Cardiff
Simhappiness1991-2021 pc level 2.shp
districts-0.113 - -0.053-0.053 - -0.011-0.011 - 0.0250.025 - 0.0670.067 - 0.157
Null model residuals

Powys (Brecknock, Montgomeryshire & Radnorshire
Swansea Cynon Valley; RhonddaOgwr
Blaenau Gwent; Islwyn
Gwynedd
Cardiff
Simhappiness1991-2021 pc level 2.shp
districts-0.049 - -0.023-0.023 - -0.006-0.006 - 0.0090.009 - 0.0230.023 - 0.051
Full model residuals
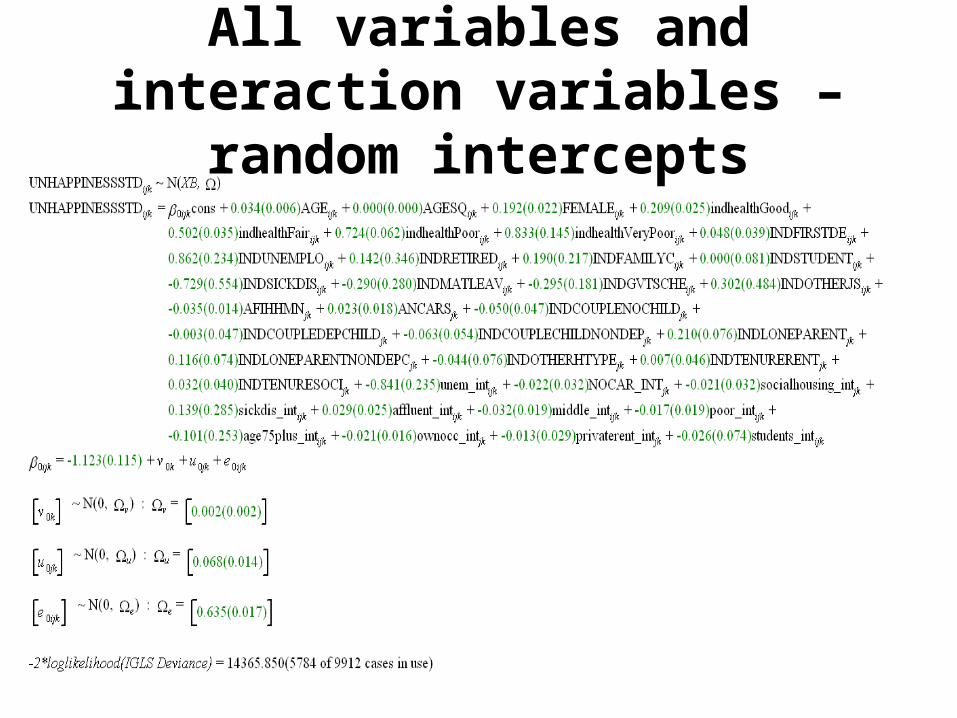
All variables and interaction variables – random intercepts

Spatial Microsimulation
• Reweight the first wave of the BHPS microdata to fit small area “constraints”
• Dynamically simulate this population for the years 1991, 2001, 2011, 2021 (“groundhog day” scenario)
• What-if dynamic simulations
After Ballas, D. , Clarke, G.P., Dorling, D., Eyre, H. and Rossiter, D., Thomas, B. (2005)SimBritain: a spatial microsimulation approach to population dynamics. Population, Space and Place, 11, 13 – 34. doi: 10.1002/psp.351

Modelling approach
1. Establish a set of constraints2. Choose a spatially defined source population3. Repeatedly sample from source4. Adjust weightings to match first constraint5. Adjust weightings to match second constraint6. …7. Adjust weightings to match final constraint8. Go back to step 4 and repeat loop until results
converge9. Save weightings which define membership of
SimBritain
MODEL CONSTRAINTS
• 1971, 1981 and 1991 Census Small Area Statistics (SAS)
• 6 constraint tables with 3 categories
• projected forward for 2001, 2011 and 2021
• ward level projections

CONSTRAINT TABLES
TABLE CATEGORY
Car Ownership no cars 1 car 2+ cars
Social Class affluent middle income less affluent
Demography 1 child 2+ children no children
Employment active retired inactive
Households married couple lone parent other
Tenure owner occupied council tenant other

Estimated geography of happiness in Wales (%) happy more than usual, 1991
Welsh Unitary Authorities (%)8.918.91 - 9.479.47 - 10.0110.01 - 10.3710.37 - 10.65
N
EW
S

Estimated geography of happiness in Wales (%) happy more than usual, 1991
parliamentary constituencies9.396 - 9.6969.696 - 10.10910.109 - 10.37210.372 - 10.72310.723 - 11.547
N
EW
S

Estimated geography of happiness in Wales (%) happy more than usual, 2001
Welsh Unitary Authorities (%)10.61 - 11.0511.05 - 11.6811.68 - 12.2812.28 - 13.7513.75 - 14.54
N
EW
S

Estimated geography of happiness in Wales (%) happy more than usual, 2001
parliamentary constituencies9.245 - 9.5999.599 - 9.9319.931 - 10.51910.519 - 11.13911.139 - 13.022
N
EW
S

Estimated geography of happiness in Wales (%) happy more than usual, 2011
Welsh Unitary Authorities (%)10.98 - 11.0811.08 - 12.6212.62 - 13.6913.69 - 14.914.9 - 15.66
N
EW
S
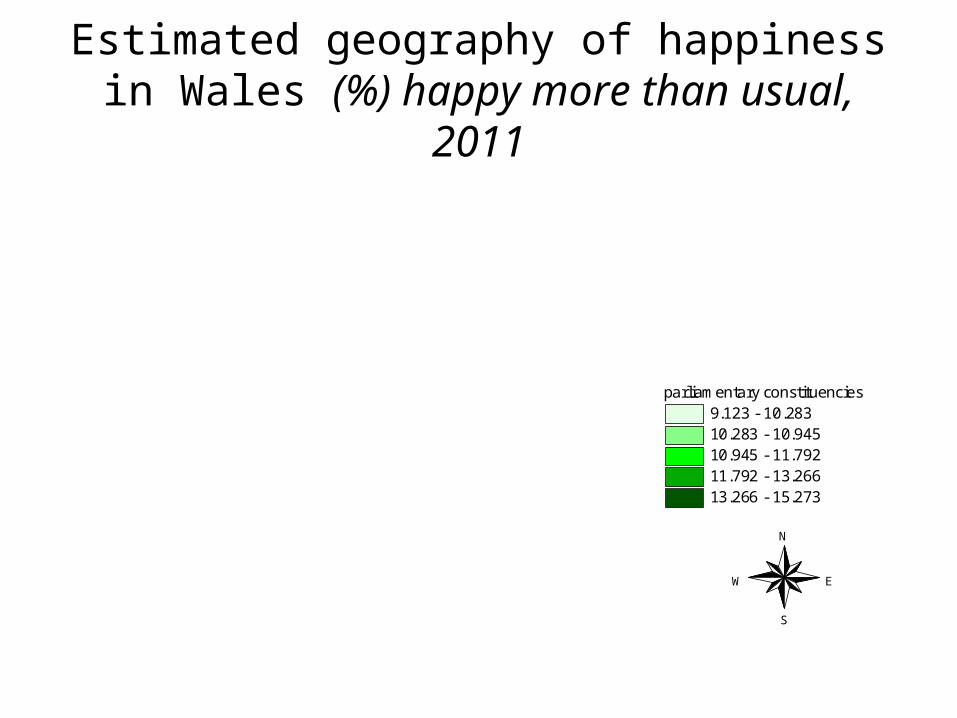
Estimated geography of happiness in Wales (%) happy more than usual, 2011
parliamentary constituencies9.123 - 10.28310.283 - 10.94510.945 - 11.79211.792 - 13.26613.266 - 15.273
N
EW
S

Estimated geography of happiness in Wales (%) happy more than usual, 2021
Welsh Unitary Authorities (%)10.76 - 11.3511.35 - 12.5812.58 - 13.4813.48 - 14.0314.03 - 16.19
N
EW
S

Estimated geography of happiness in Wales (%) happy more than usual, 2021
parliamentary constituencies8.335 - 9.5929.592 - 10.19110.191 - 10.96210.962 - 11.87711.877 - 14.103
N
EW
S

Conclusions• There are individual variations in happiness• Social context matters• Can explore additional geographical variations using
multilevel and spatial microsimulation modelling techniques
• Some district level variation in happiness does exist, even after accounting for individual and social context
• Next steps and future possibilities:– Detailed longitudinal analysis– Further analysis for finer geographical scales (spatial
microsimulation and agent-based modelling)