simulating the impact response of full-scale composite ... › d933 › 065b634ee6e5...figure 1....
TRANSCRIPT

13th International LS-DYNA Users Conference Session: Aerospace
1-1
Simulating the Impact Response of Full-Scale Composite Airframe Structures
Edwin L. Fasanella 1, Karen E. Jackson 2 and Justin D. Littell 2, Michael D. Seal 3
1National Institute of Aerospace, Hampton, VA 23666 2NASA Langley Research Center, Hampton, VA 23681
3Analytical Mechanics Associates, Inc., Hampton, VA 23666
Abstract
NASA Langley Research Center obtained a composite helicopter cabin structure in 2010 from the US Army’s Survivable Affordable Repairable Airframe Program (SARAP) that was fabricated by Sikorsky Aircraft Corporation. The cabin had been subjected to a vertical drop test in 2008 to evaluate a tilting roof concept to limit the intrusion of overhead masses into the fuselage cabin. Damage to the cabin test article was limited primarily to the roof. Consequently, the roof area was removed and the remaining structure was cut into test specimens including a large subfloor section and a forward framed fuselage section. In 2011, NASA and Sikorsky entered into a cooperative research agreement to study the impact responses of composite airframe structures and to evaluate the capabilities of the explicit transient dynamic finite element code, LS-DYNA®, to simulate these responses including damage initiation and progressive failure. Most of the test articles were manufactured of graphite unidirectional tape composite with a thermoplastic resin system. However, the framed fuselage section was constructed primarily of a plain weave graphite fabric material with a thermoset resin system. Test data were collected from accelerometers and full-field photogrammetry. The focus of this paper will be to document impact testing and simulation results for the longitudinal impact of the subfloor section and the vertical drop test of the forward framed fuselage section.
Introduction
In 2010, NASA Langley Research Center obtained residual hardware from the US Army’s Survivable Affordable Repairable Airframe Program (SARAP) [1]. The hardware consisted of a composite fuselage section, fabricated by Sikorsky Aircraft Corporation and designated the Test Validation Article (TVA). The TVA had been subjected to a vertical drop test in 2008 to evaluate a tilting roof concept to limit the intrusion of overheard mass items such as the rotor transmission into the fuselage cabin. A photograph of the fuselage section is shown in Figure 1. As a result of the 2008 test, damage to the hardware was limited primarily to the roof. Consequently, the roof area was removed and the remaining structure was cut into six different types of test specimens including: (1) tension and compression coupons, (2) I-beam sections, (3) T-sections, (4) cruciform sections, (5) a large subfloor section, and (6) a forward framed fuselage section. To protect Sikorsky’s data rights, specific details of the TVA design including thicknesses, laminate stacking sequences, and material specifications are not included. In 2011, NASA and Sikorsky entered into a cooperative research agreement [2] to study the impact responses of composite airframe structures and to evaluate the capabilities of the explicit transient dynamic finite element code, LS-DYNA [3, 4], to simulate these responses including damage initiation and progressive failure. The focus of this paper will be to document impact testing and simulation results for the two full-scale components tested, including the vertical drop test of the forward framed fuselage section shown in Figure 2 and the longitudinal impact test of a subfloor section illustrated in Figure 3. Additional information on this research program

Session: Aerospace 13th International LS-DYNA Users Conference
1-2
can be found in Reference 5.
Figure 1. Post-test photograph of the SARAP TVA following the 2008 vertical drop test.
Within LS-DYNA, two composite material models were evaluated: MAT_ENHANCED_COMPOSITE_DAMAGE (Mat 54), a progressive failure model that uses the Chang-Chang [6, 7] failure criterion to simulate ply-by-ply failure and property degradation and MAT_LAMINATED_COMPOSITE_FABRIC (Mat 58), a continuum damage mechanics model for representing unidirectional tape and fabric composite materials [8]. Sikorsky provided the material property values for Mat 54, whereas properties for Mat 58 were determined by assessing literature data, by comparing with similar Mat 54 values, and by using a trial and error process in which laminated coupons were simulated under both tensile and compressive loading.
Figure 2. Pre-test photograph of the framed fuselage section in test position.

13th International LS-DYNA Users Conference Session: Aerospace
1-3
Figure 3. Subfloor test article extraction.
Testing of the Forward Framed Fuselage Section
A photograph of the fuselage section is shown in Figure 2 during pre-test set-up. For this test, the fuselage section was attached to the portal frame. Four 100-lb lead blocks were mounted to the floor of the fuselage section. The test article was raised to a height of 91 in. and released to impact a rigid surface. Measured impact velocity was 249 in/s. The total drop weight, which included the portal frame, the upper ballast mass, lower floor ballast mass and the test article was 5,884 lbs. Instrumentation included three accelerometers on the portal frame block and one on each of the four floor masses, as well as relative displacement data collection from photogrammetry. Failure occurred at the floor through shearing and brittle fracturing from the sides near the lower corners, as shown in Figure 4.
Figure 4. Frame fuselage section post-test showing failures

Session: Aerospace 13th International LS-DYNA Users Conference
1-4
Testing of the Subfloor Section
A pre-test photograph of the subfloor section is shown in Figure 5(a). The specimen was instrumented with strain gages and sprayed with a speckle pattern for photogrammetric data collection. A picture of the test set-up with the test article under the 70-ft drop tower located at NASA Langley is shown in Figure 5(b). The weight of the portal frame drop mass was 5,100 lbs, and the impact condition was nominally 22 ft/s (264 in/s). During the test, the subfloor remained stationary, while being impacted by the portal frame drop mass. The specimen was crushed to failure and exhibited debonding of the T-stiffeners, tearing of the outer skin, and material crushing. This test was conducted solely to produce failures of the subfloor under longitudinal impact that could be captured in the simulation. The impact produced metal-to-metal contact of the bottom of the drop-frame portal with the aluminum plate that was bonded on top of the subfloor (see Figure 5 (b)). Unfortunately, this contact produced such high-frequency high-amplitude accelerations that all accelerometers either failed or were soon over-ranged. If the test could have been repeated, the subfloor would have been directly attached to the portal similar to the test method used for the forward framed fuselage section. Figure 6 shows four frames from a high-speed camera that captured the first 25 ms after impact. As can be seen in Figure 6, the floor T-stiffeners started debonding very early in the impact sequence.
(a) Subfloor specimen. (b) Test set-up. Note separation of portal and top of subfloor led to metal-to-metal contact.
Figure 5. Photographs of the subfloor specimen and the test set-up.
Description of the Framed Fuselage Section Finite Element Model
Sikorsky provided an updated 2-frame fuselage model to NASA in September 2012 that is illustrated in Figure 7. Although some of the test article was constructed of unidirectional tape, the primary material used for construction of the framed fuselage sections was a plain weave thermoset graphite fabric. The finite element model consisted of two frames plus associated skin and beam structure in the upper and lower frame sections.

13th International LS-DYNA Users Conference Session: Aerospace
1-5
Figure 6. Northeast camera view of subfloor deformation.
Sixty-nine PART_COMPOSITE cards were used to define the layer-by-layer thickness, orientation, and material assigned to plies within each composite laminate in the model. Some of the composite layups had over 100 plies. The light green solid volume attached to the top of the upper fuselage structure is intended to simulate the entirety of the upper loading mass (~5100 lbs.) and facility hardware (portal frame). This part was originally connected to the upper fuselage structure using CONTACT_TIEBREAK_SURFACE_TO_SURFACE. The empty weight of the fuselage was 368 pounds. An illustration is provided in Figure 8 showing the individual parts that are assigned to the material models (unidirectional tape and fabric) used in the framed fuselage section. Once the actual attachment hardware was constructed, the upper ballast mass was removed from the original Sikorsky finite element model and replaced with a more appropriate geometry. The revised geometry better reflected the current upper mass configuration of the test article and included increased height and line-on-line matching of the upper fuselage section profile. Four lead masses measuring 3.5- x 4- x 20-in. with each weighing approximately 100 pounds were added to the floor and the volumes were discretized using solid elements. The locations of the four lead weights are shown in Figure 9 attached to the floor frames. By removing the contact definitions between the upper mass and the roof, and between the lead blocks and the floor, noisy chatter due to contact was reduced. The upper mass shown in Figure 9 represents the mass of the drop portal frame plus attachment hardware.

Session: Aerospace 13th International LS-DYNA Users Conference
1-6
Figure 7. Sikorsky two-frame fuselage model with impact plane.
Figure 8. Sikorsky two-frame fuselage model separated by material type.
Mat 54 Predicted Responses of Fuselage Frame Compared with Test Data The Mat 54 predicted acceleration of a typical node on the upper mass, shown in Figure 10(a), exhibits very high amplitude, high-frequency oscillations even when filtered with a 300-Hz low-pass Butterworth filter in LS-PrePost® [9]. Also, the measured acceleration response from an accelerometer located on the portal is plotted in Figure 10(a) for comparison. The magnitudes of the initial peaks are comparable. Likewise, the Mat 54 predicted acceleration of a node located on a 100-lb lead block is shown in Figure 10(b) along with data from an accelerometer mounted

13th International LS-DYNA Users Conference Session: Aerospace
1-7
to the floor mass. The simulation overpredicts the magnitude of the initial peak acceleration; however, generally good agreement is shown after the initial peak.
Figure 9. Revised fuselage model updated with 4 lead blocks on the floor plus a modified upper loading mass that correctly represents the upper mass and contact area of the test article.
(a) Upper mass. (b) Lead block.
Figure 10. Comparisons of predicted accelaration responses with test of the upper loading frame mass and a floor-mounted lead block from the Mat 54 fuselage section model.
The velocity and displacement curves are much easier to compare as low-pass filtering is not required. The velocity response obtained by integrating the acceleration data from an accelerometer mounted on the upper mass is compared with the computed velocity from the Mat 54 simulation in Figure 11(a). Unfortunately, the integrated velocity is hard to interpret as a small drift or offset in acceleration can produce a very large difference in the integrated response. Consequently, it is instructive to compare with velocity that is obtained by differentiating full-field photogrammetric displacement data. However, since differentiation of digital data can produce large oscillations, it is best to smooth the curve before differentiating. A comparison of the predicted velocity from the Mat 54 fuselage section model with differentiated photogrammetric displacement data (velocity) is shown in Figure 11(b). In general, the Mat 54

Session: Aerospace 13th International LS-DYNA Users Conference
1-8
predicted velocity response agrees well with the test data and tends to fair through the test ocsillations. Note that the analysis was conducted to 0.12-seconds termination time. The static displacement of the portal frame was measured post-test to be approximately 7.25 inches. As illustrated in Figure 12, the Mat 54 model predicted that the maximum dynamic displacement of the portal was slightly over 8.5 inches. A possible explanation for the difference is that there was likely some rebound of the portal from the maximum. In addition, the rollers may have bound slightly causing energy loss.
Finally, some qualitative assessments can be performed by comparing photographs and motion picture analysis with predictions of model kinematic behavior. A photograph that was captured from a high-speed video is shown in Figure 13(a). This picture shows the rebound of the floor section after it had completely broken loose from the fuselage. The Mat 54 predicted fuselage damage at a time slightly over 100-ms after impact is shown in Figure 13(b). The kinematic motion and structural deformations of the test and analysis are nearly identical.
(a) Data from integrated accelerometer. (b) Data from differentiated photogrammetry.
Figure 11. Comparison of Mat 54 predicted velocity of the upper mass with test data.
Figure 12. Mat 54 predicted time history of the displacement of the upper mass test portal.

13th International LS-DYNA Users Conference Session: Aerospace
1-9
(a) Film-capture photo. (b) Mat 54 model prediction.
Figure 13. Test and analysis deformations of the fuselage section at time=0.1-s.
Mat 58 Predicted Responses Compared with Impact Test Data Mat 58 is a continuum damage mechanics material model based on the Matzenmiller-Lubliner-Taylor theory [8] and is intended for use with shell elements to simulate composite tape laminates and woven fabrics. The model requires input of material properties in tension, compression, and shear to define stress-strain behavior within the lamina or laminate. The user specifies the in-plane elastic modulus and Poisson’s ratio in two primary directions, designated A and B in LS-DYNA. Maximum strength values in tension, compression, and shear are also specified at corresponding strain values. The tensile response is initially linear elastic with the modulus specified by EA. Stress increases nonlinearly until XT, the maximum strength, is reached. The nonlinear portion of the response is defined internally by LS-DYNA based on a continuum damage mechanics theory. Once XT is reached, the stress is reduced based on the “stress limiting” factor SLIMT1, and is then held constant at the reduced value until elements reach a strain specified by the ERODS parameter in the material model, at which point the elements are deleted and removed from the solution. Through the appropriate selection of the SLIM parameters and ERODS, it is possible to incorporate plastic-like behavior in the model and avoid pre-mature element failure. Similar stress-strain responses are defined for in-plane compression and shear. Even composite materials have some plastic behavior and hence ERODS values need to be larger than failure strains measured in static strength tests. Element failure produces “holes” in the structure, which can lead to numerical instabilities and model disentegration. A good starting value for ERODS is difficult to determine, hence a range of values should be run to see its effect on a particular model. The fuselage section model, shown in Figure 9, was modified by changing the unidirectional tape and fabric material properties from Mat 54 to Mat 58, and the model was re-executed. A low value of ERODS (0.06) was used in the baseline model for the Mat 58 material model. ERODS is the shell erosion strain and is only available for Mat 58. ERODS, plus the SLIM parameters that can reduce element stresses after maximum strength is reached give Mat 58 more flexibility in preventing premature failures due to element deletions early in the simulation. A picture of the deformed fuselage model at a time of 0.15 seconds after impact is shown in Figure 14(a). This figure shows that the deformation and rebound of the floor closely match the actual test scenario, shown in Figure 14(b).

Session: Aerospace 13th International LS-DYNA Users Conference
1-10
The maximum displacement of the upper mass predicted by the Mat 58 model with ERODS=0.06 is slightly over 9 inches, which is greater than the displacement of 7.25 inches measured after the test. Consequently, a parametric study was performed to determine the influence of ERODS on the displacement of the upper mass. The results are shown in Figure 15. ERODS was varied from a high of 0.1 to a low of 0.06. The results show that the displacement of the upper mass is bounded by ERODS values of 0.06 and 0.09. The value of 0.075 provided the best match to photogrammetric displacement data. The displacement of the upper mass was measured post-test to be 7.25 inches. However, there is always some rebound and settling of a structure after an impact. Note that the photogrammetry data were collected from target number 1200, which is shown in Figure 16.
(a) Mat 58 model prediction. (b) Film-capture photograph.
Figure 14. Mat 58 (ERODS=0.06) simulation of the fuselage drop test at a time 0.1 seconds after impact compared with test.
Figure 15. ERODS study on the effect of upper mass displacement versus time.
As a result of the ERODS study, the fuselage model was re-executed in which the only change was to increase ERODS from 0.06 to 0.075. The predicted displacement of the upper mass now agrees better with photogrammetric data, as shown in Figure 17. In addition, comparisons of

13th International LS-DYNA Users Conference Session: Aerospace
1-11
predicted velocity with test data based on differentiated photogrammetric data and with the integrated accelerometer data are shown in Figures 18(a) and (b), respectively. The differentiated displacement (velocity) response in Figure 18(a) is for the target 1200 shown in Figure 16 at an upper left location. The velocity produced from photogrammetric data analysis is typically more accurate than the velocity produced from integrating accelerometer data due to large offsets or drifts that can occur. An acceleration offset or drift greatly alters the velocity. The initial acceleration peak is often correct, but offsets can occur shortly afterwards due to damping, filtering, and electronic biases. This problem is illustrated by the comparison of integrated acceleration with photogrammetric velocity in Figure 18 where the integrated acceleration is too low after 0.02-seconds.
Figure 16. Photogrammetric data was collected for target 1200, shown in the upper left corner.
Figure 17. Comparison of upper mass displacement predicted with Mat 58 (ERODS=0.075)
with photogrammetry of target 1200.
Although the Mat 58 fuselage model with ERODS=0.075 provided the best agreement with test displacement from the upper mass, the model with ERODS=0.06 showed the best match in predicting model kinematic behavior, including rebound of the floor, as can be seen by comparing Figure 14(a) and Figure 19. These two figures show Mat 58 model deformation at a time of 0.1-s for ERODS=0.06 and 0.075, respectively. In Figure 14(a), there is complete separation of the floor on one side. In Figure 19, neither side of the floor completely broke free.

Session: Aerospace 13th International LS-DYNA Users Conference
1-12
Note that, since the floor does not completely break away, the amount of rebound for the ERODS=0.075 model is not as great as for the model with ERODS=0.06.
(a) Data from photogrammetry. (b) Data from integrated acceleration.
Figure 18. Test-analysis velocity comparisons.
A comparison of Mat 58 (ERODS=0.075) predicted and test acceleration-time histories for the upper mass and for a lead block mounted to the floor are shown in Figures 20(a) and (b), respectively. All acceleration curves were filtered using a 300-Hz Butterworth low-pass filter. As shown in Figure 20(a), the predicted and experimental acceleration responses of the upper mass are highly oscillatory from initial impact through 0.03-s. The Mat 58 simulation slightly over predicted the initial acceleration spike, but generally matched the test response quite well. Likewise, the initial peak acceleration of the lead mass response was slightly over predicted, as shown in Figure 20(b).
Figure 19. Deformed plot for Mat 58 fuselage model (ERODS=0.075) at 0.1-s.

13th International LS-DYNA Users Conference Session: Aerospace
1-13
(a) Upper mass location. (b) Lead block on the floor.
Figure 20. Comparison of test accelerations with Mat 58 (ERODS=0.075) predictions.
Simulation of the Longitudinal Impact of a Subfloor Section
Pictures of the finite element model of the subfloor section are shown in Figure 21. The model consists of 109,393 quadrilateral shell elements; 1,500 solid elements; 111,607 nodes; 15 parts; and, 5 material cards. A single contact definition was used to define contact between the impact mass and the subfloor, and self-contact within the subfloor, which is designated CONTACT_AUTOMATIC_SINGLE_SURFACE. Of the 15 parts specified in the model, all but two were defined as PART_COMPOSITE, which allows input of ply orientations, thicknesses, and material designations for each layer in a multi-layered composite laminate. A Mat 20 (MAT_RIGID) card was used for the impact drop mass and a Mat 24 (MAT_PIECEWISE_LINEAR_PLASTICITY) card was used for the upper and lower aluminum support plates. All other parts were assigned either Mat 54 or Mat 58 material properties. For Mat 54 and Mat 58, material properties for unidirectional graphite tape were evaluated. Models were executed using LS-DYNA SMP Version 971 R6.0.0 with double precision and required up to 129 minutes of CPU on four processors for an end time of 0.1 seconds. The nominal element edge length is 0.25-inch. Nodes forming the drop mass were assigned an initial velocity of 264-in/s, matching the test condition. Two single point constraints (SPCs) were defined, one to fix the bottom nodes of the lower support plate and a second to ensure that the drop mass could only move in the vertical direction. Model output included acceleration-, velocity-, and displacement-time histories of a center node on the drop mass, as well as pictures of model deformations. Unfortunately, the only reliable data collected for the subfloor drop test was from photogrammetry of the base skinned panel, including vertical velocity and displacement responses.

Session: Aerospace 13th International LS-DYNA Users Conference
1-14
Figure 21. Pictures of the subfloor section model.
Mat 54 Predicted Response Compared with Test Data of a Subfloor Section Comparisons of the Mat 54 predicted velocity- and displacement-time history responses with photogrammetric data obtained during the subfloor section impact test are shown in Figure 22. The photogrammetric velocity response, shown in Figure 22(a), was filtered using a Society of Automotive Engineer’s SAE CFC60 low-pass filter. The Mat 54 analysis indicates that only a small amount of kinetic energy is removed during the simulation as numerous elements quickly fail dissipating very little energy. The predicted response started at a velocity of -264-in/s and ended at a velocity of -200-in/s. Likewise, the predicted vertical displacement increases in a linear fashion, without abatement, throughout the duration of the simulation. The predicted deformation pattern of the subfloor model that was executed with Mat 54 material properties is shown in Figure 23. Failure occurs in a brittle fashion, with large pieces of the structure breaking away as the model shatters like glass. The test article failed catastrophically through debonding of the T-stiffeners, tearing of the rear skin, and crushing of the I-beams. However, in the test, sufficient energy absorption occurred to limit the displacement of the upper mass to approximately 13-inches by the time of contact with the honeycomb stops (0.071-s). In the simulation, the drop mass displaced approximately 17-inches by 0.071-s. The honeycomb stops were not included in the model and the drop mass continued to displace vertically with no abatement, as brittle failure of the structure continued. Mat 54 does not have a method to add plasticity and avoid early element deletion using SLIM values and ERODS as does Mat 58.

13th International LS-DYNA Users Conference Session: Aerospace
1-15
(a) Velocity responses. (b) Displacement responses.
Figure 22. Comparisons of Mat 54 predicted velocity and displacement responses with PG.
(a) Time=0.018-s. (b) Time=0.036-s.
(c) Time=0.054-s. (d) Time=0.072-s.
(e) Time=0.09-s.
Figure 23. Pictures of Mat 54 subfloor model deformation.
Mat 58 Predicted Response Compared with Test Data of a Subfloor Section
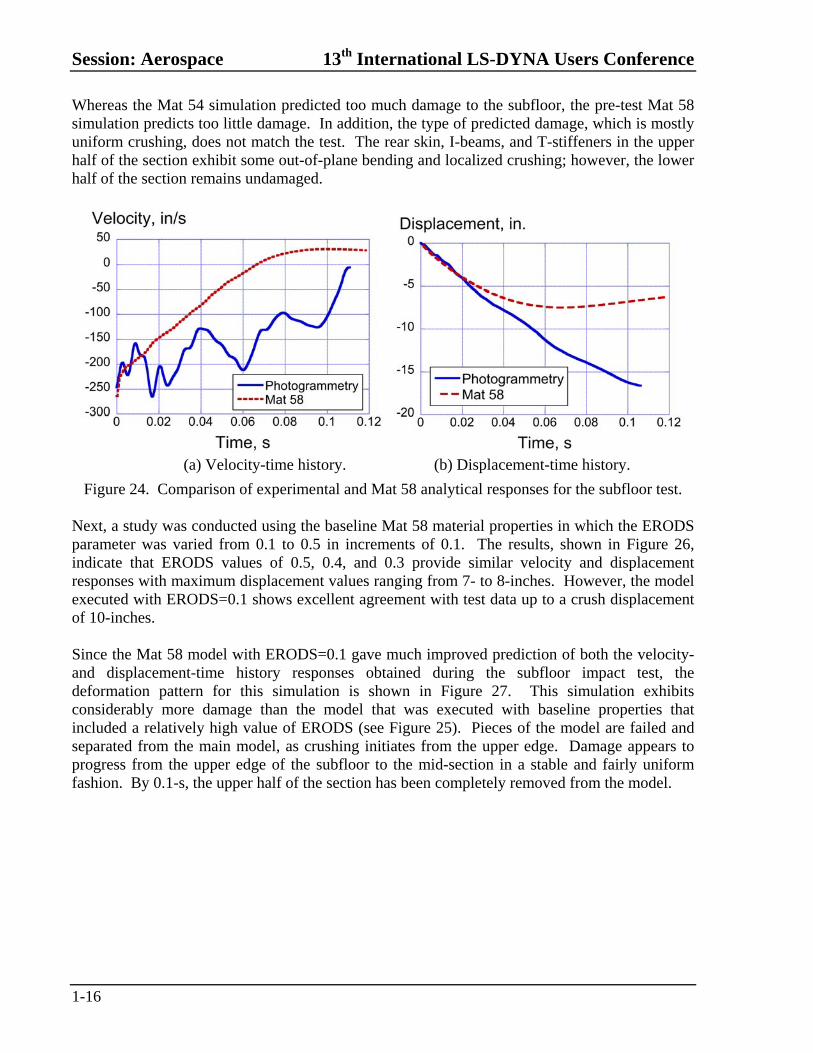
Comparisons of Mat 58 pre-test predicted velocity- and displacement-time histories with photogrammetric test data are shown in Figure 24. The predicted velocity response indicates that the model is too stiff and removes velocity much more quickly than the test. Likewise, the model predicts a maximum crush displacement of only 7-inches. Conversely, the test article displaces 13-inches, at which point the honeycomb stops are contacted. The pre-test simulation was executed using the baseline material properties for unidirectional graphite tape. The value of ERODS used in this material model proved to be too high to match the experimental deformations and failures. Pictures of model deformations are shown in Figure 25.
Session: Aerospace 13th International LS-DYNA Users Conference
1-16
Whereas the Mat 54 simulation predicted too much damage to the subfloor, the pre-test Mat 58 simulation predicts too little damage. In addition, the type of predicted damage, which is mostly uniform crushing, does not match the test. The rear skin, I-beams, and T-stiffeners in the upper half of the section exhibit some out-of-plane bending and localized crushing; however, the lower half of the section remains undamaged.
(a) Velocity-time history. (b) Displacement-time history.
Figure 24. Comparison of experimental and Mat 58 analytical responses for the subfloor test. Next, a study was conducted using the baseline Mat 58 material properties in which the ERODS parameter was varied from 0.1 to 0.5 in increments of 0.1. The results, shown in Figure 26, indicate that ERODS values of 0.5, 0.4, and 0.3 provide similar velocity and displacement responses with maximum displacement values ranging from 7- to 8-inches. However, the model executed with ERODS=0.1 shows excellent agreement with test data up to a crush displacement of 10-inches. Since the Mat 58 model with ERODS=0.1 gave much improved prediction of both the velocity- and displacement-time history responses obtained during the subfloor impact test, the deformation pattern for this simulation is shown in Figure 27. This simulation exhibits considerably more damage than the model that was executed with baseline properties that included a relatively high value of ERODS (see Figure 25). Pieces of the model are failed and separated from the main model, as crushing initiates from the upper edge. Damage appears to progress from the upper edge of the subfloor to the mid-section in a stable and fairly uniform fashion. By 0.1-s, the upper half of the section has been completely removed from the model.

13th International LS-DYNA Users Conference Session: Aerospace
1-17
(a) Time=0.02-s. (b) Time = 0.04-s.
(c) Time=0.06-s. (d) Time = 0.08-s.
Figure 25. Pictures of Mat 58 subfloor model deformation.
(a) Velocity-time history. (b) Displacement-time history.
Figure 26. Mat 58 ERODS parameter study results for the subfloor section.

Session: Aerospace 13th International LS-DYNA Users Conference
1-18
(a) Time = 0.02-s. (b) Time = 0.04-s. (c) Time = 0.06-s.
(d) Time = 0.08-s. (e) Time = 0.1-s.
Figure 27. Pictures of Mat 58 (ERODS=0.1) subfloor model deformation. Once again, the predicted behavior is not truly representative of the damage seen during the test, though this model (Mat 58 with ERODS=0.1) comes as close as any subfloor simulation that was executed. Part of the explanation is that neither the Mat 54 or Mat 58 models were setup to capture debonding or delamination. One of the first events that occurred during the test is that the T-stiffeners debonded from the base skin. These parts were almost completely undamaged, as they popped off of the subfloor. Other localized areas of delamination were noted. In general, the effect of debonding and delamination is to lower the stiffness of the structure in either a global or localized manner. For example, the loss of the T-stiffeners reduced the overall longitudinal stiffness of the subfloor, while delaminations reduce the stiffness and strength of parts in the localized region where they occur. While T-stiffener debonding could be simulated fairly easily through model modifications, it is a much more challenging task to prepare the model to accurately represent the location and amount of delamination. Note that stiffener debonding simulations were not attempted due to constraints on time and resources.
Concluding Remarks This report documents a study to assess LS-DYNA models for predicting the impact response of composite airframe structures. The test specimens were extracted from a previously tested composite prototype fuselage section developed and manufactured by Sikorsky Aircraft Corporation. As part of the study, tests were conducted on two full-scale composite components including a subfloor section and a framed fuselage section. Due to the varying complexity of the test articles, several different composite failure modes were evident during testing including brittle fracture, delamination, material crushing, and localized bending. In addition, structural failure modes occurred such as stiffener debonding and global/local buckling. The ability to accurately simulate so many different failure responses in a single finite element model is a major challenge.

13th International LS-DYNA Users Conference Session: Aerospace
1-19
Within LS-DYNA, two composite material models were evaluated: Mat 54 and Mat 58. Mat 54 is a progressive failure model that uses the Chang-Chang failure criterion to simulate ply-by-ply failure and property degradation, while Mat 58 is a continuum damage mechanics model for representing unidirectional tape and fabric composite materials. Mat 54 material properties were provided by Sikorsky, whereas material properties for Mat 58 were determined by assessing literature data, comparing with similar Mat 54 property values, and using a trial and error process in which laminated coupons were simulated under both tensile and compressive loading. Key findings of the research program are listed, as follows:
(1) The pre-test LS-DYNA models of the fuselage section using both Mat 54 and Mat 58 were successful in predicting the acceleration and displacement (compared with photogrammetry) of the upper mass and portal frame. Also the fuselage models predicted the complete failure and separation observed on each side of the two frames where the cross-section necks down. As with all Mat 58 models, the proper value of the shell element erosion parameter, ERODS, and the SLIM values are important in obtaining accurate results.
(2) The failure of the subfloor was catastrophic with multiple debonding failures, delamination, crushing, etc. Two of the primary failure modes, debonding and delamination, were not considered when setting up the subfloor model. Consequently, the pre-test model could only bound the results. Even after test results were available for comparison, neither the Mat 54 or the Mat 58 model could predict the actual physical failure modes. The Mat 54 model failed in a brittle fashion with total model disentegration. The Mat 58 model with proper tuning of the shell erosion parameter, ERODS, was able to predict the crushing distance, but not the failure modes.
Acknowledgements
The authors of this report gratefully acknowledge Charles Clarke, Brian Wilson, and Joseph Shen of Sikorsky, who provided finite element models and offered invaluable assistance in planning and executing the test and simulation program.
References
1. Carstensen T. A., Townsend W., and Goodworth A., “Development and Validation of a Virtual Prototype Airframe Design as Part of the Survivable Affordable Repairable Airframe Program,” Proceedings of the 64th American Helicopter Society Forum, Montreal, Canada, April 29-May 1, 2008. 2. Non-Reimbursable Space Act Agreement between Sikorsky Aircraft Corporation and NASA Langley Research Center for Collaborative Research Regarding Impact Testing and Simulation of Composite Airframe Structures, SAA1-1122, signed May 5, 2011. 3. Hallquist J. Q., “LS-DYNA Keyword User’s Manual,” Volume I, Version 971, Livermore Software Technology Company, Livermore, CA, August 2006. 4. Hallquist J. Q., “LS-DYNA Keyword User’s Manual,” Volume II Material Models, Version 971, Livermore Software Technology Company, Livermore, CA, August 2006. 5. Jackson, Littell, Horta, Annett, Fasanella, and Seal, “Impact Testing and Simulation of Composite Airframe
Session: Aerospace 13th International LS-DYNA Users Conference
1-20
Structures,” NASA TM-2014-218169, Feb 2014. 6. Chang, Fu-Kuo, and Chang, Kuo-Yen, “Post-Failure Analysis of Bolted Composite Joints in Tension or Shear-out Mode Failure Mode,” Journal of Composite Materials, Vol. 21, No. 9, September 1987, pp. 809-833. 7. Chang, Fu-Kuo, and Chang, Kuo-Yen, “A Progressive Damage Model for Laminated Composites Stress Concentrations,” Journal of Composite Materials, Vol. 21, No. 9, September 1987, pp. 834-855. 8. Matzenmiller A., Lubliner J., and Taylor R. L., “A Constitutive Model for Anisotropic Damage in Fiber Composites,” Mechanics of Materials., Vol. 20(2), pp. 125-152. 9. Anon., “LS-PrePost,” Livermore Software Technology Company, Livermore, CA.