simulation,
DESCRIPTION
Simulation,TRANSCRIPT

I
Simulation, optimization and development of
thermo-chemical diffusion processes
by
Yingying Wei
A dissertation submitted to the faculty
of the
WORCESTER POLYTECHNIC INSTITUE
in partial fulfillment of the requirements for the
Degree of
Doctor of Philosophy
in
Material Science and Engineering
April 2013
Approved by: ________________________
Prof. Richard D. Sisson, Jr., Advisor
George F. Fuller Professor
Director of Manufacturing and Materials Engineering

II
ABSTRACT
Thermo-chemical diffusion processes play an important part in modern manufacturing
technologies. They exist in many varieties depending on the type of diffusing elements
used and the respective process objectives and procedures.
To improve wear and/or corrosion performance of precisely machined steel components,
gas nitriding is selected as the most preferred thermo-chemical surface treatment.
Conventional gas nitriding of steels is a multi-hour, sometimes multi-day hardening
process carried out at ferritic temperatures and including a complete heat treatment cycle:
normalizing, austenitizing, martensitic quenching and tempering. An alternative,
subcritical-temperature austenitic nitriding process is evaluated with the purpose of
accelerating the treatment and optimizing the hardness and toughness of nitrided layers
while minimizing the distortion of steel parts treated. The alternative process involves
liquefied nitrogen cryogenic quenching as well as aging. This study presents results of
experimental work on AISI 4140 steel, examining the interplay between the nitriding and
tempering conditions and phase transformations in both ferritic (525oC) and subcritical,
nitrogen-austenitic (610oC) processes. Thermodynamic models, used to design processing
conditions, are applied also in the microstructural interpretation of nitrided layers. Results
are verified using the SEM, EPMA and EDS techniques. Kinetics of interstitial diffusion,
isothermal martensite transformation, as well as dimensional control of nitrided parts is
also presented.
Carburizing is, by far, the most widely adopted method in surface hardening. Problems
with intergranular oxidation (IGO), energy efficiency and carbon footprint of
conventional endothermic atmosphere (CO-H2-N2) carburizing is forcing heat treating
and manufacturing companies to move toward increasingly capital- and operating-cost
expensive, low-pressure (vacuum furnace) carburizing methods. In response, a new
activated and alternate carburizing method (A2A carburizing) has recently been
developed, bridging the endothermic atmosphere and vacuum processes, where a plasma-
activated, oxygen-free, non-equilibrium nitrogen-hydrocarbon gas blend is utilized. The
optimization of industrial A2A carburizing processes involves improvement of case
uniformity of parts at different locations in the charge as well as between different sides

III
on the parts. Connected to the optimization, a computational fluid dynamics (CFD) study
is conducted for examination of gas flow field inside the furnace and trays holding steel
parts treated. To mitigate soot in the atmosphere and minimize the poorly carburized
contact area between parts, effects of different combinations of nitrogen-hydrocarbons
mixture on soot formation in atmosphere, deposition on metal surface and graphite
growth at carburizing temperature are investigated. N2-0.4%C3H8-1%CH4 mixture is
proven to be able to provide proper carburizing hardened case with less soot in
atmosphere, less coke deposition on metal surface, as well as minimized marginally
carburized contact zone. A soot formation mechanism for non-equilibrium atmosphere in
A2A carburizing is discussed.
The carburizing processes have been investigated for decades, yet it still faces challenges
concerning performance, reliability and process control. Since carburized parts must meet
tolerances and specifications of particular applications, it is necessary to accurately
predict carbon concentration profiles as a function of processing conditions. Proper
carbon distribution is critical for satisfactory and reliable service life of carburized parts.
Based on experimental work and theoretical developments, a software CarbTool© has
been created for atmosphere and low pressure carburizing methods which consider the
thermodynamics, mass transfer kinetics and carbon diffusion aspects of the carburizing
process and the gas-steel interface condition. The models are capable now to accurately
predict the surface carbon concentration and the carbon concentration profile in the steel,
i.e. the most important outcomes of the process.

IV
ACKNOWLEDGEMENTS
Without support and guidance from many individuals, it would not be enjoyable and
challenging to complete this work. I feel deeply indebted to them all and would like to
convey my gratitude in this acknowledgement.
I wish to express my sincere gratitude to my advisor Prof. Richard D. Sisson, Jr., for his
constant support, guidance, advice, enthusiasm and encouragement throughout the years
when I am studying at Worcester Polytechnic Institute. It is my honor to be his student.
Not only does his insight and profound knowledge inspire me, but also his affirmative
attitude for both research and life encourages me to conquer difficulties in this journey.
I owe my greatest appreciation to Mr. Zbigniew Zurecki, my co-advisor at Air Products
and Chemicals, Inc. It is enjoyable to work with and learn from him. His ways of
problem solving and thinking motivate my pursuit for the better, deeper and boarder
understanding in the field of my work.
I deeply grateful to Prof. Diran Apelian, Prof. Makhlouf M. Makhlouf, Prof. Satya
Shivkumar, Prof. Kevin Rong and Prof. Jianyu Liang for sharing their vision of research,
their continuous encouragements and invaluable feedback through my academic years. I
am grateful to Ms. Rita Shilansky for her constant assistance and Dr. Boquan Li for
helping me to carry out the experiments.
I deeply appreciate opportunities that I have received through my internship with the
Metal Processing Center of Excellence in Air Products and Chemicals, Inc. A lot of my
work would have not been possible without their generous support. I give my sincere
thanks to Mr. Ranajit Ghosh, Ms. Anna K. Wehr-Auckland and Mr. John L. Green for
their valuable discussions, challenging my growth as a student, team player and an
independent researcher. I am thankful to my friends and colleagues in Air Products for
providing the support while pursuing my academic and personal goals.
I would like to thank the Center for Heat Treating Excellence at the Metal Processing
Institute and the consortium member companies for their financial support and oversight
of the project. I am so grateful for every little help that was provided on my way up.

V
It is a pleasure to be part of Materials Science and Engineering program and Metal
Processing Institute. Friends and colleagues here made my years at WPI an enjoyable
experience.
At Last, I am grateful to my parents and my boyfriend Mike Hu for being my everyday
inspiration. Their love and belief in me lit my path in life and helped me strive to reach
towards horizon and beyond.

VI
TABLE OF CONTENTS
ABSTRACT ........................................................................................................................................ II
ACKNOWLEDGEMENTS .................................................................................................................. IV
TABLE OF CONTENTS ...................................................................................................................... VI
CHAPTER I. INTRODUCTION ............................................................................................................ 1
1.1 Conventional nitriding and subcritical temperature austenitic nitriding .............................. 2
1.2 Activated and alternate atmosphere carburizing and simulation of carburizing processes 4
1.3. Objective ............................................................................................................................... 6
CHAPTER II. LITERATURE REVIEW .................................................................................................... 7
2.1 Nitriding ................................................................................................................................. 7
2.1.1 Fe-N martensite transformation during cryogenic treatment ....................................... 7
2.1.2 Atmosphere control of nitriding atmosphere .............................................................. 10
2.2 Carburizing ........................................................................................................................... 11
2.2.1 Atmosphere control of gas carburizing ........................................................................ 12
2.2.2 Intergranular oxides formation in gas carburizing ....................................................... 14
2.2.3 Vacuum carburizing ...................................................................................................... 17
2.2.4 Plasma activated and alternate atmosphere (A2A) carburizing................................... 19
2.2.5 Carbon transfer mechanisms and its analytical models ............................................... 23
2.2.6 Numerical Simulation ................................................................................................... 24
CHAPTER III. PUBLICATIONS .......................................................................................................... 35
Paper #1: Nitrogen diluted ammonia atmosphere subcritical temperature nitriding on AISI
4140 steel: microstructure evolution, layer growth kinetics and cryogenic treatment (to be
submitted to Surface and Coatings Technology) ....................................................................... 35
Paper #2: Subcritical temperature austenitic nitriding and cryogenic treatment on low alloy
steel (published in Proceedings of Materials Science and Technology (MS&T) 2012, Pittsburgh,
PA, October, 2012)..................................................................................................................... 57
Paper #3: Process Optimization for Industrial Practices of Plasma Activated Nitrogen-
Hydrocarbons Atmosphere Carburizing (to be submitted to International Heat Treatment and
Surface Engineering) .................................................................................................................. 73
Paper #4: Modeling of carbon distribution during atmosphere and low pressure carburizing
processes (published in Journal of Materials Engineering and Performance, Vol.22(1), 2013,
DOI:10.1007/s11665-012-0353-6) .......................................................................................... 103

VII
Paper #5: Intelligent Heat Treating: Simulation of Carburization Process (published in
Proceedings of the 26th ASM Heat Treating Society Conference, Cincinnati, OH, Nov 2011, pp.
91-98) ...................................................................................................................................... 118
CHAPTER IV. RESEARCH CONCLUSIONS ...................................................................................... 134
1
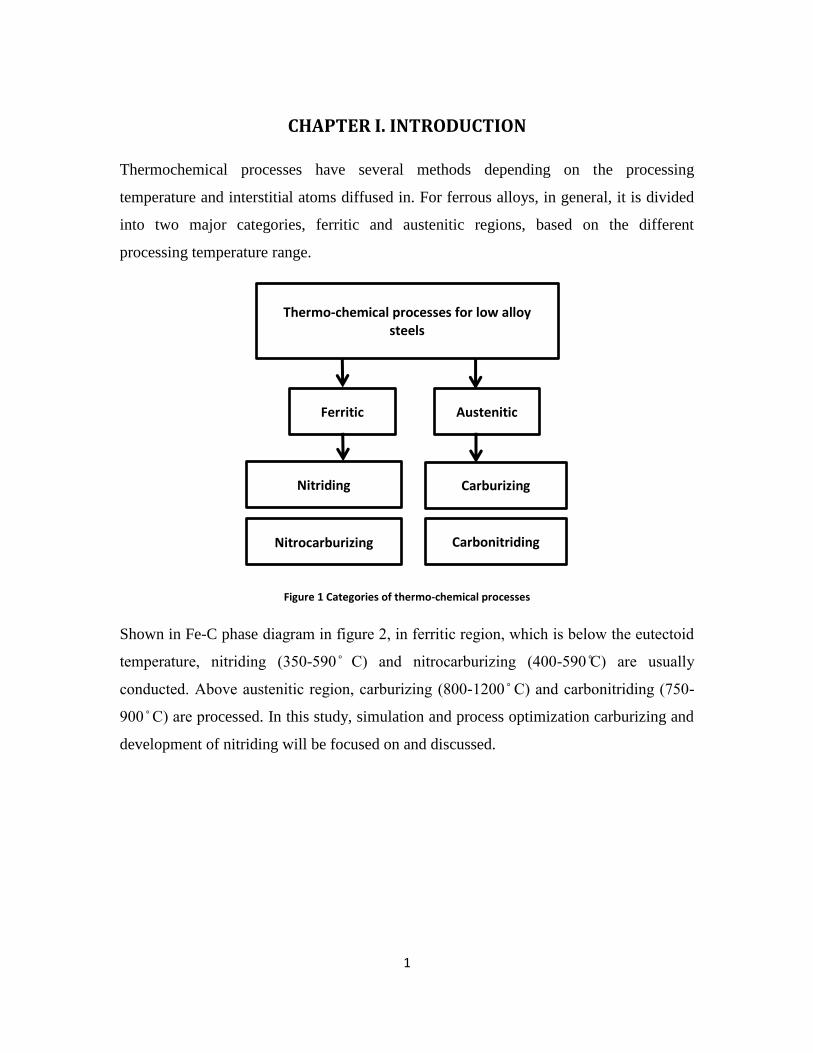
CHAPTER I. INTRODUCTION
Thermochemical processes have several methods depending on the processing
temperature and interstitial atoms diffused in. For ferrous alloys, in general, it is divided
into two major categories, ferritic and austenitic regions, based on the different
processing temperature range.
Figure 1 Categories of thermo-chemical processes
Shown in Fe-C phase
- -
- -
ocessed. In this study, simulation and process optimization carburizing and
development of nitriding will be focused on and discussed.
Thermo-chemical processes for low alloy steels
Austenitic Ferritic
Nitriding
Nitrocarburizing
Carburizing
Carbonitriding

2
Figure 2 Temperature range of thermo-chemical processes on low alloy steels
1.1 Conventional nitriding and subcritical temperature austenitic
nitriding
Nitriding is a thermo-chemical process that diffuses nitrogen atoms into surface of metals,
most frequently steels, to create hardened case. Nitriding can be divided into several
categories based on its interstitial atom carrier. During the recent decades, gas nitriding
has become the dominant method in the metals processing industry. Conventional gas
nitriding (ferritic-phase nitriding) usually takes place in the 350-590 °C range, i.e. in the
ferritic phase region of low-alloyed steels. Rapid quenching is not required following the
conventional, ferritic gas nitriding operations, and this prevents dimensional distortions,
normally produced by the classic, carbon austenite to martensite phase transformation.
Nitrided layer is comprises compound layer and diffusion zone. Compound layer,
consisting γ’- Fe4N ε-Fe2-3N, determines tribological and corrosion properties.
Diffusion zone consists of α phase and different kinds of carbides, which determine its
mechanical properties though their hardness and distribution. Ferritic nitriding of steels
Carburizing
Carbonitriding
Nitrocarburizing
Nitriding

3
produces less distortion and deformation than either carburizing or conventional
transformation hardening. However, due to the limited nitrogen solubility of ferrite
(figure 3) and a low diffusion coefficient caused by low process temperatures, the
hardened case is relatively shallow even for the treatments taking many hours or days.
Also, the nitrogen concentration decreases very quickly beneath the compound layer
which results in an undesired, sudden drop of metal hardness.
Figure 3 Solubility of nitrogen in iron at 0.1 MPa [1]: the symbols reflect data of various researchers.
A modified method is employed for accelerating nitriding treatments and optimizing the
hardness and toughness of the core and the nitrided layers while minimizing the
distortion of steel parts treated. The method involves increasing the nitriding temperature
to sub-critical temperature, the temperature above the eutectoid temperature in the Fe-N
system but below the corresponding temperature in the Fe-C system, and combined with
quenching and further cooling to the cryogenic temperature range, in order to assure a
complete transformation of nitrogen-formed austenite into nitrogen-formed martensite.
It is verified within the present research program that the core of the parts treated
according to the proposed method retain its original ductile phases, carbon ferrite and
carbides, whereas the surface layer comprises the conventional, hard compound layer (γ’-
Fe4N ε-Fe2-3N) and, an additional, somewhat softer transition layer of N-martensite.
Thus, the thickness of the hardened case increases because of the transition layer and,

4
importantly, the phase transformation on quenching only occurs inside this layer which,
in turn, will minimize distortion.
1.2 Activated and alternate atmosphere carburizing and simulation of
carburizing processes
Carburizing of ferrous alloys is the introduction of carbon atoms into a solid alloys by
holding above the temperature at which austenite begins to form, the critical temperature
(A1) of the material in contact with a suitable source of carbonaceous material, which
may be solid, liquid or gas.
The current prevalent carburizing methods in industry are atmosphere/gas and low
pressure/vacuum carburizing. Gas carburizing uses equilibrium atmosphere controlled by
carbon potential, which can be calculated from carbon activity from gas reactions.
Vacuum carburizing uses non-equilibrium atmosphere at low pressure, in this case,
carbon potential for equilibrium status is not applicable any more, in this study, carbon
flux from atmosphere into component is used as controlling parameter of vacuum
carburizing. There are three major steps in carburizing: 1) carbon carrier gases diffusion
from atmosphere to component surface, controlled by mass transfer coefficient; 2)
reaction at the surface and carbon chem-absorption by the surface, driven by activity
gradient and 3) adsorbed carbon diffusion from the surface into the bulk materials,
F k’
Endothermic gas is the major carbon carrier atmosphere used in industrial gas carburizing,
which in average contains approximately 40% N2, 40% H2, 20% CO, 0.2-0.5% CO2,
trace amount of water vapor and methane/propane, depending on the original feeding gas
into the endogas generator. [2]. The final production level of CO varies with various feed
gas and will directly affect the atmosphere carbon potential, therefore, the controlling
system in endothermic gas generator need to be precisely regulated. In addition, in certain
regions of the world, where natural gas or propane may not be available, gaseous nitrogen
and liquid methanol are used as alternate atmosphere and fed directly into furnace
without generator. However, there are some problems exist with this kind of atmosphere
in terms of quality of both atmosphere and workload. [3].

5
Because of the existence of oxidizing spices (H2O, CO2) in the atmosphere of gas
carburizing, the ferrous alloys with high content of Ti, Si, Mn, and Cr will be easily
oxidized at the grain boundary and forms so-call intergranular oxide (IGO), which is
brittle therefore could be the initial point of fatigue crack propagation during service. In
industry, post-carburizing grinding is utilized to get rid of IGO layer, but additional stress
is introduced onto the components, and also increased the cost. To avoid the formation of
IGO, low pressure carburizing is employed to treat components with high quality
requirements. Hydrocarbon, usually acetylene, is purged into furnace at 2-20 mbar.
Nevertheless, the investment of vacuum carburizing furnace is much more expensive than
gas carburizing furnace, and requires more frequent and careful maintenance.
The A2A technology introduced by Air Products and Chemicals, Inc. has been developed
to eliminate oxides, improve carburized quality, remove endo-gas generator, reduce
capital- and operational- cost saving by using less toxic and more environmental friendly
gas in 1-atm pressure furnace, where nitrogen and hydrocarbon blends are introduced and
activated through cold plasma injector. In this work, implementation of industrial process
optimization has been conducted by both experimental trials and Computational fluid
dynamics simulation (CFD), two methods of flux controlling are also used. Soot/tar
formation on low alloy steel components, which is existing problem in both gas and
vacuum carburizing is investigated.
Carbon concentration profile is one of the most important criterions for quality evaluation
of carburized components, therefore, to have satisfied and reliable service of the
components, precise control of carbon distribution is imperative. A simulation tool
CarbTool© has been developed based on experimental data and theoretical development.
In this study, vacuum carburizing model with non-equilibrium atmosphere is improved
regarding to the quick carbon saturation and carbides formation on interested alloys by
thermodynamics simulation. The accurate prediction for both gas and vacuum
carburizing has been verified.

6
1.3. Objective
The aim of this research is to develop and optimize the conventional nitriding and
carburizing processes using modified atmosphere and process parameters with assistance
from simulation and modeling.
The aim of subcritical temperature nitriding process development is to investigate the
kinetics, behavior and properties of N-austenite and N-martensite formed during gas
nitriding and cryogenic quenching in the surface of low-alloy, low-cost steels.
To commercialized the feasibility-proven plasma activated and alternate atmosphere
carburizing, industrial trials with plasma injector retrofit on exist integral quench furnace
are conducted and evaluated. The purpose of this work is to verify the feasibility of this
technology in practical industrial production in the extent of improvement of case
uniformity, assurance of atmosphere and components quality, as well as development of
process controls.
The simulation work provides better understanding of carburizing processes in
equilibrium and non-equilibrium atmosphere, as well as
Ultimately, the objective of this study is to provide the metals processing industry with
more cost-effective, better quality thermo-chemical processes alternatives.

7
CHAPTER II. LITERATURE REVIEW
Case hardening processes are used to form a hard case or shell around the still tough core
of a steel component. In general terms the harder a piece the less it wears. So if produce a
component like gear we want it to be as hard as possible to be not worn out. However,
high hardness in steel will decrease the ductility so that the components tend to be brittle.
When the component is shocked, for instant, change the gear, the gear teeth would
fracture and fall off. Therefore, case hardening would be employed as the solution, to
create a hard wear resistant outside and keep the tough, ductile and shock resistant core
[4].
2.1 Nitriding
Compare to carburizing, the benefits of conventional nitriding result from relatively
lower process temperature, which is in ferritic region. Thus it does not undergo
structural-mechanical change at the core upon quenching, and consequently minimizes
dimensional change and distortion. However, the low solubility of ferrite and low
processing temperature lead to shallow case of compound layer and hardness quickly
drop within diffusion zone. Fe-N austenite with subsequent transformed Fe-N martensite
could create a transition layer between hard but poorly supported compound layer and
soft diffusion zone.
2.1.1 Fe-N martensite transformation during cryogenic treatment
Fe-N austenite formed at high temperature nitriding (over 1000 °C) in stainless steels has
been investigated by Berns, et al [5-9]. Fattah [10] has compared the corrosion properties
of AISI 4140 steel treated by plasma ferritic and austenitic nitriding followed by a slow
cooling with furnace. Yasumaru[11] compared the results from nitriding at three different
temperatures and water quenching on pure iron.
Regarding cryogenic treatments of steels after quenching from austenitic temperatures
and before tempering, their effect on transformation of retained austenite and carbide
precipitation (aging) has been investigated extensively. Claimed advantages of these

8
“ ” -195oC) on transformation hardenable alloys are captured in
the following three aspects:
1) Conversion of retained austenite to martensite and preventing excessive
distortion during subsequent tempering due to austenite decomposition, as well as
increasing hardness.
A large number of references [12-19] have stated delay between room
temperature quench and cryogenic treatment may introduce austenite stabilization,
hindering the subsequent martensitic transformation. However, investigations by
Stratton et al. on AISI 8620 steel grade [20] shows when temperature is lower
than -120°C, the driving force is sufficient to convert even stabilized austenite.
2) Clustering of carbon atoms (distributed randomly over c-type of octahedral
interstices) is activated during soaking steel in liquid nitrogen. This effect
promotes precipitation of ultra-fine carbides, hence, it increase the hardness,
wear- and corrosion-resistance.
3) According to the current state of knowledge the transformations of
cryogenically treated steels during the subsequent aging and tempering include
: ; ε/η on,
martensite decomposition into a low carbon martensite; retained austenite
decomposition into cementite and ferrite, and conversion of transition carbides to
cementite.
Meanwhile, microstructure evolution on aging and tempering of cryogenically quenched
Fe-N martensite have been researched using elemental, carbon-free iron as the starting
material [10, 21-28].
Comparing to Fe-C martensite transformation during aging and tempering, the Fe-N
transformations differ slightly. At the first stage, Mittemeijer [23] found no evidence of
nitrogen clustering. Instead, segregation and ordering of interstitial atoms to c-type
octahedral interstices occurs during aging at room temperature, which was confirmed by
Gavdijuk [27, 29] using Mössbauer methods and Monte Carlo simulation. Gavriljuk [29]

9
observes that N tend to be short-range ordering and C tend to clustering, and that the
distribution of Cr, Mn, Ni, Mo in austenite is more homogeneous in the presence of N
H η ε original specimen included 0.5 wt. % C)
k α” [23] which results
I x α”
reduce hardness. In the last steps of described aging- q α”
γ’
ferrite and carbides.
Few only publications [30-34] were found to focus on the precipitation behavior of Fe-C-
N martensite during aging and tempering and discuss the early stages of aging. Ferguson
[35]and Wierszyllowski [36] proposed that the early clustering involves both nitrogen
α”-Fe16(C,N)2 during the
subsequent tempering.
In contrast, experimental results from Mittemeijer and et, al. [30, 32, 34] indicated that
nitrocarbides or carbonitrides do not form. It is rather the stress-driven local
redistribution of C and N atoms to a-, b- and c- type of octa α”
ε/η -development of Fe-C-N martensite.
When the atomic ratio of carbon and nitrogen varies but the total amount of interstitial
α” ε/η nt on the C/N ratio. This leads to
the conclusion that carbon and nitrogen follow separate precipitation routes, with one part
of the enrichments containing (mainly) carbon and that the other part mainly nitrogen
atoms.
The precipitation process of Fe-C-N martensite can be divided into five steps according
to Cheng et al. [34]: 1) local enrichment of interstitial atoms below 97°C; 2) formation of
nitrogen- α” - ε/η; α” γ’
ε/η; ; ε/η
In terms of alloy effects on transformation of N containing martensite during aging, only
Cheng et al. [37] reported on tempering of FeNiN martensite. Ni was found to suppress
10
the develo α”-(Fe,Ni)16N2; γ’-(Fe,Ni)4N precipitated from a randomly distributed
N-enriched matrix and was followed by retained austenite decomposition.
Considering the martensite transformation starting point (Ms), N stabilized austenite
more effectively than C. Ms was only 120K for Fe-2.75 wt. %N alloy according to [27].
When nitrogen content exceeds 2.2 wt. %, the N-austenite is stable at room temperature
due to its Ms point located below the room temperature [11]. T. Bell [38] proposed the
relationship between Ms and N-concentration as Ms (°C) = 533-228NC (wt. %). In this
case, cryogenic soaking treatment is, simply, indispensable for transforming austenite to
martensite.
2.1.2 Atmosphere control of nitriding atmosphere
Partially dissociated ammonia is used in conventional nitriding. Before feeding into the
furnace, ammonia is dissociated through an ammonia dissociate, where addition of H2 is
produced to improve the control of nitriding potential in some cases. At the metal surface,
ammonia dissociates to provide nitrogen dissolution via equation 18,
1
For local equilibrium between N in the atmosphere and N dissolve by metal surface, the
activity of nitrogen is given by,
2
where k18 is equilibrium constant of reaction 18, P is partial pressure of respective gas
phases.
Nitriding potential is defined as,
3
Lehrer diagram for pure iron in figure 4 has been universally adopted for nitriding
process control. This diagram presents the relationship between phases formed under
local equilibrium and the nitriding potential as a function of temperature for pure ion. The

11
methodology of Lehrer diagram creation for alloy steels is developed by M. Yang [39] by
Thermo-Calc [40].
Figure 4 The experimental Lehrer diagram of the pure iron [41] with isoconcentration lines added [42]
2.2 Carburizing
Of the many technologies available today to improve the performance of engineered
surfaces, carburizing is one of the most common. It is enduringly popular because it uses
a higher temperature than most thermochemical processes so that a deep hard layer can
be formed in a short time [43]. It has been used in many industrial applications,
especially automobile and aerospace components. To enrich the
- [44], depending on the process objective and procedures.
There are several categories of carburizing processes regarding to the carbon carrier
medium: liquid, carbonaceous solid and atmosphere. This review will focus on process
modeling, atmosphere control and development of carburizing processes using gas
carbon carrier medium.

12
2.2.1 Atmosphere control of gas carburizing
The current prevalent carburizing processes include gas carburizing using either
endothermic atmosphere or nitrogen/methanol mixture, and low pressure carburizing
which is usually referred as vacuum carburizing.
The endothermic gas is a common equilibrium atmosphere used in many heat-treatment
furnaces for applications that require a strong oxygen reducing atmosphere [2]. It is
commonly generated from an endo-gas generator, which is comprised of an air/gas
mixing system that supplies a mixture of ai
k / x
F F [2]. Upon the completion of
the reaction, the production gas is qu k F
freeze the gas and prevent possible reverse reaction and carbon fallout to cooling system
and pipeline downstream [2, 3].The production gas is primarily composed of 31 – 40%
H2, 40 – 46% nitrogen, 19 – 23 % CO, 0.2 – 0.5% CO2, less than 0.1 % water vapor and
less than 0.1 % hydrocarbon depending on the original feeding gas in the generator.
This production gas would be feed directly into furnace as carbon carrier atmosphere
during gas carburizing process. To achieve the desired carbon potential, an enrichment
gas, e.g. methane or propane may be added. There are three main reactions take place in
the furnace at the processing temperature.
4
5
6
Among above three reactions, the last one has been proved to be the fastest and therefore
the rate-determining reaction in the carburizing atmosphere with CO and H2 as major
components [45]. According to the fundamental principle of chemistry, the equilibrium
condition for reaction 3 is described by equilibrium constant k3 [46]:
7

13
Where ac is carbon activity, P is partial pressure of respective gas species. The value of
equilibrium constant is dependent on temperature and can be calculated from equation
[47].
8
where stands for standard Gibbs free energy for the reaction, T is the temperature, R
is the ideal gas constant. From equation 4 and 5, carbon activity can be calculated.
Carbon activity gradient is the driving force of transfering carbon atoms from atmosphere
to metal surface. When gas composition (dew point, CO, H2) is controlled and then
carbon activity is controlled.
Since equilibrium is assumed in this kind of atmosphere, the equilibrium also exists in the
reaction 1 and another carbon transferring reaction 6.
9
10
11
Therefore, carbon activity can also be controlled by CO/CO2 ratio or O2 content. CO2 is
commonly controlled with an IR instrument and O2 is with an oxygen probe.
However, in practical production, instead of carbon activity, another term called carbon
potential is used in the process. The carbon potential of a furnace atmosphere is equal to
the carbon content that pure iron would have in equilibrium with the gas [48]. The
relationship between carbon activity ac and carbon potential CP is expressed by [48],
12
13
(
) 14

14
where γ is activity coefficient and Xc is the carbon content expressed as a mole fraction.
From above equations combined with calculated carbon activity, carbon potential can be
calculated.
A simpler expression of the formula is usually used to calculate the relationship between
carbon content in low-alloy case-hardening steel and carbon potential [48].
15
In addition to endothermic gas, there is a competing process that was very popular in the
’ ’ ailment took place. During this era the
alternate atmosphere using gaseous nitrogen and liquid methanol was fed directly into the
furnace [3]. The liquid methanol will be dripped into the furnace through the sprayer and
cracks into carbon monoxide and hydrogen, at a rate to yield the 40% H2 and 20% CO
levels.
2.2.2 Intergranular oxides formation in gas carburizing
In both endogas and nitrogen/methanol mixture, the blend of the gas is formed by about
20% CO that is the most important in the exchange of the C from the atmosphere to the
surface of the carburizing steel [49]. The standard Gibbs free energy change [50] for
reaction 6 is
16
The equilibrium constant k6 of this reaction is
17
which gives k6 equals to e-21.74
at temperature 92 q
18
and Nerst equation [49],
19
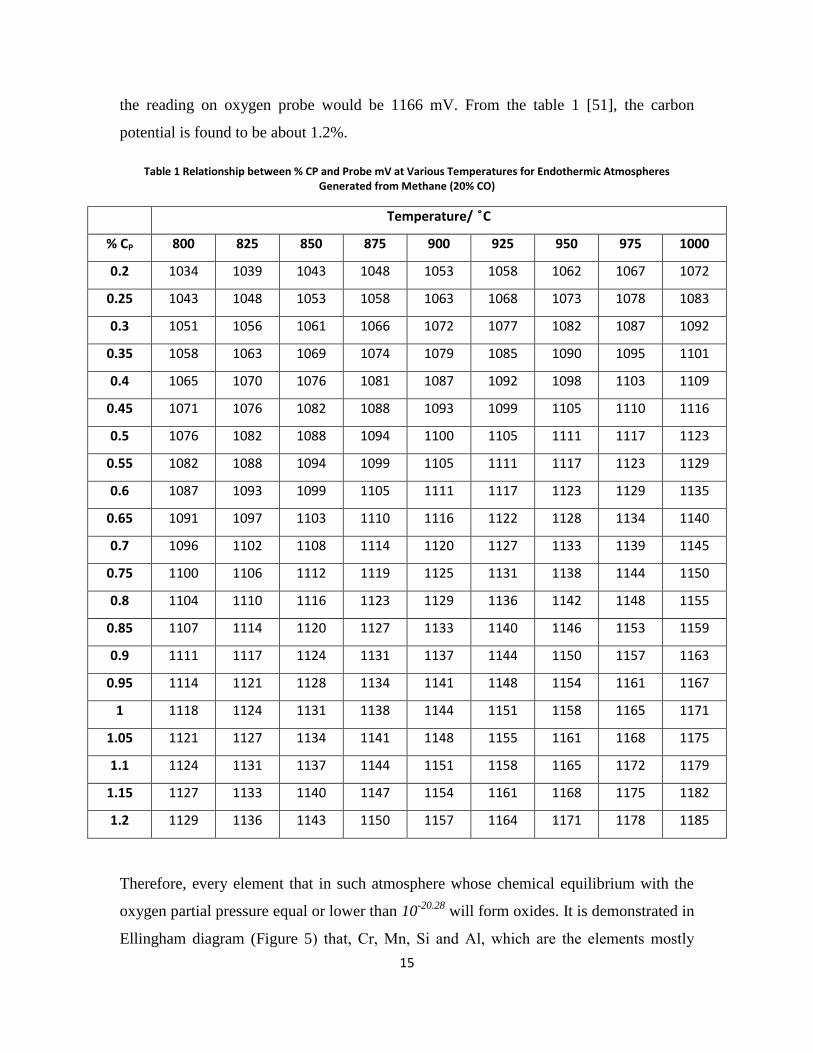
15
the reading on oxygen probe would be 1166 mV. From the table 1 [51], the carbon
potential is found to be about 1.2%.
Table 1 Relationship between % CP and Probe mV at Various Temperatures for Endothermic Atmospheres Generated from Methane (20% CO)
Temperat
% CP 800 825 850 875 900 925 950 975 1000
0.2 1034 1039 1043 1048 1053 1058 1062 1067 1072
0.25 1043 1048 1053 1058 1063 1068 1073 1078 1083
0.3 1051 1056 1061 1066 1072 1077 1082 1087 1092
0.35 1058 1063 1069 1074 1079 1085 1090 1095 1101
0.4 1065 1070 1076 1081 1087 1092 1098 1103 1109
0.45 1071 1076 1082 1088 1093 1099 1105 1110 1116
0.5 1076 1082 1088 1094 1100 1105 1111 1117 1123
0.55 1082 1088 1094 1099 1105 1111 1117 1123 1129
0.6 1087 1093 1099 1105 1111 1117 1123 1129 1135
0.65 1091 1097 1103 1110 1116 1122 1128 1134 1140
0.7 1096 1102 1108 1114 1120 1127 1133 1139 1145
0.75 1100 1106 1112 1119 1125 1131 1138 1144 1150
0.8 1104 1110 1116 1123 1129 1136 1142 1148 1155
0.85 1107 1114 1120 1127 1133 1140 1146 1153 1159
0.9 1111 1117 1124 1131 1137 1144 1150 1157 1163
0.95 1114 1121 1128 1134 1141 1148 1154 1161 1167
1 1118 1124 1131 1138 1144 1151 1158 1165 1171
1.05 1121 1127 1134 1141 1148 1155 1161 1168 1175
1.1 1124 1131 1137 1144 1151 1158 1165 1172 1179
1.15 1127 1133 1140 1147 1154 1161 1168 1175 1182
1.2 1129 1136 1143 1150 1157 1164 1171 1178 1185
Therefore, every element that in such atmosphere whose chemical equilibrium with the
oxygen partial pressure equal or lower than 10-20.28
will form oxides. It is demonstrated in
Ellingham diagram (Figure 5

16
x x x
presented at the grain boundary as the so-called intergranular oxides (IGO).
IGO has been long known to degrade carburized components, in particular, it leads to low
surface hardness and reduced component strength by depleting alloy elements in the
matrix [52]. Moreover, IGO are stress raisers and are known to act as fatigue crack
initiation sites, resulting in poor fatigue properties of the components [53, 54]. In addition,
decarburization will also occur if oxygen is present leading to a lower hardenability at the
surface [55]. However, from the above explanation of oxides formation, it has been
proven that intergranular oxide is intrinsic propensity of components treated from either
endogas or nitrogen/methanol atmosphere and barely can be prevented.

17
Figure 5 The Ellingham diagram for selected oxides [50]
2.2.3 Vacuum carburizing
Vacuum furnaces are typically utilized for heat treating precision parts with strict case
hardening specifications. It avoids the formation of metal oxides because a hydrocarbon
gas lacking oxygen is used and the furnace chamber is pumped down to a low pressure
(2-20 mbar) to remove any oxygen that may be present [56]. Vacuum carburizing was
introduced back to 1960s using methane at 500 mbar, however, it was unacceptable due

18
to the non-uniformity and heavy soot [57-61]. These problems were solved by reducing
the pressure to 2-20 mbar [62, 63] and using propane, ethylene [64] or acetylene [65].
Methane is not used any more, due to its low dissociation at this low pressure [66].
Carbon is delivered to the steel surface in vacuum carburizing via reactions such as these
[66]:
In the past, propane is the primary medium used in vacuum carburizing. However,
propane dissociation occurs before the gas comes in contact with the surface of the steel,
thus producing free carbon or soot. This uncontrolled soot formation results in poor
carbon transfer to the part and loss of up-time productivity due to the need for additional
heat treat equipment maintenance. Development work done in the past few years has
demonstrated that acetylene is a good performing gas for vacuum carburizing. This is
because the chemistry of acetylene is vastly different from that of propane or ethylene.
Dissociation of acetylene delivers two carbon atoms to the one produced by dissociation
of either propane or ethylene and avoids formation of nonreactive methane [66].
Under the high temperature, hydrocarbon gas with high decomposition rate makes the
surface of components saturate very rapidly. Oversaturation leads to carbide formation,
which should be avoided whenever possible. The only way to prevent carbide forming in
processes with high carbon transfer coefficients is to divide the process into several
boost-diffuse cycles [43]. If the carbide formation limit of the steel is exceeded, carbides
can form in the outer surface of the components become barrier for further carbon atoms
diffusion. The maximum length of carburizing boost steps is therefore given by the
carbide formation limit of the steel at process temperature. The diffusion step is carried
out until the surface carbon content has been lowered enough to attach another boost step
of reasonable duration. The process ends with a diffusion step to adjust the desired
carbon profile.

19
Compared to gas carburizing, which is controllable by measurement and adjustment of
the carbon potential, vacuum carburizing cannot be controlled by carbon potential due to
absence of thermodynamic equilibrium.
Components carburized at low pressure show no signs of internal oxidation, but other
effects are reported, including: effusion of elements, especially manganese, formation of
carbides on grain boundaries if the carburizing parameters are less than optimal, as well
as etching at austenite grain boundaries during the carburizing step [67].
2.2.4 Plasma activated and alternate atmosphere (A2A) carburizing
Oxygen-free, hydrocarbon heat treating atmospheres have been an object of industrial
and research interest for over quarter century. The early work of Kaspersma [68] and the
subsequent studies of 1-atm pressure [69, 70] or higher pressure [49], nitrogen-
hydrocarbon blends (N2-HC) have demonstrated that, due to a relatively high
thermochemical stability, acceptable reaction rates can be obtained only at temperatures
markedly higher than for the typical nitrocarburizing treatments.
To accelerate the process, bridge the gas carburizing and vacuum carburizing, eliminate
intergranular oxides, reduce capital/operational cost and promote usage of more safety
and environmental friendly atmosphere, a plasma activation and alternate atmosphere
heat treatment technology (A2A technology) has been introduced by Air Products and
Chemicals, Inc [71]. A series of gas stream-activating, cold-plasma (figure 7) injectors
have been developed at Air Products during the recent few years. The injectors [72]
comprise two high voltage electrodes positioned across the stream of gas directed from
gas supply into heat treating furnace. A DC or AC source-powered electric discharge
between these electrodes ionizes, partially dissociates and converts the gas molecules on
their way into the furnace. In contrast to the conventional, low-pressure plasma ion
furnaces, metal load is not an electrode. A high-voltage/low-amperage, low power supply
is used (typically below 2 kW) which forms a cold discharge combining self-pulsed, non-
equilibrium arc and abnormal glow plasma modes [73] inside the passing gas stream. The
low thermal energy of the discharge assures long electrode lifetime and prevents gas
pyrolysis and sooting. The plasma injector can be easily retrofitted to various types of the

20
conventional, radiant tube or electrically heated and 1-atm pressure furnaces in order to
carry out carburizing, carbonitriding, neutral carbon annealing, as well as
nitrocarburizing operations falling into a relatively low temperature range [74]. So far,
this technology has been tested on carburizing of low-alloy and stainless steels [74], low-
and high-temperature nitriding of carbon, alloy and stainless steels [75].
Figure 6 Non-thermal (cold) plasma and thermal plasma [75].
During A2A carburizing, instead of using endothermic gas in atmosphere furnace, the
alternate nitrogen-hydrocarbons blend is used. Through the cold plasma, hydrocarbon
could be activated into active species, numerous long- and short-lived, equilibrium and
non-equilibrium gas products are formed in the N2-hydrocarbons blend passing the
discharge. As shown in figure 8, carbon flux obtained on low alloy steel AISI 1010 under
activated N2-4.5% CH4 carburizing is more than twice on the same steel under only
thermal treatment.

21
Figure 7 Thermal and plasma carburizing using N2-4.5% CH4 gas blend (AISI 1010 steel) [74]
Comparison between activated hydrocarbon treated and endo-gas treated AISI 8620 is
demonstrated in Figure 9 [74], the endo-carburized part revealed a clearly developed
intergranular oxidation zone. The enrichment of the oxidized boundaries with Mn, Cr and
Si is observed and agrees with the metal oxides found from Ellingham diagram (figure 5)
in previous sections.
The control of N2-NC atmosphere is more challenging than controlling equilibrium endo-
gas by carbon potential. Normally, flowrate and concentration of the process gas are used
to control the non-equilibrium N2-NC blend, the same approach as vacuum atmosphere.
The development of carburizing recipes may require more trials, and the cycle may
include carbon boost and diffuse with necessitate real-time, dynamic corrections to the
processing parameters using a feedback loop. And many in situ sensors have been
developed over the years to address the difficulties of process control in non-equilibrium
as well as equilibrium atmospheres by testing the electrical resistance of carburized
samples which directly related to carbon concentration [51, 76-78].

22
Figure 8 SEM-SEI-EDS cross-sectional images of subsurface regions of AISI 8620 after completed carburizing, quenching and tempering cycle. Etched in 2% Nital. (a) SEI image of endo-atmosphere carburized part; (b-c) Mn and
Cr EDS-maps of area (a),(d) higher magnification of area (a), (e) Si EDS-map of area (d); and (f) SEI image of AC-plasma carburized part.
23
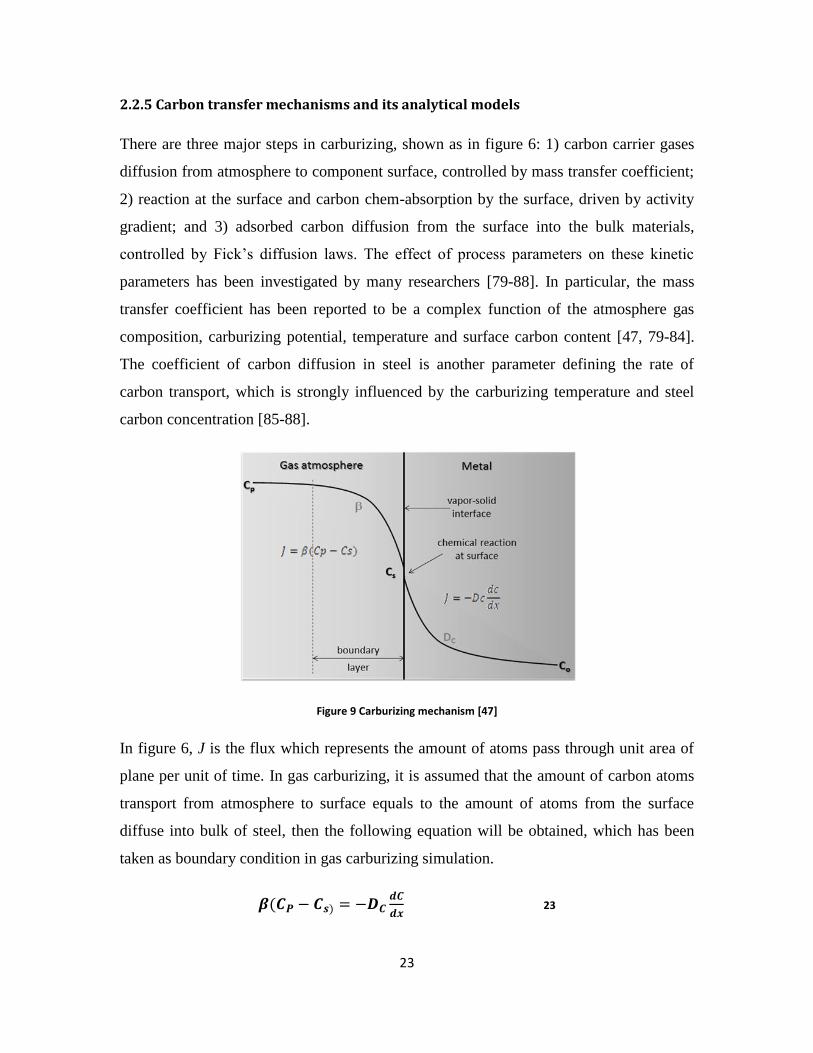
2.2.5 Carbon transfer mechanisms and its analytical models
There are three major steps in carburizing, shown as in figure 6: 1) carbon carrier gases
diffusion from atmosphere to component surface, controlled by mass transfer coefficient;
2) reaction at the surface and carbon chem-absorption by the surface, driven by activity
gradient; and 3) adsorbed carbon diffusion from the surface into the bulk materials,
F k’ k
parameters has been investigated by many researchers [79-88]. In particular, the mass
transfer coefficient has been reported to be a complex function of the atmosphere gas
composition, carburizing potential, temperature and surface carbon content [47, 79-84].
The coefficient of carbon diffusion in steel is another parameter defining the rate of
carbon transport, which is strongly influenced by the carburizing temperature and steel
carbon concentration [85-88].
Figure 9 Carburizing mechanism [47]
In figure 6, J is the flux which represents the amount of atoms pass through unit area of
plane per unit of time. In gas carburizing, it is assumed that the amount of carbon atoms
transport from atmosphere to surface equals to the amount of atoms from the surface
diffuse into bulk of steel, then the following equation will be obtained, which has been
taken as boundary condition in gas carburizing simulation.
23

24
In the above equation, β is mass transfer coefficient, CP is carbon potential of atmosphere,
CS is surface carbon concentration, DC is diffusion coefficient of carbon in steel, C is
carbon concentration and x is the depth from the surface.
However, this equation is not applicable in low pressure and plasma carburizing due to
the intrinsic non-equilibrium of the process. In this case, flux has been used as boundary
condition [89]. It can be measured by either weight gain after vacuum carburizing, or
calculated from direct integration of carbon concentration profile [47],
24
∫
25
where m is the weight change after carburizing, A is the area of treated surface, t is time
and C(x,t) is the carbon concentration as a function of depth and time.
Nevertheless, during vacuum carburizing, the hydrocarbon decomposition rate is so fast
that the surface carbon concentration will build up and excess the austenite solubility
easily. Once the austenite solubility is reached, carbides will start to form and block
further carbon atoms absorption. If the model does not take into account the phase
transformation, the carbon concentration calculation of following segments would be
influenced and deviates from the reality.
F k’ surface
curvature condition,
(
)
26
where u=-1 for convex surface, u=0 for plane surface and u=1 for concave surface, r is
radius of the curvature.
2.2.6 Numerical Simulation
Since an analytical solution to carbon diffusion in steel with the flux balance boundary
condition is not available for concentration dependent diffusivity, the carburizing
processes need to be modeled numerically. The governing partial differential equation

25
with the corresponding boundary condition can be transformed into a set of finite
difference equations and solved numerically [47].
References
[1] N.I. Kardonina, A.S. Yurovskikh and A. S. Kolpakov, 2011, "Transformations in the
Fe – N System," Metal Science and Heat Treatment, 52(9) pp. 457-467.
[2] Jossart, J., "Endothermic Gas Production Overview," Atmosphere Engineering
Company,.
[3] Bernard, W. J., Poor, R. P., Barbee, G. W., 2012, "Surface Treatment of Metallic
Articales in an Atmospheric Furnace," 12/085,209(US 8,293167 B2) .
[4] The Linde Group, "The principles of carburizing and carbonitriding,"
[5] Berns, H., 2007, "Advantages in Solution Nitriding of Stainless Steels," Metal
Science and Heat Treatment, 49(11) pp. 578-580.
[6] Berns, H., 2003, "Case Hardening of Stainless Steel using Nitrogen," Industrial
Heating, 70(5) pp. 47.
[7] Tschiptschin, A., 2002, "Predicting Microstructure Development during
HighTemperature Nitriding of Martensitic Stainless SteelsUsing Thermodynamic
Modeling," Materials Research (São Carlos, São Paulo, Brazil), 5(3) pp. 257-262.
[8] D. M. Larinin, L. M. Kleiner and A. A. Shatsov, 2008, "High-Temperature Nitriding
of Low-Carbon Martensitic Steel 12Kh2G2NMFB in Nontoxic Salt Melts," Metal
Science and Heat Treatment, 50(9) pp. 502-507.
[9] H.W. Lee, J.H. Kong, D.J. Lee and et al., 2009, "A Study on High Temperature Gas
Nitriding and Tempering Heat Treatment in 17Cr-1Ni-0.5C," Materials & Design, 30(5)
pp. 1691-1696.
26
[10] M. Fattah, F. M., 2010, "Comparison of Ferritic and Austenitic Plasma Nitriding
and Nitrocarburizing Behavior of AISI 4140 Low Alloy Steel," Materials & Design, 31(8)
pp. 3915-3921.
[11] Yasumaru, N., 1992, "Formation of Austenite and Martensite in Surface Layer of
Pure Iron with Ion Nitriding," Materials Transactions, JIM, 33(1) pp. 7-10.
[12] A. Saha Podder, H.K.D.H. Bhadeshia, 2010, "Thermal Stability of Austenite
Retained in Bainitic Steels," Materials Science & Engineering.A, Structural Materials :
Properties, Microstructure and Processing, 527(7-8) pp. 2121-2128.
[13] Zrník, J., 2006, "Retained Austenite Stability Investigation in TRIP Steel using
Neutron Diffraction," Materials Science & Engineering.A, Structural Materials :
Properties, Microstructure and Processing, 437(1) pp. 114-119.
[14] Herring, D., 2005, "A Discussion of Retained Austenite," Industrial Heating, 72(3)
pp. 14.
[15] Kokosza, A., 2005, "Evaluation of Retained Austenite Stability in Heat Treated
Cold Work Tool Steel," Journal of Materials Processing Technology, 162-163pp. 327-
331.
[16] Van Der Zwaag, S., 2001, "Stabilization Mechanisms of Retained Austenite in
Transformation-Induced Plasticity Steel," Metallurgical and Materials Transactions.A,
Physical Metallurgy and Materials Science, 32(6) pp. 1527-1539.
[17] Ferrer, J. P., 2006, "Austenite Retention in Low Al/Si Multiphase Steels," Scripta
Materialia, 55(5) pp. 441-443.
[18] De Moor, E., 2008, "Effect of Retained Austenite Stabilized Via Quench and
Partitioning on the Strain Hardening of Martensitic Steels," Metallurgical and Materials
Transactions.A, Physical Metallurgy and Materials Science, 39(11) pp. 2586-2595.
27
[19] Savchenkova, S., 2005, "Effect of Preliminary Heat Treatment on the Stability of
Austenite in Steel 08Kh15N5D2T," Metal Science and Heat Treatment, 47(5) pp. 232-
234.
[20] Paul Stratton, Cord Henrik Surberg, 2009, "Retained Austenite Stabilization: In
Carburized SAE 8620 Alloy Steel: Case-Hardened Components made of Low-Alloy
Steels often have Retained Austenite in the Case After Quenching, which can be
Transformed to Martensite by further Cooling of the Component, Even if the Austenite
Stabilizes during Aging at Room Temperature," Heat Treating Progress, 9(2) pp. 25.
[21] M.J. Van Genderen, A. Böttger and E.J. Mittemeijer, 1997, "Format Α ″ I
Nitride in FeN Martensite: Nitrogen Vacancies, Iron-Atom Displacements, and Misfit-
Strain Energy," Metallurgical and Materials Transactions.A, Physical Metallurgy and
Materials Science, 28(1) pp. 63-77.
[22] A. Van Gent, E.C. Van Doorn and E.J. Mittmeijer, 1985, "Crystallography and
Tempering Behavior of Iron-Nitrogen Martensite," Metallurgical Transactions.A,
Physical Metallurgy and Materials Science, 16(8) pp. 1371-1384.
[23] Liu Cheng, E. J. M., 1990, "The Tempering of Iron-Nitrogen Martensite;
Dilatometric and Calorimetric Analysis," Metallurgical Transactions.A, Physical
Metallurgy and Materials Science, 21(1) pp. 13-26.
[24] Liu Cheng, N.M. van der Pers and A. Böttger, 1990, "Lattice Changes of Iron-
Nitrogen Martensite on Aging at Room Temperature," Metallurgical Transactions.A,
Physical Metallurgy and Materials Science, 21(11) pp. 2857-2867.
[25] I. FALL, J. -. R. G., 1996, "Mössbauer Spectroscopy Study of the Aging and
Tempering of High Nitrogen Quenched Fe-N Alloys: Kinetics of Formation of Fe16N2
Nitride by Interstitial Ordering in Martensite," Metallurgical and Materials
Transactions.A, Physical Metallurgy and Materials Science, 27(8) pp. 2160-2177.

28
[26] Dongling Jiao, C.P. Luo and Jiangwen Liu, 2007, "Isothermal Transformation of
High-Nitrogen Austenite," Scripta Materialia, 56(7) pp. 613-616.
[27] V.G. Gavdijuk, V.M. Nadutov and K. Ullakko, 1991, "Low Temperature Ageing of
Fe-N Martensite," Scripta Metallurgica Et Materialia, 25(4) pp. 905-910.
[28] Lee, T., and Tae-Ho Lee, Chang-Seok Oh, Min-Ku Lee and et. al, 2010, "Nitride
Precipitation in Salt-Bath Nitrided Interstitial-Free Steel," Materials Characterization,
61(10) pp. 975-981.
[29] Gavriljuk, V. G., 2006, "Austenite and Martensite in Nitrogen-, Carbon- and
Hydrogen-Containing Iron Alloys: Similarities and Differences," Materials Science &
Engineering.A, Structural Materials : Properties, Microstructure and Processing, 438-
440pp. 75-79.
[30] Genderen, M.J. van, A. Böttger and E.J. Mittemeijer, 1992, "Ternary iron-carbon-
nitrogen martensitic alloys: as-quenched state and development of transition
precipitates," Gilbert. R. Speich Symposium Proceedings, Iron & Steel Society, pp. 29-38.
[31] A. Böttger, P.J. Warren, G.D.W. Smith, M.J. van Genderen, S.J. Sijbrandij, 1999,
"Tempering of iron-carbon-nitrogen martensites: (re)distribution of interstitial atoms,"
Materials Science Forum, 318-320, pp. 103-108.
[32] Genderen, M.J. van, A.J. Böttger and E.J. Mittemeijer, 1992, "First Stage of
Precipitation in Iron-Carbon-Nitrogen Martensites; Diffraction Analysis using
Synchrotron Radiation," Scripta Metallurgica Et Materialia, 26(6) pp. 883-888.
[33] Liu Cheng, A. Böttger and E.J. Mittemeijer, 1990, "The initial stages of tempering
of iron-carbon-nitrogen martensite," Proc. Sec. Int. Conf. on High Nitrogen Steels, H. W.
G. Stein, ed. Stahleisen, Düsseldorf, Aachen, Germany, pp. 52-56.
[34] Liu Cheng, A. Böttger and E.J. Mittemeijer, 1992, "Tempering of Iron-Carbon-
Nitrogen Martensites," Metallurgical Transactions.A, Physical Metallurgy and Materials
Science, 23(4) pp. 1129-1145.

29
[35] P. Ferguson and K.H. Jack, 1984, Scripta Metallurgica, 18pp. 1189.
[36] I. Wierszyllowski, L. M., 1988, Proceeding of International Conference on High
Nitrogen Steels, Institute of Metals, London, Lille, France, pp. 338.
[37] Liu Cheng, A. Böttger and E.J. Mittemeijer, 1991, "The Tempering of FeNiN
Martensite," Metallurgical Transactions.A, Physical Metallurgy and Materials Science,
22(9) pp. 1945-1956.
[38] Bell, T., 1968, "Martensite Transformation Start Temperature in Iron-Nitrogen
Alloys," The Journal of the Iron and Steel Institute, 206(10) pp. 1017-1021.
[39] Yang, M., 2012, "Nitriding – Fundamentals, Modeling and Process Optimization,"
Dissertation, Worcester Polytechnic Insitute.
[40] Andersson, J. O., and et al., 2002, "THERMO-CALC & DICTRA, Computational
Tools for Materials Science," Calphad, 26(2) pp. 273-312.
[41] Lehrer, E., 1930, "The Equilibrium, Iron-Hydrogen-Amnonia," Zeitschrift Fuer
Elektrochemie Und Angewandte Physikalische Chemie, 36pp. 383.
[42] Maldzinski, L., and P.Z., K., L., 1986, "Equilibrium between NH3/H2 and Nitrogen
in Phase of Iron-Nitrogen System," 12pp. 645-649.
[43] The Linde Group, "Furnace Atmospheres No. 6: Low pressure carburising and high
pressure gas quenching."
[44] Herring, D., 2012, "All about Carburizing," .
[45] Grabke, H. J., 1990, "Carburising Kinetics (in Germany)," Harterei-Technische
Mitteilungen, 45.pp. 110-118.
[46] The Linde Group, "Furnace Atmosphere No. 1 Gas Carburizing and
Carbonitriding,"

30
[47] Karabelchtchikova, O., 2007, "Fundamentals of Mass Transfer in Gas Carburizing,"
Dissertation, Worcester Polytechnic Institute.
[48] Holm, T., "Furnace atmospheres 1: Gas Carburizing and Carbonitriding," AGA AB,
[49] Gianotti, E., 2006, "Hyper Baric Carburising Process," La Metallurgia Italiana, 7(8)
pp. 41-46.
[50] Gaskell, D.R., 2008, "Introduction to the Thermodynamics of Materials - 5th
Edition," Taylor & Francis Group, New York, NY, .
[51] Eurothermo, 2008, "Carbon Probe Instruction Manual," pp. 28.
[52] Naito, T., Ueda, H., and Kikuchi, M., 1984, "Fatigue Behavior of Carburized Steel
with Internal Oxides and Nonmartensitic Microstructure Near the Surface," Metall. Trans.
A, 15(7) pp. 1431-1436.
[53] Krauss, G., 1995, "Microstructure and Performance of Carburized Steel. Part IV:
Oxidation and Inclusion," Adv. Mater. Process, 148(6) pp. 36Z-36DD.
[54] Dowling, W. E., Donlon, W. J., and Coupple, W. B., 1995, "Fatigue Behaviour of
Two Carburized Low Alloy Steel," Proceeding of the second international conference on
carburizing and nitriding with atmosphere, Cleveland, OH, J. Grosch, J. Morral and M.
Schneider, eds. pp. 55.
[55] Colombo, R. L., Fusani, F., and Lamberto, M., 1983, "On the Soft Layer in
Carburized Gears," Journal of Heat Treating, 3pp. 126-128.
[56] Poor, R. P., Barbee, W., and Brug, J. E., 2007, "Furnace for Vacuum Carburizing
with Unsaturated Aromatic Hydrocarbons," 11/404,459(US 7,267,793 B2) pp. 1-14.
[57] Limque, F., and Bless, F., 1980, "Erfahrungen Mit Überdruck-Gasabschrecken
Sowie Aufkohlen in Vakuumöfen," Härterei-Techn. Mitt., 35(5) pp. 238-244.

31
[58] Chatterjee-Fischer, R., 1985, "Überblick Über Die Möglichkeiten Zur Verkürzung
Der Aufkohlungsdauer," Härterei-Techn. Mitt., 40(1) pp. 7-11.
[59] Eysell, F. W., and Heumüller, E., 1979, "Entwicklungstendenzen Auf Dem Gebiet
Der Unterdruckaufkohlung," Härterei-Techn. Mitt., 34(2) pp. 83-89.
[60] Chatterjee-Fischer, R., 1982, "Verfahrenstechnische Möglichkeiten einer
randoxidationsarmen (-freien) Einsatzhärtun," FVA-Nr.14/II Abschlussbericht, FVA
Forschungsheft 110, Forschungsvereinigung Antriebstechnike. V.
[61] Luiten, C. H., Limque, F., and Bless, F., 1979, "Aufkohlen in Vakuum-Öfen,"
Härterei- Techn. Mitt., 34(6) pp. 253-259.
[62] Pourprix, Y., and Nandot, J., 1985, "La Cémentation Sous Basse Pression: Un
D’ é L q D L L D’ D’ "
Traitement Thermique, 197pp. 51-58.
[63] Altena, H., 1998, "Niederdruck-Aufkohlung Mit Hochdruckgasabschreckung,"
Härterei-Techn. Mitt., 53(2) pp. 93-101.
[64] Sugiyama, M., Ishikawa, K., and Iwata, H., 1998, "Using Acetylen for Superior
Performance Vacuum Carburising," Proceedings of 18th ASM Heat Treating Society
Conference, Anonymous Rosemont, Illinois, pp. 49-56.
[65] Hayaud, C., Jacquot, P., Baravian, G., 1997, "Caractérisation Par Spectrométrie De
D L’ è D D’ F D é B P "
Traitement Thermique, pp. 99-107.
[66] Davis, J.R., 2002, "Surface Hardening of Steels: Understanding the Basics," ASM
International, Materials Park, OH, pp. 349-91.
[67] Clausen, B., Hoffmann, F., and Mayr, P., 2003, "Randschichtschädigung infolge
Niederdruckaufkohlung," Europäische Tagung Das Einsatzhärten, SVW/ASTT
Schweizer Verband für die Wärmebehandlung der Werkstoffe, Zürich, 3-4, pp. 149-172.

32
[68] Kaspersma, J. H., and Shay, R. H., 1982, "Carburization and Gas Reactions of
Hydrocarbon-Nitrogen Mixtures at 850oC and 925oC," Metallurgical Transactions B,
13Bpp. 267-273.
[69] Estrin, B. M., and et al, 1984, "Carburizing in a Nitrogen-Based Mixture with
Additives of Pure Methane," Metallovedenie i Termicheskaya Obrabotka Metallov, 5pp.
26-29.
[70] Connery, K., and Ho, S., 2007, "Optimization of Oxygen-free Heat Treating,"
Proceeding of the 24th ASM Heat Treating Society Conference, Detroit, MI, pp. 17-19.
[71] Wang, X., Zurecki, Z., and Sisson Jr., R. D., 2012, "Development of Nitrogen-
Hydrocarbon Atmospheric Carburizing and Process Control Methods," Journal of
Materials Engineering and Performance, DOI: 10.1007/s11665-012-0294-0.
[72] Zurecki, Z., 2007, "Heat Treating Atmosphere Activation," Proceeding of the 24th
ASM Heat Treating Society Conference, Detroit, MI, .
[73] Fridman, A., 2008, "Plasma Chemistry," Cambridge University Press, New York,
pp. 177-208.
[74] Zurecki, Z., and Wang, X., 2009, "Atmosphere carburizing using electric discharge-
activated nitrogen-natural gas mixtures," Heat Treating Conference and Exposition 2009,
Indianapolis, IN .
[75] Wang, X., 2011, "Activated Atmosphere Case Hardening of Steels," Dissertation,
Worcester Polytechnic Institute.
[76] Beuret, P., (US 5,064,620) .
[77] Ghedid, L. G., and et al, (US 7,068,054) .
[78] Winter, K., 2008, "A Guide to Better Atmosphere Carburizing using BothDynamic
and Equilibrium-Based Measurements," Industrial Heating, pp. 91-94.

33
[79] Stolar, P., and Prenosil, B., 1984, "Kinetics of Transfer of Carbon from Carburizing
and Carbonitriding Atmospheres," Metallic Materials (English Translation of Kovove
Materialy), 22(5) pp. 348-353.
[80] Rimmer K., Schwarz-Bergkampf E., and Wunning J., 1975, "Surface Reaction Rate
in Gas Carburizing," Haerterei-Technische Mitteilungen, 30(3) pp. 152-160.
[81] Munts, V. A., and Baskatov, A. P., 1980, "Rate of Carburizing of Steel," Metal
Science and Heat Treatment (English Translation of Metallovedenie i Termicheskaya
Obrabotka Metallov, 22(5-6) pp. 358-360.
[82] Munts, V. A., and Baskatov, A. P., 1983, "Mass Exchange in Carburization and
Decarburization of Steel," Metal Science and Heat Treatment (English Translation of
Metallovedenie i Termicheskaya Obrabotka Metallov, 25(1-2) pp. 98-102.
[83] Wunning, J., 1968, "Advances in Gas Carburizing Technique," Haerterei-
Technische Mitteilungen, 23(3) pp. 101-109.
[84] Moiseev, B. A., Brunzel, Y. M., and Shvartsman, L. A., 1979, "Kinetics of
Carburizing in an Endothermal Atmosphere," Metal Science and Heat Treatment (English
Translation of Metallovedenie i Termicheskaya Obrabotka Metallov), 21(5-6) pp. 437-
442.
[85] Goldstein, J. I., and Moren, A. E., 1978, "Diffusion Modeling of the Carburization
Process," Metallurgical and Materials Transactions A, 9(11) pp. 1515-1525.
[86] Totten, G.E., and Howes, M.A.H., 1997, "Steel Heat Treatment Handbook,"
Marcell Dekker, Inc., New York, NY, .
[87] Agren, J., 1986, "Revised Expression for the Diffusivity of Carbon in Binary Fe-C
Austenite," Scripta Metallurgica, 20(11) pp. 1507-1510.
[88] Asimow, R. M., 1964, "Analysis of the Variation of the Diffusion Constant of
Carbon in Austenite with Concentration," Transactions of AIME, 230(3) pp. 611-613.

34
[89] Kula, P., 2005, "Vacuum Carburizing—process Optimization," Journal of Materials
Processing Technology, 164pp. 876-881.

35
CHAPTER III. PUBLICATIONS
This section summarizes the results for the theoretical work and experimental
investigations. The section is structured as a collection of papers.
Paper #1: Nitrogen diluted ammonia atmosphere subcritical
temperature nitriding on AISI 4140 steel: microstructure evolution,
layer growth kinetics and cryogenic treatment (to be submitted to Surface
and Coatings Technology)
Yingying Wei1, Zbigniew Zurecki
2, Richard D. Sisson, Jr.
1
1. Center for Heat Treating Excellence, Worcester Polytechnic Institute, Worcester, MA, USA
2. Metal Processing Center of Excellence, Merchant ases, Air Products and Chemicals, Inc.,
Allentown, PA, USA
Abstract
An alternative, subcritical-temperature austenitic nitriding process is evaluated in this
paper with the purpose of accelerating the treatment cycle, optimizing the hardness
gradient in nitrided layers and seeking improved process control. Comparing to the
conventional nitriding processed at ferritic temperature and followed by slow cooling, the
alternative process includes nitriding at elevated austenitic temperature in nitrogen-dilute
ammonia atmospheres and cryogenic quenching in liquefied nitrogen. This paper presents
results of experimental work on low alloy steel I I
en the nitriding
and cooling conditions as well as phase transformations. Thermodynamic models were
used to design the process conditions and assist in the microstructural interpretation of
the nitrided layers produced. Results were verified using the SEM, EPMA, and
microhardness measurements. It is observed that in subcritical temperature austenitic
nitriding, nitrogen absorption rate is accelerated, a transitional nitrogen-austenite sublayer
is formed between compound layer and diffusion zone, meanwhile, the hardness in
diffusion zone increases with the cryogenic soaking time ranging from 1 hour to 48 hours,
suggesting that more mechanisms are operational than the classic nitrogen martensitic

36
transformation. The kinetics of interstitial diffusion and layer growth in non-equilibrium
gas nitriding atmosphere are also discussed.
1. Introduction
During recent decades, gas nitriding has become increasingly popular as a surface
hardening method used in the steel processing industry. Conventionally, gas nitriding of
low-alloy steels (ferritic-phase nitriding) takes place in the temperature range of 495-
565 °C, shown as lower shading area in figure 1. Rapid quenching is not required,
preventing large dimensional distortion which is normally produced by the classic,
carbon austenite-martensite phase transformation. However, due to the limited nitrogen
solubility in ferrite [1] and low diffusion rates at low process temperatures, the nitrogen
hardened layer is relatively shallow, even for the treatments lasting many hours or days.
Also, the nitrogen concentration rapidly decreases from the surface to the core which
results in an undesired, sharp hardness and stress gradient. In this paper, a modified
method is explored for accelerating nitriding treatment and optimizing the hardness
distribution from the surface layers to the core. This method involves increasing the
nitriding temperature to the sub-critical temperature: above the austenite transformation
temperature in the system with nitrogen but below the eutectoid temperature in the
system without nitrogen, shown as top shading area in figure 1, combined with quenching
and further cooling to cryogenic temperatures. The core of the parts treated according to
the evaluated method is expected to retain its original microstructure and properties,
whereas the surface layer, due to the nitrogen stabilized austenite, may comprises the
conventional, hard compound layer (γ’- Fe4N/ε-Fe2-3N) and, an additional, somewhat
softer transition layer of nitrogen-martensite with a possible fraction of retained nitrogen-
austenite, as well as diffusion zone.
37
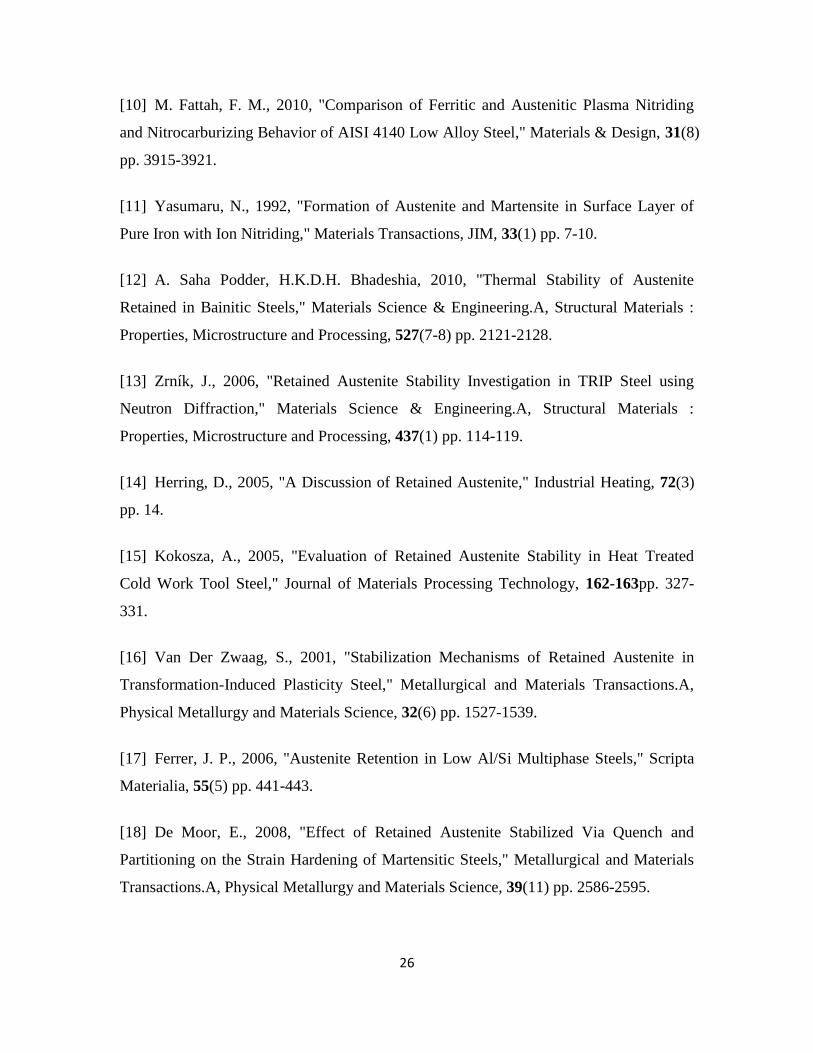
Figure 1 Temperature ranges for ferritic (bottom shade) and subcritical austenitic (top
shade) nitriding. Dashed lines: Fe-C binary phase diagram; Solid lines: Fe-C isopleth
% α γ ε θ γ’ F 2-3N, cementite and Fe4N,
respectively and indicate the phase regions of Fe-C isopleth with 1% nitrogen. generated
by Thermo-Calc.
Fe-N austenite has been investigated by several authors. Fattah [2] compared corrosive
properties of steel after plasma ferritic- and austenitic-nitriding followed with a slow
cooling. Yasumaru [3] examined the effects of nitriding at three different temperatures
and water quenching on pure iron. Most of microstructural evolution during aging and
tempering of cryogenically quenched Fe-N martensite was analyzed using pure iron as
the starting material [2, 4-6]. References published to date offer little on the physical
metallurgy of Fe-N austenite formed in the popular industrial structural steels during the
subcritical temperature nitriding and their transformation products in the subsequent
cryogenic treatments. Thus, the further examination of this area is technologically
justified.
α+γ
γ
α+γ+θ α+γ+ε
γ+θ
α+γ+γ’ α+γ’

38
This proposed method utilizes nitrogen diluted ammonia instead of traditional pure
ammonia or partially dissociated ammonia, from the economic and ecological point of
view. Diluting ammonia with second component in the atmosphere came into use about
50-60 years ago [7, 8]. The utility of nitrogen gas is due to its cheaper cost compare to
ammonia and removal of ammonia dissociator. However, the utilization and atmosphere
control is seldom investigated, a few of which are conducted by Sorokin [7], Maldzinski
[9] and Michalski [10].
The purpose of cryogenic quenching and soaking in liquid nitrogen (LIN) is to promote
the transformation of the nitrogen-formed austenite into nitrogen-formed martensite.
Considering the martensite transformation starting point (Ms), nitrogen stabilizes
austenite more effectively than carbon. Reference [5] reported Ms to be only 120K for
Fe-2.75 wt.%N alloy. When nitrogen content exceeds about 2.2 wt.%, the N-austenite is
stable at room temperature due to its Ms point located below the room temperature [3,
11]. In this view, a post-nitriding treatment involving cryogenic quenching and soaking
appears to be advisable for transforming austenite to martensite.
2. Experimental procedures
AISI 4140 steel, characterized by high hardenability, was selected as the test materials.
The composition of 4140 is listed in table 1.
Table 1 Composition of Low-alloy Steel Tested
C Cr Fe Mn Mo P S Si
AISI 4140 minimum 0.38 0.8 Bal. 0.75 0.15 0 0 0.15
maximum 0.43 1.1 Bal. 1 0.25 0.035 0.04 0.35
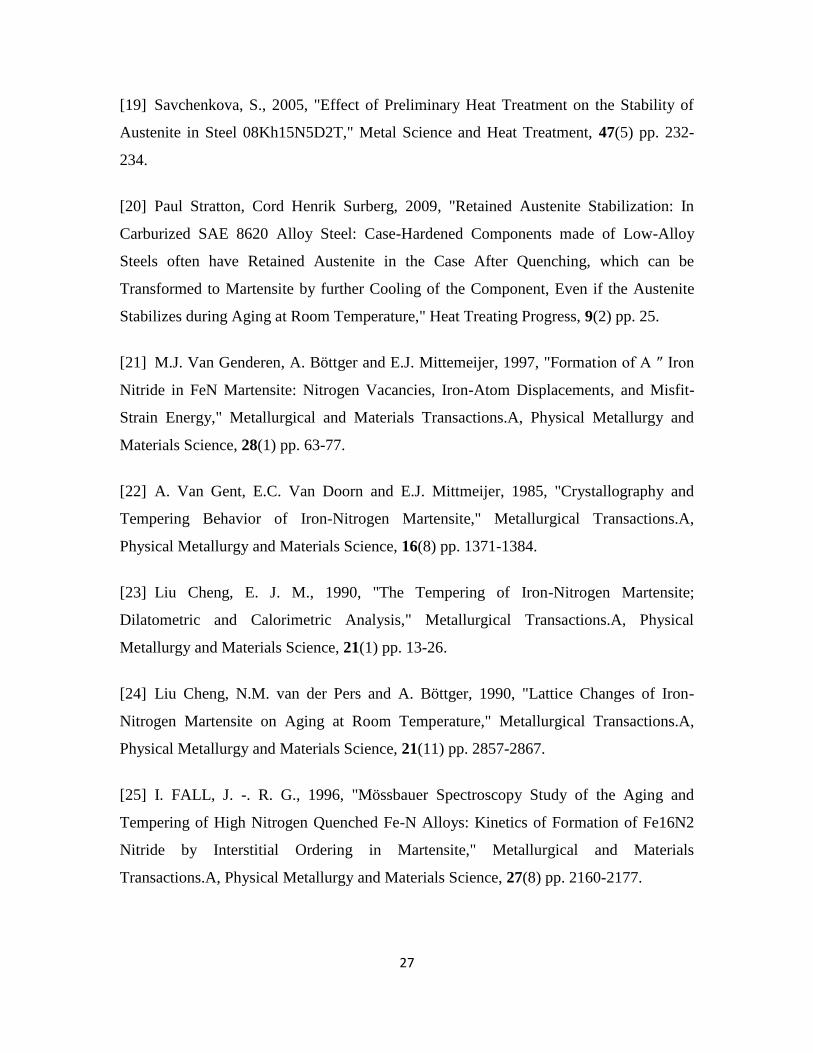
Material was processed in the sequence illustrated in figure 2: normalizing, rough
machining, austenitizing, oil and LIN quenching, tempering and oil quenching, finish
machining, nitriding, and finish cooling of nitrided samples in three different ways.
Ferritic nitriding (FN) at 525°C and austenitic nitriding (AN) at 610°C lasted 4 hours in
N2-diluted 25% NH3 atmosphere. The three finish cooling paths examined were: (a) slow
39
cooling inside furnace, (b) fast cooling in liquid nitrogen bath (-195oC) and holding for 1
hour (LIN 1 hr), as well as (c) fast cooling in liquid nitrogen combined with holding for
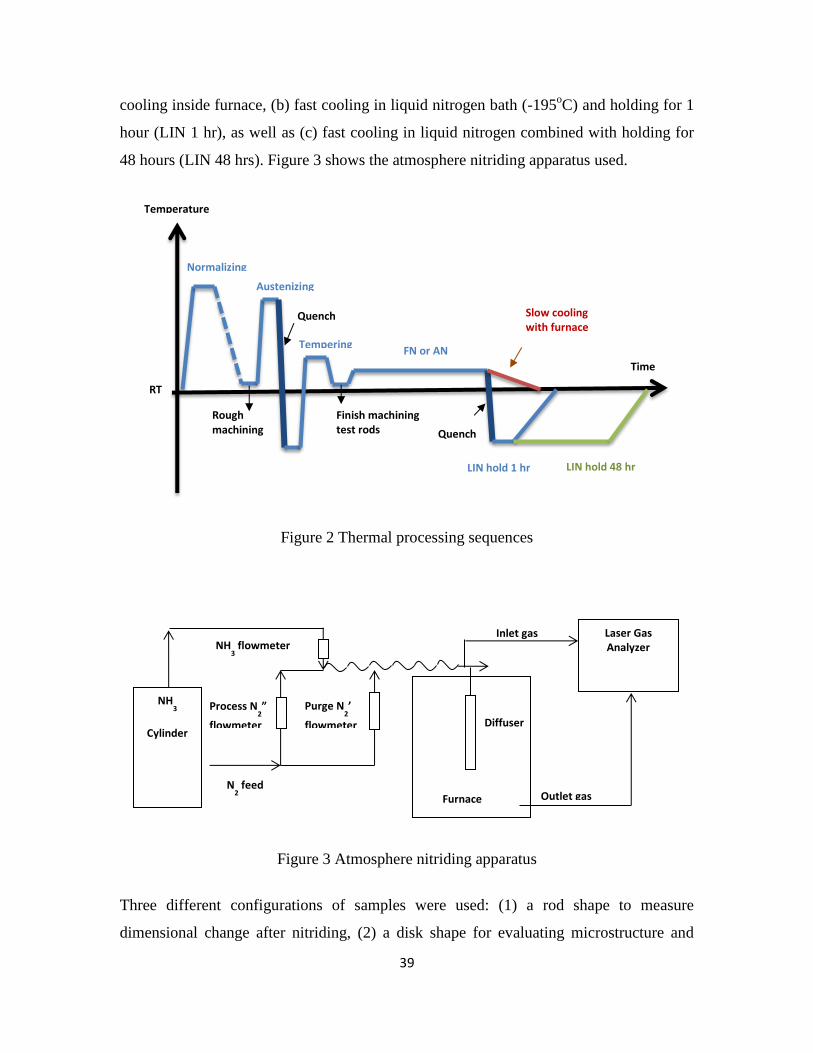
48 hours (LIN 48 hrs). Figure 3 shows the atmosphere nitriding apparatus used.
Figure 2 Thermal processing sequences
Figure 3 Atmosphere nitriding apparatus
Three different configurations of samples were used: (1) a rod shape to measure
dimensional change after nitriding, (2) a disk shape for evaluating microstructure and
Normalizing
Austenizing
FN or AN Tempering
LIN hold 1 hr LIN hold 48 hr
Slow cooling with furnace
Rough machining
test rods
Finish machining
test rods
Time
Temperature
RT
Quench
Quench
NH
3
Cylinder
Laser Gas Analyzer NH
3 flowmeter
N2 feed
Process N2”
flowmeter
Purge N2’
flowmeter
Furnace
Diffuser
Outlet gas
Inlet gas

40
hardness, and (3) flat thin coupons to measure weight gain after nitriding. Nitrided disks
were etched in 2% Nital. OM ZEISS IM35, SEM JEOL JSM-7000F, Oxford energy
dispersive x-ray spectroscope and JEOL Superprobe JXA-8900R were used for
microstructure and concentration profile analysis, while microhardness profiling was
carried out on Shimadzu HMV-2000. The dimensional stability of liquid nitrogen
quenched and soaked components has been reported in reference [12].
3. Results
1.1 Microstructure and nitrogen concentration profile
Figure 4 shows the optical and SEM micrographs of samples processed along three
different paths. After the conventional ferritic nitriding (figure 4(a) and (b)), the hardened
case is composed of compound layer and diffusion zone. The austenitic nitriding results
“ ”
transition layer, that appears dark on the samples cooled with the furnace but bright on
the samples quenched in liquid nitrogen, and the inner diffusion zone. The white layer
thickness increases from 10 m to 30 m as the nitriding temperature is increased from
the ferritic to the austenitic range, indicating that the nitrogen flux into the metal core is
larger due to the larger diffusion rate at elevated temperature.

41
Figure 4: Optical and secondary images of cross sections of ferritic and austenitic nitrided
samples. (a and b): Ferritic nitriding and cooling with furnace. (c and d): Austenitic
nitriding and cooling with furnace. (e and f): Austenitic nitriding and LIN soaking 1 hr.
Etched in 2% Nital.
The nitrogen concentration profiles for the FN and AN, both concluded with the slow
furnace cooling, as well as the profiles for AN then quenched and soaked in LIN for 1
hour are presented in figure 5. As expected, the nitrogen profiles of AN samples are
significantly broader than for the FN treatment.

42
Figure 5 Nitrogen concentration profiles for ferritic nitriding (FN) and cooling with
furnace, austenitic nitriding (AN) and cooling with furnace, as well as austenitic nitriding
(AN) and quenched in LIN bath;
Figure 6 illustrates that three major phases dominates three layers respectively at 610oC.
The outmost white layer, whose concentration is between 4 wt.%-4.5 wt.%, comprises of
ε and minor autenite. The transition layer, the second layer seen in figure 4 (c-f),
whose concentration is from 2 wt.%-2.3 wt.% dominated by N-austenite. Figure 4 and 5
confirms that the cooling method has an insignificant effect on redistribution of nitrogen
concentration. But microstructure of transition layer is modified by cooling rates.
Appearing darker after etching in figure 4(c) (slow cooling) and brighter in 4(e) (fast
cooling), the transition layer responds to the cooling rate change by replacing
equilibrium-favored braunite [13] with a more etch-resistant N-austenite. Due to
decreased Ms. temperature by nitrogen atoms, after cooling in liquid nitrogen and short
storage time, the austenite stabilized. The dark transition layers were reported to comprise
ε γ’ [ ] XRD x
0%
1%
2%
3%
4%
5%
6%
0 5 10 15 20 25 30 35 40 45 50
Nit
roge
n C
on
cen
trat
ion
(w
t.%
)
Depth (micron)
FN cool with furnace
AN cool with furnace
AN LIN 1 hr

43
Figure 6 Mole fraction of phases vs. mass percent of nitrogen at 610oC, generated by
Thermo-Calc.
1.2 Hardness profiles
Effect of finish-cooling methods on microhardness profiles is presented in figure 7 for the
three AN disks: (a) slow cooled with furnace, (b) fast cooled in LIN bath and held there
(soaked) for 1 hour, as well as (c) fast cooled in LIN and soaked for 48 hours. Typically,
hardness within diffusion zones is higher for the LIN quenched and soaked samples, and
the effect scales with the soaking time indicates that, apart from the expected athermal
martensitic transformation, an isothermal martensitic transformation [14-16] or age-
hardening may be operating. The low hardness between the surface and inner core peak is
due to the austenite stabilization. The more nitrogen atoms, the harder the martensitic
transformation, thus when nitrogen concentration decreases, with prolonged time,
austenite starts to transform into martensite and increases the hardness at inner core part.
Therefore, due to the isothermal martensitic transformation, it is expected that the desired
continuous hardness profile could be achieved with longer soaking time in liquid nitrogen.

44
A more detailed transmission electron microscopy will be required to interpret the data.
Although the subject falls outside the scope of the present study, it should be mentioned
that a large number of references exist on so- “ ” -hour cryogenic
soaking treatments of martensitic steels, producing significant improvements of wear
resistance while displaying only a mild increase in hardness. This effect has been
attributed to the precipitation of submicron carbides taking place during LIN bath soaking
[17].
Figure 7 Hardness profiles of austenitic nitrided samples
1.3 Nitrogen flux
Although frequently overlooked, nitrogen flux control is important for optimizing
nitriding parameters. Table 2 presents the flux values measured from weight gain of thin
coupons and calculated from concentration profiles in figure 5. The following equations
are used in which: J – flux, t – time, A – surface area, and C(x) – concentration at depth x.
∫
400
500
600
700
800
900
0 100 200 300 400
Har
dn
ess
(H
K)
Depth (micron)
AN cool with furnace
AN LIN 1 hr
AN LIN 48 hrs

45
A reasonable agreement between the results of the two methods indicates their potential
parity in the industrial practice. Of note, the AN treatment brings about a 2.5-times higher
nitrogen uptake than the conventional FN treatment which confirms the starting
assumptions.
Table 2 Average Nitrogen Flux for 4 Hour Nitriding at 525oC (FN) and 610
oC (AN)
Weight gain (g) Flux (g/cm
2/s) from wt. gain Flux (g/cm
2/s) from conc. profile
FN 1.89E-02 5.75E-08 8.69E-08
AN 4.80E-02 1.06E-07 1.50E-07
4. Discussion
4.1 Nitrogen diluted ammonia atmosphere
Nitriding potential is defined by
out of nitriding reaction
giving the equilibrium constant
nitrogen activity is
In the atmosphere of molecule nitrogen diluted ammonia, nitrogen acts in counter effects
[9]. The presence of nitrogen lowers the partial pressure of NH3 and H2 simultaneous thus
increases nitriding potential, however, the dilution for the whole reaction acts like

46
pressure reduction, thus based on Le Cha ’ q
dissociation side, thus reduces nitriding potential. In general, the dilution of ammonia
increases the nitriding potential, as shown in figure 8, however, the nitrogen availability
at metal surface is reduced. Therefore, the process for this kind of atmosphere is not only
controlled by nitriding potential, nitrogen availability as well should be taken into
account. The same investigation has been reported by Michalski [10] and Zimadars [18].
In nitrogen diluted ammonia atmosphere, nitriding potential is not able to unequivocally
describe the boundary condition of the process. The utilization of nitrogen availability as
a parameter creates more possibility for atmosphere controlling [10]. The investigation in
reference [18] claimed in the nitrogen oxinitriding atmosphere, the layer growth rate
dependents on ammonia percentage in the process gas.
In reference [19], nitrogen availability of the nitriding atmosphere (mN2) ties the ammonia
dissociation rate (α) with the flow rate of the input atmosphere (Fin) liters/minute in by
the equation
In this study, nitrogen flux has been calculated in table 2 as nitrogen availability using
weight gain measurements and integration of nitrogen concentration profiles.

47
Figure 8 Diagram for nitriding potential KN as a function of inlet NH3 percentage x and
NH3 dissociate rate y.
In figure 9, the decreasing of nitriding potential is shown during the process, the average
of the nitriding process is about 1.8, correlating to the diagram in figure 10 which is
showing the relationship between nitriding potential and surface nitrogen concentration,
the corresponding surface concentration is located at 9 wt.%. However, the measured
surface nitrogen concentration is between 4%-4.5%, which indicates that the equilibrium
between nitriding atmosphere and metal surface may not be reached yet at the period of
this study. Even though generally, the nitrogen content in the compound layer close to the
surface is significantly lower than the content corresponding to local equilibrium with the
imposed nitriding potential, attributed to the competition between the relative slow
kinetics of ammonia dissociation, the desorption of molecular nitrogen gas from the
surface and solid state diffusion into bulk metal [20, 21], the intrinsic non-equilibrium
character of nitrogen diluted ammonia atmosphere [9] makes the surface equilibrium hard
to achieve.

48
Figure 9 Measured nitriding potential and temperature during the AN process.
Figure 10 Diagram of nitriding potential as a function of nitrogen mass concentration,
generated by ThermCalc.
4.2 Kinetics of layers growth
The diffusion controlled layer growth kinetics is express as parabolic relationship,
√
0
100
200
300
400
500
600
700
0
0.5
1
1.5
2
2.5
3
3.5
4
0 1 2 3 4 5 6
Nit
rid
ing
po
ten
tial
(K
n)
Time (hr)
KN
Temperature
Tem
pe
rature
(C)

49
xi is the thickness of i phase layer, ki is the growth rate constant of i and t is the time.
If local equilibrium prevails all phase interfaces and between nitriding medium and metal
surface under isothermal condition, the horizontal lines in figure 10 are interfaces
between different layers, since nitriding potential is projected by nitrogen activity
(equation 6). The surface concentration and concentration at both sides of interfaces can
be determined.
As mentioned earlier the surface equilibrium is not achieved, thus to control the thickness
of each layer and determine the equilibrium state at interfaces, more experiments are
needed under the same atmosphere but with different processing time. However, if local-
equilibrium has been assumed at solid/solid interfaces in the cases of AN samples, the
nitrogen concentration at the front end of each layer is fixed during the process. Once
quasi-equilibrium [21] is built up in the system, the nitrogen activity on both sides of
interfaces are equal, therefore the boundary conditions at each interface are accessible
from nitrogen concentration profile, as shown in figure 11.
Figure 11 Fe-N isopleth (a); and concentration/depth diagram for growth of nitride layers
imposed with SEM image for AN LIN 1hr sample (b).

50
Measured nitrogen flux can be utilized as solid/gas interface boundary condition. The
analytic solution for diffusion in steel with flux boundary condition is not available,
F k’
equations. For planar geometry and one dimensional diffusion problem, the following
equation [22] can be used:
[
(
(
) )
(
)
]
Where C and Dε are carbon concentration and diffusion coefficient in ε, corresponding to
particular location (node i) and time t, respectively. x is space increment between the
nodes, and t is time increment.
When C = C1, the corresponding x is the desired xε shown in figure 11(b).
The kinetics of layers growth can be determined by migration of interface.
⁄
[ (
) (
)]
Since the interfaces are assumed to be local equilibrium, the austenite layer follows the
q K k ’ [ ] F k’
equation is utilized.
(
√ )
(
√ )
where y ε
At quasi-equilibrium state, the constant concentrations ε/γ γ/α interfaces under
isothermal condition are γ Bγ α Bα
conditions,
( )

51
( )
Then the above error functions can be derived as
√
(
√ )
√
(
√ )
Apply equation 8, 14 and 15 to equation 17-18,
γ/α itten as
⁄
√
[ √
√
√
√
√
√
]
x γ/α
[ √
√
√
√
√
√
]
If two of three major parameters, diffusion coefficients, growth rate constant of each
layer, and the depth of austenite layer are measured, the other parameter can be solved
from above interface flux balance equation. Further experiments carried out under the
same processing condition but with different times are needed to validate the proposed
model.
It is noted that the thickness of compound layer is much thicker than the middle sublayer,
this is due to the larger nitrogen d ε [ ] γ [ ]
ε γ x ε t is

52
illustrated that the thickness of austenite layer is following parabolic growth, however,
the top compound layer is determined by the nitrogen flux from atmosphere to metal
surface. If the nitrogen flux from atmosphere is excessive, it does not take the part in the
growth kinetics of inner layers, the growth of compound layer would exceed to the
growth of austenite layer and diffusion zone. Therefore, to control the layer thickness by
control of nitrogen flux in each layer, boost and diffuse scheme analogue to that in low
pressure carburizing can be employed.
5. Conclusion
At subcritical temperature, the gas nitriding of low-alloy AISI 4140 steel in nitrogen
diluted ammonia atmosphere increases the rate of nitrogen absorption from nitriding
atmosphere 2.5 times and the thickness of nitrided case from 10 micron to 40 micron as
compared to the conventional ferritic nitriding. A transitional, nitrogen-austenite sublayer
forms between the conventional, hard compound layer and soft diffusion zone during the
subcritical austenitic nitriding.
The local equilibrium between nitriding medium and metal load surface has not built up
yet during the period in this experiment. The intrinsic character of nitrogen diluted
ammonia atmosphere makes nitriding potential not sufficiently represents the nitriding
capability. Therefore, if quasi-equilibrium (the local equilibrium only at solid interfaces)
is assume in the system, the layer growth kinetics can be controlled by the nitrogen flux
from the atmosphere into metal surface and the interfaces migration. Based on parabolic
growth of diffusion controlled layers, a mathematic model has been derived. Once two of
three major components, diffusion coefficient, growth rate constant and layer depth, are
measured, the other one is accessible from the mathematical calculation. The excessive
nitrogen atoms constitute to the growth of top compound layer, as suggested, boost and
diffuse conditions are beneficial to control the thickness of each layer.
Liquid nitrogen quenching and soaking increases the hardness of the diffusion layers in
the subcritically nitrided steel. Due to the nitrogen stabilized retained austenite, the
hardness peak appears at inner part of diffusion zone. The hardness increase is

53
proportional to the soaking time suggesting cryogenic aging and isothermal martensitic
transformation as the operating mechanisms.
Future work should examine phases present in the transition layer after cryogenic soaking,
evaluate wear and mechanical properties of subcritically nitrided components, determine
the experimental equilibrium state then correlate it with thermodynamic predictions, and
validate the proposed model.
Acknowledgements
This work has been financed and administrated by Air Products and Chemicals, Inc. The
authors would like to thank Mr. John Green of Air Products for the help in
experimentation. The continuous support from Center for Heat Treating Excellence at
Worcester Polytechnic Institute and Thermo-Calc Software are gratefully acknowledged.
References
[1] N.I. Kardonina, A.S. Yurovskikh and A. S. Kolpakov, 2011, "Transformations in the
Fe – N System," Metal Science and Heat Treatment, 52(9) pp. 457-467.
[2] M. Fattah, F. M., 2010, "Comparison of Ferritic and Austenitic Plasma Nitriding and
Nitrocarburizing Behavior of AISI 4140 Low Alloy Steel," Materials & Design, 31(8) pp.
3915-3921.
[3] Yasumaru, N., 1992, "Formation of Austenite and Martensite in Surface Layer of
Pure Iron with Ion Nitriding," Materials Transactions, JIM, 33(1) pp. 7-10.
[4] J V G Bö E J j "F Α ″ I
Nitride in FeN Martensite: Nitrogen Vacancies, Iron-Atom Displacements, and Misfit-
Strain Energy," Metallurgical and Materials Transactions.A, Physical Metallurgy and
Materials Science, 28(1) pp. 63-77.

54
[5] V.G. Gavdijuk, V.M. Nadutov and K. Ullakko, 1991, "Low Temperature Ageing of
Fe-N Martensite," Scripta Metallurgica Et Materialia, 25(4) pp. 905-910.
[6] Gavriljuk, V. G., 2006, "Austenite and Martensite in Nitrogen-, Carbon- and
Hydrogen-Containing Iron Alloys: Similarities and Differences," Materials Science &
Engineering.A, Structural Materials : Properties, Microstructure and Processing, 438-
440pp. 75-79.
[7] Sorokin, Y. V., and Minkevich, A. N., 1966, "Nitriding Steel in a Mixture of
Nitrogen and Ammonia," MiTOM, 5pp. 49-52.
[8] Minkevich, A. N., 1965, "Thermochemical Treatement of Metals and Alloys,"
Mashinostroenie, pp. 331.
[9] Maldzinski, L., and Tacikowski, J., 2006, "Concept of an Economical and Ecological
Process of Gas Nitriding of Steel," Journal of Heat Treatment and Materials, 61(6) pp. 1-
7.
[10] Michalski, J., 2012, "Using Nitrogen Availability as a Nitriding Process Parameter,"
Industrial Heating.
[11] Bell, T., 1968, "Martensite Transformation Start Temperature in Iron-Nitrogen
Alloys," The Journal of the Iron and Steel Institute, 206(10) pp. 1017-1021.
[12] Wei, Y., Zurecki, Z., and Sisson Jr., R. D., 2012, "Thermodynamic model-assisted
evaluation of phase transformations in subcritical austenitic nitriding," Materials Science
and Technology (MS&T) 2012. Pittsburgh, PA, pp. 180.

55
[13] Totten, G.E., 2006, "Steel heat treatment handbook. 2nd
edition," Taylor and Francis
Group, UK, .
[14] Laughlin, D. E., and et al., 2008, "Thermally activated martensite: its relationship to
non-thermally activated (athermal) martensite," ICOMAT 2008, Santa Fe, USA, .
[15] Lobodyuk, V. A., and Estrin, E. I., 2005, "Isothermal Martensitic Transformations,"
Physics-Uspekhi, 48(7) pp. 713-732.
[16] Zhao, J. C., and Notis, M. R., 1995, "Continuous Cooling Transformation Kinetics
Versus Isothermal Transformation Kinetics of Steels: A Phenomenological
Rationalization of Experimental Observations," Materials Science and Engineering,
R15pp. 135-208.
[17] Das, D., and et al, 2009, "Influence of Varied Cryotreatment on the Wear Behavior
of AISI D2 Steel," Wear, 266pp. 297-309.
[18] Zimdars, H., 1987, "Technologische Grundlagen Fur Die Erzeugung Nitridhaltiger
Schichten in stickstoffangBereicherten Nitrieratomspharen," Dissertation Bergakademie
Freiberg, pp. 37-39.
[19] Michalski, J., 2011, "Characteristics and calculations of atmospheres for controlled
gas nitriding of steel," Instytut Mechaniki Precyzyjnej, Warszawa, .
[20] Somers, M. A. J., and Christiansen, T., 2005, "Kinetics of Microstructure Evolution
during Gaseous Thermochemical Surface Treatment," Journal of Phase Equilibria and
Diffusion, 26(5) pp. 520-528.

56
[21] Ratajski, J., 2004, "Model of Growth Kinetics of Nitrided Layer in the Binary Fe-N
System," International Journal of Materials Research and Advanced Techniques (Z.
Metallkd.), 95(9) pp. 823-828.
[22] Karabelchtchikova, O., 2007, "Fundamentals of Mass Transfer in Gas Carburizing,"
Dissertation, Worcester Polytechnic Institute.
[23] Kirkaldy, J. S., 1958, "Diffusion in Multicomponent Metallic System: I.
Phenomenological Theory for Substituional Solid Solution Alloys," Canadian Journal of
Physicals, 36(7) pp. 899-906.
[24] Sun, Y., and Bell, T., 1997, "Computer Prediction of Threshold Nitriding Potential
Curves," Heat Treatment of Metals, 24pp. 43-49.
[25] Straumal, B. B., Vershinin, N. F., Friesel, M., 2001, "Ionic Nitriding of Austenitic
and Ferritic Steel with the Aid of a High Aperture Hall Current Accelerator," Defect and
Diffusion Forum, 194-199pp. 1457-1462.

57
Paper #2: Subcritical temperature austenitic nitriding and cryogenic
treatment on low alloy steel (published in Proceedings of Materials Science
and Technology (MS&T) 2012, Pittsburgh, PA, October, 2012)
1Y. Wei,
2Z. Zurecki,
1R.D. Sisson, Jr.
1Center for Heat Treating Excellence, Worcester Polytechnic Institute, Worcester, MA, USA
2 Metals Processing Center of Excellence, Air Products & Chemicals, Inc., Allentown, PA, USA
Key words: austenitic nitriding, subcritical temperature, thermodynamics, cryogenic, simulation
Abstract
Conventional nitriding of low-alloy steels is a multi-hour surface hardening process
carried out at ferritic temperatures and concluding a complete heat treatment cycle:
normalizing, austenitizing, martensitic quenching and tempering. An alternative,
subcritical-temperature austenitic nitriding process is evaluated with the purpose of
accelerating the treatment and optimizing the hardness and toughness of nitrided layers
while minimizing the distortion of steel parts treated. The alternative process involves
cryogenic nitrogen quenching as well as aging. This paper presents results of
experimental work on AISI 4140 steels, examining the interplay between the nitriding
and cooling conditions and phase transformations in both ferritic (525oC) and subcritical,
nitrogen-austenitic (610oC) processes. Thermodynamic models, used to design process
conditions, are applied also in the microstructural interpretation of nitrided layers,
examined via SEM, EPMA and EDS. Kinetics of interstitial diffusion and phase
transformation-based dimensional control of nitrided parts are also presented.
2. Introduction
During the recent decades, gas nitriding has become increasingly popular as a surface
hardening method used in the steel processing industry. Conventionally, gas nitriding of

58
low-alloy steels (ferritic-phase nitriding) takes place in the temperature range of 495-
565 °C, shown as lower shading area in Figure 1. Rapid quenching is not required, and
this prevents large dimensional distortions, normally produced by the classic, carbon
austenite-to-martensite phase transformation. However, due to the limited nitrogen
solubility in ferrite [1] and low diffusion rates at low process temperatures, the nitrogen
hardened layer is relatively shallow, even for the treatments lasting many hours or days.
Also, the nitrogen concentration rapidly decreases from the surface to the core which
results in an undesired, sharp hardness and stress gradient. In this paper, a modified
method is explored for accelerating nitriding treatment and optimizing the hardness and
toughness of the core and the surface layers, while assuring minimum distortion of the
parts treated. The method involves increasing the nitriding temperature to the sub-critical
temperature: above the eutectoidal transformation temperature in the Fe-N system but
below the corresponding temperature in the Fe-C system, shown as top shading area in
Figure 1, combined with quenching and further cooling to cryogenic temperatures. The
purpose of the latter is to promote the transformation of the nitrogen-formed austenite
into nitrogen-formed martensite. The core of the parts treated according to the evaluated
method is expected to retain its original microstructure and properties, whereas the
sur γ’- Fe4N ε-Fe2-
3N) and, an additional, somewhat softer transition layer of N-martensite with a possible
fraction of retained N-austenite. This work aims at verifying if the described method can
reduce typically sharp hardness and stress gradients between the compound layer and the
core without causing part distortion. Fe-N austenite has been investigated by several
authors. Fattah [2] compared corrosion of steel after plasma ferritic- and austenitic-
nitriding followed with a slow cooling. Yasumaru [3] examined the effects of nitriding at
three different temperatures and water quenching on pure iron. Microstructural evolution
during aging and tempering of cryogenically quenched Fe-N martensite was analyzed
using elemental, carbon-free iron as the starting material [2, 4-6]. There is debate [7-9]
on the nitrogen and carbon precipitation in the Fe-C-N martensite during aging and
tempering, however only Cheng [10] reported on tempering of low-alloyed steel and
transformation of FeNiN martensite. Considering the martensite transformation starting
point (Ms), nitrogen stabilizes austenite more effectively than carbon. Reference [5]

59
reported Ms to be only 120K for Fe-2.75 wt.%N alloy. When nitrogen content exceeds
2.2 wt.%, the N-austenite is stable at room temperature due to its Ms point located below
the room temperature [3]. Bell [11] proposed the relationship between Ms and N-
concentration as Ms (°C) = 533 - 228NC (wt.%). In this view, a post-nitriding treatment
involving cryogenic soaking appears to be advisable for transforming austenite to
martensite. References published to date offer little on the physical metallurgy of Fe-N
and Fe-N-C austenite formed in the popular structural steels during the subcritical
temperature nitriding and their transformation products in the subsequent thermal
treatments. Thus, the further examination of this area is technologically justified.
Fig. 1: Temperature ranges for ferritic and subcritical austenitic nitriding
3. Experimental
AISI 4140 steel, characterized by high hardenability, was selected as the test materials.
The composition of 4140 is listed in Table I.

60
Table I: Composition of Low-alloy Steel Tested
C Cr Fe Mn Mo P S Si
AISI 4140 minimum 0.38 0.8 Bal. 0.75 0.15 0 0 0.15
maximum 0.43 1.1 Bal. 1 0.25 0.035 0.04 0.35
Material was processed in the sequence illustrated in Figure 39: normalizing, rough
machining, austenitizing, oil and LIN quenching, tempering and oil quenching, finish
machining, nitriding, and finish cooling of nitrided samples in three different ways.
Material was processed in the sequence illustrated in Figure 2: normalizing, rough
machining, austenitizing, oil and LIN quenching, tempering and oil quenching, finish
machining, nitriding, and finish cooling of nitrided samples in three different ways.
Ferritic nitriding at 525°C and austenitic nitriding at 610°C lasted 4 hours in N2-diluted
25% NH3 atmosphere. The three finish cooling paths examined were: (a) slow cooling
inside furnace, (b) fast cooling in liquid nitrogen bath, LIN (-195oC) and holding for 1
hour, as well as (c) fast cooling in LIN combined with holding for 48 hours. Figure 3
shows the atmosphere nitriding apparatus used.
Fig. 2: Thermal processing sequence
Normalizing
Austenizing
FN or AN Tempering
LIN hold 1 hr LIN hold 48 hr
Slow cooling
with furnace
Rough
machining
test rods
Finish
machining
test rods
Time
Temperature
RT
Quench
Quench

61
Fig. 3: Atmosphere nitriding apparatus
Three different configurations of samples were used: (i) a rod shape to measure
dimensional change after nitriding, (ii) a disk shape for evaluating microstructure and
hardness, and (iii) flat coupons to measure weight gain after nitriding. Nitrided disks (ii)
were etched in 2% Nital. OM ZEISS IM35, SEM JEOL JSM-7000F, Oxford energy
dispersive x-ray spectroscope and JEOL Superprobe JXA-8900R were used for
microstructure and concentration profile analysis, while microhardness profiling was
carried out on Shimadzu HMV-2000.
4. Results and Discussion
4.1 Microstructure and Nitrogen Distribution
Figure 4 shows the optical and SEM micrographs of samples processed along three
different paths. After the conventional ferritic nitriding (FN), the hardened case is
composed of compound layer and diffusion zone. The austenitic nitriding (AN) results in
“ ”
appears dark on the samples cooled with the furnace but bright on the samples quenched
in liquid nitrogen (LIN), and the inner diffusion zone. The white layer thickness increases
from 10 m to 30 m as the nitriding temperature is increased from the ferritic to the
NH
3
Cylinde
r
Laser Gas
Analyzer
NH3 flowmeter
N2 feed
Process N2”
flowmeter
Purge N2’
flowmeter
Furnace
Diffuser
Outlet gas
Inlet gas

62
austenitic range, indicating that the N flux into the metal core is larger due to the
temperature raise and larger solubility of N in austenite. The nitrogen concentration
profiles for the FN and the AN, both concluded with the slow furnace cooling, as well as
the profile for AN and quenched in LIN are presented in Figure 5 left. As expected, the N
profiles of the two AN samples are the same and significantly broader than for the FN
treatment. At 610oC, the maximum N concentration observed, 4-5 wt. %, corresponds to
the region consist ε N- γ’ F
right. The transition layer, i.e. the 2nd
layer seen in Figure 6, dominates in the N-
concentration region between about 1 and 4 wt%. This range shown in Figure 5 right is
dominated by N-austenite. Figure 6 confirms that the cooling method has an insignificant
effect on redistribution of nitrogen and pre-existing carbon, and minor variations can be
attributed to experimental errors. The microstructure of transition layer is modified by
cooling rates, though. Appearing darker after etching in Figure 4b (slow cooling) and
brighter in 4c (fast cooling), the transition layer responds to the cooling rate change by
replacing equilibrium-favored braunite [12] with a more etch-resistant mixture of N-
martensite and N-austenite. The dark transition layers were reported to comprise ferrite,
ε γ’ [ ] XRD x

63
Fig. 4: Optical and secondary images of cross sections of ferritic and austenitic nitrided
samples. (a and d): Ferritic nitriding and cooling with furnace. (b and e): Austenitic
nitriding and cooling with furnace. (c and f): Austenitic nitriding and LIN quenching.
Etched in 2% Nital.

64
(a)
(b)
Fig. 5, (a), Nitrogen concentration profiles for ferritic nitriding (FN) and cooling with
furnace, austenitic nitriding (AN) and cooling with furnace, as well as austenitic nitriding
(AN) and quenched in LIN bath; (b), Mole fraction of phases vs. mass percent of nitrogen
at 610oC, Thermo-Calc.
0%
1%
2%
3%
4%
5%
6%
05101520253035404550
Co
nce
ntratio
n o
f N (w
t.%)
Depth (micron)
FN cool with furnace
AN cool with furnace
AN LIN 1 hr
610 °C
1. γ
2. fcc3
3. fcc2
4. ε
5. γ‘
6. α
7. Cementite
8. MC_SHP
9. MSI_CARBIDE
10. M23C6
Compound layer Diffusion zone Transition

65
Depth (micron)
(b)
Higher temperatures and larger solubility in austenite accelerate nitrogen flux from
’ N
a relatively thick white layer and thin transition layer. The effect is a likely result of a
comparatively low nitrogen diffusion coefficient in the austenitic phase, lower than for
the ferrite and nitrides, Figure 7 [13-16]. Thus, once the N-austenite is formed beneath
the white layer, an effective diffusion barrier is created. Nitrogen builds up in the
growing white layer, and the expansion of transition layer slows.
Fig. 6: Nitrogen and carbon concentration in AN samples (a) cooled with furnace, and (b)
quenched in LIN, superimposed on the corresponding SEM images.
Co
nce
ntratio
n (w
t.%)
Depth (micron)
(a)

66
Fig. 7: Diffusion coefficient of nitrogen in different phases.
Compound layers are undesired in certain engineering applications. An additional
investigation was carried out on control and dissolution of compound layers by the
simultaneous modification of nitriding potential (Kn) and nitrogen flux using inert gas
dilution of ammonia. Results will be reported in the future.
4.2 Hardness Profiles
Effect of finish-cooling method on microhardness profile is presented in Figure 8 for the
three AN disks: (a) slow cooled with furnace, (b) fast cooled in LIN bath and held there
(soaked) for 1 hour, as well as (c) fast cooled in LIN and soaked for 48 hours. Typically,
hardness within the transition and diffusion zones is higher for the LIN quenched and
soaked samples, and the effect scales with the soaking time indicating, that apart from the
expected athermal martensitic transformation, an isothermal martensitic transformation
[17-19] or age-hardening may be operating. A more detailed transmission electron
microscopy will be required to interpret the data. Although the subject falls outside the
scope of the present study, it should be mentioned that a large number of references exist
on so- “ ” -hour cryogenic soaking treatments of martensitic steels,
producing significant improvements of wear resistance while displaying only a mild
1.00E-15
1.00E-14
1.00E-13
1.00E-12
1.00E-11
1.00E-10
1.00E-09
1.00E-08
1.00E-07
1.00E-06
1.00E-05
1.00E-04
1.00E-03
5 6 7 8 9 10 11 12 13 14 15 16 17 18 19 20
D (
cm2 /
s)
104/T (K-1)
Dn in α-Fe [13]
Dn in γ-Fe [13]
Dn in γ' Fe4N [14]
Dn in ε [14]
Dn in α-Fe [14]
Dn in α-Fe [15]
Dn in α-Fe [16]
1600 900 800 700 600 500 400 300
T (⁰C)

67
increase in hardness. This effect has been attributed to the precipitation of submicron
carbides taking place during LIN bath soaking [20].
Fig. 8: Hardness profiles of austenitic nitrided samples
Fig. 9: Diameter and length changes, as well as total run-out increase of ferritic and
austenitic nitrided rods (i).
300
400
500
600
700
800
900
0 50 100 150 200 250 300 350 400
Har
dn
ess
(kn
oo
p)
Depth (micron)
AN cooled with furnace
AN LIN 1 hr
AN LIN 48 hr
0
0.001
0.002
0.003
0.004
0.005
0.006
0.007
0.008
99.0%
99.5%
100.0%
100.5%
101.0%
FN AN FN AN
Cool with furnace LIN 1 hr
Diameter
Length
Total run-out
Total ru
n o
ut in
crease
(Inch
) In
cre
ase
pe
rce
nta
ge

68
4.3 Nitrogen Flux
Although frequently overlooked, N flux control is important for optimizing nitriding
parameters. Table II presents the flux values measured from weight gain of coupons (iii)
and calculated from concentration profiles, Figure 5, left. The following equations are
used in which: J – flux, t – time, A – surface area, and C(x) – concentration at depth x.
∫
A reasonable agreement between the results of the two methods indicates their potential
parity in the industrial QC practice. Of note, the subcritical AN treatment brings about a
2.5-times higher nitrogen uptake than the conventional FN treatment which confirms the
starting assumptions.
Table II: Average Nitrogen Flux for 4 Hour Nitriding at 525oC (FN) and 610
oC (AN)
Weight gain (g) Flux (g/cm
2/s) from wt. gain Flux (g/cm
2/s) from conc. profile
FN 1.89E-02 5.75E-08 8.69E-08
AN 4.80E-02 1.06E-07 1.50E-07
4.4 Dimensional Stability
A minimum-distortion nitriding of low-alloy steels can be achieved by limiting the
processing temperature to below the eutectoidal transformation temperature in their
respective Fe-C-M systems, where: C – carbon, and M - metallic alloying additions, as
well as assuring uniform heating, cooling and atmosphere flow-field [21]. Dimensional
stability of subcritically nitrided and differently cooled AISI 4140 rods (i), 6.35 mm x
L 101.6 mm, ground to Ra 0.4 m, was evaluated and compared to that resulting from the
conventional ferritic nitriding using two cooling methods. Treatment resultant changes in
the rod diameter, length, and total run-out were considered. Shown in Figure 9, the
results prove that, overall, the stability of rods nitrided at 610oC and cooled in LIN bath is
about the same as for the conventionally nitrided rods. Total run-out increased only in the

69
case of the slow cooled AN specimens, probably due to a partial decomposition of N-
austenite into a soft braunite phase.
5. Conclusions
1. Subcritical temperature austenitic nitriding of low-alloy AISI 4140 steel increases the
rate of nitrogen absorption from nitriding atmosphere and the thickness of nitrided
case as compared to the conventional ferritic nitriding.
2. A transitional, nitrogen-austenite sublayer forms between the conventional, hard
compound layer and soft diffusion zone during the subcritical austenitic nitriding. Its
thickness and the thickness of compound layer can be controlled through
measurement of nitrogen flux, dilution of undissociated NH3 atmosphere with N2,
adjusting nitriding potential, and applying proper boosting-diffusing conditions.
3. Liquid nitrogen quenching and soaking increases the hardness of the transition and
diffusion layers in the subcritically nitrided steel. The hardness increase is
proportional to the soaking time suggesting cryogenic aging and isothermal
martensitic transformation as the operating mechanisms.
4. Dimensional change and distortion of the subcritically nitrided and liquid nitrogen
quenched/soaked parts are in the same range as after the conventional ferritic
nitriding. Slow cooling with furnace may result in nonlinear deformations, however.
5. Future work should examine phases present in the transition layer after cryogenic
soaking, evaluate wear properties of subcritically nitrided surfaces, and correlate
nitrogen flux from nitriding atmosphere to the extent of ammonia dissociation and
dilution with inert gases.
Acknowledgements

70
This work has been financed and supported by Air Products and Chemicals, Inc.
Computational contributions of the CHTE at Worcester Polytechnic Institute must be also
acknowledged. The authors would like to thank Mr. John Green of Air Products for the
help in experimentation.
References
1. N. I. Kardonina, A. S. Yurovskikh and A. S. Kolpakov, 2011, "Transformations in the
Fe – N System," Metal Science and Heat Treatment, 52(9) (2011), 457-467.
2. M. Fattah, "Comparison of Ferritic and Austenitic Plasma Nitriding and
Nitrocarburizing Behavior of AISI 4140 Low Alloy Steel," Materials & Design, 31(8)
(2010), 3915-3921.
3. N. Yasumaru, "Formation of Austenite and Martensite in Surface Layer of Pure Iron
with Ion Nitriding," Materials Transactions, JIM, 33(1) (1992), 7-10.
J V G Bö E J j "F α ″ I N
FeN Martensite: Nitrogen Vacancies, Iron-Atom Displacements, and Misfit-Strain
Energy," Metallurgical and Materials Transactions. A, Physical Metallurgy and
Materials Science, 28(1) (1997), 63-77.
5. V. G. Gavdijuk, V. M. Nadutov and K. Ullakko, "Low Temperature Ageing of Fe-N
Martensite," Scripta Metallurgica Et Materialia, 25(4) (1991), 905-910.
6. V. G. Gavriljuk, "Austenite and Martensite in Nitrogen-, Carbon- and Hydrogen-
Containing Iron Alloys: Similarities and Differences," Materials Science & Engineering.
A, Structural Materials : Properties, Microstructure and Processing, 438-440 (2006), 75-
79.
7. A. Böttger et al., "Tempering of iron-carbon-nitrogen martensites: (re)distribution of
interstitial atoms " Materials Science Forum, 318-320 (1999), 103-108.

71
8. Liu Cheng, A. Böttger and E. J. Mittemeijer, "Tempering of Iron-Carbon-Nitrogen
Martensites," Metallurgical Transactions. A, Physical Metallurgy and Materials Science,
23(4) (1992), 1129-1145.
9. P. Ferguson, K. H. Jack, Scripta Metallurgica, 18 (1984), 1189.
10. Liu Cheng, A. Böttger and E. J. Mittemeijer, "The Tempering of FeNiN Martensite,"
Metallurgical Transactions.A, Physical Metallurgy and Materials Science, 22(9) (1991),
1945-1956.
11. T. Bell, "Martensite Transformation Start Temperature in Iron-Nitrogen Alloys," The
Journal of the Iron and Steel Institute, 206(10) (1968), 1017-1021.
12. George, Totten, Steel heat treatment handbook. 2nd
ed (UK: Taylor and Francis
Group, 2006).
13. B. B. Straumal, N. F. Vershinin and M. Friesel, et al, “I
H ” Defect and
Diffusion Forum, 194-199 (2001), 1457-1462.
Y B “ prediction of threshold nitriding potential ”
Heat Treatment of Metals, 24 (1997), 43-49.
E F “ ” Academic Press,
(2009), 195.
16. M. Weller, Material Science Forum, 366-368 (2001), 95-137.
17. D E L “ : -
” I O F U ,
2008).
V L k E I E “I ” Physics-
uspekhi, 48(7) (2005), 713-732.
J Z R N “ k
isothermal transformation kinetics of steels: a phenomenological rationalization of
x ” Materials Science and Engineering, R15 (1995), 135-208.

72
D D “I I I D
” Wear, 266 (2009) 297-309.
D P “D ” Industrial Heating, Jan. 7th
, 2011

73
Paper #3: Process Optimization for Industrial Practices of Plasma
Activated Nitrogen-Hydrocarbons Atmosphere Carburizing (to be
submitted to International Heat Treatment and Surface Engineering)
Yingying Wei1, Zbigniew Zurecki
2, Kai Kang
2, Richard D. Sisson, Jr.
1
1Worcester Polytechnic Institute, Worcester, MA 01609, USA
2Air Products and Chemicals, Inc. Allentown, PA 18195, USA
Abstract
Problems with intergranular oxidation (IGO), energy efficiency and carbon footprint of
conventional endothermic atmosphere (CO-H2-N2) carburizing is forcing heat treating
and manufacturing companies to move toward increasingly capital- and operating-cost
expensive, low-pressure (vacuum furnace) carburizing methods. In response, a new
activated and alternate carburizing method (A2A carburizing) has recently been
developed, bridging the endothermic atmosphere and vacuum processes, where a plasma-
activated, oxygen-free, non-equilibrium nitrogen-hydrocarbon gas blend is utilized. The
optimization of industrial A2A carburizing processes involves improvement of case
uniformity of parts as a function of position in the charge as well as on different sides of
the parts. Connected to the optimization, a computational fluid dynamics (CFD) study is
conducted for examination of gas flow field inside the furnace and trays holding steel
parts treated. To mitigate soot in the atmosphere and minimize the poorly carburized
contact area between parts, effects of different combinations of nitrogen-hydrocarbons
mixture on soot formation in atmosphere, deposition on metal surface and graphite
growth at carburizing temperature are investigated. A mixture of N2-0.4%C3H8-1%CH4
mixture has been proven to be able to provide a well carburizing hardened case with less
soot in atmosphere, less coke deposition on metal surface, as well as minimized
marginally carburized contact zone. A soot formation mechanism for non-equilibrium
atmosphere in A2A carburizing is proposed.
1. Introduction

74
To accelerate the process, merge the merits of gas carburizing and vacuum carburizing,
eliminate intergranular oxides, reduce capital/operational cost and promote usage of a
more safe and environmental friendly atmosphere, a plasma activation and alternate
atmosphere heat treatment technology (A2A technology) has been introduced by Air
Products and Chemicals, Inc.[1] Different from conventional plasma heat treating
processes [2], in which loading parts performance as one electrode, this technology
adapts cold plasma discharge to activate the inlet gas and promote the hydrocarbon
dissociation in the atmosphere. During recent years, a series of gas stream-activating,
cold-plasma injectors have been developed at Air Products. A high-voltage/low-
amperage, low power (below 2 KW) DC or AC electric discharge between electrodes on
the plasma injector ionizes, partially dissociates and converts the gas molecules on their
way into the furnace [1]. The low thermal energy activates hydrocarbons to ions, radicals
and various low chain byproducts [3-6], and prevents complete dissociation of
hydrocarbons into carbon and hydrogen only.
The plasma injector can be easily retrofitted to various types of the conventional, radiant
tube or electrically heated and 1-atm pressure furnaces in order to carry out carburizing,
carbonitriding, neutral carbon annealing, as well as nitrocarburizing operations falling
into a relatively low temperature range [7]. So far, this technology has been lab tested on
the carburizing of low-alloy and stainless steels [7], low-and high-temperature nitriding
of carbon, alloy and stainless steels [8]. It has been proven to be effective to eliminate
intergranular oxides, accelerate the process, and at the same time reduce cost. Application
of A2A technology onto industrial scale furnace is more challenging, requires dynamic
in-situ atmosphere control and more uniform gas stream. In this paper, a computational
fluid dynamic study is presented to improve the carburizing uniformity by modification
of the loading configuration.
A propensity for sooting on the steel surface continues to be an unresolved issue in non-
equilibrium carburizing operations. Several investigations performed by Grabke [9-13]
provide a good understanding of thermodynamic, kinetics and mechanisms of coke
deposition for equilibrium atmosphere. Many investigations about soot/coke formation in
equilibrium or hydrocarbon non-equilibrium atmosphere are reported at the temperature

75
lower than practical carburizing temperature [14-20], its formation an
I -
atmosphere as well as on metal surface. The mechanism of soot formation and deposition
is proposed.
2. Experimental methods
2.1 Industrial practices
Industrial practices have been done at one industrial site. The onsite integral quench
furnace (IQF) schematic is demonstrated in figure 1. Gas stream flows in from the top
inlet, after being stirred by a 4-blade fan, it circulates around the muffle and flows into
the heating chamber through the three columns of bottom vents, on top of where is 4
stacks of trays with components loaded.
Figure 1 Schematic of industrial integral quench furnace, Ipsen design [21]
Shown in Figure 2, the cold plasma injector is mounted at the inlet of the furnace,
individually controlled by a 110V/30A AC power supply. Gas are pre-mixed upstream

76
and fed into the integral quench furnace thought the plasma injector. H2, CO, CO2, CH4,
C3H8 in the furnace are monitored by probe gas analyzers.
Figure 2 Retrofit of industrial integral quench furnace, Ipsen design [21]
F - -propane
atmosphere. First three tests are implemented with the same traditional loading
configuration as demonstrated in figure 3(a), but with different boost and diffuse schemes,
trying to optimize the process efficiency, hardened case depth and surface quality. In
such loading configuration, normal basket trays are used. Test samples and dummy parts
are shoveled into trays and shaken for uniform distribution.
Nevertheless, the last test is taking carburizing with a new loading configuration as
shown in figure 3(b), with a center channel in each tray and an entire solid top sheet
metal cover. Two ends of the channel in each tray are also covered with solid metal
panels. Width of three bottom channels is the same as floor center vents, but the width of
top channel is ¾ of three bottom ones.
Plasma injector
High voltage
N2+C3H8 blend
House C3H8

77
(a)
(b)
Figure 3 Pictures of conventional loading (a); and center channel configuration loading (b)
Upon charging the components into furnace
x
chamber door. To consume the residual oxygen in the furnace, propane is purged at a

78
base amount level. When temperature and oxygen level recovers, pre-mixed blend gas is
purged into furnace and following the designed boost and diffuse steps.
16MnCr5 DIN steel is used as test material, its composition is list in table 1.
Table 1 Composition of 16MnCr5 DIN steel
C Fe Cr Mn Mo Ni Si Al Cu
wt. % 0.16 Bal. 0.95 1.15 Max.
0.08
Max.
0.30
Max.
0.40
Max.
0.035
Max.
0.30
On carburized test samples, OM ZEISS IM35 and Shimadzu HMV-2000 are utilized for
optical micrographs and microhardness profiles.
2.2 Nitrogen-hydrocarbons blend tests for A2A carburizing
Five different combinations of CH4 and C3H8 with balanced nitrogen, listed in table 2,
are used to test the soot formation both in atmosphere and on metal surface. A semi-
industrial lab scale furnace manufactured by Applied Test System ” x ”
x ” G x
blow into furnace through plasma injector. During the process, a filter is used at the
furnace outlet for measurement of soot deposition rate, which indicates the soot amount
in the atmosphere. Boost time for weight gain measurements on coupons is set to be the
same, 60 minutes for each condition. While boost time for soot deposition rate
measurements is set to be different, allowing enough deposits to be measureable by
microbalance. Gas composition CO, CO2, CH4 is monitored by Siemens Tri Gas
Ultramat 23, C3H8 is measured by Siemens Ultramas 22, O2, H2 and dew point are
measured by Alpha Omega trace O2 series 3000, Cosa/Xentaur dew point XPDM and
Thermco binary gas thermal conductivity analyzer 6900 series, respectively. Percentage
of each composition is taken from average of readings over the period at processing
temperature.

79
Table 2 Conditions for nitrogen - hydrocarbons blend tests
Inlet Condition
conditions C3H8 (%) CH4 (%) Total flow
(scfh)
Temperature
(℃)
Boost time (min)
Filter Weight
1 1.8 4
200 930
20
60
2 1.8 0 20
3 0.4 4 40
4 0.4 1 90
5 0.4 0 187
Polished AISI 8620 (table 3) disk coupons with 0.05 micron surface finish are used in
condition 1, 3, 4 and 5. Two coupons are used in condition 1, 3 and 5. One is used for
weight gain measurements, and the other one is partially covered by a square steel bar to
mimic the situation when parts are touching each other. In condition 4, to investigate the
correlation between grain boundary and soot deposition, another coupon with additional
pre-etching step by 2% nital is also employed. After carburizing at 930 C, coupons are
cooled with furnace in nitrogen atmosphere, preventing deposited soot convert to a solid
thin film during oil quench.
Table 3 Composition of AISI 8620
C Cr Fe Mn Mo Ni P S Si
8620 0.18 –
0.23
0.40 –
0.60 Bal.
0.70 –
0.90
0.15 –
0.25
0.40 –
0.70
0 –
0.035
0 –
0.040
0.15 –
0.30
A tape test is used to visually compare the amount of soot deposition on coupon surface
from each condition. Weight gain is measured after washing the coupons with acetone.
OM ZEISS IM35, SEM JEOL JSM-5910LV and EDS Thermo Noran System Six (NSS)
equipped with a silicon drift detector (SDD) are used for microstructure analysis.

80
3. Results
3.1 Microstructure and hardness for different loading configurations
Figure 4(a) presents the optical images of top and bottom sides on the part from bottom
tray in T3. It is observed that less carburizing at top side and over carburizing at bottom
side. At bottom side, carbides and large grains of retained austenite are found at surface
and in near surface layer respectively. It is because that high carbon content in boundary
layer enhances the flux from atmosphere to metal surface, exceeds the diffusion rate
inside the metal. Austenite is over saturated with carbon and forms carbides. This over
saturation suppresses martensite transformation during quench and leaves large amount
of austenite. However, demonstrated in figure 4(b), uniform carburizing is achieved
between top and bottom sides on the part, which is from bottom tray of T4. Fine
martensite is uniformly distributed over the hardened case. Meanwhile, no intergranular
oxide is observed in all of images.
(a)
Bottom
25 um
Top
25 um

81
(b)
Figure 4 Optical microscopic images of top and bottom sides on the part in bottom tray from (a) T3; and (b) T4
Corresponding to microscope images, hardness profiles on each side are shown in figure
5. On the part from T3, there is less case depth on top side comparing to bottom side,
meanwhile, a hardness drop is shown at near surface due to large amount of austenite. As
illustrated in figure 5(b), same case depth are achieved on both sides of the sample from
T4, absence of hardness drop at surface on bottom side is due to uniformly distributed
fine martensite.
(a)
400
500
600
700
800
900
1000
0 500 1000 1500 2000 2500 3000
Har
dn
ess
(K
no
op
)
Depth (micron)
Top Bottom
25 um 25 um
Top Bottom

82
(b)
Figure 5 Hardness profiles of top and bottom sides on the part in bottom tray from (a) T3; and (b) T4
Top chart of figure 6 shows the average hardness of all parts within one tray from T1 to
T4. Large deviations over four trays are shown from T1 to T3. Hardness range is from
HRC 52 to 56 for T1, and 52-58, 55-60 for T2 and T3, respectively. Not only the average
hardness of trays deviates, so does hardness of components within one tray, which is
shown in bottom chart of figure 6. Compare to T4, the standard deviation value in each
tray from all T1-T3 is relatively higher and heavily vary among trays which is illustrating
very non- I “ - ”
applied. In T4 when the center channel configuration is utilized, narrow range of average
hardness among trays is observed in top chart of figure 6, the deviation in each tray is
smaller than the corresponding values from T1-T3, meanwhile, the variation of standard
deviation among trays is limited, illustrating the uniform carburizing.
300
400
500
600
700
800
900
1000
0 500 1000 1500
Har
dn
ess
(V
icke
rs)
Depth (micron)
Top Bottom

83
Figure 6 Average hardness (top chart) in each tray; and standard deviation among parts (bottom chart) in each tray from four industrial practices, tray 1 to tray 4 is from bottom to top
3.2 Microstructure and hardness of contacted area
To keep efficiency the same as endo-gas carburizing, in industrial tests, test samples are
highly dense, shovel loaded in trays, the same way as conventional atmosphere
carburizing. Therefore, it is inevitable that parts touch each other, leading to pale contact
area on carburized parts, as shown in figure 7. Around the contact area, a dark perimeter
is shown up and the rest of the surface appears grey.
Figure 7 Photograph of as-quenched part being touched during A2A carburizing
Empty channel test
Empty channel test
Contact
Grey
Dark

84
Illustrated in figure 8(a), the contact area is barely carburized, with very shallow case
shown in hardness profile (figure 9), comparing to the similar case depth of dark
perimeter and grey area in the same hardness profile. However, the as quenched
condition at grey area (figure 8(f)) appears rough microstructure with scattered cementite
on surface and large austenite grain in near surface sub-layer, which is corresponding to
the hardness drop at near surface in hardness profile. Thus, pale contact area is soft,
marginally carburized, the dark areas, next to contact spot were properly carburized, and
the most exposed to gas atmosphere grey areas were somewhat over carburized due to the
fact that the furnace atmosphere was set to be over carburizing by the process controller.
Carburizing was acceptable outside the contact area, with minor portions, hardness drop
near surface, that could be corrected by the subsequent tempering treatment.
Figure 8 Optical micrographic images of contact (a) and (d), dark (b) and (e),as well as grey (c) and (f) areas on the as-quenched part being touched during A2A carburizing
dark 100x grey 100x contact 100x
127 um 127 um 127 um
dark 500x grey 500x contact 500x
25 um 25 um 25 um
(a)
(f) (e) (d)
(c) (b)

85
Figure 9 Hardness profiles of contact, dark and grey areas on the as-quenched part being touched during A2A carburizing
3.3 Soot formation in atmosphere and deposition on metal surface
Figure 10 compares the soot deposition rate on filter from nitrogen-hydrocarbons blend
tests, which illustrates that soot in the atmosphere is increasing with propane, while when
the propane percentage is fixed, it increases with methane. Besides condition 5, the
carbon fluxes in condition 1-4 are very close. Condition 5 is poorly carburized with very
low flux. Condition 3 and 4 is appearing as the optimized ones, with less soot in the
atmosphere and enough carbon flux on the coupon.
Figure 10 Measured soot deposition rate in filter and flux on coupons for five conditions
400
500
600
700
800
900
0 200 400 600 800 1000 1200
Har
dn
ess
, HV
Depth (micron)
contact
dark
grey
0
1
2
3
4
5
6
7
8
1 2 3 4 5
Soot deposition rate in filter (1E-06 g/cm2/s)
Flux on coupon (1E-07 g/cm2/s)
1.8% C3H8 + 4% CH4
1.8% C3H8
0.4% C3H8 + 4% CH4
0.4% C3H8 + 1% CH4 0.4% C3H8
conditions

86
In figure 11(a) it is observed that dark soot on the tape in condition 1, 3, 4 and 5, no
matter how much flux it is. However, the soot severity on metal surface cannot be
associated to the soot amount in the atmosphere.
(a)
(b)
Figure 11 Pictures of soot on tape (a); and contact area (b) of coupons from condition 3, 1, 4, and 5 (left to right)
Analogue to chemical vapor deposition [22], at high temperature and one atmosphere
pressure, the deposition is a mass transportation limited process, rather than surface
reaction limited process. The deposition rate of pyrolytic soot is determined by gas mass
transfer coefficient hg.
where Dg is the diffusion coefficient in boundary layer, δ is boundary layer thickness.
Theoretically, Dg is proportional to
Condition 1 Condition 5 Condition 4 Condition 3
Condition 1 Condition 5 Condition 4 Condition 3
87
where temperature T and pressure P are fixed in this set of experiments, then Dg is the
same in different conditions.
Boundary layer thickness is proportional to
in which μ is gas viscosity, ρ is gas density, x is the location and U is the gas velocity. In
conditions of blend test, x and U are constant, then the boundary is affected by gas
viscosity and density.
Therefore, in the blend tests conditions, the pyrolytic soot deposition rate on metal
surface is determined by
(
)
The more soot nucleation in the atmosphere does not necessary leads to more soot
deposition on the metal surface.
However, correlating figure 11(a) and (b), the more soot deposits on the metal surface,
the less penetration depth it is in the narrow gap between contact parts.
Therefore, the best combination of results has been achieved in condition 4, with enough
carbon flux on coupon, but less soot in atmosphere and on metal surface, therefore largest
penetration depth within contact zone.
3.4 Graphite filaments growth on metal surface
Graphite filaments are observed on metal surface, which appear as bright spots in figure
12(a). There are large amount of filaments as seen in the optical image from condition 1.
For condition 3, 4 and 5, only sporadic filaments are shown.
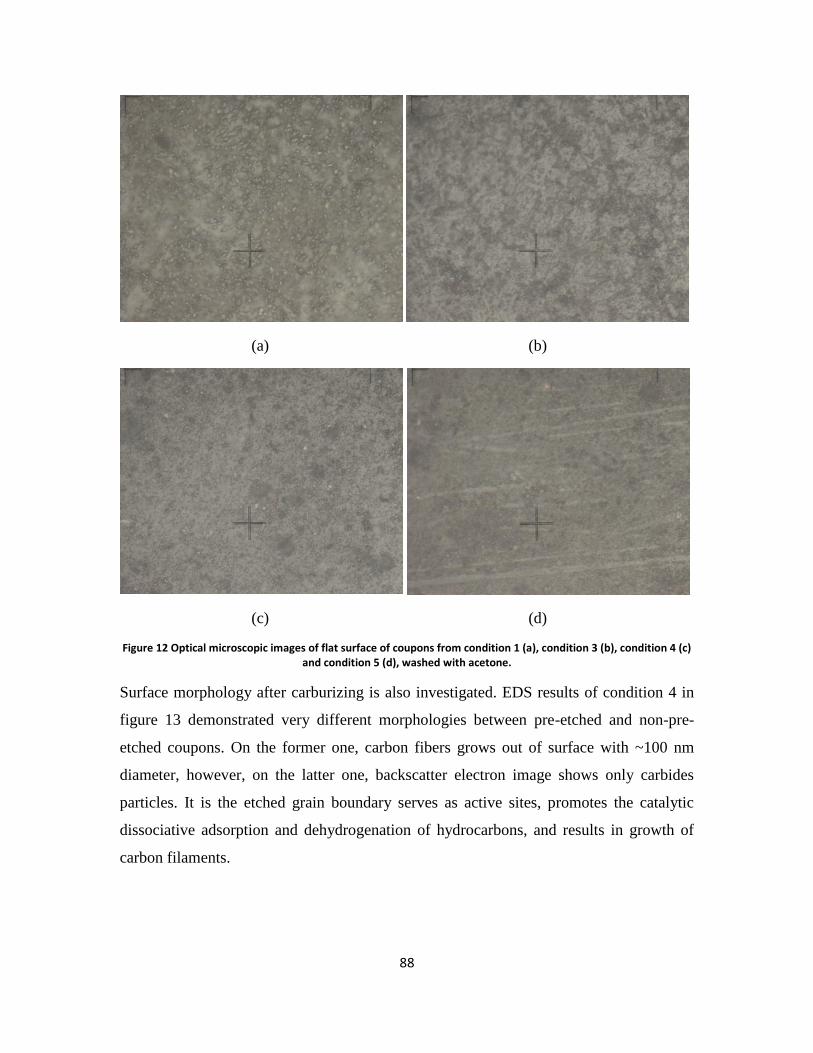
88
(a) (b)
(c) (d)
Figure 12 Optical microscopic images of flat surface of coupons from condition 1 (a), condition 3 (b), condition 4 (c) and condition 5 (d), washed with acetone.
Surface morphology after carburizing is also investigated. EDS results of condition 4 in
figure 13 demonstrated very different morphologies between pre-etched and non-pre-
etched coupons. On the former one, carbon fibers grows out of surface with ~100 nm
diameter, however, on the latter one, backscatter electron image shows only carbides
particles. It is the etched grain boundary serves as active sites, promotes the catalytic
dissociative adsorption and dehydrogenation of hydrocarbons, and results in growth of
carbon filaments.

89
(a)
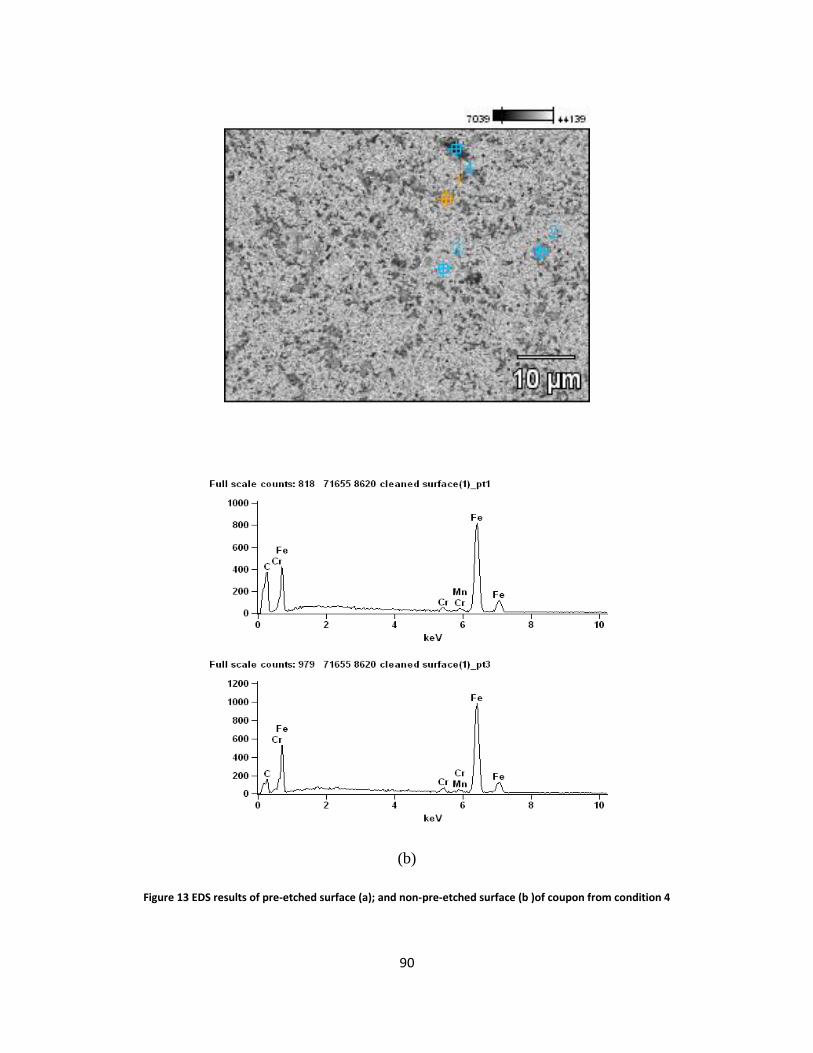
90
(b)
Figure 13 EDS results of pre-etched surface (a); and non-pre-etched surface (b )of coupon from condition 4

91
4. Discussion
4.1 Computational fluid dynamic study of gas flow
A computational fluid dynamic study is used to demonstrate the gas flow pattern within
the furnace for different loading configurations. Geometry used in CFD for industrial
integral quench furnace is demonstrated in figure 14. After stirring by the fan and flowing
around the muffler, gas stream flows into the hot chamber through 3 columns by 10 rows
of bottom vents. Charging trays are stacked on top of middle 8 rows of vents. To
maximize production efficiency, traditionally, components are densely packed in trays.
Demonstrated in fluid dynamic prediction of gas velocity at longitudinal cross section in
figure 15(a), it is showing that the velocity vectors through trays are very slow compare
to the other parts within the furnace. The slow gas velocity leads to thick boundary layer
at the near surface thus results in slow diffusion within it. Meanwhile, in figure 15(b), the
gas velocity vectors at lateral cross section prefer spreading out of the charging tray to
going through them. Therefore, less carbon resource and non-uniform gas stream are
provided to the parts in trays, leading to slow carburizing rate and non-uniform
carburizing effect between top and bottom sides on components, and average hardness
deviations among trays.
Figure 14 Geometry of industrial integral quench furnace used in CFD modeling

92
(a)
(b)
Figure 15 Computational fluid dynamic model showing gas velocity vectors through trays (200scfh, 1.5% C3H8), (a) cross sectional; (b) lateral; assuming homogeneous resistance throughout the tray volume, horizontal resistance as
60% packed, vertical resistance as 80% packed
To have more gas stream introduce into trays, the center channel design is considered.
Two ends of each channel are covered by solid stainless steel sheet, as well as the top of
the channel in top tray. Different configurations of this design are listed in table 4. Mass
flow per unit metal at the open side borders of the corresponding tray in each model are
[m/s]

93
calculated from CFD simulation, from tray 1 to tray 4 are the trays from bottom to top
respectively.
Table 4 Conditions of four center channel loading configurations
Model 1 trays Model 2 trays Model 3 trays Model 4 trays
1 2 3 4 1 2 3 4 1 2 3 4 1 2 3 4
Center channel width a* a a a 0.5a
Packing height Full 2/3 full Full Full Full
Top tray full metal cover No No Yes Yes
* a equals to the width of middle column vents.
In model 1 and model 2 (figure 16(a)), most inflow from center vents escapes from top
tray, most inflow from side vents escapes from bottom tray. Mass flow per unit metal
difference between first 2 models is limited.
(a)
Rad
iant t b s
2
1
3
4
fan
Floo with v nts

94
(b)
Figure 16 CFD simulation of center channel configuration model 2(a), and model 3 (b), showing gas velocity vectors (m/s)
However, with the introduction of entire top tray metal sheet cover in model 3, shown in
figure 16(b), gas stream from the center vents flows into the center channel, forced by the
top metal sheet cover, the part that escapes out from the top tray flows horizontally
through each tray to achieve the uniform carburizing.
In table 5, uniformity of mass flow per unit metal in model 3 is largely improved with top
metal sheet cover. In model 4, the channel in top tray is narrowed to ½ width of channels
in other tray, mass flow per unit metal at top tray is even further decreased, over
corrected the improvement in model 3. Therefore, an intermediate design with ¾ width
channel is utilized in industrial practice T4. In consequence, average hardness deviation
among trays and hardness non-uniformity between parts top and bottom sides are
improved as described in section 3.1, due to more uniform mass flow over trays and
horizontal gas stream through each tray.

95
Table 5 Mass flow (kg/s) per kg-metal through trays of different center channel loading configurations calculated from CFD simulation
Gas kg/s per kg-metal Model 1 Model 2 Model 3 Model 4
Tray 1 3.80E-04 3.30E-04 4.80E-04 5.00E-04
Tray 2 2.67E-04 4.00E-04 3.67E-04 3.84E-04
Tray 3 3.00E-04 7.41E-04 4.34E-04 4.46E-04
Tray 4 9.07E-04 8.74E-04 5.54E-04 3.77E-04
4.2 Mechanism of soot formation and deposition
In hydrocarbon atmosphere, a sequence of complex polymerization processes is involved,
resulting in a variety of high molecular weight products [19], which is considered as
polycyclic aromatic hydrocarbons (PAH). PAH may condense into liquid drops, even at
high temperature, and deposits as tar, or maybe further carbonized in the gas to originate
soot [23] in the form of spherical particles consisting of small crystallites [19].
In A2A carburizing, to preserve the advantages of vacuum carburizing but still keep
production efficiency as in gas carburizing, components are inevitably touching each
other, leading to the poorly carburized contact area (figure 7). In figure 17, gas flow in
the crevice between two parts is stagnant, which increases the boundary layer thickness,
lowers the diffusion of carbon resource from atmosphere to metal surface, slows down
the carburizing rate and therefore results in less carburizing area. At the same time, a
large amount of soot and tar are easily generated in the non-equilibrium atmosphere,
deposit in the crevice area, and act as diffusion barrier for further diffusion of carbon
source. Thus, soot control in atmosphere is an effective method to minimize the poorly
carburized contact area and improve the carburizing evenness.
However, different from catalytic soot formation on top of cementite [14, 24] when
austenite solubility has been reached, it is observed that soot forms at flow stagnant areas,
and deposit on the dark perimeter where cementite is not formed, as shown in figure 8(e).
It is speculated that it is pyrolytic carbon that will deposit on metal with or without the
formation of cementite. This kind of carbon layer in vacuum carburizing has been
reported to be fine crystalline graphite [25] and active hydrocarbons of different
saturation degree [26, 27], which can constitutes an additional carbon source [25-27].
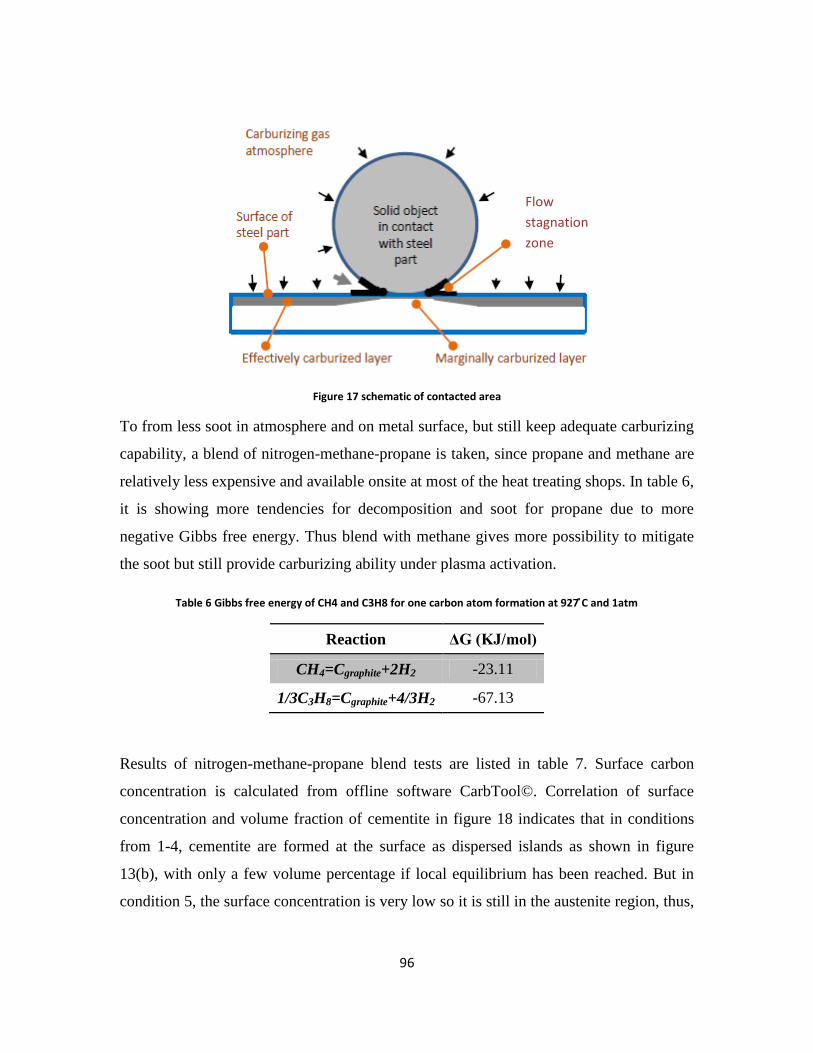
96
Figure 17 schematic of contacted area
To from less soot in atmosphere and on metal surface, but still keep adequate carburizing
capability, a blend of nitrogen-methane-propane is taken, since propane and methane are
relatively less expensive and available onsite at most of the heat treating shops. In table 6,
it is showing more tendencies for decomposition and soot for propane due to more
negative Gibbs free energy. Thus blend with methane gives more possibility to mitigate
the soot but still provide carburizing ability under plasma activation.
Table 6 ibbs f n of 4 and 3 fo on a bon ato fo ation at 2 and 1at
Reaction ΔG (KJ/mol)
CH4=Cgraphite+2H2 -23.11
1/3C3H8=Cgraphite+4/3H2 -67.13
Results of nitrogen-methane-propane blend tests are listed in table 7. Surface carbon
concentration is calculated from offline software CarbTool©. Correlation of surface
concentration and volume fraction of cementite in figure 18 indicates that in conditions
from 1-4, cementite are formed at the surface as dispersed islands as shown in figure
13(b), with only a few volume percentage if local equilibrium has been reached. But in
condition 5, the surface concentration is very low so it is still in the austenite region, thus,
Flow
stagnation
zone

97
no cementite is formed on surface. However, in figure 11(a), soot is observed on every
tape regardless of the cementite formation.
Table 7 Calculated surface carbon concentration from flux on coupon for nitrogen-hydrocarbons blend tests
conditions Inlet
C3H8 (%)
Inlet
CH4 (%)
Flux on coupon
(10-7
g/cm2/s)
Calculated surface
carbon concentration
(wt.%)
1 1.8 4 6.51 1.36
2 1.8 0 6.84 1.40
3 0.4 4 5.85 1.27
4 0.4 1 6.03 1.30
5 0.4 0 0.82 0.41
Figure 18 Volume fraction of cementite on AISI 93xx, 86xx, 51xx, 43xx at 930 °C and 1 atmosphere
Therefore, if soot or tar precipitates in the atmosphere, it will diffuse through the
boundary and deposit on the metal surface, the deposition rate is affected by several
factors as discussed in section 3.3. This type of soot can be removed with tape if the parts
are cooled with furnace as the experimental condition, however, it will become a sticky
layer attached on the surface when parts are quenched in oil, and leave the dark sooty
areas. Atmosphere composition control is able to alleviate the pyrolytic soot or tar in the
atmosphere (figure 10), increase the carburizing penetration depth into the contact area
93XX
86XX
43XX
51XX

98
(figure 11), minimize the marginally carburized area and thus improves the process
quality.
In consequence, the following mechanism is proposed in figure 19. In non-equilibrium
atmosphere at practical carburizing temperature, soot particles and PAH clusters
precipitate easily from the gas phase just like snowflakes and would be easy to
condensate on metal surface as a pyrolytic soot layer. The graphitic crystalline soot
constitutes carbon resource. If the metal surface can absorb carbon fast enough, like
many low-carbon steels, the carburizing is uninterrupted. When carbon atoms
supersaturate in austenite matrix, and activity of carbon is larger enough to stabilize
carbides, precipitates form at the grain boundary. Carbides and cementite is claimed to
be catalytic to carbon deposition by many researchers [9, 10, 14, 17, 20]. When there are
suitable nucleation sites are available, as shown in figure 13(a), the etched grain
boundary, graphite nucleates and increases carbon activity larger than 1, then cementite
becomes unstable and starts to decompose. The decomposed carbon atoms attach to the
graphite plane and metal atoms migrate through graphite by gradient to the tip of the
filament, agglomerating to the clusters and particles which act as catalysts for further
carbon deposition [12], therefore elongate the graphite filaments. This type of carbon
deposition of filaments has been reported as the major fraction of any catalytic carbon
deposition [14-19], and on iron base alloys surface, it prefers forming in higher carbon
hydrocarbons to forming in methane [20]. In consequence, in figure 12(a) without any
active sites on metal surface, a large amount of carbon filaments is investigated on the
surface of coupon from condition 1, which has much more propane than conditions 3-5;
however, on the surface of coupons from conditions 3-5, only scattered bright spots are
observed. When the grain boundary is etched before carburizing, the dissociative
adsorption and dehydrogenation of hydrocarbons is promoted, providing active sites for
graphite nucleation and filaments growth as shown in figure 13(a). But in figure 13(b),
without active sites, only isolated carbides are observed in backscatter electron
microscope image.
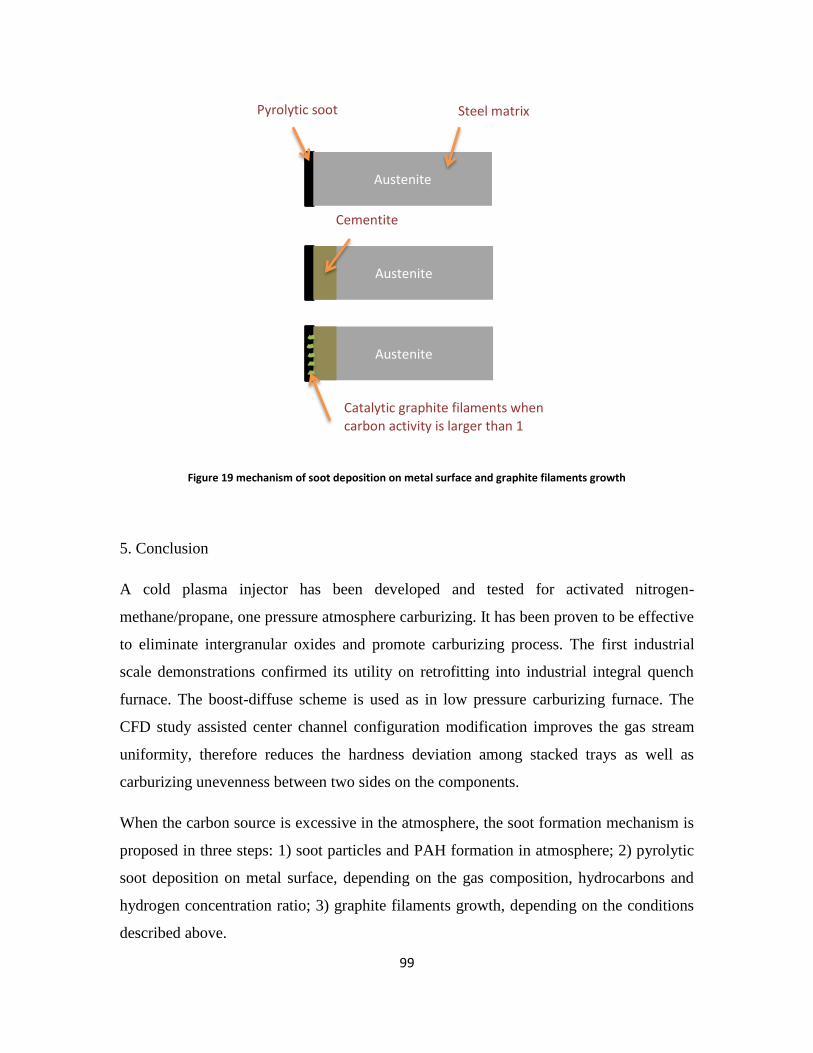
99
Figure 19 mechanism of soot deposition on metal surface and graphite filaments growth
5. Conclusion
A cold plasma injector has been developed and tested for activated nitrogen-
methane/propane, one pressure atmosphere carburizing. It has been proven to be effective
to eliminate intergranular oxides and promote carburizing process. The first industrial
scale demonstrations confirmed its utility on retrofitting into industrial integral quench
furnace. The boost-diffuse scheme is used as in low pressure carburizing furnace. The
CFD study assisted center channel configuration modification improves the gas stream
uniformity, therefore reduces the hardness deviation among stacked trays as well as
carburizing unevenness between two sides on the components.
When the carbon source is excessive in the atmosphere, the soot formation mechanism is
proposed in three steps: 1) soot particles and PAH formation in atmosphere; 2) pyrolytic
soot deposition on metal surface, depending on the gas composition, hydrocarbons and
hydrogen concentration ratio; 3) graphite filaments growth, depending on the conditions
described above.
Austenite
Austenite
Austenite
Steel matrix Pyrolytic soot
Cementite
Catalytic graphite filaments when carbon activity is larger than 1

100
The nitrogen-hydrocarbons blend tests illustrate that in the condition with 0.4% propane
and 1% methane, the optimized results has been achieved. In this condition, sufficient
carbon flux has been obtained, but with least soot deposition on metal surface and in
atmosphere. Meanwhile graphite filaments grown on metal surface are investigated, its
formation is associated with hydrocarbons type, cementite/carbides formation and surface
catalytic sites. Therefore, soot mitigation in atmosphere and on metal surface can be
achieved by control of the gas composition. The carbon filaments elimination can be
obtained by control of cementite formation and surface condition.
Acknowledgement
The authors would like to thank Mr. John Green for laboratory supports, Mr. Guido
Plicht for industrial practices implementation and Air Products and Chemicals, Inc for
funding, managing and permitting to publish this work. The continuous support from
Center for Heat Treating Excellence at Worcester Polytechnic Institute is grateful
acknowledged.
References
[1] Wang, X., Zurecki, Z., and Sisson Jr., R. D., 2012, "Development of Nitrogen-
Hydrocarbon Atmospheric Carburizing and Process Control Methods," Journal of
Materials Engineering and Performance, DOI: 10.1007/s11665-012-0294-0.
[2] YAGITA, K., and OHKI, C., 2010, "Plasma Nitriding Treatment of High Alloy Steel
for Bearing Components," NTN TECHNICAL REVIEW, Vol.78, pp. 33-40.
[3] Zhaoa, G., and et al., 2006, "Methane Conversion in Pulsed Corona Discharge
Reactors," Chemical Engineering Journal, Vol.125, pp. 67-79.
[4] Kado, S., and et al., 2004, "Diagnosis of Atmospheric Pressure Low Temperature
Plasma and Application to High Efficient Methane Conversion," Catalysis Today, Vol.89,
pp. 47-55.
[5] Li, X., and et al., 2004, "Methane Conversion to C2 Hydrocarbons and Hydrogen in
Atmospheric Non-Thermal Plasmas Generated by Different Electric Discharge
Techniques," Catalysis Today, Vol.98, pp. 617-624.

101
[6] Indarto, A., and et al., 2006, "Effect of Additive Gases on Methane Conversion using
Gliding Arc Discharge," Energy, Vol.31, pp. 2986-2995.
[7] Zurecki, Z., and Wang, X., 2009, "Atmosphere carburizing using electric discharge-
activated nitrogen-natural gas mixtures," Proceedings of Heat Treating Conference and
Exposition 2009, Indianapolis, IN.
[8] Wang, X., 2011, "Activated Atmosphere Case Hardening of Steels," Dissertation,
Worcester Polytechnic Institute .
[9] Grabke, H. J., 1998, "Thermodynamics, Mechanisms and Kinetics of Metal Dusting,"
Materials and Corrosion, Vol.49, pp. 303-308.
[10] Grabke, H.J., and Schütze, M., 2007, "Corrosion by Carbon and Nitrogen - Metal
Dusting, Carburisation and Nitridation," Woodhead Publishing, pp. 331.
[11] Grabke, H. J., and Muller-Lorenz, E. M., 1995, "Effect of Sulfur on the Stability of
Cementite," Steel Research, Vol.66(6), pp. 254-258.
[12] Grabke, H. J., 2002, "Carburization, Carbide Formation, Metal Dusting, Coking,"
MATERIALI IN TEHNOLOGIJE, Vol.36(6), pp. 297-305.
[13] Wei, Q., Pippel, E., Woltersdorf, J., 1999, "Microprocesses of Coke Formation in
Metal Dusting," Materials and Corrosion, Vol.50, pp. 628-633.
[14] Young, D. J., and Zhang, J., 2012, "Metal Dusting: Catastrophic Corrosion by
Carbon," Journal of Minerals, Metals, and Materials Society, Vol.64(12), pp. 1461-1469.
[15] Horsley, G. W., and Cairns, J. A., 1984, "The Inhibition of Carbon Deposition on
Stainless Steel by Prior Selective Oxidation," Applications of Surface Science, Vol.18, pp.
273-286.
[16] Zhang, J., Boddington, K., and Young, D. J., 2008, "Oxidation, Carburisation and
Metal Dusting of 304 Stainless Steel in CO/CO2 and CO/H2/H2O Gas Mixtures,"
Corrosion Science, Vol.50, pp. 3107-3115.
[17] Bonnet, F., Ropital, F., Berthier, Y., 2003, "Filamentous Carbon Formation Caused
by Catalytic Metal Particales from Iron Oxide," Materials and Corrosion, Vol.54(11), pp.
870-880.

102
[18] Toh, C. H., Munroe, P. R., Young, D. J., 2003, "High Temperature Carbon
Corrosion in Solid Oxide Fuel Cells," Materials at Hight Temperatures, Vol.20(2), pp.
129-136.
[19] Figueiredo, J. L., 1999, "Reactivity of Coke Deposited on Metal Surfaces,"
Materials and Corrosion, Vol.50, pp. 696-699.
[20] Brown, A. M., and Hill, M. P., 1983, "The characterization of carbon deposit
morphologies using in situ scanning electron microscopy," ACS Symposium Series,
American Chemical Society: Washington, DC, pp. 193-222.
[21] Ipsen, Inc., Http://Www.Ipsenusa.Com/Index.Php .
[22] Martin, P.M., 2010, "Handbooks of deposition technologies for films and coatings
(Third edition)," Elsevier Inc., pp. 912-314.
[23] Trimm, D.L., 1982, "Progress in catalyst deactivation," Martinus Nijhoff
Publishers, The Hague .
[24] Kula, P., 2005, "Vacuum Carburizing—process Optimization," Journal of Materials
Processing Technology, Vol.164, pp. 876-881.
[25] Gorockiewics, R., and Lapinski, A., 2010, "Structure of the Carbon Layer
Deposited on the Steel Surface After Low Pressure Carburizing," Vacuum, 85, pp. 429-
433.
[26] G k R I ż ł 5(152), pp. 981-984.
[27] K P k D P k R I ż ł 5(152), pp.
1092-1096.

103
Paper #4: Modeling of carbon distribution during atmosphere and low
pressure carburizing processes (published in Journal of Materials
Engineering and Performance, Vol.22(1), 2013, DOI:10.1007/s11665-012-0353-
6)
Y. Wei, L. Zhang, R.D. Sisson, Jr.,
Center for Heat Treating Excellence, Worcester Polytechnic Institute, Worcester, MA, USA
(Submitted June 15, 2012)
(Footnote to go above the author info and special issue footnotes): This paper is an updated version of
the 2011 HTS-Bodycote Best Paper in Heat Treating, which won the award unde “I H
: P ” H B P
in Heat Treating Award in 1997 to recognize a paper that represents advancement in heat-treating
technology, promotes heat treating in a substantial way, or represents a clear advancement in managing the
business of heat treating. The award, endowed by Bodycote Thermal Process-North America, is open to all
students, in full time or part-time education, at universities (or their equivalent) or colleges. It also is open
to those students who have graduated within the past three years and whose paper describes work
completed while an undergraduate or post graduate student. The subject matter of the paper is required to
cover any aspect of research or development applied to the fields of heat treatment, surface engineering, hot
isostatic pressing (hip), metallurgical coatings, testing, or materials processing, including any production
process, information technology, or relevant management or business issues.
Footnote: This article is an invited paper selected from presentations at the 26th ASM
Heat Treating Society Conference, held October 31 through November 2, 2011, in
Cincinnati, Ohio, and has been expanded from the original presentation.
Abstract
Heat treaters need an effective simulation tool to predict the carburization performance of
a variety of steels. The tool is needed not only to predict the carbon profile but also to
optimize the process in terms of the cycle time and the total cost. CarbTool has been
developed to meet these needs for gas and vacuum carburization. In this paper,

104
CarbTool predictions were compared with industrial experimental results for three
types of steels (AISI 8620, 5120, 4320), heat treated by both gas and vacuum carburizing
processes. Based on the agreement of model predictions and experimental results, it is
found that CarbTool could be used to predict the carbon concentration profile for a
variety of alloys in both gas and vacuum carburizing processes.
Keywords: Simulation, Gas carburizing, Vacuum carburizing, CarbTool
1. Introduction
Carburizing media are divided into three kinds: liquid, solid carbonaceous compounds,
and atmospheric. In both gas and vacuum carburization processes, the steel part is
subjected to an atmosphere with high carbon potential.
The optimization of the industrial carburizing parameters is typically pursued by a trial
and error method. In addition to being time consuming and expensive, this approach
yields suboptimal results at best [1]. In this paper, effective gas and vacuum carburizing
models are presented. The models may also be used to optimize the processes.
1.1 CarbTool – Carburizing Simulation Tool
A simulation program has been developed by CHTE (Center for Heat Treatment
Excellence) for the calculation of the carbon concentration profile during the gas and
vacuum carburizing processes.
The solution algorithm used in CarbTool is based on the finite difference method
(FDM), and the code is developed using Microsoft Visual C++ in Window OS. The tool
has been built on the concept of the carbon flux at the surface between the gas and steel is
to be specified by the user. The outputs of CarbTool are the carbon concentration
distribution profile inside the steel part and the surface carbon concentration profile as a
function of time.
105
Users input parameters about the carburization process, such as carburization temperature,
carburizing time, and carbon potential or carbon flux. After a quick simulation the carbon
profile along the distance below the surface can be plotted with the case depth labeled
according to a user defined value.
CarbTool has two modules – Gas carburizing and vacuum carburizing. The functions
for each module are listed below:
1) Gas Carburization: variable operating temperature, constant mass transfer coefficient,
variable carbon potential, single boost-diffuse process, data export of carbon profile at
certain interval and final time, effective case depth indication at 0.35 wt.% carbon or
other user defined condition.
2) Vacuum Carburization: variable operating temperature, constant flux process design,
cementite transformation indication, cyclic and non-cyclic boost-diffuse process design,
data export of carbon profile at certain interval and final time, effective case depth
indication at 0.35 wt.% carbon or other user defined condition.
1.2 Gas Carburizing Model
Gas carburizing is a complex phenomenon which involves three distinct stages [3]: 1)
carbon transport from the atmosphere to the steel surface, 2) surface reductive chemical
reactions, and 3) diffusion of the absorbed carbon atoms towards the bulk of the steel
down the chemical potential gradient. Total carbon transfer from the atmosphere to the
steel is thus determined by the limiting process, which kinetically becomes the rate
controlling stage of carburizing. Figure 1 shows the mechanisms of carbon transfer
during carburizing and the primary control parameters: the mass transfer coefficient
/ β x / 2/s) (J) from the atmosphere to the steel
surface and the coefficient of carbon diffusion in steel (D) at Austenizing temperatures
[2].
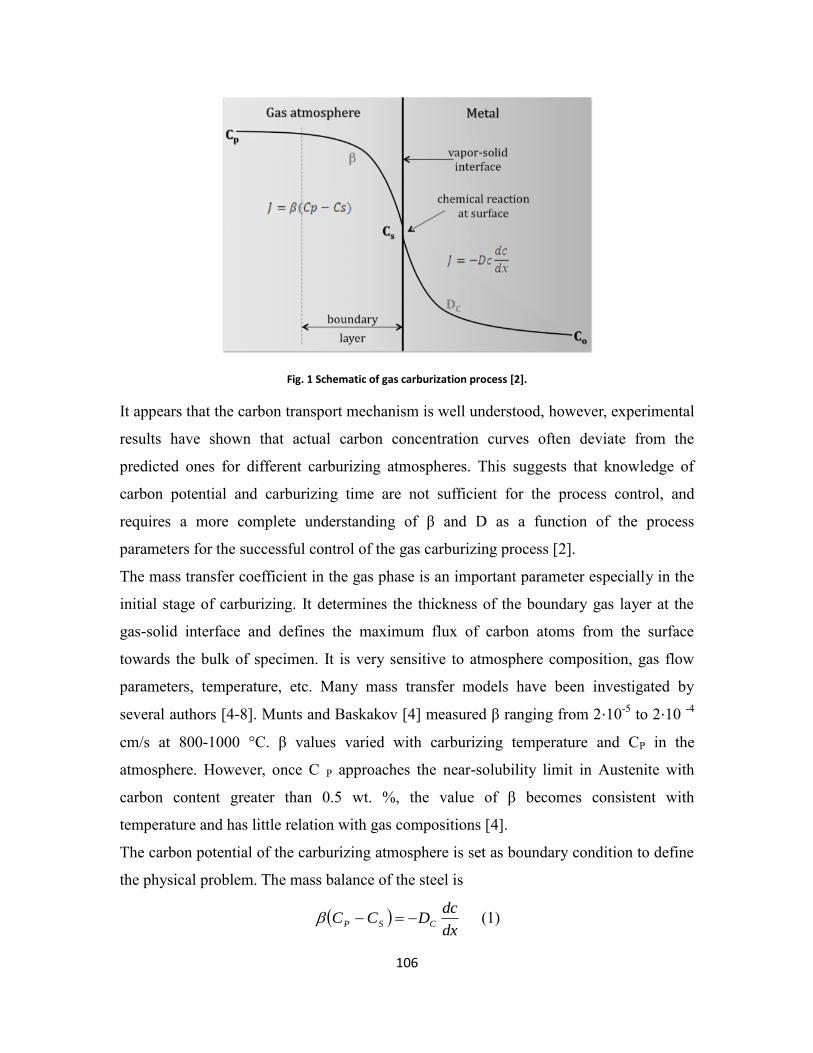
106
Fig. 1 Schematic of gas carburization process [2].
I x
k
q β D
[ ]
I k
- x x
k I
[ - ] B k k [ ] β ⋅ - ⋅ -
/ - ° β P
H P -
% β
[ ]
dx
dcDCC CSP

107
1.3 Vacuum Carburization Model
I q H H
q
H x
I q
F k’
000 ||| xxxdx
dCDJ
x= -
D
q k
x I
% F O
% B
F

108
(a)
(b)
Fig. 2 Fe-Fe3C phase diagram (a) and 93xx isopleth diagram (b).

109
Current commercial carburization simulation software does not consider the formation of
carbides on the steel surface [10]. When surface carbon concentration of 93xx steel is
plotted as a function of time during carburizing process, the surface carbon concentration
will increase beyond the solubility limit, as seen in Figure 3. But in reality, the steel will
start to form cementite at 1.03 wt.% carbon (as seen in Figure 4). Therefore in simulation
it is necessary to consider the maximum solubility of carbon in Austenite, otherwise, the
formation of carbides will not be considered, carburizing model calculation after
formation of carbides will be affect, and finally lead to a discrepant result. CarbTool
indicates at which carbon concentration cementite will start to form, and shows the
cementite volume fraction along with increasing total carbon content. In this case,
cementite formation in processes can be controlled.
Fig. 3 Output of carbon concentration as the function of time of single boost and diffuse vacuum carburizing
To determine the Austenite maximum carbon solubility, ThermoCalc was utilized to
draw the diagram of mole fraction of cementite for alloys. The diagram for 93xx, 86xx,
51xx, 43xx and 10xx was drawn and presented in Figure 4. As seen in Figure 4, the
carbon solubility of 93xx is the least, approximately at 1.0 wt. % carbon, while the limits
of other alloys are larger, which is corresponding to the decreasing Cr percentage in the
alloys.

110
Fig. 4 Mole fraction diagram of AISI 93xx, 86xx, 51xx, 43xx and 10xx.
2. Experimental Procedure
I q
x
Table 1 Chemical Composition (wt %) of alloys at room temperature
C Cr Fe Mn Mo Ni P S Si
8620 0.18 –
0.23
0.40 –
0.60 Bal.
0.70 –
0.90
0.15 –
0.25
0.40 –
0.70
0 –
0.035
0 –
0.040
0.15 –
0.30
5120 0.17 –
0.22
0.70 –
0.90 Bal.
0.70 –
0.90 0 0
0 –
0.035
0 –
0.040
0.15 –
0.30
4320H 0.17 –
0.23
0.35 –
0.65 Bal.
0.40 –
0.70
0.20 –
0.30
1.55 –
2.00
0 –
0.035
0 –
0.040
0.15 –
0.30
j ± %
± % ”

111
= % R
F
G
©
Fig. 5 Geometry of sample
°F
k °F
q F
L
Fig. 6 Process schematic of gas carburizing
Φ
76.2 mm

112
Table 2 Process parameters for gas carburizing
%
%
%
- °F
°F
q F
Fig. 7 Process schematic of vacuum carburizing
Table 3 Process parameters for vacuum carburizing
x
/ /
B
D
B
D
H
E-
E-
E-

113
O E OE -
3. Results and discussion
3.1 Gas Carburizing in endothermic gas
F
F F F
F
Fig. 8 Surface carbon concentration changes along with carburizing time on 8620, 5120 and 4320.
Fig. 9 Carbon profiles after boost step and diffuse step on 8620, 5120 and 4320.
- F
x Ex

114
Fig. 10 Comparison between experimental and predicted carbon profiles from gas carburizing of 8620, 5120 and
4320.
Table 4 Gas carburizing results comparison between experiments and prediction
%
± ±
Ex
E D
±
Ex
3.2 Vacuum Carburizing in Cyclohexane (C6H12)
x
F x
x
x
q
tA
xfJ
Cox
0)(
I x x
k
x ;
k
Ex F

115
x D x
I
x
x I
x x
D - j
Fig. 11 Comparison between experimental and predicted carbon profiles from vacuum carburizing of 8620, 5120
and 4320.
3.3 Gas carburizing and vacuum carburizing results comparison
x
F -
4. Conclusion
I
x
116
Acknowledgments
H Ex H E W P
I k k
k I k
B B R P
I x k
References
[ ] “ B O O ” Surf. Eng.
V N
[ ] K k O “F G ” P D
D W P I
[ ] K k O “ P
N ” MS&T '06: Materials Science and Technology 2006
Conference and Exhibition
[ ] V “R ” Met. Sci. Heat Treat. V N -
-
[ ] P "K
" Metallic Materials V N -
[ ] R K “ R R G ” Haerterei-Technische
Mitteilungen V N -
[ ] R K " G D " Scand. J Metall. V
-

117
[ ] V " Ex D "
Met. Sci. Heat Treat. V N - -
[ ] Metals Handbook, Volume 8: Metallography, Structures
and Phase Diagrams. 8th Edition,
[ ] K P “V - ” 13th International
Scientific Conference on Achievement in Mechanical and Materials Engineering,
P

118
Paper #5: Intelligent Heat Treating: Simulation of Carburization Process
(published in Proceedings of the 26th ASM Heat Treating Society Conference,
Cincinnati, OH, Nov 2011, pp. 91-98)
Y. Wei, G. Wang, R.D. Sisson, Jr.,
Center for Heat Treating Excellence, Worcester Polytechnic Institute, Worcester, MA, USA
B. Bernard, R. Poor
Surface Combustion, Inc. Maumme, OH, USA
Keywords: Modeling, Gas carburizing, Vacuum carburizing, CarbTool
Abstract
Heat treaters need an effective simulation tool to predict the carburization performance of
a variety of steels. The tool is needed not only to predict the carbon profile but also to
optimize the process in terms of the cycle time and the cost. CarbTool has been
developed to meet these needs for gas and vacuum carburization. In this paper,
CarbTool predictions were compared with industrial experimental results of four types
of steels, heat treated by both gas and vacuum carburizing processes. Based on the
excellent agreement of model predictions and experimental results, CarbTool may be
used to predict the carbon concentration profile for a variety of alloys in both gas and
vacuum carburizing processes.
Introduction
Carburizing media are divided into three kinds: liquid, solid carbonaceous compounds,
and atmospheric. In both gas and vacuum carburization processes, the steel part is
subjected to an atmosphere with high carbon potential.

119
The optimization of the industrial carburizing parameters is typically pursued by a trial
and error method. In addition to being time consuming and expensive, this approach
yields suboptimal results at best [1]. In this paper, effective gas and vacuum carburizing
models are presented. The models may also be used to optimize the processes.
Carburizing Modeling
In this section carburization models for gas carburizing and vacuum carburizing
processes developed at CHTE (Center for Heat Treatment Excellence) are presented and
discussed.
CarbTool – Carburizing Simulation Tool
A simulation program has been developed by CHTE for the calculation of the carbon
concentration profile during the carburizing processes.
The solution algorithm used in CarbTool is based on the finite difference method
(FDM), and the code is developed using Microsoft Visual C++ in Window OS. The tool
has been built so that the carbon flux at the surface between the gas and steel is to be
specified by the user [2]. The outputs of CarbTool are the carbon concentration
distribution profile inside the steel part and the surface carbon concentration profile as a
function of time.
Users input parameters about the carburization process, such as carburization temperature,
carburizing time, and carbon potential or carbon flux. After a quick simulation the carbon
profile along the distance below the surface can be plotted with the case depth labeled
according to a user defined value.
CarbTool has two modules – Gas carburizing and vacuum carburizing. The functions
for each module are listed below:
1) Gas Carburization
Variable operating temperature;
Constant mass transfer coefficient;

120
Variable carbon potential;
Single boost-diffuse process;
Data export of carbon profile at certain interval and final time;
Effective case depth indication at 0.35 wt.% carbon or other user defined
condition.
2) Vacuum Carburization
Variable operating temperature;
Constant flux process design;
Cementite transformation indication;
Cyclic and non-cyclic boost-diffuse process design;
Data export of carbon profile at certain interval and final time;
Effective case depth indication at 0.35 wt.% carbon or other user defined
condition.
Gas Carburizing Model
Gas carburizing is a complex phenomenon which involves three distinct stages [3]: 1)
carbon transport from the atmosphere to the steel surface, 2) surface reductive chemical
reactions, and 3) diffusion of the absorbed carbon atoms towards the bulk of the steel
down the chemical potential gradient. Total carbon transfer from the atmosphere to the
steel is thus determined by the limiting process, which kinetically becomes the rate
controlling stage of carburizing. Figure 1 shows the mechanisms of carbon transfer
dur : β
defining carbon atoms flux (J) from the atmosphere to the steel surface and the
coefficient of carbon diffusion in steel (D) at Austenizing temperatures [2].

121
Fig. 1 Schematic of gas carburization process [2].
Mass Transfer Coefficient
A constant value for the mass transfer coefficient is applicable for most cases since once
the carbon potential approaches the near-solubility limit in Austenite with carbon content
% β
relation with gas compositions [5].
The carbon potential of the carburizing atmosphere is set as the boundary condition to
define the physical problem. The mass balance of the steel is
dx
dcDCC CSP (1)
Vacuum Carburization Model
Boundary Conditions
In vacuum carburizing, a small quality of hydrocarbon gas (i.e. C2H2, C6H12) is added to
a vacuum furnace. The addition creates a very high carbon potential. In fact, in some
cases soot may form. Therefore, the mass balance boundary condition is not applicable
for this process. However, a constant surface flux can be used. It is assumed that the

122
amount of carbon produced by the surface reactions is equal to the mass flow rate for
F k’
000 ||| xxxdx
dCDJ (2)
where x=0 at the gas-steel surface.
Process Control – Surface Carbon Saturation
During vacuum carburizing, the surface concentration of carbon can exceed the Austenite
solubility limit due to the high carbon flux and might form carbides [5,6]. In plain carbon
steel, cementite will start forming at 1.3 wt.% carbon (point A) at 925 C, as shown in
Figure 2 (a). In alloy steel, the saturation point is reached at 1.0 wt.% carbon (point B) at
the same temperature, as shown in Figure 2 (b).
(a)

123
(b)
Fig. 2 Fe-Fe3C phase diagram (a) and 93xx isopleth diagram (b).
Current commercial carburization simulation software does not consider the formation of
carbides on the steel surface [8]. When surface carbon concentration of 93xx steel is
plotted as a function of time, the surface carbon concentration will increase beyond the
solubility limit, as seen in Figure 3. But in reality, the steel will start to form cementite at
1.03 wt.% carbon (as seen in Figure 4). Therefore in simulation it is necessary to consider
the maximum solubility of carbon in Austenite, otherwise, the formation of carbides will
not be identified. CarbTool indicates at which carbon concentration cementite will start
to form, and shows the cementite volume fraction along with increasing total carbon
content. In this case, cementite formation in processes can be controlled.

124
Fig. 3 Output of carbon concentration as the function of time of single boost and diffuse vacuum carburizing
To determine the Austenite maximum carbon solubility, ThermoCalc was utilized to
draw the diagram of mole fraction of cementite for alloys. The diagram for 93xx, 86xx,
51xx, 43xx and 10xx was drawn and presented in Figure 4. As seen in Figure 4, the
carbon solubility of 93xx is the least, approximately at 1.0 wt. % carbon, while the limits
of other alloys are larger.
Fig. 4 Mole fraction diagram of AISI 93xx, 86xx, 51xx, 43xx and 10xx.

125
Case Study
In a current case, identical carbon profiles for a series of steels are required for fatigue
testing. These profiles need to be achieved by gas carburizing as well as vacuum
carburizing in cyclohexane. The modeling was used to revise the processes to achieve the
same surface carbon concentration and effective case depth.
Carburizing Samples
Chemistry
Four materials were chosen, which need to obtain the same carburized properties after
both gas and vacuum carburizing. Table 1 is the chemistry (AISI and UNS) of each steel.
Table 1 Chemical Composition (wt %) at room temperature
C Cr Fe Mn Mo Ni P S Si
9310 0.08 –
0.13
1.00 –
1.40 Bal.
0.45 –
0.65
0.08 –
0.15
3.00 –
3.50
0 –
0.025
0 –
0.035
0.15 –
0.30
8620 0.18 –
0.23
0.40 –
0.60 Bal.
0.70 –
0.90
0.15 –
0.25
0.40 –
0.70
0 –
0.035
0 –
0.040
0.15 –
0.30
5120 0.17 –
0.22
0.70 –
0.90 Bal.
0.70 –
0.90 0 0
0 –
0.035
0 –
0.040
0.15 –
0.30
4320H 0.17 –
0.23
0.35 –
0.65 Bal.
0.40 –
0.70
0.20 –
0.30
1.55 –
2.00
0 –
0.035
0 –
0.040
0.15 –
0.30
Carburizing Objective
: ” = %
Surface carbon: 0.80 ± 0.05 for 8620 and 5120, 0.70 ± 0.05 for 4320 and 9310
Geometry
The geometry is shown in Figure 5.

126
Fig. 5 Geometry of sample
Gas Carburizing Process Development
Test samples were gas carburized in an industrial furnace using a boost and diffuse
method. The heat treating process is to heat up to 1700 °F and hold 3.5 hours in
endothermic gas at carbon potential of 0.95%, then diffuse at 1550 °F for 1 hour in
carbon potential of 0.8%, quench in oil at 140 °F and temper at 350 °F for 2 hours. Figure
6 presents the process schematic.
Φ
76.2 mm

127
Fig. 6 Process schematic of gas carburizing
The carbon-depth profile measurements of the carburized parts are performed using the
Optical Emission Spectrometer (OES). The model was calculated by inputting the
parameters of boost and diffuse cycles. Figure 7 presents the measured results and model
predictions from CarbTool. These results agreed very well, which verified the
effectiveness of CarbTool on predicting gas carburizing.
1700 °F, Cp=0.95wt.%
Time
210 min 60 min
1550°F, Cp=0.8wt.%
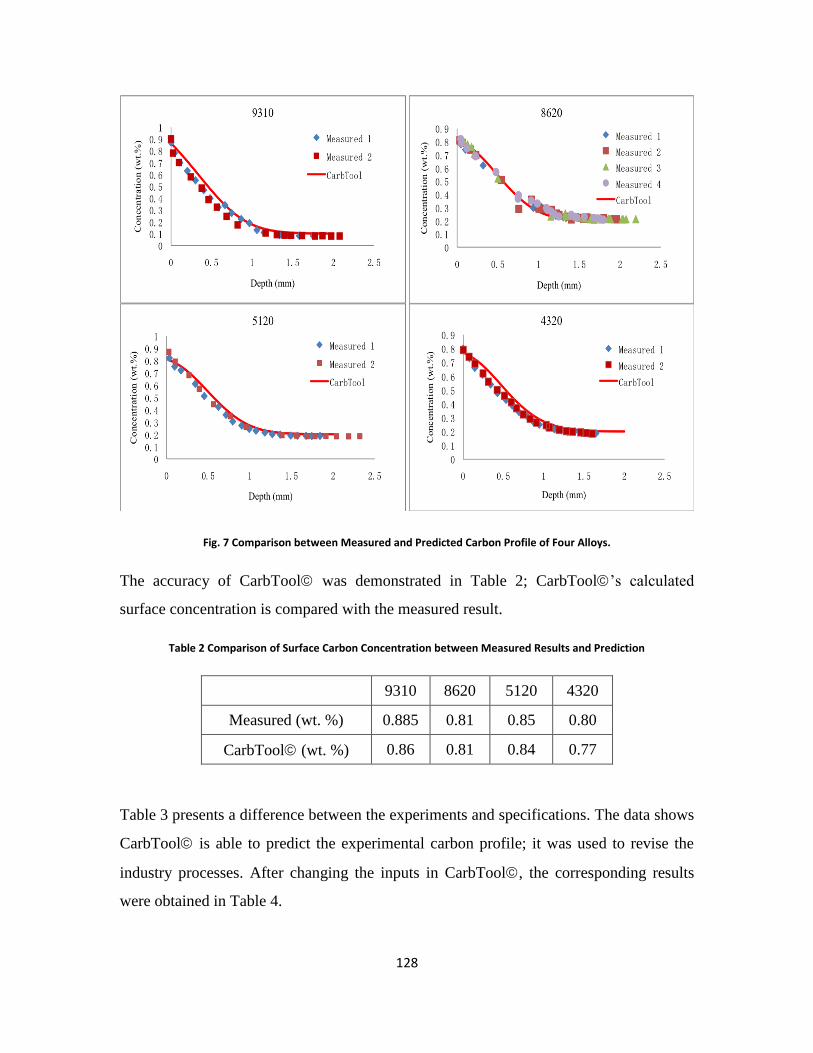
128
Fig. 7 Comparison between Measured and Predicted Carbon Profile of Four Alloys.
The accuracy of CarbTool was demonstrated in Table 2; CarbTool’
surface concentration is compared with the measured result.
Table 2 Comparison of Surface Carbon Concentration between Measured Results and Prediction
9310 8620 5120 4320
Measured (wt. %) 0.885 0.81 0.85 0.80
CarbTool (wt. %) 0.86 0.81 0.84 0.77
Table 3 presents a difference between the experiments and specifications. The data shows
CarbTool is able to predict the experimental carbon profile; it was used to revise the
industry processes. After changing the inputs in CarbTool, the corresponding results
were obtained in Table 4.

129
Table 3 Comparison between objective and experimental results
Materials
Surface concentration
(wt. %) Case depth (mm) Retained Austenite (%)
Specification Experimental Specification Experimental Specification Experimental
9310 0.70 ± 0.05
0.885(higher)
0.889
0.65(shallower)
20% - 30%
33.08
4320 0.8(higher) 0.67(shallower) 37.21
8620 0.80 ± 0.05
0.81 0.80(shallower) 19.04
5120 0.85 0.74(shallower) 23.54
Table 4 Gas carburizing predictions from CarbTool
9310 4320 8620 5120
Specification Surface concentration (wt.%) 0.7±0.05 0.8±0.05
Depth at 0.35 wt% carbon (mm) 0.889 0.889
Modeling Results Surface concentration (wt.%) 0.74 0.74 0.84 0.84
Depth at 0.35 wt% carbon (mm) 0.888 0.889 0.889 0.889
Process Determination of Vacuum Carburizing in Cyclohexane (C6H6)
9310 and 8620 were used for process development. Processes of the four alloys were set
up by industry based on experience and their own databases. In 9310 process, 9310 and
8620 were used. In the other three processes, 8620 coupons with different dimensions
were used. Table 5 demonstrates the trial tests.
From Figure 8, the flux of each process was calculated.
Table 5 Tentative test cycles
Process Test Material Diameter (mm) Calculated flux
Coupon 1 9310 9310 25.4 Flux 1
Coupon 2 9310 8620 12.7 Flux 2

130
Coupon 3 8620/5120 8620 25.4 Flux 3
Coupon 4 8620/5120 8620 12.7 Flux 4
Coupon 5 4320 8620 25.4 Flux 5
Fig. 8 Carbon profiles of test coupons.
The calculated flux was an input into CarbTool as a boundary condition; other
carburizing parameters (temperature, time and dimension) were kept the same with
industry process. The model then predicted carbon profiles of test coupons.
Although we already verified the effectiveness of CarbTool in gas carburizing, this
process has new feature in terms of temperature. Thus, here we verify CarbTool again.
As seen in Figure 9, the modeling results and experimental results agreed with each other
very well.
0.0
0.1
0.2
0.3
0.4
0.5
0.6
0.7
0.8
0.9
1.0
0.001 0.004 0.006 0.009 0.013 0.018 0.023 0.028 0.035 0.045
% W
t. C
arb
on
Depth (inches)
9310 in 9310 process
8620 in 9310 process
8620 in 8620/5120 process
8620 in 8620/5120 process
8620 in 4320 process

131
Fig. 9 Carbon profiles of test coupons and their modeling results.
Since the effectiveness of CarbTool has been proved in this process, the software was
utilized to model the fatigue test samples in their corresponding processes. In each
process, the calculated flux from the trial test was used as the boundary condition.
Meanwhile, diffusivity was changed from the test material (9310 or 8620) to the
corresponding material, and the diameter was changed to the correct size (9.525 mm
diameter).

132
“ ”
column in Table 6. The results do not match specification. Then carburized parameters
were tentatively changed in CarbTool, based on the basic knowledge of diffusion. Once
“ ” j
processes were obtained.
Table 6 Comparison between objective and different modeling
Process with
corresponding
material
Flux
Surface concentration (wt. %) Case depth (mm)
Specification Modeling 1 Modeling
2 Specification Modeling 1
Modeling
2
9310
Flux
1
0.70 ± 0.05
0.82(higher) 0.72
0.889
0.717(shallower) 0.878
Flux
2 0.84(higher) 0.73 0.727(shallower) 0.891
4320 Flux
5 0.94(higher) 0.69 0.829(shallower) 0.886
8620
Flux
3
0.80 ± 0.05
0.83(higher) 0.78 1.063(deeper) 0.883
Flux
4 0.85 0.8 1.079(deeper) 0.896
5120
Flux
3 0.84 0.8 1.040(deeper) 0.866
Flux
4 0.86(higher) 0.82 1.057(deeper) 0.878
Conclusion
The modeling tool, CarbTool, is effective in predicting the carbon profile for gas
carburizing and vacuum carburizing.
Carburization modeling will assist heat treaters to better understand the effects of process
parameters on the diffusion process, distribution of carbon concentration, and effective
case depth.
Effective modeling will save time and money over a variety of experimental trial.

133
Finally, the model will give engineers the possibility of optimizing the material, process
and design for achieving the optimum performance.
Acknowledgments
The support of the Center for Heat Treating Excellence (CHTE) at Worcester Polytechnic
Institute and the member companies is gratefully acknowledged. The author would thank
Timken Inc. for providing the raw materials and supporting in this work. The
carburization heat treatments were performed at Bodycote Inc. and Surface Combustion
Inc. Their support through facilities and experimental work is greatly appreciated.
References
[ ] “ B O O ” Surf. Eng.,
2004, Vol. 20 No. 5, pp. 379.
[ ] K k O “F G ” P D
Dissertation, Worcester Polytechnic Institute, 2007.
[ ] K k O “ P
N ” MS&T '06: Materials Science and Technology 2006
Conference and Exhibition, 2007.
[ ] V “R ” Met. Sci. Heat Treat. (English
Translation of Metallovedenie i Termicheskaya Obrabotka Metallov), Vol. 22, No. 5-6
(1980), pp. 358-360.
[ ] B Y “G V k mperaturnaya nitrotsementatsiya
k k ” MITOM, Vol. 9, (1986), pp. 8-10 (in Russian).
[ ] G W “ –pressure carburizing – a novel and superior
” Heat Treatment of Metals, Vol. 4, (1999), pp. 79-85.
[ ] K P “V - ” 13th International
Scientific Conference on Achievement in Mechanical and Materials Engineering, 2005,
Poland.

134
CHAPTER IV. RESEARCH CONCLUSIONS
This thesis presents results of our works on simulation, development and optimization of
thermo-chemical processes, specifically, carburizing and nitriding.
In case hardening processes, there are many process parameters can affect the
microstructure and mechanical properties through concentration distribution of interstitial
atoms, case depth and hardness.
Regarding to nitriding process, elevated processing temperature within subcritical
austenite region replaced the hardened case layers from traditional two layers (compound
layer and diffusion zone) to three layers (compound layer, N-austenite layer and diffusion
zone if fast cooled). Due to the increased diffusion coefficient at elevated temperature,
the nitriding rate was increased leading to more nitrogen flux from atmosphere to metal
load and thicker nitride case. The nitrogen flux has been increased to one magnitude
larger, while the hardened case was increased from 10 micron to 40 micron.
Liquid nitrogen quenching and soaking utilized on austenitic nitride components
increased the hardness of the diffusion zone in the subcritically nitrided steel. Due to the
nitrogen stabilized retained austenite, the hardness peak appears at inner part of diffusion
zone. The hardness increase is proportional to the soaking time suggesting cryogenic
aging and isothermal martensitic transformation as the operating mechanisms. Thus the
continuous hardness profile for subcritical temperature austenitic nitriding can be
achieved under prolonged soaking in liquid nitrogen.
In nitrogen diluted ammonia atmosphere, the local equilibrium between nitriding medium
and metal load surface has not built up yet during the period in this experiment. The
intrinsic character of nitrogen diluted ammonia atmosphere makes nitriding potential not
sufficiently represents the nitriding capability. Therefore, if quasi-equilibrium (the local
equilibrium only at solid interfaces) is assume in the system, the layer growth kinetics
can be controlled by the nitrogen flux from the atmosphere into metal surface and the
interface migration. Based on parabolic growth of diffusion controlled layers, a

135
mathematic model has been derived. Once two of three major components, diffusion
coefficient, growth rate constant and layer depth, are measured, the other one is
accessible from the mathematical calculation. When local equilibrium is reached, the
excessive nitrogen atoms constitute the growth of top compound layer, as suggested,
boost and diffuse conditions are beneficial to control the thickness of each layer.
In carburizing section, first, the atmosphere effects have been discussed. The carburizing
atmosphere is divided into two categories: equilibrium and non-equilibrium. Simulation
tool CarbTool© has been built up for these two kinds of atmosphere by Center for Heat
Treating Excellence at Worcester Polytechnic Institute, using finite difference method.
This work has improved both gas and vacuum models in it using experimental data and
thermodynamic predictions. The validation of the models has been implemented by
creating recipes in CarbTool© for both industrial atmosphere and low pressure
carburizing, as well as comparing the concentration profiles between two processes and
between experimental and simulation results. It has been proven that the improved
models are capable of creating desired carbon profiles for the carburizing processes in
both kinds of atmospheres.
Non-equilibrium atmosphere is used in plasma activated nitrogen-hydrocarbons mixture
atmosphere carburizing. The first industrial scale demonstrations confirmed its utility in
eliminating intergranular oxides and promoting carburizing process in one atmosphere
pressure furnace. In N2 - 0.4% C3H8 - 1% CH4 atmosphere, sufficient carbon absorption
has been achieved with less soot deposition on the metal surface and in the atmosphere.
Secondly, the effect of loading configuration on carburizing uniformity over different
locations in the charge and between different sides on the components is investigated
with assistance of computational fluid dynamics study. A center channel configuration
modification improved the gas stream uniformity, therefore reduced the hardness
deviation among stacked trays as well as carburizing unevenness between two sides on
the components.
Thirdly, graphite filaments growth on metal surface are investigated, its formation is
associated with hydrocarbons type, cementite/carbides formation and surface catalytic

136
sites. The soot formation mechanism is proposed in three steps: 1) soot particles and PAH
formation in atmosphere; 2) pyrolytic soot deposition on metal surface, depending on the
gas composition, hydrocarbons and hydrogen concentration ratio; 3) graphite filaments
growth, depending on the conditions described above.