simulation and implementation of solar powered … · all these components are modeled in...
TRANSCRIPT

Circuits and Systems, 2016, 7, 643-661 Published Online May 2016 in SciRes. http://www.scirp.org/journal/cs http://dx.doi.org/10.4236/cs.2016.76055
How to cite this paper: Sankar, A.B. and Seyezhai, R. (2016) Simulation and Implementation of Solar Powered Electric Ve-hicle. Circuits and Systems, 7, 643-661. http://dx.doi.org/10.4236/cs.2016.76055
Simulation and Implementation of Solar Powered Electric Vehicle A. Bharathi Sankar, R. Seyezhai Department of EEE, SSN College of Engineering, Chennai, India
Received 7 March 2016; accepted 6 May 2016; published 11 May 2016
Copyright © 2016 by authors and Scientific Research Publishing Inc. This work is licensed under the Creative Commons Attribution International License (CC BY). http://creativecommons.org/licenses/by/4.0/
Abstract The rise in the price of oil and pollution issues has increased the interest on the development of electric vehicles. This paper discusses about the application of solar energy to power up the ve-hicle. The basic principle of solar based electric vehicle is to use energy that is stored in a battery to drive the motor and it moves the vehicle in forward or reverse direction. The Photo Voltaic (PV) module may be connected either in parallel or series, and the charge controllers direct this solar power to the batteries. The DC voltage from the PV panel is then boosted up using a boost DC-DC converter, and then an inverter, where DC power is converted to AC power, ultimately runs the Brushless DC motor which is used as the drive motor for the vehicle application. This paper focus-es on the design, simulation and implementation of the various components, namely: solar panel, charge controller, battery, DC-DC boost converter, DC-AC power converter (inverter circuit) and BLDC motor for the vehicle application. All these components are modeled in MATLAB/SIMULINK and in real-time, the hardware integration of the system is developed and tested to verify the si-mulation results.
Keywords Photo Voltaic Panel, DC-DC Converter, Brushless DC Motor, Electric Vehicle
1. Introduction The renewable energy is vital for today’s world as the non-renewable sources that we are using are going to get exhausted. The solar vehicle is a step in saving these non-renewable sources of energy [1]-[3]. Solar powered electric vehicle is advantageous because of less noise, less pollution and reduces carbon dioxide emissions [4]-[6]. It consists of PV panel, charger controller, battery, inverter and BLDC motor. The basic principle of the proposed vehicle is the energy drawn from the solar panel that is used to charge a battery which in turn runs the motor of the vehicle. A boost converter is used as an interface between the solar panel and the battery to obtain

A. B. Sankar, R. Seyezhai
644
the required voltage and to extract maximum power from PV. The BLDC motor is preferred over DC motor be-cause of high efficiency, low maintenance, long life, low weight and compact construction. The conventional DC motor is relatively more expensive and needs maintenance due to the brushes and commutator, whereas, BLDC motor has a rotor and a stator, which is connected to a power electronic switching circuit [7]-[9]. This paper focuses on the modeling of solar cell, battery and implements a boost converter for the solar vehicle dri-ven by BLDC motor. The simulations are carried out in MATLAB software. The hardware prototype is built and the results are verified.
2. Modeling of Solar Cell A solar cell is the building block of a photovoltaic panel. A photovoltaic panel is developed by connecting many solar cells in series and parallel. A single photovoltaic cell can be modeled by utilizing current source, diode and two resistors as shown in Figure 1 [10] [11].
The equation for a photovoltaic cell is given by
exp 1s slg os
sh
V I R V I RI I I qA k T R
+ ∗ + ∗ = − ∗ ∗ − − ∗ ∗ (1)
31 1
exp*
ros or go
r
T TTI I q ET A k
− ∗ ∗ ∗ ∗
=
(2)
( ){ }25lg scr iI I K T λ= + ∗ − ∗ (3)
exp 1
pss
s p sp lg p os
sh
NRV I V I RN N N
I N I N I qA k T R
+ + = − − −
∗ ∗ ∗∗ ∗ ∗ ∗
∗ ∗
(4)
where I & V: Photovoltaic cell output current and voltage; Ios: PV cell reverses saturation current; T: Solar cell temperature in Celsius; k: Boltzmann’s constant, 1.38 × 10⁻¹⁹ J/K; q: Electron charge, 1.6 × 10⁻²³ C; Ki: Short circuit current temperature coefficient at Iscr; λ : Solar cell irradiation in W/m2; Iscr: Short circuit current at 25 degree Celsius; Ilg: Light-generated current; Ego: Band gap for silicon; A: Ideality factor; Tr: Reference temperature;
Figure 1. A single solar cell circuit model.

A. B. Sankar, R. Seyezhai
645
Ior: Cell saturation current at Tr; Rsh: Shunt resistance; Rs: Series resistance.; It can be seen that the photovoltaic cell operates as a constant current source at low values of operating vol-
tages and a constant voltage source at low values of operating current. Electrical specifications of solar panel are: open circuit voltage: 32.6 V, short circuit current: 8.5A, total no of cells in series: 72 and solar cell temperature: 30 degree Celsius. SIMULINK model of the photovoltaic panel is shown in Figure 2.
The P-V output characteristics with varying irradiation at constant temperature are shown in Figure 3. The I-V output characteristics of PV module with varying irradiation at constant temperature are shown in Figure 4. When the irradiation increases, the current output increases and the voltage output also increases. This results in net increase in output power with increase in irradiation at constant temperature.
The P-V output characteristics with varying temperature at constant irradiation are shown in Figure 5. The I-V output characteristics of PV module with varying temperature at constant irradiation are shown in Figure 6. When the operating temperature increases, the current output increases marginally but the voltage output de-creases drastically results in net reduction in power output with rise in temperature.
Figure 2. SIMULINK model of the photovoltaic panel.
Figure 3. P-V characteristics of a typical PV module for varying solar irradiance.

A. B. Sankar, R. Seyezhai
646
Figure 4. I-V characteristics of a typical PV module for varying solar irradiance.
Figure 5. P-V characteristics of a typical PV module for varying temperature.
Figure 6. I-V characteristics of a typical PV module for varying temperature.

A. B. Sankar, R. Seyezhai
647
3. DC-DC Boost Converter A single photovoltaic cell produces voltage of about 0.6V. In order to boost up the voltage, a DC-DC boost converter is used. It is used to step up the input voltage to a required output voltage without the use of a trans-former. The control strategy lies in the manipulation of the duty cycle of the switch which results in obtaining a variable DC output voltage. The circuit diagram of the boost converter is shown in Figure 7 [12].
The active switch in the boost converter is a MOSFET. A fast recovery diode is used as the freewheeling di-ode. The input and output capacitor is selected as C1 = 470 μF and C2 = 330 μF, 450 V .The inductance value is 2 mH, 15 A. For a DC-DC boost converter, the conversion gain for continuous conduction mode is given by:
1in
oVV
D=
− (5)
where Vo is the output voltage of the converter, Vin is the input voltage of the converter and D is the duty cycle of operation.
Boost Inductor and Output Capacitor The boost inductor L is calculated based on parameters such as switching frequency fs, input and output voltages, Vin and Vout and the inductor current ripple ∆IL.
( )in o in
L s o
V V VL
I f V−
=∆∗∗ ∗
(6)
The output capacitor is calculated using the below formula
oo
s o
D VCf R V
∗∗ ∗
=∆
(7)
where ∆Vo is the output voltage ripple. The DC-DC boost converter output voltage is about 60 V and input current is about 8 A as shown in Figure 8
& Figure 9.
4. Battery Modeling The lead-acid battery are studied in an intensive way for automotive and the renewable energy sectors. In this paper, the principle of the lead-acid battery is presented. A simple, fast, and effective equivalent circuit model structure for lead-acid batteries is implemented [13]. The identification of the parameters and the battery model is validated by performing the simulation in MATLAB/SIMULINK.
The general equation for modeling the battery is Discharge:
oQ QV E K it K i R i C
Q it Q it= − − − ⋅ +
− − (8)
Charge:
Figure 7. Circuit diagram of boost converter.

A. B. Sankar, R. Seyezhai
648
Figure 8. Input current and output voltage of boost converter.
Figure 9. Output current of boost converter.
0.1oQ QV E K it K i R i C
Q it it Q= − − − ⋅ +
− − (9)
where V: Battery voltage (V); Eo: Nominal voltage (V); K: Polarization resistance (Ω); Q: Battery capacity (A∙h); it: Actual battery charge (A∙h); A: Exponential zone amplitude (V); B: Exponential zone time constant inverse (A∙h−1); R: Battery internal resistance (Ω); C: Exponential voltage (V). From the manufacturer’s datasheet, the above parameters can be obtained. But, polarization resistance, expo-
nential zone amplitude and exponential zone time constant inverse should be calculated from the discharge curve of the battery which is calculated as follows is shown in Figure 10.
full expA V V= − (10)
0 0.005 0.01 0.015 0.02 0.025 0.03 0.035 0.040
5
10Input current
0 0.005 0.01 0.015 0.02 0.025 0.03 0.035 0.040
50
100
Time in sec
Out
put
volt
age
Inpu
t cu
rren
t
Output voltage
0.03 0.0301 0.0301 0.0302 0.0302 0.0302 0.0303 0.0303 0.0304 0.0304 0.03057.98
7.99
8
8.01
8.02Input current ripple
0.03 0.0301 0.0301 0.0302 0.0302 0.0302 0.0303 0.0303 0.0304 0.0304 0.030559.8
59.9
60
60.1
60.2
Time in sec
Output voltage ripple

A. B. Sankar, R. Seyezhai
649
Figure 10. Discharging characteristics of battery.
3
exp
BQ
=
o fullE V K R i A= + + ⋅ − (11)
The value of exponential voltage for charging and discharging are Discharge:
( )C B i C A= ⋅ ⋅ − +
Charge:
( )C B i C= ⋅ ⋅ −
4.1. Current Block The charging and discharging of the battery is altered depending upon the state of charge of the battery. When the state of charge reaches a certain maximum level, it begins to discharge upto the minimum value is shown in Figure 11. The value of state of charge can be fixed depending upon the battery specifications and the manufacturer.
4.2. State of Charge Block The charge of the battery, Q is calculated as
dQ i t= ∫
The above equation gives the result in Ampere-seconds. Inorder to get the standard value in Ampere-hours, the result is divided by 3600 and compared with the nominal battery capacity to get the present state of charge is shown in Figure 12.
4.3. Polarization Voltage Block The polarization voltage block is calculated as is shown in Figure 13.
polQV K it
Q it= ⋅
−
4.4. Polarization Resistor Block The polarization resistance is calculated according to charging and discharging modes is shown in Figure 14.
Charge:
polQR K
Q it=
−

A. B. Sankar, R. Seyezhai
650
Figure 11. SIMULINK model of current block.
Figure 12. SIMULINK model of state of charge block.
Figure 13. SIMULINK model of polarization voltage block.
Figure 14. SIMULINK model of polarization resistor block.

A. B. Sankar, R. Seyezhai
651
Discharge:
0.1polQR K
it Q=
−
4.5. Exponential Block The SIMULINK model exponential block is shown in Figure 15.
By calculating the battery parameters using the mathematical blocks and using Equations (8) and (9), the vol-tage of the battery is plotted. The modeling is done in such a way that the charging current and discharging current are alternated according to the state of charge of the battery. By this way, both the charging and discharging characteristics are obtained. This is shown in Figure 16.
The discharging characteristic of the lead acid battery is shown in Figure 17. The characteristics were taken by connecting a resistive load across the battery. It can be seen that as the resistance increases the time taken for discharging completely also increases. The SOC characteristics are shown in Figure 18.
For different charging currents, the charging characteristics were observed as shown in Figure 19. It can be found that as the charging current increases, the time taken by the battery to attain full voltage decreases. The SOC characteristics are shown in Figure 20.
Figure 15. SIMULINK model of exponential block.
Figure 16. Simulation results of battery characteristics.
0 2 4 6 8 10x 105
48
49
50
Time (s)
Vol
tage
(V)
0 2 4 6 8 10x 105
0
0.5
1
Time (s)
SOC
0 2 4 6 8 10x 105
-8-6-4-2024
Time (s)
Cur
rent
(A)

A. B. Sankar, R. Seyezhai
652
Figure 17. Simulation results for battery voltage for various R load.
Figure 18. Simulation results of SOC for various R load.
Figure 19. Simulation results for battery voltage for various charging current.
Figure 20. Simulation results of SOC for various charging current.
0 0.5 1 1.5 2 2.5 3 3.5 4x 10⁴
0
20
40
60
Time (s)
Bat
tery
Vol
tage
(V)
1.5ohm2ohm2.5ohm3ohm
Load
0 0.5 1 1.5 2 2.5 3 3.5 4x 10⁴
0
0.2
0.4
0.6
0.8
1
Time (s)
SOC
1.5ohm2ohm2.5ohm3ohm
Load
0 0.5 1 1.5 2 2.5 3 3.5 4x 10⁵
47
47.5
48
48.5
Time (s)
Bat
tery
Vol
tage
(V)
2A4A6A8A
Chargingcurrent
0 0.5 1 1.5 2 2.5 3 3.5 4x 10⁵
0
0.5
1
Time (s)
SOC
2A4A6A8A
Chargingcurrent

A. B. Sankar, R. Seyezhai
653
5. Electric Vehicle Dynamic Performance Dynamic behavior analysis of electric motors is required in order to accurately evaluate the performance of electric vehicles. Simulation tools for electric vehicles are divided into steady state and dynamic models. For the accurate prediction of electric vehicle performance, dynamic modeling of the motor and other components is necessary. The dynamic performance of the motor for electric vehicles is investigated [14]-[19]. For this purpose a BLDC motor with its electrical drive is modeled and simulated first, and then the other components of a series electric vehicle, such as battery charger, multilevel inverter are designed and linked with the electric motor.
The first step in vehicle performance modeling is to obtain an equation for calculating the required vehicle propelling force. This force must overcome the road load and accelerate the vehicle. The tractive force, Ftot, available from the propulsion system can be written as:
tot roll AD grade accF f f f f= + + + (12)
The rolling resistance, aerodynamic drag, and climbing resistance are known as the road load. The rolling re-sistance is due to the friction of the vehicle tires on the road and can be written as:
roll rf f M g= ∗ ∗ (13)
where M, fr and g are the vehicle mass, rolling resistance coefficient and gravity acceleration, respectively. The aerodynamic drag is due to the friction of the vehicle body moving through the air. The formula for this
component is:
212AD Df C A Vξ∗ ∗ ∗ ∗= (14)
where V, ξ, CD and A are the vehicle speed, air mass density, aerodynamic coefficient and the frontal area of the vehicle, respectively.
The climbing resistance is due to the slope of the road and is expressed by: singradef M g α∗ ∗= (15)
where α is the angle of the slope. If the velocity of the vehicle is changing, then clearly a force will be needed to be applied in addition to the
above forces. This force will provide the linear acceleration of the vehicle, and is given by: ddaccVf M a Mt
∗=∗= (16)
Wheels and axle convert Ftot and the vehicle speed to torque and angular speed requirement to the differential as follows:
ddwheel
wheel tot wheel wheel lossT F R I Tt
ω∗= + +∗ (17)
( )1wheelwheel
V sR
ω = + (18)
where Twheel, Rwheel, Iwheel, Tloss, ωwheel, and s are the tractive torque, radius of the wheel, wheel inertia, wheel loss torque, angular velocity of the wheels and wheel slip wheels, respectively.
Figure 21 shows that acceleration of electric vehicle is calculated using mainly the position of the accelerator, which is between −100% and +100% and the measured electric vehicle speed. Note that a negative accelerator position represents a brake position. Figure 22 shows that the starting motor torque of electric vehicle is about 3 Nm.
Figure 23 shows that the maximum motor speed (2500 rpm) achieved in BLDC motor drive. Figure 24 shows the stator current for electric vehicle drive. It is observed from the results that the stator cur-
rent ripple is settled in running condition. Figure 25 shows that the maximum vehicle speed (40 Km/hr) achieved BLDC motor drive. The simulation results of motor acceleration, motor torque, stator current, motor speed, vehicle speed for
electric vehicle is obtained. The electromagnetic torque of BLDC motor is varied from 0 to 4 second. Then the rated torque is reached at 8 s. The rated torque can be seen 3 Nm as shown in the Figure 22. The stator current

A. B. Sankar, R. Seyezhai
654
Figure 21. Acceleration of electric vehicle.
Figure 22. Motor torque of electric vehicle.
Figure 23. Motor speed of electric vehicle.
0 2 4 6 8 10 12 14 16-0.8
-0.6
-0.4
-0.2
0
0.2
0.4
0.6
0.8
1
Time in sec
Ele
ctri
cal v
ehic
le A
ccel
erat
ion
Accelerator
0 2 4 6 8 10 12 14 16-1
-0.5
0
0.5
1
1.5
2
2.5
3
Motor torque in N/m
Tim
e in
sec
0 2 4 6 8 10 12 14 160
500
1000
1500
2000
2500
3000
Time in sec
Mot
or s
peed
in r
pm

A. B. Sankar, R. Seyezhai
655
Figure 24. Stator current of electric vehicle.
Figure 25.Vehicle speed of electric vehicle.
responses of the BLDC motor are shown in Figure 24. The stator current is about 10 A and stator current fluc-tuates between 4 and 8 s. With respect to the above Figures 23-25, the rotor speed is gradually increased to the rated speed. The rated speed is 2500 rpm and it is reached at nearly 13 s and the vehicle speed is gradually in-creased to the rated speed. The vehicle speed is 40 km/hr and it is reached at nearly 12 seconds.
The experimental P-V and V-I characteristics are shown in Figure 26. Table 1 shows that specifications of PV Panel & Boost Converter.
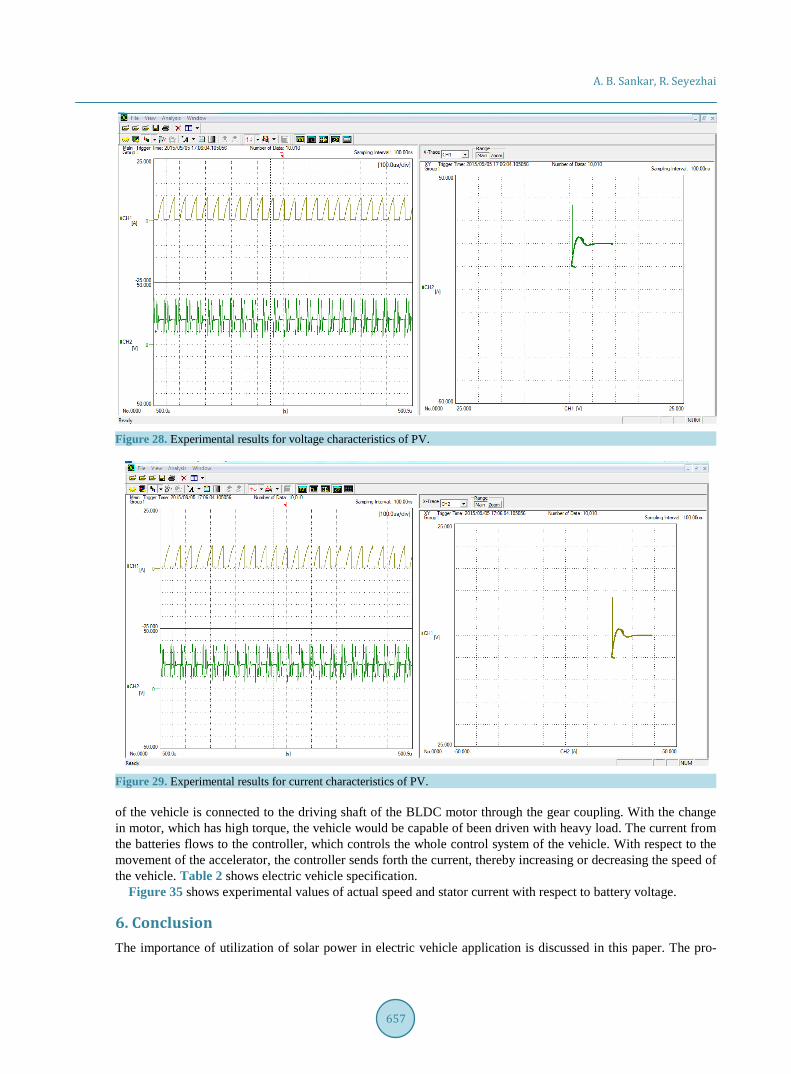
The dynamic characteristics of PV array is measured using scope corder (advanced DSO) and it is shown in Figures 27-29 (VOC = 32.5 V and ISC = 8.5 A).
The input to the converter is about 31.9 V and output voltage obtained is about 64.6 V as shown in Figure 30. The MOSFET switches at 50% duty cycle.
Output voltage and input current ripple of DC-DC boost converter measured using PQ analyzer is about 0.9% and 1.3% as shown in Figure 31.
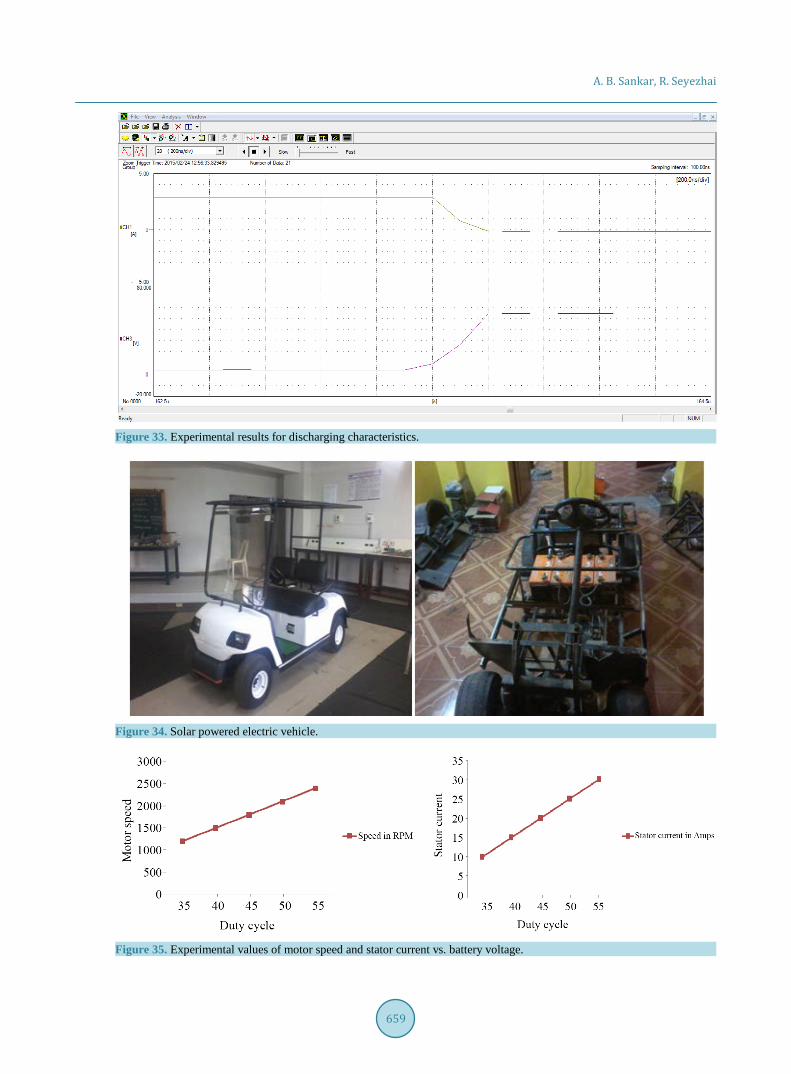
The dynamic charging and discharging characteristics of battery are measured using scope corder and they are shown in Figure 32 & Figure 33.
The solar powered electric vehicle using BLDC Drive is shown in Figure 34. The vehicle was designed with forward and backward driving system which was able to achieve a speed of 40 Kmph. The differential rear axle
0 2 4 6 8 10 12 14 16
-2
-1
0
1
2
Time in sec
Mot
or s
tato
r cu
rren
t in
amps
0 2 4 6 8 10 12 14 160
5
10
15
20
25
30
35
40
45
Time in sec
Veh
icle
spe
ed in
Km
/Hr
VEHICLE SPEED

A. B. Sankar, R. Seyezhai
656
Figure 26. Experimental P-V & V-I characteristics.
Figure 27. Experimental results for PV voltage and current.
Table 1. Specifications of PV panel & boost converter.
Parameters Values
Voc 31.16 V
Isc 8.57 A
Pmax 250 W
Insolation W/m2 1000 W/m2
System Efficiency 76.72%
Output Capacitance C1 = 330 μF
Inductance L1 = 2 mH, 15 A.
Switching Frequency fs = 50 KHz
A. B. Sankar, R. Seyezhai
657
Figure 28. Experimental results for voltage characteristics of PV.
Figure 29. Experimental results for current characteristics of PV.
of the vehicle is connected to the driving shaft of the BLDC motor through the gear coupling. With the change in motor, which has high torque, the vehicle would be capable of been driven with heavy load. The current from the batteries flows to the controller, which controls the whole control system of the vehicle. With respect to the movement of the accelerator, the controller sends forth the current, thereby increasing or decreasing the speed of the vehicle. Table 2 shows electric vehicle specification.
Figure 35 shows experimental values of actual speed and stator current with respect to battery voltage.
6. Conclusion The importance of utilization of solar power in electric vehicle application is discussed in this paper. The pro-

A. B. Sankar, R. Seyezhai
658
Figure 30. Experimental setup for PV interface boost converter.
Figure 31. Output voltage and input current ripple of boost converter for 50% duty cycle.
Figure 32. Experimental results for charging characteristics.
A. B. Sankar, R. Seyezhai
659
Figure 33. Experimental results for discharging characteristics.
Figure 34. Solar powered electric vehicle.
Figure 35. Experimental values of motor speed and stator current vs. battery voltage.

A. B. Sankar, R. Seyezhai
660
Table 2. Electric vehicle specification.
Electric vehicle specification parameters
Vehicle capacity 2-Seater Maximum mileage 60 km
Overall Dimension 2750 mml * 1200 mmw *1800 mmh Forward & Reverse Speed 10 - 40 km/hour
Ground Clearance 114 mm Braking Distance <2 meter
Tred Distance Front 870 mm Rear 980 mm Turning Radius 2.9 meter
Net Weight (without battery) 290 kg Climbing Ability Safe Climbing 25%
posed electric vehicle will be fuel efficient, reduce the pollution and provide noiseless operation. The drive range of the proposed electric vehicle powered by solar is improved compared with the conventional one. Selec-tion of BLDC drive for the vehicle provides high efficiency, high operating life, torque/speed characteristics, high output power to size ratio and noiseless operation. The design of DC-DC boost converter is investigated and the input and output voltage ripple is reduced which is verified experimentally. Therefore, solar powered electric vehicle will reduce the pollution and improve the economy of the country.
References [1] Spina, M.A., de la Vega, R.J., Rossi, S.R., et al. (2012) Source Issues on the Design of a Solar Vehicle Based on Hy-
brid Energy System. International Journal of Energy Engineering, 2, 15-21. http://dx.doi.org/10.5923/j.ijee.20120201.03
[2] Lalouni, S., Rekioua, D., Rekioua, T. and Matagne, E. (2009) Fuzzy Logic Control of Standalone Photovoltaic System with Battery Storage. Journal of Power System, 193, 899-907.
[3] Mangu, R., Prayaga, K., Nadimpally, B. and Nicaise, S. (2010) Design, Development and Optimization of Highly Effi-cient Solar Cars: Gato Del Sol I-IV. Proceedings of 2010 IEEE Green Technologies Conference, Grapevine, 15-16 April 2010, 1-6.
[4] Husain, I. (2005) Electrical and Hybrid Vehicles Design Fundamentals. CRC Press, Boca Raton, London, New York and Washington DC.
[5] Miller, T.J.E. (1989) Brushless Permanent Magnet and Reluctance Motor Drive. Clarendon Press, Oxford. [6] Trembly, O., Dessaint, L.A. and Dekkiche, A.-I. (2007) A Generic Battery Model for the Dynamic Simulation of Hy-
brid Electric Vehicles. 2007 IEEE Vehicle Power and Propulsion Conference, Arlington, 9-12 September 2007, 284- 289. http://dx.doi.org/10.1109/vppc.2007.4544139
[7] Bellur, D.M. and Kazimierczuk, M.K. (2007) DC-DC Converters for Electric Vehicle Applications. 2007 Electrical Insulation Conference and Electrical Manufacturing Expo, Nashville, 22-24 October 2007, 286-293. http://dx.doi.org/10.1109/eeic.2007.4562633
[8] Shmilovitz, D. (2005) On the Control of Photovoltaic Maximum Power Point Tracking via Output Parameters. IEE Proceedings—Electric Power Applications, 152, 239-248. http://dx.doi.org/10.1049/ip-epa:20040978
[9] Chiang, S.J., Chang, K.T. and Yen, C.Y. (1998) Residential Photovoltaic Energy Storage System. IEEE Transactions on Industrial Electronics, 45, 385-394. http://dx.doi.org/10.1109/41.678996
[10] Underland, N.M.T.M. and Robinson, W.P. (2002) Power Electronics Converters Application and Design. 3rd Edition, John Wiley & Sons, Inc., Hoboken.
[11] Shimizu, T. and Hirakata, M. (2001) Generation Control Circuit for Photovoltaic Modules. IEEE Transactions on Power Electronics, 16, 293-300. http://dx.doi.org/10.1109/63.923760
[12] Beno, J., Thompson, R. and Hebner, R. (2002) Flywheel Batteries for Vehicles. Proceedings of the 2002 Workshop on Autonomous Underwater Vehicles, Piscataway, 99-101. http://dx.doi.org/10.1109/AUV.2002.1177211
[13] Zhu, Z.Q. and Howe, D. (2007) Electrical Machines and Drives for Electric, Hybrid, and Fuel Cell Vehicles. Proceed-ings of the IEEE, 95, 746-765. http://dx.doi.org/10.1109/JPROC.2006.892482
[14] Karden, E., Ploumen, S., Fricke, B., Miller, T. and Snyder, K. (2007) Energy Storage Devices for Future Hybrid Elec-tric Vehicles. Journal of Power Sources, 168, 2-11. http://dx.doi.org/10.1016/j.jpowsour.2006.10.090
[15] Giannouli, M. and Yianoulis, P. (2012) Study on the Incorporation of Photovoltaic Systems as an Auxiliary Power Source for Hybrid and Electric Vehicles. Solar Energy, 86, 441-451. http://dx.doi.org/10.1016/j.solener.2011.10.019
[16] Zhang, X., Chau, K.T., Yu, C. and Chan, C.C. (2008) An Optimal Solar-Thermoelectric Hybrid Energy System for

A. B. Sankar, R. Seyezhai
661
Hybrid Electric Vehicles. Proceedings of IEEE Vehicle Power and Propulsion Conference, Harbin, 3-5 September 2008, 1-6.
[17] Zhang, X., Chau, K.T. and Chan, C.C. (2010) Overview of Power Networks in Hybrid Electric Vehicles. Journal of Asian Electric Vehicles, 8, 1371-1377. http://dx.doi.org/10.4130/jaev.8.1371
[18] Arsie, I., Rizzo, G. and Sorrentino, M. (2010) Effect of Engine Thermal Transients on the Energy Management of Se-ries Hybrid Solar Vehicles. Control Engineering Practice, 18, 1231-1238. http://dx.doi.org/10.1016/j.conengprac.2010.01.015
[19] Matsumoto, S. (2005) Advancement of Hybrid Vehicle Technology. Proceedings of IEEE European Conference on Power Electronics and Applications, Dresden, 11-14 September 2005, 1-7. http://dx.doi.org/10.1109/epe.2005.219775