simulation and measurement of dynamic tyre forces …road-transport-technology.org/proceedings/2 -...
TRANSCRIPT
SIMULATION AND MEASUREMENT OF DYNAMIC TYRE FORCES
D J Cole and D Cebon
Cambridge University Engineering Department, UK
SUMMARY
Research concerned with measurement and simulation of the dynamic wheel loads generated by heavy vehicles is presented. Dynamic wheel load data measured on an extensively instrumented articulated vehicle is used to validate a vehicle vibration simulation. The experimental data indicate that roll motions have some influence on the dynamic wheel loads at high frequencies, but do not influence the main low frequency force components due to sprung mass motion. Agreement between a pitch-plane simulation and experiment is good. The paper also describes a new "wheel load measuring mat" which can be used to measure the dynamic wheel loads generated by many uninstrumented vehicles. Preliminary test results indicate promising performance. .
Acknowledgement: The authors gratefully acknowledge the contributions to this work by the Vehicles and Environment Division of the Transport and Road Research Laboratory (TRRL), UK and by Golden River Ltd .. The views expressed in this paper are those of the authors, and not necessarily those of the UK Department of Transport, TRRL or Golden River.


1 INTRODUCTION
This paper is concerned with the dynamic forces that are caused by interaction of a heavy vehicle with road surface roughness. Dynamic tyre forces are dependent on the vehicle design, payload, speed, and the road surface profile. Peak tyre forces can be as much as twice their static value, and RMS levels are typically 20-30% of the static force [1,2,3]
It is thought that the dynamic tyre forces of heavy vehicles are a significant cause of road damage [2,4], however, most existing axle load regulations take no account of dynamic forces. Concern about the road damage caused by heavy vehicles is prompting a number of authorities throughout the World to consider regulations which encourage the use of "road friendly" vehicles. In order to introduce such regulations it is necessary to understand the mechanics of the interaction between vehicles and road surfaces, and to prescribe a vehicle (or suspension system) testing procedure which measures the responses of interest.
The central aim of the research described in this paper is to understand the mechanisms by which heavy vehicles cause road damage. A vehicle simulation is being developed for studying the nature of road loading, and for investigating vehicle design improvements. Road mounted instrumentation for measuring the dynamic tyre forces of uninstrumented vehicles has been designed and developed. This instrumentation will be used in an extensive programme of vehicle tests in the near future and may be suitable for use in a "type approval" test for vehicles as part of possible future axle loading regulations.
The work is being performed in collaboration with the UK Transport and Road Research Laboratory (TRRL) and with Golden River Ltd., a company which specialises in road" traffic instrumentation. The work is part of an integrated programme of research at Cambridge into the effects of dynamic axle loads, on roads, bridges, buildings (through ground-borne vibration) and buried pipes.
2 VALIDATION OF A VEHICLE SIMULATION
A number of simulations of heavy vehicle vibration have been developed in the past, but relatively few have been validated using experimental data. Recent model validation studies include those by Sayers and Gillespie [5], Heath and Good [6], Captain et. al. [7] and Cebon [8]. For the study of road damage caused by lorries, the simulation must include all of the features of the vehicle that significantly influence the forces applied to the road. It is well established that realistic suspension models and an accurate description of the road surface profile must be included [5,8], but there is not yet definitive evidence to say whether roll motions and frame flexural vibration make a significant contribution to dynamic tyre forces. The aim of this validation study is to collect experimental data on the tyre forces of a typical heavy goods vehicle and to determine the complexity of the mathematical models that are necessary to predict dynamic tyre forces accurately for highway conditions.

2.1 Experimental Measurements
2.1.1 Vehicle Tests
The test vehicle was a typical UK articulated lorry, with four axles and a gross mass of 32.5 tonnes. The tractor had two axles, each fitted with multi-leaf springs and hydraulic dampers. The semi-trailer was fitted with a wide-spread "four-leaf" tandem axle group having mono-leaf springs and a load-levelling mechanism (figure 1). Dual radial ply tyres were fitted to all the axles except the steering axle, which was fitted wi th single radial tyres.
The vehicle was extensively instrumented to measure tyre forces and frame accelerations. Tyre forces were measured by means of strain gauges bonded to each axle between the spring mounting and brake back plate. Accelerometers were also fitted to the ends of each axle so that a correction could be made for the inertia of the mass outboard of each strain gauge [2]. Tractor and trailer vertical frame vibrations were measured by eight accelerometers, three on the tractor and five on the trailer. The outputs from the twenty-four transducers were recorded on two 14-channel FM tape recorders and the recorded data was subsequently digitised for analysis by computer.
Two straight lanes, each 600m in length and of motorway standard, were used for the tests. Lane 1 was a flexible pavement with a smooth asphalt surface, and lane 2 was a rigid concrete pavement. The profiles of left and right hand wheel tracks were measured using the TRRL high-speed profilometer [9].
The vehicle was tested at three speeds (50,65,80 km/h) and three loads (unladen, half laden, fully laden). Three runs down both lanes were performed for each condition of speed and load, to provide sufficient data for accurate spectral analysis. Because of the large amount of data collected, only the results for the fully laden vehicle travelling at 80km/h on the asphalt lane will be given. These conditions are representative of many heavy vehicles operating in the UK.
2.1.2 Sprung M ass Roll Motions
The profiles of the left and right hand wheel paths (zl and z2) were processed and spectrum analysed to determine the power spectral densities (PSD) of the average
. vertical "bounce" displacement (zl+z2)/2 and the "roll" displacement (zl-z2)/2. The ratiQ of roll PSD to bounce PSD for the asphalt lane is shown in figure 2. This graph indicates that the roll component does not become significant until the wavenumber exceeds a "critical" value of about 0.2 cycle/m. There is some evidence to suggest that many road surfaces have similar properties, and if the surface roughness is assumed to be isotropic, then the "critical" wavenumber depends mainly on the spacing of the wheel tracks [10,11].
For a vehicle speed of 80km/h, the frequency corresponding to 0.2 cycle/m is 4.5Hz, which is above the frequencies of the main sprung mass roll modes of the test vehicle. It is therefore unlikely that the sprung mass roll modes will contribute significantly to the dynamic tyre forces. This is confirmed by examining the responses of the test vehicle.

sli pper ends \
radius arm
Figure 1.
0 1.5 (f)
a... Q) (J
C ::J 0 ~ 1.0 ""'-0 (f)
a...
0 0.5 L.
levelling arm
chassis \
\ taper leaf spring
Tandem axle group of the test vehicle
WAVENUMBER / eye/m
. Figure 2. Ratio of roll PSD to bounce PSD for the test lane

Figure 3a shows the PSDs of the bounce and roll (average and difference) components of tyre forces measured on the tractor driving axle. Figure 3b shows the same components for the leading trailer axle. The graphs show that in the region of the sprung mass modes (up to 4.5Hz), the bounce component is the major part of the dynamic tyre force. At higher frequencies, the two components are similar in magnitude.
These results suggest that for simulating the sprung mass modes of heavy vehicles travelling under typical operating conditions, it is satisfactory to model the vehicle in only two dimensions. However, simulation of the unsprung mass modes in two dimensions mayor may not be satisfactory, depending on the characteristics of the suspension. This is discussed in later sections.
2.2 Vehicle Simulation
2.2.1 Mathematical M ode13
Cebon [8] developed a nonlinear vibration simulation program, suitable for modelling the vibration of lumped parameter vehicle models of arbitrary complexity. This program was used to develop two two-dimensional models of the test vehicle: a six degrees of freedom (DOF) "four-leaf" tandem suspension model, and an eleven DOF tractor and semi-trailer model (figure 4). Features of these models are:
(i) Nonlinear leaf spring elements, the hysteresis characteristic being modelled according to the equation devised by Fancher et al [12,13].
(ii) Viscous damping on the tractor axles, with different rates in bump and rebound.
(iii) Tyres modelled as linear springs in parallel with light viscous dampers. The tyres can lose contact with the road.
(iv) Simple tyre contact patch averaging for the envelopment of short wavelength irregularities.
(v) Rigid tractor and trailer frames.
The calculations were performed in the time domain, using the measured profile of the nearside track of the test lane as the input.
2.2.2 Leaf Spring SU3pen3ion
Previous work has shown that axle group models are satisfactory for predicting tyre forces at frequencies above the sprung mass modes [5,8]. The six DOF model was therefore used to investigate the effect of the trailer suspension parameters on high frequency tyre forces.
Force-deflection data of a single trailer leaf spring, tested on a laboratory rig, was provided by the manufacturer, and this was used to determine suitable values for the leaf spring simulation. Agreement between the response of the six DOF model and the experimental measurements was unsatisfactory. This is thought to be because the installation of the springs in the trailer considerably modifies the spring charactersitics.

N I
"'" N
Z
"'" Cl (j')
CL
N I
"'" N Z
..........
0 (j')
CL
1.0E+07
1.0E+06
1.0E+OS
1.0E+04
1.0E+03~~~~~~--~~~~~~~~~~
0.1 1.0 10.0 100.0
FREQUENCY / Hz
( a) Drive axle
1.0E+07
1.0E+06
1.0E+OS
'.1 1.0E+04
1 .0 E + 0 3 '------'----'--.&.-&.....L...I....a..u... __ ..J..-..J..-..t-...I......Io."-4..LL.-_...&..-......I.-.A--'-'~
O. 1
Figure 3.
1.0 10.0
FREQUENCY / Hz
(b) Leading trailer axle
100.0
Measured bounce and roll force PSDs ------ Bounce component
D_11 ________ '"

Figure 4.
70
60
50
z ~ , 40
w U a::: 30 0 l.L.
20
10
Figure 5.
kk-f. ~ x 0 x <D
Eleven DOF tractor and semi-trailer model
DISPLACEMENT / mm
Force against deflection for the trailer leaf spring I I I I I I I I Manufacturer's data ----- -- - Modified data

The two main causes are the longitudinal radius arms fitted between the chassis and the end of each axle, and the rigid connection of the centres of the springs to the axle tubes (figure 1).
On this particular trailer, the radius arms are inclined to the horizontal. Vertical displacement of the wheel therefore causes a longitudinal displacement of the spring relative to the chassis. However, longitudinal movement can only take place once friction at the slipper ends of the springs has been overcome. The friction force is reacted by a force in the radius arm. The inclination of the arm means that a component of the force is applied to the axle in a vertical direction, in addition to the force applied directly by the spring. The amount of the additional force is dependent on the friction coefficient at the spring ends, the instantaneous vertical load, and the angle of inclination of the radius arm. The force acts to increase the hysteresis.
The static inclination angles of the radius arms were measured, ,and the coefficient of friction at the spring ends was estimated [14]. The manufacturer's spring data was then modified to account for the additional force provided by the radius arms (figure 5) and this characteristic was used in the simulation.
2.3 Comparison of Simulated and Measured Responses
The eleven DOF model was supplied with the trailer suspension parameters developed on the six DOF model. The responses from both models were compared, and it was confirmed that at frequencies above the sprung mass modes the spectra were very similar. Tractor suspension data was provided by the manufacturer. The tractor leaf springs are attached to the chassis with pins and shackles, and radius arms are not fitted.
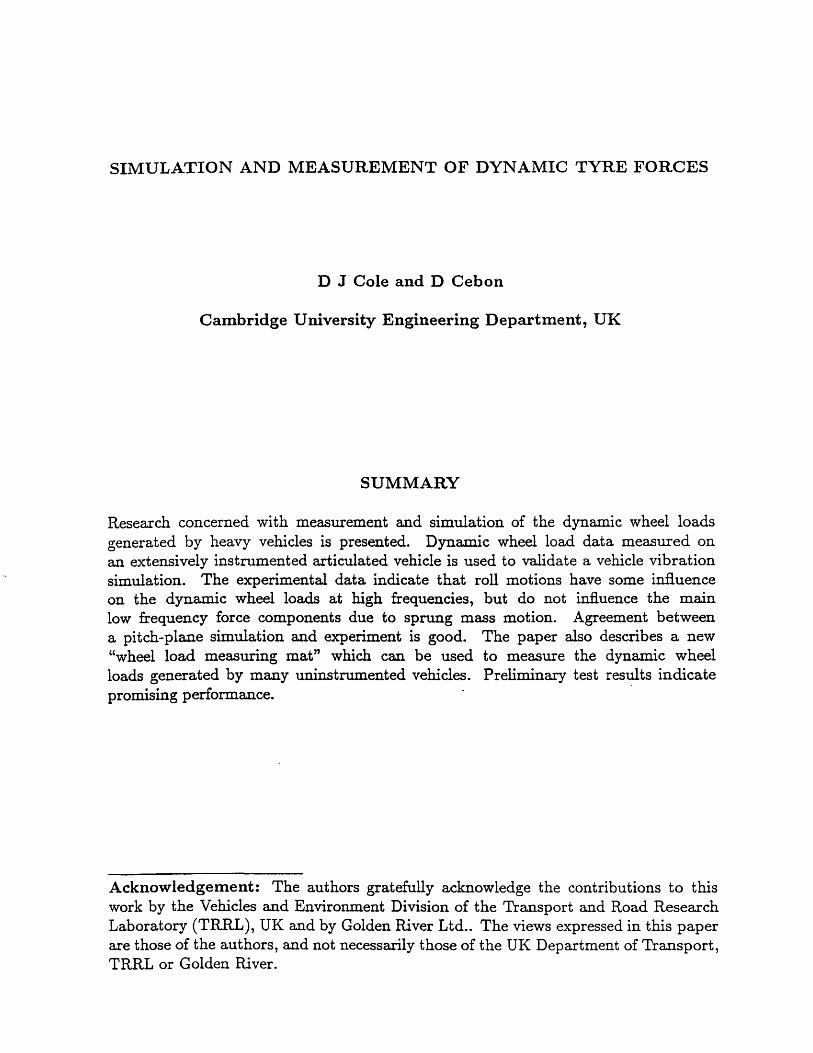
Figure 6 shows spectral densities of dynamic tyre forces from the eleven DOF model and from the test vehicle. The simulated responses are generally in good agreement with the measured responses. Comparable agreement was achieved for other simulated responses, such as sprung mass bounce and pitch accelerations. The most obvious discrepancies are in the steer axle force at 2-4Hz and the trailer axle forces at 12-30Hz. The likely sources of the low frequency error are the estimated inertia properties of the sprung masses and independent vibration of the cab and engine which are not included in the model.
The discrepancy at 12-30 Hz is due to inaccurate modelling of the "four-leaf" suspension. It is thought that more detailed modelling of the radius arms, frictional effects and roll motions will improve the accuracy considerably. It is important to note, however, that the majority of the "power" in the wheel force spectrum is concentrated at the low frequencies and is associated with sprung mass bounce and pitch. This is consistent with most other measurements and simulations of dynamic wheel loads of heavy vehicles [1,2,6,15,16]. '

N I
........... C"I
Z
...........
0 en a..
N I ...........
('of
z
" 0 en a..
1.0E+07
1.0E+06
1.0E+05
1.0E+04
1.0E+03L-~~~~~--~~~~0~0--~~~10~0~.0 O. 1 1.0 1 .
FREQUENCY / Hz
( a) Front tractor axle
1.0E+07
1.0E+06
1.0E+05
1.0E+04
1.0E+03~~~~~~--~~~~~--~~~~
0.1 1.0 10.0 100.0
Figure 6.
FREQUENCY / Hz
(b) Rear tractor axle
Measured and simulated tyre force PSDs Measured
- - - - - - Simulated
N :c "-N
Z
"-Cl (f') Cl..
N :c "-N Z
'-.... 0 en Cl..
1.0E+07
1.0E+06
1.0E+05 1
-I I
I
1.0E+04
1.0E+03~~~~~~--~~~~~--~~~~
0.1
1.0E+07
1.0E+06
1.0E+05
1.0E+04
1.0E+03 0.1
1.0 10.0
FREQUENCY / Hz
( c) Leading trailer axle
I /
1.0 10.0
FREQUENCY / Hz
( d) Trailing trailer axle
Figure 6. (cont.)
100.0
100.0

2.4 Further Work
Quite good agreement with a two-dimensional model has been achieved, but several limitations of the model have been identified. The significance of these limitations is currently being investigated with a three-dimensional model. The model includes the effect of the trailer suspension radius arms and accounts for axle bounce and roll modes. Further work will also include a study of the effects of frame vibrations on dynamic tyre forces. A trailer bending mode at a frequency of 7Hz was measured on the test vehicle, but this did not appear to influence the· tyre forces. This is consistent with a previous study [8] and is thought to be because the nodes of the bending mode were close to the suspension attachment points [8,17,18]. This mayor may not be the case for different distributions of payload.
3 MEASUREMENT OF ROAD DAMAGING POTENTIAL
3.1 Dynamic Tyre Forces and Road Damage
The processes by which wheel forces cause damage to asphalt pavements are complex and depend on the response of the road as well as the nature of the applied loads. The road response depends on its structure and material characteristics which, in turn, depend strongly on environmental factors such as temperature, moisture and frost [4]. The mechanisms of failure of road surfaces are not well understood. It is therefore not surprising that the available methods for determining the service lives of roads are inaccurate [4].
At present the most realistic way to assess the road damaging potential of vehicles is to calculate the strains within a road using a validated dynamic model of the road response [19]. An estimate of the damage incurred at individual points along the road can then be obtained using empirical fatigue or permanent deformation properties of the pavement materials, which may be determined from laboratory tests. ~his procedure is the subject of related work [4,19].
The damage caused at a particular point on a road by a vehicle depends on the forces generated by all of the axles, because all tyres along one side of a vehicle strike each point along the wheel path. The magnitude of forces applied to a point on the road by each axle of a vehicle will not be random. The coupling between axles caused by the sprung mass modes will mean that at certain vehicle speeds a point on the road may be subjected to high forces from more than one axle. Similarly, other points on the road may be subjected to low forces from more than one axle.
Figure 7 demonstrates how the pattern of road loading by a vehicle can lead to uneven damage. Tyre force histories were simulated using the eleven DO F model, travelling fully laden at 80km/h on the measured nearside profile of the asphalt test lane. The "aggregate fourth-power weighted force criterion" (defined by Cebon [20]) was used to estimate the damage at points along the road caused by the passage of the vehicle. This simple criterion is calculated by summing the fourth power of the tyre forces applied to each point on the road by each axle. This number is normalised by the sum of the static

w U 0::: a u.. 3.5 ~~--~--~~---r--~--~~--~--~~--~--~--~~--~--~~--~---0::: W 3: a a. :I:
3.0 2.5 2.0
~ 1.5 Cl 1.0 w ~ 0.5 ~ 0&0~0--~~--~--~10-.~00--~--~~--~2-0-.0~O--~--~~--~30-.-0LO--~~--~--~4-0~.OO 0:::
~ DISTANCE / m
Figure 7. Simulated 4th power aggregate force history

tyre loads each raised to the fourth power. The fourth power is used to account for the fact that road damage generally increases exponentially with tyre force. It originated in the AASHO road test [21]. This criterion takes no account of several important factors that influence road damage [4]. Figure 7 shows that the road damage criterion at one point along the section of road is three times that due to the static tyre forces alone.
Because heavy vehicle traffic often travels within a narrow range of speeds, and because many heavy vehicles in the "national fleet" have similar dynamic characteristics, it is likely that road damage does not accumulate evenly along the length of the road, but is concentrated at a small proportion of "worst" locations [3,22]. In order to investigate this hypothesis fully it will be necessary to measure the performance of a large number of representative vehicles (possibly hundreds) under highway conditions.
3.2 Measurement of Dynamic Tyre Forces
The previous section has shown how the tyre forces generated by all axles of a vehicle influence the damage at every point along the wheel path. Therefore, to assess the road damaging potential of a vehicle it is necessary to measure all of the tyre forces simultaneously along one side of the vehicle. This could be achieved in three ways:
(i) The vehicle could be instrumented with strain gauged axles or force measuring hubs (see, for example, [1,2,3,6]). Instrumenting a large number of vehicles in this way would be time consuming and expensive. It would not be practical to test many vehicles "off the street".
CH) The vehicle could be tested on a "road simulator" with computer controlled hydraulic actuators under every wheel [16]. The main disadvantage of this system is high capital and running costs. However, it is not necessary to attach instrumentation to the vehicle, hence many vehicles can be tested easily.
(iii) The vehicle could be driven over "weigh-in-motion" (WIM) equipment placed on the road surface.
This last option is being pursued in the UK by the authors, in conjunction with the Transport and Road Research Laboratory and Golden River Ltd .. The equipment that has been developed for the project consists of a tough polymer mat, made up from tiles 1.2m square and 13mm thick, each containing three novel capacitative force transducers laid perpendicular to the wheel path at a longitudinal separation of O.4m. The tiles are laid end to end to give the required length of mat (typically 50-lOOm). The primary ad vantage of the force measuring mat is that statistically significant samples of the tyre force time histories generated by many vehicles can be measured without having to instrument each vehicle. This will allow a large experimental study of vehicle design variables to be performed cheaply. The design and performance of the force measuring mat is described in the next section (see also [23]). .

4 FORCE MEASURING MAT
4.1 Design and Operation
4.1.1 Fea3ibility Study
The main design requirement of the mat was to measure accurately the dynamic tyre forces along one side of a vehicle. A measuring interval of 0.4m was specified to ensure resolution of high frequency (10-15Hz) components. An overall instrumented length of 50-lOOm was thought necessary to allow a sufficient number of low frequency (I-3Hz) cycles to be measured. The mat was also required to be portable so that vehicles could be tested on a variety of road surfaces. Other design requirements included linearity, high frequency response, transducer uniformity, low sensitivity to temperature and to tyre contact area, and ease of calibration and installation.
The feasibility study included a review of existing WIM technology. The WIM systems assessed included weighbeams [24], piezo-electric cables [25], piezo-electric film (PVdF) [26], and capacitative pads [27]. The conclusion of the study was that none of the existing systems could meet all of the design requirements. However, the study did point the way to the development of a capacitative strip sensor, and this sensor is now the basis of the force measuring mat.
4.1.2 Capacitative Strip Force S en30r
A schematic cross-section of the sensor is shown in figure 8. The main component of the sensor is an hollow aluminium alloy extrusion, with cross-sectional dimensions of approximately 10mm x 30mm, and a length of (typically) loOm to 1.5m. The extrusion contains an inner copper electrode which acts as one plate of a capacitor, the second plate being the extrusion.
A tyre rolling over the top of the transducer causes the top section of the extrusion to deflect. This deflection reduces the air gap between the extrusion and the inner conductor, causing an increase in capacitance. The wheel force is determined by measuring the magnitude and duration of the capacitance change. Uniform sensitivity along the sensor is ensured by maintaining the air gap to close tolerance. Tests in the laboratory have shown the variation in sensitivity along the length of the sensors to be less than ±2%. Tests have also shown low sensitivity to temperature. The effect of external electrical interference is minimised by housing the primary signal conditiong circuit within one end of the extrusion. The circuit is designed to give an output which varies linearly with the force applied to the sensor.
4.1.3 Signal Proce33ing
The output of each sensor is fed to a data-logging box. One box can deal with up to twelve sensors. If there are more than twelve sensors, data-loggers can be "daisy chained" together via a serial communications link (RS232). The serial link is also used to transfer the processed data to a portable computer (figure 9) after each vehicle test.

tyre contact pressure inner electrode
capaci tance --~r-~~~~~~
lOmm
insulator
~ _________ w_~ __________ ~J~~~=~~~
Figure 8. Schematic cross-section of the force sensor
eight mat sections (24 sensors)
\ ~ ~~~I ~I ---,--I ~I ~I ---L-1---1..1----.,..J1
"" 12 sensor cables 7 """ 12 sensor cables?
=~ smru li~ ~~==rll-----,II /
data-logging box /
personal computer
Figure 9. Arrangement of the mats and data-logging boxes

The data-loggers convert the sensor signals into tyre force values. Because the sensor is a narrow strip the tyre force cannot be measured instantaneously. Therefore, the output of the sensor is integrated during the passage of the tyre over the sensor. The result of the integration depends not only on the tyre force but also on the speed of the vehicle and the sensitivity of the transducer. Both of these factors must be measured before the tyre force can be determined.
The vehicle speed is measured by timing the arrival of the tyre at each sensor. The sensitivity of each sensor is determined by measuring its output \vhen a known pressure is applied to a known length of the strip. This operation can be performed statically; it is not necessary to apply an impulse or a moving wheel force. A calibrator has been developed which allows pressure from a hand operated hydraulic pump to be applied to any 200mm length section of a sensor. Using this device it is possible to measure the variation in sensitivity along the length, and to give each sensor a calibration factor during manufacture.
A second type of calibrator allows encapsulated sensors to be calibrated. This "in-situ" calibrator is placed on the mat directly above a sensor, and a large mass (such as the front wheel of a lorry) is placed (or driven) on top to react the force fr.om the hydraulic pressure, which is again provided by a hand pump. In practice, a large array of sensors can also be calibrated using a vehicle which is instrumented to measure dynamic wheel forces.
4.2 Vehicle Tests on the Mat
4.2.1 Te3t C ondition3
The first installation of the mat consisted of eight tiles placed in the offside wheel track of a concrete lane on the TRRL test track. The eight mats contained twenty-four sensors, and provided an instrumented distance of 9.6m. Sheets of plywood were used for lead-in and lead-out ramps, and to raise the level of the other wheel path to the same height as the mat (13mm).
The mat was tested using a two axle rigid vehicle, fully laden to 16 tonnes gross weight. The front axle was equipped with single tyres, and the rear axle with dual tyres. The vehicle was instrumented to measure tyre forces in the same way as the vehicle used for the validation study (section 2.1.1). The position of the vehicle relative to the mat was measured using an infra-red transceiver mounted on the vehicle, which detected the position of a reflective strip mounted on the road. The vehicle was driven over the mat twenty times at speeds from 50km/h to 80km/h.
4.2.2 Te3t Re3ult3
Calibration factors for the mat were initially measured using the "in-situ" calibrator. However, a significant variation in sensitivity along the length of many of the sensors was noticed. This was thought to be due the surface texture of the road on which the mats were placed. The surface consisted of deeply grooved concrete, the grooves being approximately lOmm wide and on a 25mm pitch. The . grooves ran across the lane,

but not exactly parallel to the sensors, therefore many of the sensors were unevenly supported along their length. Subsequent tests on the same sensors in the laboratory confirmed this to be the cause of the non-uniform sensitivity.
For the results that follow the sensor calibration factors were determined using low speed measurements by the instrumented vehicle.
Figure 10 shows the result of one vehicle pass at 55km/h. The solid line joins the wheel forces measured by the vehicle instrumentation and the asterisks mark the sensor measurements. It is clear from these graphs that the mat is detecting the variation in tyre force of both axles, but there is some discrepancy between the measurements by the mat and the lorry instrumentation.
Figure 11 presents the results of the twenty vehicle passes over sensor number 18. Figure 11a displays the force measured by the sensor against the force on the lorry, and figure lIb shows the distribution of error. The corresponding standard deviation is 7.8%, which was the lowest of the twenty-four sensors. The standard deviation for the whole installation was 10%. Note that the the mat and the vehicle instrumentation both contribute to the error. Mitchell and Gyenes [2] estimated that the vehicle instrumentation is probably accurate to 3-5%.
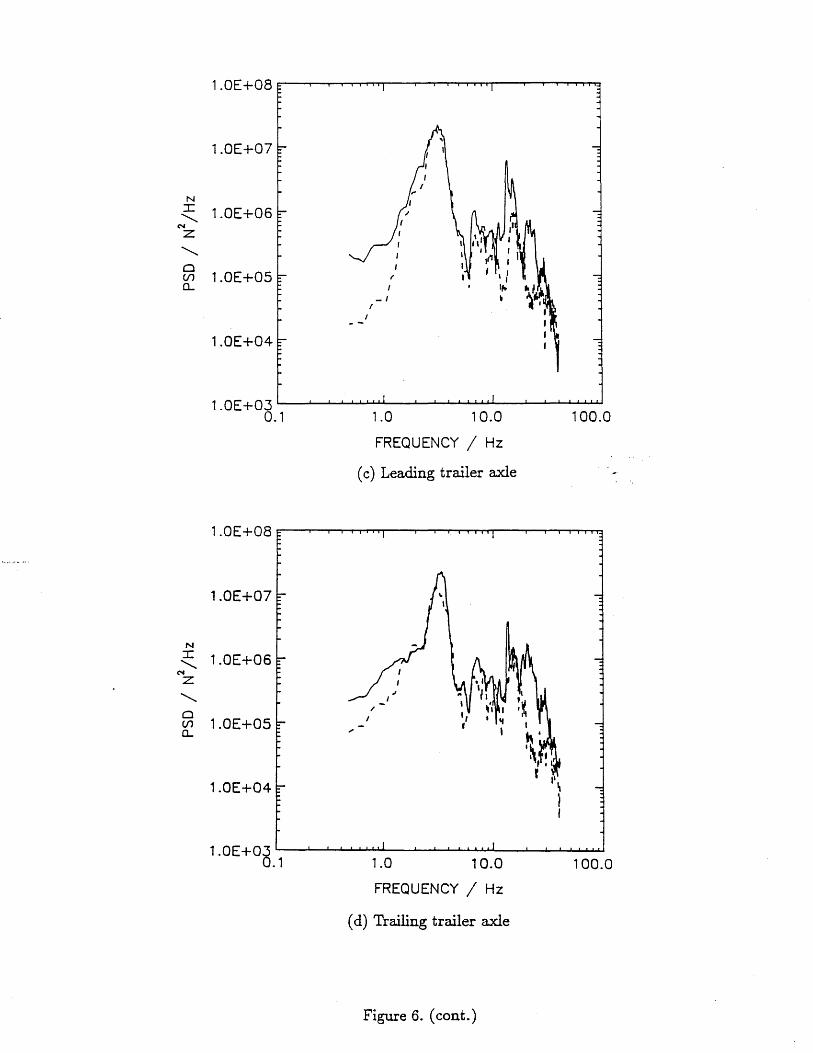
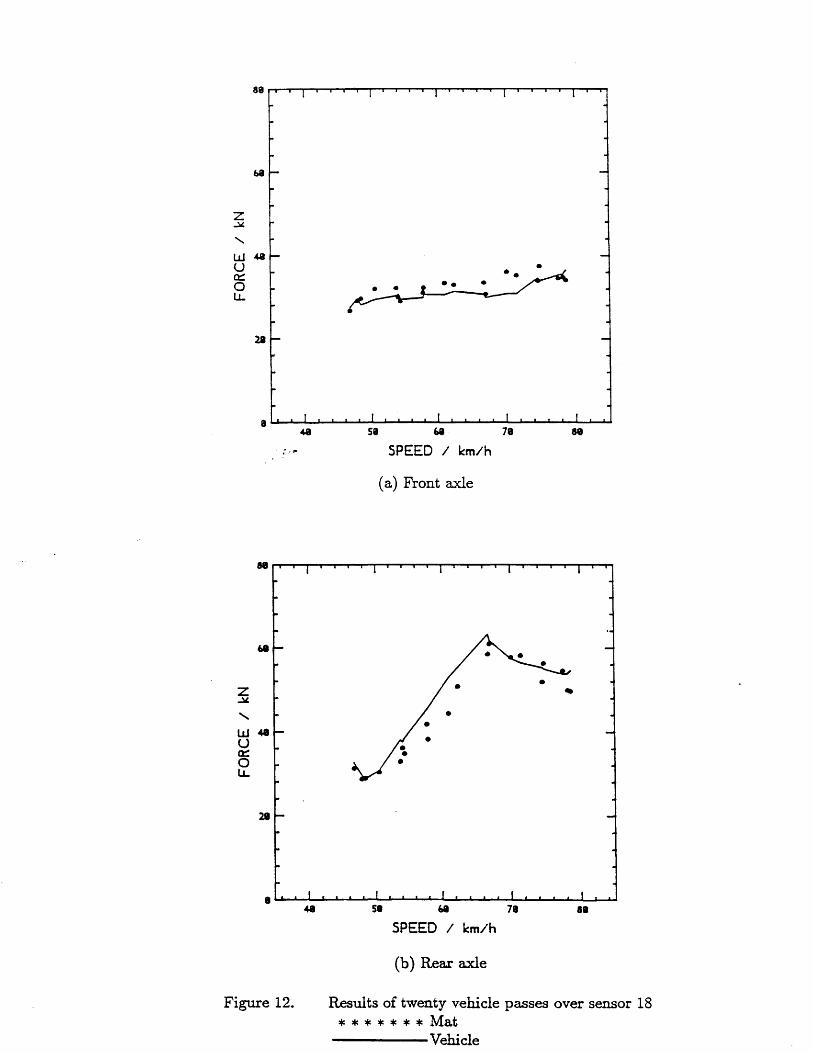
Figure 12 shows the same results as figure 11, but plotted against vehicle speed. The measurements by the vehicle instrumentation have been joined with a continuous line. It is apparent that, for tests at a similar speed, the measurements by the vehicle instrumentation are more repeatable than the measurements by the sensor. Also, the front tyre forces are generally over-estimated by the mat transducer and the rear tyre forces are under-estimated. This is explained by the variation in sensitivity along the sensor (caused by the grooved concrete) and the difference in the lateral position of the front and rear tyres.
Figure 12b clearly demonstrates how the tyre force at a particular point on a road varies with the vehicle speed. It shows that the force can increase and decrease with speed. A similar graph was plotted for all twenty-four sensors, and each showed a different variation in force with speed.
4.3 Further Work
The standard deviation of error was much higher than anticipated, and so a series of laboratory tests was performed in order to determine the cause. The main conclusion of these tests was that the large random error was caused by movement of the mat sections as the vehicle passed over them. Each mat was attached to the road by four bolts only, one in each corner. This allowed the sensors to move and thus cause small changes in their output, due to bending and vibration. At the time of writing, the mat is being reinstalled on a smooth asphalt lane (without grooves) with improved mounting arrangements. It is expected that vehicle tests on this installation will demonstrate much more accurate performance of the mat.

60 Z ..:.l.
.........
W 40 U a::: 0 • • l1.. • •
20
o L-~0--~~--~~~5~~~~--~~1~0~--~~--~~15~~~~--~~2~0~~~~~
60
.........
W40 U a::: o l.L.
20
SENSOR NUMBER
( a) Front axle
o L-~0~--~~~~~5~~~~--~-1~8~--~~--~~1~5~--~~~--2~0~~~~~
Figure 10.
SENSOR NUMBER
(b) Rear axle
Measurements by the mat and instrumented vehicle
* * * * * * * Mat Vehicle

"" w u Cl::: o u. Cl::: o (/")
z w (/")
5 . ~
~
r-~
4 I-en W U Z W
r- .
a:::: ::> 3 U U o LL o 2 a::: w ID I: ::> z
~
-l-
~
~
I-
""
"" -I"
I"
~
~
1 -38
Figure 11.
..
TYRE FORCE / kN
( a) Force measured by mat against force measured by vehicle
. I
f
-21
• J
f -11
. J . • 1 •
,..
1
ERROR / 7. 11
(b) Distribution of error
I
. if
21
,
· -·
· -·
· -
-· · · · . la
Results of twenty vehicle passes over sensor 18
" w U a:::: o lJ...
z ~
"w U a::: o lJ...
. ;.~
Figure 12.
• •
SPEED I km/h
( a) Front axle
SPEED I km/h
(b) Rear axle
Results of twenty vehicle passes over sensor 18
* * * * * * * Mat -----Vehicle

5 CONCLUSION
This paper has reported on the progress of research aimed at measuring and simulating the potential of a vehicle to cause road damage. The main conclusions are:
(i) The dynamic wheel forces generated by the test vehicle were mainly due to sprung mass bounce and pitch motion at low frequencies, below 4Hz.
(ii) Unsprung mass roll motion affected the wheel forces at high frequencies (12-30Hz), but their contribution was comparatively small.
(iii) As a result of (i) and Cii), the pitch-plane vehicle model yielded good predictions of dynamic wheel loads. It was necessary to use detailed nonlinear suspension models and measured road surface roughness profiles in the simulation.
(iv) U sing a simple road damage criterion, based on the "fourth-power law", the damage incurred at some points along a smooth test track was estimated to be up to three times the damage due to static wheel loads alone.
( v ) Preliminary tests on a new "wheel load measuring mat" were presented. Results are encouraging. The mat will enable the wheel loads generated by a large number of uninstrumented vehicles to be measured easily.
REFERENCES
[1] Woodrooffe, J.H.F., LeBlanc, P.A., and LePiane, K.R., "Effects of suspension variations on the dynamic wheel loads of a heavy articulated highway vehicle", Vehicle Weights and Dimensions Study, Vol. 11, Canroad Transportation Research Corporation, Canada, 1986.
[2] Mitchell, C.G.B. and Gyenes, L., "Dynamic pavement loads measured for a variety of truck suspensions" , to be presented at the 2nd International Conference on heavy vehicle weights and dimensions, Kelowna, British Columbia, June 1989.
[3] Hahn, W.D., "Effects of commercial vehicle design on road stress", Institut fur Kruftfahrwesen, Universitat Hannover, Report No.453, 1987. .
[4] Cebon, D., "Theoretical road damage due to dynamic tyre forces of heavy vehicles. Part 1: dynamic analysis of vehicles and road surfaces. Part 2: simulated damage caused by a tandem-axle vehicle", Proc. Instn. Mech. Engrs., Vol. 202, No. C2, p103-117, 1988.
[5] Sayers, M. and Gillespie, T.D., "Dynamic pavement/wheel loading for trucks with tandem suspensions", Proc. 8th IAVSD Symposium on the dynamics of vehicles on roads and on railway tracks, Cambridge, MA, 1983, p517-533, Swets and Zeitlinger, 1984.
[6] Heath, A.N. and Good, M.C., "Heavy vehicle design parameters and dynamic pavement loading", Australian Road Research, 15(4), December 1985, p249-263.
[7] Captain, K.M., Boghani, A.B. and Wormley, D.N., "Analytical tire models for dynamic vehicle simulation", Vehicle System Dynamics, Vol. 8, No. 1, 1979, pl-32.
[8] Cebon, D. "Heavy vehicle vibration - a case study" , Proc. 9th IAVSD Symposium on the dynamics of vehicles on roads and on tracks, Linkoping, Sweden, 1985, p30-43, Swets and Zeitlinger.

[9] Still, P.B. and Jordan, P.G., "Evaluation of the TRRL high-speed profilometer" , TRRL Laboratory Report 922, Crowthorne, 1980.
[10] Dodds, C.J., "The laboratory simulation of vehicle service stress", J. Eng. Ind. ASME Trans., May 1974, p391-398.
[11] Heath, A.N., "Evaluation of the Isotropic Road Roughness Assumption", Proc. 10th IAVSD Symposium on the dynamics of vehicles on roads and on tracks, Prague, 1987, p157-160, Swets and Zeitlinger.
[12] Fancher, P.S. et al, "Measurement and representation of the mechanical properties of truck leaf springs", SAE Trans. 800905, 1980.
[13] Cebon, D. "Simulation of the response of leaf springs to broad band random excitation", Vehicle System Dynamics, Vol. 15, p375-392, 1986.
[14] Winkler, C.B., "Analysis and computer simulation of the four elliptical leaf spring tandem suspension", SAE Trans. 740136, 1974.
[15] Ervin, R.D., Nisonger, R.L., Sayers, M., Gillespie, T.D. and Fancher P.S., "Influence of truck size and weight variables on the stability and control properties of heavy trucks", University of Michigan Report No. UMTRI-83-10/2, April 1983.
[16] Hu, G., "Use of a road simulator for measuring dynamic wheel loads" , SAE 881194, SP765, Vehicle/Pavement Interaction, Indianapolis, November 7-10, 1988, p61-68.
[17] Gillespie, T.D., "Heavy Truck Ride", SAE SP-607, 1985, 68p. [18] Ribarits, J .1., Aurell, J. and Andersers, E., "Ride comfort aspects of heavy truck
design", SAE 781064, 1978, p4046-4069. [19] Hardy, M.S.A. and Cebon, D., "Measurement and analysis of the dynamic response
of flexible pavements", to be presented at The 2nd International Symposium on heavy vehicle weights and dimensions, Kelowna, British Columbia, June 1989.
[20] Cebon, D., "Assessment of the dynamic wheel forces generated by heavy road vehicles", ARRB/FORS Symposium on heavy vehicle suspension characteristics, Canberra, March 1987.
[21] The AASHO Road Test, Report 5, "Pavement Research", Highway Research Board, Special Report 61E, Washington D.C., 1962.
[22] Addis, R.R., Halliday, A.R., and Mitchell, C.G.B., "Dynamic loading of road pavements", Proc. International Symposium on heavy vehicle weights and dimensions, Kelowna, British Columbia, June 1986 ..
[23] Cole, D.J. and Cebon, D., "A capacitative strip sensor for measuring dynamic tyre forces", Proc. The second international conference on road traffic monitoring, lEE, London, February 1989.
[24] Trott, J.J. and Grainger, J.W., "Design of a dynamic weighbridge for recording vehicle wheel loads" , TRRL Report LR219, TRRL, Crowthome, 1968.
[25] Stewart, P.M., "Low cost weigh-in-motion: Piezoelectric. cable systems current practice and research directions", Proc. Seminar on Road Traffic Data Collection Using Weigh-in-Motion, ARRB, Melbourne, Victoria, 1987.
[26] Davies, P. and Somerville, F.K., "Low cost axle load determination", 13th ARRB-5th REAAA Combined Conference, 25-29 August 1986, Volume 13 - Proceedings - Part 6, p142-149, ARRB, Victoria, 1986.
[27] Salter, D.R. and Davies, P., "Development and testing of a portable microprocessor based capacitative weigh-in-motion·system", Transportation Research Record 997, Transportation Research Board, p61-70.
