simulation of a full-scale wastewater treatment plant
TRANSCRIPT

* Corresponding author.
1944-3994/1944-3986 © 2021 Desalination Publications. All rights reserved.
Desalination and Water Treatment www.deswater.com
doi: 10.5004/dwt.2021.26726
213 (2021) 190–201February
Simulation of a full-scale wastewater treatment plant performance at various temperatures using Extended Activated Sludge Model No.1
Noha A. El Hattaba, Mostafa M. El-Seddikb,*, Hisham S. Abdel-Halima, Minerva E. Mattaa
aSanitary and Environmental Engineering Division, Public Works Department, Faculty of Engineering, Cairo University, Cairo 12613, Egypt, emails: [email protected] (N.A. El Hattab), [email protected] (H.S. Abdel-Halim), [email protected] (M.E. Matta) bSanitary and Environmental Engineering, Civil Engineering Department, Institute of Aviation Engineering and Technology, Giza 12815, Egypt, Tel. +201097931177; email: [email protected]
Received 1 July 2020; Accepted 22 October 2020
a b s t r a c tIn this paper, a simulation model was adapted for the 6th of October wastewater treatment plant (WWTP) located in Cairo, Egypt. The study aims to investigate the effect of variable temperature on treated effluent wastewater with regards to various operational parameters. The temperature in the arid region where the plant is located varies significantly between summer and winter. The sim-ulation model was created using the Runge–Kutta 4th order numerical technique in the MATLAB platform and applies Extended Activated Sludge Model No. 1 (ASM1) equations for WWTP mod-eling. This model reflected the equations of ASM1 with modified Monod kinetics for the dissocia-tion of soluble biodegradable organic substrates into unionized organic substrates to be utilized by aerobic heterotrophs and autotrophs. Wastewater characterization was determined with a detailed sampling campaign for the WWTP influent, primary settled, and effluent discharges. Model cal-ibration and sensitivity analyses of kinetic parameters were conducted for model validation. A comprehensive study was performed to examine the effect of various operating parameters on the removal of chemical oxygen demand (COD) at different temperatures using the calibrated model. The operational conditions studied are dissolved oxygen (DO), hydraulic retention time (HRT), and mixed liquor volatile suspended solids (MLVSS). The modified model indicates that COD removal efficiency reaches about 65% for MLVSS of 2,500 mg/L at 15°C, whereas the COD removal efficiency is increased by about 15% as the measured temperature increases from 15°C to 35°C at a DO value of 2 mg/L and HRT of 6 h. Furthermore, the simulation results imply that COD removal can be significantly enhanced by increasing both MLVSS and DO to 4,000 and 3 mg/L, respectively.
Keywords: COD; Extended Activated Sludge Model No. 1; Operating parameters; Temperature; WWTP
1. Introduction
Wastewater treatment is essential for minimizing disease transmission resulting from bacterial and viral reproduc-tion as well as protecting water resources and allowing their use for different purposes. In particular, biological wastewater treatment processes depend on accelerating
natural degradation processes for organic contaminants by either aerobic or anaerobic microorganisms under con-trolled conditions. Among those, the activated sludge pro-cess, the integrated fixed-film activated sludge (IFAS) pro-cess, anaerobic digestion, and a two-step anaerobic–anoxic and oxic (A2O) process are commonly applied in Egypt for removal of both organic matter and nutrients [1,2]. Low-cost

191N.A. El Hattab et al. / Desalination and Water Treatment 213 (2021) 190–201
wastewater treatment methods are also used in Egypt. These methods include the oxidation-ponds processes that require a hot climate which prevails most of the year in Egypt. The oxidation-ponds processes have high land area requirements, which are addressed by constructing the ponds in the desert where vast amounts of land are avail-able. Some examples of such low-cost treatment methods are the El Sadat treatment plant, which uses anaerobic, fac-ultative, and maturation ponds [3] and the Al Ismailia plant consisting of an aerated lagoon, a facultative aerated lagoon, and polishing ponds [4].
After many decades of applying treatment methods, a computerized method to simulate the performance of a full-scale wastewater treatment plant (WWTP) was needed. Mathematical modeling can provide plant operators with highly accurate, predicted values of a plant’s performance that would be useful in making decisions about the dif-ferent operating parameters. In the early eighties, the International Association of Water Quality (IAWQ) formed a task group to develop the simplest mathematical model for the prediction of activated sludge system performance. In 1987, the activated sludge system model was created and named Activated Sludge Model No. 1 (ASM1). Since then, activated sludge models (ASMs) have evolved enormously. The most well-known ASMs are ASM1, ASM2, ASM2d, and ASM3, all of which are used often in simulation stud-ies for municipal and industrial WWTPs [5–7]. An ASM is a representation of microbial growth and substrate utiliza-tion within an activated sludge system through a dynamic mathematical expression [8,9].
ASMs are incorporated through various simulation plat-forms such as Simba, GPS-X, and BioWin. ASM equations can be computer-generated with the MATLAB program-ming platform utilized in this study. Simulating the perfor-mance of a full-scale WWTP is done either to enhance the quality of the plant’s effluent or to study the relationship between parameters that affect its performance. Enhancing the quality of effluent at the 6th of October WWTP is of major importance due to the environmental policies adopted by the Egyptian government. The significant variation in tem-perature in the arid region of the plant’s location affects the effluent quality of the treated wastewater at this plant. This study aims at studying the effect of temperature on treated effluent wastewater with regards to various oper-ational parameters. MATLAB version R2016b (9.10.441655) software is utilized to create equations that simulate the actual performance of the 6th of October WWTP using extended ASM1 [10,11]. The conventional ASM1 only considers the hydrolysis of particulate (slowly) biodegradable organic substrates into soluble (readily) biodegradable compounds to be utilized by aerobic heterotrophs and autotrophs. The role of pH in the dissociation of soluble organic substrates is ignored in this version of the model. In this paper, the extended model simulates the removal of chemical oxygen demand (COD) by considering the hydrolysis of soluble organic substrates such as acetic acid into unionized sub-strates utilized by bacteria. Moreover, the efficiency of the WWTP with regard to the total COD percentage of removal is studied relative to the following operational parame-ters: hydraulic retention time (HRT), dissolved oxygen (DO), and mixed liquor volatile suspended solids (MLVSS).
Previous studies were conducted to investigate the effect of HRT, DO, and MLVSS on pilot-scaled studies. None of these studies was conducted on a full-scale WWTP, nor was the effect of these operational parameters on the removal efficiency compared for the same plant at different temperatures. One study was conducted on a pilot reactor to investigate the effect of HRT on removal efficiency in Alexandria, Egypt [12]. The removal efficiency of the plant was enhanced by decreasing the HRT; however, the paper stated that this enhancement was due to the accumulation of biomass that occurred during the operation of the plant at higher HRTs. Another study was conducted on a pilot reactor to investigate the influence of HRT on the removal efficiency of COD, BOD5, total suspended solids (TSS), and NH4–N [2,13]. The results showed that the removal effi-ciency increased by raising the HRT. A pilot-scaled reactor was also used to investigate the effect of MLVSS and HRT on the removal efficiency of a WWTP [14]. The results showed that the performance of the pilot reactor was enhanced by increasing both operational parameters. The aforemen-tioned studies were all conducted on experimental-scale reactors. The aim of our study is to predict the performance of a full-scale WWTP using an extended ASM1 in conjunc-tion with the data collected from the plant under various operational parameters at various temperature segments.
2. Materials and methods
Although there are many modified ASMs, ASM1 remains one of the most reliable simulation models and is the most widely used worldwide [11,15,16]. In ASM1, car-bon material is categorized as either biodegradable, non- biodegradable COD, or active biomass, as shown in Fig. 1.
2.1. Description of the 6th of October WWTP process
The WWTP under study is located in 6th of October, a city in Giza Governorate, Egypt. It began operating in 1988 and serves 13 residential districts, ten compounds,
Total COD
Biodegradable COD
Soluble SS
Particulate XS
Nonbiodegre-dable COD
Soluble SI
Particulate XI & XP
Active mass COD
HeterotrophsXB,H
Autotrophs XB,A
Fig. 1. Segregation of total COD as per ASM1 equations.
N.A. El Hattab et al. / Desalination and Water Treatment 213 (2021) 190–201192
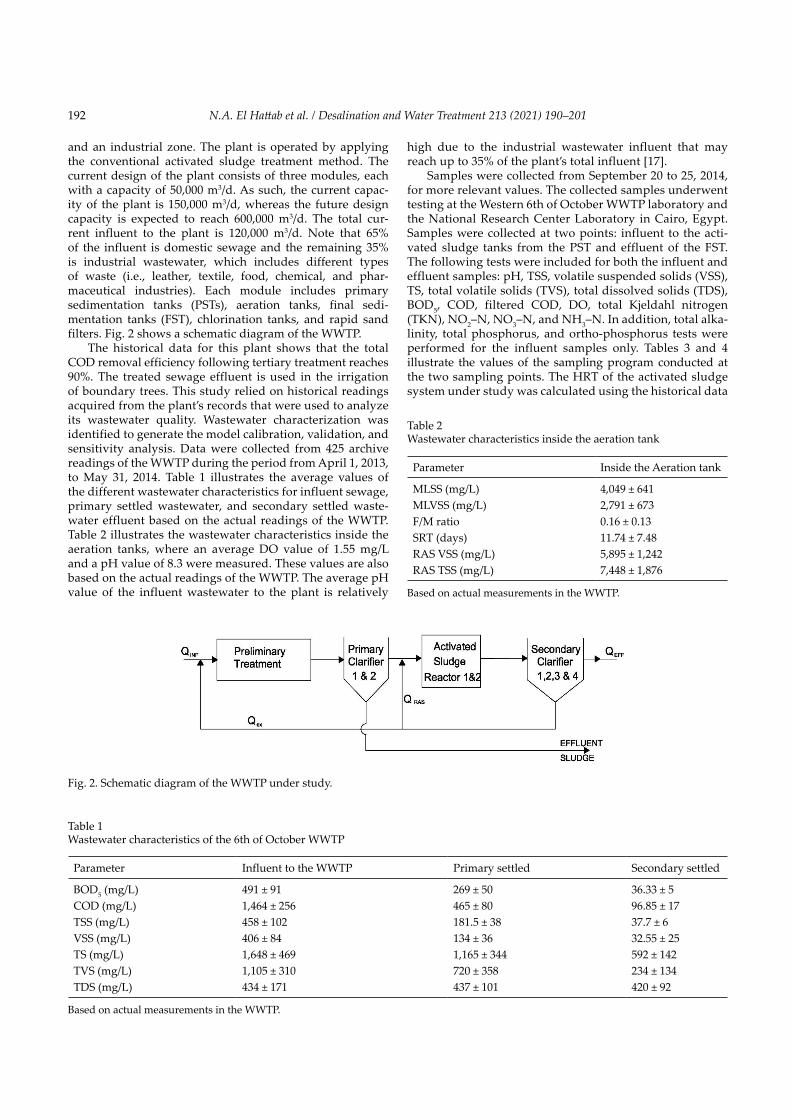
and an industrial zone. The plant is operated by applying the conventional activated sludge treatment method. The current design of the plant consists of three modules, each with a capacity of 50,000 m3/d. As such, the current capac-ity of the plant is 150,000 m3/d, whereas the future design capacity is expected to reach 600,000 m3/d. The total cur-rent influent to the plant is 120,000 m3/d. Note that 65% of the influent is domestic sewage and the remaining 35% is industrial wastewater, which includes different types of waste (i.e., leather, textile, food, chemical, and phar-maceutical industries). Each module includes primary sedimentation tanks (PSTs), aeration tanks, final sedi-mentation tanks (FST), chlorination tanks, and rapid sand filters. Fig. 2 shows a schematic diagram of the WWTP.
The historical data for this plant shows that the total COD removal efficiency following tertiary treatment reaches 90%. The treated sewage effluent is used in the irrigation of boundary trees. This study relied on historical readings acquired from the plant’s records that were used to analyze its wastewater quality. Wastewater characterization was identified to generate the model calibration, validation, and sensitivity analysis. Data were collected from 425 archive readings of the WWTP during the period from April 1, 2013, to May 31, 2014. Table 1 illustrates the average values of the different wastewater characteristics for influent sewage, primary settled wastewater, and secondary settled waste-water effluent based on the actual readings of the WWTP. Table 2 illustrates the wastewater characteristics inside the aeration tanks, where an average DO value of 1.55 mg/L and a pH value of 8.3 were measured. These values are also based on the actual readings of the WWTP. The average pH value of the influent wastewater to the plant is relatively
high due to the industrial wastewater influent that may reach up to 35% of the plant’s total influent [17].
Samples were collected from September 20 to 25, 2014, for more relevant values. The collected samples underwent testing at the Western 6th of October WWTP laboratory and the National Research Center Laboratory in Cairo, Egypt. Samples were collected at two points: influent to the acti-vated sludge tanks from the PST and effluent of the FST. The following tests were included for both the influent and effluent samples: pH, TSS, volatile suspended solids (VSS), TS, total volatile solids (TVS), total dissolved solids (TDS), BOD5, COD, filtered COD, DO, total Kjeldahl nitrogen (TKN), NO2–N, NO3–N, and NH3–N. In addition, total alka-linity, total phosphorus, and ortho-phosphorus tests were performed for the influent samples only. Tables 3 and 4 illustrate the values of the sampling program conducted at the two sampling points. The HRT of the activated sludge system under study was calculated using the historical data
Fig. 2. Schematic diagram of the WWTP under study.
Table 1Wastewater characteristics of the 6th of October WWTP
Parameter Influent to the WWTP Primary settled Secondary settled
BOD5 (mg/L) 491 ± 91 269 ± 50 36.33 ± 5COD (mg/L) 1,464 ± 256 465 ± 80 96.85 ± 17TSS (mg/L) 458 ± 102 181.5 ± 38 37.7 ± 6VSS (mg/L) 406 ± 84 134 ± 36 32.55 ± 25TS (mg/L) 1,648 ± 469 1,165 ± 344 592 ± 142TVS (mg/L) 1,105 ± 310 720 ± 358 234 ± 134TDS (mg/L) 434 ± 171 437 ± 101 420 ± 92
Based on actual measurements in the WWTP.
Table 2Wastewater characteristics inside the aeration tank
Parameter Inside the Aeration tank
MLSS (mg/L) 4,049 ± 641MLVSS (mg/L) 2,791 ± 673F/M ratio 0.16 ± 0.13SRT (days) 11.74 ± 7.48RAS VSS (mg/L) 5,895 ± 1,242RAS TSS (mg/L) 7,448 ± 1,876
Based on actual measurements in the WWTP.

193N.A. El Hattab et al. / Desalination and Water Treatment 213 (2021) 190–201
provided and found at 6.14–6.47 h. The physical parameters of pH and temperature have a major effect on the waste-water treatment process. Temperature varies significantly due to normal seasonal variations in the arid location of the plant. Thus, it was important to analyze the temperature values (less than 15°C, 15°C–25°C, 25°C–35°C, and greater than 35°C) throughout the study period. Furthermore, the
6th of October WWTP receives both domestic and indus-trial wastewater, resulting in high pH values at a range of 7.2–10. The typical values of kinetic and stoichiometric parameters were considered at neutral pH values.
Both the actual readings and the samplings measure-ments program showed a significant percentage of removal of COD in the PST. This can be attributed to the characteristics
Table 3Measured parameters of the PST effluent
Date20-09-2014 21-09-2014 22-09-2014 23-09-2014 24-09-2014 25-09-2014
Parameter
T (°C) 28.6 29.9 29.3 28.3 29.3 28.2Flow (m3/d) 49,500 49,000 49,750 49,750 49,250 49,250pH 8.7 9.3 8.9 8.9 8.7 9TSS (g/m3) 352 408 293 353 312 373VSS (g/m3) 281 343 212 305 281 301TS (g/m3) 680 820 653 715 742 816TVS (g/m3) 420 680 401 663 671 786TDS (g/m3) 228 305 360 416 395 422BOD5 (g/m3) 225 217 174 215 190 220COD (g/m3) 548 560 498 449 397 447Filtered COD (g/m3) 260 275 238 219 195 214DO (g/m3) 0.3 0 0.2 0 0.2 0.1TKN (g/m3) 32.3 33.9 35.6 34.1 34.4 34.8NO2–N (g/m3) 0.03 0.024 0.053 0.082 0.105 0.008NO3–N (g/m3) 0.039 0.066 0.069 0.01 0.24 0.184NH3–N (g/m3) 0.21 1.6 0.06 1.8 0.039 1.02Total alkalinity 285 440 270 160 300 285Total P 2.34 1.24 3.24 1.76 3.88 2Ortho P 1.45 0 1.97 0 2.3 1.4
Based on the sampling program.
Table 4Measured parameters of the FST effluent
Date20-09-2014 21-09-2014 22-09-2014 23-09-2014 24-09-2014 25-09-2014
Parameter
pH 8.8 8.9 8.7 8.7 8.7 8.8TSS (g/m3) 35 47 36 28 25 31VSS (g/m3) 28 41 31 21 18 22TS (g/m3) 320 452 362 411 425 186TVS (g/m3) 300 425 341 389 376 402TDS (g/m3) 260 308 300 308 335 395BOD5 (g/m3) 32 42 31 24 31 42COD (g/m3) 75 92 80 73 75 93Filtered COD (g/m3) 30 37 32 29 30 37NO2–N (g/m3) 0.245 0.062 0.3 0.225 0.37 0.21NO3–N (g/m3) 0.84 0.07 1.5 0.72 0.48 0.685NH3–N (g/m3) 0.13 0.15 0.1 0.01 0.05 0.03
Based on the sampling program.
N.A. El Hattab et al. / Desalination and Water Treatment 213 (2021) 190–201194
of the plant’s influent that includes industrial wastewater of high amount of particulate matter that sediments in the pri-mary sedimentation tanks.
2.2. Model approach and calibration
Several computer programs can apply the ASM equa-tions in WWTP simulations, including WEST, STOAT, and Simba. Another programming platform that can be used for simulation processes is MATLAB, which is designed specifically for engineers and scientists. MATLAB utilizes a matrix-based language that allows the most natural expres-sion of computational mathematics. The Runge–Kutta fourth order numerical technique was applied in the extended model using MATLAB software. This model reflected the equations of ASM1 with modified Monod kinetics for the hydrolysis of soluble biodegradable organic substrates [10,11]. The extended ASM1 indicates that soluble organic substrates are dissociated into unionized organic substrates to be utilized by aerobic heterotrophs and autotrophs that maintain a constant pH. Based on El-Seddik [10] and Al Madany et al. [11], the biomass and substrate mass balance equations of extended ASM1 are expressed as follows:
VdC
dtF C C K C VX H A
Xi H A X H A H A d H A X H A,
, , , , , ,( )( ) ( ) ( ) ( )= −( ) + −( )in µ (1)
VdC
dtF C C
YKS H N
Si H N S H NH A
H Ad H A
,, ,
,
,,
( )( ) ( ) ( )= −( ) − −
in
µCC VX H A, ,( ) (2)
where the specific growth rate of heterotrophic and auto-trophic bacteria can be expressed as follows [10,11]:
µ µH A H AHS H N
S N HS H N H A
HS H N
C
K CC
K C
C
, max ,,
, , ,
,
,=+
×+( )
( )
( ) ( )
O
O O
2
2 2
(( )
−( )−
=+
10
10
pH
pH
C
KS H N
A
,
(3)
Model calibration, validation, and a sensitivity analysis were generated to ensure the adequacy of the created model relative to the results of the plant. The MATLAB model sim-ulates the kinetic and biological reaction occurring inside the biological treatment process. The influent value of any parameter addressed in the model represents the value of the primary settled wastewater effluent characteristics. The effluent of any parameter is the effluent from the FST. Two types of parameters are involved in the extended ASM1 model, stoichiometric and kinetic. Stoichiometric parameters are temperature-independent parameters that help to calculate the relationship between the relative quantities of substances taking part in a reaction. Kinetic parameters are temperature-dependent parameters [17]. The kinetic parameters of extended ASM1 include µmax(H), µmax(A), Kd(H), Kd(A), KS, KN, KO2(H), and KA, while the stoichio-metric parameters considered in the extended model are YH and YA. The dissociation coefficient (KA) can be attributed to Atkins [18] and El-Seddik et al. [19] as reported by Al Madany et al. [11].
The calibration process aims to ensure the parameters used in the MATLAB model are appropriate for this spe-cific WWTP. Many protocols are developed and used for efficient process simulations (e.g., STOWA, WERF, and BIOMATH). The protocol adopted herein is STOWA, which determines wastewater characterization as a ratio to total COD as follows: 3%, 45%, 30%, and 22% for SI, SS, XI, and XS, respectively, as reported by Sin and Vanrolleghem [20] and Elawwad et al. [7]. The model was calibrated using the typical values of kinetic parameters as well as the stoichio-metric parameters indicated in Table 5. Several iterations were performed using the MATLAB model to approach the closest values for the total effluent COD concentration. One of the most important parameters considered was the maximum specific growth rate of both heterotrophic and autotrophic biomass (µmax(H,A)), which is the relation between substrate degradation capacity and biomass growth under specific treatment conditions such as BOD, pH, nutrients, and alkalinity. The Hoff–Arrhenius equation (Eq. (4)) shows that the µmax(H,A) depends on the temperature (T). For an activated sludge system, the temperature-activity coeffi-cient (θ) is taken as 1.04 [21]. Eq. (4) helps to deduce the values of kinetic parameters at a specific temperature [7,20].
µ µ θmax maxTT
( ) ( )−( )= 2020 , (4)
Heterotrophic biomass is an extremely important param-eter to measure and include in the model. The value of the heterotrophic active biomass concentration due to mixed liquor (XBH) should be calculated for adequate calibration and validation. Based on experimental measurements, Lee et al. [22] addressed an equation to calculate the heterotro-phic biomass concentration in an aeration tank. Eq. (5) was utilized to predict the value of XBH as follows:
X ef f f
Y
N EBH
intercept
CV slope=
+( ) −( ) −( )−( )
4 57 1. (5)
where fE is the fraction of heterotrophic active biomass that is endogenous residue = 0.2; fCV is the COD to VSS ratio of the mixed liquor organic suspended solids (mgCOD/mgVSS); fN is the TKN to VSS ratio of the mixed liquor organic suspended solids (mgTKN/mgVSS); Y-intercept = 2.5 (for oxygen uptake rate (OUR) = 12 mg O/L/h); slope = –3/240 (with respect to the time period).
The appropriate kinetic and stoichiometric parameters, which reflect the proper performance of this specific WWTP, could be deduced using the calculated average values of XBH and the maximum specific growth rates of heterotrophs and autotrophs. A set of runs were conducted to validate the appropriate values of the kinetic and stoichiometric para-meters for this plant. Table 5 shows the calibrated values of different parameters.
2.3. Effect of temperature on various operating conditions
Variation in temperature affects the maximum specific growth rates of both heterotrophs and autotrophs. The val-ues of µmax(H,A) is taken as per the typical literature values

195N.A. El Hattab et al. / Desalination and Water Treatment 213 (2021) 190–201
at 20°C. Using Eq. (4), the maximum specific growth rate can be deduced for several temperature intervals. Tables 5 and 6 show the typical values of kinetic parameters at 20°C along with the deduced values of the maximum specific growth rates for both heterotrophs and autotrophs accord-ing to the temperature range. Operating temperatures were categorized into five ranges (less than 15°C, 15°C–20°C, 20°C–25°C, 25°C–35°C, and greater than 35°C). These tem-perature ranges are actual values from the plant’s records as the temperature varies significantly during the year. The maximum heterotrophic and autotrophic biomass concen-trations were deduced for each run based on these tem-perature ranges. The operating parameters studied were MLVSS, DO, and HRT. Each parameter was studied in a separate set of runs. Calibrated stoichiometric and kinetic parameters were used during each set of runs to match the performance of the actual full-scale WWTP under study.
3. Results and discussion
3.1. Extended model validation and sensitivity analysis
A set of runs was created for the 400 historical readings of the WWTP to ensure appropriate total effluent COD results after applying the calibrated parameters. Simulated effluent soluble COD is converted into total effluent COD according to the STOWA protocol. Fig. 3 shows the actual total effluent COD from primary and final settling tanks as
per the historical readings and the simulated total effluent COD from the aeration tank. The results show that the simulated total effluent COD agrees with that of the mea-sured outcomes from the WWTP, indicating the robustness of the extended ASM1.
Fig. 4 shows the simulation results of soluble COD removal and heterotrophic biomass concentration in the aeration tank for six different actual readings of the WWTP. Note that the simulation below is done using the calibrated kinetic and stoichiometric parameters, whereas the mea-sured operating conditions for these runs are mentioned in Table 7. The simulation results indicate that effluent solu-ble COD reaches about 50 mg/L for influent soluble COD to the aeration tank fluctuating between 170 and 280 mg/L as shown in Fig. 4a. Also, Fig. 4b shows an increase in the het-erotrophic biomass concentration in the aeration tank from 4,000 to 8,000 mg/L that can be attributed to the variation of MLVSS in the aeration tank. However, the steady-state results of effluent soluble COD approach 0.05 kg/m3 due to the different operational conditions mentioned in Table 7.
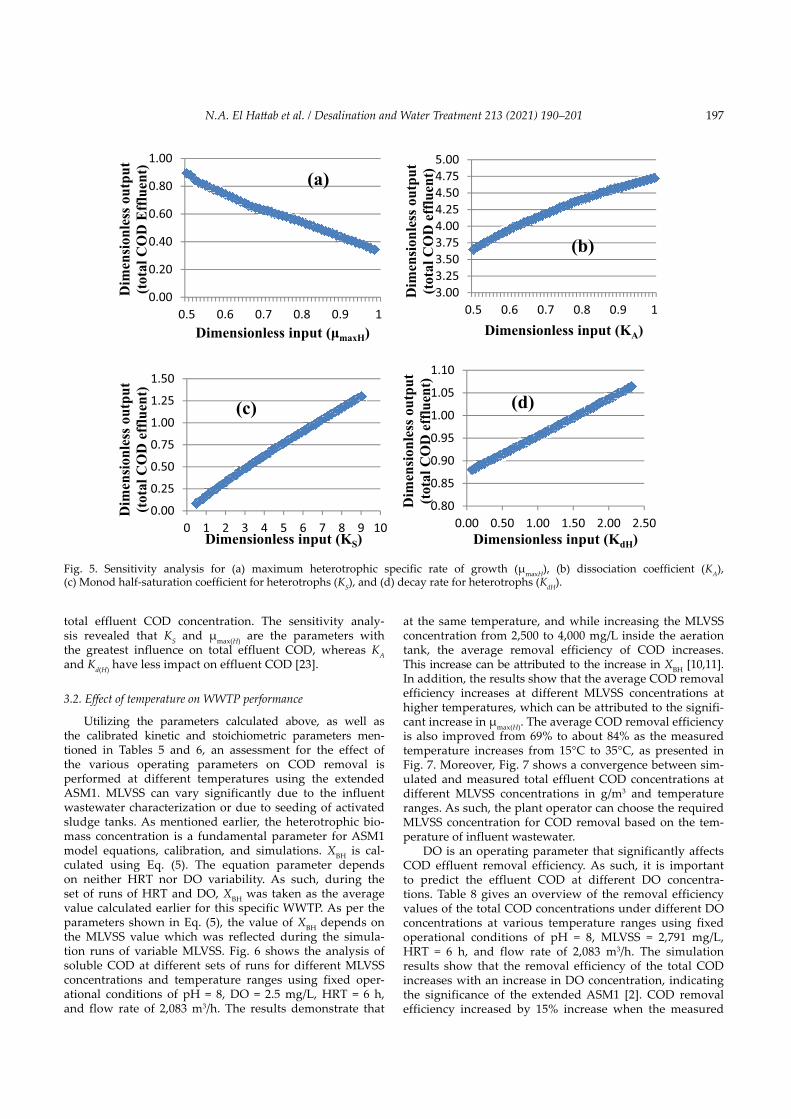
Sensitivity analysis should be incorporated into the cal-ibration protocol to minimize the amount of effort needed to optimize the calibration procedure, according to Sin and Vanrolleghem [20]. Sensitivity analysis is performed in the steady-state calibration stage and used to determine which parameters of the model have the greatest influence on the plant’s performance and, therefore, the significant need for calibration. Accordingly, the sensitivity analysis was
Table 5Calibrated values of kinetic and stoichiometric parameters for the WWTP under study
Model parameters
IAWQ model parameter definition Literature values Calibrated values20°C 10°C
µmax(H) Maximum heterotrophic specific rate of growth, d–1 6.4 3 5.54µmax(A) Maximum autotrophic specific rate of growth, d–1 0.8 0.3 0.73Kd(H) Decay rate for heterotrophs, d–1 0.6 0.05 0.5Kd(A) Decay rate for autotrophs, d–1 0.2 0.05 0.2KS Monod half-saturation coefficient for heterotrophs, g COD m–3 60 20 30KO2(H) Oxygen half-saturation coefficient for heterotrophs, g O2 m–3 0.2 0.1 0.2KA Dissociation coefficient ≤0.0001 0.000001KN Monod half-saturation constant for autotrophs, g NH3–N/m3 1.0 1.0 1.0YH Yield coefficient for heterotrophs, gcell COD formed/gCOD oxidized 0.67 0.67 0.69YA Yield coefficient for autotrophs, gcell COD formed/gN oxidized 0.14 0.14 0.14
Table 6Maximum specific growth rate of bacteria at different temperature intervals
T (°C)Average temp. (°C)
Autotrophs Heterotrophs
µmax(20) (d–1) µmax(T) (d–1) µmax(20) (d–1) µmax(T) (d–1)
<15 13.6 0.8 0.622 6.0 4.66815–20 17.98 0.8 0.739 6.0 5.54420–25 22.50 0.8 0.882 6.0 6.61825–30 27.49 0.8 1.073 6.0 8.04830–35 31.38 0.8 1.250 6.0 9.377

N.A. El Hattab et al. / Desalination and Water Treatment 213 (2021) 190–201196
performed on one variable at a time. During this process, one variable is changed, and the others remain constant at the literature review average values. Fig. 5 shows the results of the sensitivity analysis; the horizontal axis rep-resents the dimensionless input of the variable parameter,
and the vertical alignment represents the dimensionless value for the parameter under study. The dimensionless value represents the value of the parameter per run divided by the average value or the proposed literature value at a convenient temperature. The output value represents the
0
200
400
600
800
1000
0 20 40 60 80 100
120
140
160
180
200
220
240
260
280
300
320
340
360
380
400
Tota
l CO
D (g
m/m
3 )Measured effluent COD from PSTMeasured effluent COD from FSTSimulated effluent COD from FST
Days
Fig. 3. Measured influent and effluent COD values and simulated effluent COD values of the aeration tank during the WWTP study period.
(a) (b)
Fig. 4. MATLAB simulation results for (a) soluble COD and (b) heterotrophic biomass concentration of randomly chosen actual readings.
Table 7Measured operating conditions for different runs used in the extended ASM1
pH T (°C) Total COD influent (g/m3)
Soluble COD influent (g/m3)
MLVSS (g/m3)
DO (mg/L)
Simulated COD effluent (g/m3)
Total COD effluent (g/m3)
Run 1 9.3 22.6 529.92 238.46 2,510 1.8 37.8 84Run 2 7.6 32 368.32 165.74 3,347 1.2 35.1 78Run 3 7.4 12.8 531.2 239.04 2,540 1.4 48.6 108Run 4 8.2 18.4 481.92 216.86 2,410 1.6 58.95 131Run 5 8.2 19.6 640 288 3,842 1 58.95 131Run 6 9.4 26.3 397 178.65 2,470 1.3 44.1 98
197N.A. El Hattab et al. / Desalination and Water Treatment 213 (2021) 190–201
total effluent COD concentration. The sensitivity analy-sis revealed that KS and µmax(H) are the parameters with the greatest influence on total effluent COD, whereas KA and Kd(H) have less impact on effluent COD [23].
3.2. Effect of temperature on WWTP performance
Utilizing the parameters calculated above, as well as the calibrated kinetic and stoichiometric parameters men-tioned in Tables 5 and 6, an assessment for the effect of the various operating parameters on COD removal is performed at different temperatures using the extended ASM1. MLVSS can vary significantly due to the influent wastewater characterization or due to seeding of activated sludge tanks. As mentioned earlier, the heterotrophic bio-mass concentration is a fundamental parameter for ASM1 model equations, calibration, and simulations. XBH is cal-culated using Eq. (5). The equation parameter depends on neither HRT nor DO variability. As such, during the set of runs of HRT and DO, XBH was taken as the average value calculated earlier for this specific WWTP. As per the parameters shown in Eq. (5), the value of XBH depends on the MLVSS value which was reflected during the simula-tion runs of variable MLVSS. Fig. 6 shows the analysis of soluble COD at different sets of runs for different MLVSS concentrations and temperature ranges using fixed oper-ational conditions of pH = 8, DO = 2.5 mg/L, HRT = 6 h, and flow rate of 2,083 m3/h. The results demonstrate that
at the same temperature, and while increasing the MLVSS concentration from 2,500 to 4,000 mg/L inside the aeration tank, the average removal efficiency of COD increases. This increase can be attributed to the increase in XBH [10,11]. In addition, the results show that the average COD removal efficiency increases at different MLVSS concentrations at higher temperatures, which can be attributed to the signifi-cant increase in µmax(H). The average COD removal efficiency is also improved from 69% to about 84% as the measured temperature increases from 15°C to 35°C, as presented in Fig. 7. Moreover, Fig. 7 shows a convergence between sim-ulated and measured total effluent COD concentrations at different MLVSS concentrations in g/m3 and temperature ranges. As such, the plant operator can choose the required MLVSS concentration for COD removal based on the tem-perature of influent wastewater.
DO is an operating parameter that significantly affects COD effluent removal efficiency. As such, it is important to predict the effluent COD at different DO concentra-tions. Table 8 gives an overview of the removal efficiency values of the total COD concentrations under different DO concentrations at various temperature ranges using fixed operational conditions of pH = 8, MLVSS = 2,791 mg/L, HRT = 6 h, and flow rate of 2,083 m3/h. The simulation results show that the removal efficiency of the total COD increases with an increase in DO concentration, indicating the significance of the extended ASM1 [2]. COD removal efficiency increased by 15% increase when the measured
0.00
0.20
0.40
0.60
0.80
1.00
0.5 0.6 0.7 0.8 0.9 1
Dim
ensio
nles
s out
put
(tota
l CO
D E
fflue
nt)
Dimensionless input (μmaxH)
(a)
3.003.253.503.754.004.254.504.755.00
0.5 0.6 0.7 0.8 0.9 1
Dim
ensio
nles
s out
put
(tota
l CO
D e
fflue
nt)
Dimensionless input (KA)
(b)
0.00
0.25
0.50
0.75
1.00
1.25
1.50
0 1 2 3 4 5 6 7 8 9 10
Dim
ensio
nles
s out
put
(tota
l CO
D e
fflue
nt)
Dimensionless input (KS)
(c)
0.80
0.85
0.90
0.95
1.00
1.05
1.10
0.00 0.50 1.00 1.50 2.00 2.50
Dim
ensio
nles
s out
put
(tota
l CO
D e
fflue
nt)
Dimensionless input (KdH)
(d)
Fig. 5. Sensitivity analysis for (a) maximum heterotrophic specific rate of growth (µmaxH), (b) dissociation coefficient (KA), (c) Monod half-saturation coefficient for heterotrophs (KS), and (d) decay rate for heterotrophs (KdH).

N.A. El Hattab et al. / Desalination and Water Treatment 213 (2021) 190–201198
temperature increases from 15°C to 35°C. Note that the removal efficiency percentage increased by 10% as the measured temperature increased from 15°C to 25°C; how-ever, the percentage increased by only 3% as the measured temperature increased from 25°C to 35°C.
HRT is an operating condition that significantly affects WWTP performance. Because the volume of the tanks is con-stant, the HRT is a function of influent discharge flowing to
the plant. Generally, most of the sewerage systems in Egypt are combined, receiving both storm and sewage discharges. During a stormwater event, the WWTP may experience diluted wastewater that can change the characteristics of the influent wastewater. In that case, HRT decreases. Conversely, HRT may increase in cases of operational com-plications within the factories served by the plant. A typical HRT value for the WWTP ranges from 6.14 to 6.47 h. Thus,
(a) (b)
(c) (d)
Fig. 6. MATLAB model simulations for soluble COD concentrations at different MLVSS concentrations and different temperature ranges. (a) 15°C–20°C, (b) 20°C–25°C, (c) 25°C–30°C, and (d) 30°C–35°C.
40
60
80
100
120
140
160
<15 15-20 20-25 25-30 30-35
m/mg(
DO
C tneulffE
3 )
Temperature (ºC)
Simulated MLVSS = 3000 mg/l Simulated MLVSS = 3500 mg/lActual MLVSS = 3000 mg/lActual MLVSS = 3500 mg/l
Fig. 7. Simulated and measured effluent COD concentrations for different MLVSS concentrations at different temperature ranges.

199N.A. El Hattab et al. / Desalination and Water Treatment 213 (2021) 190–201
it was decided to study the HRT under ranges that vary from 4 to 8 h utilizing the calibrated parameters. Table 9 shows the variation of the total COD removal efficiency at increasing HRTs under different temperature ranges. The results show that the average total COD removal efficiency increases when the temperature increases. At the same temperature, increasing the HRT increases the total COD removal efficiency by an average of 12% [2].
4. Conclusions
An extended ASM1 was utilized to simulate a full-scale WWTP performance at various operating temperatures. Wastewater characterization was determined with a detailed sampling campaign for the WWTP influent, raw primary settled, and effluent discharge. Kinetic and stoichiometric parameters were calibrated to represent the 6th of October WWTP, located in Cairo, Egypt. After calibration and vali-dation of the extended ASM1, several sets of runs were conducted to study the effect of temperature on total COD removal at various operating parameters: MLVSS, DO, and HRT. The results of the simulation runs were plotted vs. the temperature ranges, indicating the removal efficiency for the total COD concentration. Conversely, each parame-ter was studied separately within its set of runs. The runs of MLVSS showed that the value of total COD removal effi-ciency increased from 72% to 81% as the MLVSS concentra-tion increases from 2,500 to 4,000 mg/L at 20°C–25°C. The simulation results also showed that the removal efficiency of total COD concentration increased by about 15% when the measured temperature increased from 15°C to 35°C at
MLVSS of 2,500 mg/L, DO of 2 mg/L, and HRT of 6 h. Note that the increase in the removal efficiency for all operating parameters was significant at temperatures ranging from 15°C to 25°C. This paper provides the operator of the WWTP with various operating scenarios that can help optimize the COD removal efficiency of the plant.
Acknowledgments
The authors acknowledge the assistance provided by the 6th of October WWTP in making the data collected during this study available. Also, the authors acknowledge the American Society of Civil Engineers (ASCE) for making the model’s MATLAB code available at the ASCE library.
Symbols
ASM1 — Activated Sludge Model No. 1SI — Soluble inert CODSS — Soluble (readily) biodegradable CODXS — Particulate (slowly) biodegradable CODXB,H — Particulate heterotrophic biomassXB,A — Particulate autotrophic biomassXI — Particulate inert CODXP — Particulate bio-P heterotrophic biomassPST — Primary settling tankFST — Final settling tankTSS — Total suspended solids, mg/LVSS — Volatile suspended solids, mg/LRAS TSS — Return activated sludge total suspended
solids, mg/L
Table 9Analysis of the total COD removal efficiency for different HRT values at different temperature ranges
COD removal efficiency at different HRT and temperature ranges
HRT (h) <15°C 15°C–20°C 20°C–25°C 25°C–30°C 30°C–35°C
4.0 0.544 0.59 0.64 0.69 0.725.0 0.69 0.64 0.68 0.73 0.766.0 0.626 0.674 0.72 0.765 0.7957.0 0.647 0.696 0.74 0.785 0.8148.0 0.67 0.72 0.76 0.8 0.83Average 0.635 0.664 0.708 0.754 0.784
Table 8Analysis of the total COD removal efficiency for different DO values at different temperature ranges
COD removal efficiency at different DO values and temperature ranges
DO (g/m3) <15°C 15°C–20°C 20°C–25°C 25°C–30°C 30°C–35°C
1.0 0.589 0.639 0.69 0.737 0.7711.5 0.623 0.672 0.719 0.763 0.7942.0 0.643 0.69 0.734 0.777 0.812.5 0.654 0.7 0.743 0.785 0.8133.0 0.662 0.707 0.75 0.79 0.817Average 0.634 0.682 0.73 0.77 0.801
N.A. El Hattab et al. / Desalination and Water Treatment 213 (2021) 190–201200
RAS VSS — Return activated sludge volatile suspended solids, mg/L
MLSS — Mixed liquor suspended solids, mg/LMLVSS — Mixed liquor volatile suspended solids, mg/LTS — Total solids, mg/LTVS — Total volatile solids, mg/LTDS — Total dissolved solids, mg/LF/M ratio — Food to microorganism ratioBOD5 — Biochemical oxygen demand, mg/LCOD — Chemical oxygen demand, mg/LDO — Dissolved oxygen, mg/LSRT — Solids retention time, dayHRT — Hydraulic retention time, hTKN — Total kjeldahl nitrogen, mg/LNO2–N — Nitrite–nitrogen, mg/LNO3–N — Nitrate–nitrogen, mg/LNH3–N — Ammonia–nitrogen, mg/LTotal P — Total phosphorus, mg/LOrtho P — Ortho phosphorus, mg/LCS(H,N) — COD and NH4–N concentrations in bulk
solution, kg/m3
CX(H,A) — Heterotrophic and autotrophic biomass concentrations in bulk solution, kg/m3
CSi(H,N) — Influent COD and NH4–N concentrations, kg/m3
CXi(H,A) — Influent heterotrophic and autotrophic biomass concentrations, kg/m3
CHS(H,N) — Unionized COD and NH4–N substrate concentrations, kg/m3
CO2 — Dissolved oxygen concentration, kg/m3
Fin — Influent flow to reactor, m3/hV — Volume of aeration tank, m3
Kd(H,A) — Decay rate for heterotrophs and autotro-phs, d–1
µmax(H,A) — Maximum specific rate of growth for heterotrophs and autotrophs, d–1
KS — Monod half-saturation coefficient for heterotrophs, gCOD/m3
KO2(H,A) — Oxygen half saturation coefficient for heterotrophs and autotrophs, g O2/m3
KA — Dissociation coefficient, dimensionlessKN — Monod half-saturation constant for auto-
trophs, g NH3/m3
µmax(20) — Maximum specific growth rate of bacteria at 20°C, d–1
µmax(T) — Maximum specific growth rate of bacteria at temperature T, d–1
θ — Temperature-activity coefficientƒE — Fraction of heterotrophic active biomass
that is endogenous residueƒCV — COD to VSS ratio of the mixed liquor
organic suspended solids, mg COD/mg VSSƒN — TKN to VSS ratio of the mixed liquor
organic suspended solids, mg TKN/mg VSSYH — Yield coefficient of heterotrophs, g COD
formed/g COD oxidizedYA — Yield coefficient of autotrophs, g COD
formed/g N oxidizedOUR — Oxygen uptake rate, mg O/L/hXBH — Heterotrophic active biomass concentration
due to mixed liquor, mg VSS/L
References[1] A. Elawwad, M. Matta, M. Abo-Zaid, H. Abdel-Halim, Plant-
wide modeling and optimization of a large-scale WWTP using BioWin’s ASDM model, J. Water Process Eng., 31 (2019), doi: 10.1016/j.jwpe.2019.100819.
[2] M. Soliman, H. Abdel-Halim, E. Helmy, M. El-Seddik, M. Moharram, A study of A2/O process in El-Berka WWTP by replacing the anaerobic selector with UASB and adopting a hybrid system in the oxic zone, Sep. Sci. Technol., 55 (2020) 1–8.
[3] F.A. Nasr, A. El-Ashmawy, G. El Taweel, S.A. El-Shafai, Waste Stabilization Ponds for Wastewater Treatment and Reuse in Egypt, First international conference on Hazardous waste Management, Chania, Crete, 2008.
[4] H.I. Abdel-Shafy, M.A.M. Salem, Efficiency of Oxidation Ponds for Wastewater Treatment in Egypt, M.K. Zaidi, Ed., Wastewater Reuse-Risk Assessment, Decision-Making and Environmental Security, Springer, Dordrecht, 2007, pp. 175–184.
[5] F. Delrue, J.M. Choubert, A.E. Stricker, M. Spérandio, M. Mietton-Peuchot, Y. Racault, Modelling a full scale membrane bioreactor using Activated Sludge Model No.1: challenges and solutions, Water Sci. Technol., 62 (2010) 2205–2217.
[6] A. Elawwad, A. Naguib, H. Abdel-Halim, Modeling of phenol and cyanide removal in a full-scale coke-oven wastewater treatment plant, Desal. Water Treat., 57 (2016) 25181–25193.
[7] A. Elawwad, M. Zaghloul, H. Abdel-Halim, Simulation of municipal-industrial full scale WWTP in an arid climate by application of ASM3, J. Water Reuse Desal., 7 (2017) 37–44.
[8] M. Henze, C.P.L. Grady, W. Gujer, G.v.R. Marais, T. Matsuo, Activated Sludge Model No. 1, IAWPRC Publishing, London, 1987.
[9] M. Henze, W. Gujer, T. Mino, M. van Loosdrecht, Activated Sludge Models ASM1, ASM2, ASM2d and ASM3, Scientific and Technical Report Series, IWA Publishing, London, 2000.
[10] M.M. El-Seddik, Modified fractional-order activated sludge model (MFASM) for aerobic microbial growth in wastewater, Inorg. Chem. Ind. J., 12 (2017) 1–8.
[11] A.M. Al Madany, M.M. El-Seddik, K.Z. Abdallah, Extended Activated Sludge Model No. 1 with floc and biofilm diffusion for organic and nutrient removal, J. Environ. Eng., 146 (2020) 040200081–0402000811, doi: 10.1061/(ASCE)EE.1943-7870.0001669.
[12] H. Abbas, H. Seif, A. Moursi, Effect of Hydraulic Retention Time on the Activated Sludge System, Proceedings of Sixth International Water Technology Conference, IWTC, Alexandria, Egypt, 2001.
[13] K.H.S.M. Dharmadasa, S. Chairuangsri, S. Saenton, A. Jam-peetong, Effects of hydraulic retention time on the pilot-scale activated sludge and floating aquatic macrophytes wetland system for treatment of cafeteria wastewater, Int. J. Adv. Sci. Eng. Technol., 6 (2018) 48–53.
[14] K. Kumar, G.K. Singh, M.G. Dastidar, T.R. Sreekishan, Effect of mixed liquor volatile suspended solids (MLVSS) and hydraulic retention time (HRT) on the performance of activated sludge process during the biotreatment of real textile wastewater, Water Resour. Ind., 5 (2014) 1–8.
[15] U. Jeppsson, G. Olsson, Reduction order models for on-line parameter identification of the activated sludge process, Water Sci. Technol., 28 (1993) 173–183.
[16] U. Jeppsson, Modelling Aspects of Wastewater Treatment Processes, Lund Institute of Technology, ISBN 91–88934–00–4, PhD Thesis, Sweden, 1996.
[17] N.G. Mostafa, M.M. Galal, A.G. Radwan, E.M. Rashed, Comparison and database development of four recent ASM3 model extensions, J. Environ. Eng., 142 (2016) 040160211–040160219, doi: 10.1061/(ASCE)EE.1943-7870.0001087.
[18] P.W. Atkins, Physical Chemistry, 6th ed., Oxford University Press, Oxford, 1998, p. 739.
[19] M.M. El-Seddik, M.M. Galal, A.G. Radwan, H.S. Abdel-Halim, Modified kinetic-hydraulic UASB reactor model for treatment of wastewater containing biodegradable organic substrates, Water Sci. Technol., 73 (2016) 1560–1571.
[20] G. Sin, P.A. Vanrolleghem, Extensions to modeling aerobic carbon degradation using combined respirometric–titrimetric

201N.A. El Hattab et al. / Desalination and Water Treatment 213 (2021) 190–201
measurements in view of activated sludge model calibration, Water Res., 41 (2007) 3345–3358.
[21] Metcalf and Eddy, Wastewater Engineering: Treatment, Disposal and Reuse, McGraw-Hill Book Company, New York, United States of America (USA), 1991.
[22] B.J. Lee, M. Wentzel, G. Ekama, Y.Y. Choi, J.W. Choi, Measurement of ordinary heterotrophic organism active
biomass in activated sludge mixed liquor: evaluation and comparison of the quantifying techniques, Environ. Eng. Res., 19 (2014) 1–9.
[23] E. Liwarska-Bizukojc, D. Olejnik, R. Biernacki, S. Ledakowicz, Calibration of a complex activated sludge model for the full-scale wastewater treatment plant, Bioprocess Biosyst. Eng., 34 (2011) 659–670.