simulation of managed sea ice loads on a floating …shadialawneh/papers/icetech14-gem...
TRANSCRIPT
Paper No. ICETECH14-xxx-R0 Daley Page number: 1
Simulation of Managed Sea Ice Loads on a Floating Offshore Platform
using GPU-Event Mechanics
Claude Daley Memorial University
St. John's, Newfoundland and Labrador, Canada
Shadi Alawneh Memorial University
Dennis Peters
Memorial University
Gary Blades
Memorial University
Bruce Colbourne
Memorial University
ABSTRACT
The paper describes a GPU-based event mechanics (GEM) model of
the action of managed pack ice on a floating offshore structure. The ice
cover is represented by a large number of discrete polygonal ice floes,
of varying thickness. Each ice-structure contact is modeled, as is every
ice-ice contact. Time histories of total platform force (net mooring
force) and platform position are presented. Ice coverage, floe sizes and
thickness are varied in the simulation set. The work represents a further
exploration of the possibilities of GEM technology, which was
previously used to explore both resistance and local structural loads for
ships transiting pack ice. The work is part of a research project at
Memorial University of Newfoundland called STePS2 (Sustainable
Technology for Polar Ships and Structures).
KEY WORDS: ice forces; pack ice; simulation; GPU, event-
mechanics GEM
INTRODUCTION
The paper presents preliminary results concerning the use of
GPU-event mechanics (GEM) computer technology to simulate
the response of a moored drill barge to drifting pack ice, as an
approximation of managed ice.
The problem explored here is interaction of loose pack ice
comprised of small floes drifting onto a moored platform.
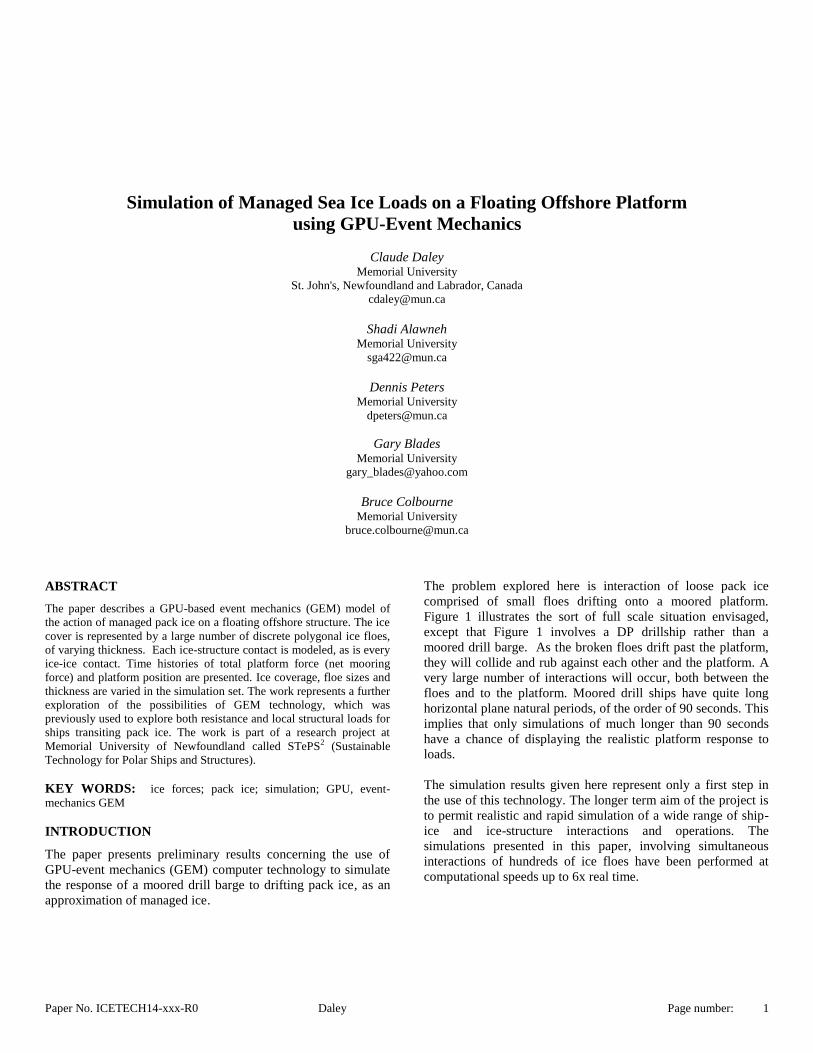
Figure 1 illustrates the sort of full scale situation envisaged,
except that Figure 1 involves a DP drillship rather than a
moored drill barge. As the broken floes drift past the platform,
they will collide and rub against each other and the platform. A
very large number of interactions will occur, both between the
floes and to the platform. Moored drill ships have quite long
horizontal plane natural periods, of the order of 90 seconds. This
implies that only simulations of much longer than 90 seconds
have a chance of displaying the realistic platform response to
loads.
The simulation results given here represent only a first step in
the use of this technology. The longer term aim of the project is
to permit realistic and rapid simulation of a wide range of ship-
ice and ice-structure interactions and operations. The
simulations presented in this paper, involving simultaneous
interactions of hundreds of ice floes have been performed at
computational speeds up to 6x real time.
Paper No. ICETECH14-xxx-R0 Daley Page number: 2
www.sitnews.us: Photo by Martin Jakobsson, Stockholm University
Figure 1. Drilling in managed pack ice at North Pole, 2004.
Another aim of the paper is to explore a new use of the GPU-
Event-Mechanics (GEM) simulation approach. The GEM
approach integrates several concepts. The physical space is
described as a set of bodies. The movements (kinematics) of the
bodies are tracked using simple equations of motion. Time is
divided into relatively long ‘moments’, during which events
occur. All variables in the simulation; forces, movements,
fractures and other changes, are considered to be aspects of
events. Some events are momentary, while others are
continuing. Some events involve a single body and are termed
solo events. Motion, for example, is treated as a solo event.
Some events are two-body events. Impact is an example of a
two-body event. The basic collision event was originally
developed to represent the design scenario in the IACS Polar
Rules (Daley 2000). That event was based on a method
developed by Popov et al. (1967), updated with a pressure-area
model. The models were extended further to permit direct
design of polar ships (Daley 1999, 2001, Daley et. al. 2007 and
Daley and Kendrick 2008). The GEM model takes the event
concept and implements it in a massively parallel multi-body
interaction simulation. The GEM model combines the event
concept with the massively parallel computation power of
GPUs. A GPU (Graphics Processing Unit) is a common element
found in modern computer graphics cards. The GPU is primarily
intended for making rapid calculations associated with the
display. However, special software can access the GPU and
enhance the computing power available to the user. See (Daley
et.al. 2012, 2014) for further discussion of GPUs.
The event models are the analytical solutions of specific
scenarios. As a result, the events do not require solution (in the
numerical sense) during the GEM simulation. The event
solution is merely invoked for the specific inputs that arise at
that point in the GEM simulation. For example, the collision
load depends on the specific shape and position of the ice floe,
as well as thickness, flexural strength and crushing behavior.
The load also depends on hull form and impact location, as well
as the mass properties of the ship. There are dozens of input
variables which influence the specific event parameters.
Nevertheless, the computation problem is far smaller than if the
continuum mechanics were to be solved for each collision event.
As a rough comparison, the results presented here represent
about 72 hrs of real-time interaction and took about 36hrs to
compute on a GPU card costing less than $1000. If all the
collisions could have been calculated as continuum events in
LS-Dyna (which was used to study single events) the total
computation time on a standard desktop computer would be in
the range of 10,000 to 100,000 years. The GEM model focuses
on the large scale system involving a large number of bodies,
rather than on any single impact. This feature has great practical
significance for design, assessment and training applications.
MODEL INPUT
Ice Conditions
The 36 simulations discussed below were performed in ice
fields with three types of concentrating boundaries and 3
different current speeds. All the fields involved the same set of
4008 randomly shaped and oriented polygons representing ice of
4/10ths concentration (see Figure 3). The thickness of the floes
was set to be 1.2m, 0.7m or 0.5m (thick, medium and thin first
year ice). In one case there was a mix of 1/10 thick, 2/10
medium and 1/10 thin ice. In the other cases all the ice was of
one thickness.
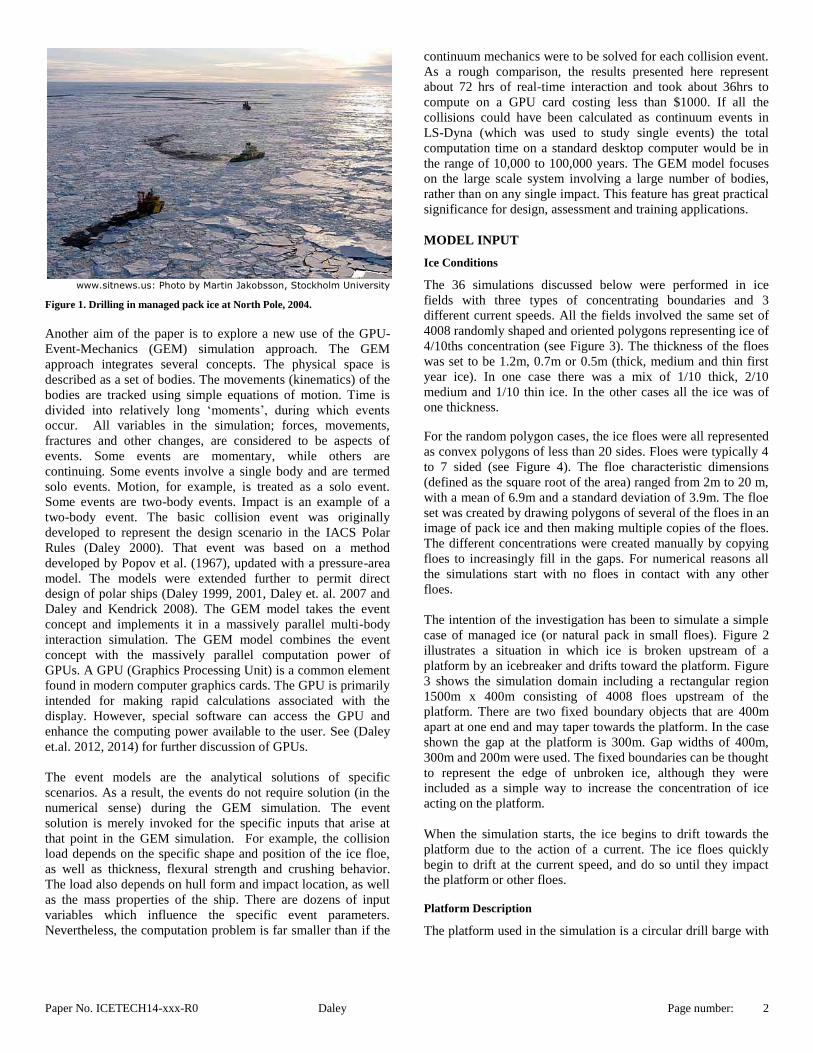
For the random polygon cases, the ice floes were all represented
as convex polygons of less than 20 sides. Floes were typically 4
to 7 sided (see Figure 4). The floe characteristic dimensions
(defined as the square root of the area) ranged from 2m to 20 m,
with a mean of 6.9m and a standard deviation of 3.9m. The floe
set was created by drawing polygons of several of the floes in an
image of pack ice and then making multiple copies of the floes.
The different concentrations were created manually by copying
floes to increasingly fill in the gaps. For numerical reasons all
the simulations start with no floes in contact with any other
floes.
The intention of the investigation has been to simulate a simple
case of managed ice (or natural pack in small floes). Figure 2
illustrates a situation in which ice is broken upstream of a
platform by an icebreaker and drifts toward the platform. Figure
3 shows the simulation domain including a rectangular region
1500m x 400m consisting of 4008 floes upstream of the
platform. There are two fixed boundary objects that are 400m
apart at one end and may taper towards the platform. In the case
shown the gap at the platform is 300m. Gap widths of 400m,
300m and 200m were used. The fixed boundaries can be thought
to represent the edge of unbroken ice, although they were
included as a simple way to increase the concentration of ice
acting on the platform.
When the simulation starts, the ice begins to drift towards the
platform due to the action of a current. The ice floes quickly
begin to drift at the current speed, and do so until they impact
the platform or other floes.
Platform Description
The platform used in the simulation is a circular drill barge with
Paper No. ICETECH14-xxx-R0 Daley Page number: 3
the following nominal properties:
Diameter: 100m
Waterline shape: vertical
Mass: 100,000 tonnes
Mooring Stiffness: 500 kN/m (linear, both x and y)
Geometry: 2D polygon (20 sided)
Figure 2. Concept sketch of simulation.
Figure 3. Actual geometry of 2D simulation domain
Figure 4. Close-up of Random Polygonal ice floes
MODEL MECHANICS
Ice Behavior
As stated above, the concept for the simulation is the rapid
assessment of a sequence of discrete interactions with a large
number of discrete ice objects. The transit of a vessel through
pack ice, and the interactions of the ice are modeled as a set of
contact events. The movements are treated using simple
equations of motion. The individual ice blocks move in the 2D
space of the simulation. The position and velocity of each floe is
updated every time step. A simple water drag model results in
the floes tending to slow. Ice-ice interactions account for both
ice crushing impact forces and steady elastic stresses to resist
static pressure. In this generation of the model there is only the
current driving force but no wind. Neither are there any of the
more complex responses such as rafting and rubbling. These are
being planned for future generations of the model.
Each ice-ice collision event within the pack is treated using a
method that can be traced to Popov et. al (1967). The method
was updated to reflect ice contact pressure-area effects (Daley,
1999), and used for a variety of ship-ice interaction scenarios
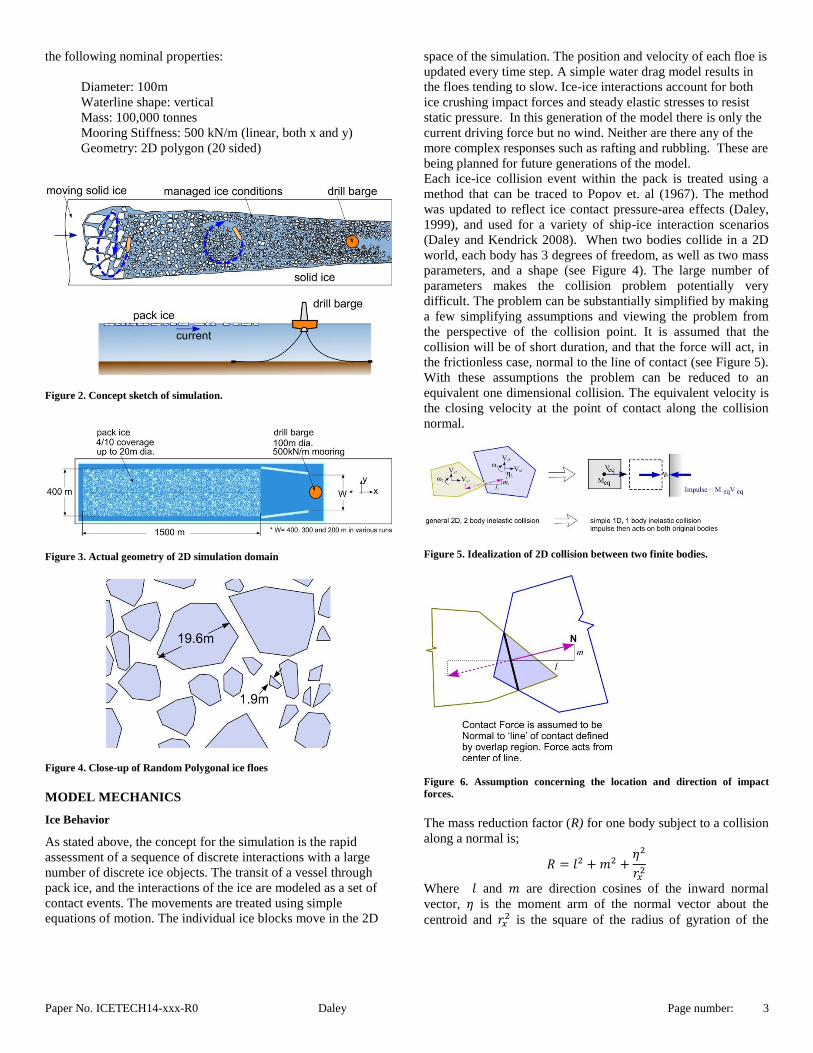
(Daley and Kendrick 2008). When two bodies collide in a 2D
world, each body has 3 degrees of freedom, as well as two mass
parameters, and a shape (see Figure 4). The large number of
parameters makes the collision problem potentially very
difficult. The problem can be substantially simplified by making
a few simplifying assumptions and viewing the problem from
the perspective of the collision point. It is assumed that the
collision will be of short duration, and that the force will act, in
the frictionless case, normal to the line of contact (see Figure 5).
With these assumptions the problem can be reduced to an
equivalent one dimensional collision. The equivalent velocity is
the closing velocity at the point of contact along the collision
normal.
Figure 5. Idealization of 2D collision between two finite bodies.
Figure 6. Assumption concerning the location and direction of impact
forces.
The mass reduction factor (R) for one body subject to a collision
along a normal is;
𝑅 = 𝑙2 +𝑚2 +𝜂2
𝑟𝑥2
Where 𝑙 and 𝑚 are direction cosines of the inward normal
vector, 𝜂 is the moment arm of the normal vector about the
centroid and 𝑟𝑥2 is the square of the radius of gyration of the
Paper No. ICETECH14-xxx-R0 Daley Page number: 4
body. Each body in a two body collision has a unique mass
reduction factor. The above mass reduction factor represents the
simplest case for 2D without added mass or friction.
Enhancements to the formula have been developed to include
effects of hydrodynamic added mass and friction and 3D effects
(see Daley 1999).
The program assumes that all collisions are inelastic, where the
ice crushing energy absorbs all the effective kinetic energy. A
collision is detected in one time step when the two bodies are
found to overlap. The effective masses and normal velocities are
determined for each colliding body for their respective points of
impact. The direction of relative motion is determined to allow
the determination of the friction direction. The impulse that will
eliminate the net normal velocity is then found. That impulse is
applied to each body in an equal and opposite sense. The result
is that the normal velocity at that point is zero in the next time
step. This does not mean that all motion is stopped. Ice floes
tend to rotate around the collision point and slide away. This
approach does contain some idealizations and approximations,
but does appear to be stable and produce reasonable results.
Platform Behavior
The platform is modeled as a floating body subject to ice impact
forces, inertial forces and a simple mooring restoring force. In
most of the simulations, the water drag (damping) in the
platform was ignored. Two simulations (1c and 1e) were done
with water drag to see the effect of this assumption.
SIMULATION CASES
The basic set of simulation runs is tabulated in Table 1, showing
the ice thickness, boundary width and current speed parameters.
Table 2 lists 5 additional alternative runs that were all based on
run #1. These alternatives were used to see if the model was
behaving as might be expected, as a check. The results of these
check runs is described below.
Table 1. List of simulation run parameters.
# Runs Cthk Cmed Cthin W Current 1/10th 1/10th 1/10th m m/s
1 004_400_25 0 0 4 400 0.25 2 004_400_50 0 0 4 400 0.50 3 004_400_100 0 0 4 400 1.00 4 004_300_25 0 0 4 300 0.25 5 004_300_50 0 0 4 300 0.50 6 004_300_100 0 0 4 300 1.00 7 004_200_25 0 0 4 200 0.25 8 004_200_50 0 0 4 200 0.50 9 004_200_100 0 0 4 200 1.00
10 040_400_25 0 4 0 400 0.25 11 040_400_50 0 4 0 400 0.50 12 040_400_100 0 4 0 400 1.00 13 040_300_25 0 4 0 300 0.25 14 040_300_50 0 4 0 300 0.50 15 040_300_100 0 4 0 300 1.00 16 040_200_25 0 4 0 200 0.25 17 040_200_50 0 4 0 200 0.50 18 040_200_100 0 4 0 200 1.00 19 400_400_25 4 0 0 400 0.25 20 400_400_50 4 0 0 400 0.50
21 400_400_100 4 0 0 400 1.00 22 400_300_25 4 0 0 300 0.25 23 400_300_50 4 0 0 300 0.50 24 400_300_100 4 0 0 300 1.00 25 400_200_25 4 0 0 200 0.25 26 400_200_50 4 0 0 200 0.50 27 400_200_100 4 0 0 200 1.00 28 121_400_25 1 2 1 400 0.25 29 121_400_50 1 2 1 400 0.50 30 121_400_100 1 2 1 400 1.00 31 121_300_25 1 2 1 300 0.25 32 121_300_50 1 2 1 300 0.50 33 121_300_100 1 2 1 300 1.00 34 121_200_25 1 2 1 200 0.25 35 121_200_50 1 2 1 200 0.50 36 121_200_100 1 2 1 200 1.00
Table 2. List of alternative run parameters.
# Runs Mooring Stiff
Water Drag on Platform
Note
kN/m
1 004_400_25 500 no
1a 004_400_25(2) 500 no re-run #1 as is
1b 004_400_25_F 500 no re-run #1 w/ ice forces extracted
1c 004_400_25_WD 500 yes re-run #1 water drag on OS
1d 004_400_25_50kND 50 no re-run #1 at 50kN w/o water drag on OS
1e 004_400_25_50k_WD 50 yes re-run #1 at 50kN w/water drag on OS
MODEL RESULTS
A few example outputs are shown below to illustrate the type of
data available from the model.
Field Images
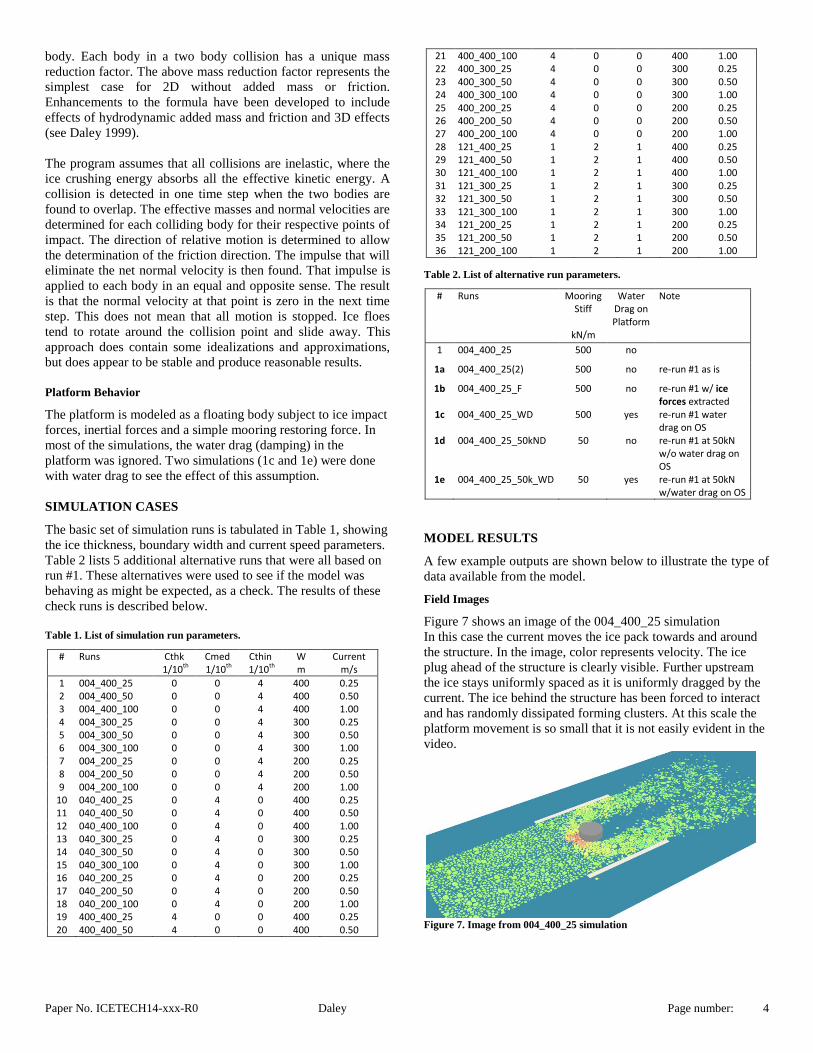
Figure 7 shows an image of the 004_400_25 simulation
In this case the current moves the ice pack towards and around
the structure. In the image, color represents velocity. The ice
plug ahead of the structure is clearly visible. Further upstream
the ice stays uniformly spaced as it is uniformly dragged by the
current. The ice behind the structure has been forced to interact
and has randomly dissipated forming clusters. At this scale the
platform movement is so small that it is not easily evident in the
video.
Figure 7. Image from 004_400_25 simulation
Paper No. ICETECH14-xxx-R0 Daley Page number: 5
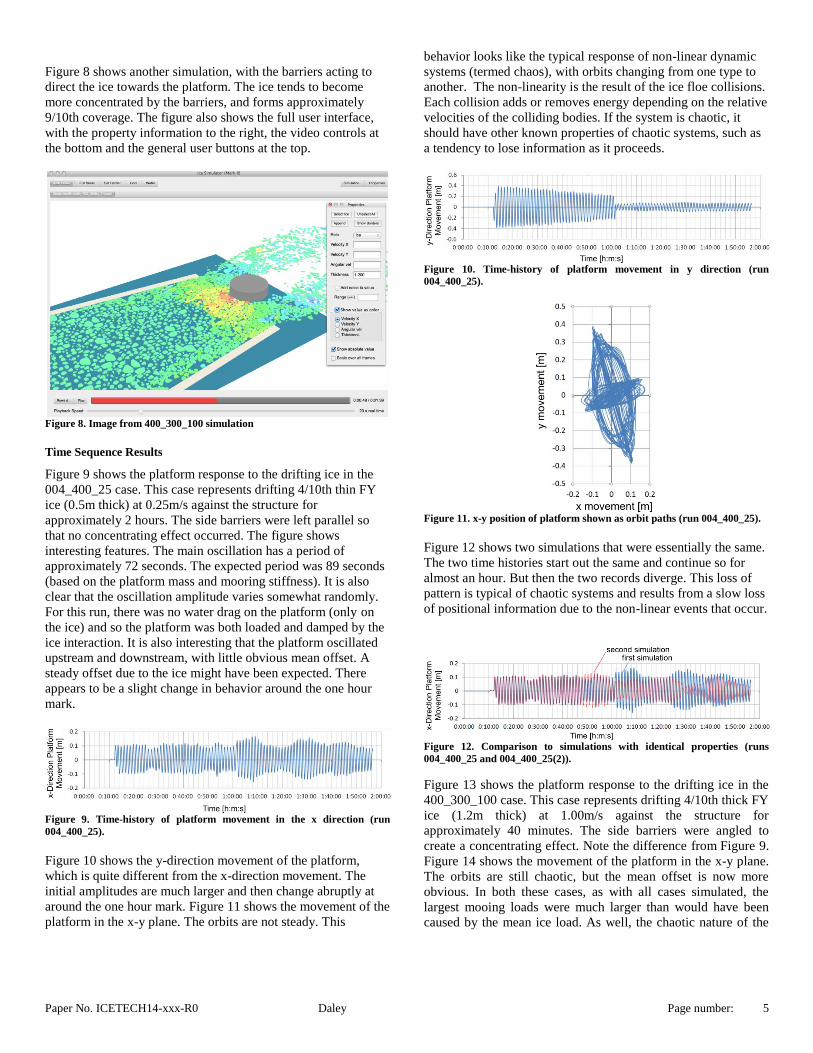
Figure 8 shows another simulation, with the barriers acting to
direct the ice towards the platform. The ice tends to become
more concentrated by the barriers, and forms approximately
9/10th coverage. The figure also shows the full user interface,
with the property information to the right, the video controls at
the bottom and the general user buttons at the top.
Figure 8. Image from 400_300_100 simulation
Time Sequence Results
Figure 9 shows the platform response to the drifting ice in the
004_400_25 case. This case represents drifting 4/10th thin FY
ice (0.5m thick) at 0.25m/s against the structure for
approximately 2 hours. The side barriers were left parallel so
that no concentrating effect occurred. The figure shows
interesting features. The main oscillation has a period of
approximately 72 seconds. The expected period was 89 seconds
(based on the platform mass and mooring stiffness). It is also
clear that the oscillation amplitude varies somewhat randomly.
For this run, there was no water drag on the platform (only on
the ice) and so the platform was both loaded and damped by the
ice interaction. It is also interesting that the platform oscillated
upstream and downstream, with little obvious mean offset. A
steady offset due to the ice might have been expected. There
appears to be a slight change in behavior around the one hour
mark.
Figure 9. Time-history of platform movement in the x direction (run
004_400_25).
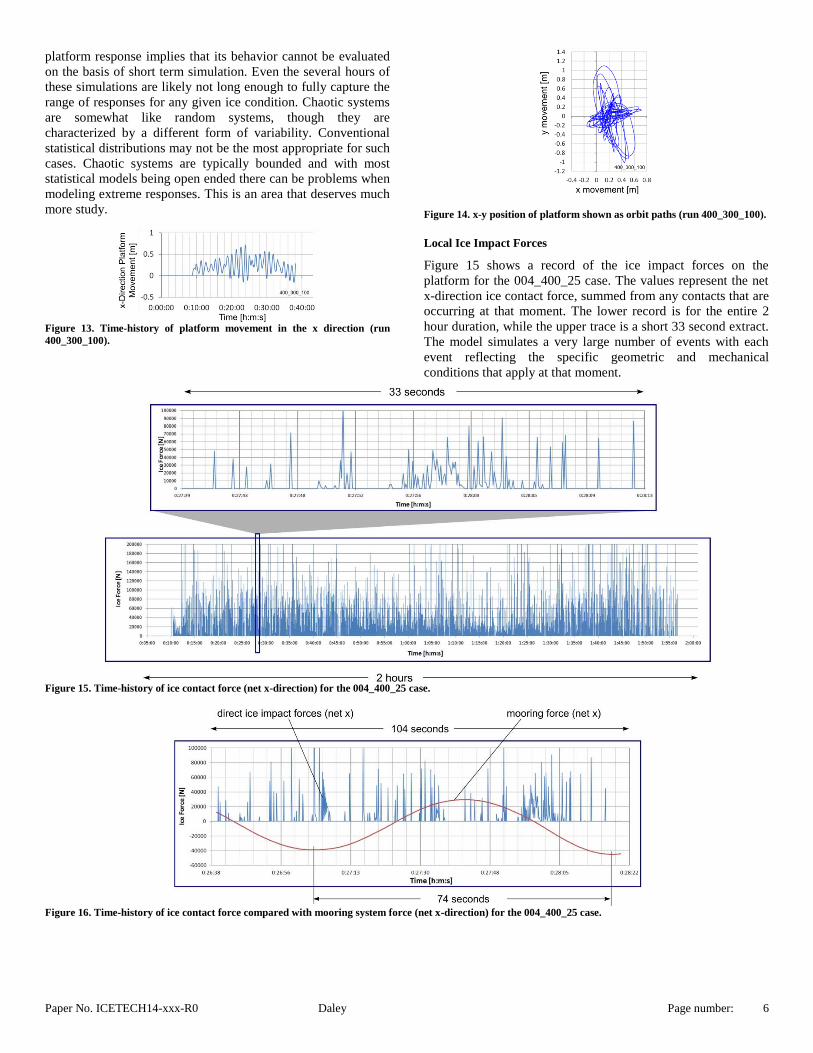
Figure 10 shows the y-direction movement of the platform,
which is quite different from the x-direction movement. The
initial amplitudes are much larger and then change abruptly at
around the one hour mark. Figure 11 shows the movement of the
platform in the x-y plane. The orbits are not steady. This
behavior looks like the typical response of non-linear dynamic
systems (termed chaos), with orbits changing from one type to
another. The non-linearity is the result of the ice floe collisions.
Each collision adds or removes energy depending on the relative
velocities of the colliding bodies. If the system is chaotic, it
should have other known properties of chaotic systems, such as
a tendency to lose information as it proceeds.
Figure 10. Time-history of platform movement in y direction (run
004_400_25).
Figure 11. x-y position of platform shown as orbit paths (run 004_400_25).
Figure 12 shows two simulations that were essentially the same.
The two time histories start out the same and continue so for
almost an hour. But then the two records diverge. This loss of
pattern is typical of chaotic systems and results from a slow loss
of positional information due to the non-linear events that occur.
Figure 12. Comparison to simulations with identical properties (runs
004_400_25 and 004_400_25(2)).
Figure 13 shows the platform response to the drifting ice in the
400_300_100 case. This case represents drifting 4/10th thick FY
ice (1.2m thick) at 1.00m/s against the structure for
approximately 40 minutes. The side barriers were angled to
create a concentrating effect. Note the difference from Figure 9.
Figure 14 shows the movement of the platform in the x-y plane.
The orbits are still chaotic, but the mean offset is now more
obvious. In both these cases, as with all cases simulated, the
largest mooing loads were much larger than would have been
caused by the mean ice load. As well, the chaotic nature of the
Paper No. ICETECH14-xxx-R0 Daley Page number: 6
platform response implies that its behavior cannot be evaluated
on the basis of short term simulation. Even the several hours of
these simulations are likely not long enough to fully capture the
range of responses for any given ice condition. Chaotic systems
are somewhat like random systems, though they are
characterized by a different form of variability. Conventional
statistical distributions may not be the most appropriate for such
cases. Chaotic systems are typically bounded and with most
statistical models being open ended there can be problems when
modeling extreme responses. This is an area that deserves much
more study.
Figure 13. Time-history of platform movement in the x direction (run
400_300_100).
Figure 14. x-y position of platform shown as orbit paths (run 400_300_100).
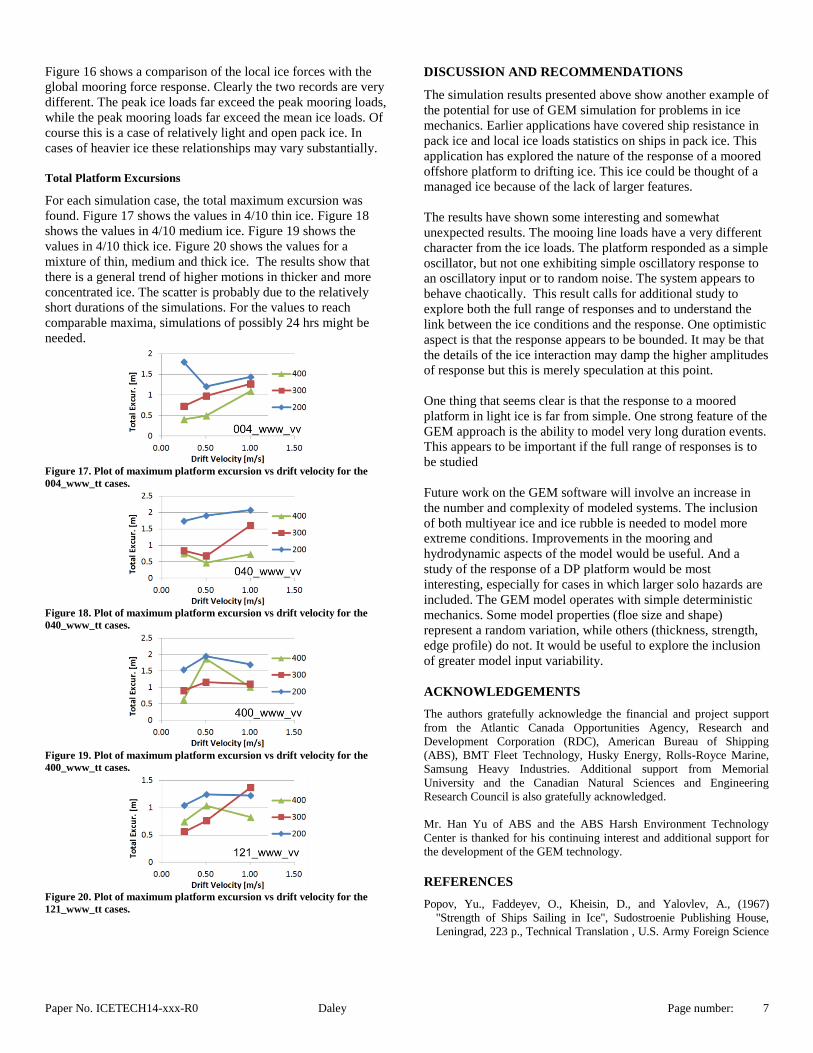
Local Ice Impact Forces
Figure 15 shows a record of the ice impact forces on the
platform for the 004_400_25 case. The values represent the net
x-direction ice contact force, summed from any contacts that are
occurring at that moment. The lower record is for the entire 2
hour duration, while the upper trace is a short 33 second extract.
The model simulates a very large number of events with each
event reflecting the specific geometric and mechanical
conditions that apply at that moment.
Figure 15. Time-history of ice contact force (net x-direction) for the 004_400_25 case.
Figure 16. Time-history of ice contact force compared with mooring system force (net x-direction) for the 004_400_25 case.
Paper No. ICETECH14-xxx-R0 Daley Page number: 7
Figure 16 shows a comparison of the local ice forces with the
global mooring force response. Clearly the two records are very
different. The peak ice loads far exceed the peak mooring loads,
while the peak mooring loads far exceed the mean ice loads. Of
course this is a case of relatively light and open pack ice. In
cases of heavier ice these relationships may vary substantially.
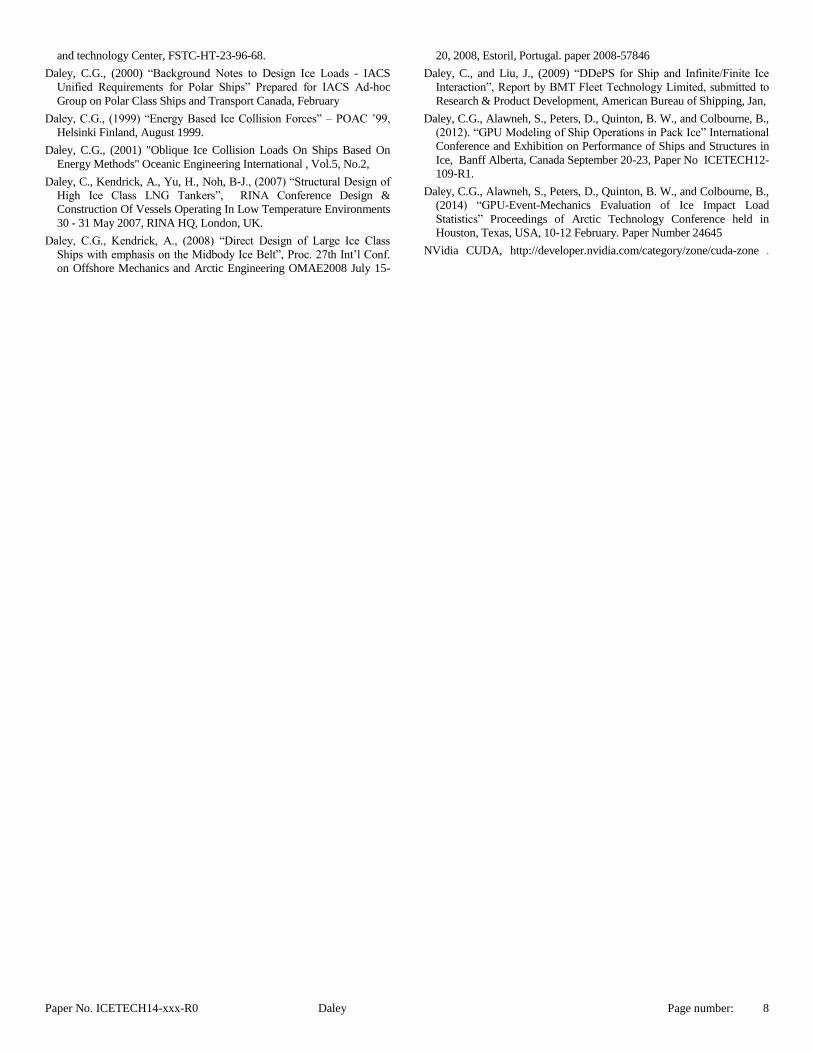
Total Platform Excursions
For each simulation case, the total maximum excursion was
found. Figure 17 shows the values in 4/10 thin ice. Figure 18
shows the values in 4/10 medium ice. Figure 19 shows the
values in 4/10 thick ice. Figure 20 shows the values for a
mixture of thin, medium and thick ice. The results show that
there is a general trend of higher motions in thicker and more
concentrated ice. The scatter is probably due to the relatively
short durations of the simulations. For the values to reach
comparable maxima, simulations of possibly 24 hrs might be
needed.
Figure 17. Plot of maximum platform excursion vs drift velocity for the
004_www_tt cases.
Figure 18. Plot of maximum platform excursion vs drift velocity for the
040_www_tt cases.
Figure 19. Plot of maximum platform excursion vs drift velocity for the
400_www_tt cases.
Figure 20. Plot of maximum platform excursion vs drift velocity for the
121_www_tt cases.
DISCUSSION AND RECOMMENDATIONS
The simulation results presented above show another example of
the potential for use of GEM simulation for problems in ice
mechanics. Earlier applications have covered ship resistance in
pack ice and local ice loads statistics on ships in pack ice. This
application has explored the nature of the response of a moored
offshore platform to drifting ice. This ice could be thought of a
managed ice because of the lack of larger features.
The results have shown some interesting and somewhat
unexpected results. The mooing line loads have a very different
character from the ice loads. The platform responded as a simple
oscillator, but not one exhibiting simple oscillatory response to
an oscillatory input or to random noise. The system appears to
behave chaotically. This result calls for additional study to
explore both the full range of responses and to understand the
link between the ice conditions and the response. One optimistic
aspect is that the response appears to be bounded. It may be that
the details of the ice interaction may damp the higher amplitudes
of response but this is merely speculation at this point.
One thing that seems clear is that the response to a moored
platform in light ice is far from simple. One strong feature of the
GEM approach is the ability to model very long duration events.
This appears to be important if the full range of responses is to
be studied
Future work on the GEM software will involve an increase in
the number and complexity of modeled systems. The inclusion
of both multiyear ice and ice rubble is needed to model more
extreme conditions. Improvements in the mooring and
hydrodynamic aspects of the model would be useful. And a
study of the response of a DP platform would be most
interesting, especially for cases in which larger solo hazards are
included. The GEM model operates with simple deterministic
mechanics. Some model properties (floe size and shape)
represent a random variation, while others (thickness, strength,
edge profile) do not. It would be useful to explore the inclusion
of greater model input variability.
ACKNOWLEDGEMENTS
The authors gratefully acknowledge the financial and project support
from the Atlantic Canada Opportunities Agency, Research and
Development Corporation (RDC), American Bureau of Shipping
(ABS), BMT Fleet Technology, Husky Energy, Rolls-Royce Marine,
Samsung Heavy Industries. Additional support from Memorial
University and the Canadian Natural Sciences and Engineering
Research Council is also gratefully acknowledged.
Mr. Han Yu of ABS and the ABS Harsh Environment Technology
Center is thanked for his continuing interest and additional support for
the development of the GEM technology.
REFERENCES
Popov, Yu., Faddeyev, O., Kheisin, D., and Yalovlev, A., (1967)
"Strength of Ships Sailing in Ice", Sudostroenie Publishing House,
Leningrad, 223 p., Technical Translation , U.S. Army Foreign Science
Paper No. ICETECH14-xxx-R0 Daley Page number: 8
and technology Center, FSTC-HT-23-96-68.
Daley, C.G., (2000) “Background Notes to Design Ice Loads - IACS
Unified Requirements for Polar Ships” Prepared for IACS Ad-hoc
Group on Polar Class Ships and Transport Canada, February
Daley, C.G., (1999) “Energy Based Ice Collision Forces” – POAC ’99,
Helsinki Finland, August 1999.
Daley, C.G., (2001) "Oblique Ice Collision Loads On Ships Based On
Energy Methods" Oceanic Engineering International , Vol.5, No.2,
Daley, C., Kendrick, A., Yu, H., Noh, B-J., (2007) “Structural Design of
High Ice Class LNG Tankers”, RINA Conference Design &
Construction Of Vessels Operating In Low Temperature Environments
30 - 31 May 2007, RINA HQ, London, UK.
Daley, C.G., Kendrick, A., (2008) “Direct Design of Large Ice Class
Ships with emphasis on the Midbody Ice Belt”, Proc. 27th Int’l Conf.
on Offshore Mechanics and Arctic Engineering OMAE2008 July 15-
20, 2008, Estoril, Portugal. paper 2008-57846
Daley, C., and Liu, J., (2009) “DDePS for Ship and Infinite/Finite Ice
Interaction”, Report by BMT Fleet Technology Limited, submitted to
Research & Product Development, American Bureau of Shipping, Jan,
Daley, C.G., Alawneh, S., Peters, D., Quinton, B. W., and Colbourne, B.,
(2012). “GPU Modeling of Ship Operations in Pack Ice” International
Conference and Exhibition on Performance of Ships and Structures in
Ice, Banff Alberta, Canada September 20-23, Paper No ICETECH12-
109-R1.
Daley, C.G., Alawneh, S., Peters, D., Quinton, B. W., and Colbourne, B.,
(2014) “GPU-Event-Mechanics Evaluation of Ice Impact Load
Statistics” Proceedings of Arctic Technology Conference held in
Houston, Texas, USA, 10-12 February. Paper Number 24645
NVidia CUDA, http://developer.nvidia.com/category/zone/cuda-zone .