simulation of the reactive powder concrete (rpc) behavior ... · reactive powder concrete (rpc) is...
TRANSCRIPT
Journal of Rehabilitation in Civil Engineering 4-1 (2016) 63-77
journal homepage: http://civiljournal.semnan.ac.ir/
Simulation of the Reactive Powder Concrete (RPC)
Behavior Reinforcing with Resistant Fiber Subjected to
Blast Load
H. Akbarzadeh Bengar1* and M.R. Yavari
2
1. Department of Civil Engineering, University of Mazandaran, Babolsar, Iran
2. Department of Flight and Engineering, Imam Ali University, Tehran, Iran
*Corresponding author: [email protected]
ARTICLE INFO
ABSTRACT
Article history:
Received: 05 August 2015
Accepted: 15 November 2016
In research or experimental works related to blast loads, the
amount of explosion material and distance of explosion point
are very important. So, in this paper has been attempted to
present a parametric study of the reactive powder concrete
subjected to blast load. The effect of the different amount of
TNT adopted the literature, distance of explosion point from
RPC slab and also the location of explosion charge
(horizontal and vertical coordinates form the center of
specimens) has been investigated. In order to the analytical
simulation of RPC behavior against blast and also the
accuracy of acquired results, at first using ABAQUS
software, a RPC slab studied in the literature has been
verified. The obtained results are showed that the simulated
model of RPC is match with literature one. In the next stage,
a case study of the effect of explosion charge and also the
distance of explosion point from RPC and NSC (normal
strength concrete) slabs have been examined, and the results
have been compared. It’s noted that the NSC slab is
supposed to be a reinforced concrete, whereas 2% volume of
special short steel fibers were used in the RPC specimen.
The acquired results have been showed that the RPC have
better blast explosion resistance than reinforced normal
strength concrete.
Keywords:
Reactive Powder Concrete
(RPC),
Blast load,
Analytical simulation,
Explosion charge,
Explosion point.
1. Introduction
In recent years, there have been numerous
explosion-related accidents due to military and
terrorist activities. To protect structures and save
human lives against explosion accidents, better
understanding of the explosion effect on
structures is needed. In an explosion, the blast
load is applied to concrete structures as an
impulsive load of extremely short duration with
very high pressure and heat. Generally, concrete
is known to have a relatively high blast resistance
compared to other construction materials.
However, normal strength concrete structures
require higher strength to improve their
resistance against impact and blast loads.
64 H. Akbarzadeh Bengar and M. R. Yavari/ Journal of Rehabilitation in Civil Engineering 4-1 (2016) 63-77
Therefore, a new material with high-energy
absorption capacity and high resistance to
damage is a better material for blast resistance
design. Recently, Ultra High Strength Concrete
(UHSC) and Reactive Powder Concrete (RPC)
have been actively developed to significantly
improve concrete strength [1-2]. Reactive powder
concrete (RPC), otherwise known as ultra-high-
performance concrete, was developed through
microstructural enhancement techniques for
cementitious materials. As compared to ordinary
cement-based materials, the primary
improvements of RPC include the particle size
homogeneity, porosity, and microstructures. The
mechanical properties that can be achieved
include the compressive strength of the range
between 200 and 800 MPa, fracture energy of the
range between 1200 and 40,000 J/m2, and
ultimate tensile strain at the order of 1%. [1-2].
This is generally achieved by microstructural
engineering approach, including elimination of
the coarse aggregates, reduction of the water-to-
cementitious material, lowering of the CaO–SiO2
ratio by introducing the silica components, and
incorporation of steel fiber reinforcement [3–5].
The reinforcing effect of steel fibers is especially
critical to the mechanical properties of RPC
under tension. Among many UHPCs available on
the market, ultra-high strength concrete (UHSC)
and reactive powder concrete (RPC) are the most
widely used [6]. However, because of their ultra-
high strengths and manufacturing costs, the use
of UHSC and RPC has been questioned, with
concerns raised about possible ultra-brittle failure
and unfavorable cost-to-performance efficiency.
The UHSC specimen had a higher elastic
modulus than the RPC specimen for two reasons.
Firstly, UHSC has a higher material rigidity than
RPC, because UHSC is denser than RPC, and
secondly, RPC is more deformable than UHSC,
because RPC contains short steel fibers which
create multiple interfaces (similar to voids) in the
material [7]. RPC is a more appropriate
construction material for military facilities and
important structures than conventional concrete
owing to its enhanced workability and
mechanical properties. Reactive powder concrete
(RPC) is advanced cement based material, which
originally developed in the early 1990s by
Bouygues’ laboratory in France [8]. RPC possess
ultra-high static and dynamic strength, high
fracture capacity, low shrinkage and excellent
durability under severe condition [5, 8-10].
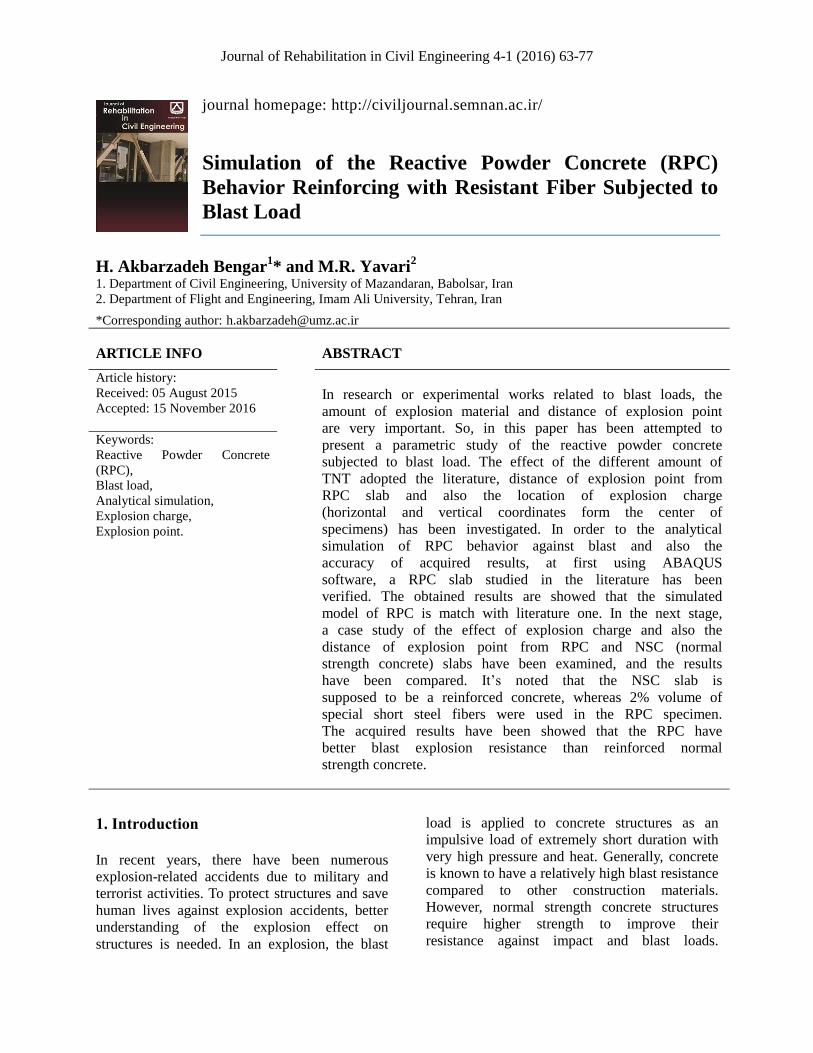
Jörg Jungwirth(2002) observed that the behavior
of RPC in compression is characterized by an
initially steady, linear load-deformation
relationship, a short nonlinear phase and then
fracture, which is associated with a decrease in
the stress. The stress then stabilizes at a residual
value (Fig. 1). The heat treatment has a
considerable influence on the compressive
resistance. With curing at 90°C, the compressive
resistance rises from 120 MPa to 180 MPa. The
failure pattern was characterized by a typical
diagonal crack [11].
Fig. 1. Stress-strain Curve of RPC and Failure Pattern [11].
Based on a composite material developed by
Richard and Cheyrezy (1994, 1995), reactive
powder concrete (RPC) is characterized by its
material’s uniformity that is increased by
eliminating coarse aggregate and using silica
sand with amaximum particle size of 400 µm.
Additionally, concrete density is increased by
selecting optimum particle size components [1,
8]. Zanni et al., (1996) observed the working
mechanism of RPC’s high strength and durability
while studying its microstructure. Based on use
of nuclear magnetic resonance technology, Zanni
et al. (1996) investigated the hydration and
pozzolanic reaction inside a specimen that
received 20 ◦C and 250 ◦C heat curing.
According to their results, the amount of silica
fume that participated in hydration was directly
proportional to the heat curing temperature [12].
Bayard and Plé (2003) found that the distribution
of steel fibers in RPC significantly affects its
mechanical behavior. Additionally, the
H. Akbarzadeh Bengar and M. R. Yavari/ Journal of Rehabilitation in Civil Engineering 4-1 (2016) 63-77 65
distribution could be adjusted via a modified
casting procedure to enhance its mechanical
performance [13]. Chan and Chu (2004)
elucidated how silica fume content affects the
cohesion between the RPC base material and
steel fibers, indicating that cohesive results are
optimum when the silica fume contents ranged
from 20–30% [14].
The microstructure of RPC is optimized by
precise gradation of all particles in the mix to
yield maximum compactness. With these merits,
RPC has a great potential prospect in the
protective shelter of military engineering and
nuclear waste treatment, which has received
significant concerns from experts across the word
[15–17]. However, the high cost, complex
fabrication technique and high energy demand of
RPC severely limit its commercial development
and application in the practical engineering
[18,19].
The main purpose of this study is evaluating the
blast resistance capacities of NSC (normal
strength concrete) and RPC (reactive powder
concrete) to determine whether these materials
are suitable for use in structures susceptible to
terrorist attacks or accidental impacts. In order to,
at first for accuracy of acquired results, using
ABAQUS software, a RPC slab studied in the
literature has been verified. The obtained results
are showed that the simulated model of RPC is
match with literature one. In resumption, a
parametric study having 4 scenarios having
different characteristics of NSC and RPC
subjected to blast load has been performed. The
result show that the robustness of RPC behavior
rather than NSC against blast loads. Numerical
results demonstrate that the RPC has more
resistant than NSC and as an ultra-high strength
concrete is suitable for structures under terrorist
attacks.
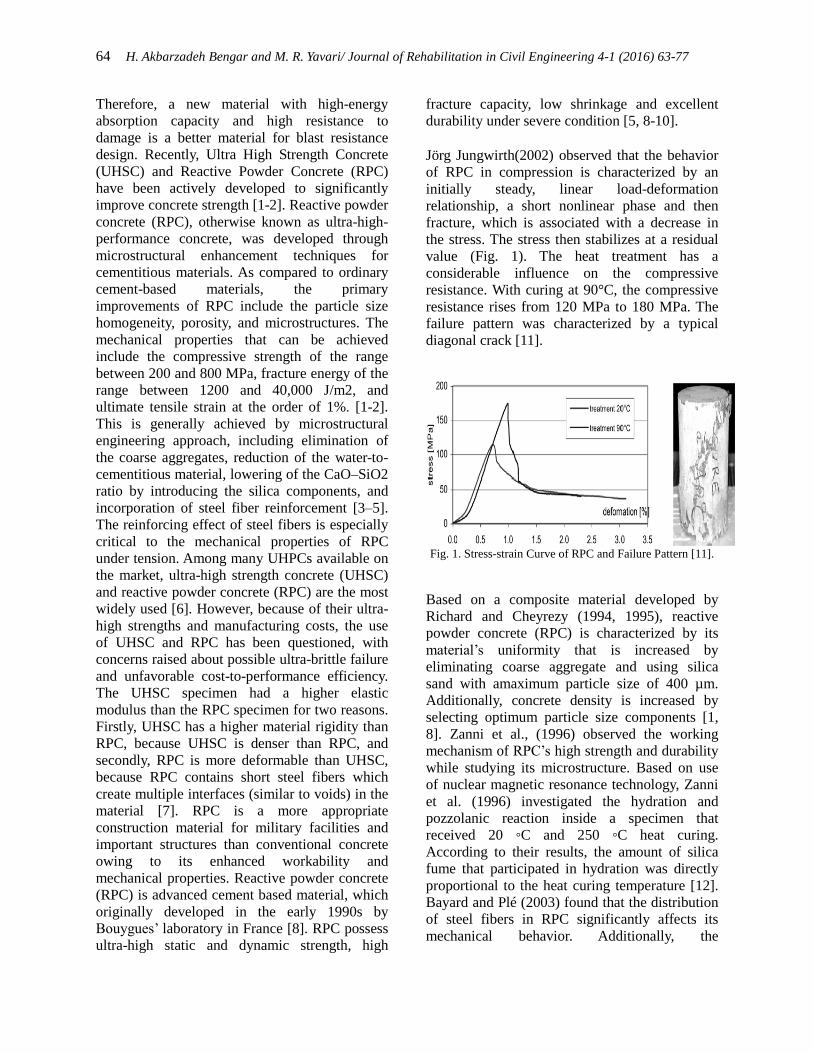
2. Characteristic of blast load An explosion is a very fast chemical reaction
producing transient air pressure waves called
blast waves. For a free-air burst, the blast wave
will travel away from the source as a spherical
wave front as shown in Fig 2(a) ([20-21]). The
peak overpressure and the duration of the
overpressure vary with distance from the
explosives. The magnitude of these parameters
also depends on the explosive materials from
which the explosive compound is made. Usually
the size of the explosive compound is given in
terms of a TNT weight. Explosive behavior
depends on a number of factors: ambient
temperature, ambient pressure, explosive
composition, explosive material properties, and
the nature of the ignition source type. Additional
factors include type, energy, and duration of the
events as well as geometry of surroundings (i.e.,
confined or unconfined). When a condensed high
explosive is initiated, explosion reaction
generates several additional characteristics such
as blast wave of very high pressure,
fragmentation from the explosive case or
structural elements, hot gas with a pressure from
100 up to 300 kilo bar, and a temperature of
about 3,000~4,000℃. The main blast effect is
impulsive pressure loading from the blast wave
as shown in Fig 2(b) (Baker 1973, Mays & Smith
1995 [22-23]). After a short time, the
overpressure behind the shock front drops rapidly
and becomes smaller than that of the surrounding
atmosphere as shown in Figure 2(b). This
pressure domain is known as the negative phase.
The front of the blast wave weakens as it
progresses outward and its velocity drops toward
the velocity of sound in the undisturbed
atmosphere. The characteristics of a blast wave
resulting from an explosion depend mainly on the
physical properties of the source and the medium
through which blast waves propagate. To create
reference blast experiments, some controlled
explosions have been conducted under ideal
conditions. To relate other explosions with non-
ideal conditions to the reference explosions, blast
scaling laws can be employed. The most widely
used approach to blast wave scaling is that
formulated by Hopkinson, which is commonly
described as the cube-root scaling law. The scaled
distance, Z, is defined using the Hopkinson-
Cranz's cube root law as (ASCE 1999 [24]): 1 1
3 3/ /Z R E or Z R W (1)
where, Z is scaling distance; R is stand-off
distance from the target structure; E is total
explosive thermal amount of energy; W is charge
weight of equivalent TNT amount. The scaling
distance is used for evaluation of blast wave
characteristics.
66 H. Akbarzadeh Bengar and M. R. Yavari/ Journal of Rehabilitation in Civil Engineering 4-1 (2016) 63-77
(a) Spherical free air blast
(b) Pressure-time history
Fig. 2. Spherical free air blast ([20-21]).
3. Validation of the simulated model of
RPC slab by experimental study In this part in order to analytical simulation of
RPC behavior against blast and also accuracy of
acquired results, at first using ABAQUS
software, a RPC slab studied in the literature [7]
has been verified. The obtained results are
showed that the simulated model of RPC is
match with literature one with appropriate
approximation. A fixed supported rectangular of
RPC slab with dimension 1000mm×1000mm
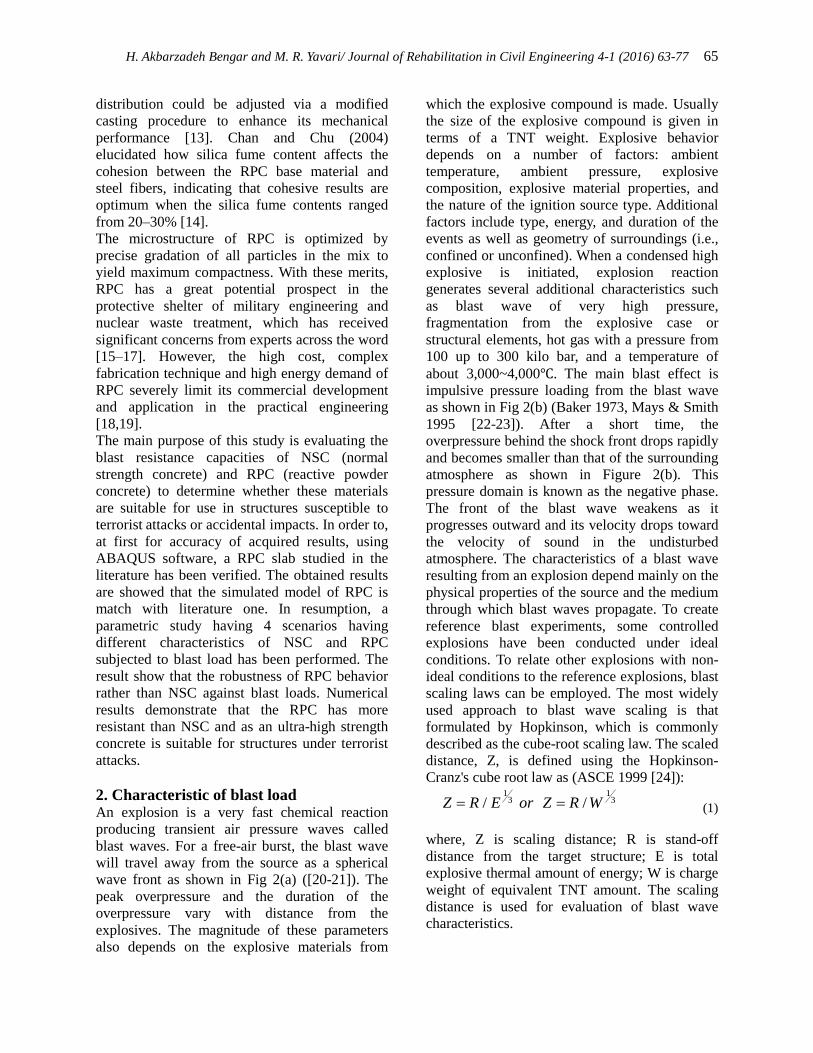
×150mm is presented in this study. In the first
step, a comparison between measurement data
and experimental modal data tested by Na-Hyun
Yi et al. [7] is made to validate the accuracy of
the numerical modal data. In the experimental
test, the RPC slab including 2% volume of
special short steel fibers subjected to 15.88 kg of
ANFO and a standoff distance of 1.5 m from the
center of the slab was selected for the main test
as Fig. 3.
(a)
(b)
(c)
Fig. 3. Measurement sensor locations: (a) pressure-meter
placement setup photo, (b) dimension of the RPC slab
(c) cross section of RPC slab [7].
H. Akbarzadeh Bengar and M. R. Yavari/ Journal of Rehabilitation in Civil Engineering 4-1 (2016) 63-77 67
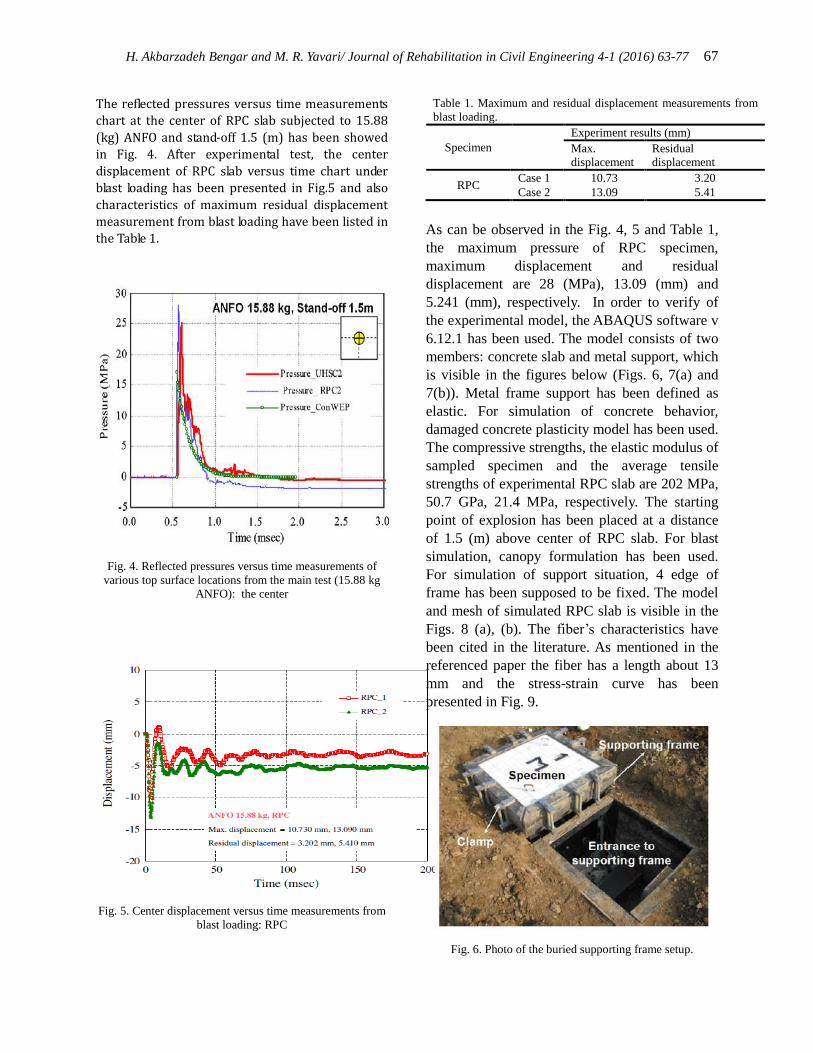
The reflected pressures versus time measurements
chart at the center of RPC slab subjected to 15.88
(kg) ANFO and stand-off 1.5 (m) has been showed
in Fig. 4. After experimental test, the center
displacement of RPC slab versus time chart under
blast loading has been presented in Fig.5 and also
characteristics of maximum residual displacement
measurement from blast loading have been listed in
the Table 1.
Fig. 4. Reflected pressures versus time measurements of
various top surface locations from the main test (15.88 kg
ANFO): the center
Fig. 5. Center displacement versus time measurements from
blast loading: RPC
Table 1. Maximum and residual displacement measurements from
blast loading.
Specimen
Experiment results (mm)
Max.
displacement
Residual
displacement
RPC Case 1 10.73 3.20
Case 2 13.09 5.41
As can be observed in the Fig. 4, 5 and Table 1,
the maximum pressure of RPC specimen,
maximum displacement and residual
displacement are 28 (MPa), 13.09 (mm) and
5.241 (mm), respectively. In order to verify of
the experimental model, the ABAQUS software v
6.12.1 has been used. The model consists of two
members: concrete slab and metal support, which
is visible in the figures below (Figs. 6, 7(a) and
7(b)). Metal frame support has been defined as
elastic. For simulation of concrete behavior,
damaged concrete plasticity model has been used.
The compressive strengths, the elastic modulus of
sampled specimen and the average tensile
strengths of experimental RPC slab are 202 MPa,
50.7 GPa, 21.4 MPa, respectively. The starting
point of explosion has been placed at a distance
of 1.5 (m) above center of RPC slab. For blast
simulation, canopy formulation has been used.
For simulation of support situation, 4 edge of
frame has been supposed to be fixed. The model
and mesh of simulated RPC slab is visible in the
Figs. 8 (a), (b). The fiber’s characteristics have
been cited in the literature. As mentioned in the
referenced paper the fiber has a length about 13
mm and the stress-strain curve has been
presented in Fig. 9.
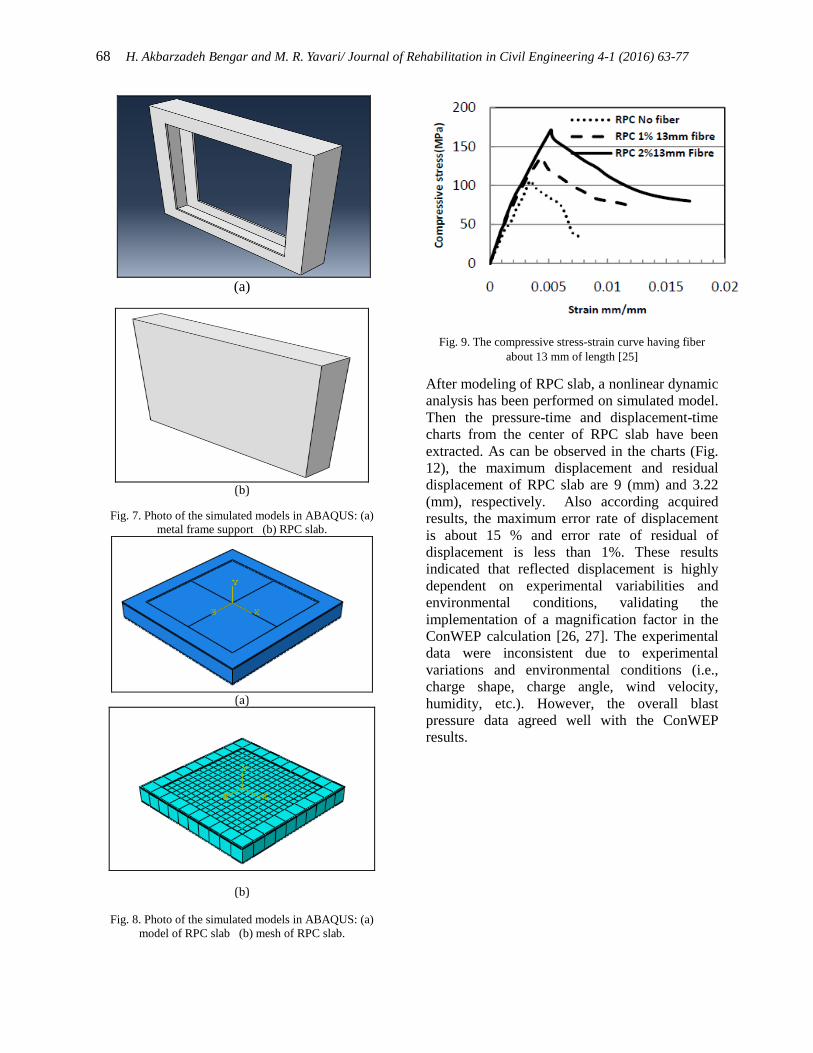
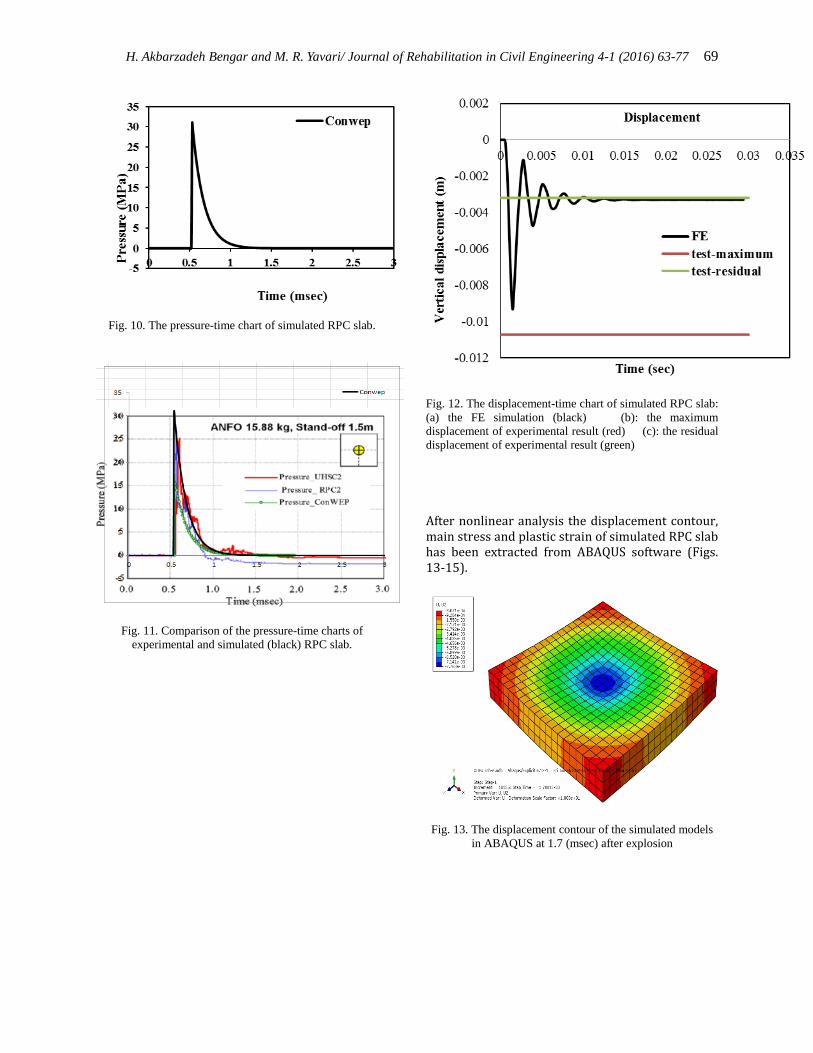
Fig. 6. Photo of the buried supporting frame setup.
68 H. Akbarzadeh Bengar and M. R. Yavari/ Journal of Rehabilitation in Civil Engineering 4-1 (2016) 63-77
(a)
(b)
Fig. 7. Photo of the simulated models in ABAQUS: (a)
metal frame support (b) RPC slab.
(a)
(b)
Fig. 8. Photo of the simulated models in ABAQUS: (a)
model of RPC slab (b) mesh of RPC slab.
Fig. 9. The compressive stress-strain curve having fiber
about 13 mm of length [25]
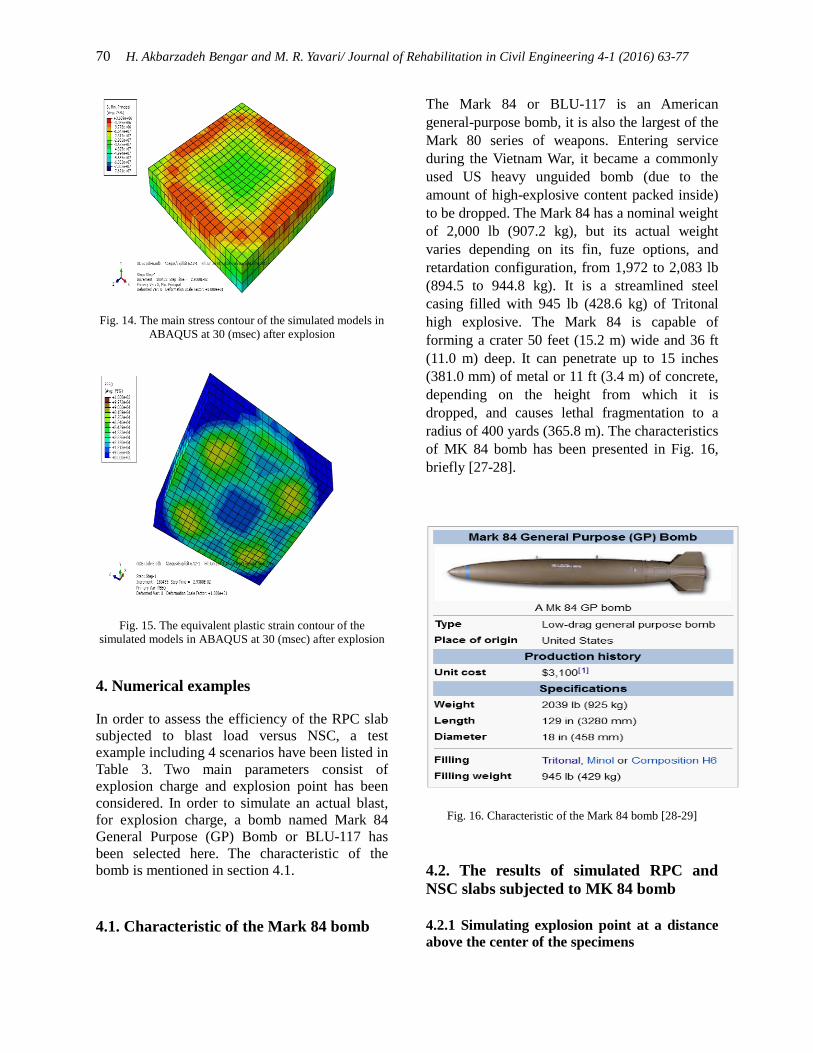
After modeling of RPC slab, a nonlinear dynamic
analysis has been performed on simulated model.
Then the pressure-time and displacement-time
charts from the center of RPC slab have been
extracted. As can be observed in the charts (Fig.
12), the maximum displacement and residual
displacement of RPC slab are 9 (mm) and 3.22
(mm), respectively. Also according acquired
results, the maximum error rate of displacement
is about 15 % and error rate of residual of
displacement is less than 1%. These results
indicated that reflected displacement is highly
dependent on experimental variabilities and
environmental conditions, validating the
implementation of a magnification factor in the
ConWEP calculation [26, 27]. The experimental
data were inconsistent due to experimental
variations and environmental conditions (i.e.,
charge shape, charge angle, wind velocity,
humidity, etc.). However, the overall blast
pressure data agreed well with the ConWEP
results.
H. Akbarzadeh Bengar and M. R. Yavari/ Journal of Rehabilitation in Civil Engineering 4-1 (2016) 63-77 69
Fig. 10. The pressure-time chart of simulated RPC slab.
Fig. 11. Comparison of the pressure-time charts of
experimental and simulated (black) RPC slab.
Fig. 12. The displacement-time chart of simulated RPC slab:
(a) the FE simulation (black) (b): the maximum
displacement of experimental result (red) (c): the residual
displacement of experimental result (green)
After nonlinear analysis the displacement contour, main stress and plastic strain of simulated RPC slab has been extracted from ABAQUS software (Figs. 13-15).
Fig. 13. The displacement contour of the simulated models
in ABAQUS at 1.7 (msec) after explosion
70 H. Akbarzadeh Bengar and M. R. Yavari/ Journal of Rehabilitation in Civil Engineering 4-1 (2016) 63-77
Fig. 14. The main stress contour of the simulated models in
ABAQUS at 30 (msec) after explosion
Fig. 15. The equivalent plastic strain contour of the
simulated models in ABAQUS at 30 (msec) after explosion
4. Numerical examples In order to assess the efficiency of the RPC slab
subjected to blast load versus NSC, a test
example including 4 scenarios have been listed in
Table 3. Two main parameters consist of
explosion charge and explosion point has been
considered. In order to simulate an actual blast,
for explosion charge, a bomb named Mark 84
General Purpose (GP) Bomb or BLU-117 has
been selected here. The characteristic of the
bomb is mentioned in section 4.1.
4.1. Characteristic of the Mark 84 bomb
The Mark 84 or BLU-117 is an American
general-purpose bomb, it is also the largest of the
Mark 80 series of weapons. Entering service
during the Vietnam War, it became a commonly
used US heavy unguided bomb (due to the
amount of high-explosive content packed inside)
to be dropped. The Mark 84 has a nominal weight
of 2,000 lb (907.2 kg), but its actual weight
varies depending on its fin, fuze options, and
retardation configuration, from 1,972 to 2,083 lb
(894.5 to 944.8 kg). It is a streamlined steel
casing filled with 945 lb (428.6 kg) of Tritonal
high explosive. The Mark 84 is capable of
forming a crater 50 feet (15.2 m) wide and 36 ft
(11.0 m) deep. It can penetrate up to 15 inches
(381.0 mm) of metal or 11 ft (3.4 m) of concrete,
depending on the height from which it is
dropped, and causes lethal fragmentation to a
radius of 400 yards (365.8 m). The characteristics
of MK 84 bomb has been presented in Fig. 16,
briefly [27-28].
Fig. 16. Characteristic of the Mark 84 bomb [28-29]
4.2. The results of simulated RPC and
NSC slabs subjected to MK 84 bomb
4.2.1 Simulating explosion point at a distance
above the center of the specimens
H. Akbarzadeh Bengar and M. R. Yavari/ Journal of Rehabilitation in Civil Engineering 4-1 (2016) 63-77 71
A fixed slab with dimensions 1*1*0.15 (m)
shown in Figure 8 is selected as the numerical
example for RPC and NSC specimens. The
characteristics of analytical models for NSC and
RPC specimens have been listed in Table 2. As
shown in Table 3, for assessment of the RPC
Slab, forth different scenarios have been
considered. In these scenarios, the starting point
of explosion has been placed at a distance above
the center of the specimens as Table 3. It’s noted
that the explosion charge has been supposed to be
equal with 925 kg TNT as a nominal weight of
Mark 84 bomb.
Table 2. The characteristics of analytical models(i.e.
compressive strength, ….)
Specimens
Elastic
modulus
(GPa)
Compressive
strength
(MPa)
Tensile
strength
(MPa)
NSC 25.74 30 2.40
RPC 50.70 202 21.40
Table 3. A parametric study based on explosion point under
Mark 84 bomb
Explosion charge
(kg, TNT)
Explosion point (above
the center of the RPC
slab) (m)
925 (Mark 84 bomb)
925 (Mark 84 bomb)
925 (Mark 84 bomb)
925 (Mark 84 bomb)
4
10
20
30
The identification charts of analytical simulations
for scenarios 1-4 have been shown in Figure 17 -
24. The figures consist of pressure-time, vertical
displacement and comparison charts for RPC and
NSC specimens.
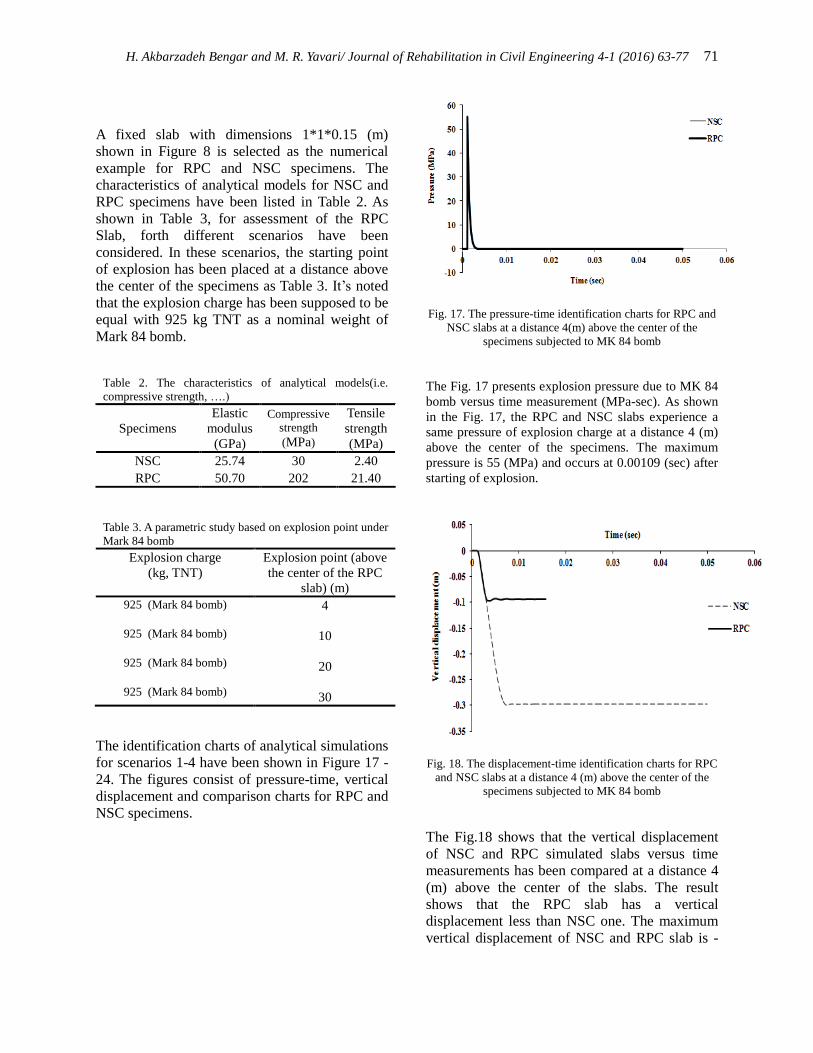
Fig. 17. The pressure-time identification charts for RPC and
NSC slabs at a distance 4(m) above the center of the
specimens subjected to MK 84 bomb
The Fig. 17 presents explosion pressure due to MK 84
bomb versus time measurement (MPa-sec). As shown
in the Fig. 17, the RPC and NSC slabs experience a
same pressure of explosion charge at a distance 4 (m)
above the center of the specimens. The maximum
pressure is 55 (MPa) and occurs at 0.00109 (sec) after
starting of explosion.
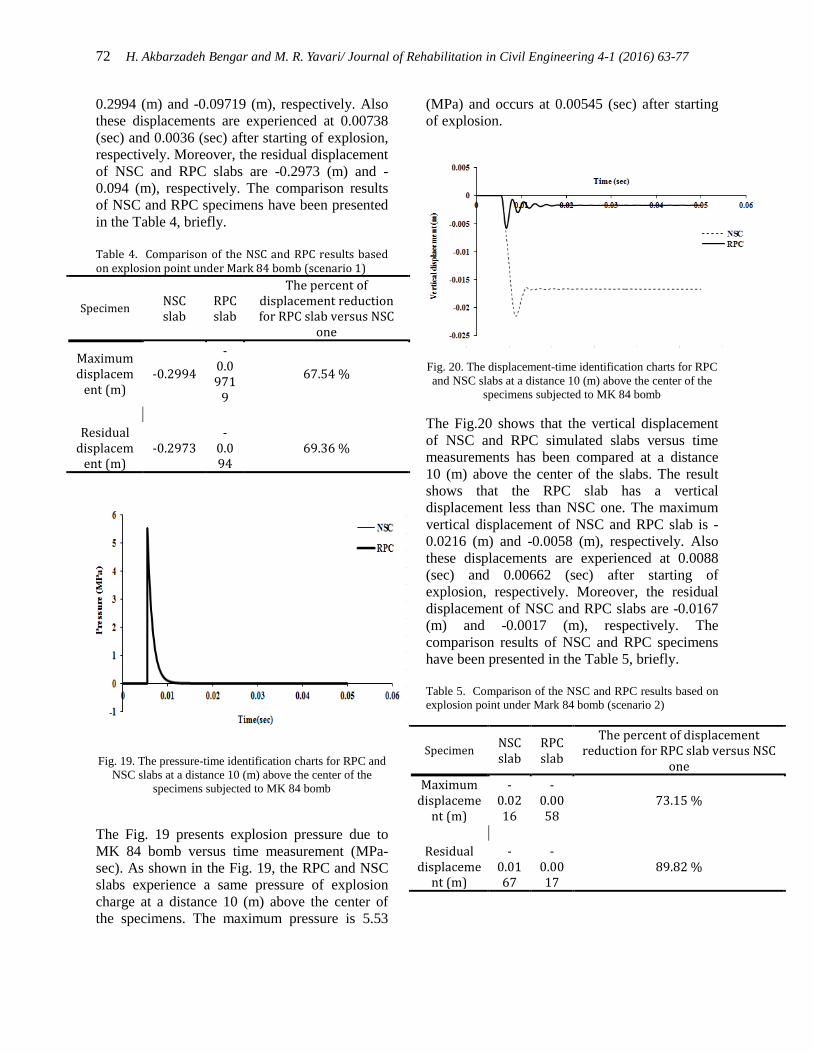
Fig. 18. The displacement-time identification charts for RPC
and NSC slabs at a distance 4 (m) above the center of the
specimens subjected to MK 84 bomb
The Fig.18 shows that the vertical displacement
of NSC and RPC simulated slabs versus time
measurements has been compared at a distance 4
(m) above the center of the slabs. The result
shows that the RPC slab has a vertical
displacement less than NSC one. The maximum
vertical displacement of NSC and RPC slab is -
72 H. Akbarzadeh Bengar and M. R. Yavari/ Journal of Rehabilitation in Civil Engineering 4-1 (2016) 63-77
0.2994 (m) and -0.09719 (m), respectively. Also
these displacements are experienced at 0.00738
(sec) and 0.0036 (sec) after starting of explosion,
respectively. Moreover, the residual displacement
of NSC and RPC slabs are -0.2973 (m) and -
0.094 (m), respectively. The comparison results
of NSC and RPC specimens have been presented
in the Table 4, briefly.
Table 4. Comparison of the NSC and RPC results based on explosion point under Mark 84 bomb (scenario 1)
Specimen NSC slab
RPC slab
The percent of displacement reduction for RPC slab versus NSC
one
Maximum displacem
ent (m) -0.2994
-0.0971
9
67.54 %
Residual displacem
ent (m) -0.2973
-0.094
69.36 %
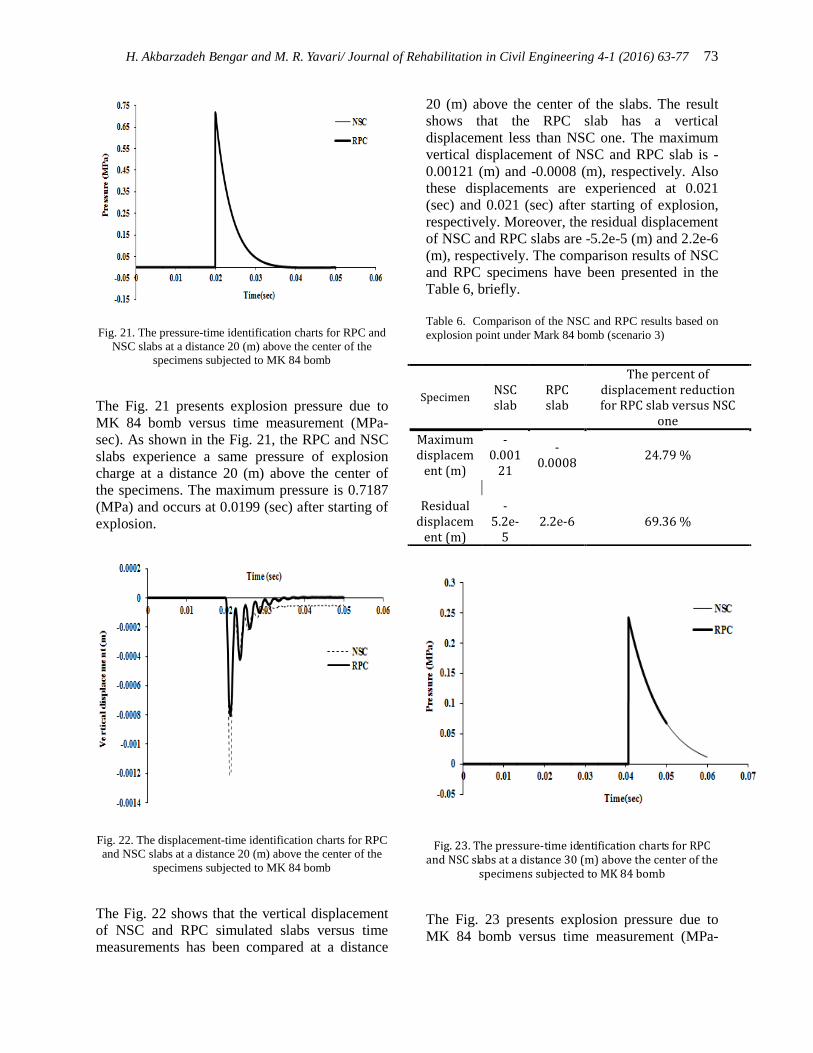
Fig. 19. The pressure-time identification charts for RPC and
NSC slabs at a distance 10 (m) above the center of the
specimens subjected to MK 84 bomb
The Fig. 19 presents explosion pressure due to
MK 84 bomb versus time measurement (MPa-
sec). As shown in the Fig. 19, the RPC and NSC
slabs experience a same pressure of explosion
charge at a distance 10 (m) above the center of
the specimens. The maximum pressure is 5.53
(MPa) and occurs at 0.00545 (sec) after starting
of explosion.
Fig. 20. The displacement-time identification charts for RPC
and NSC slabs at a distance 10 (m) above the center of the
specimens subjected to MK 84 bomb
The Fig.20 shows that the vertical displacement
of NSC and RPC simulated slabs versus time
measurements has been compared at a distance
10 (m) above the center of the slabs. The result
shows that the RPC slab has a vertical
displacement less than NSC one. The maximum
vertical displacement of NSC and RPC slab is -
0.0216 (m) and -0.0058 (m), respectively. Also
these displacements are experienced at 0.0088
(sec) and 0.00662 (sec) after starting of
explosion, respectively. Moreover, the residual
displacement of NSC and RPC slabs are -0.0167
(m) and -0.0017 (m), respectively. The
comparison results of NSC and RPC specimens
have been presented in the Table 5, briefly.
Table 5. Comparison of the NSC and RPC results based on
explosion point under Mark 84 bomb (scenario 2)
Specimen NSC slab
RPC slab
The percent of displacement reduction for RPC slab versus NSC
one
Maximum displaceme
nt (m)
-0.0216
-0.0058
73.15 %
Residual displaceme
nt (m)
-0.0167
-0.0017
89.82 %
H. Akbarzadeh Bengar and M. R. Yavari/ Journal of Rehabilitation in Civil Engineering 4-1 (2016) 63-77 73
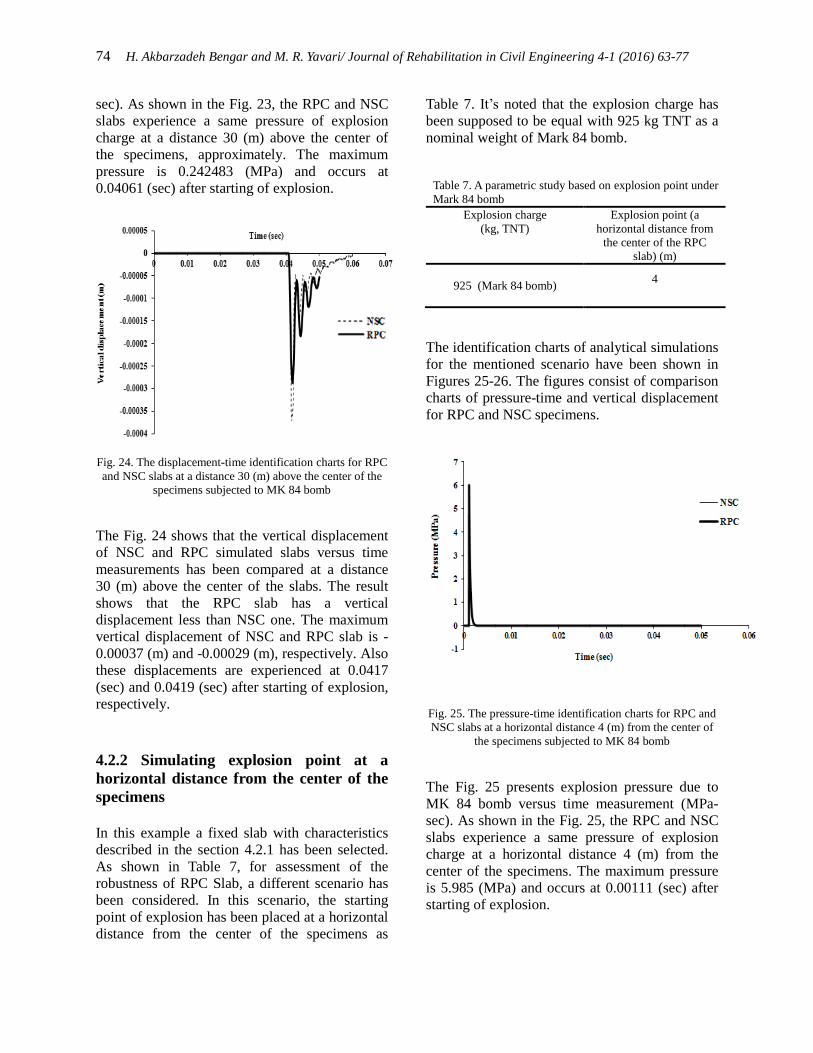
Fig. 21. The pressure-time identification charts for RPC and
NSC slabs at a distance 20 (m) above the center of the
specimens subjected to MK 84 bomb
The Fig. 21 presents explosion pressure due to
MK 84 bomb versus time measurement (MPa-
sec). As shown in the Fig. 21, the RPC and NSC
slabs experience a same pressure of explosion
charge at a distance 20 (m) above the center of
the specimens. The maximum pressure is 0.7187
(MPa) and occurs at 0.0199 (sec) after starting of
explosion.
Fig. 22. The displacement-time identification charts for RPC
and NSC slabs at a distance 20 (m) above the center of the
specimens subjected to MK 84 bomb
The Fig. 22 shows that the vertical displacement
of NSC and RPC simulated slabs versus time
measurements has been compared at a distance
20 (m) above the center of the slabs. The result
shows that the RPC slab has a vertical
displacement less than NSC one. The maximum
vertical displacement of NSC and RPC slab is -
0.00121 (m) and -0.0008 (m), respectively. Also
these displacements are experienced at 0.021
(sec) and 0.021 (sec) after starting of explosion,
respectively. Moreover, the residual displacement
of NSC and RPC slabs are -5.2e-5 (m) and 2.2e-6
(m), respectively. The comparison results of NSC
and RPC specimens have been presented in the
Table 6, briefly.
Table 6. Comparison of the NSC and RPC results based on
explosion point under Mark 84 bomb (scenario 3)
Fig. 23. The pressure-time identification charts for RPC and NSC slabs at a distance 30 (m) above the center of the
specimens subjected to MK 84 bomb
The Fig. 23 presents explosion pressure due to
MK 84 bomb versus time measurement (MPa-
Specimen NSC slab
RPC slab
The percent of displacement reduction for RPC slab versus NSC
one
Maximum displacem
ent (m)
-0.001
21
-0.0008
24.79 %
Residual displacem
ent (m)
-5.2e-
5 2.2e-6 69.36 %
74 H. Akbarzadeh Bengar and M. R. Yavari/ Journal of Rehabilitation in Civil Engineering 4-1 (2016) 63-77
sec). As shown in the Fig. 23, the RPC and NSC
slabs experience a same pressure of explosion
charge at a distance 30 (m) above the center of
the specimens, approximately. The maximum
pressure is 0.242483 (MPa) and occurs at
0.04061 (sec) after starting of explosion.
Fig. 24. The displacement-time identification charts for RPC
and NSC slabs at a distance 30 (m) above the center of the
specimens subjected to MK 84 bomb
The Fig. 24 shows that the vertical displacement
of NSC and RPC simulated slabs versus time
measurements has been compared at a distance
30 (m) above the center of the slabs. The result
shows that the RPC slab has a vertical
displacement less than NSC one. The maximum
vertical displacement of NSC and RPC slab is -
0.00037 (m) and -0.00029 (m), respectively. Also
these displacements are experienced at 0.0417
(sec) and 0.0419 (sec) after starting of explosion,
respectively.
4.2.2 Simulating explosion point at a
horizontal distance from the center of the
specimens
In this example a fixed slab with characteristics
described in the section 4.2.1 has been selected.
As shown in Table 7, for assessment of the
robustness of RPC Slab, a different scenario has
been considered. In this scenario, the starting
point of explosion has been placed at a horizontal
distance from the center of the specimens as
Table 7. It’s noted that the explosion charge has
been supposed to be equal with 925 kg TNT as a
nominal weight of Mark 84 bomb.
Table 7. A parametric study based on explosion point under
Mark 84 bomb
Explosion charge
(kg, TNT)
Explosion point (a
horizontal distance from
the center of the RPC
slab) (m)
925 (Mark 84 bomb)
4
The identification charts of analytical simulations
for the mentioned scenario have been shown in
Figures 25-26. The figures consist of comparison
charts of pressure-time and vertical displacement
for RPC and NSC specimens.
Fig. 25. The pressure-time identification charts for RPC and
NSC slabs at a horizontal distance 4 (m) from the center of
the specimens subjected to MK 84 bomb
The Fig. 25 presents explosion pressure due to
MK 84 bomb versus time measurement (MPa-
sec). As shown in the Fig. 25, the RPC and NSC
slabs experience a same pressure of explosion
charge at a horizontal distance 4 (m) from the
center of the specimens. The maximum pressure
is 5.985 (MPa) and occurs at 0.00111 (sec) after
starting of explosion.
H. Akbarzadeh Bengar and M. R. Yavari/ Journal of Rehabilitation in Civil Engineering 4-1 (2016) 63-77 75
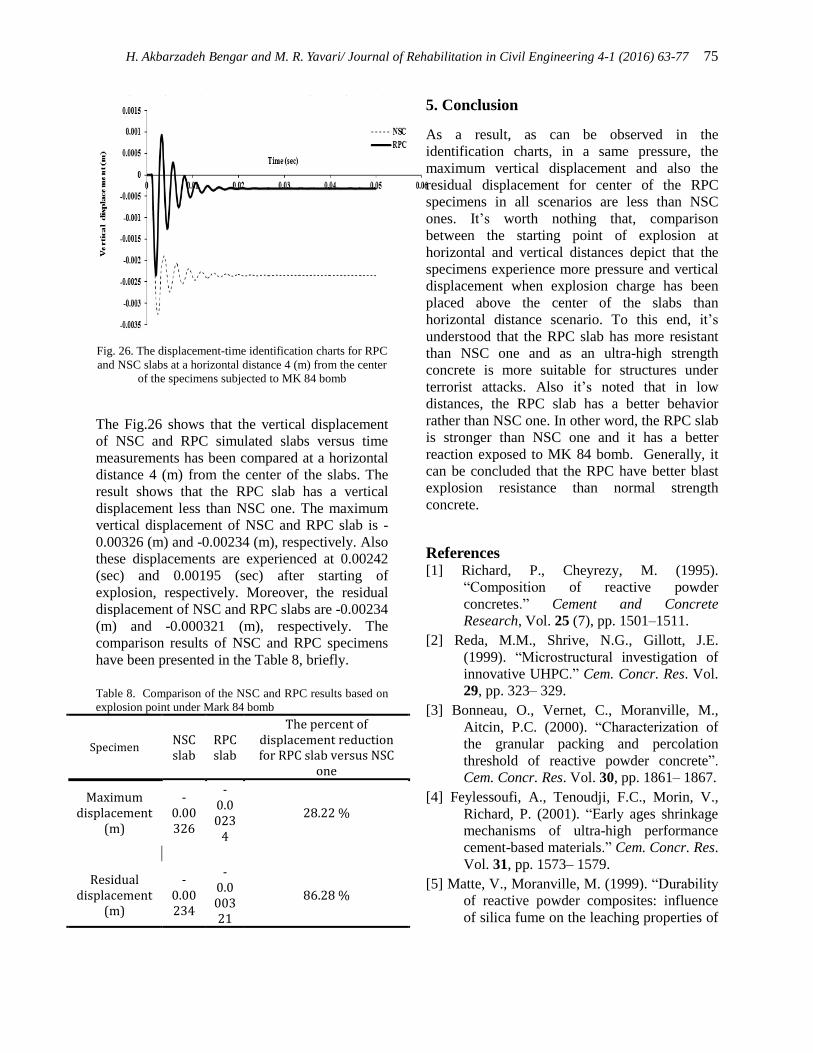
Fig. 26. The displacement-time identification charts for RPC
and NSC slabs at a horizontal distance 4 (m) from the center
of the specimens subjected to MK 84 bomb
The Fig.26 shows that the vertical displacement
of NSC and RPC simulated slabs versus time
measurements has been compared at a horizontal
distance 4 (m) from the center of the slabs. The
result shows that the RPC slab has a vertical
displacement less than NSC one. The maximum
vertical displacement of NSC and RPC slab is -
0.00326 (m) and -0.00234 (m), respectively. Also
these displacements are experienced at 0.00242
(sec) and 0.00195 (sec) after starting of
explosion, respectively. Moreover, the residual
displacement of NSC and RPC slabs are -0.00234
(m) and -0.000321 (m), respectively. The
comparison results of NSC and RPC specimens
have been presented in the Table 8, briefly.
Table 8. Comparison of the NSC and RPC results based on
explosion point under Mark 84 bomb
Specimen NSC slab
RPC slab
The percent of displacement reduction for RPC slab versus NSC
one
Maximum displacement
(m)
-0.00326
-0.0023
4
28.22 %
Residual displacement
(m)
-0.00234
-0.000321
86.28 %
5. Conclusion
As a result, as can be observed in the
identification charts, in a same pressure, the
maximum vertical displacement and also the
residual displacement for center of the RPC
specimens in all scenarios are less than NSC
ones. It’s worth nothing that, comparison
between the starting point of explosion at
horizontal and vertical distances depict that the
specimens experience more pressure and vertical
displacement when explosion charge has been
placed above the center of the slabs than
horizontal distance scenario. To this end, it’s
understood that the RPC slab has more resistant
than NSC one and as an ultra-high strength
concrete is more suitable for structures under
terrorist attacks. Also it’s noted that in low
distances, the RPC slab has a better behavior
rather than NSC one. In other word, the RPC slab
is stronger than NSC one and it has a better
reaction exposed to MK 84 bomb. Generally, it
can be concluded that the RPC have better blast
explosion resistance than normal strength
concrete.
References [1] Richard, P., Cheyrezy, M. (1995).
“Composition of reactive powder
concretes.” Cement and Concrete
Research, Vol. 25 (7), pp. 1501–1511.
[2] Reda, M.M., Shrive, N.G., Gillott, J.E.
(1999). “Microstructural investigation of
innovative UHPC.” Cem. Concr. Res. Vol.
29, pp. 323– 329.
[3] Bonneau, O., Vernet, C., Moranville, M.,
Aitcin, P.C. (2000). “Characterization of
the granular packing and percolation
threshold of reactive powder concrete”.
Cem. Concr. Res. Vol. 30, pp. 1861– 1867.
[4] Feylessoufi, A., Tenoudji, F.C., Morin, V.,
Richard, P. (2001). “Early ages shrinkage
mechanisms of ultra-high performance
cement-based materials.” Cem. Concr. Res.
Vol. 31, pp. 1573– 1579.
[5] Matte, V., Moranville, M. (1999). “Durability
of reactive powder composites: influence
of silica fume on the leaching properties of
76 H. Akbarzadeh Bengar and M. R. Yavari/ Journal of Rehabilitation in Civil Engineering 4-1 (2016) 63-77
very low water/binder pastes.” Cem.
Concr. Compos. Vol. 21, pp.1 –9.
[6] Almansour, H., Lounis, Z. (2010).
“Innovative design approach of precast-
prestressed girder bridges using ultra high
performance concrete.” Can J Civil Eng,
Vol.37(4), pp.511–21.
[7] Na-Hyun, Yi., Jang-Ho, Jay Kim., Tong-
Seok, Han, Yun-Gu, Cho, Jang Hwa, Lee,
Blast-resistant characteristics of ultra-high
strength concrete and reactive powder
concrete (2012). Construction and
Building Materials, Vol. 28, pp.694–707.
[8] Richard, P., Cheyrezy, M. (1994). “Reactive
powder concretes with high ductility and
200–800MPa compressive strength”. In:
Proceedings of V.M. Malhotra Symposium
“Concrete Technology. Past, Present and
Future” ACI SP 144, P.K. Metha, S.
Francisco, pp.507–518.
[9] Bonneau, O., Lachemi, M., Dallaire, E.
(1997). “Mechanical properties and
durability of two industrial reactive
powder concretes.” ACI Mater J, Vol.
94(4), pp.286–90.
[10] Allan, CLW., Paul, AC., Richard, B. (2007).
“Simultaneous measurement of shrinkage
and temperature of reactive powder
concrete at early-age using fiber Bragg
grating sensors.” Cement Concrete Comp,
Vol. 29(60), pp.490–7.
[11] Jungwirth, J. (2002). “Underspanned Bridge
Structures in Reactive Powder Concrete,”
4th International Ph.D. Symposium in
Civil Engineering, Munich, Germany.
[12] Zanni, H., Cheyrezy, M., Maret, V.,
Philippot, S., Nieto, P. (1996).
“Investigation of hydration and pozzolanic
reaction in reactive powder concrete (RPC)
using 29Si NMR”. Cement and Concrete
Research, Vol.26 (1), pp.93–100.
[13] Bayard, O., Plé, O. (2003). “Fracture
mechanics of reactive powder concrete:
material modeling and experimental
investigations.” Engineering Fracture
Mechanics, Vol.70 (7–8), pp.839–851.
[14] Chan, Y.W., Chu, S.H. (2004). “Effect of
silica fume on steel fiber bond
characteristics in reactive powder
concrete.” Cement and Concrete Research,
Vol.34 (7), pp.1167–1172.
[15] Pierre-Claude, A. (2000). “Cements of
yesterday and today: concrete of
tomorrow.” Cement Concrete Res,
Vol.30(9), pp.1349–59.
[16] Cyr, MF., Shah, SP. (2002). “Advances in
concrete technology.” In: Proceedings of
the international conference on advances in
building technology, 4–6 December, Hong
Kong, China, pp.17–27.
[17] Ming, GL., Yung, CW., Chui, TC. (2007).
“A preliminary study of reactive powder
concrete as a new repair material. Constr
Build Mater, Vol.21(1), pp.182–9.
[18] Bonneau O., Poulin, C., Dugat, J. (1996).
“Reactive powder concretes: from theory
to practice.” Concrete Int, Vol. 18(4), pp.
47–9.
[19] Cheyrezy M. (1999). “Structural
applications of RPC.” Concrete, Vol.
33(1), pp.20–3.
[20] Kim, H.J., Nam, J.W., Kim, S.B., Kim, J.H.J
and Byun, K.J. (2007). “Analytical
Evaluations of the Retrofit Performances
of concrete Wall Structures Subjected to
Blast Load.” Journal of the Korea
Concrete Institute, Vol.19(2), pp.241-250.
[21] TM5-1300/AFR 88-2/NAVFAC P-39.
(1990). “Structures to Resist the Effects of
Accidental Explosions.” Joint Department
of the Army, Air Force and Navy
Washington, DC.
[22] Baker, W.E. (1973). “Explosion in Air.
Wilfred Bker Engineering, San Antonio”.
[23] Mays, G.C., and Smith, P.D. (1995). “Blast
effect on Buildings: Design of Buildings to
Optimize Resistance to Blast Load-ing.”
[24] ASCE. (1999). “Structural Design for
Physical Security: State of the Practice
Report. Task Committee on Physical
Security”. American Society of Civil
Engineers, New York.
[25] Lavanya Prabha, S., Dattatreya, J.K.,
Neelamegam, M. and Seshagiri, RAO
M.V. (2010). “Properties of reactive
powder concrete under uniaxial
compression.” Int J Eng Sci Technol, Vol.
2(11), pp.6408-6416.
H. Akbarzadeh Bengar and M. R. Yavari/ Journal of Rehabilitation in Civil Engineering 4-1 (2016) 63-77 77
[26] Yi, N.H., Kim, S.B., Kim, J.H.J., Cho, Y.G.
(2009). “Behavior analysis of concrete
structure under blast loading: (II) blast
loading response of ultra- high strength
concrete and reactive powder concrete
slabs (Korean).” J Korean Soc Civil Eng,
Vol. 29(5A), pp.565–75.
[27] Nam, JW., Kim, HJ., Kim, SB., Yi, NH.,
Kim, JHJ. (2010). “Numerical evaluation
of the retrofit effectiveness for GFRP
retrofitted concrete slab subjected to blast
pressure.” Compos Struct, Vol. 92(5),
pp.1212–22.
[28]
https://en.wikipedia.org/wiki/Mark_84_bo
mb
[29] Don, Holloway. (1996). “STEALTH
SECRETS OF THE F-117 NIGHTHAWK:
Its development was kept under wraps for
14 years, but by 1991, the F-117
Nighthawk had become a household word.
Aviation History (Harrisburg,
Pennsylvania: Cowles Magazines)”. ISSN
1076-8858.