simulink® model of single co2 sensor location impact on ...®_model_of_single_co2... · simulink,...
TRANSCRIPT
Simulink® Model of Single CO2 Sensor Location Impact on CO2 Levels in Recirculating Multiple-Zone Systems
Annie-Claude Lachapelle1 and James A. Love1 1Faculty of Environmental Design, University of Calgary, Alberta, Canada
Abstract Building ventilation can be modulated based on occupant require-ments determined by monitoring CO2 concentrations. These CO2 con-centrations are sometimes monitored in a common air duct to reduce costs. Warden (2004) suggested that a single CO2 sensor located in the supply air duct (SACO2-DCV) may provide better control of CO2 in rooms with higher occupancy density than return air duct (RACO2-DCV) placement systems serving multiple zones. Stanke (2010) pointed out that Warden failed to account for varying space population and airflow requirements. This research evaluated Stanke’s observa-tions using a hypothetical four-room-school model built with Math-Works®’ Simulink®. The results showed that Warden’s claim was valid for a dynamic environment but that SACO2-DCV may over-ventilate spaces when occupancy varies. The simulation provided a graphical representation of the impact of CO2 sensor location on room CO2 levels when implementing CO2-DCV in recirculating multiple-zone systems.
1 Introduction Building designers strive to minimize energy use while meeting comfort and ventilation re-quirements. Modeling software can help by assessing whole building energy performance. Some issues must be analyzed beyond the limitations of whole building simulation programs to achieve more reliable results (e.g., thermal bridging in building envelopes). This paper ad-dresses such an issue: the impact on zone CO2 levels of placing a single CO2 sensor in either the return or supply duct to control ventilation in a recirculating multiple-zone system (MZS).
DCV based on CO2 monitoring has been recognized as an effective way of reducing energy use while maintaining acceptable indoor air quality (IAQ) where people are the main source of pollutants (Haghighat and Donnini 1992). CO2-DCV can not ensure IAQ when other significant sources of pollutants are present. It is unclear whether a single duct-mounted CO2 sensor averaging air from multiple spaces provides adequate ventilation (Murphy and Bradley 2008). At the time of writing, a research project funded by ASHRAE (RP-1547, “CO2-Based Demand Controlled Ventilation For Multiple Zone HVAC Systems”) is under-way to verify whether CO2-DCV for MZS avoids excessive CO2 levels when used as an en-ergy efficiency measure (ASHRAE 2011). Despite concerns regarding the CO2 control effec-tiveness, this single sensor approach is commonly used in MZS to reduce costs as CO2 sen-sors are expensive and require maintenance (Warden 2004).
When using a single CO2 sensor in a recirculating MZS, Warden (2004) presented practical reasons why better CO2 levels in the least occupied spaces would be achieved by monitoring CO2 levels in the supply air duct (SACO2-DCV) rather than in the return air duct (RACO2-DCV). His analysis was based on an open-loop control. Warden, however, recog-nized his calculations, which were based on Standard 62-2001 (ASHRAE 2001), lacked valid-ity for standards that have an area-based requirement for outdoor air (OA) such as Standard
http://esim.ca Page 189 of 614 May 1-4, Halifax Nova Scotia
Proceedings of eSim 2012: The Canadian Conference on Building Simulation
62.1-2010 (ASHRAE 2010). As Stanke (2010) later pointed out, Warden’s analysis also ne-glected the system response as population varies. Nassif et al. (2005), also researched the per-formance of SACO2-DCV, focussing on fan energy use based on multiple space Equation 6-1 (ASHRAE 2001). The analysis used various analytical approaches including simulation work and on-site measurements. The authors concluded that SACO2-DCV provided better CO2-control than RACO2-DCV.
To complement Warden and Stanke’s work, this paper reports the results of a custom-ized dynamic model to determine which of SACO2-DCV or RACO2-DCV provides better CO2 levels across a multi-space environment when occupancy varies greatly. Unlike previous studies the area-based OA requirement was included in the model.
2 Methods A model of an air handling unit (AHU) serving four classrooms was built to compare the im-pact of the CO2-DCV control loop. Assumptions were made to limit the number of parameters involved to those necessary for a comparative assessment of the control system. The parame-ters necessary to create the initial RACO2-DCV model were established based on a fictitious building. The SACO2-DCV model was built modifying only the feedback loop and the con-troller gain of the RACO2-DCV model. Simulations using both models were run to compare the variation of CO2 levels in each room. Since this study focussed on the control system, keeping all elements of the building constant, Simulink® appeared to be the most appropriate tool. Simulink, is a graphical environment built on the well-known MATLAB®, which has been used for more than 15 years for various aspects of building and mechanical system simu-lation (Riederer 2005).
2.1 Assumptions For the purpose of this research, the airflows to each zone, typically controlled by the zone thermal loads, were assumed to be constant, uniform and identical for all rooms. Using con-stant airflows significantly simplified the model to focus on the control of OA based on CO2 levels.
The following is a list of additional assumptions made for simplicity sake: • There were no external disturbances to the system. • The air was well-mixed within each room. • There was no stratification in the ducts. • There were no short-cut between the supply and return air grills. • There was no infiltration or ex-filtration in the rooms or ducts. • The sensors were highly accurate and did not drift over time. • The system had a zone ventilation efficiency of 1 (perfect mixing). • Cool air was distributed trough ceiling diffusers (zone air distribution effec-
tiveness of 1.0, according to Table 6-2 of Standard 62.1-2010 (ASHRAE 2010).
• The dampers worked perfectly and linearly in adjusting OA fraction. • Occupants were the main source of pollutant.
2.2 Parameter Description Parameters were selected to create a model based on proven equations to generate realistic results.
http://esim.ca Page 190 of 614 May 1-4, Halifax Nova Scotia
Proceedings of eSim 2012: The Canadian Conference on Building Simulation
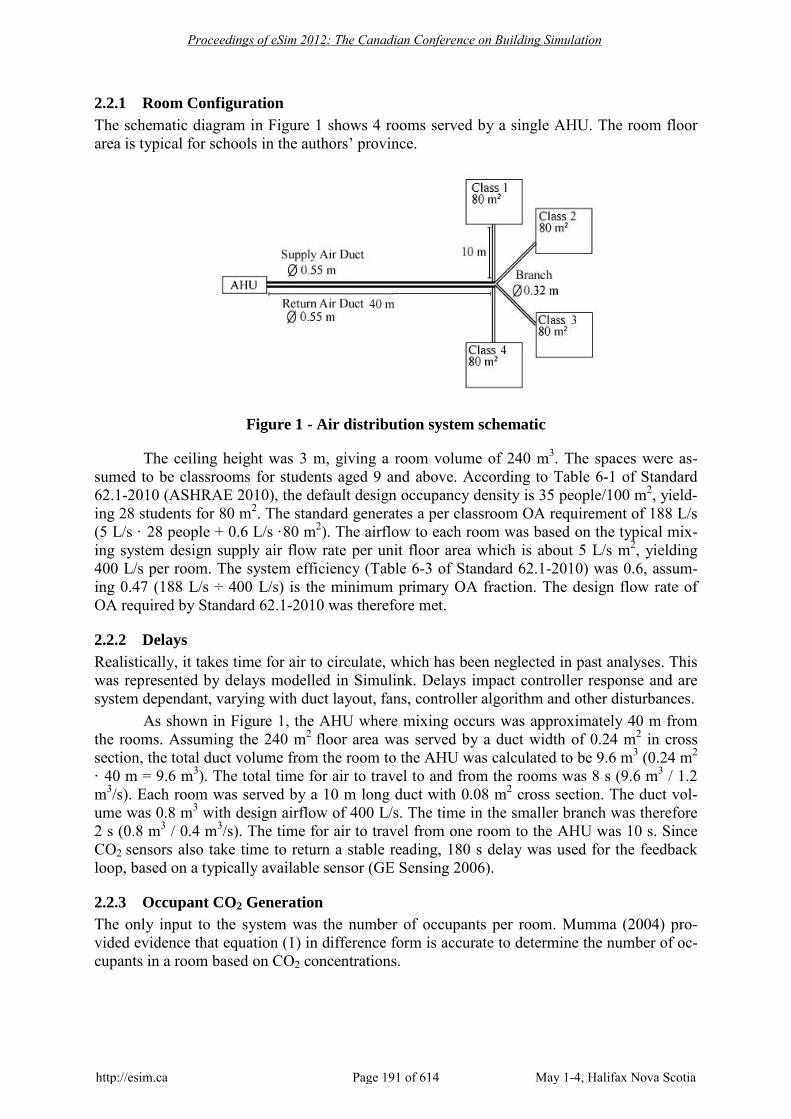
2.2.1 Room Configuration The schematic diagram in Figure 1 shows 4 rooms served by a single AHU. The room floor area is typical for schools in the authors’ province.
Figure 1 - Air distribution system schematic
The ceiling height was 3 m, giving a room volume of 240 m3. The spaces were as-sumed to be classrooms for students aged 9 and above. According to Table 6-1 of Standard 62.1-2010 (ASHRAE 2010), the default design occupancy density is 35 people/100 m2, yield-ing 28 students for 80 m2. The standard generates a per classroom OA requirement of 188 L/s (5 L/s · 28 people + 0.6 L/s ·80 m2). The airflow to each room was based on the typical mix-ing system design supply air flow rate per unit floor area which is about 5 L/s m2, yielding 400 L/s per room. The system efficiency (Table 6-3 of Standard 62.1-2010) was 0.6, assum-ing 0.47 (188 L/s ÷ 400 L/s) is the minimum primary OA fraction. The design flow rate of OA required by Standard 62.1-2010 was therefore met.
2.2.2 Delays Realistically, it takes time for air to circulate, which has been neglected in past analyses. This was represented by delays modelled in Simulink. Delays impact controller response and are system dependant, varying with duct layout, fans, controller algorithm and other disturbances.
As shown in Figure 1, the AHU where mixing occurs was approximately 40 m from the rooms. Assuming the 240 m2 floor area was served by a duct width of 0.24 m2 in cross section, the total duct volume from the room to the AHU was calculated to be 9.6 m3 (0.24 m2 · 40 m = 9.6 m3). The total time for air to travel to and from the rooms was 8 s (9.6 m3 / 1.2 m3/s). Each room was served by a 10 m long duct with 0.08 m2 cross section. The duct vol-ume was 0.8 m3 with design airflow of 400 L/s. The time in the smaller branch was therefore 2 s (0.8 m3 / 0.4 m3/s). The time for air to travel from one room to the AHU was 10 s. Since CO2 sensors also take time to return a stable reading, 180 s delay was used for the feedback loop, based on a typically available sensor (GE Sensing 2006).
2.2.3 Occupant CO2 Generation The only input to the system was the number of occupants per room. Mumma (2004) pro-vided evidence that equation (1) in difference form is accurate to determine the number of oc-cupants in a room based on CO2 concentrations.
http://esim.ca Page 191 of 614 May 1-4, Halifax Nova Scotia
Proceedings of eSim 2012: The Canadian Conference on Building Simulation
𝑃𝑧 = 𝑉 ∙ (𝐶𝑟 – 𝐶𝑟−1)
∆𝑇 + 𝑉𝑠𝑎 ∙ (𝐶𝑟 − 𝐶𝑠𝑎)𝐺 ∙ 106
(1)
Where: G = CO2 generation rate per person (L/s) Pz = Number of occupants V = Volume of the room (L) ∆T = Time step (s) Vsa = Supply air flow rate (L/s) Cr = CO2 level, current sampling time (parts per million (ppm)) Cr-1 = CO2 level, previous sampling time (ppm) Csa = CO2 level, supply air duct (ppm) In equation (1), the first term (V·(Cr – Cr-1)) / ∆T, represents the transient state of the
system, hence the time the system takes to reach its steady-state. The time step (∆T) was cho-sen to 20 s.
Based on Lawrence (2008), the OA CO2 concentration was constant at 400 ppm for all simulations. Therefore, initially, the rooms were assumed empty at 400 ppm. As time pro-gressed CO2 levels were calculated by rearranging the terms of equation (1) to form equation (2).
𝐶𝑟 =𝐺 ∙ 106 ∙ 𝑃𝑧 + 𝑉∆𝑇 ∙ 𝐶𝑟−1 + 𝑉𝑠𝑎 ∙ 𝐶𝑠𝑎
𝑉∆𝑇 + 𝑉𝑠𝑎
(2)
Students in the classrooms were assumed sedentary (met = 1.0). The per person CO2 generation rate was 0.0043 L/s as used by Warden (2004). This rate is also in accordance with Standard 62.1-2010 (ASHRAE 2010).
2.2.4 Controller The same controller type (proportional) was used throughout the study in order to emulate the impact of positioning a given controller either in the supply or return air duct. As pointed out by Underwood (1999), this system was studied for a limited range of operating conditions for which the use of a constant gain controller was acceptable. The controller gain was tuned to achieve stability for both models and obtain the same steady state concentration as calculated with the concentration equation (Awbi 2003) shown in (3).
𝐶∞ =𝒱 ∗ 𝐶𝑒 + 𝐺𝒱 + 𝐺
(3)
Where: C∞ = Steady state concentration 𝒱 = OA supply rate (L/s) Ce = External concentration of pollutant G = Volume of pollutant generated (L/s)
http://esim.ca Page 192 of 614 May 1-4, Halifax Nova Scotia
Proceedings of eSim 2012: The Canadian Conference on Building Simulation
Using equation (3), given a CO2 generation rate of 0.1204 L/s (0.0043 L/s · 28 occu-pants), an OA concentration of 400 ppm and an OA supply rate of 188 L/s, to meet the mini-mum ventilation requirements, resulted in a steady state concentration of 1039 ppm. This level is deemed acceptable according to Standard 62.1-2010 (ASHRAE 2010) which states “maintaining a steady-state CO2 concentration in a space no greater than 700 ppm above OA levels will indicate that a substantial majority of visitors entering a space will be satisfied with respect to bioeffluents (body odor)”.
The controller sampling rate was set to 11 s for both controllers. The proportional band of the controller was set so the OA dampers start opening as the duct CO2 levels are sensed above 400 ppm. The controller gains were adjusted so all rooms reached 1039 ppm at design occupancy to ensure adequate ventilation. The controller gains were 1/719 for SACO2-DCV and 1/1357 for RACO2-DCV.
2.2.5 Building Component According to Standard 62.1 (ASHRAE 2010), a minimum ventilation rate per floor area is required and the outdoor airflow should be no less than this building component. CO2-DCV does not measure airflow directly, which makes it difficult to establish whether the technique complies with ventilation standards (Stanke 2010). When the rooms were uniformly occupied, the model showed the building component was met. The building component in the current study was established as 0.6 L/s·m2 · 80 m2 = 48 L/s per classroom. 48L/s is 12% of the pri-mary airflow (400 L/s) hence a 12% opening of the OA damper.
2.2.6 Parameter Summary The model parameters are summarized in Table 1.
http://esim.ca Page 193 of 614 May 1-4, Halifax Nova Scotia
Proceedings of eSim 2012: The Canadian Conference on Building Simulation
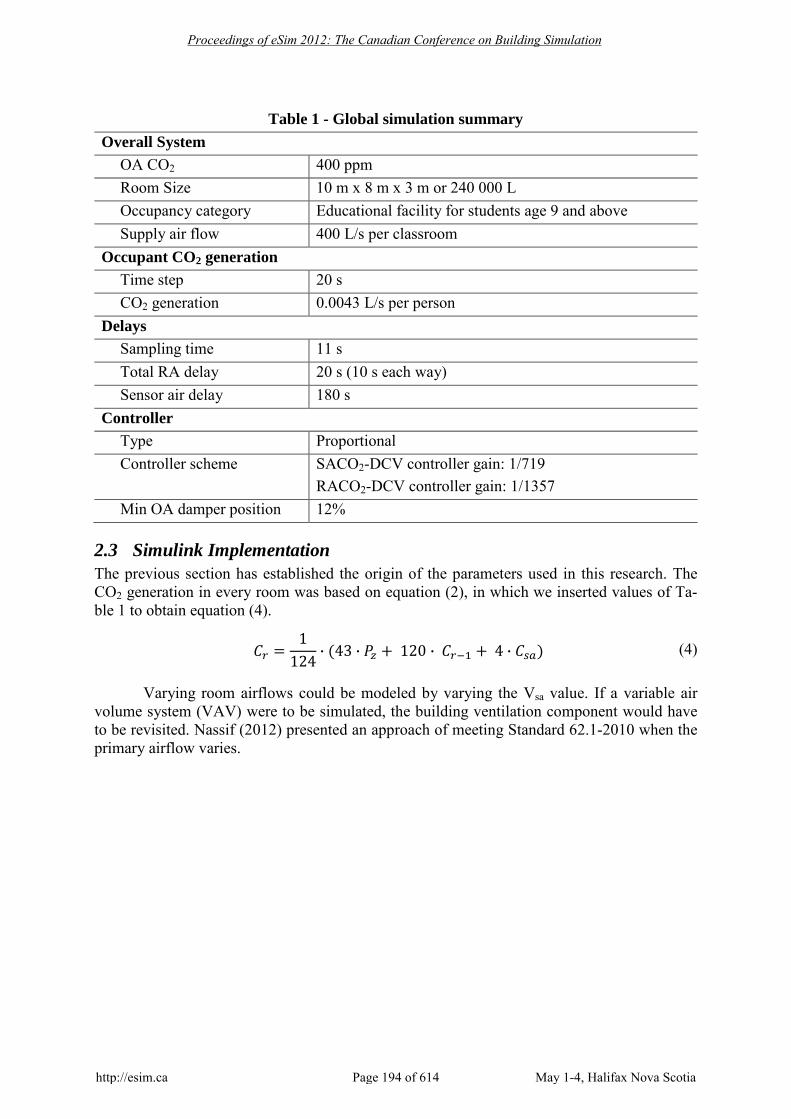
Table 1 - Global simulation summary Overall System
OA CO2 400 ppm Room Size 10 m x 8 m x 3 m or 240 000 L Occupancy category Educational facility for students age 9 and above Supply air flow 400 L/s per classroom
Occupant CO2 generation Time step 20 s CO2 generation 0.0043 L/s per person
Delays Sampling time 11 s Total RA delay 20 s (10 s each way) Sensor air delay 180 s
Controller Type Proportional Controller scheme SACO2-DCV controller gain: 1/719
RACO2-DCV controller gain: 1/1357 Min OA damper position 12%
2.3 Simulink Implementation The previous section has established the origin of the parameters used in this research. The CO2 generation in every room was based on equation (2), in which we inserted values of Ta-ble 1 to obtain equation (4).
𝐶𝑟 =1
124∙ (43 ∙ 𝑃𝑧 + 120 ∙ 𝐶𝑟−1 + 4 ∙ 𝐶𝑠𝑎) (4)
Varying room airflows could be modeled by varying the Vsa value. If a variable air volume system (VAV) were to be simulated, the building ventilation component would have to be revisited. Nassif (2012) presented an approach of meeting Standard 62.1-2010 when the primary airflow varies.
http://esim.ca Page 194 of 614 May 1-4, Halifax Nova Scotia
Proceedings of eSim 2012: The Canadian Conference on Building Simulation

Figure 2 – Schematic of RACO2-DCV Simulink model where C is the CO2 concentration and Zs is the opening ratio of the OA damper. Scope icons indicate virtual probe loca-
tions.
Figure 3 - Schematic of SACO2-DCV Simulink model
The controlled variable in this project was the CO2 concentration. The critical differ-ence between these models was the sensor location, symbolized by the starting point of the feedback loop to the controller. Unlike the RACO2-DCV strategy, the SACO2-DCV feedback
http://esim.ca Page 195 of 614 May 1-4, Halifax Nova Scotia
Proceedings of eSim 2012: The Canadian Conference on Building Simulation

loop returned the sensed CO2 concentration from the supply air duct rather than from the re-turn air duct. The total time for the air to recirculate to the room was the same in both cases. The delays were positioned to reflect sensors located near the AHU.
2.4 Simulation work The models were validated to ensure Standard 62.1-2010 (ASHRAE 2010) minimum OA re-quirements were met when occupancy was uniform between the rooms. To do so, the OA damper opening (Zs) was recorded at different occupancies. Zs was multiplied by the air flow to each room (400 L/s) to determine the amount of OA supplied to each zone. The concentra-tion equation (Awbi 2003) was rearranged to obtain equation (5) and validate the OA flow to each room.
𝒱 =𝐺 ∗ (1 − 𝐶∞)𝐶∞ − 𝐶𝑒
(5)
The process was repeated for both models and compared to Standard 62.1-2010 (ASHRAE 2010) requirements.
The steady state room level CO2 concentrations as population varied between the rooms were then assessed for both models. The goal was to test Warden’s claim that SACO2-DCV provides better CO2 control in rooms with higher occupancy density than RACO2-DCV (Warden 2004). Equation (5) was used to assess if sufficient OA was delivered to each room based on the number of occupants.
Lastly, population was kept at design occupancy to observe the transient response of the room CO2 levels. The goal was to determine if either system offered an advantage in the time taken to reach steady state.
3 Results
3.1 Uniform Occupancy Room populations were kept uniform. The OA flow rates at different occupancies for the two Simulink models were compared to those based on Standard 62.1 (ASHRAE 2010) as shown in Figure 4.
Figure 4 – System outdoor airflow versus occupancy for both models compared to Stan-
dard 62.1-2010 minimum requirements
0 20 40 60 80
100 120 140 160 180 200
0 4 8 12 16 20 24 28
Out
door
Air
flow
(L/s
)
Number of Occupants
Standard 62.1-2010 SACO2-DCV RACO2-DCV
http://esim.ca Page 196 of 614 May 1-4, Halifax Nova Scotia
Proceedings of eSim 2012: The Canadian Conference on Building Simulation
The results in Figure 4 were obtained by reading the resulting Zs value from each simulation and multiplying it by the airflow (400 L/s). Since the population was equally dis-tributed among the rooms, the exact same airflows were found by inserting the simulation CO2 concentration in equation (5).
Figure 4 shows both systems meet exactly the minimum required airflows when rooms are at design capacity or empty. Although both systems remain above the minimum requirements at intermediate capacities, RACO2-DCV remained closer to Standard 62.1-2010 (ASHRAE 2010) requirements. When occupants are evenly distributed between zones RACO2-DCV would therefore better meet Standard 62.1-2010 (ASHRAE 2010) ventilation requirements while reducing energy use. This is assuming the lower energy option is the one requiring less OA, as shown by Persily et al. (2003). SACO2-DCV would maintain lower CO2 concentrations by over-ventilating the spaces.
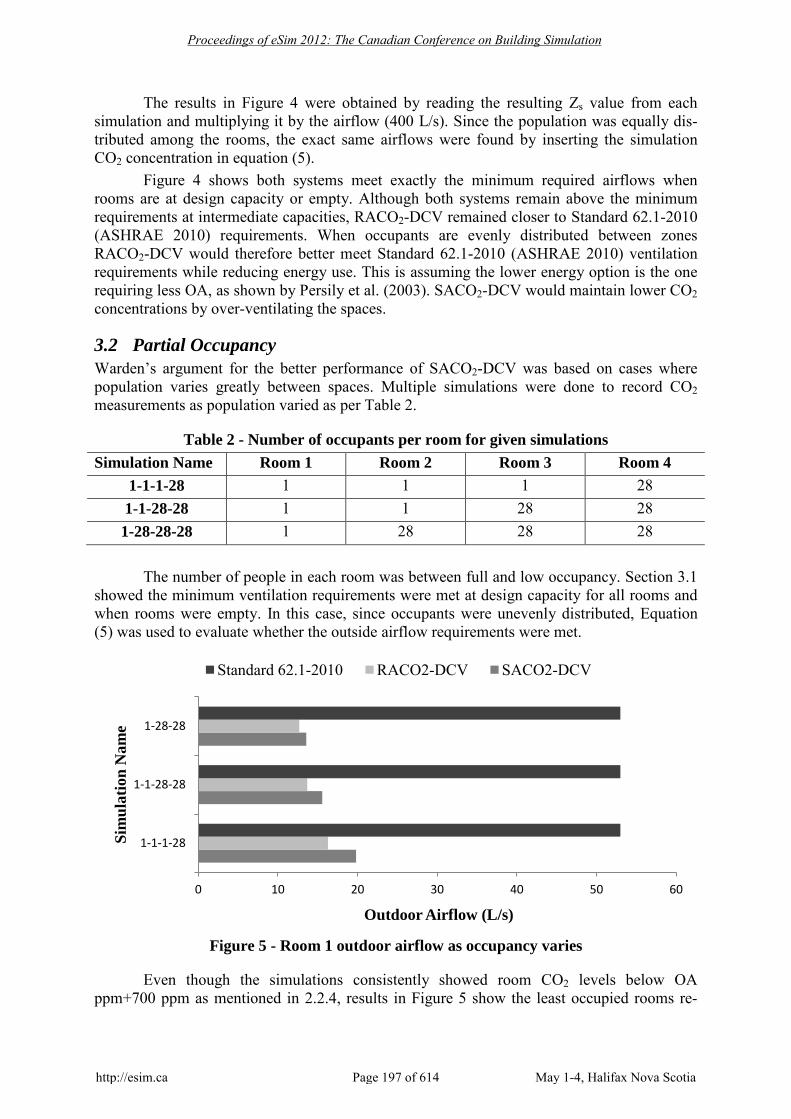
3.2 Partial Occupancy Warden’s argument for the better performance of SACO2-DCV was based on cases where population varies greatly between spaces. Multiple simulations were done to record CO2 measurements as population varied as per Table 2.
Table 2 - Number of occupants per room for given simulations Simulation Name Room 1 Room 2 Room 3 Room 4
1-1-1-28 1 1 1 28 1-1-28-28 1 1 28 28 1-28-28-28 1 28 28 28
The number of people in each room was between full and low occupancy. Section 3.1
showed the minimum ventilation requirements were met at design capacity for all rooms and when rooms were empty. In this case, since occupants were unevenly distributed, Equation (5) was used to evaluate whether the outside airflow requirements were met.
Figure 5 - Room 1 outdoor airflow as occupancy varies
Even though the simulations consistently showed room CO2 levels below OA ppm+700 ppm as mentioned in 2.2.4, results in Figure 5 show the least occupied rooms re-
0 10 20 30 40 50 60
1-1-1-28
1-1-28-28
1-28-28
Outdoor Airflow (L/s)
Sim
ulat
ion
Nam
e
Standard 62.1-2010 RACO2-DCV SACO2-DCV
http://esim.ca Page 197 of 614 May 1-4, Halifax Nova Scotia
Proceedings of eSim 2012: The Canadian Conference on Building Simulation
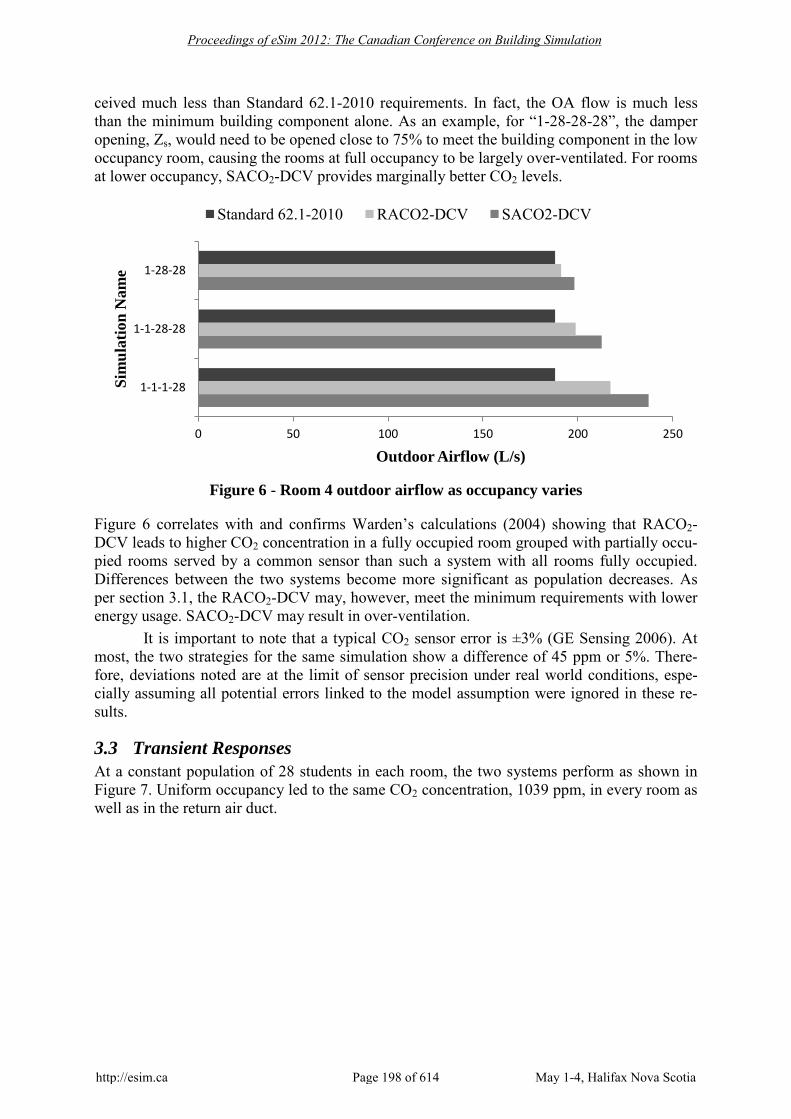
ceived much less than Standard 62.1-2010 requirements. In fact, the OA flow is much less than the minimum building component alone. As an example, for “1-28-28-28”, the damper opening, Zs, would need to be opened close to 75% to meet the building component in the low occupancy room, causing the rooms at full occupancy to be largely over-ventilated. For rooms at lower occupancy, SACO2-DCV provides marginally better CO2 levels.
Figure 6 - Room 4 outdoor airflow as occupancy varies
Figure 6 correlates with and confirms Warden’s calculations (2004) showing that RACO2-DCV leads to higher CO2 concentration in a fully occupied room grouped with partially occu-pied rooms served by a common sensor than such a system with all rooms fully occupied. Differences between the two systems become more significant as population decreases. As per section 3.1, the RACO2-DCV may, however, meet the minimum requirements with lower energy usage. SACO2-DCV may result in over-ventilation.
It is important to note that a typical CO2 sensor error is ±3% (GE Sensing 2006). At most, the two strategies for the same simulation show a difference of 45 ppm or 5%. There-fore, deviations noted are at the limit of sensor precision under real world conditions, espe-cially assuming all potential errors linked to the model assumption were ignored in these re-sults.
3.3 Transient Responses At a constant population of 28 students in each room, the two systems perform as shown in Figure 7. Uniform occupancy led to the same CO2 concentration, 1039 ppm, in every room as well as in the return air duct.
0 50 100 150 200 250
1-1-1-28
1-1-28-28
1-28-28
Outdoor Airflow (L/s)
Sim
ulat
ion
Nam
e
Standard 62.1-2010 RACO2-DCV SACO2-DCV
http://esim.ca Page 198 of 614 May 1-4, Halifax Nova Scotia
Proceedings of eSim 2012: The Canadian Conference on Building Simulation

Figure 7 – Return air duct CO2 concentration at design occupancy (28 students)
Figure 7 shows the transient state of both systems, a capability Warden’s (Warden 2004) static model lacked, as noted by Stanke (Stanke 2010). The figure shows both systems reached a steady state of 1039 ppm at design occupancy as per their controller setting. RACO2-DCV however reached 90% of this value (935 ppm) in around 39 minutes while it took close to 44 minutes for SACO2-DCV to reach the same value.
3.4 Discussion The model was built to compare two design options independently of the building characteris-tics, since the building is assumed to be the same. Unlike other available tools such as CONTAMW used by Persily et al. (2003), Simulink offered the ability to create a customized model, tailored to the level of complexity required for the task. As an example, in the present case, the same theoretical CO2 generation rate was used in both models. This rate did not ac-count for the impact of airflow and heat transfer between zones or uneven contaminant mix-ing within a zone or duct. More advanced building simulation programs can consider these factors and are capable of creating much more comprehensive CO2 generation rate algorithms. However, since both models use the same CO2 generation rate algorithm, using the simpler algorithm would not alter the results of this comparative assessment.
The absolute numbers obtained through this study only approximated field conditions because of the assumptions mentioned above. Yet, the models can be used for comparison purposes, knowing the above assumptions would have the same impact on both models, apart from random disturbances.
4 Conclusion This paper presented a Simulink model comparing the performance of SACO2-DCV with that of RACO2-DCV in recirculating multiple zone systems. Warden (2004), through a theoretical analysis, and Nassif (2005), through site measurements, both determined that SACO2-DCV provides better CO2 control than RACO2-DCV when used in recirculating multiple zone sys-tems. The Simulink model was used to verify this claim.
Unlike previous research, the dynamic model included a building component. This building component was set at design occupancy which revealed not to be sufficient when population varied. This study also showed that SACO2-DCV may result in higher over-
0
200
400
600
800
1000
1200
0 627 1287 1947 2607 3267 3927 4587 5247 5907 6567 7227
CO
2 Con
cent
ratio
n (p
pm)
Time (seconds)
SACO2-DCV RACO2-DCV
http://esim.ca Page 199 of 614 May 1-4, Halifax Nova Scotia
Proceedings of eSim 2012: The Canadian Conference on Building Simulation

ventilation of spaces than RACO2-DCV in fully occupied rooms when the total population was below design occupancy.
Overall, the two systems were shown to have comparable performance given potential instrumentation error. Other factors such as cost and ease of access for installation and main-tenance may determine the choice of sensor location. The concept of one system being supe-rior to another is project-dependant and subject to designer goals and priorities.
5 Future Work The advantage of the current model relies in its simplicity and adaptability. The model was built to answer a specific question without extensive knowledge about the building itself. This paper has shown Simulink can be a useful tool for CO2-DCV analysis.
The following could be added to the current model: • Assumptions outlined in section 2.1 could be added to the model. Distur-
bances could be modeled as additional delays. • Co-simulation using this Matlab model with other existing simulation soft-
ware such as CONTAMW may be an interesting avenue to study more com-plex CO2-DCV questions involving the building envelope.
• Alternative controller algorithms could be implemented to analyze their per-formance.
• The model in this paper was relatively simple enough to be kept in the time domain. A time domain model is straightforward to modify and more readable even with little background in control system theory. The Simulink model could however be converted to the LaPlace domain to facilitate algebraic ma-nipulation in more advanced analysis of the system.
6 Acknowledgements The authors would like to acknowledge funding received from Natural Sciences and Engi-neering Research Council of Canada and the University of Calgary.
7 References ASHRAE 2001. Standard 62-2001. Ventilation for Acceptable Indoor Air Quality. Atlanta.
ASHRAE 2010. Standard 62.1-2010. Ventilation for Acceptable Indoor Air Quality. Atlanta, Georgia.
ASHRAE. 2011. Active Research Project Abstract. Available at: http://www.ashrae.org/technology/page/39 [Accessed May 3, 2011].
Awbi, H. 2003. Ventilation of Buildings, New York, Taylor & Francis.
GE Sensing. 2006. Telaire Duct Probe Sensor [Online]. Available at: http://www.instrumart.com/assets/108/T8041_datasheet.pdf [Accessed August 3, 2011].
Haghighat, F. & Donnini, G. 1992. IAQ and Energy-Management by Demand Controlled Ventilation. Environmental Technology, 13, 351-359.
Lawrence, T. M. 2008. Selecting CO2 Criteria for Outdoor Air Monitoring. ASHRAE Journal, pp.18 - 27.
Mumma, S. A. 2004. Transient Occupancy Ventilation By Monitoring CO2. IAQ Applications, Winter 2004.
http://esim.ca Page 200 of 614 May 1-4, Halifax Nova Scotia
Proceedings of eSim 2012: The Canadian Conference on Building Simulation

Murphy, J. & Bradley, B. 2008. CO2-Based Demand-Controlled Ventilation. Heating/Piping/Air Conditioning HPAC Engineering, 80, 36-47.
Nassif, N. 2012. A robust CO2-based demand-controlled ventilation control strategy for multi-zone HVAC systems. Energy and Buildings, 45, 72-81.
Nassif, N., Kajl, S. & Sabourin, R. 2005. Ventilation Control Strategy Using the Supply CO2 Concentration Setpoint. HVAC&R Research, 11, 239-262.
Persily, A., Musser, A., Emmerich, S. & Taylor, M. 2003. Simulations of indoor air quality and ventilation impacts of demand controlled ventilation in commercial and institutional buildings,. NISTIR, 7042.
Riederer, P. 2005. Matlab/Simulink For Building And HVAC Simulation - State Of The Art. Ninth International IBPSA Conference. Montréal, Canada.
Stanke, D. 2010. Dynamic Reset for Multiple-Zone Systems. ASHRAE Journal, 52, 22-4, 26, 28, 30, 32, 34-5.
Underwood, C. P. (ed.) 1999. HVAC Control Systems: Modelling, analysis and design, London and New York: E & FN Spon.
Warden, D. 2004. Supply Air CO2 Control. ASHRAE Journal, 46, 26-38.
http://esim.ca Page 201 of 614 May 1-4, Halifax Nova Scotia
Proceedings of eSim 2012: The Canadian Conference on Building Simulation