simultaneous analysis of vocal fold vibration and ...svante/thesis/paperv.pdf · simultaneous...
TRANSCRIPT

TMH-QPSR, KTH, Vol. 45, 2003
Speech, Music and Hearing, KTH, Stockholm, Sweden TMH-QPSR, KTH, Vol. 45: 35 - 46, 2003
35
Simultaneous analysis of vocal fold vibration and transglottal airflow; Exploring a new experimental set-up Svante Granqvist*, Stellan Hertegård°, Hans Larsson° & Johan Sundberg*
* Department of Speech Music and Hearing, Royal Institute of Technology (KTH), Stockholm, Sweden. ° Dept of Logopedics and Phoniatrics, Karolinska Institute, Huddinge University Hospital, Stockholm, Sweden
Preliminary results of this study were presented at the 30th annual symposium: Care of the Professional Voice 2001, Philadelphia, Pennsylvania, USA
Abstract The purpose of this study was to develop an analysis system for studying the relationship between vocal fold vibration and the associated transglottal airflow. Recordings of airflow, electro-glottography (EGG), oral air pressure and acoustic signals were performed simultaneously with high speed imaging at a rate of approximately 1900 frames/s. Inverse filtered airflow is compared with the simultaneous glottal area extracted from the high speed image sequence. The accuracy of the synchronization between the camera images and the foot pedal synchronization pulse was examined, showing that potential synchronization errors increase with time distance to the synchronization pulse. Therefore, analysis was limited to material near the synchronization pulse. Results corroborate previous predictions that air flow lags behind area but also reveal that relationships between these two entities may be complex and apparently varying with phonation mode.
Introduction The voice source, i.e., the pulsating transglottal airflow, is controlled by three main physio-logical parameters. Subglottal pressure is highly correlated to vocal loudness, vocal fold length, mass and stiffness are the main controlling parameters for voice fundamental frequency, and net glottal adduction force controls mode of phonation. However, the influences of these parameters on the voice source are indirect, the mediating link being how they affect vocal fold vibration. Therefore, a crucial aspect of sound generation in the human voice is the relationship between vocal fold vibration and the associated transglottal airflow.
This relationship is not as simple as it might seem. For example, while photoglottography (PGG) usually shows a symmetric pulse shape of glottal area, the airflow pulse is typically asymmetrical, according to Fant & Sonesson (1962). On the basis of theoretical considera-
tions, Rothenberg (1981) predicted that the asymmetrical shape of the airflow pulse may be caused by three effects. One is the air displaced by vocal fold movement; the lateral motion of the vocal folds during the opening phase will consume some airflow, while the motion during the closing phase will add some airflow. This effect, however, will be small because of the small dimensions of the glottis. Another effect is an interaction between the vocal folds and the vocal tract; vocal tract resonance may interfere with the transglottal pressure that drives the vocal fold vibrations. A third effect is that the airflow has to accelerate at the initiation of the open phase, and hence a small airflow is produced for a given glottal opening area; at the end of the open phase, the inertia of the airflow increases the airflow to area ratio, such that a small glottal opening produces a large airflow. As acoustic mass is inversely proportional to the area, this effect can be assumed to be quite significant at the end of the closing phase. These

Granqvist S et al.: Simultaneous analysis of vocal fold vibration ...
36
effects as well as acoustic impedance effects related to the Bernouilli force (the glottal “bernoulliance”) were quantitatively analyzed and simulated by Liljencrants (1996).
Indirect information on the relationship between glottal area and transglottal airflow has been gained by the combination of electro-glottography (EGG) and high-speed imaging. This combination was used by Childers and co-workers (1983) who found that the EGG signal mostly provided reliable information on vocal fold contact area, but also observed that mucous spanning the glottis may cause effects on the EGG waveform that are likely to be confused with glottal closure. Baer and collaborators (1983) used a similar experimental setup, which was complemented by PGG recordings. They found that much of the information gathered from high-speed filming could be inferred from the EGG and the PGG waveforms.
To gain direct information on the glottal area-flow relationship, we combined high-speed imaging with inverse filtering of the glottal airflow. In this article, we present results and report on the strengths and limitations of this combination.
Method One female and one male served as subjects, both with extensive experience as singers. Their task was to repeat the syllable [pae] at different pitches and degrees of vocal loudness as well as in different modes of phonation that were familiar to the subjects. Repetition rate was 2 syllables per second, approximately.
The recording setup is shown in Figure 1. The following signals were recorded: 1. High-speed video imaging 2. Oral airflow 3. Oral air pressure 4. EGG 5. Sound pressure (audio) recorded at 30 cm. The high-speed image sequences of the vocal
folds were obtained via a rigid endoscope (Richard Wolf, Knittlingen Germany, 70° type 4450.501) and recorded by a Weinberger high-speed camera using 256 by 64 pixels at a frame rate of about 1900 images per second. The light source was a 300 W xenon lamp light (R. Wolf).
Oral air flow was recorded by means of circumferentially vented air flow mask (Glottal Enterprises) with a wide band pressure
transducer (type PTW-1). A pressure sensor (type PLL-1), attached to a thin plastic tube, ∅ 4 mm, was mounted in the flow mask which the subject held in the corner of the mouth and which thus captured oral air pressure. The pressure recorded during the occlusion for the consonant [p] was used as an estimate of the subglottal pressure. The endoscope was inserted through the handle hole of the flow mask, as illustrated in Figure 1. For the male subject, the air flow signal was attenuated by a custom-made electronic attenuator so as to avoid overloading. The EGG signal was measured by means of a Glottal Enterprises twin electroglottograph MC2-1. Sound pressure was recorded with a B&K condenser microphone 4192 and a microphone amplifier 2669.
The oral air flow, EGG, oral air pressure and sound pressure signals were all digitally recorded together with the synchronization signal coinciding with the last recorded high-speed frame, on a TEAC PCM RD-200T multi-channel digital tape recorder. The high-speed imaging was digitized (8-bit) and recorded to a separate computer file, without using any compression scheme.
Analysis Synchronization of the high-speed imaging signal and the inverse filtered airflow signal is crucial. The synchronization signal from the high-speed imaging equipment consisted of a single pulse triggered by the examiner’s
Figure 1. Experimental setup: flow wasrecorded by a flow mask provided withairtight sealings for an endoscope attachedto a high-speed camera and for a plastic tubeattached to a pressure transducer formeasuring oral (subglottal) pressure. Alsorecorded were an EGG signal and, forpurpose of protocol, the audio signal.
TMH-QPSR, KTH, Vol. 45, 2003
Speech, Music and Hearing, KTH, Stockholm, Sweden TMH-QPSR, KTH, Vol. 45: 35 - 46, 2003
37
pressing of a foot pedal. Pressing the pedal also arrested the high-speed recording, such that the synchronization pulse was synchronized with the last frame of the high-speed recording.
Area waveforms were derived semi-automatically from the high-speed recordings by means of a custom-made computer program, “High-Speed Toolbox” (2000). No attempts were made towards an absolute calibration of glottal area. The area waveform thus obtained was stored in a computer file.
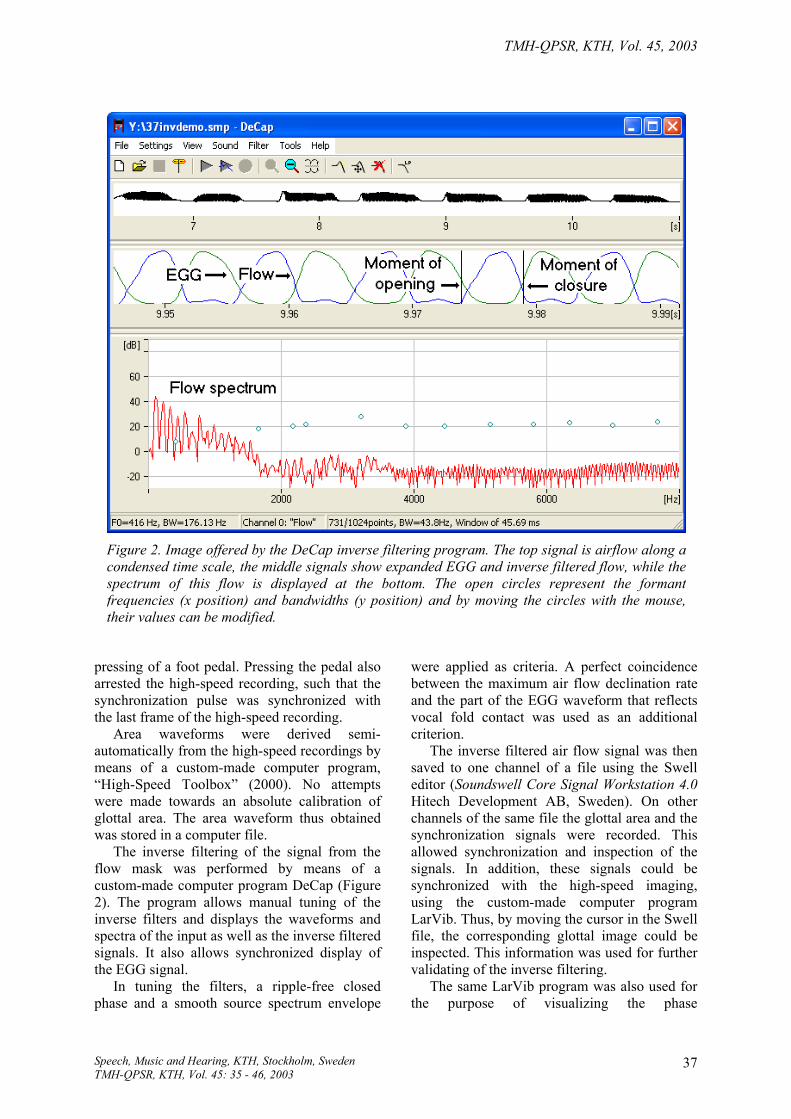
The inverse filtering of the signal from the flow mask was performed by means of a custom-made computer program DeCap (Figure 2). The program allows manual tuning of the inverse filters and displays the waveforms and spectra of the input as well as the inverse filtered signals. It also allows synchronized display of the EGG signal.
In tuning the filters, a ripple-free closed phase and a smooth source spectrum envelope
were applied as criteria. A perfect coincidence between the maximum air flow declination rate and the part of the EGG waveform that reflects vocal fold contact was used as an additional criterion.
The inverse filtered air flow signal was then saved to one channel of a file using the Swell editor (Soundswell Core Signal Workstation 4.0 Hitech Development AB, Sweden). On other channels of the same file the glottal area and the synchronization signals were recorded. This allowed synchronization and inspection of the signals. In addition, these signals could be synchronized with the high-speed imaging, using the custom-made computer program LarVib. Thus, by moving the cursor in the Swell file, the corresponding glottal image could be inspected. This information was used for further validating of the inverse filtering.
The same LarVib program was also used for the purpose of visualizing the phase
Figure 2. Image offered by the DeCap inverse filtering program. The top signal is airflow along acondensed time scale, the middle signals show expanded EGG and inverse filtered flow, while thespectrum of this flow is displayed at the bottom. The open circles represent the formantfrequencies (x position) and bandwidths (y position) and by moving the circles with the mouse,their values can be modified.

Granqvist S et al.: Simultaneous analysis of vocal fold vibration ...
38
relationships between different oscillating areas; the method is based on the time variation of the light intensity at each pixel in the camera CCD. For each pixel, a waveform corresponding to this time-variation was extracted from con-secutive images. The length of the time-window was approximately adjusted to represent the four glottal cycles used for the other measurements. Each of these waveforms was then processed by means of a fast Fourier-transform (FFT) that in these cases yielded periodic spectra. From these spectra, the F0 was selected. For each pixel, the FFT amplitude at this particular frequency was displayed as color saturation, and the FFT phase was displayed as color hue. The resulting image thus displays areas with large light intensity oscillations as intensely colored, and if the oscillations that occur are not in phase, these areas appear in different colors. For a more
extensive explanation of the method, see Granqvist & Lindestad (2001). Since the main purpose of the laryngeal examination was to study the glottal area, the amplitude threshold for displaying areas in color was selected so that mainly the glottis was colored, leaving other regions with smaller oscillatory amplitudes uncolored. This implied that the colored regions represented the maximally open area of the glottis, and the color hue represented the phase relations of the fundamental frequency of the light intensity oscillation at the different locations in the glottal area. The underlying laryngeal gray-scale images were selected from a maximally closed instant of the glottal oscillation.
All signals were then recorded on separate tracks of a new Swell file, which thus contained seven channels (Figure 3):
Figure 3. Display of a Swell file containing the following signals (from top): audio, flow, oral airpressure, filtered EGG, synchronization, inverse filtered flow, and glottal area. The time scale hasbeen expanded in the right hand display. (Audio)

TMH-QPSR, KTH, Vol. 45, 2003
Speech, Music and Hearing, KTH, Stockholm, Sweden TMH-QPSR, KTH, Vol. 45: 35 - 46, 2003
39
1. Sound pressure (Audio) 2. Flow 3. Estimated subglottal pressure 4. EGG 5. Synchronization signal 6. Inverse filtered air flow 7. Glottal area The audio signal was used only for
monitoring purposes. For a perfect synchronization of the tape-
recorded signals and the high-speed images exact information on the relationship between the sampling rates is required. However, this condition was not completely fulfilled, since the sampling frequency of the signal recorder and the frame rate of the high-speed camera were not synchronized. Furthermore, the signals were transferred from the signal recorder to the com-puter through an analog connection. Therefore, there was a slight lack of synchrony far away from the synchronization pulse.
To estimate the synchronization error, the synchrony was examined at a position about 2 seconds (~3800 frames) before the synchroni-zation pulse in one of the recordings. This revealed a synchronization error of about 2-3 frames. Thus, the synchronization drift could be assumed to be well below a single frame only for at least the 500 frames that preceded the synchronization pulse. To avoid significant syn-chronization errors, only the last 200 frames of each recording were used.
Another source of uncertainty in the synchronization would be that the foot pedal signal appeared at a time 0 to 1 frame after the last frame recorded. To examine the time alignment between the foot pedal sync pulse and the last frame recorded by the camera, a simple experiment was carried out. The general idea was to record a periodically time varying light signal that was simultaneously detected by a photo diode and the high-speed camera. The light signal was generated by a rotating disc with 32 sectors, 16 colored in black and 16 in white. The disc was positioned in front of a photodiode light detector. The speed of the disc rotation was adjusted so that the frequency from the photodiode output became 300 Hz, approxi-mately. The signal from the photodiode was recorded on a separate channel of the equipment that also recorded the synchronization pulse from the foot pedal. The rotating disc and the image of the photodiode were simultaneously recorded by the high-speed camera (Figure 4). The transition from black-to-white and vice
versa on the rotating disc was not sharp, but smooth, in order to approximate a sinusoidal variation in light intensity. Thus, the time-varying light intensity at each pixel in the camera CCD and at the photodiode could be considered as bandwidth limited, and thus the sampling theorem fulfilled. This means that the signal between samples (frames) could be reconstructed by applying up-sampling. The time-varying light intensity at a single pixel of the camera image, located straight in front of the photodiode, was extracted from the high-speed recording. In case of a perfect synchronization, this signal would be synchronous with the signal from the photodiode. Both signals were up-sampled to 500 kHz with the ReSample module in the Soundswell program package and the delay between the two signals was measured manually in Swell. The ReSample program has an option that assures that no phase shift is introduced; during the the resampling process, the signals are filtered by means of a 16th order elliptic IIR filter, and this filtering is performed twice, both backwards and forwards, assuring zero phase shift. The filters guarantee a frequency response within 0.1 dB up to 900 Hz. Alias attenuation is more than 100 dB.
The experiment was repeated 20 times. An average time shift corresponding to 0.27 frames, SD 0.39 frames, could be observed. The data obtained from human subjects was compensated for this average time shift, while, obviously, the random part of the time shifts could not be compensated for.
The air flow signal is delayed by the time it takes for sound to propagate from the glottis to the flow mask. Assuming a glottis-to-mask distance of 17.5 cm and speed of sound propa-gation of 350 m/s, this delay can be estimated to 0.175/350 = 0.0005 s. No individual adjustments were made according to vocal tract length, since 0.5 ms corresponds to one frame of the high-speed recording.
Results The waveforms thus obtained were analyzed with particular focus on the relation between glottal area and air flow. As expected, the inverse filtered air flow waveform was more skewed to the right than the area waveform.
To display small skewing differences, glottal air flow was plotted as function of glottal area in Lissajou figures. Figures 5-9 show some examples from a male and a female subject. If

Granqvist S et al.: Simultaneous analysis of vocal fold vibration ...
40
Figure 4. Setup for the experiment in which the synchronization between the camera recording and the foot pedal synchronization pulse was examined. The top picture shows the placement of the photo diode, endoscope over the rotating disc provided with white and black sectors. The marking on the disc was used for the overall synchronization. The insert shows an image as seen by the camera. The bottom display shows up-sampled signals from the photo diode and a selected pixel in the camera view marked in the insert.

TMH-QPSR, KTH, Vol. 45, 2003
Speech, Music and Hearing, KTH, Stockholm, Sweden TMH-QPSR, KTH, Vol. 45: 35 - 46, 2003
41
there were a linear relationship and no phase lag between area and air flow, the data points would fall on a straight line. A non-linear relationship, on the other hand, would cause the data points to fall along a curved contour and changes in the phase relationship between area and air flow would appear as loops. The graphs all show such signs of non-linear and phase shifted relation-ship between area and air flow.
The four panels in Figure 5 show data gathered for breathy phonation. In this case, neither area, nor air flow, reaches zero as expected (lower left panel). Moreover, the relationship is complicated by loops suggesting that glottal area decreased momentarily at the initiation of the closed phase while the air flow stayed approximately constant. Presumably, these loops are related to the complex vocal fold movement during closed phase, characterized by
a desynchronization of the left and right vocal folds (right panels). In case of an incomplete closure, the glottal area at the topmost level of the vocal folds does not necessarily represent the effective area as seen by the airflow. This will complicate the apparent relationship between air flow and measured area, since the area detector tends to reflect the topmost area rather than the effective area.
The same subject’s flow phonation yielded slightly different area-to-flow relationship (Figure 6). Here the air flow signal indicated a non-zero air flow during the closed phase, on the order of 150 ml/s (left panels). This air flow may be caused by a glottal piston movement during the closed phase. In this case, the glottis opened in an anterior-to-posterior zipper-like fashion (upper right panel).
Figure 5. Example of four cycles recordings of breathy phonation as produced by the male subject.The top left curves represent inverse filtered flow and glottal area and the bottom graph shows theirphase relationship in terms of a Lissajou figure. The upper right image shows, in terms of color hue,the phase relationship between the light intensity oscillations at the left and right vocal folds,identical colors reflecting zero phase; the colored area approximates the maximally opened glottis.The lower image shows the corresponding kymogram at the line marked in the glottal image.

Granqvist S et al.: Simultaneous analysis of vocal fold vibration ...
42
Figure 6. Example of recordings of flow phonation as produced by the male subject (for explanation, see caption of Figure 5).
Figure 7. Example of recordings of pressed phonation as produced by the male subject, reflecting the artifact that the flow leads rather than lags area (for explanation, see caption of Figure 5).

TMH-QPSR, KTH, Vol. 45, 2003
Speech, Music and Hearing, KTH, Stockholm, Sweden TMH-QPSR, KTH, Vol. 45: 35 - 46, 2003
43
Figure 8. Example of recordings of neutral phonation at 220 Hz F0 as produced by the female subject (for explanation, see caption of Figure 5).
Figure 9. Example of recordings of neutral phonation at 340 Hz F0 as produced by the female subject (for explanation, see caption of Figure 5).

Granqvist S et al.: Simultaneous analysis of vocal fold vibration ...
44
The example of pressed phonation illustrates an artifact (Figure 7). In this case, the air flow to area relationship was reversed, the area apparently lagging behind the air flow, which obviously is impossible. Careful inspection of the corresponding video sequence suggested that the cause for this artifact was that the opening was initiated in the anterior portion of the glottis that, however, was hidden by the petiolus, a situation probably caused by the laryngeal posturing associated with pressed phonation. In addition, the opening of the glottis followed a zipper-like pattern, such that the anterior part of the glottis opened slightly earlier than the posterior parts. This phase difference is illustrated by the dissimilar colors of the anterior and posterior parts of the glottis shown in the upper right panel in Figure 7. As a result, the first part of the open phase was not recorded by the area detector program. This illustrates both the sensitivity of these Lissajou graphs and the importance of analyzing an image material that accurately reflects the entire glottis.
The graphs in Figure 8 and 9 refer to the female subject’s neutral phonation at 220 Hz and 340 Hz F0, respectively. Although the sampling rate was low as compared to F0, the area-to-flow Lissajou graphs are similar to those of the male voice. A minor posterior chink caused a slight air flow during the closed phase in both cases. However, the area extraction program failed to detect this chink in the case shown in Figure 9.
The graphs shown in Figure 5-9 corroborate the non-trivial relationship between glottal air flow and glottal area, particularly in breathy phonation. The presence of loops at the turning points of the curves suggests that the area to air flow relationship may be quite complex at the moment of initiation of the closing phase. The loops may indicate that an unchanged airflow is maintained even when the area starts to decrease. The changing profile of the glottis from converging to diverging may contribute to this effect.
Discussion The relationship between glottal area and trans-glottal air flow is of fundamental interest for understanding and modeling the glottal mecha-nism. In the present study, an attempt was made to measure these two entities simultaneously. This involved a setting with a Rothenberg mask combined with a rigid endoscope, allowing
synchronuous recording of transglottal airflow and high-speed video recording of the glottis. This experimental procedure was slightly more complicated than normal laryngoscopy, but worked surprisingly well. Given that simul-taneous recordings also were made of EGG, oral pressure and audio, there is a great potential for data obtained in this way to be used for quantitative analysis and computer modeling of the vocal folds.
However, the limited accuracy of the synchronization between imaging and analog signals reduced the useable material to the last hundreds of frames in each recording. This synchronization should preferably be improved in future studies. A better setting would be to have a synchronization impulse for each frame in the high-speed recording, derived directly from the camera, rather than a single pulse at the end of the recording derived from the foot pedal.
In spite of these limitations, the material obtained has confirmed previous results. They corroborate Fant & Sonesson’s (1962) observations on the relationship between glottal area as visualized by photoglottography and synchronous inverse filtering. Furthermore, they are consistent with results from computer simulations of area and airflow (Drioli, 2002).
The phase differences between glottal area and transglottal airflow are often clearly visible from inspection of the waveforms. However, Lissajou graphs of the type shown in Figures 5-9 are particularly revealing in cases where the phase differences are small. The skewing of the airflow waveform causes loops, i.e. different traces for increasing and decreasing glottal area. On the other hand, small methodological errors will also contribute significantly. For example, an error in the synchronization between area and air flow signals would cause an otherwise in-phase relation to show a loop. Also, an inappro-priate inverse filtering would cause vertical ripple in the curve, but so would also interaction effects from the vocal tract. In addition, dis-crepancies between extracted and effective glottal area can affect the phase relationship between area and air flow. Such Lissajou figures efficiently illustrate minor phase differences, regardless of their origin.
In the case of flow phonation (Figure 7), a zero area was associated with an airflow of about 150 ml/s. The anterior-most part of the glottis was hidden to the camera, so a chink in this region may have caused the effect. However, careful inspection of this particular

TMH-QPSR, KTH, Vol. 45, 2003
Speech, Music and Hearing, KTH, Stockholm, Sweden TMH-QPSR, KTH, Vol. 45: 35 - 46, 2003
45
high-speed recording suggested the more plausible explanation that this air flow origi-nated from a piston movement of the vocal folds, lasting throughout the entire closed phase. Such a piston movement is hard to observe in non-moving images but can be readily observed when the images are played back as a sequence. If the vocal folds are regarded as a piston with a diameter of 1.5 cm and the closed phase is assumed to last for 3 ms, this piston would have had to move about 2.5 mm upwards at an approximately constant velocity during the closed phase to achieve an air flow of that magnitude. It is difficult to estimate the upward movement from direct inspection of the high-speed recording but it does not seem un-reasonable to assume that the magnitude of a glottal piston movement may amount to several mm. Previous measurements using triangulation technique of a laser beam directed to the upper surface of the vocal folds showed that the vertical (piston) movements were in the magni-tude of 1-2 mm for loud modal voice phonation in a male subject (Hertegård et al., 1998). This supports our hypothesis that a piston movement would explain the air flow during the closed phase. Measurements with absolute calibration of glottal dimensions and vertical movement are needed to further elucidate this.
The method presented here is most reliable for low F0, although plausible results were obtained also for an F0 of 340 Hz. The limited frame rate of the high-speed camera (1900 frames/s) fails to represent frequency com-ponents above 950 Hz (=fs/2) in the glottal area function. In addition, the flow mask has reso-nances at 1600 Hz and above (Badin et al., 1990), which makes the results less reliable at high frequencies. In any event, it would be worthwhile to test also a camera with a higher frame rate.
The phase lag between air flow and area is acoustically relevant. The reason is that the maximum air flow declination rate determines the overall SPL of vowels. If the air flow would be directly proportional to the area, the air flow decline rate would be lower, which, in turn, would lead to a lower SPL than produced by the actual skewed air flow waveform.
Using simultaneous multi-parameter measu-rements appears to be an interesting way to study voice production. In particular, the relation between glottal area and air flow could be examined in detail for individual glottal cycles. Thus the study represents an attempt to
bridge the knowledge gap between vocal fold vibration and sound generation. The results from the experiments were promising, and future studies should be performed, with an improved synchronization, a greater number of subjects and a wider range of voice qualities.
Conclusion Combining high-speed imaging of the glottis with inverse filtering of the transglottal airflow seems rewarding. Our findings corroborate predictions by Rothenberg and others that transglottal air flow lags glottal area. However, this phase lag appears to be influenced by glottal adjustments. For future investigations of the glottal area to air flow relationship, improved mechanisms for synchronization between video frames and transglottal air flow signals would be beneficial.
Acknowledgements We would like to thank the brave subjects for participating in the experiments. This work was supported by Swedish Council for Working Life and Social Research grant number 1998-0560.
References Badin P, Hertegård S & Karlsson I (1990). Notes on
the Rothenberg maks, STL-QPSR, KTH, 1: 1-7. Baer T, Löfqvist A & McGarr N (1983). Laryngeal
vibrations: A comparison between high-speed filming and glottographic techniques. J Acoustic Soc Amer 73: 1304-1308.
Childers D, Naik JM, Larar JN, Krishnamurty AK & Moore GP (1983). Electroglottography, speech, and ultra-high speed cinematography. In: Titze I & Scherer R, eds, Vocal Fold Physiology, Biomecha-nics, Acoustics and Phonatory Control, Denver, CO: The Denver Center for The Performing Arts.
Drioli C (2002). A flow waveform adaptive mechanical glottal model, TMH-QPSR, KTH, 43: 69-79. http://www.speech.kth.se/qpsr/tmh/ 2002/02-43-069-079.pdf.
Fant G & Sonesson B (1962). Indirect studies of glottal cycles by synchronous inverse filtering and photo-electrical glottography, STL-QPSR, KTH, 4: 1-3.
Granqvist S & Lindestad P-Å (2001). A method of applying Fourier analysis to high-speed laryngo-scopy, J Acoustic Soc Amer 110/6: 3193-3197
Hertegård S, Björck G & Manneberg G (1998). Using laser triangulation to measure vertical distance and displacement of laryngeal mucosa. Phonoscope. 1/3: 179-185.
Larsson H, Hertegård S, Lindestad PA & Ham-marberg B (2000). Vocal fold vibrations: high-speed imaging, kymography, and acoustic analysis:

Granqvist S et al.: Simultaneous analysis of vocal fold vibration ...
46
a preliminary report. Laryngoscope. 110/12: 2117-2122.
Liljencrants J (1996). Analysis by synthesis of glottal airflow in a physical model, TMH-QPSR, KTH, 2: 139-142.
Rothenberg (1981). Research Aspects of Singing, Stockholm: Royal Sw Acad Music: Publication 33: 15-33.