simultaneous genome-wide gene expression and transcript...
TRANSCRIPT
RESEARCH ARTICLE
Simultaneous genome-wide gene expression
and transcript isoform profiling in the human
malaria parasite
Lindsey B. Turnbull1,2☯, Geoffrey H. Siwo1,3☯, Katrina A. Button-Simons1, Asako Tan1,4,
Lisa A. Checkley1, Heather J. Painter5, Manuel Llinas5,6, Michael T. Ferdig1*
1 Department of Biological Sciences, Eck Institute for Global Health, University of Notre Dame, Notre Dame,
Indiana, United States of America, 2 Ryan White Center for Pediatric Infectious Diseases and Global Health,
Indiana University, Indianapolis, Indiana, United States of America, 3 IBM Research Africa, Johannesburg,
South Africa, 4 Illumina, Madison, Wisconsin, United States of America, 5 Department of Biochemistry &
Molecular Biology and Center for Malaria Research, Pennsylvania State University, University Park,
Pennsylvania, United States of America, 6 Department of Chemistry, Pennsylvania State University,
University Park, Pennsylvania, United States of America
☯ These authors contributed equally to this work.
Abstract
Gene expression DNA microarrays have been vital for characterizing whole-genome tran-
scriptional profiles. Nevertheless, their effectiveness relies heavily on the accuracy of
genome sequences, the annotation of gene structures, and the sequence-dependent per-
formance of individual probes. Currently available gene expression arrays for the malaria
parasite Plasmodium falciparum rely on an average of 2 probes per gene, usually positioned
near the 30 end of genes; consequently, existing designs are prone to measurement bias
and cannot capture complexities such as the occurrence of transcript isoforms arising from
alternative splicing or alternative start/ stop sites. Here, we describe two novel gene expres-
sion arrays with exon-focused probes designed with an average of 12 and 20 probes span-
ning each gene. This high probe density minimizes signal noise inherent in probe-to-probe
sequence-dependent hybridization intensity. We demonstrate that these exon arrays accu-
rately profile genome-wide expression, comparing favorably to currently available arrays
and RNA-seq profiling, and can detect alternatively spliced transcript isoforms as well as
non-coding RNAs (ncRNAs). Of the 964 candidate alternate splicing events from published
RNA-seq studies, 162 are confirmed using the exon array. Furthermore, the exon array pre-
dicted 330 previously unidentified alternate splicing events. Gene expression microarrays
continue to offer a cost-effective alternative to RNA-seq for the simultaneous monitoring of
gene expression and alternative splicing events. Microarrays may even be preferred in
some cases due to their affordability and the rapid turn-around of results when hundreds of
samples are required for fine-scale systems biology investigations, including the monitoring
of the networks of gene co-expression in the emergence of drug resistance.
PLOS ONE | https://doi.org/10.1371/journal.pone.0187595 November 7, 2017 1 / 20
a1111111111
a1111111111
a1111111111
a1111111111
a1111111111
OPENACCESS
Citation: Turnbull LB, Siwo GH, Button-Simons KA,
Tan A, Checkley LA, Painter HJ, et al. (2017)
Simultaneous genome-wide gene expression and
transcript isoform profiling in the human malaria
parasite. PLoS ONE 12(11): e0187595. https://doi.
org/10.1371/journal.pone.0187595
Editor: Massimo Caputi, Florida Atlantic University,
UNITED STATES
Received: February 3, 2017
Accepted: October 23, 2017
Published: November 7, 2017
Copyright: © 2017 Turnbull et al. This is an open
access article distributed under the terms of the
Creative Commons Attribution License, which
permits unrestricted use, distribution, and
reproduction in any medium, provided the original
author and source are credited.
Data Availability Statement: All files are available
from the GEO database (accession number(s)
GSE86255, GSE85248, GSE86254).
Funding: LBT, GHS, and KAB were supported by
Eck Institute for Global Health Fellowships. This
project was supported by the Indiana Clinical and
Translational Sciences Institute funded, in part by
Award Number UL1TR001108 from the National
Institutes of Health, National Center for Advancing
Translational Sciences, Clinical and Translational
Sciences Award and with support from the Center
Introduction
Even as RNA sequencing (RNA-seq) studies become common, microarrays remain the most
widely used tool to assess gene expression patterns [1]. This preference for microarrays for
studies containing large sample numbers is partly due to the lower cost; furthermore, microar-
ray data can be generated faster due to well-established data analytical tools and pipelines.
Moreover, it can be more straightforward to combine data and compare results across projects
and labs when using microarrays [2]. However, for good technical reasons, RNA-seq is supe-
rior, and if microarray technology is to survive, array platforms need to be updated to take
advantage of all potential applications. Specifically, the dynamic range of microarrays does not
approximate that of RNA sequencing when samples are sequenced at high enough coverage
levels, which vary based on the size of the transcriptome, and the number of lowly expressed
genes [3,4]. Microarrays are generally not well-suited to identify transcript isoforms—an
important biological feature of gene expression that remains to be fully explored.
For Plasmodium falciparum, the most lethal of malaria species, gene regulatory control of
the parasite across the developmental cycle remains an active area of research. Transcription is
an essential layer of information to guide the understanding of how phenotypes arise and
change over time, across genetic variation, and in response to changes in the environment.
Gene expression arrays have provided a relatively unbiased technique to quantify genome-
wide transcript levels at high resolution, demonstrating that gene expression is regulated
throughout the developmental cycle [5–7], that the genome contains hotspots for transcrip-
tional regulation [8], and that expression patterns change in response to drugs and other
perturbations [9–12]. Gene expression profiling of in vivo parasite samples has demonstrated
that the parasite exists in three distinct physiological states each with implications for disease
severity [13,14]. Recently, whole transcriptome data have revealed differences in transcrip-
tional networks between drug sensitive and resistant parasites [15] as well as potentially novel
mechanisms for anti-malarial drugs [16,17]. A high-density microarray for Plasmodium falcip-arum recently was used to demonstrate the affordability and feasibility to predict drug mecha-
nisms of action further emphasizing the continuing usefulness of this technology [17]. Given
the amount of data generated in each of these studies, the comparison of gene expression
across hundreds of samples and different studies may hold the key to understanding the signif-
icance of gene expression in contributing to a myriad of biological phenotypes.
In spite of the proven utility of gene expression arrays, current microarray platforms for
P. falciparum face a number of challenges that confound their ability to capture biological vari-
ation. Previously utilized Affymetrix arrays interrogated the transcriptome with a high density
of approximately one probe per 150bp [16,18], though exact probe placement is not uniform
across the transcriptome. These arrays are designed such that both detection of ncRNAs and
alternative splicing is possible. However, binding to the 25 base pair length oligonucleotide
probes on these arrays is less specific and has higher potential cross reactivity than more recent
glass slide arrays that use longer probes that are either spotted or synthesized in situ. Affyme-
trix arrays only measure a single sample per array leading to a high cost per sample, and rede-
signing Affymetrix arrays is expensive, thus making it cost prohibitive to keep it up to date
with the reference genome. Newer, multiple sample platforms with design flexibility are thus
more feasible for studies with large sample sizes. Two microarray platforms currently in use
include a spotted oligonucleotide array with 70bp probes with about 1.9 probes per gene [5,7],
and an Agilent 8×15K array with 60mer probes and average of 2.5 probes per gene [19,20].
The Agilent 15K array is a significant improvement over previous arrays in terms of number
of features represented including non-coding RNAs (ncRNAs) and recently identified genes.
As a dual-color platform, the Agilent 15K array (with 2.5 probes per gene on average)
Expression and transcription profiling in the human malaria parasite
PLOS ONE | https://doi.org/10.1371/journal.pone.0187595 November 7, 2017 2 / 20
for Quantitative Biology (P50 GM071508) (ML).
The content is solely the responsibility of the
authors and does not necessarily represent the
official views of the National Institutes of Health.
Neither IBM Research Africa nor Illumina provided
financial or salary support for the associated
authors GHS and AT. The specific roles of these
authors are articulated in the ‘author contributions’
section. Neither has commercial affiliation or any
intellectual, commercial, or ownership rights over
the products or ideas presented in this manuscript.
The funders had no role in study design, data
collection and analysis, decision to publish, or
preparation of the manuscript.
Competing interests: GHS is affiliated with IBM
Research Africa. AT is affiliated with Illumina.
Neither IBM Research Africa nor Illumina provided
financial or salary support for the associated
authors GHS and AT; nor did either have any role in
the study design, data collection and analysis,
decision to publish, or preparation of the
manuscript. The specific roles of these authors are
articulated in the ‘author contributions’ section.
Neither has commercial affiliation or any
intellectual, commercial, or ownership rights over
the products or ideas presented in this manuscript.
These affiliations do not alter the authors’
adherence to PLOS ONE policies on sharing data
and materials.
adequately captures the log2 ratio of co-hybridized samples which have been shown to be sta-
tistically consistent regardless of probe number and location within a gene [19,20]. However,
overall signal intensity for a given probe within a gene on the Agilent 15K array is highly vari-
able [19,20] based on nucleotide sequence [21,22], and an average of 2.5 probes per gene could
lead to biases in average gene expression levels that can be strongly influenced by outliers and
sequence polymorphisms. Given the highly sequence-dependent nature of probe hybridization
kinetics [21,22] average gene expression levels would be expected to be less biased if expression
levels were obtained from the signal intensities of multiple probes; this is especially relevant
given the highly AT rich genome of P. falciparum. In addition, nearly half of the genes in P. fal-ciparum contain multiple exons [23] and the potential for transcript isoforms. Current micro-
array platforms cannot resolve transcript isoforms arising from alternatively spliced exons,
alternative promoters or alternative start and stop sites. Genome-wide characterization of
alternative splicing has not been conducted using microarrays; however, two RNA-seq studies
predicted that at least 4.5% of genes undergo alternative splicing in P. falciparum across devel-
opmental time points [24,25]. Another study, based on cDNA sequencing of EST libraries,
estimated that nearly 16% of genes are alternatively spliced [26].
To enhance the information attainable from microarrays, we designed and validated two
high density microarrays, one on the Nimblegen platform and one on Agilent’s high density
(HD) 60K platform. The Nimblegen array was first described in a 2015 publication [17] and is
validated in greater detail here. Both of these arrays simultaneously measure genome-wide
transcript levels and transcript isoforms. As has been done in other organisms, alternatively
spliced variants are determined by leveraging multiple probes spanning a single gene [27–29].
Probe sets were designed to target each exon and alternative splicing was determined by com-
paring the signal intensity of a given exon to the average intensity of all probes in the same
gene [27]. In contrast to existing Plasmodium arrays, both of these exon-centric arrays contain
multiple probes per exon and a large number of overall probes spanning each gene, conferring
a new level of robustness which is less sensitive to probe-specific signal noise and allows both
arrays to be used as single-color platforms. While the Nimblegen array has significantly more
features per sample, this array is no longer available because Nimblegen has discontinued
microarray production which prompted the design of the Agilent HD exon microarray.
Results
We designed two exon expression microarrays to profile the full transcriptome of the malaria
species Plasmodium falciparum. Both of these arrays have a substantially higher density of
probes per replicated sample loading region (plex) on the chip than previous designs (Table 1),
which allows for more precise measurement of expression at the exon level. The Nimblegen
platform chip is a 12-plex microarray containing an average of 5 probes per exon and 22 per
annotated gene (PlasmoDB v6.3). The Agilent HD exon array is an 8-plex microarray contain-
ing an average of 5 probes per exon and 12 per annotated gene (PlasmoDB v9.3). Both arrays
also contain probes that interrogate 92 non-coding RNAs (ncRNAs) [18]. To compare the per-
formance of our exon arrays with that of existing arrays we used data generated from the estab-
lished Agilent 15K array [19] as the gold standard. Both the Nimblegen and Agilent HD exon
array are utilized as a single-color platform for the data presented, while the Agilent 15K array
is dual-color. Additional information about microarray specifications of our arrays and other
existing Plasmodium microarrays is provided in Table 1.
To determine the within platform reproducibility of gene expression measurements
obtained from our exon arrays, we hybridized independently biologically replicated RNA sam-
ples of the HB3 laboratory clone from 12, 24, 36, and 48 hours post-invasion (hpi). Both arrays
Expression and transcription profiling in the human malaria parasite
PLOS ONE | https://doi.org/10.1371/journal.pone.0187595 November 7, 2017 3 / 20
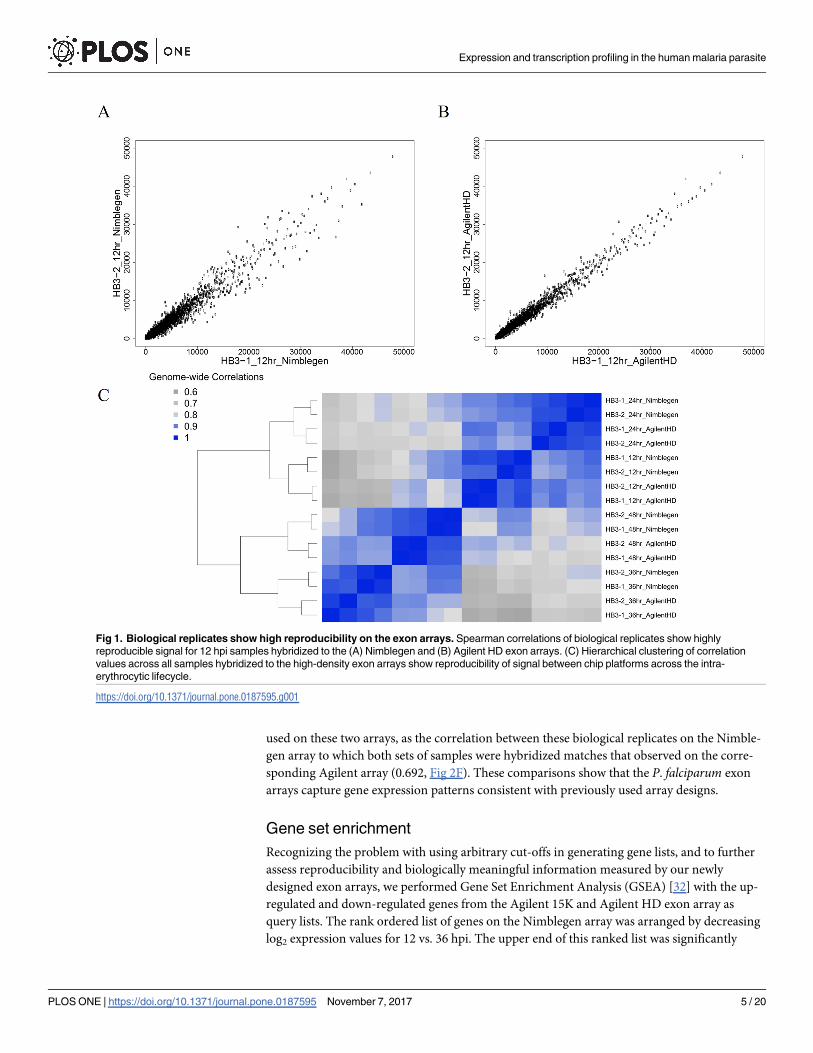
generated reproducible whole transcriptome measurements at 12 hpi (Fig 1A and 1B), as well
as at 24, 36 and 48 hpi (not shown). The correlations among replicates on the Nimblegen plat-
form ranged from 0.96 (48 hpi) to 0.99 (12, 24, 36 hpi) (Fig 1C). For the Agilent HD exon
array, the correlations observed between biological replicates were 0.96 (24, 36 hpi) and 0.99
(12, 48 hpi) (Fig 1C). Hierarchical clustering of samples by time point, irrespective of which
array was used (Fig 1C), confirm that whole-transcriptome profiles are stable and robust
across these two platforms. Correlation values observed between the same samples hybridized
to the Agilent HD exon array and Nimblegen exon array (0.917 to 0.962, Fig 1C). This analysis
demonstrates that both the Nimblegen exon array and Agilent HD exon array obtain highly
reproducible mRNA abundance measurements on a single-color platform. Given the high cor-
relations across biologically replicated samples, this data suggests that there may be greater
experimental value in prioritizing biological replication over technical replication if costs are
limiting.
Differential gene expression reproducibility
To determine the accuracy of the mRNA abundance captured on the exon arrays, we mea-
sured differential gene expression of biologically replicated HB3 samples between 12 and 36
hpi. Using an initial log2 = 2 (4-fold) differential expression cut-off to generate gene lists for
comparing platforms, we identified up- and down-regulated candidate genes between these
time points for the 4911 genes represented on both arrays. The correlation of genome-wide
log2 ratios between the two exon arrays was 0.905 (Fig 2A and 2B). For the Nimblegen array
we observed 92 up-regulated and 244 down-regulated genes. For the Agilent HD exon array
we observed 348 up-regulated and 488 down-regulated genes (S1 and S2 Tables). Combined,
both arrays shared 75 up-regulated genes and 219 as down-regulated, representing an average
concordance of 85.6% between the array platforms with respect to up- or down-regulated
genes. The majority of additional differentially expressed genes identified on the Agilent HD
exon array are due to the higher signal:noise ratio of the Agilent array and the greater dynamic
range of the Agilent scanner. When comparing each of these arrays to the data from the Agi-
lent 15K array, the genome-wide log2 ratio correlations for the Nimblegen array was 0.873 (Fig
2C and 2D) with an average concordance of 80.09%. The overall correlation between the Agi-
lent 15K and Agilent HD exon array was 0.676 (Fig 2E); the average concordance of up- and
down-regulated genes between the Agilent arrays was 86.44%. This indicates that the lower
correlation value does not indicate lower reproducibility of information between arrays.
Rather, the lower correlation value can be largely attributed to differences in biological samples
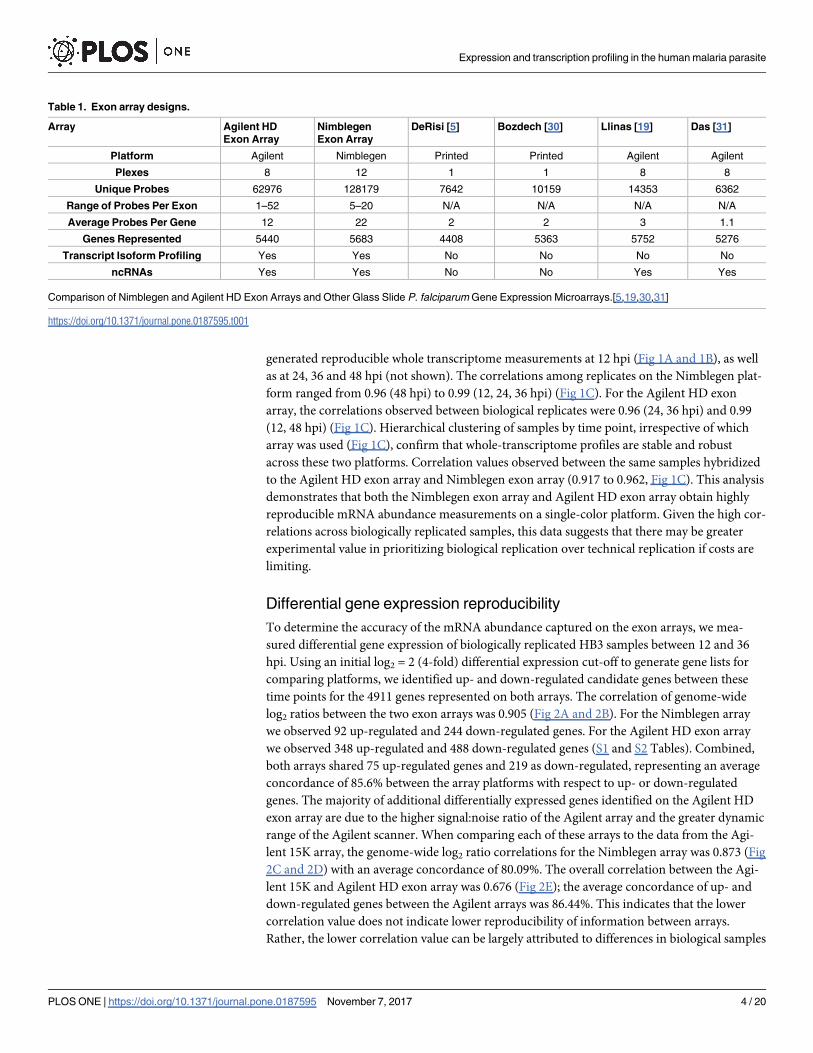
Table 1. Exon array designs.
Array Agilent HD
Exon Array
Nimblegen
Exon Array
DeRisi [5] Bozdech [30] Llinas [19] Das [31]
Platform Agilent Nimblegen Printed Printed Agilent Agilent
Plexes 8 12 1 1 8 8
Unique Probes 62976 128179 7642 10159 14353 6362
Range of Probes Per Exon 1–52 5–20 N/A N/A N/A N/A
Average Probes Per Gene 12 22 2 2 3 1.1
Genes Represented 5440 5683 4408 5363 5752 5276
Transcript Isoform Profiling Yes Yes No No No No
ncRNAs Yes Yes No No Yes Yes
Comparison of Nimblegen and Agilent HD Exon Arrays and Other Glass Slide P. falciparum Gene Expression Microarrays.[5,19,30,31]
https://doi.org/10.1371/journal.pone.0187595.t001
Expression and transcription profiling in the human malaria parasite
PLOS ONE | https://doi.org/10.1371/journal.pone.0187595 November 7, 2017 4 / 20
used on these two arrays, as the correlation between these biological replicates on the Nimble-
gen array to which both sets of samples were hybridized matches that observed on the corre-
sponding Agilent array (0.692, Fig 2F). These comparisons show that the P. falciparum exon
arrays capture gene expression patterns consistent with previously used array designs.
Gene set enrichment
Recognizing the problem with using arbitrary cut-offs in generating gene lists, and to further
assess reproducibility and biologically meaningful information measured by our newly
designed exon arrays, we performed Gene Set Enrichment Analysis (GSEA) [32] with the up-
regulated and down-regulated genes from the Agilent 15K and Agilent HD exon array as
query lists. The rank ordered list of genes on the Nimblegen array was arranged by decreasing
log2 expression values for 12 vs. 36 hpi. The upper end of this ranked list was significantly
Fig 1. Biological replicates show high reproducibility on the exon arrays. Spearman correlations of biological replicates show highly
reproducible signal for 12 hpi samples hybridized to the (A) Nimblegen and (B) Agilent HD exon arrays. (C) Hierarchical clustering of correlation
values across all samples hybridized to the high-density exon arrays show reproducibility of signal between chip platforms across the intra-
erythrocytic lifecycle.
https://doi.org/10.1371/journal.pone.0187595.g001
Expression and transcription profiling in the human malaria parasite
PLOS ONE | https://doi.org/10.1371/journal.pone.0187595 November 7, 2017 5 / 20
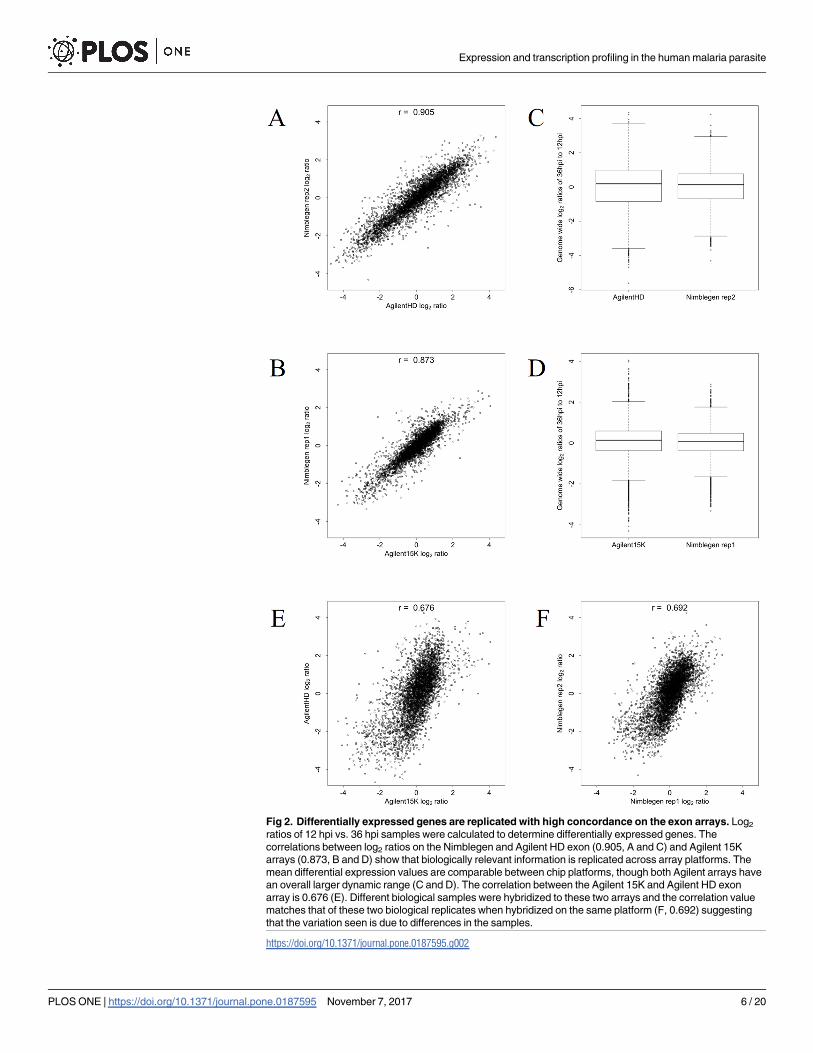
Fig 2. Differentially expressed genes are replicated with high concordance on the exon arrays. Log2
ratios of 12 hpi vs. 36 hpi samples were calculated to determine differentially expressed genes. The
correlations between log2 ratios on the Nimblegen and Agilent HD exon (0.905, A and C) and Agilent 15K
arrays (0.873, B and D) show that biologically relevant information is replicated across array platforms. The
mean differential expression values are comparable between chip platforms, though both Agilent arrays have
an overall larger dynamic range (C and D). The correlation between the Agilent 15K and Agilent HD exon
array is 0.676 (E). Different biological samples were hybridized to these two arrays and the correlation value
matches that of these two biological replicates when hybridized on the same platform (F, 0.692) suggesting
that the variation seen is due to differences in the samples.
https://doi.org/10.1371/journal.pone.0187595.g002
Expression and transcription profiling in the human malaria parasite
PLOS ONE | https://doi.org/10.1371/journal.pone.0187595 November 7, 2017 6 / 20
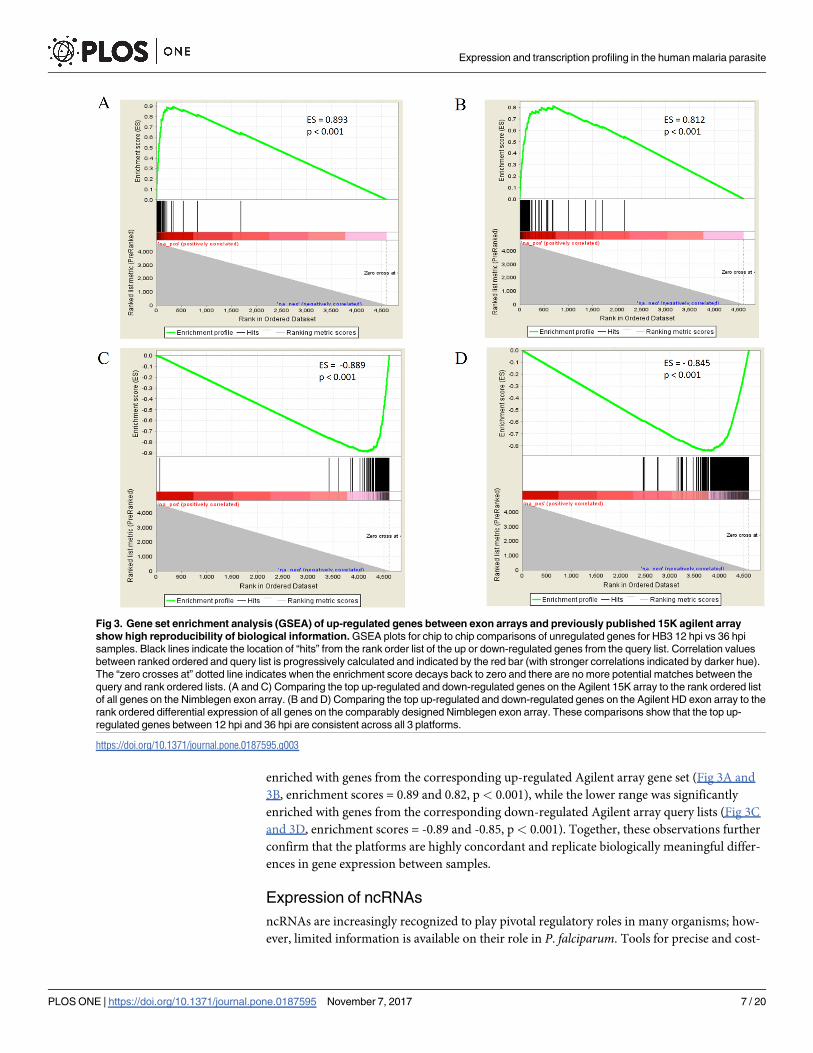
enriched with genes from the corresponding up-regulated Agilent array gene set (Fig 3A and
3B, enrichment scores = 0.89 and 0.82, p< 0.001), while the lower range was significantly
enriched with genes from the corresponding down-regulated Agilent array query lists (Fig 3C
and 3D, enrichment scores = -0.89 and -0.85, p< 0.001). Together, these observations further
confirm that the platforms are highly concordant and replicate biologically meaningful differ-
ences in gene expression between samples.
Expression of ncRNAs
ncRNAs are increasingly recognized to play pivotal regulatory roles in many organisms; how-
ever, limited information is available on their role in P. falciparum. Tools for precise and cost-
Fig 3. Gene set enrichment analysis (GSEA) of up-regulated genes between exon arrays and previously published 15K agilent array
show high reproducibility of biological information. GSEA plots for chip to chip comparisons of unregulated genes for HB3 12 hpi vs 36 hpi
samples. Black lines indicate the location of “hits” from the rank order list of the up or down-regulated genes from the query list. Correlation values
between ranked ordered and query list is progressively calculated and indicated by the red bar (with stronger correlations indicated by darker hue).
The “zero crosses at” dotted line indicates when the enrichment score decays back to zero and there are no more potential matches between the
query and rank ordered lists. (A and C) Comparing the top up-regulated and down-regulated genes on the Agilent 15K array to the rank ordered list
of all genes on the Nimblegen exon array. (B and D) Comparing the top up-regulated and down-regulated genes on the Agilent HD exon array to the
rank ordered differential expression of all genes on the comparably designed Nimblegen exon array. These comparisons show that the top up-
regulated genes between 12 hpi and 36 hpi are consistent across all 3 platforms.
https://doi.org/10.1371/journal.pone.0187595.g003
Expression and transcription profiling in the human malaria parasite
PLOS ONE | https://doi.org/10.1371/journal.pone.0187595 November 7, 2017 7 / 20
effective measurement of genome-wide ncRNAs levels, in concert with coding mRNA, will
shed light on their role in parasite biology. The Nimblegen array includes 92 ncRNAs from a
published set of 120 ncRNAs [18] that have been confirmed by northern blots, microarrays or
phylogenetic conservation. The Agilent HD exon array includes 100 ncRNAs from the same
set of verified ncRNAs. ncRNAs were only excluded based on the inability to design appropri-
ate probes on each array platform. An important feature of the Agilent chip construction is the
ease with which new information can be incorporated into future designs, for example as
more regulatory ncRNAs are discovered these can be added to subsequent chips.
In HB3, 75 ncRNAs were detected in at least one developmental stage on the Nimblegen
exon array, and 68 on the Agilent HD exon array (S3 Table). The Spearman correlation
between the 51 ncRNAs detected on both arrays at 24 hpi was high (r = 0.82). Of 22 ncRNAs
previously reported as expressed based on northern blots, 17 were represented on the Agilent
HD exon array. Six of these ncRNAs were differentially expressed (2-fold change) between
stages (S4 Table). Differentially expressed ncRNAs included RNAZ_ID_2132 expressed in
rings and trophozoites, which exhibited a transcript level 4.5-fold lower in 36 hour early schiz-
onts compared to 12 hour rings.
Transcript isoforms
A single gene can encode more than one protein product and/or transcript isoform due to
alternative splicing, including alternative transcription start or stop sites and alternative polya-
denylation sites [33]. Exon arrays allow for the detection of transcript isoforms based on the
expression level of individual exons across a gene [27,34]. An alternatively spliced exon (absent
in some cells under some conditions) is expressed at a lower level compared to the expression
level of the entire gene [27]. To test the ability of the exon array to detect previously described
transcript isoforms, we obtained exon-level expression for each gene by averaging the signal
intensity across all probes targeting an exon. The exon-level expression was then normalized
to the average signal intensity across a gene to obtain the gene level normalized intensity (NI).
Alternative splicing for a given exon was then determined as the log2 ratio of NI between two
samples, referred to as the Splicing Index (SI) [27]. An exon was considered as a candidate for
alternative splicing if it had an SI more than 2 or less than -2. Prior RNA-seq studies excluded
highly variable genes (var, rifin, stevor) from data analysis of isoforms; for ease of comparison
these genes were also trimmed from our lists of alternatively spliced genes.
On this basis, we predicted 665 splicing events involving 492 genes in at least one pair of
time point comparisons (S5 Table). The correlation of SI between our two exon arrays was
0.626 for the 12 hpi vs. 36 hpi time points (Fig 4A). This value is lower than the correlation
observed across arrays for differential expression of the same time point, and is primarily due
to the higher sensitivity of the splicing index to variation in expression estimate and is compa-
rable to the between array SI comparison values on other platforms [35].
The number of alternative splicing events in P. falciparum has been estimated by RNA-seq
studies to range from sixty-five [25] to six-hundred ninety-two [37] genes having at least one
alternatively spliced product. To assess the performance of the exon array, we compared the
predicted alternative splicing events to those from four RNA-seq studies: Otto et al. [25] in
which alternative splicing was determined using sequence data from 3D7 parasites at 8, 16, 24,
32, 40 and 48 hpi, Sorber et al. [24] in which sequencing was performed on 11, 22, 33, and 44
hpi samples from the 3D7 laboratory clone; Broadbent et al.[36] who sequenced a total of 15
time points across the lifecycle and focused primarily on long noncoding RNA structure and
splicing; and Lopez-Barragan et al.[37] which included sequencing of gametocytes and mos-
quito stages of the parasite lifecycle. Each of these studies used the 3D7 parasite strain, and
Expression and transcription profiling in the human malaria parasite
PLOS ONE | https://doi.org/10.1371/journal.pone.0187595 November 7, 2017 8 / 20
harvested RNA at similar time points in the lifecycle. However the lists of alternatively spliced
genes in these RNA-seq studies are largely exclusive such that each study identified a large
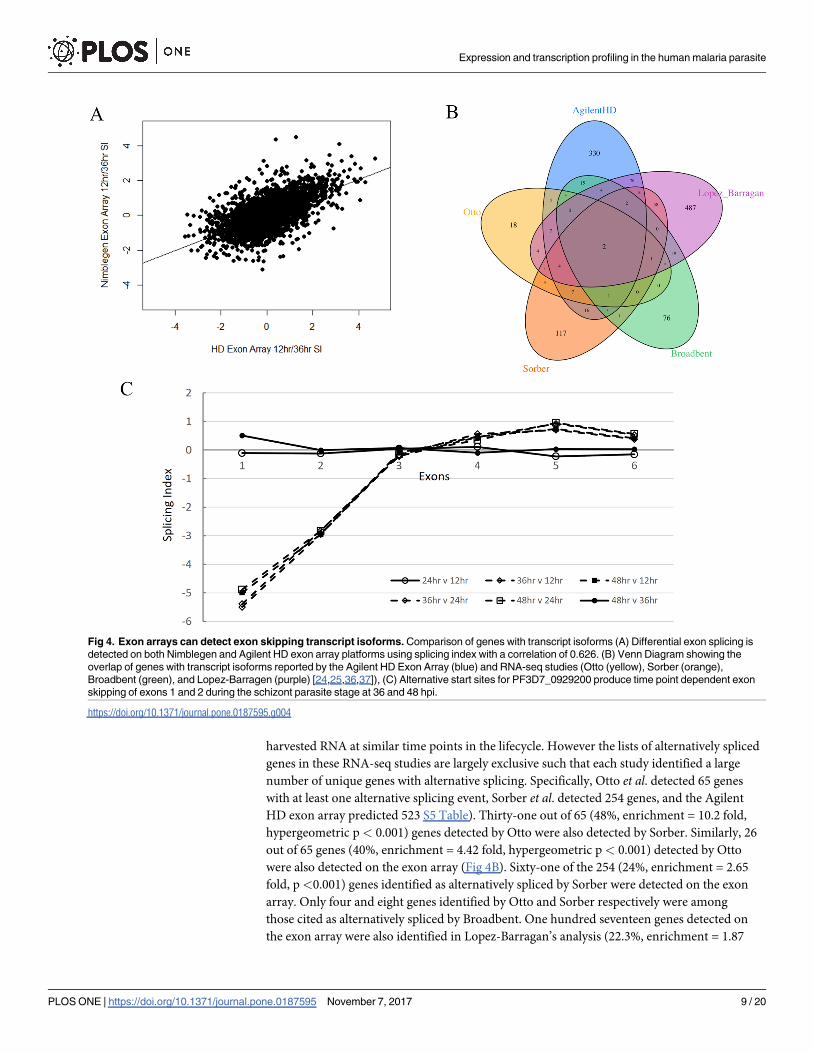
number of unique genes with alternative splicing. Specifically, Otto et al. detected 65 genes
with at least one alternative splicing event, Sorber et al. detected 254 genes, and the Agilent
HD exon array predicted 523 S5 Table). Thirty-one out of 65 (48%, enrichment = 10.2 fold,
hypergeometric p< 0.001) genes detected by Otto were also detected by Sorber. Similarly, 26
out of 65 genes (40%, enrichment = 4.42 fold, hypergeometric p< 0.001) detected by Otto
were also detected on the exon array (Fig 4B). Sixty-one of the 254 (24%, enrichment = 2.65
fold, p<0.001) genes identified as alternatively spliced by Sorber were detected on the exon
array. Only four and eight genes identified by Otto and Sorber respectively were among
those cited as alternatively spliced by Broadbent. One hundred seventeen genes detected on
the exon array were also identified in Lopez-Barragan’s analysis (22.3%, enrichment = 1.87
Fig 4. Exon arrays can detect exon skipping transcript isoforms. Comparison of genes with transcript isoforms (A) Differential exon splicing is
detected on both Nimblegen and Agilent HD exon array platforms using splicing index with a correlation of 0.626. (B) Venn Diagram showing the
overlap of genes with transcript isoforms reported by the Agilent HD Exon Array (blue) and RNA-seq studies (Otto (yellow), Sorber (orange),
Broadbent (green), and Lopez-Barragen (purple) [24,25,36,37]), (C) Alternative start sites for PF3D7_0929200 produce time point dependent exon
skipping of exons 1 and 2 during the schizont parasite stage at 36 and 48 hpi.
https://doi.org/10.1371/journal.pone.0187595.g004
Expression and transcription profiling in the human malaria parasite
PLOS ONE | https://doi.org/10.1371/journal.pone.0187595 November 7, 2017 9 / 20
fold, p<0.001). Consequently, a total of 162 genes with transcript isoforms (32.9%) identified
by the Agilent HD exon array were independently supported by RNA-seq data. The exon
arrays also detected 330 potentially alternatively spliced genes not previously identified by
other studies. Identification of novel isoforms on the microarray is not unexpected, and there
are a large number of genes with suggested alternative splicing that are reported in only one of
the four comparison RNA-seq studies (698 of 964 total). Of the 5668 annotated genes in the
current PlasmoDB release 28, the exon array covers a total of 5434 (95.8%), and 4569 (80.6%
total) genes are covered by eight or more unique probes. Alternative splicing could potentially
be identified on 2781 genes (51.1%) represented on the HD exon array which have probes in at
least two exons, though not every multiple exon gene is expected to have alternate transcripts.
Most transcript isoform candidates identified on the HD exon array were alternative tran-
scription start and stop sites. For example PF3D7_0929200, coding for a putative RNA-bind-
ing protein, contains an alternative 30 start site [25] that results in different mRNA sequence
based on hpi time points (Fig 4C). The gene expresses two different transcript isoforms, one
containing six exons at 12 and 24 hpi and the other with four at 36 and 48 hpi. Alternative
splicing can lead to protein isoforms with different biological functions when the alternatively
spliced exon encodes distinct protein domains. Therefore, for each spliced gene, we scanned
the encoded protein sequence for domains using position specific scoring matrices (PSSMs) of
protein domain alignments from the conserved domain database (CDD) [38]. Of the 492 alter-
natively spliced genes detected by the Agilent HD exon array, 29% (196 exons) coded for con-
served protein domains from distinct functional categories such as enzymes, sorting signals,
protein-protein interactions, protein-DNA interactions, transport domains, and variant sur-
face antigens (S5 Table). Alternative splicing also can lead to changes in localization of proteins
in the cell through splicing events involving exon coding for protein sorting signals or trans-
membrane domains. In P. falciparum, an established example is erythrocyte binding protein
MAEBL (PF3D7_1147800) in which alternative splicing of trans-membrane domain occurs
[39]. Interestingly we found that the fourth exon of MAEBL, which includes a signal peptide,
is skipped in one of the isoforms. The available RNA-seq studies [24,25,36,37] did not, how-
ever, report any form of alternative splicing in this gene. Experimental validation of the alter-
natively spliced exon coding for protein domains will be highly useful in determining their
function effects. Some spliced exons coding for specific protein domains are conserved across
species or result in transcript isoforms that are present in other species, implying that they
may be functional. For example, we found alternative splicing of an ankyrin domain
(PF3D7_0825100), homologous to human ankyrins that are known to occur in multiple iso-
forms [40].
Assessing chip design principles
During our validation and use of the Nimblegen exon array, Nimblegen was purchased by
Roche and subsequently the microarray platform was discontinued. This prompted us to
investigate how well our exon array design principles would apply to other high-density micro-
array platforms. The Agilent HD exon array platform was chosen to test the transferability of
design principles due to its high probe density, and the ease of platform customization to spe-
cific projects and hypotheses using the Agilent eArray online design software. Several factors
determine the overall performance and reliability of an array including, the level of 30 bias and
probe hybridization intensity. Our exon arrays and sample preparation protocols have been
optimized to overcome both of these potential pitfalls. By using the WTA2 cDNA synthesis kit
(Sigma-Aldrich, US), we avoided 30 bias in our sample preparations (S2 Fig). We calculated
predicted probe binding intensities based on the frequency of dinucleotide combinations in
Expression and transcription profiling in the human malaria parasite
PLOS ONE | https://doi.org/10.1371/journal.pone.0187595 November 7, 2017 10 / 20
the probe sequences (S3 Fig) which shows that TT rich probes are associated with very low
hybridization intensities while GA rich probes have high intensities as has been previously
documented by others [41]. Additionally, both of these factors can be further overcome by
including a sufficient number of probes per gene on the array.
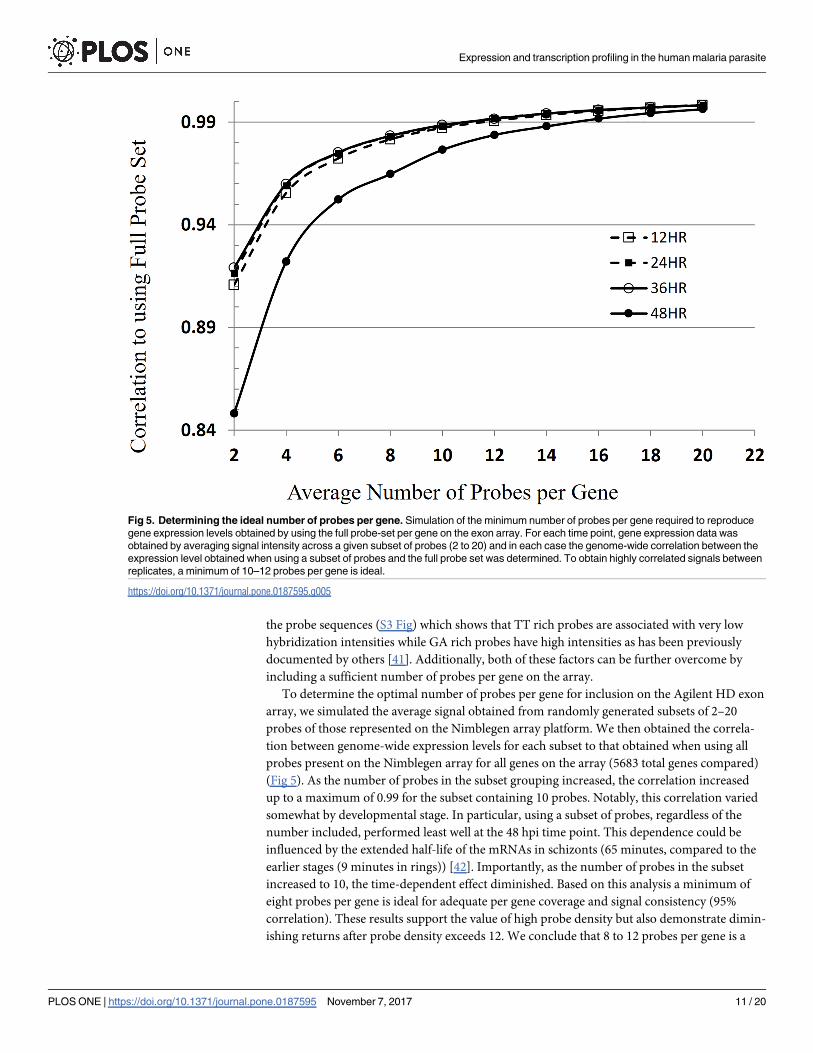
To determine the optimal number of probes per gene for inclusion on the Agilent HD exon
array, we simulated the average signal obtained from randomly generated subsets of 2–20
probes of those represented on the Nimblegen array platform. We then obtained the correla-
tion between genome-wide expression levels for each subset to that obtained when using all
probes present on the Nimblegen array for all genes on the array (5683 total genes compared)
(Fig 5). As the number of probes in the subset grouping increased, the correlation increased
up to a maximum of 0.99 for the subset containing 10 probes. Notably, this correlation varied
somewhat by developmental stage. In particular, using a subset of probes, regardless of the
number included, performed least well at the 48 hpi time point. This dependence could be
influenced by the extended half-life of the mRNAs in schizonts (65 minutes, compared to the
earlier stages (9 minutes in rings)) [42]. Importantly, as the number of probes in the subset
increased to 10, the time-dependent effect diminished. Based on this analysis a minimum of
eight probes per gene is ideal for adequate per gene coverage and signal consistency (95%
correlation). These results support the value of high probe density but also demonstrate dimin-
ishing returns after probe density exceeds 12. We conclude that 8 to 12 probes per gene is a
Fig 5. Determining the ideal number of probes per gene. Simulation of the minimum number of probes per gene required to reproduce
gene expression levels obtained by using the full probe-set per gene on the exon array. For each time point, gene expression data was
obtained by averaging signal intensity across a given subset of probes (2 to 20) and in each case the genome-wide correlation between the
expression level obtained when using a subset of probes and the full probe set was determined. To obtain highly correlated signals between
replicates, a minimum of 10–12 probes per gene is ideal.
https://doi.org/10.1371/journal.pone.0187595.g005
Expression and transcription profiling in the human malaria parasite
PLOS ONE | https://doi.org/10.1371/journal.pone.0187595 November 7, 2017 11 / 20
reasonable trade-off between performance and physical design constraints on other platforms.
The Agilent HD exon array contains 62976 probe spots, and assesses 5440 genes with an aver-
age of 12 probes per gene.
Discussion
Our analyses indicate that the transcriptional landscape of P. falciparum is complex and the
routine monitoring of alternatively spliced mRNA and ncRNAs will be important to under-
stand the significance to parasite development, response to drug, and environmental perturba-
tions. While the future of microarrays remains hotly debated as RNA-seq becomes less
expensive and efficiently analyzed, the results obtained here stress the need for exon-centric
analyses of transcripts, including those obtained by RNA-seq. The data and design principles
presented here demonstrate that microarrays have a niche in measuring whole transcription
profiles. At less than $200 per sample, both the Nimblegen and Agilent HD exon arrays are
cost-effective compared to RNA-seq for high throughput whole malaria transcriptome assess-
ment of hundreds of samples. These platforms can be readily customized for hypothesis-driven
investigations, can be quickly updated as new genome versions are released, and have well
developed post-hybridization data pipelines for systems biology and network analyses [15,17].
Unlike other existing arrays for P. falciparum, the high-density exon arrays profile both
transcript isoforms and ncRNAs. The array detects isoforms that are consistent with those pre-
viously reported by RNA-seq studies, and identifies potentially novel instances of alternative
splicing. There is currently no comprehensive alternative splicing database for P. falciparumand, every new study has identified novel isoforms. The Agilent HD exon array identified
many known alternate splicing events and predicted novel events. The identification of new
alternative splicing on the exon array suggests there may be considerably more genes with vari-
ant isoforms than are currently curated in gene databases. Among the genes that were identi-
fied as alternatively expressed on the HD exon array but not in RNA-seq experiments, 39.8%
had expression levels in the lowest quartile of genes measured by Otto et al. As the ability to
detect alternative splicing using RNA-seq is dependent on the number of sequencing reads
across a mRNA sequence, low expressing genes may not have produced enough sequencing
reads in some of the cited studies to determine whether alternative splicing had occurred.
Detection of novel splicing variants using microarrays is widely utilized in human genomic
studies using the high-density arrays [27,43,44], and may be a valuable tool to assess gene iso-
forms in protozoan parasites as well. However, in the described experiments, there was no
robust way to determine the proportion of false positives among our set of newly identified
genes with alternative splicing. Thus, it will be important to continue to validate predicted iso-
forms and cross validate new data with published results.
Overall, the two exon arrays generate highly reproducible transcript abundance estimates
using single-color platforms that are comparable to existing datasets collected using previous
dual-color platforms. The high probe density of the arrays allow gene expression measure-
ments for each gene to be estimated from a minimum of 8 probes across the entire mRNA
length. The increased density enhances the reliability of the array by making it robust to
sequence dependent probe hybridization biases and providing more reproducible transcript
abundance measurements.
The protocol described in the methods uses a very low initial amount of RNA (300 ηg)
which we can reliably extract from 10 mL of culture at 5% hematocrit and 1%—2% parasite-
mia. Even with these very low starting RNA volumes, the exon arrays demonstrated excellent
reproducibility allowing for considerable resource use reductions. This protocol also allows
samples to be stored long-term as unlabeled cDNA which has greater stability than RNA.
Expression and transcription profiling in the human malaria parasite
PLOS ONE | https://doi.org/10.1371/journal.pone.0187595 November 7, 2017 12 / 20
The new high-density exon arrays described provide new alternatives for Plasmodium
expression profiling. The Agilent HD exon array, as a single-color platform, accurately mea-
sures mRNA abundance, ncRNA abundance and detects exon skipping.
Materials and methods
Design of the malaria exon arrays
The Nimblegen platform exon array [17] is a custom-designed microarray consisting of
12-plexes (12 ×135K format). On each plex are 128,179 features (probes) of 50 to 75-mers rep-
resenting 5,683 annotated transcripts in PlasmoDB [45], ncRNAs [18] and novel transcripts
[46]. For each transcript, exon sequences were downloaded from PlasmoDB (v 6.3). Exon
sequences were binned into 3 categories depending on their length: i) exons longer than 1 kb
were each targeted by 20 probes, ii) exons ranging from 200–1000 bases were each targeted by
10 probes and, iii) exons shorter than 200 bases were each targeted by 5 probes. For transcripts
in which it was not possible to design a probe in all the exons, probe design was performed
based on the full mRNA sequence. In addition to probes targeting transcripts, negative control
probes, having no sequence similarity to the P. falciparum genome but of the same GC content
and melting temperature as the transcript probes, were randomly generated and placed on the
array.
The Agilent HD exon array is a custom-designed microarray consisting of 8-plexes
(8 ×60K format). On each plex there are 62,976 features of 60-mers representing 5540 anno-
tated transcripts, ncRNAs and novel transcripts. For each transcript, exon sequences were
downloaded from PlasmoDB (v 9.3). Probes were designed 50 to 30 using the Agilent eArray
online software and evenly spaced based on exon length such that: i) exons longer than 10 kb
were targeted by one probe every 1000bp, ii) exons between 5–10 kb were targeted by one
probe every 500bp, iii) exons between 1–5 kb were targeted by 10 probes spaced evenly
throughout the exon, and iv) exons shorter than 1 kb were targeted by one probe every 100bp
and these probes were duplicated on the array multiple times to provide a minimum of 8
probes per exon. Exons shorter than 45 bp were not included on the array. All probes were
checked for hybridization quality, and cross-hybridization potential prior to inclusion on the
array. In addition to probes targeting transcripts, negative and other control probes were
placed randomly on the array using Agilent’s P. falciparum expression array control grid.
Further information about the probe counts and distribution of probes across the genome is
provided in S1 Methods.
Parasite cultures and RNA extraction
The P. falciparum laboratory clone HB3 was grown using standard protocols [47]. Cultures
obtained from a single parasite thaw were grown in replicates at 37˚C and 5% hematocrit in
O+ human red blood cells using RPMI 1640 (Invitrogen, Carlsbad, CA) supplemented with
0.5% Albumax I (Invitrogen, Carlsbad, CA), 0.25% sodium bicarbonate (Mediatech, Inc.,
Manassas, VA) and 0.01 mg ml-1 gentamicin (Invitrogen, Carlsbad, CA) under an atmosphere
of 90% nitrogen, 5% oxygen, and 5% carbon dioxide. Cultures were synchronized using 5%
sorbitol. Harvesting of cultures for RNA samples was performed at 12, 24, 36 and 48 hours
post-invasion. Total RNA was extracted from 20mls of culture using TriZol reagent (Invitro-
gen, Carlsbad, CA) as described previously [48]. Quality and quantity of RNA was determined
using Nanodrop (NanoDrop Technologies).
Expression and transcription profiling in the human malaria parasite
PLOS ONE | https://doi.org/10.1371/journal.pone.0187595 November 7, 2017 13 / 20
cDNA synthesis, labeling and hybridization
300ηg of RNA was used as starting material for cDNA synthesis using the Sigma WTA2 whole
transcriptome amplification kit as previously described [17].
1μg of cDNA was labeled with Cy3 dye using 65% AT rich pre-labeled random hexamers as
primers for cDNA synthesis by Klenow fragment of DNA polymerase I. Hybridizations on the
Nimblegen array were performed for 18 hours followed by washing of the arrays as described
according to standard protocol (Roche NimbleGen Inc., Madison, WI). The microarray image
was obtained using a 2μM scanner and probe intensity values extracted using NimbleScan soft-
ware (Roche NimbleGen Inc., Madison, WI). For the Agilent HD exon array, hybridizations
were performed for 17 hours. Images were obtained on the same 2uM scanner and probe
intensity values extracted using Agilent Feature Extraction software.
Gene expression analysis
Probe intensities were normalized using robust multichip average (RMA) method [49]. Nor-
malization was performed across all samples hybridized on a single chip. Exon signal intensity
for each gene was obtained by averaging the intensities of all probes within each exon. To
determine a significance threshold for exon expression levels, a background distribution of sig-
nal intensities from a set of negative control probes (10,000 probes on the Nimblegen exon
array and 1,000 on the Agilent HD exon array) with no sequence matches to the P. falciparumgenome was generated. A threshold corresponding to the 95th percentile (5% FDR) of the sig-
nal distribution of the negative control probes was then applied [27]. To determine gene
expression levels, exons that passed the 5% significance threshold were subjected to an addi-
tional threshold derived from intensities of 1,000 simulated exons each consisting of 20 ran-
domly sampled negative control probes. Intensities of exons that passed a 5% FDR based on
this background distribution were averaged to obtain a gene expression average. More details
are provided in the supplementary material. ncRNAs that showed high variation of fold-
change� 2 between replicates were excluded.
Determination of concordance between platforms
Concordance between platforms was evaluated by comparing lists of differentially expressed
genes obtained from each platform using replicates at 12 and 36 hour post-invasion. Genes
with log2 ratio� 2 or� -2 (4-fold change) between 12 vs. 36 hpi samples were regarded as up-
regulated and down-regulated, respectively.
The platforms were further compared using gene set enrichment analysis (GSEA) [32,50];
GSEA used ranked information to compare gene lists from independent studies. Given a
query gene list ordered by confidence and a second rank ordered list of all genes (i.e. the gene
set), GSEA represents the likelihood of finding the entries in the gene set at the top of the
query list. For GSEA, four query lists were first constructed: up-regulated and down-regulated
genes from the previously published Agilent 15K array, and up-regulated and down-regulated
genes from the newly designed Agilent HD exon array. Genes from the Nimblegen exon array
were sorted in descending order (from the most up-regulated to the most down-regulated) to
make up the rank ordered gene set. The Broad GSEA online software was then used to query
the gene lists from the both Agilent platform arrays against the ranked Nimblegen gene set.
Transcript isoform analysis
Exon intensities meeting the 5% FDR criterion described above were considered for transcript
isoform analysis. Alternative splicing was then estimated using two indices: i) normalized gene
Expression and transcription profiling in the human malaria parasite
PLOS ONE | https://doi.org/10.1371/journal.pone.0187595 November 7, 2017 14 / 20
index (NI); and splicing index (SI), which have been used in transcript isoform analysis in
Affymetrix exon arrays [51] where:
Normalized Gene Index; NI ¼Exon Level ExpressionGene Level Expression
ð1Þ
Splicing Index ¼ log2Sample 1 NISample 2 NI
� �
ð2Þ
An exon was considered to be alternatively spliced if the splicing index was� 2 (indicating
the exon is spliced out in the reference sample, sample 2) or� -2 (exon spliced out in the tar-
get, sample 1). Exons whose expression was not detected in at least 2 replicates were excluded
from the analysis.
Alternatively spliced exons were compared to those from RNA-seq studies [24, 25] using a
hypergeometric test to determine the statistical significance of the overlaps of alternatively
spliced exons detected by the exon array vs. RNA-seq based on the total number of genes in
the genome containing multiple exons (N = 2781) [52]. Alternatively spliced exons were
scanned for domains using PSSMs from the Conserved Domain Database [38] implemented
in CD-Search [53].
Agilent 15K array hybridization and data analysis
RNA obtained as described above at 12 and 36 hpi was prepared for hybridization using a val-
idated protocol for cDNA synthesis from Dr. Manuel Llinas’ lab [20]. Labeling was per-
formed using single strand aminoallyl-containing cDNA synthesis and Amersham CyDye
coupling (GE Healthcare, Piscataway, NJ, USA). cDNA for the two developmental stages was
labeled using Cy5 and hybridized to an equal amount of Cy3-labeled cDNA reference pool
obtained from equal amounts of rings, trophozoites and schizonts. Hybridization was per-
formed on printed 8 X 15K arrays ordered from Agilent (Agilent Technologies, Santa Clara,
CA, USA) for 16 hours in a rotating hybridization oven (10 rpm) at 65˚C. Arrays were
scanned using Agilent G25OB Microarray Scanner at 5 μm resolution at wavelengths of
532ηm (Cy3) and 633ηm (Cy5) using the extended dynamic range setting (10–100%). Nor-
malized signal intensities were extracted using Agilent feature Extractor Software Version 9.5
and further analysis performed on the Princeton University Microarray Database (PUMA.
princeton.edu).
Determining optimum number of probes
Data from the Nimblegen exon array was used to determine the optimum number of probes
per gene that should be included on the Agilent HD exon array. Of the total probes on the
Nimblegen array, the signal was averaged across probes selected in randomly generated even-
numbered subsets of the total number of probes per gene ranging from subsets of 2 probes to
20 probes per gene. The average signal intensity for one subset of each number (2, 4, 6 . . .20)
was generated for each gene in the genome. These randomly generated subsets were then cor-
related to the average signal intensity of all probes per gene on the array.
Supporting information
S1 Table. Comparison of up-regulated genes on the Nimblegen, Agilent HD exon, and Agi-
lent 15K arrays. All genes that were up-regulated on any array are represented in column A.
Expression and transcription profiling in the human malaria parasite
PLOS ONE | https://doi.org/10.1371/journal.pone.0187595 November 7, 2017 15 / 20
The “X” symbol is used to indicate in which array and replicate the gene was found to be up-
regulated.
(CSV)
S2 Table. Comparison of down-regulated genes on the Nimblegen, Agilent HD exon, and
Agilent 15K arrays. All genes that were down-regulated on any array are represented in col-
umn A. The “X” symbol is used to indicate in which array and replicate the gene was found to
be down-regulated.
(CSV)
S3 Table. Comparison of ncRNA detected on the Nimblegen and Agilent HD exon arrays,
and via Northern blot. The Gene ID for each ncRNA is provided in column A and the RNA-
z_ID in column B. The “X” symbol indicates whether the ncRNA was detected on the arrays
or by Northern blot [18]. The sequence of the ncRNA is also listed.
(XLSX)
S4 Table. Differential expression of ncRNAs detected on the Agilent HD exon array. The
Gene ID for each ncRNA is provided in column A and the RNAz_ID in column B. The nor-
malized fluorescent intensity values of each differentially expressed ncRNA at the correspond-
ing time point for HB3 is provided in columns C-F, and the differential expression between
time points are represented as log2 ratios in columns G-L.
(XLSX)
S5 Table. Alternative splicing events identified on the Agilent HD exon array and compari-
son to RNA-seq studies. The Gene ID and exon number are given in columns A and B. Super-
family IDs and any conserved protein domains identified in the CDSS search are given in
columns C and D. The PlasmoDB description of the gene is listed in column E. Averaged nor-
malized fluorescent intensity values per exon on the Agilent HD array at the indicated time
point are provided in columns F-I, and the averaged intensity for all probes within the entire
gene are listed in columns K-M. NI values for the time point are given in N-Q, and SI values
are in columns R-W as described in the supplement. Columns X—AA indicate by the “X”
which other references or arrays detected alternative splicing.
(XLSX)
S1 Fig. Distribution of probes throughout the transcriptome. Histogram distributions for
the number of probes per gene (A and B) and base pair distance between probes (C and D) on
the Nimblegen exon and Agilent HD exon array.
(TIF)
S2 Fig. Signal intensity is consistent among exons within a transcript. The relationship
between the signal intensity for annotated exons and the location of the exons within the gene
demonstrates that the signal distribution of hybridized samples is on average of similar inten-
sity from the most 50 exon (exon 1) to the most 30 exon (exon 5).
(TIF)
S3 Fig. Effect of probe sequence on hybridization signal intensity. (A) Correlation between
the frequency of each dinucleotide and the observed signal intensity of a probe.1st base refers
to the first nucleotide in the dinucleotide considered and second base to the second nucleotide
in the same dinucleotide. (B) Correlation between the actual signal intensity of a set of probes
to their predicted intensity based on a linear model of dinucleotides constructed from inde-
pendent set of probes. The predictability of signal intensity from probe sequence alone
(r = 0.56) signifies that the measurement of gene expression from a single probe cannot
Expression and transcription profiling in the human malaria parasite
PLOS ONE | https://doi.org/10.1371/journal.pone.0187595 November 7, 2017 16 / 20
adequately be predicted from the during the design process. Robust gene expression measure-
ments require expression level of a single gene to be determined from multiple independent
probes.
(TIF)
S1 Methods. Supplementary methodology and rationale for high density gene expression
array designs. Processes and rationale for unbiased cDNA synthesis, and balanced design
using sequence dependent hybridizing probes, along with more in depth technical explana-
tions of the gene expression and transcript isoform analyses are described.
(DOCX)
Acknowledgments
LBT, GHS, and KAB were supported by Eck Institute for Global Health Fellowships.
This project was supported by the Indiana Clinical and Translational Sciences Institute
funded, in part by Award Number UL1TR001108 from the National Institutes of Health,
National Center for Advancing Translational Sciences, Clinical and Translational Sciences
Award and with support from the Center for Quantitative Biology (P50 GM071508) (ML).
The content is solely the responsibility of the authors and does not necessarily represent the
official views of the National Institutes of Health. Neither IBM Research Africa nor Illumina
provided financial or salary support for the associated authors GHS and AT. The specific roles
of these authors are articulated in the ‘author contributions’ section. Neither has commercial
affiliation or any intellectual, commercial, or ownership rights over the products or ideas pre-
sented in this manuscript.
Author Contributions
Conceptualization: Lindsey B. Turnbull, Geoffrey H. Siwo, Katrina A. Button-Simons,
Michael T. Ferdig.
Data curation: Lindsey B. Turnbull, Geoffrey H. Siwo, Katrina A. Button-Simons, Asako Tan.
Formal analysis: Lindsey B. Turnbull, Geoffrey H. Siwo, Katrina A. Button-Simons.
Funding acquisition: Lindsey B. Turnbull, Manuel Llinas, Michael T. Ferdig.
Investigation: Lindsey B. Turnbull, Geoffrey H. Siwo, Katrina A. Button-Simons, Lisa A.
Checkley, Heather J. Painter.
Methodology: Lindsey B. Turnbull, Geoffrey H. Siwo, Katrina A. Button-Simons, Lisa A.
Checkley.
Resources: Manuel Llinas.
Software: Geoffrey H. Siwo, Katrina A. Button-Simons, Asako Tan, Heather J. Painter.
Validation: Lindsey B. Turnbull, Geoffrey H. Siwo, Katrina A. Button-Simons.
Visualization: Geoffrey H. Siwo, Katrina A. Button-Simons.
Writing – original draft: Lindsey B. Turnbull, Geoffrey H. Siwo, Katrina A. Button-Simons,
Michael T. Ferdig.
Writing – review & editing: Lindsey B. Turnbull, Geoffrey H. Siwo, Katrina A. Button-
Simons, Lisa A. Checkley, Heather J. Painter, Manuel Llinas, Michael T. Ferdig.
Expression and transcription profiling in the human malaria parasite
PLOS ONE | https://doi.org/10.1371/journal.pone.0187595 November 7, 2017 17 / 20
References1. Su Z, Fang H, Hong H, Shi L, Zhang W, Zhang W, et al. An investigation of biomarkers derived from leg-
acy microarray data for their utility in the RNA-seq era. Genome Biol. 2014; 15: 3273.
2. Malone JH, Oliver B. Microarrays, deep sequencing and the true measure of the transcriptome. BMC
biology. 2011; 9: 34. https://doi.org/10.1186/1741-7007-9-34 PMID: 21627854
3. Lei R, Ye K, Gu Z, Sun X. Diminishing returns in next-generation sequencing (NGS) transcriptome data.
Gene. 2015; 557: 82–87. https://doi.org/10.1016/j.gene.2014.12.013 PMID: 25497830
4. Tarazona S, Garcia-Alcalde F, Dopazo J, Ferrer A, Conesa A. Differential expression in RNA-seq: a
matter of depth. Genome Res. 2011; 21: 2213–2223. https://doi.org/10.1101/gr.124321.111 PMID:
21903743
5. Bozdech Z, Llinas M, Pulliam BL, Wong ED, Zhu J, DeRisi JL. The transcriptome of the intraerythrocytic
developmental cycle of Plasmodium falciparum. PLoS Biol. 2003; 1: E5. https://doi.org/10.1371/journal.
pbio.0000005 PMID: 12929205
6. Llinas M, DeRisi JL. Pernicious plans revealed: Plasmodium falciparum genome wide expression analy-
sis. Curr Opin Microbiol. 2004; 7: 382–387. https://doi.org/10.1016/j.mib.2004.06.014 PMID: 15358256
7. Llinas M, Bozdech Z, Wong E, Adai A, DeRisi J. Comparative whole genome transcriptome analysis of
three Plasmodium falciparum strains. Nucleic Acids Res. 2006; 34: 1166–1173. https://doi.org/10.1093/
nar/gkj517 PMID: 16493140
8. Gonzales JM, Patel JJ, Ponmee N, Jiang L, Tan A, Maher SP, et al. Regulatory hotspots in the malaria
parasite genome dictate transcriptional variation. PLoS Biol. 2008; 6: e238. https://doi.org/10.1371/
journal.pbio.0060238 PMID: 18828674
9. Tamez PA, Bhattacharjee S, van Ooij C, Hiller NL, Llinas M, Balu B, et al. An erythrocyte vesicle protein
exported by the malaria parasite promotes tubovesicular lipid import from the host cell surface. PLoS
Pathog. 2008; 4: e1000118. https://doi.org/10.1371/journal.ppat.1000118 PMID: 18688278
10. van Brummelen AC, Olszewski KL, Wilinski D, Llinas M, Louw AI, Birkholtz LM. Co-inhibition of Plasmo-
dium falciparum S-adenosylmethionine decarboxylase/ornithine decarboxylase reveals perturbation-
specific compensatory mechanisms by transcriptome, proteome, and metabolome analyses. J Biol
Chem. 2009; 284: 4635–4646. https://doi.org/10.1074/jbc.M807085200 PMID: 19073607
11. Hu G, Cabrera A, Kono M, Mok S, Chaal BK, Haase S, et al. Transcriptional profiling of growth perturba-
tions of the human malaria parasite Plasmodium falciparum. Nat Biotechnol. 2010; 28: 91–98. https://
doi.org/10.1038/nbt.1597 PMID: 20037583
12. Becker JV, Mtwisha L, Crampton BG, Stoychev S, van Brummelen AC, Reeksting S, et al. Plasmodium
falciparum spermidine synthase inhibition results in unique perturbation-specific effects observed on
transcript, protein and metabolite levels. BMC Genomics. 2010; 11: 235. https://doi.org/10.1186/1471-
2164-11-235 PMID: 20385001
13. Daily J, Scanfeld D, Pochet N, Le Roch K, Plouffe D, Kamal M, et al. Distinct physiological states of
Plasmodium falciparum in malaria-infected patients. Nature. 2007; 450: 1091–1095. https://doi.org/10.
1038/nature06311 PMID: 18046333
14. Wirth D, Daily J, Winzeler E, Mesirov JP, Regev A. In vivo profiles in malaria are consistent with a novel
physiological state. Proc Natl Acad Sci U S A. 2009; 106: E70. https://doi.org/10.1073/pnas.
0904478106 PMID: 19570993
15. Siwo GH, Tan A, Button-Simons KA, Samarakoon U, Checkley LA, Pinapati RS, et al. Predicting func-
tional and regulatory divergence of a drug resistance transporter gene in the human malaria parasite.
BMC Genomics. 2015; 16: 115. https://doi.org/10.1186/s12864-015-1261-6 PMID: 25765049
16. Le Roch KG, Zhou Y, Blair PL, Grainger M, Moch JK, Haynes JD, et al. Discovery of gene function by
expression profiling of the malaria parasite life cycle. Science. 2003; 301: 1503–1508. https://doi.org/
10.1126/science.1087025 PMID: 12893887
17. Siwo GH, Smith RS, Tan A, Button-Simons KA, Checkley LA, Ferdig MT. An integrative analysis of
small molecule transcriptional responses in the human malaria parasite Plasmodium falciparum. BMC
Genomics. 2015; 16: 1030. https://doi.org/10.1186/s12864-015-2165-1 PMID: 26637195
18. Mourier T, Carret C, Kyes S, Christodoulou Z, Gardner PP, Jeffares DC, et al. Genome-wide discovery
and verification of novel structured RNAs in Plasmodium falciparum. Genome Res. 2008; 18: 281–292.
https://doi.org/10.1101/gr.6836108 PMID: 18096748
19. Kafsack BF, Painter HJ, Llinas M. New Agilent platform DNA microarrays for transcriptome analysis of
Plasmodium falciparum and Plasmodium berghei for the malaria research community. Malaria journal.
2012; 11: 187. https://doi.org/10.1186/1475-2875-11-187 PMID: 22681930
20. Painter HJ, Altenhofen LM, Kafsack BF, Llinas M. Whole-genome analysis of Plasmodium spp. Utilizing
a new agilent technologies DNA microarray platform. Methods Mol Biol. 2013; 923: 213–219. https://
doi.org/10.1007/978-1-62703-026-7_14 PMID: 22990780
Expression and transcription profiling in the human malaria parasite
PLOS ONE | https://doi.org/10.1371/journal.pone.0187595 November 7, 2017 18 / 20
21. Chou CC, Chen CH, Lee TT, Peck K. Optimization of probe length and the number of probes per gene
for optimal microarray analysis of gene expression. Nucleic Acids Res. 2004; 32: e99. https://doi.org/
10.1093/nar/gnh099 PMID: 15243142
22. Shi L, Reid LH, Jones WD, Shippy R, Warrington JA, Baker SC, et al. The MicroArray Quality Control
(MAQC) project shows inter-and intraplatform reproducibility of gene expression measurements. Nat
Biotechnol. 2006; 24: 1151–1161. https://doi.org/10.1038/nbt1239 PMID: 16964229
23. Gardner MJ, Hall N, Fung E, White O, Berriman M, Hyman RW, et al. Genome sequence of the human
malaria parasite Plasmodium falciparum. Nature. 2002; 419: 498–511. https://doi.org/10.1038/
nature01097 PMID: 12368864
24. Sorber K, Dimon MT, DeRisi JL. RNA-Seq analysis of splicing in Plasmodium falciparum uncovers new
splice junctions, alternative splicing and splicing of antisense transcripts. Nucleic Acids Res. 2011; 39:
3820–3835. https://doi.org/10.1093/nar/gkq1223 PMID: 21245033
25. Otto TD, Wilinski D, Assefa S, Keane TM, Sarry LR, Bohme U, et al. New insights into the blood-stage
transcriptome of Plasmodium falciparum using RNA-Seq. Mol Microbiol. 2010; 76: 12–24. https://doi.
org/10.1111/j.1365-2958.2009.07026.x PMID: 20141604
26. Iriko H, Jin L, Kaneko O, Takeo S, Han E, Tachibana M, et al. A small-scale systematic analysis of alter-
native splicing in Plasmodium falciparum. Parasitol Int. 2009; 58: 196–199. https://doi.org/10.1016/j.
parint.2009.02.002 PMID: 19268714
27. Clark TA, Schweitzer AC, Chen TX, Staples MK, Lu G, Wang H, et al. Discovery of tissue-specific
exons using comprehensive human exon microarrays. Genome Biol. 2007; 8: R64. https://doi.org/10.
1186/gb-2007-8-4-r64 PMID: 17456239
28. Kwan T, Benovoy D, Dias C, Gurd S, Provencher C, Beaulieu P, et al. Genome-wide analysis of tran-
script isoform variation in humans. Nat Genet. 2008; 40: 225–231. https://doi.org/10.1038/ng.2007.57
PMID: 18193047
29. Kwan T, Benovoy D, Dias C, Gurd S, Serre D, Zuzan H, et al. Heritability of alternative splicing in the
human genome. Genome Res. 2007; 17: 1210–1218. https://doi.org/10.1101/gr.6281007 PMID:
17671095
30. Hu G, Llinas M, Li J, Rainer P, Bozdech Z. Selection of long oligonucleotides for gene expression micro-
arrays using weighted rank-sum strategy. BMC BioInformatics. 2007; 8.
31. Subudhi AK, Boopathi P, Middha S, Acharya J, Rao SN, Mugasimangalam RC, et al. A cross strain
Plasmodium falciparum microarray optimized for the transcriptome analysis of Plasmodium falciparum
patient derived isolates. Genomics Data. 2016; 9: 118–125. https://doi.org/10.1016/j.gdata.2016.07.
006 PMID: 27489776
32. Carninci P, Kasukawa T, Katayama S, Gough J, Frith MC, Maeda N, et al. The transcriptional landscape
of the mammalian genome. Science. 2005; 309: 1559–1563. https://doi.org/10.1126/science.1112014
PMID: 16141072
33. Bemmo A, Benovoy D, Kwan T, Gaffney DJ, Jensen RV, Majewski J. Gene expression and isoform var-
iation analysis using Affymetrix Exon Arrays. BMC Genomics. 2008; 9: 529. https://doi.org/10.1186/
1471-2164-9-529 PMID: 18990248
34. Ha KC, Coulombe-Huntington J, Majewski J. Comparison of Affymetrix Gene Array with the Exon Array
shows potential application for detection of transcript isoform variation. BMC Genomics. 2009; 10: 519-
2164-10-519. https://doi.org/10.1186/1471-2164-10-519 PMID: 19909511
35. Broadbent KM, Park D, Wolf AR, Van Tyne D, Sims JS, Ribacke U, et al. A global transcriptional analy-
sis of Plasmodium falciparum malaria reveals a novel family of telomere-associated lncRNAs. Genome
Biol. 2011; 12: R56. https://doi.org/10.1186/gb-2011-12-6-r56 PMID: 21689454
36. Lopez-Barragan MJ, Lemieux J, Quiñones M, Williamson KC, Molina-Cruz A, Cui K, et al. Directional
gene expression and antisense transcripts in sexual and asexual stages of Plasmodium falciparum.
BMC Genomics. 2011; 12: 587. https://doi.org/10.1186/1471-2164-12-587 PMID: 22129310
37. Marchler-Bauer A, Lu S, Anderson JB, Chitsaz F, Derbyshire MK, DeWeese-Scott C, et al. CDD: a Con-
served Domain Database for the functional annotation of proteins. Nucleic Acids Res. 2011; 39: D225–
9. https://doi.org/10.1093/nar/gkq1189 PMID: 21109532
38. Hull R, Dlamini Z. The role played by alternative splicing in antigenic variability in human endo-parasites.
Parasit Vectors. 2014; 7: 53. https://doi.org/10.1186/1756-3305-7-53 PMID: 24472559
39. van Oort RJ, Altamirano J, Lederer WJ, Wehrens XH. Alternative splicing: a key mechanism for
ankyrin-B functional diversity? J Mol Cell Cardiol. 2008; 45: 709–711. https://doi.org/10.1016/j.yjmcc.
2008.08.016 PMID: 18838078
40. Agbavwe C, Somoza MM. Sequence-dependent fluorescence of cyanine dyes on microarrays. PLoS
One. 2011; 6: e22177. https://doi.org/10.1371/journal.pone.0022177 PMID: 21799789
Expression and transcription profiling in the human malaria parasite
PLOS ONE | https://doi.org/10.1371/journal.pone.0187595 November 7, 2017 19 / 20
41. Shock JL, Fischer KF, DeRisi JL. Whole-genome analysis of mRNA decay in Plasmodium falciparum
reveals a global lengthening of mRNA half-life during the intra-erythrocytic development cycle. Genome
Biol. 2007; 8: R134. https://doi.org/10.1186/gb-2007-8-7-r134 PMID: 17612404
42. Gardina PJ, Clark TA, Shimada B, Staples MK, Yang Q, Veitch J, et al. Alternative splicing and differ-
ential gene expression in colon cancer detected by a whole genome exon array. BMC Genomics.
2006; 7: 1.
43. Zhang W, Duan S, Bleibel WK, Wisel SA, Huang RS, Wu X, et al. Identification of common genetic vari-
ants that account for transcript isoform variation between human populations. Hum Genet. 2009; 125:
81–93. https://doi.org/10.1007/s00439-008-0601-x PMID: 19052777
44. Aurrecoechea C, Brestelli J, Brunk BP, Dommer J, Fischer S, Gajria B, et al. PlasmoDB: a functional
genomic database for malaria parasites. Nucleic Acids Res. 2009; 37: D539–43. https://doi.org/10.
1093/nar/gkn814 PMID: 18957442
45. King AJ, van Gorkom T, Pennings JL, van der Heide HG, He Q, Diavatopoulos D, et al. Comparative
genomic profiling of Dutch clinical Bordetella pertussis isolates using DNA microarrays: identification of
genes absent from epidemic strains. BMC Genomics. 2008; 9: 311. https://doi.org/10.1186/1471-2164-
9-311 PMID: 18590534
46. Trager W J J. Human malaria parasites in continuous culture. Science. 1976; 193: 673–675. PMID:
781840
47. Bozdech Z, Zhu J, Joachimiak MP, Cohen FE, Pulliam B, DeRisi JL. Expression profiling of the schizont
and trophozoite stages of Plasmodium falciparum with a long-oligonucleotide microarray. Genome Biol.
2003; 4: R9. https://doi.org/10.1186/gb-2003-4-2-r9 PMID: 12620119
48. Irizarry RA, Hobbs B, Collin F, Beazer-Barclay YD, Antonellis KJ, Scherf U, et al. Exploration, normali-
zation, and summaries of high density oligonucleotide array probe level data. Biostatistics. 2003; 4:
249–264. https://doi.org/10.1093/biostatistics/4.2.249 PMID: 12925520
49. Subramanian A, Tamayo P, Mootha VK, Mukherjee S, Ebert BL, Gillette MA, et al. Gene set enrichment
analysis: a knowledge-based approach for interpreting genome-wide expression profiles. Proceedings
of the National Academy of Sciences. 2005; 102: 15545–15550.
50. Mootha VK, Lindgren CM, Eriksson K, Subramanian A, Sihag S, Lehar J, et al. PGC-1α-responsive
genes involved in oxidative phosphorylation are coordinately downregulated in human diabetes. Nat
Genet. 2003; 34: 267–273. https://doi.org/10.1038/ng1180 PMID: 12808457
51. Chaal BK, Gupta AP, Wastuwidyaningtyas BD, Luah YH, Bozdech Z. Histone deacetylases play a
major role in the transcriptional regulation of the Plasmodium falciparum life cycle. PLoS Pathog. 2010;
6: e1000737. https://doi.org/10.1371/journal.ppat.1000737 PMID: 20107518
52. Johnson N.L., Kotz S., Kemp A.W. Univariate Discrete Distributions. 2nd ed. New York: Wiley; 1992.
53. Marchler-Bauer A, Bryant SH. CD-Search: protein domain annotations on the fly. Nucleic Acids Res.
2004; 32: W327–31. https://doi.org/10.1093/nar/gkh454 PMID: 15215404
Expression and transcription profiling in the human malaria parasite
PLOS ONE | https://doi.org/10.1371/journal.pone.0187595 November 7, 2017 20 / 20