since 1979 and its first report on the …the global competitiveness report 2014–2015 | 85 chapter...
TRANSCRIPT
The Global Competitiveness Report 2014–2015 | 85
CHAPTER 1.3
The Executive Opinion Survey: The Voice of the Business CommunityCIARA BROWNE
ATTILIO DI BATTISTA
THIERRY GEIGER
TANIA GUTKNECHT
World Economic Forum
Since 1979 and its first report on the competitiveness of European industry, the World Economic Forum’s annual survey has been a key ingredient of its research and benchmarking activities. The Executive Opinion Survey (the Survey) is the longest-running and most extensive survey of its kind. Box 1 retraces the history of this instrument, which is closely related to the history of the competitiveness report series. The Survey captures the opinions of business leaders around the world on a broad range of topics for which data sources are scarce or, frequently, nonexistent on a global scale. It helps to capture aspects of a particular domain—such as the extent of the skills gap, the level of corruption, or the intensity of market competition—that are more qualitative than hard data can provide. Thus it is an indispensable complement to the sources of data made available by international organizations and national statistical offices.
The indicators derived from the Survey are used in the calculation of the Global Competitiveness Index (GCI) and other Forum indexes, including the Networked Readiness Index, the Enabling Trade Index, the Travel & Tourism Competitiveness Index, and the Gender Gap Index, as well as in a number of regional studies.
A truly unique source of data, the Survey has also long been used by a number of international and nongovernmental organizations, think tanks, and academia for empirical and policy work. For example, Transparency International has been using the Survey data for the elaboration of their Corruption Perceptions Index and the Bribe Payers Index. Institutions such as the Organisation for Economic Co-operation and Development (OECD), the World Bank, and the International Monetary Fund (IMF) also refer to the Forum’s Survey data in their publications, as do a number of academic publications. Finally, an increasing number of countries publish national competitiveness reports that draw on or refer to the Survey data.
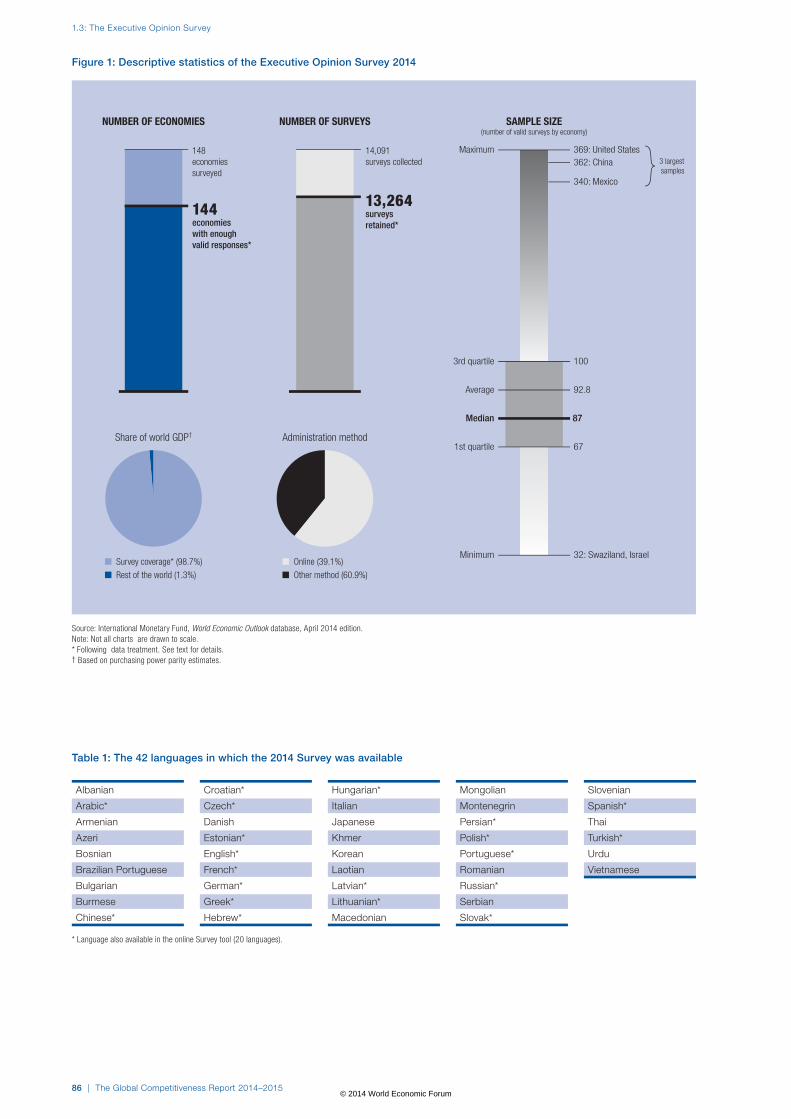
THE SURVEY IN NUMBERSThe 2014 edition of the Survey captured the opinions of over 14,000 business leaders in 148 economies between February and June 2014; because of data issues, out of the 148 economies surveyed, 144 are included in the GCI this year (please see the data treatment section below for further details). Figure 1 presents some key descriptive statistics. The Survey is available in 42 languages, of which 20 are available online (see Table 1). This year almost 40 percent of respondents took the Survey online. In 22 economies the Survey was administered entirely online, while in a further 16 over 90 percent of respondents completed the Survey online (see Table 2 for statistics about the administration approach).
Geographic coverageFollowing a year of non-inclusion, Tajikistan is reinstated in the 2014 edition; however, no new economy is added
© 2014 World Economic Forum
1.3: The Executive Opinion Survey
86 | The Global Competitiveness Report 2014–2015
Table 1: The 42 languages in which the 2014 Survey was available
Albanian
Arabic*
Armenian
Azeri
Bosnian
Brazilian Portuguese
Bulgarian
Burmese
Chinese*
Croatian*
Czech*
Danish
Estonian*
English*
French*
German*
Greek*
Hebrew*
Hungarian*
Italian
Japanese
Khmer
Korean
Laotian
Latvian*
Lithuanian*
Macedonian
Mongolian
Montenegrin
Persian*
Polish*
Portuguese*
Romanian
Russian*
Serbian
Slovak*
Slovenian
Spanish*
Thai
Turkish*
Urdu
Vietnamese
* Language also available in the online Survey tool (20 languages).
148 economies surveyed
Minimum 32: Swaziland, Israel
Maximum 369: United States362: China 3 largest
samples
340: Mexico
1st quartile 67
3rd quartile 100
Average 92.8
Median 87
Share of world GDP†
■ Survey coverage* (98.7%)
■ Rest of the world (1.3%)
Administration method
■ Online (39.1%)
■ Other method (60.9%)
144 economies with enough valid responses*
14,091surveys collected
NUMBER OF ECONOMIES NUMBER OF SURVEYS
Collected
13,264 surveys retained*
SAMPLE SIZE(number of valid surveys by economy)
Figure 1: Descriptive statistics of the Executive Opinion Survey 2014
Source: International Monetary Fund, World Economic Outlook database, April 2014 edition.Note: Not all charts are drawn to scale.* Following data treatment. See text for details.† Based on purchasing power parity estimates.
© 2014 World Economic Forum

The Global Competitiveness Report 2014–2015 | 87
1.3: The Executive Opinion Survey
this year. The Survey was not completed to minimum requirements in Benin, Brunei Darussalam, or Liberia, and therefore those countries could not be included this year. Furthermore, Bosnia and Herzegovina and Ecuador are not included in this edition of the Report because of data quality concerns (see “Trend analysis and exceptions” below for more detail). The Forum’s Global Competitiveness and Benchmarking Network continues its efforts to increase country coverage year on year.
SURVEY STRUCTURE, ADMINISTRATION, AND METHODOLOGYThe Survey is divided into 14 sections:
I. About Your CompanyII. Overall Perceptions of Your Economy
III. InfrastructureIV. Innovation and Technology InfrastructureV. Financial Environment
VI. Foreign Trade and InvestmentVII. Domestic Competition
VIII. Company Operations and StrategyIX. Government and Public InstitutionsX. Education and Human CapitalXI. Corruption, Ethics and Social
ResponsibilityXII. Travel & Tourism
XIII. EnvironmentXIV. Health
Most questions in the Survey ask respondents to evaluate, on a scale of 1 to 7, one particular aspect of their operating environment. At one end of the scale, 1 represents the worst possible situation; at the other end of the scale, 7 represents the best (see Box 2 for an example).
The administration of the Survey could not be carried out without the network of over 160 Partner Institutes worldwide. Partner Institutes are recognized research or academic institutes, business organizations, national competitiveness councils, or other established professional entities and, in some cases, survey consultancies, that have the network and capacity to reach out to the business community, are reputable organizations, and have a firm commitment to improving the competitiveness conditions of their economies. The full list of Partner Institutes can be found at the beginning of this Report.1
In administering the Survey, Partner Institutes are asked to follow detailed sampling guidelines to ensure that the sample of respondents is the most representative possible and is comparable across the globe and in a specific timeframe. The sampling guidelines have evolved over time and are based on best practices in the field of survey administration and on discussions with survey experts. The Survey sampling guidelines specify that the Partner Institute build a “sample frame”—that is, a list of potential business executives from small- and medium-sized enterprises and large companies—from the various
Figure 2: Country/economy coverage of the Executive Opinion Survey
n Previous coverage
n 2014 additions
© 2014 World Economic Forum

First component* Second component: 2014 edition*
Country/Economy Survey edition No. of respondents Weight (%)* No. of respondents Online (%) Weight (%)*
Albania 2013 81 45.3 79 — 54.7Algeria 2013 65 40.1 97 — 59.9Angola 2013 35 41.3 47 — 58.7Argentina 2013 122 47.0 104 100.0 53.0Armenia 2013 76 45.0 76 5.3 55.0Australia 2013 57 43.2 66 100.0 56.8Austria 2013 99 49.1 71 43.7 50.9Azerbaijan 2013 85 44.6 88 — 55.4Bahrain 2013 41 42.3 51 92.2 57.7Bangladesh 2013 71 44.1 76 1.3 55.9Barbados 2013 51 45.8 48 87.5 54.2Belgium 2013 86 48.7 64 100.0 51.3Bhutan 2013 85 46.9 73 — 53.1Bolivia 2013 74 40.1 110 100.0 59.9Botswana 2013 87 40.7 123 26.8 59.3Brazil 2013 98 43.1 114 98.2 56.9Bulgaria 2013 81 41.9 104 — 58.1Burkina Faso 2013 57 50.6 36 — 49.4Burundi 2013 110 47.0 94 — 53.0Cambodia 2013 93 47.0 79 — 53.0Cameroon 2013 81 44.8 82 — 55.2Canada 2013 133 51.4 79 96.2 48.6Cape Verde 2013 80 44.4 84 9.5 55.6Chad 2013 102 50.0 68 — 50.0Chile 2013 130 43.8 143 51.7 56.2Colombia 2013 204 47.9 162 59.9 52.1Costa Rica 2013 110 52.5 59 98.3 47.5Côte d'Ivoire 2013 81 45.8 76 — 54.2Croatia 2013 80 44.7 82 2.4 55.3Cyprus 2013 63 47.4 52 — 52.6Czech Republic 2013 50 39.7 77 100.0 60.3Denmark 2013 173 53.0 89 1.1 47.0Dominican Republic 2013 56 43.7 62 — 56.3Timor-Leste 2013 34 43.0 40 — 57.0Egypt 2013 60 38.8 100 — 61.3El Salvador 2013 44 43.7 49 100.0 56.3Estonia 2013 92 45.4 89 100.0 54.6Ethiopia 2013 98 44.7 100 — 55.3Finland 2013 40 42.5 49 100.0 57.5Macedonia, FYR 2013 82 45.6 78 — 54.4France 2013 80 35.2 184 80.4 64.8Gabon 2013 59 49.8 40 20.0 50.2Gambia, The 2013 76 43.6 85 — 56.4Georgia 2013 74 49.6 51 98.0 50.4Germany 2013 170 51.6 99 89.9 48.4Ghana 2013 70 41.5 93 4.3 58.5Greece 2013 91 45.9 85 91.8 54.1Guatemala 2013 86 45.4 83 1.2 54.6Guinea 2013 56 40.9 78 — 59.1Guyana 2013 92 47.9 73 — 52.1Haiti 2013 117 57.5 39 — 42.5Honduras 2013 55 36.9 108 — 63.1Hong Kong SAR 2013 60 44.4 63 65.1 55.6Hungary 2013 88 43.5 99 82.8 56.5Iceland 2013 91 45.9 85 100.0 54.1India 2013 85 34.4 211 0.9 65.6Indonesia 2013 87 44.6 90 — 55.4Iran, Islamic Rep. 2013 121 42.2 152 100.0 57.8Ireland 2013 55 45.7 52 100.0 54.3Israel 2013 60 52.6 32 100.0 47.4Italy 2013 85 44.7 87 1.1 55.3Jamaica 2013 61 49.9 41 — 50.1Japan 2013 115 52.1 64 6.3 47.9Jordan† 2012 156 48.6 117 — 51.4Kazakhstan 2013 107 43.2 124 10.5 56.8Kenya 2013 100 43.5 113 — 56.5Kuwait 2013 36 43.1 42 19.0 56.9Kyrgyz Republic 2013 101 45.5 97 — 54.5Lao PDR 2013 62 42.3 77 — 57.7Latvia 2013 97 47.2 81 100.0 52.8Lebanon 2013 39 44.7 40 97.5 55.3Lesotho 2013 97 46.6 85 — 53.4Libya 2013 63 50.6 40 15.0 49.4
Table 2: Executive Opinion Survey: Descriptive statistics and weightings
(Cont’d.)
1.3: The Executive Opinion Survey
88 | The Global Competitiveness Report 2014–2015© 2014 World Economic Forum

Table 2: Executive Opinion Survey: Descriptive statistics and weightings (cont’d.)
First component* Second component: 2014 edition*
Country/Economy Survey edition No. of respondents Weight (%)* No. of respondents Online (%) Weight (%)*
Lithuania 2013 141 44.6 146 60.3 55.4Luxembourg 2013 57 42.6 69 100.0 57.4Madagascar 2013 157 50.7 99 — 49.3Malawi 2013 55 44.3 58 22.4 55.7Malaysia 2013 106 46.2 96 43.8 53.8Mali 2013 94 46.3 85 — 53.7Malta 2013 42 42.3 52 82.7 57.7Mauritania 2013 88 43.7 98 — 56.3Mauritius 2013 77 48.9 56 96.4 51.1Mexico 2013 320 44.2 340 97.1 55.8Moldova 2013 122 43.8 134 — 56.2Mongolia 2013 86 45.7 81 — 54.3Morocco 2013 82 51.8 47 80.9 48.2Mozambique 2013 87 42.4 107 0.9 57.6Myanmar 2013 79 43.9 86 1.2 56.1Namibia 2013 79 45.3 77 — 54.7Nepal 2013 93 46.3 84 1.2 53.7Netherlands 2013 87 44.9 88 97.7 55.1New Zealand 2013 37 43.7 41 100.0 56.3Nicaragua 2013 69 52.9 36 91.7 47.1Nigeria 2013 109 45.3 106 1.9 54.7Norway 2013 68 42.1 86 100.0 57.9Oman† 2012 78 42.5 95 31.6 57.5Pakistan 2013 130 54.9 56 21.4 45.1Panama 2013 130 44.9 131 38.9 55.1Paraguay 2013 58 44.8 59 — 55.2China 2013 364 45.1 362 0.3 54.9Peru 2013 79 44.1 85 42.4 55.9Philippines 2013 95 42.1 120 — 57.9Poland 2013 208 45.5 200 98.0 54.5Portugal 2013 100 40.8 140 76.4 59.2Puerto Rico 2013 57 46.4 51 100.0 53.6Qatar 2013 106 45.4 103 5.8 54.6Korea, Rep. 2013 81 42.4 100 — 57.6Montenegro 2013 78 42.5 95 — 57.5Serbia 2013 100 45.0 100 — 55.0Romania 2013 103 49.4 72 — 50.6Russian Federation 2013 294 45.8 276 0.4 54.2Rwanda‡ 2013 81 100.0 n/a n/a n/aSaudi Arabia 2013 139 41.7 181 72.4 58.3Senegal 2013 98 44.7 100 — 55.3Seychelles 2013 31 36.5 63 — 63.5Sierra Leone 2013 99 45.9 92 — 54.1Singapore 2013 150 44.0 163 60.7 56.0Slovak Republic 2013 114 48.6 85 84.7 51.4Slovenia 2013 98 46.9 84 1.2 53.1South Africa 2013 47 42.4 58 96.6 57.6Spain 2013 84 46.3 76 75.0 53.8Sri Lanka 2013 100 45.4 97 — 54.6Suriname 2013 50 49.1 36 100.0 50.9Swaziland 2013 32 45.0 32 31.3 55.0Sweden 2013 45 41.0 62 98.4 59.0Switzerland 2013 71 44.7 73 100.0 55.3Taiwan, China 2013 71 43.1 83 37.3 56.9Tajikistan‡‡ — — — 97 — 100.0Tanzania 2013 92 44.5 96 — 55.5Thailand 2013 86 43.0 101 99.0 57.0Trinidad and Tobago 2013 132 42.2 165 99.4 57.8Tunisia 2013 84 44.9 85 76.5 55.1Turkey 2013 94 45.8 88 47.7 54.2Uganda 2013 93 45.4 90 — 54.6Ukraine 2013 108 45.4 105 1.0 54.6United Arab Emirates† 2012 169 45.9 157 21.0 54.1United Kingdom 2013 118 49.9 79 100.0 50.1United States 2013 598 50.9 369 100.0 49.1Uruguay 2013 92 44.1 99 46.5 55.9Venezuela 2013 54 48.7 40 100.0 51.3Vietnam 2013 109 46.7 95 7.4 53.3Yemen 2013 72 48.8 53 — 51.2Zambia 2013 85 48.0 67 — 52.0Zimbabwe 2013 57 47.7 46 56.5 52.3
Grand total/average 13,264 39.1
Notes: Bold typeface identifies economies where the Survey was conducted entirely online. All statistics were computed following the edition of the data. See text for details. Survey edition(s) used for the computation of economy scores: † 2012 and 2014; ‡ 2013; ‡‡ 2014. See Box 2 for details about exceptions. * Weight applied to the country score in that edition of the Survey. See Box 4 for details.
The Global Competitiveness Report 2014–2015 | 89
1.3: The Executive Opinion Survey
© 2014 World Economic Forum
1.3: The Executive Opinion Survey
90 | The Global Competitiveness Report 2014–2015
administered in a variety of formats, including face-to-face or telephone interviews with business executives, mailed paper forms, and online surveys. For energy, time, and cost considerations, the Forum encourages the use of the online survey tool. However, deciding which of these differing methodologies to use may be based on the particular country’s infrastructure, distance between cities, cultural preferences, and other such issues.
The Partner Institutes also play an active and essential role in disseminating the findings of The Global Competitiveness Report and other reports published by The Global Competitiveness and Benchmarking Network by holding press events and workshops to highlight the results at the national level to the business community, the public sector, and other stakeholders.
Striving for excellenceThe Global Competitiveness and Benchmarking Network has, over the years, always given great importance to reflecting the newest thinking in matters of development and measurement of economic growth as well as to applying surveying best practices. To this end, it has
sectors of activity, as detailed below. It then applies a dual stratification procedure based on these two criteria of company size and sector. Specifically, the Partner Institutes are asked to carry out the following steps:
1. Prepare a “sample frame,” or large list of potential respondents, which includes firms representing the main sectors of the economy (agriculture, manufacturing industry, non-manufacturing industry, and services).
2. Separate the frame into two lists: one that includes only large firms, and a second list that includes all other firms (both lists representing the various economic sectors).2
3. Based on these lists, and in view of reducing survey bias, choose a random selection of these firms from both lists to receive the Survey.
Furthermore, the sampling guidelines specify that the Partner Institute should aim to collect a combination of random respondents with some repeat respondents for further comparative analysis.3 The Survey is
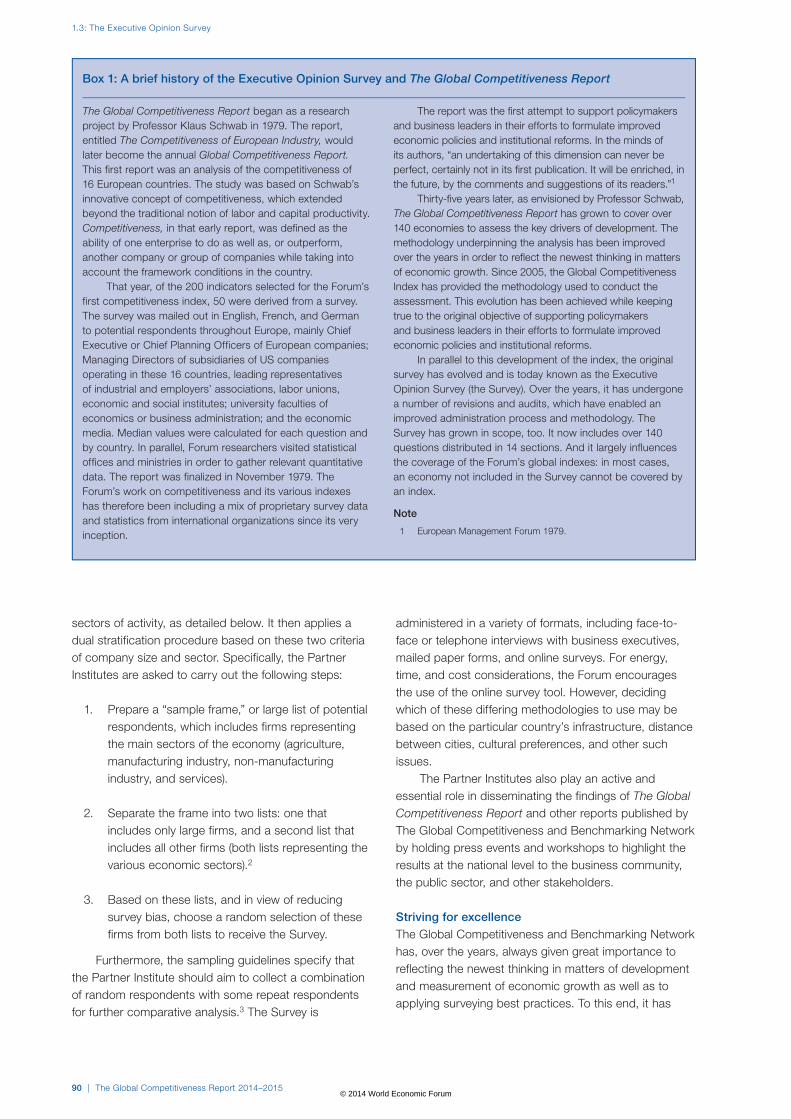
Box 1: A brief history of the Executive Opinion Survey and The Global Competitiveness Report
The Global Competitiveness Report began as a research project by Professor Klaus Schwab in 1979. The report, entitled The Competitiveness of European Industry, would later become the annual Global Competitiveness Report. This first report was an analysis of the competitiveness of 16 European countries. The study was based on Schwab’s innovative concept of competitiveness, which extended beyond the traditional notion of labor and capital productivity. Competitiveness, in that early report, was defined as the ability of one enterprise to do as well as, or outperform, another company or group of companies while taking into account the framework conditions in the country.
That year, of the 200 indicators selected for the Forum’s first competitiveness index, 50 were derived from a survey. The survey was mailed out in English, French, and German to potential respondents throughout Europe, mainly Chief Executive or Chief Planning Officers of European companies; Managing Directors of subsidiaries of US companies operating in these 16 countries, leading representatives of industrial and employers’ associations, labor unions, economic and social institutes; university faculties of economics or business administration; and the economic media. Median values were calculated for each question and by country. In parallel, Forum researchers visited statistical offices and ministries in order to gather relevant quantitative data. The report was finalized in November 1979. The Forum’s work on competitiveness and its various indexes has therefore been including a mix of proprietary survey data and statistics from international organizations since its very inception.
The report was the first attempt to support policymakers and business leaders in their efforts to formulate improved economic policies and institutional reforms. In the minds of its authors, “an undertaking of this dimension can never be perfect, certainly not in its first publication. It will be enriched, in the future, by the comments and suggestions of its readers.”1
Thirty-five years later, as envisioned by Professor Schwab, The Global Competitiveness Report has grown to cover over 140 economies to assess the key drivers of development. The methodology underpinning the analysis has been improved over the years in order to reflect the newest thinking in matters of economic growth. Since 2005, the Global Competitiveness Index has provided the methodology used to conduct the assessment. This evolution has been achieved while keeping true to the original objective of supporting policymakers and business leaders in their efforts to formulate improved economic policies and institutional reforms.
In parallel to this development of the index, the original survey has evolved and is today known as the Executive Opinion Survey (the Survey). Over the years, it has undergone a number of revisions and audits, which have enabled an improved administration process and methodology. The Survey has grown in scope, too. It now includes over 140 questions distributed in 14 sections. And it largely influences the coverage of the Forum’s global indexes: in most cases, an economy not included in the Survey cannot be covered by an index.
Note
1 European Management Forum 1979.
© 2014 World Economic Forum

The Global Competitiveness Report 2014–2015 | 91
1.3: The Executive Opinion Survey
undertaken two audits since 2008 as well as yearly reviews of both the Index and the Survey.
An initial external audit by a team of survey experts from Gallup was performed in 2008. Four years after implementing the recommendations from the first audit, a second audit was conducted in 2012 by Gallup. During this second audit, the Survey instrument, the sampling guidelines, and the administration process underwent a thorough review. The review took a twofold approach, analyzing the recommendations and their impact on the process as well as keeping up to date on best practices in the field of surveying. Overall, the outcome of the review regarding the implementation of the 2008 recommendations was commendable; the review determined that the Executive Opinion Survey process followed best practices and made the improvements noted in both the Survey tool and translations as well as in sampling quality. Box 3 presents some statistics about the Survey’s demographics and reveals that the sample of respondents is very diverse.
The 2012 audit addressed an important aspect related to the impact of national culture—the so-called cultural bias—that may impact interviewee responses. The Global Competitiveness and Benchmarking Network recognizes this as a possibility; nonetheless, following international best practices and upon Gallup’s recommendation, the Forum decided not to re-weight the data using vignettes because of the limited effectiveness of such a procedure and to prevent introducing additional noise into the data that occurs with such an approach.
In the context of the GCI revision (see Chapter 1.1), the Survey will undergo a full review in the Fall of 2014. Along with updating some questions, following expert recommendations, the Survey will be shortened and its terminology simplified.
With such ongoing efforts in the realm of survey administration best practice, the Global Competitiveness and Benchmarking Network team continues to improve processes to achieve greater data accuracy and heightened comparability across economies.
DATA TREATMENT AND SCORE COMPUTATIONThis section details the process whereby individual responses are edited and aggregated in order to produce the scores of each economy on each individual question of the Survey. These results, together with other indicators obtained from other sources, feed into the GCI and other research projects.4
Data editingPrior to aggregation, the respondent-level data are subjected to a thorough editing process. A first series of tests is run to identify and exclude those surveys whose patterns of answers demonstrate a lack of sufficient focus on the part of the respondents. Surveys with a
completion rate inferior to 50 percent are excluded.5 Surveys with straight answers (e.g., only 4s or only 1s) are also excluded. The very few cases of duplicate surveys—which can occur, for example, when a survey is both completed online and mailed in—are also excluded in this phase.
In a second step, a multivariate test is applied to the data using the Mahalanobis distance method. This test estimates the probability that an individual survey in a specific country “belongs” to the sample of that country by comparing the pattern of answers of that survey against the average pattern of answers in the country sample.
More specifically, the Mahalonobis distance test estimates the likelihood that one particular point of N dimensions belongs to a set of such points. One single survey made up of N answers can be viewed as the point of N dimensions, while a particular country sample c is the set of points. The Mahalanobis distance is used to compute the probability that any individual survey i does not belong to the sample c. If the probability is high enough—we use 99.9 percent as the threshold—we conclude that the survey is a clear outlier and does not “belong” to the sample. The implementation of this test requires that the number of responses in a country be greater than the number of answers, N, used in the test. The test uses 52 questions, selected by their relevance and placement in the Survey instrument.
A univariate outlier test is then applied at the country level for each question of each survey. We use
Box 2: Example of a typical Survey question
In your country, how strong is the protection of
intellectual property, including anti-counterfeiting
measures?
Extremely weak < 1 2 3 4 5 6 7 > Extremely strong
Circling 1 ... means you agree completely with the answer on the left-hand side
Circling 2 ... means you largely agree with the left- hand side
Circling 3 ... means you somewhat agree with the left- hand side
Circling 4 ... means your opinion is indifferent between the two answers
Circling 5 ... means you somewhat agree with the right- hand side
Circling 6 ... means you largely agree with the right-hand side
Circling 7 ... means you agree completely with the answer on the right-hand side
© 2014 World Economic Forum

1.3: The Executive Opinion Survey
92 | The Global Competitiveness Report 2014–2015
Box 3: Insights from the Executive Opinion Survey 2014
The respondents of the Executive Opinion Survey largely reflect the characteristics and diversity of the economic fabric of the countries covered. They also demonstrate the efforts undertaken by the Partner Institutes to follow the sampling guidelines. Figure 1 presents selected statistics about the Survey’s demographics.
Because small- and medium-sized enterprises (SMEs) account for a large share of economic activities in most countries, the Survey aims to collect the opinion of executives from those smaller companies (Figure 1a). Indeed, small enterprises, defined here as those with fewer than 50 employees, account for 27 percent of the sample in Advanced Economies and Emerging and Developing Asia and for 48 percent in Sub-Saharan Africa, also reflecting the respective economic structure of these regions. The Partner Institutes are asked to collect a mix of SMEs and large companies.
The Survey also aims to capture the diversity of companies in terms of ownership (Figure 1b). On average, 19 percent of the surveyed companies’ equity is owned by foreigners (as either minority or majority shareholders).
Further, the Survey sampling also aims to ensure the coverage of a variety of non-exporting and exporting companies (Figure 1c). Regular exporters (companies for which exports account for more than 50 percent of revenues) account for just 6 percent of the sample in the Commonwealth of Independent States and as much as 22 percent in Advanced Economies.
Finally, in alignment with the Forum’s sampling guidelines, approximately a third of the 2014 Survey respondents are “repeat” respondents—that is to say, they are executives who have previously taken part in the Survey (Figure 1d). This improves the comparability of data across years.
0 20 40 60 80 100
Sub-Saharan Africa
Middle East, North Africa,and Pakistan
Latin Americaand the Caribbean
Emerging andDeveloping Europe
Emerging andDeveloping Asia
Commonwealth ofIndependent States
Advanced economies
0 20 40 60 80 100
0 20 40 60 80 100
Sub-Saharan Africa
Middle East, North Africa,and Pakistan
Latin Americaand the Caribbean
Emerging andDeveloping Europe
Emerging andDeveloping Asia
Commonwealth ofIndependent States
Advanced economies
0 20 40 60 80 100
0 20 40 60 80 100
Sub-Saharan Africa
Middle East, North Africa,and Pakistan
Latin Americaand the Caribbean
Emerging andDeveloping Europe
Emerging andDeveloping Asia
Commonwealth ofIndependent States
Advanced economies
0 20 40 60 80 100
0 20 40 60 80 100
Sub-Saharan Africa
Middle East, North Africa,and Pakistan
Latin Americaand the Caribbean
Emerging andDeveloping Europe
Emerging andDeveloping Asia
Commonwealth ofIndependent States
Advanced economies
0 20 40 60 80 100
Figure 1: Executive Opinion Survey: Respondent profile
1a: Company size by number of employees
1c: Revenues generated by exports
1b: Company ownership
1d: Repeat and random respondents
Respondents, percent
n Small (< 50) n Small-medium (50–150) n Large-medium (151–1,000)n Large (> 1,000) n n/a
n None n 25% or lessn 26%–50% n Over 50%n n/a
Equity, percent
n Private (domestic) n Public (domestic) n Foreign
n Repeat respondents n Random respondents n n/a
Respondents, percent Respondents, percent
© 2014 World Economic Forum
The Global Competitiveness Report 2014–2015 | 93
1.3: The Executive Opinion Survey
the standardized score—or “z-score”—method, which indicates by how many standard deviations any one individual answer deviates from the mean of the country sample. Individual answers with a standardized score greater than 3 are dropped.
Aggregation and computation of country averagesThrough 2013, the computation of country averages used a weighting by economic sector: averages of individual responses were computed for the four main economic sectors (agriculture, manufacturing industry, non-manufacturing industry, and services) in a given country. Country averages were then derived by taking a weighted average of the sector averages using the estimated contributions of each sector to a country’s GDP as weights. The aim was to obtain a more representative average.
However, while appealing in theory, this approach presents a number of implementation challenges and limitations. First, in many countries covered by the Survey, information about economic structure is not reliable or is subject to significant revision. Special treatment is also required for 10 countries for which the breakdown of industry between manufacturing and non-manufacturing is not available. Second, the structure of the sample of responses might end up differing significantly from the actual structure of the economy, despite the efforts of our Partner Institutes, especially in challenging environments where the administration of the Survey is difficult. Third, in some major petroleum- and gas-producing countries, a handful of very large companies account for a sizeable share of the non-manufacturing sector. This means that attempting to mirror the structure of the economy would result in assigning a very high individual weight to the respondent from those companies. A related issue arises if none of those companies are surveyed, in which case the non-manufacturing sector is not represented at all in the country sample. Elsewhere, where agriculture still accounts for a large share of an economy, the agriculture sector tends to be under-represented in the Survey sample because of the difficulty of identifying respondents in that sector who have an international perspective. The issue of sectoral representation tends to be exacerbated when the sample of respondents is small.
In the presence of unbalanced samples, we used to limit the maximum implicit weight of an individual response in the sample to 10 percent.6 In some extreme cases, where a sample size was too small or the sectoral representation too different from the actual structure of the economy, this mechanism was not sufficient to prevent an individual response from receiving a disproportionate weight. In such a case, the economic sector stratification average was abandoned and a simple average of the surveys was applied.
For all these reasons, this year we decided to revert back to using a simple average to compute scores of all countries. Therefore, every individual response carries the same implicit weight, regardless the company’s sector of activity. Yet, as explained above, we will continue to work with our Partner institutes to obtain samples of respondents that are as representative as possible.
Formally, the country average of a Survey indicator i for country c, denoted qi,c , is computed as follows:
q i,c = �q i,c,j
N i,c
j
N i,c
whereqi,c,j is the answer to question i in country c from
respondent j; andNi,c is the number of respondents to question i in
country c.
Moving average and computation of country scoresAs a final step, the country averages for 2014 are combined with the 2013 averages to produce the country scores that are used for the computation of the GCI 2014–2015 and for other projects.7
This moving average technique, introduced in 2007, consists of taking a weighted average of the most recent year’s Survey results together with a discounted average of the previous year. There are several reasons for doing this. First, it makes results less sensitive to the specific point in time when the Survey is administered. Second, it increases the amount of available information by providing a larger sample size. Additionally, because the Survey is carried out during the first quarter of the year, the average of the responses in the first quarter of 2013 and first quarter of 2014 better aligns the Survey data with many of the data indicators from sources other than the Survey, which are often year-average data.
To calculate the moving average, we use a weighting scheme composed of two overlapping elements. On one hand, we want to give each response an equal weight and, therefore, place more weight on the year with the larger sample size. At the same time, we would like to give more weight to the most recent responses because they contain more updated information. That is, we also “discount the past.” Table 2 reports the exact weights used in the computation of the scores of each country, while Box 4 details the methodology and provides a clarifying example.
Trend analysis and exceptionsThe two tests described above address variability issues among individual responses in a country. Yet they were not designed to track the evolution of country scores across time. We therefore carry out an analysis to assess the reliability and consistency of the Survey data over
© 2014 World Economic Forum

1.3: The Executive Opinion Survey
94 | The Global Competitiveness Report 2014–2015
time. As part of this analysis, we run an inter-quartile range test, or IQR test, to identify large swings—positive and negative—in the country scores. More specifically, for each country we compute the year-on-year difference, d, in the average score of a core set of 62 Survey questions. We then compute the inter-quartile range (i.e., the difference between the 25th percentile and the 75th percentile), denoted IQR, of the sample of 146 economies.8 Any value d lying outside the range bounded by the 25th percentile minus 1.5 times IQR and the 75th percentile plus 1.5 times IQR is identified as a potential outlier. Formally, we have:
lower bound = Q1 – 1.5 � IQRupper bound = Q3 – 1.5 � IQR
whereQ1 and Q3 correspond to the 25th and 75th
percentiles of the sample, respectively, andIQR is the difference between these two
values.
This test allows for the identification of potentially problematic countries, which display large upward or downward swings or repeated and significant changes over several editions. The IQR test is complemented by a series of additional empirical tests, including an analysis of five-year trends and a comparison of changes in the Survey results with changes in other indicators capturing similar concepts. We also conduct interviews of local experts and consider the latest developments in a country in order to assess the plausibility of the Survey results.
Based on these quantitative and qualitative analyses, the 2014 Survey data collected in Bosnia and Herzegovina, Ecuador, and Rwanda deviate significantly from the historical trends, and recent developments in these countries do not seem to provide enough justification for the large swings observed. In the case of Rwanda, we use only the 2013 Survey data in the computation of the Survey scores (see the Exceptions section in Box 4). Rwanda therefore is still covered in the GCI 2014–2015. Although this remains a remedial
This box presents the method applied to compute the country scores for the vast majority of economies included in The Global Competitiveness Report 2014–2015 (see text for exceptions).
For any given Survey question i, country c’s final score, 2013–14qi,c , is given by:
q i,c2013–14 q i,c
2013wc2013 wc
2014 � � � q i,c
2014� (1)
where
q i,ct is country c’s score on question i in year t, with t = 2013, 2014, as computed following the approach
described in the text; and
wct is the weight applied to country c’s score in year t (see below).
The weights for each year are determined as follows:
wc2013
�
��
N c2013
N(1��)
2c2013 N c
2014
(2a) and wc2014
�
��
N c2014
N�
2c2013 N c
2014
(2b)
where N ct is the sample size (i.e., the number of respondents) for country c in year t, with t = 2013, 2014. � is a discount factor.
Its value is set at 0.6. That is, the 2013 score of country c is given 2/3 of the weight given to the 2014 score.
Plugging Equations (2a) and (2b) into (1) and rearranging yields:
qi,c2013–14
� � �� �qi,c2013
� �qi,c2013
� qi,c2014(1��) �
�
Nc2013
Nc2013 Nc
201421
� �21
�
Nc2014
Nc2013 Nc
2014qi,c2014�� � �� �
discounted-past weighted average sample-size weighted average
. (3)
In Equation (3), the first component of the weighting scheme is the discounted-past weighted average. The second component is the sample-size weighted average. The two components are given half-weight each. One additional characteristic of this approach is that it prevents a country sample that is much larger in one year from overwhelming the smaller sample from the other year.
Box 4: Country/economy score calculation
(Cont’d.)
© 2014 World Economic Forum

The Global Competitiveness Report 2014–2015 | 95
1.3: The Executive Opinion Survey
measure, we will continue to investigate the situation over the coming months in an effort to improve the reliability of the Survey data in this country.
Last year, the same analysis resulted in the Survey data of four countries—Bosnia and Herzegovina, Jordan, Oman, and United Arab Emirates—being dismissed. This year, as an intermediate step toward the re-establishment of the standard computation method, we used a weighted average of the Survey data of 2012 and 2014 for these countries, with the exception of Bosnia and Herzegovina described further below.
In the case of Bosnia and Herzegovina, we observe a very high degree of volatility in the Survey results over the past four years. For Ecuador, the trend exhibited by the Survey results over the past four years is not corroborated by developments on the ground during that period. Therefore, as an exceptional measure, both countries are excluded from this year’s coverage. We will work closely with the respective Partner Institutes to improve the administration process and the reliability of
the data, with the aim of reinstating both countries in the near future.
CONCLUSIONSince 1979, the World Economic Forum has been conducting a survey to gather perception data for its research on competitiveness. Over the years, the Executive Opinion Survey has become the largest poll of its kind, this year collecting the insight of more than 14,000 executives into critical drivers of their respective countries’ development. This scale could not be achieved without the tremendous efforts of the Forum’s network of over 160 Partner Institutes in carrying out the Survey at a national level. The Survey gathers valuable information on a broad range of variables for which data sources are scarce or nonexistent. For this reason, and for the integrity of our publication and related research, sampling thoroughness and comparability across the globe remain an essential and ongoing endeavor of The Global Competitiveness and Benchmarking Network.
The formula is easily generalized. For any two consecutive editions t1 and t2 of the Survey, country c’s final score on question i is computed as follows:
qi,ct1 –t2 � � �� �qi,c
t1 � �qi,ct1 � qi,c
t2(1��) �21
� �21
�
Nct2
Nct1 Nc
t2�
Nct1
Nct1 Nc
t2qi,c
t2� � � �. (4)
Exceptions
As described in the text, there are a number of exceptions to the approach described above. In describing them below, we use actual years—rather than letters—in equations for the sake of concreteness.
In the case of Survey questions that were introduced in 2014, where, by definition, no past data exist, the weight applied to the 2013 score is wc
2013 = 0 and the weight applied to the 2014 score is wc2013 = 1. Equation (1) simply is qi,c
2013–14 = qi,c2014. The same
is true for Tajikistan, which was reinstated in 2014. In this case, we have qi,c2013–14 = qi,c
2014.In the case of countries that failed the inter-year robustness check, the weight applied is wc
2013 = 1 and wc2014 = 0, so that
Equation (1) simply becomes qi,c2013–14 = qi,c
2013. In the case of countries that failed the inter-year robustness check last year and for which the 2013 data were discarded, we use the Survey data from 2012 instead, and combine them with those of 2014 to compute the scores. Equation (1) then becomes qi,c
2012–2014 = wc2012 � qi,c
2012 � wc2014 � qi,c
2014.
Example of score computation
For this example, we compute the score of Tanzania for indicator 5.08 Extent of staff training, which is derived from the following Survey question: “In your country, to what extent do companies invest in training and employee development? [1 = not at all; 7 = to a great extent].” This question is not a new Survey question and Tanzania did not fail the inter-year robustness test either this year or last year. Therefore, the general case of Equation (1) applies. Tanzania’s score was 3.76 in 2013 and 3.31 in 2014. The weighting scheme described above indicates how the two scores are combined. In Tanzania, the size of the sample was 92 in 2013 and 96 in 2014. Using � = 0.6 and applying Equations (2a) and (2b) yields weights of 44.5 percent for 2013 and 55.5 percent for 2014 (see Table 2). The final country score for this question is given by Equation (1):
�0.445 � 3.76�
2013
0.555 � 3.31 3.51�
2014
� .
This is the final score used in the computation of the GCI and reported in Table 5.08 (see page 463). Although numbers are rounded to two decimal places in this example and to one decimal place in the data tables, exact figures are used in all calculations.
Box 4: Country/economy score calculation (cont’d.)
© 2014 World Economic Forum

1.3: The Executive Opinion Survey
96 | The Global Competitiveness Report 2014–2015
NOTES 1 The World Economic Forum’s Global Competitiveness and
Benchmarking Network would like to acknowledge e-Rewards Market Research for carrying out the Executive Opinion Survey 2014 in the United States, following the detailed sampling guidelines. Furthermore, e-Rewards supplemented a sample in Germany and Sweden, as well as France.
2 Company size is defined as the number of employees of the firm in the country of the Survey respondent. The company size value used for delineating the large and small company sample frames varies across countries. The size value tracks closely with the overall size of the economy. Adjustments were made to the value based on searches in company directories and data gathered through the administration of the Survey in past years.
3 In order to reach the required number of surveys in each country (80 for most economies and 300 for the BRIC countries and the United States), a Partner Institute uses the response rate from previous years.
4 The results are the scores obtained by each economy in the various questions of the Survey. The two terms are used interchangeably throughout the text.
5 The completion rate is the proportion of answered questions among a subset of questions in the survey instrument. These 123 core questions are all numerical questions of sections II through XI.
6 Practically, under the old approach, when, for a particular country, the ratio of the weight of one sector in the economy to the percentage of surveys from that sector in the country sample exceeded 5, the sector weight used for the weighted average was capped at five times the percentage of surveys from that sector in the sample. The weights of the other sectors were then adjusted proportionally to their weight in the country’s GDP.
7 The 2013 scores were computed using a sector-weighted average.
8 The Survey was conducted in 148 economies in 2014. However, in Brunei Darussalam and Liberia there were not enough responses collected for inclusion. Therefore, those two countries were excluded prior to carrying out the IQR test.
REFERENCEEuropean Management Forum. 1979. The Competitiveness of European
Industry. Geneva: European Management Forum.
© 2014 World Economic Forum