singapore retail foods annual 2011 - amazon s3...report highlights: singapore, an asean member...
TRANSCRIPT

THIS REPORT CONTAINS ASSESSMENTS OF COMMODITY AND TRADE ISSUES MADE BY
USDA STAFF AND NOT NECESSARILY STATEMENTS OF OFFICIAL U.S. GOVERNMENT
POLICY
Date:
GAIN Report Number:
Approved By:
Prepared By:
Report Highlights:
Singapore, an ASEAN member state, is a city state with a population now just over 5 million. As a consumer
market, it is one of the wealthiest in Asia. Its GDP per capita was $43,900 in 2010.
Agriculture, processed food, and drink imports were valued at $9.7 billion in 2010, which is slightly less than
India (reported at $10.3 billion in 2010). Singapore produces very little in the way of food and is a re-export base
for many products, including retail packed products, and is also a showcase of products for the rest of Southeast
Asia. Singapore has a dynamic and highly segmented retail market, with several retailers carrying a diverse
range of products, from basic in-house labeled products to high end specialty and organic foods. Demand is
underpinned by an affluent domestic population, and also one of the largest expatriate communities in East Asia.
Tariffs are only levied on alcoholic drinks.
Stanton, Emms & Sia
Chris P. Rittgers
Annual 2011
Retail Foods
Singapore
12/13/2011
Required Report - public distribution

Post:
Executive Summary:
MARKET SUMMARY
1. Singapore in summary
Singapore is an ASEAN member state located in the heart of the ASEAN (Southeast Asia) region. ASEAN is
making great strides towards more economic integration. Singapore is ASEAN’s most affluent nation, with a
GDP per capita of $43,900 in 2010.
Its economic growth patterns tend to track global trends because its export manufacturing sector has key targets in
North America, Europe and Japan. Current estimates of economic growth are becoming increasingly cautious
because of the problems in the EU. Analysts suggest that its medium term growth is likely to average between
3% and 5% per annum, which would be largely supported by its involvement with a dynamic Asian regional
economy.
Although its domestic population is small at around 5 million, it is one of Asia’s largest importers of agricultural
products, processed foods, and drinks. Imports of such products were valued at US$ 9.7 billion in 2010, which is
slightly smaller than India, whose imports were valued at US$ 10.3 billion in that year.
The high value of imports exists because Singapore does not produce much food and is a re-export base for many
products that are ultimately consumed in other parts of Asia. In essence, it is a free trade port acting as a base for
products that can be marketed through its re-export channels. A multitude of products are re-exported, some of
which are important to U.S. commercial interests, e.g. frozen meat and poultry, fresh fruits and vegetables,
confectionery, cookies, canned foods, sauces, soft drinks, alcoholic drinks and pet food.
Singapore’s domestic population is quite well segmented and ranges from lower income to the super-rich, and the
strategies of the food and drink retailing industry reflect these different consumer groups.
The bulk of the population is regarded as middle income consumers, who are gainfully employed and lead a
relatively comfortable lifestyle. Native Singaporeans are the largest pool of active consumers and will continue to
drive increased consumption of imported food and beverages in the future. In addition, Singapore’s large
population of expatriates, including a large American community, is a market for a wide range of products.
Singapore

2. Singapore’s food retail and wholesale market
According to the government’s 2009 retail industry survey:
Singapore’s food and drink retailing sector comprises about 2,900 supermarkets, hypermarkets, department
stores, convenience stores and provisions shops that sell food and drinks. In addition to this, Singapore also has
around 1,200 other specialty food and drinks outlets. The sector, which employs around 36,000 people, reported
total sales of US$ 8.2 billion in 2009.
While the large number of outlets implies a fragmented market, actually food and drink retailing is now
concentrated in the supermarket, convenience store and chain store sub-sector, with total sales of around US$
4.84 billion in 2010. These channels are the most important targets for imports.
Modern retailers now control up to 60 percent of retail sales of packaged food and drinks. The same retailers
control lower shares of sales of confectionery, ice cream and soft drinks (between 60% and 70% share).
The balance of the industry comprises a large number of small family owned shops, which range from
neighborhood grocery (Mom and Pop-type) stores to high end specialty shops, e.g. retailing wines and spirits,
butchers, bakeries and confectionery shops.
The sector also includes traditional wet and dry markets, but these only carry limited products that are relevant to
U.S. exporters, including fresh produce, i.e. apples, oranges, grapes, plums, potatoes and celery.
These neighborhood-based markets are still important because the older generation (over 45 years of age) and
lower and middle income groups like to shop in them for fresh products, i.e. meats, poultry, fish, seafood and
fresh produce. They are also developing into an occasional shopping outlet for wealthy Singaporeans, many of
whom only use them on weekends. Due to government policy, these markets will continue to be part of the retail
industry in the foreseeable future.
Singapore’s wholesaling industry involved in the food trade is highly fragmented, comprising 3,400 firms with
total sales of around US$ 7.1 billion in 2010. Many of these are family-owned businesses involved in re-exports
of products from Singapore. Some are also regional marketing operations of multinationals, e.g. those involved in
the alcoholic drinks industry.
As Singapore imports most of its foodstuffs, the global changes in commodity and freight prices have a direct
impact on retail food sales. In some cases, i.e. staple foods, this impact is delayed as retailers refrain from
increasing prices for fear of damaging their markets. Singaporeans are generally price sensitive, and become even
more so in times of economic uncertainty and actual economic downturn.
Singaporeans still have quite high levels of consumer confidence, but there are developing concerns about a range
of issues, including the economic problems in Europe, the continuing slowdown in the USA, slowing exports,
potentially impending shortages in food supplies (due to floods in Southeast Asia), increasing food commodity
and crude oil prices, the strong dollar, a possible property bubble, and imported inflation.

3. Singapore’s food imports
Singapore’s imports of all agricultural products, processed food and drinks increased to US$ 9.7 billion in 2010,
up from US$ 5.7 billion in 2006. The USA’s share of Singapore’s imports is small and ranged from 5.8% to 7%
over the past 5 years (see chart below).
Source: Official Trade Statistics
As can be seen from the Chart above:
Singapore’s imports rebounded after the global recession in 2008, and grew in 2010. The collapse in imports in
2009 arose because economic growth in Singapore (a major exporter of high tech and specialty products), is
linked directly to the state of its markets for these products, which are concentrated in Europe, North America and
Japan;
The USA is one of many suppliers of food products to Singapore.
Singapore is not a major producer of agrifoods or processed food and drinks; consequently, its imports of these
products are diverse and broad based (see table below).
Singapore Imports of Agrifoods, Processed Food and Drinks – US$ 9.7 Billion in 2010
Imports of Agrifoods, Processed Food and Drinks
US$
%
Beverages 1,800 20
Dairy products 1,083 12
Fish and seafood 707 8
Meat and poultry 660 7

Oils and fats 649 7
Cocoa and its products 544 6
Misc processed foods 509 6
Fruits, fresh/dried 470 5
Vegetables, fresh/dried 411 5
Processed cereal and starch products 400 4
Sugar and its products 383 4
Processed fish and meat 371 4
Cereals, unprocessed 305 3
Processed vegetables and fruits 241 3
Coffee, tea and spices 216 2
Other products 378 4
Source: Official Trade Statistics
Imports are diverse because of little domestic production and also because re-exporters are trading a wide range
of products into the Asian region.
Beverage imports lead the market because of the strategy of using Singapore as a hub for re-exporting alcoholic
drinks. As an example, re-exports of spirits, i.e. whisky, cognac, vodka, etc, comprised around 90% of total
imports in 2010.
Re-exports also tend to be high in frozen meat, poultry and offal, certain fresh and dried fruits and vegetables,
confectionery, canned products, beer and soft drinks and juices. The bulk of many other product categories are
consumed in Singapore, e.g. chilled foods, e.g. dairy and meats, perishable fruits and vegetables, and some types
of frozen foods.
4. Advantages and challenges for U.S. exporters in Singapore’s retail market
Advantages (Sector Strengths and Market
Opportunities) Challenges (Sector Weaknesses and Competitive
Threats) Singapore is reliant on imports for virtually
all of its food and drink supplies. This
situation will not change in future.
Singapore is one of the wealthiest markets in
Asia, and it is a key location for expatriate
families to reside in East Asia. This situation
will not change in future. It also has a very
small lower income group, so virtually the
whole population is a target market.
Singaporeans have a sophisticated diet that
includes a wide range of foreign concept
foods, which has expanded on the back of
Singapore’s retail food market is now in a
maturing state, i.e. still growing but not
growing at the rapid rates seen in the past 10
years or so (Note: The Singapore
government now has a policy that will
reduce growth in immigration into
Singapore and so much slower population
growth rates than in the past).
Singaporeans are generally price sensitive
when it comes to buying everyday food
items, e.g. meat and poultry, fresh fruits and
vegetables, breakfast cereals (a younger
generation product) and soft drinks. This is

demand from the younger generation (under
40s).
Singaporeans are open to products that are
high quality and value-for-money. The
population has a large number of single
adults who are very clearly indulgent in their
spending patterns when economic times are
good. This benefits premium imported
meats, some dairy products, exotic fruits,
confectionery, wines and spirits, gift items
and pet foods.
Singaporeans generally perceive the USA
and its brand-owners as quality suppliers of
food and drink products.
U.S. brand-owners and products have good
shares in some of Singapore’s mainstream
market segments (breakfast cereals and some
fresh fruits) and smaller niches (organics).
underpinned by imported food price inflation
over the past 5 years. It has provided
opportunities for ASEAN-made and Chinese
suppliers to increase their market shares at
the expense of traditional exporters.
U.S. exporters must compete with factories
of Asian/ASEAN based multinationals,
China (upgrading supply bases), and the
“traditional” supply bases in Australia, the
EU and New Zealand.
U.S. exporters cannot always service
Singaporean importers, retailers and end
consumers in a way that closely meets their
demand requirements and expectations, e.g.
on order sizes, packaging sizes and formats,
taste, pricing that “fits” the market (marking
to market), and for promotional support. This
trait is viewed negatively by importers.
Some products that are exported from the
USA are not understood by Singaporeans
and are never explained to them, e.g. ready-
to-consume prepared TV dinners. Such
products do not have a “fit” in local food
culture.
Further economic sluggishness in Western
Europe and the U.S. could have negative
impacts on Singapore’s economic prospects
over the next 3 years. A possible bubble in
the private housing market is also of
concern.
II. ROAD MAP FOR MARKET ENTRY
5. Entry strategy
Singapore is a highly competitive market that operates in an environment where:
(i) There are very powerful retailers that control access to shoppers and have very strong bargaining power over
suppliers of all forms of food and drinks, fresh, frozen and shelf stable retail packed. The major supermarket and
hypermarket operators control the whole retail market by actively segmenting it around different store concepts
(and store brands/banners) and merchandising strategies that target the low income group through to the high
income groups and expatriates;

(ii) The mass “middle income group” market in Singapore, i.e. the bulk of Singaporeans, is price sensitive
towards foreign food and drinks that are more expensive than local products; and,
(iii) Marketing and distribution costs are extremely high for new product launches and also high for the on-going
maintenance of market shares and positions.
Local products now include market leading ASEAN-made products imported from Malaysia, Indonesia,
Philippines, Vietnam and Thailand. This includes food and drink made by multinationals who have factories in
the ASEAN region, manufacturing products that were once imported, e.g. ice cream, tea, sugar confectionery,
chocolate, cookies, breakfast cereals, snacks of various types, soups and soft drinks.
The sector is continuously evolving as retailers drive to reduce costs and overhead, through:
(i) more retailer labeled products on shelves; and,
(ii) more direct buying by retailers, including specialty products such as organics, and niche products that are
specifically demanded by expatriates.
In view of the challenges from “retailer power” that exist in the market, importers prefer to work with exporters
that:
(i) are fully committed to develop their markets in Singapore, in terms of a willingness to deal with local demands
for promotional campaigns, products and packages that fit into demand conditions;
(ii) have a product and brand that is unique enough to break into the market; and,
(iii) are flexible in terms of their short term returns and profit goals, and, very importantly, have a medium to long
term strategy and action plan to build their market in Singapore.
This situation exists because suppliers in Singapore have very little power to deal with the demands of retailers
when it comes to accessing retail space for their products. Trade sources comment that everything now revolves
around the cost of accessing such space, maintaining a listing (avoid delisting) and so the ability to consistently
access shoppers.
U.S. exporters should not assume anything about the Singapore market or demand for their products, and should
be prepared for high learning costs, actual costs (wasted listing fees, promotional costs, etc.), and the
disappointment of failure to build any form of market.
It is very important that exporters with an interest in developing a market in Singapore perform research on their
own specific opportunities to confirm and clarify exactly where market potential exists for their products. This
should include what the product’s unique selling advantages are under Singapore market scenarios. In addition to

this research, it is also important to:
(i) study what successful U.S. exporters have done in practice to build their retail markets in Singapore, e.g. the
benchmarks that have been set by U.S. origin dried fruits, breakfast cereals, certain fresh fruits, nuts and
vegetables, and non-Asian sauces;
(ii) develop a sound export business and marketing strategy under which their products are well targeted, well
segmented, well distributed and well differentiated from the competition in a very competitive market; and,
(iii) identify and appoint a knowledgeable and experienced and fully resourced importer-distributor as a strategic
partner to activate the new export business and marketing strategy for the Singapore market.
Some points that US exporters should consider questioning when planning to enter the Singapore retail market
are as follows:
(a) where the product fits in the retail market, e.g. as a mass market item, high-end niche item, novelty/exotic
item, seasonal festive/gift item, targeted at western expatriates, etc.
(b) price competitiveness of the US products versus comparable brands already in the market.
(c) packaging size and quality that meets with customers’ expectations.
(d) U.S. products which can be readily accepted as alternatives/substitutes to competing products.
(e) U.S. products that can readily fit into local food culture.
(f) U.S. organic products and health food products that can meet retailer’s requirements.
(g) U.S. products which provide convenience to customers.
(h) The level of promotion, commitment to brand support and consumer education necessary for successful
launch and development of a new-to-market product.
(i) Ability to meet retailer purchasing requirements and specifications.
6. Distribution channels
As pointed out earlier in this report, Singapore’s distribution channels for consumer ready foods are now
concentrated around supermarkets and hypermarkets. The two leading convenience store chains are also
controlled by the market leading supermarket operators.
While there are alternative channels, e.g. the wet and dry markets, small “mom and pop” type shops, mini-marts
and some specialty food and drinks shops, these channels can no longer support imported products from USA
under a strategy of building a sizeable long term market share.

U.S. exporters’ brands and products have to be in Singapore’s main retailing channels, i.e. supermarkets,
hypermarkets and convenience stores, if they want to have a successful and sustained future in the Singapore
retail channels. Major supermarket operators emphasize seasonal gift retailing, premium and specialty products,
organics, and expatriate-targeted products as part of their market segmentation strategies.
The strategies of the retailers in segmenting the market means that it is possible for a shopper to buy a huge range
of different products from across the world, including many products that are in the supermarkets or other large
format stores in the USA. This arises because of consolidated shipments imported either by the retailer, a part of
its group, or an independent importer-distributor.
7. The retail industry and market structure
7.1 Large format stores
The Table below provides information on the major retailers involved in the operation of supermarkets,
hypermarkets and department stores.
Retailer Name
and Ownership Outlet Types Annual
Sales in
US$
No of Outlets Locations Procurement
Method
Fairprice (Local
cooperative)
Supermarkets
and
hypermarkets
1,916
million 4 hypermarkets
under the Fairprice
Xtra banner and 8 high end
supermarkets under
the FairPrice Finest
banner and 94
FairPrice
supermarkets, plus
mini-supermarkets
and a chain of
convenience stores.
Island-wide Direct sourcing
preferred with
some agents used
for smaller volume
supplies
Cold Storage
group * and
Giant (Owned
by DFI, a Hong
Kong based
listed company)
Supermarkets
and
hypermarket
1,200
million. 39 Cold Storage
supermarkets. 6 The Market Place
high end
supermarkets and 8
hypermarkets under
the Giant banner.
Island-wide Direct sourcing
preferred, together
with a number of
local preferred
agents used.

Shop n Save
(Owned by DFI,
a Hong Kong
based listed
company)
Supermarkets 210
million 59 supermarkets. Island wide Direct sourcing
preferred, together
with a number of
local preferred
agents used.
Sheng Siong
Supermarket Supermarkets
and
hypermarkets
495
million 23 stores, mainly
supermarkets.
Island wide Local agents are
important, but this
company is
increasingly
sourcing on a
direct basis from
overseas suppliers.
Carrefour Hypermarkets 200
million 2 hypermarkets. Major
shopping
centres in
city
locations.
Prefers to source
on a group basis
directly from
suppliers.
*: The Cold Storage group of supermarkets also includes Jason’s and The Market Place banners.
Singapore also has some smaller chains of supermarkets, the biggest of which is reported to be Prime
Supermarkets, with annual sales of about US$ 15 million in 2009. In addition to this chain, it also has some other
single site stores that carry imported products:
(a) Two sizeable and high profile Japanese retail stores, which import Japanese products direct from Japan and
source most other products locally from Singapore based importers:
(i) Meidi-ya Singapore, which is an overseas branch of Meidi-ya Co Ltd, one of Japan’s food companies and a
premium supermarket operator in Japan; and,
(ii) Isetan Supermarket, which operates as part of Isetan (Singapore) Limited, a Singapore listed department store
operator that is majority owned by Isetan Japan.
(b) The Mustafa Department Store that operates a supermarket within its department store, which has a single
location in the Little India area of Singapore. This store is often used by importers to sell products that they are
having difficulty selling through other more mainstream retail channels. It has a wide range of products, which
include products sourced from all over the world, and a strategic focus on products of Indian origin.
The key channels to target for U.S. products are the following, which are used by higher income Singaporean
shoppers and expatriates:
(a) DFI/Cold Storage group, in particular The Market Place and Cold Storage supermarkets; and,

(b) FairPrice, especially the FairPrice Finest supermarkets;
(c) Carrefour; and,
(d) Meidi-ya Singapore and Isetan Supermarket, both of which carry U.S. products as part of their merchandising
policies, e.g. meats, fresh produce and wines.
These stores accept a much wider range imported products than any others. As mentioned earlier, it is possible to
buy a wide range of U.S. and other Western food and drink products in Singapore, with the main channels being
the above stores.
Certain U.S. origin products, e.g. fresh and dried fruits, fresh vegetables of certain types, snacks, breakfast
cereals, wine, ice cream, processed meats and confectionery, will also have market opportunities in Shop n Save,
Giant hypermarkets, some of the larger second-tier FairPrice stores and Sheng Siong that are frequented by
expatriates.
7.2 Convenience stores and other small format stores
Although having a smaller share of the food and drink retailing industry than the supermarkets and hypermarkets,
Singapore’s convenience and other small format stores are very important channels for certain types of products.
This sector comprises:
(a) Chains with a broad based focus in terms of the products that they carry:
(i) chains of convenience stores; and,
(ii) small format supermarkets, known as minimarts, some of which are operated by the supermarket operators.
The market leaders in this sector are:
(i) 7-Eleven, which operates over 550 outlets across the island, with about 25% of them run by the earlier
mentioned Cold Storage group, whose owner Dairy Farm International (DFI) is the Singapore strategic partner
for 7-Eleven Incorporated;
(ii) Cheers (another FairPrice group banner), which 124 outlets are operate on all across the island, including on
site at Esso gas (petrol) stations in Singapore; and,
(iii) FairPrice Xpress, of which there are 23 stores operating on an island wide basis with many also located at
Esso gas stations.

The i-Econ group of value-for-money franchised neighbourhood grocery stores, which operates under PSC
Corporation Ltd group, is a diversified group of companies listed on the Singapore Stock Exchange. Although
this group claims to have the largest chain of minimarts in Singapore, it is not likely to be a major channel for
food and drink products exported from the USA because it’s focus is on lower and middle income consumers.
Accessing the main chains of convenience stores and mini-markets can be very difficult for imported products.
The merchandising policies in these stores and small retail display space mean that products being carried by
them experience rapid turnover. For this reason, the products that are carried are generally locally/ASEAN
produced and branded, or are multinational branded products, which are heavily supported by A&P (advertising
and promotional) campaigns on a year- round basis in the broader Singapore market.
(b) Chains that have a more specialised focus in terms of the products that they carry:
(i) chains of personal care/pharmacy type stores that carry certain food and drinks; and,
(ii) chains of stores that retail healthy foods and nutrition supplements.
These chains include:
(i) Watsons Personal Care, which has 105 stores located in major shopping centre or shopping streets across the
whole of Singapore island. While this chain is focused on personal care, beauty and pharmaceuticals and
nutraceuticals, it also carries a range of food and drinks targeted at the convenience seeking shopper and also
gifts, e.g. chocolates and cookies. It tends to boost its range of gift food products during festive seasons.
(ii) Guardian, which is part of the Cold Storage/DFI group, has about 140 stores located all over the island. Its
main focus is on pharmacy operations and health and beauty products. Its range of food products is linked very
closely to its core focus, e.g. dietetic-type / special needs products.
(iii) Unity Pharmacy, which is owned by the NTUC Healthcare Cooperative, and operates around 50 stores
located all over the island. Like Guardian, Unity is very focused on its core business, so the food and drink
products carried are usually dietetic-type / special needs in nature.
(iv) Nature’s Farm, a health food and supplements retail chain with 26 outlets located all across the island.
There are also some smaller professionally managed chains involved this sub-sector, e.g. SuperNature (2 outlets),
an organic food specialist owned by the Club 21 high fashion retail group.
These chains generally seek well known and good quality products that are supported by importers and foreign
brand owners. Demand for these products is linked to a range of different factors, including:
(i) health and wellness;
(ii) indulgence in terms of personal treats and gifts; and,
(iii) value-for-money in terms of shopper judgements on price, quality and functionality.
Added to this matter are the demands of the retailers for discounts, listing fees (in some cases) and promotional
support, because they are also under significant competitive threat from the major retailers.
7.3 The traditional channels
As mentioned earlier in this report, the traditional channels are no longer a strategic or, in most cases, a viable
target for products that are exported from the U.S. When such products do enter these channels, they do so
because:
(i) they are good channels for basic staples and fresh fruit, e.g. apples, oranges, celery and potatoes in the wet
markets; or,
(ii) the importer-distributor has a problem selling the product and these channels are then used in the same way as
the earlier mentioned Mustafa Department Store.
Singapore’s mom and pop grocery stores now mainly carry locally made food and drinks and products that are
imported from the ASEAN region and China.
Some small shops also specialise in:
(i) wines and spirits, usually wines;
(ii) organics and healthy foods; and,
(iii) confectionery and food gift type products.
This sector of Singapore retailing includes a sizeable number of shops that would be classified as “hobby shops”
rather than an aggressive commercial operation.
7.4 The other channels
Internet shopping linked to delivery services is offered by the major retailers, e.g. FairPrice and Cold Storage, and
the niche players, e.g. SuperNature and Nature’s Glory.
No readily available information exists on the total annual value of internet transactions involving food and
drinks in Singapore. PayPal released a report in 2011, which estimated that total on-line shopping by
Singaporeans had reached US$ 1.1 billion in 2010.

Food and drinks purchases were not listed in the top shopping categories cited by PayPal. The main categories
included travel services, fashion, entertainment, insurance, IT/electronics products and gifts/collectables, which
comprised around 80% of total on-line spending in that year.
Trade sources comment that there is a sizeable amount of on-line shopping taking place in Singapore. According
to a source at the Singapore Retailers Association, recent surveys have also indicated that around 80% of
Singaporeans under the age of 35 years are frequent internet shoppers.
Sources in the food industry believe that the only shoppers who buy their groceries on-line are those that want
their groceries delivered because they have very little time to shop, or have a specific problem in visiting a retail
outlet.
As Singaporean’s “love to shop”, on-line shopping is not the same as visiting a supermarket and looking at the
fresh produce, other products and, very importantly, the “bargains” that are available. From this standpoint, while
on-line shopping, linked to home delivery services, is growing quite rapidly, it is just one of the services that
retailers (both mainstream and niche) are now supplying to their clientele, and not yet a mainstream channel.
III. Competition in the retail market
8.1 Overview of the nature of competition
(a) Local suppliers and brand-owners who operate in the dairy, beer, soft drinks and processed meat industries,
with some of the companies in these industries manufacturing some of their market leading products in other
ASEAN countries, e.g. Malaysia and Thailand;
(b) Major Competitors: Australia (wide range of products), New Zealand and some EU countries, e.g.
Netherlands, Denmark, France, Italy and the UK;
(c) Brazil (meats and poultry), South Africa (wines), China (fresh fruits and vegetables), Chile (wines and fresh
fruits), and South Korea (berries); and,
(d) The multinational food and drink companies operating in Singapore, the other ASEAN countries and China
(which includes some U.S. companies).
U.S. exporters and their products face a complex range of challenges if they are not well differentiated in the eyes
of the consumers. One key factor is price competition from products that look similar, and that originate from
China, Brazil, South Africa and the ASEAN countries, all of which are very competitive.
8.2 Competition matrix
The Table below provides an overview of competition in the market segments that are covered by this report.

Market and Its
Size Major Supply
Countries Strengths of Key Supply
Countries Advantages and
Disadvantages of Local
Suppliers
Beef, fresh/chilled
and frozen
Net imports:
18,538 tonnes.
Australia –
38%. New Zealand –
25%. Brazil – 16%. Uruguay – 12%. USA – 5%.
Australia and New Zealand
(mainly food service, with a
low level presence in retail)
have full access for all of
their products, which local
buyers consider as good
quality and price competitive. Brazil price-competes in the
frozen beef segment, which
now has an expanded
presence in supermarkets.
Beef is not produced in
Singapore.
Trends in gross imports
Product group 2008 Tonnes 2009 Tonnes 2010 Tonnes
Beef, fresh/chilled 3,173 3,617 4,030
Beef, frozen 18,584 19,347 20,040
Source: GTIS
Pork, fresh/chilled
and frozen
Net imports:
71,661 tonnes.
Brazil – 37%. Australia – 18%. Netherlands – 8%.
USA – 8%.
Brazil dominates the frozen
segment with value-for-
money pork of a quality
acceptable to local users,
some in retail channels. Australia (Australian Pork
and AIRPORK brands)
dominates the fresh/chilled
market on the back of its
proximity and ability to
export high volumes to
Singapore. Netherlands
frozen pork is in retail
channels packed under
private or retailer labels.
Indonesian live pigs are
imported and slaughtered
in Singapore, and the pork
is sold through wet
markets (chilled retail
stalls) and supermarkets.
It is acceptable to
Singaporeans and is part
of the country’s food
security for staple foods.
Trends in gross imports
Product group 2008 Tonnes 2009 Tonnes 2010 Tonnes Pork, fresh/chilled and frozen
70,382
74,989
79,631

Source: GTIS
Poultry, frozen
Net imports:
96,905 tonnes.
(Note: Chicken
accounts for 99%
of imports. Turkey
and duck imports
(net of re-exports)
are niche markets
comprising 604
and 434 tonnes
respectively).
Brazil – 67%. USA – 27%. Argentina – 3%.
Brazil (e.g. Perdigao and
Seara) competes on price and
its products are acceptable to
users in Singapore. The USA
is now a niche player in retail
channels.
Malaysian live chickens
are imported and
slaughtered in Singapore.
This fresh chicken is the
dominant product in the
market and is in high
demand based on
traditional demand traits.
Trends in gross imports
Product group 2008 Tonnes 2009 Tonnes 2010 Tonnes Poultry in all forms 105,728 100,411 105,963
Source: GTIS
Offal, frozen (not
poultry).
Net imports:
12,191 tonnes.
Australia –
30%. New Zealand –
18%. Netherlands –
10%. Ireland – 8%
USA – 2%.
Private or retailer label
packed frozen halal certified
bovine offal, mainly imported
from Australia, is readily
available in supermarkets.
Offal from pigs
slaughtered in Singapore
dominates the market for
such products. No
substantial quantities of
bovine offal are produced
in Singapore.
Cheese in all
forms.
Net imports: 9,734
tonnes.
Australia –
43%. New Zealand –
18%. USA – 7%. France – 6%. Denmark – 5%.
Fonterra’s brands from
Australia and New Zealand
are leading players, along
with some other Australian
brands, e.g. Lactos, Dairy
Farmers and Bega. President
(France) and Arla (Denmark)
also have a strong retail
presence.
Singapore does not
produce any retail packed
cheeses.
Butter and dairy
spreads.
Net imports:
15,185 tonnes.
Australia –
29%. Netherlands –
23%. New Zealand –
Australia has a number of
brands in the market, e.g.
Golden Churn, including
some private label products.
Anchor (New Zealand),
No retail packed butter is
produced in Singapore.

19%. France – 11%. Germany – 6%.
USA – 3%.
President (France) and some
other EU brands (Lurpak)
have a strong presence in
retail.
Yogurt.
Net imports: 7,362
tonnes.
Malaysia –
39%. Australia –
21%. Thailand –
16%. Switzerland –
7%. Germany – 6%.
USA – 4%.
The strongest imported
brands are Alive (Fraser &
Neave Malaysia), which is
the leading imported brand,
Yoplait and Bulla (Australia),
Meiji (Thailand) and Emmi
(Switzerland).
Malaysia Dairy Industries
produces Marigold
yoghurt, which has been
tailored to Singaporean
local tastes. It leads the
yogurt market and is an
aggressive competitor for
all imported brands in the
chilled dairy sections of
supermarkets and
hypermarkets.
Liquid milk.
Net imports: 62.5
million litres.
Australia –
34%. Thailand –
30%. Indonesia –
11%. New Zealand –
7%. India – 3%.
USA – 0.3%.
Strong imported brands with
good distribution are
Australian, which include
Marigold (local brand),
Farmhouse (local brand) and
Pura, Meiji (Thailand),
Greenfields (Indonesia). The
leading retailers also market
Australian liquid milk under
their in-house brands.
The local dairy companies
are very strong
competitors with good
brands and some imported
liquid milks in their
portfolios. The local
brands include Magnolia,
Farmhouse, Daisy (Fraser
& Neave), and the brands
of Malaysian Dairy
Industries, namely HL
(the market leader) and
Marigold.
Ice cream.
Net imports:
14,443 tonnes.
Malaysia –
58%. Thailand –
17%. USA – 4%. France – 4%. Australia – 3%.
Strong brands and physical
distribution from Malaysia
and Thailand, which are
production bases for Wall’s
(Unilever), Nestlé and Fraser
& Neave (Meadowgold and
King’s). The other countries
are premium ice cream
suppliers, e.g. Ben & Jerry’s
(USA) and Haagen Dazs
(France).
Local supply is negligible
when compared to
imports.
Apples and pears. China – 55%. The market is generally price Singapore does not

Net imports:
61,864 tonnes.
South Africa –
20%. USA – 9%. New Zealand –
7%. France – 7%.
competitive due to retailer
strategies. In addition to
apples (Fuji variety), China
also supplies highly popular
Chinese pears. New Zealand
and France are supported by
strong promotions and good
physical distribution.
produce apples and pears.
Trends in gross imports
Product group 2008 Tonnes 2009 Tonnes 2010 Tonnes
Apples 47,177 45,828 47,749
Pears 23,527 21,917 23,573
Source: GTIS
Citrus fruits, not
tropical.
Net imports:
59,039 tonnes.
China – 36%. USA – 28%. South Africa –
16%. Australia – 9%. Egypt – 3%.
This market is generally price
sensitive due to retailer
strategies, which supports the
position of China (dominant
in Mandarins), South Africa
and Egypt in the market.
Singapore does not
produce these fruits.
Trends in gross imports
Product group 2008 Tonnes 2009 Tonnes 2010 Tonnes
Oranges 41,414 40,942 41,744
Mandarins 19,604 16,838 19,468
Grapefruit (with Pomelo) 4,118
4,022
4,530
Source: GTIS
Grapes and
raisins.
Net imports:
12,772 tonnes.
USA – 49%. South Africa –
23%. Australia –
12%. Chile – 5%. Egypt – 3%.
The USA dominates in its
season because of its
competitiveness on quality,
saleability, profitability for
channel members,
promotional support and
branding (including in
raisins) and supply capacity.
In the other season, South
Africa and Australia (close to
year round supply capability
in green grapes) compete,
with South Africa winning
due to its more competitive
Not produced in
Singapore.

pricing.
Trends in gross imports
Product group 2008 Tonnes 2009 Tonnes 2010 Tonnes
Grapes, fresh or dried 15,656 16,627 16,392
Source: GTIS
Soft fruits,
temperate
varieties.
Net imports: 3,563
tonnes.
USA – 47%. South Korea –
34%. Australia – 8%. New Zealand –
4%. Egypt – 3%.
High quality chilled
distribution channels into
Singapore, ability to deliver
quality. and seasonal
promotional activities support
all activity in this market.
Not produced in
Singapore.
Stone fruits,
including avocado.
Net imports: 7,315
tonnes.
USA – 46%. Australia –
28%. South Africa –
6%. China – 5%. New Zealand –
3%. Chile – 3%.
High quality chilled
distribution channels into
Singapore and seasonal
promotional activities support
the USA and Australian
positions in this market.
Not produced in
Singapore.
Trends in gross imports
Product group 2008 Tonnes 2009 Tonnes 2010 Tonnes
Plums 3,192 3,492 3,322
Peaches and nectarines 1,991
1,813
1,877
Avocado 747 978 1,285
Source: GTIS
Middle Eastern
type dates.
Net imports: 637
tonnes.
Iran – 32%. Egypt – 16%. Israel – 15%. Saudi Arabia –
7%. UAE – 4%. USA – 4%.
These products are imported
to meet seasonal demand,
mainly related to Muslim
festivals. The Middle East
dominates because the retail
market is generally price
sensitive.
Not produced in
Singapore.
Edible nuts,
temperate climate
products.
USA – 53%. China – 26%. Iran – 6%.
Competition revolves around
traditionally commodities
(China and Iran), branded
Not produced in
Singapore.

Net imports: 1,805
tonnes.
Australia – 5%. Italy – 4%.
snacks (USA mainly under
local brands, which are well
distributed) and some level of
seasonal demand.
Potatoes, fresh
table.
Net imports:
40,698 tonnes
China – 36%. Bangladesh –
15%. USA – 13%. Indonesia –
11%. Australia – 8%.
This market is generally price
competitive, with the USA
and, to a lesser extent,
Australia involved in
marketing in supermarkets.
Not produced in
Singapore.
Broccoli and
cauliflower, fresh.
Net imports:
14,595 tonnes.
China – 83%. Australia –
12%. Malaysia – 3%.
USA – 0.6%.
China now dominates this
market because of its price
competitiveness and quality
versus Australia. Chinese
product quality is now similar
in the eyes of consumers and
its export pricing is between
40% and 50% of Australia’s
pricing.
Not produced in
Singapore.
Lettuce head-type,
fresh.
Net imports: 9,955
tonnes.
USA – 39%. China – 28%. Malaysia –
20%.
The USA is the dominant
player because of its quality
and reasonable pricing.
Although China’s price is
between 70% and 75% of
U.S. price, its lettuce has
quality problems when in the
Singapore distribution
channels. Malaysia is mainly
supplying hydroponic
products which are marketed
differently to U.S. products.
Singapore does not
produce products that
compete with U.S.
imported products.
Asparagus, fresh.
Net imports: 1,118
Thailand –
46%. USA – 32%.
Thailand, which supplies
younger (thinner) asparagus,
operates in a different
Not produced in
Singapore.

tonnes. Australia –
14%. Peru – 5%.
segment to asparagus
imported from the USA. Thai
products have a mass market
target. The USA leads the
seasonal premium market.
Celery, fresh
Net imports: 5,100
tonnes.
USA – 72%. China – 15%. Malaysia –
10%. Australia – 3%.
The USA leads this market
because of its
competitiveness in terms of
price, quality and supply,
distribution and marketing
capabilities.
Not produced in
Singapore.
Coffee, ground
roasted
Net imports: 2,324
tonnes.
USA – 59%. Indonesia –
13%. Malaysia – 7%. Italy – 4%.
The strong local brands
marginalise imported brands
to niches or the food service
market (a key U.S. target due
to corporate demand-pull).
The highest profile premium
brands in retailers are all
from the EU, e.g. Melitta,
Lavazza and Cafe Direct. The
highest profile U.S. retail
brand is Folger. Nestlé has
just started to play in this
market.
Singapore has a strong
coffee producing industry,
with the dominant players
in the premium segment
being Boncafe, the market
leader, and Sarika (Suzuki
brand).
Tea leaf and bags,
green and black
retail packed.
Net imports: 1,450
tonnes.
Indonesia –
28%. Sri Lanka –
10%. USA – 6%. India – 6%. Malaysia – 5%.
The brands in this market are
supported by strong
advertising and promotions
and distribution capabilities,
including Lipton (Unilever),
the market leader, which
supplies most of its products
from Indonesia, Dilmah (Sri
Lanka) and Boh (Malaysia).
The UK (Twinings, an
important premium brand) is
the leader in the premium and
super premium niches.
Singapore is not a major
player in the market for
retail packed leaf teas and
tea bags.

Processed meats
and poultry, not
chilled.
Net imports:
24,427 tonnes.
Thailand –
47%. China – 22%. Malaysia –
16%. USA – 6%. Brazil – 4%.
This market is dominated by
a range of frozen and Asian-
style canned products from
Thailand (Chareon Pokphand
frozen products) and
Malaysia (various brands),
and canned products from
China. The key non-Asian
brands in this market are
mainly canned beef and pork-
based products, i.e. Spam
(USA), Libby’s (Brazil) and
Tulip (EU produced).
Growing stronger on the
new investments in
production facilities for
processed meats, both
chilled and canned.
Sausages, not
fresh chilled.
Net imports: 6,321
tonnes.
Brazil – 40%. USA – 20%. Denmark –
18%. France – 16%. Malaysia – 4%.
Strong physical distribution,
access to retail display space
and periodic price
promotions are the most
important factor in this price
driven commodity-style
market. The highest profile
suppliers in the market are
Perdix (Brazil), Doux
(France), Dewfresh
(Denmark origin),
Rockingham and Valley Chef
(USA) and, in canned, Tulip
(Denmark).
The local sausage industry
has a focus on producing
premium fresh/chilled
sausages and traditional
dried Chinese-style
sausages. Although a
competitive industry, it
does not compete directly
with imported products,
which tend to be either
commodity products
(frozen or canned
frankfurters) or branded
better quality “more
authentic” chilled
products.
Processed fish and
seafood, higher
processed
products only.
Malaysia –
29%. Thailand –
20%. Vietnam – 14%.
This market is dominated by
price competitive ASEAN-
made and branded canned
and frozen products, which
includes a large segment
Singapore has a frozen
fish and seafood industry
that competes with
products from the other
ASEAN countries.

Net imports:
38,306 tonnes.
USA – 0.7%.
involving tuna based
products and
sardines/mackerel.
Competition tends to revolve
around access retailers’
shelves and price.
Sugar
confectionery.
Net imports:
10,760 tonnes.
Malaysia –
27%. China – 20%. Indonesia – 9%. Thailand – 8%. Taiwan – 6%.
USA – 5%.
Malaysian local producers
(several brands) and
multinationals with
production in China (Mars),
Indonesia (Nestlé), Thailand
(Cadbury Adams) and
Vietnam (Perfetti) dominate
this market. These businesses
have brands that are well
supported by very wide
spread distribution.
Singapore is not a major
producer of sugar
confectionery, although it
has a strong position in
the medicated sweets
segment.
Chocolate
confectionery.
Net imports:
14,304 tonnes.
USA – 16%. Australia –
12%. Malaysia –
11%. New Zealand –
9%. Italy – 8%.
High levels of competition
for retail shelf space between
Cadbury (Australia and New
Zealand), Mars (Australia
and China), Hershey (USA
and China), Ferrero (Italy),
Nestlé (Malaysia, UK
Australia and USA) and
others from Malaysia. Europe
also has high profile and very
active brands from Germany,
Belgium, France, Switzerland
and the UK, which tend to
operate in the premium food
gift market.
Singapore is a chocolate
producer but does not
operate as a major player
in the mass retail market.
Cookies (Sweet
Biscuits).
Net imports:
18,068 tonnes.
Malaysia –
46%. Indonesia –
12%. USA – 7%. Thailand – 7%. China – 6%.
Malaysia is very strong with
the branded and wide product
ranges of Kraft, Munchy’s
and Perfect Foods
dominating the retailers’
shelves and brand shares.
Kraft’s operations in
Indonesia (Oreo), USA
(various brands) and China
(Chips Ahoy) are also key
competitors in this segment.
Singapore has a sizeable
biscuit producer, Khong
Guan, which is involved
in this segment, although
its clientele are reported to
be older Singaporeans.
Breakfast cereals,
including oats.
China – 44%. USA – 15%. Philippines –
A market with strong and
well supported brands
dominated
Singapore does not produce breakfast cereals.

Net imports: 5,447
tonnes.
11%. Thailand – 6%. Malaysia – 5%.
by Quaker (China), Nestlé
(Philippines), Kellogg’s
(Thailand and the USA) and
Post (USA).
Snack foods,
extruded types and
potato based.
Net imports: 6,900
tonnes.
Malaysia –
72%. Thailand –
15%. USA - 5%.
A market with brands
supported by very strong
distribution capabilities. The
companies/brands involved
include Kraft Foods
(Malaysia), Mamee Double
Decker (Malaysia), URC
(Malaysia), Pringles
(Malaysia), Calbee (Thailand
and Malaysia) and Frito-Lay
(USA and Mexico).
Most snacks marketed
under Singapore owned
brands are now produced
in neighbouring Malaysia.
Frozen potatoes.
Net imports:
18,824 tonnes.
USA – 48%. New Zealand –
25%. Canada – 14%. Netherlands –
8%.
French fries and hash browns
are marketed under
Singapore private labels, e.g.
Farmland (U.S. origin), with
Ore Ida (USA), Watties (New
Zealand) and McCain
(Canada) also have quite
strong distribution access to
retailers.
Not produced in
Singapore.
Frozen vegetables.
Net imports: 1,173
tonnes.
USA – 39%. China – 23%. Thailand –
19%. Canada – 6%. Japan – 5%.
The highest profile brands in
supermarkets and
hypermarkets today are now
retailer in-house branded
products. Thailand is a niche
player in frozen green
soybeans. Simplot (various
origins), , Watties (NZ) and
Emborg (EU) are the highest
profile independent brands.
Singapore is not
producing any frozen
vegetables.
Fruit juices.
Net imports:
34,927 tonnes.
Malaysia –
24%. USA – 15%. China – 14%. Indonesia – 8%.
Asian sourced fruit juices
tend to be food service
products or juice drinks. The
USA is the leader in chilled
retail packed fruit juices, due
Singapore has a strong
industry involved in the
production of fruit juices,
including Fraser & Neave,
Malaysia Dairy Industries

South Korea –
4%.
to high quality products,
strong brands and very good
distribution coverage.
and Pokka Singapore,
which aggressively
compete with each other
for market share.
Canned and
bottled vegetables.
Net imports: 8,871
tonnes.
China – 23%. Thailand –
21%. USA – 17%. Italy – 7%. Spain – 3%.
China and Thailand have a
focus on canned indigenous
vegetables. Italy and Spain
are mainly supplying canned
or bottled olives.
Although Singapore does
have a canning industry, it
is not involved in this
market.
Sauces, non-Asian
types.
Net imports: 3,093
tonnes.
USA – 71%. Australia –
11%. UK – 5%. Netherlands –
5%. Germany – 2%.
Heinz (USA) has a sizeable
portfolio of non-Asian sauces
on the shelves, along with
strong presences from a range
of Australian made sauces
(including Unilever and
Masterfoods, the UK (Lea &
Perrins) and Netherlands
(HP).
Singapore’s industry only
produces Asian-type
sauces.
Soups
Net imports: 6,199
tonnes.
Malaysia –
60%. Australia –
11%. USA – 10%.
Campbell Soups (Malaysia
and USA) dominate this
market, with some
competition from Heinz,
mainly from Australia.
No retail packed soups are
produced in Singapore.
Soft drinks.
Net imports: 167
million litres.
Malaysia –
54%. Thailand –
12%. Taiwan – 9%. China – 5%. New Zealand –
4%.
USA – 1.3%.
Malaysia dominates the
market for imports with
supplies of good quality
cordials, fruit juices, sports
drinks and Asian soft drinks
at very competitive prices,
with Fraser & Neave a major
importer from Malaysia.
Taiwan has a focus on
supplying niche Asian type
products, with Yeo Hiap
Seng contract packing some
of these products there.
Imports from the USA and
other non-Asian countries
operate in very small niches.
Singapore has a very
strong soft drink industry,
which includes Coca-
Cola, Pepsico (Yeo Hiap
Seng as the bottler) and
Pokka. The products of
these producers lead the
market.

Beer.
Net imports: 55.8
million litres.
Malaysia –
34%. Germany –
12%. India – 9%. Netherlands –
9%. South Korea –
8%.
USA – 0.7%.
Carlsberg (Malaysia) holds
second place in the market to
the local brewery. The other
brands play around the
brands of APB and Carlsberg
and tend to compete on price
or on premium niche status,
because they do not have the
marketing budgets or the very
strong distribution channels
of the market leaders. India is
quite a recent entrant and is
operating in the budget and
strong beer areas of the
market.
Asia Pacific Breweries
(APB) leads the Singapore
market with its high
profile and very well
distributed brands, which
include Tiger, Heineken,
Guinness, Anchor, ABC
Extra Stout, plus some
niche brands. It competes
very aggressively for
market share with
Carlsberg Malaysia,
which also views
Singapore as its home
market territory.
Wine, not
sparkling.
Net imports: 10.5
million litres.
Australia –
32%. France – 22%. Chile – 12%. Italy – 6%. New Zealand –
6%. USA – 5%.
Australia dominates the retail
market with a range of
products that segment it from
“mass market” (very well
distributed) to premium. In
the mass market, its main
competitors are South
American and some U.S.
wineries. In the premium
area, its main competitors are
France (subject to high
profile promotions), which
has a broad range of
products, along with niche
players like New Zealand,
U.S. premium labels and
some other EU countries.
Singapore does not produce any grape-based
wines.
Spirits, including
brandy, whisky,
UK – 56%. France – 27%.
UK (Scotland) whisky and
French cognac owned by
Although repacking of
UK produced whisky is

rum, gin, vodka
and liqueurs.
Net imports: 5.8
million litres.
USA – 4%. Ireland - 3%. Sweden – 2%.
multinationals continue to
dominate the market for
spirits in an environment
where intensive promotion is
taking place for vodka and
some liqueurs. Other products operate within
niches.
reported to on-going in
Singapore, it does not
produce any alcoholic
drinks that compete in this
market.
Pet food in retail
packaging
Net imports: 9,193
tonnes.
Thailand –
58%. Australia –
21%. France – 6%.
USA – 2%.
This market is dominated by
the products of two
multinationals, namely Mars
Pet Food and Nestle Purina
Pet Food that have plants in
Thailand and the other supply
countries that service demand
in Singapore.
Singapore does not
produce any retail packed
pet foods.
Trends in gross imports
Product group 2008 Tonnes 2009 Tonnes 2010 Tonnes
Pet foods, including dog and cat food 9,815
9,069
9,589
Source: GTIS
Singapore has a very large market for fish and seafood. The bulk of sales through retail channels are warm water
(tropical) fish rather than cool water fish as is supplied by the USA. Singapore’s large format stores supply a
small range of cool water products, most of which have developed demand over the past 20 years. The high end
supermarkets that service expatriates and the upper income Singaporeans tend to have a larger range due to the
demands of their clientele.
Retailers comment that only a small number of non-tropical fresh/chilled or frozen fish and seafood products are
viable for sale through supermarkets. The characteristics of such products are reported to be:
- well promoted, e.g. Norwegian fresh/chilled salmon; or,
- have a good distribution channel, price and functionality, e.g. Norwegian frozen cod; or,
- are unique, when compared to the competition, e.g. smoked salmon (Scotland, Norway, Australia and New
Zealand), other smoked fish (usually to cover expatriate demand) and shellfish such as mussels (New Zealand)
and clams (North America).
The main challenge for cool-water products is the extremely high levels of competition that exist from much
better known, more widely available and more competitively priced tropical species, which are easier to use in
local cooking. This is a big challenge to developing a viable presence in retail channels for cool-water products.
While this is the case, there are opportunities for seasonal cool-water products if they are well promoted to

shoppers, e.g. Shanghai hairy crabs.
The retail markets for salmon, smoked salmon, cod and retail packed mussels were developed from zero base in
the 1990s through years of marketing and consumer education, such that they now have good demand from
Singaporeans, especially salmon. This has been a real success story for Norway’s exporters and their importers
over this 20 year period.
Market
and Its
Size
Major Supply
Countries Strengths of Key Supply
Countries Advantages and
Disadvantages of Local
Suppliers Salmon,
fresh
chilled
Net
imports:
2,270
tonnes.
Norway – 86% Australia –
13%. New Zealand
– 1%.
USA – Not
involved in
this market.
Norway is a highly aggressive
promoter of its fresh/chilled salmon
in Singapore. It is the market maker
and its product is retailed at a price
that is acceptable to Singaporeans,
who now know how to cook this fish
at home.
Singapore does not produce
this type of fish.
Smoked
salmon
Net
imports:
173
tonnes.
Norway –
76%. Denmark –
12%. New Zealand
– 5%. UK – 3%. France – 2%.
USA –
Negligible
supplies.
Norway has very good access to
supermarket shelves in outlets that
service Singapore’s middle and
upper income groups. Norway, and
the food service industry and
sandwich chains in Singapore, have
educated Singaporeans on how they
can use smoked salmon at home, if
they wish to do so. New Zealand and
the UK (Scottish) have good access
to shelves in high end retailers.
Singapore does not produce
much of this type of product
for the mainstream retail
market.
Cod,
frozen
Net
imports:
190
tonnes.
USA – 69%. Australia –
11%. Germany 5%. Norway – 5%.
Frozen cod is generally retailed as a
generic frozen product in many of
Singapore’s supermarkets without
any clear definition of its country of
origin. Norway occasionally
promotes its product at the same
time as its salmon promotions.
Singapore does not produce
this type of fish.
Mackerel,
frozen
Net
Tropical
species – 59%. Norway –
23%.
Demand pull for the tropical species
which have a strategic fit in the local
diet. For cool-water mackerel, supply-
While Singapore does have
locally caught supplies of a
tropical species of this fish,
it is used in a different way

imports:
2,751
tonnes.
Japan – 13%. China – 3%. Germany –
1%.
push from Norwegian and Japanese
suppliers with good distribution
channels. The market is underpinned
by food service demand, with retail
being a sizeable niche with demand
from Japanese and Korean
expatriates being important.
to cool-water mackerel,
which has links to Korean,
Japanese and some northern
Chinese cooking styles.
Mussels,
frozen
Net
imports:
348
tonnes.
New Zealand
– 78%. China – 9%. Chile – 5%. Malaysia –
4%. USA – 3%.
New Zealand has very strong
marketing and distribution for its
mussels in shelf and meat in
Singapore supermarkets and
hypermarkets.
The bulk of locally landed
mussels will be sold fresh
through wet markets and to
food service buyers.
Scallops,
frozen
Net
imports:
634
tonnes.
Japan – 32%. Australia –
27%. USA – 16%. Hong Kong
SAR – 13%.
The market leaders in retail channels
have a focus on quality packed
products and have good access to the
frozen distribution cabinets in
mainstream supermarkets and
hypermarkets. Imported products
also have demand in food service
channels.
None produced for
marketing in retail channels,
although if available some
may be sold through the wet
markets.
IV. Best product prospects
10. Tariff and market access status in Singapore today
The only tariffs on food products are levied on alcoholic beverages. A listing of Customs Duty and Excise Duty
applicable to alcoholic beverages can be obtained from http://www.customs.gov.sg.
Market access for most products is quite straightforward. While this is the case, the Agri-Food and Veterinary
Authority (AVA) is very strict when it comes to the potential for livestock diseases or contamination events that
may harm the Singapore population (which includes large numbers of foreigners, both residents and tourists) or
its food security.

The AVA will, and does, ban imports of products. U.S. beef imports are limited to boneless beef under 30
months of age for example. U.S. bone-in beef imports are still banned, and AVA enforces regid microbiological
testing on meat and poultry imports.
11. Products present in the retail market which have good sales potential
Product Net
Imports
in 2010
Market Growth
Rate Per Annum* Key Constraints to
Market Development Market Attractive for
the USA
Poultry, frozen 96,905
tonnes. Overall, very slow
growth due to
stable demand.
Turkey demand
could grow at
around 3% per
annum.
Competition from local
slaughtering of imported
live poultry and from
lower cost producers,
mainly in Brazil. This has
now marginalised U.S.
products to niches in
mainstream retailers.
Very attractive in the
turkey niche (600
tonnes) and moderately
attractive in chicken
market and duck (400
tonnes) niche, with an
emphasis of higher
quality demand and
niches.
Citrus fruits 59,039
tonnes. Very slow growth
due to mature
demand.
Very strong competition
from China, and price
sensitivity amongst retail
buyers.
Attractive due to high
demand, albeit in a very
slow growing market.
Grapes and
raisins 12,772
tonnes. 2% to 4% per
annum, as demand
is starting to
mature.
Price sensitivity amongst
consumers, although U.S.
products are well liked
because of the quality of
their taste.
Attractive due to high
demand, albeit in a slow
growing market.
Soft fruits,
temperate 3,563
tonnes. 5% to 10% per
annum. Price sensitivity in the
supply chain, ranging from
importer to end consumer
and some price
competition, in
strawberries, with South
Korean products.
Very attractive, as
higher incomes are
creating more demand,
especially for
strawberries.
Stone fruits,
including
avocado
7,315 tonnes.
4% to 6% per
annum. Price sensitivity in the
supply chain from
importers through retail
buyers to end consumers.
Very attractive, as
higher incomes are
creating more demand.
Edible nuts 1,805 tonnes.
Quite static with
limited drivers for
demand in quite a
mature market.
A mature market with
price competition, mainly
from Chinese products.
Attractive as there is
solid demand for U.S.
origin nuts, albeit that
the market is now quite
mature.
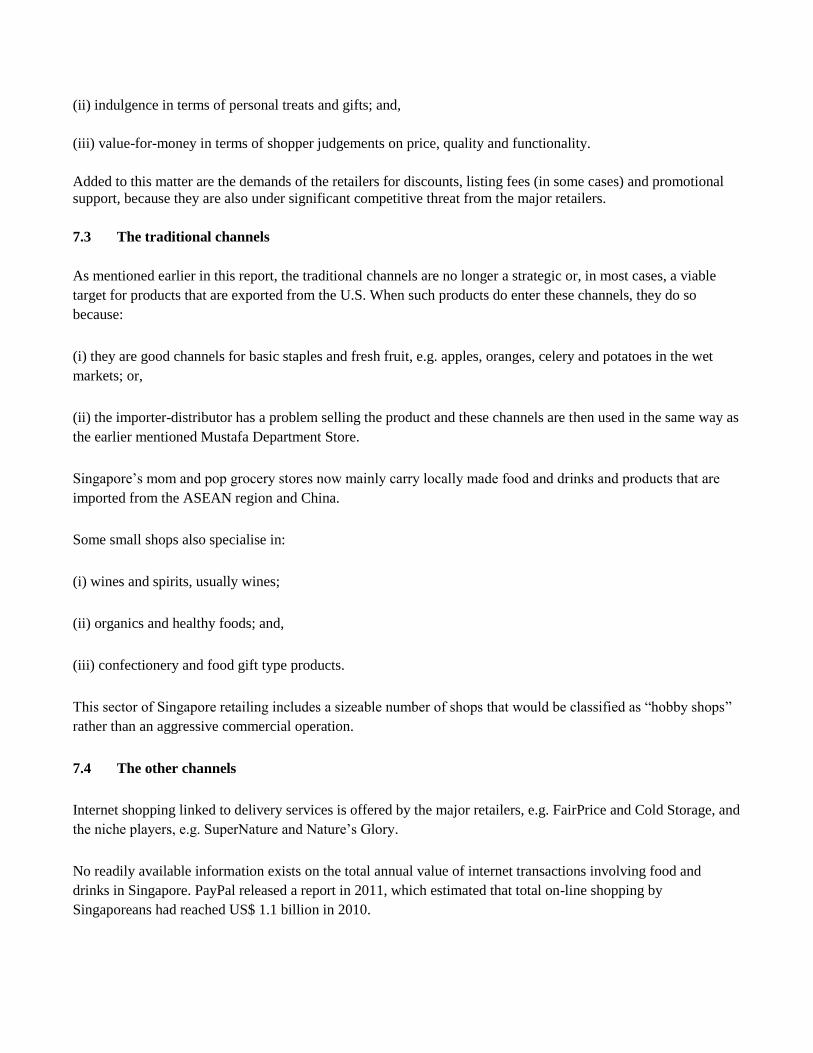
Lettuce, head 9,955 4% to 6% per Although the USA is the Attractive as there is
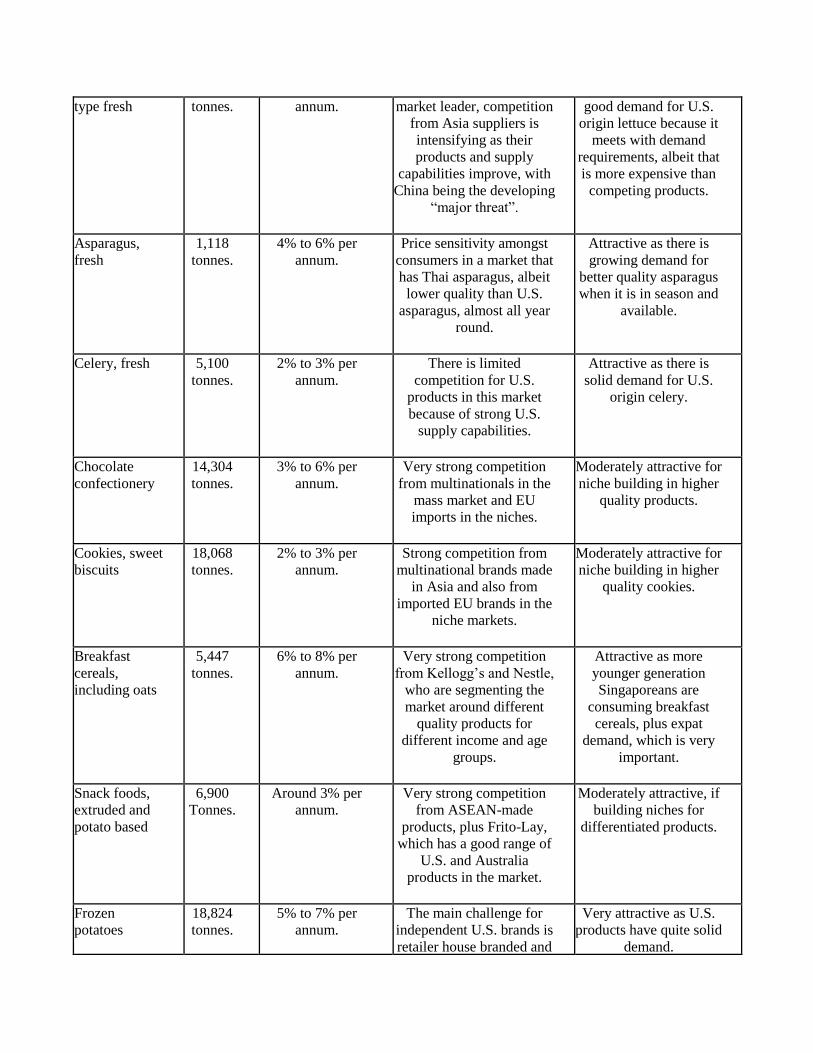
type fresh tonnes. annum. market leader, competition
from Asia suppliers is
intensifying as their
products and supply
capabilities improve, with
China being the developing
“major threat”.
good demand for U.S.
origin lettuce because it
meets with demand
requirements, albeit that
is more expensive than
competing products.
Asparagus,
fresh 1,118
tonnes. 4% to 6% per
annum. Price sensitivity amongst
consumers in a market that
has Thai asparagus, albeit
lower quality than U.S.
asparagus, almost all year
round.
Attractive as there is
growing demand for
better quality asparagus
when it is in season and
available.
Celery, fresh 5,100 tonnes.
2% to 3% per
annum.
There is limited
competition for U.S.
products in this market
because of strong U.S.
supply capabilities.
Attractive as there is
solid demand for U.S.
origin celery.
Chocolate
confectionery 14,304
tonnes. 3% to 6% per
annum. Very strong competition
from multinationals in the
mass market and EU
imports in the niches.
Moderately attractive for
niche building in higher
quality products.
Cookies, sweet
biscuits 18,068
tonnes. 2% to 3% per
annum.
Strong competition from
multinational brands made
in Asia and also from
imported EU brands in the
niche markets.
Moderately attractive for
niche building in higher
quality cookies.
Breakfast
cereals,
including oats
5,447 tonnes.
6% to 8% per
annum. Very strong competition
from Kellogg’s and Nestle,
who are segmenting the
market around different
quality products for
different income and age
groups.
Attractive as more
younger generation
Singaporeans are
consuming breakfast
cereals, plus expat
demand, which is very
important.
Snack foods,
extruded and
potato based
6,900 Tonnes.
Around 3% per
annum. Very strong competition
from ASEAN-made
products, plus Frito-Lay,
which has a good range of
U.S. and Australia
products in the market.
Moderately attractive, if
building niches for
differentiated products.
Frozen
potatoes 18,824
tonnes. 5% to 7% per
annum. The main challenge for
independent U.S. brands is
retailer house branded and
Very attractive as U.S.
products have quite solid
demand.

private label products that
are starting to dominate
frozen food displays.
Frozen
vegetables 1,173
tonnes. Very slow growth
as Singaporeans
prefer fresh
vegetables.
Competition from retailer
house branded products
that are starting to
dominate frozen food
displays, in preference to
independent brands.
Low level attractiveness.
Sauces, non-
Asian 3,093
tonnes.
5% to 8% per
annum. The market for such sauces
is tied to demand from
expats or to a fit in the
local diet. The key sauces
in the market are either
supplied by strong
multinationals, e.g. Kraft
and Heinz, or another
strong brand.
Moderately attractive
under conditions of
strong competition.
*: Trade estimates on the basis that Singapore’s annual economic growth takes place at an average of between
3% and 5% per annum.
12. Products not present in significant quantities in the retail market but that have good sales potential
Product Net
Imports
in 2010
Market Growth
Rate Per
Annum*
Key Constraints to Market
Development Market Attractive
for the USA
Pork 71,661
tonnes. 1% to 2% per
annum, because
pork is a staple.
Very strong competition from
Australian pork, which has
strong air-flown physical
distribution access and good
brand values. Additionally,
strong competition from pork
from the local slaughterhouses
and from frozen pork.
Moderately attractive,
but only in the quality
area of the market, i.e.
higher end niches.
Cheese in all
forms 9,734
tonnes. 3% to 5% Very strong competition from
Australia and New Zealand,
which have a very strong and
developed presence in
channels. Additionally strong
competition in niche cheeses
from EU countries, especially
Denmark, France and the
Low level
attractiveness, unless
niche building.

Netherlands.
Ice cream 14,443
tonnes. 3% to 5% Strong competition from the
multinational ice cream
companies (Unilever and
Nestlé), which are segmenting
the market from mass through
to super premium using
different brands.
Moderately attractive,
with an emphasis on
higher end branded
products.
Apples and
pears 61,864
tonnes. 2% to 3% per
annum. Very strong competition from
China (price and apparent
quality) and France (supplier-
push marketing activities) in
the northern hemisphere
season.
Attractive as there is
clear demand for
apples and pears from
the Developed World,
including the USA.
Potatoes, fresh
table 40,698
tonnes. 3% to 5% per
annum.
Price sensitivity and
competition from lower cost
Asian supply countries, i.e.
China, Bangladesh and
Indonesia.
Attractive because
retailers like to have
U.S. and Australian
origin potatoes in their
fresh produce
displays.
Broccoli and
cauliflower,
fresh
14,595
tonnes. 3% to 5% per
annum.
Massive competition from
China, with its low pricing and
apparent good quality driving
more expensive Developed
World supplies out of the
market.
Moderately attractive
because demand for
these products, in
particular broccoli is
strengthening.
Coffee,
ground
roasted
2,234 tonnes.
6% to 8% per
annum, largely
driven by the
high end coffee
shop chains.
In retail, very strong
competition from the locally
produced Boncafe and Suzuki
brands, and also key brands
imported from the EU.
Low level
attractiveness in retail.
Processed
meats and
poultry.
24,427
tonnes. 3% to 5% per
annum. Very strong competition from
ASEAN-made products and
some multinational brands, e.g.
Libby’s, Tulip and Spam.
Moderately attractive.
Sausages 6,321 tonnes.
4% to 6% per
annum. Price competition from Brazil
and the EU. The commodity
Attractive because it
is still growing.

nature of this market, which is
also underpinned by price
sensitivity.
Sugar
confectionery 10,760
tonnes. Quite static in all
segments, with
no significant
growth drivers
present.
Very high levels of competition
from ASEAN/Asia-made
products (including
multinationals), with a very
large number of products in a
market that has become
stagnant over the past 5 years,
after many years of quite solid
growth.
Low level
attractiveness, unless
niche building.
Fruit juices 34,927
tonnes. 5% to 7% per
annum.
Strong competition from long
established brands, both local
and foreign that have built their
market presence and shares on
the back of strong physical
distribution since the early
1990s.
Attractive due to
continuing growth in
demand for healthy
and nutritious
products.
Canned and
bottled
vegetables
8,871 tonnes.
Very slow
growth because
Singaporeans
prefer fresh
products.
Singaporean food culture,
which is tied to fresh
vegetables and does not have
much demand for canned
vegetables in home cooking.
Moderately attractive
because there is
demand for U.S.
products.
Soups 6,199 tonnes.
3% to 5% per
annum.
High level competition from
longstanding multinational
brands in canned and powdered
soups, e.g. Campbell
(Malaysia, USA and China),
Heinz (Australia and the UK)
and, in ASEAN-made
powdered soups under brands
owned by Nestle and Unilever.
Low level
attractiveness, unless
building a niche.
Wine, not
sparkling 10.8
million
litres.
3% to 5% per
annum.
Price sensitivity towards more
expensive wines, a continuing
lack of local knowledge about
wines and price competition in
a market flooded with a
massive number of different
labels.
Very attractive
because the market is
continuing to grow
underpinned by good
consumer (albeit quite
confused) interest in
consuming wines.
Spirits,
alcoholic 5.8
million Liters.
Quite static due
to competition,
mainly from
wine.
Dominated by well funded
multinational brands that are
fighting for market share in the
broader alcoholic drinks
Low level
attractiveness, unless
niche building.

market.
Pet food 9,193 tonnes.
2% to 4% per
annum. Competition from the
multinational pet food
companies who dominate the
retail shelf space in many of
the pet food channels, except
the small specialty shops.
Moderately attractive
for building specialty
niches.
Cod, frozen 190 tonnes.
4% to 6% per
annum,
depending on
level of
marketing
activities and
promotions.
Low level demand in retail
channels because this fish is
still not well understood, albeit
that Norway has been
promoting it for over 10 years.
Low level
attractiveness in retail.
Mussels
frozen 348
tonnes. 3% to 5% per
annum. Price sensitivity amongst
consumers in retail channels.
Very strong competition from
New Zealand, which has good
physical distribution and
coverage for its products in
Singapore.
Low level
attractiveness, unless
niche building.
Scallops,
frozen 634
tonnes. Very slow
growth. Price sensitivity amongst
consumers in retail channels,
coupled with price competition
between suppliers.
Low level
attractiveness, unless
niche building.
13. Products not present because they face significant barriers in the retail market
Product Imports
in 2010 Market Growth
Rate * Key Constraints to
Market Development Market Attractive
for the USA
Beef 18,538
tonnes. 4% to 6% per annum. Continuing regulatory
barriers and massive
competition from other
suppliers with easier access
and good distribution and
branding.
Attractive for niche
building.
Offal 12,191
tonnes. Quite static, with not
much growth
potential due to
upgraded meat
demand.
Food safety issues (for
bovine offal) and price
sensitivity. Pig’s offal from
locally slaughtered pigs,
which is readily available.
Low level
attractiveness.

Butter and
dairy spreads 15,185
tonnes. Quite static with not
much growth
potential in retail.
Very high levels of
competition for chilled
retail display space and
very strong distribution of
longstanding brands.
Low level
attractiveness, unless
niche building.
Yogurt 7,362 tonnes.
Quite static as
competition from
local products is
fierce for the
Singaporean area of
the market.
Competition from local
brands in the Singaporean
area of the market and
Australian brands in the
expat area of the market.
Low level
attractiveness, unless
niche building.
Liquid milk 62.5
million
litres.
4% to 6% per annum. Massive competition from
local brands and price
competitive products,
mainly imported from
Australia, including retailer
labeled products.
Not attractive, unless
focused on supplying
very small expatriate
niches and have
distribution access to
do this.
Middle
Eastern type
dates
637 tonnes.
2% to 3% per annum. Price competition from the
Middle East and receptive
price sensitivity in the main
demand area of the market.
Low level
attractiveness.
Tea leaf and
bags 1,450
tonnes. 2% to 4% per annum. Very high levels of
competition from the key
brands that are fighting for
retail space, Lipton
(Indonesia), Dilmah (Sri
Lanka), Twinings (UK) and
Boh (Malaysia).
Not attractive.
Processed
fish and
seafood,
higher
processed
products
38,306
tonnes. Very slow growth. Massive competition from
ASEAN-made products,
which meet Singaporean
demands on products and
pricing.
Not attractive, unless
focused on supplying
very small expatriate
niches and have access
to do this.
Soft drinks 167
million
litres.
2% to 4% per annum. Massive competition from
locally made products
(multinational brands) and
imports from ASEAN and
other Asian countries, plus
local taste issues.
Low level
attractiveness, unless
niche building.
Beer 55.8
million
Very slow as the beer
market is already
Massive competition from
local and Malaysia brewed
Low level
attractiveness, unless

litres. saturated. multinational brands and
price competitive imports
from the EU and some
Asian countries.
niche building.
Salmon, fresh
chilled 2,270
tonnes. 5% to 10%,
depending on the
aggressiveness of
marketing.
Norway’s dominant
position in the market as
supported by very strong
distribution and marketing
activities.
Low level
attractiveness in retail.
Smoked
salmon 173
tonnes. Very slow growth,
unless there is
aggressive promotion.
Very small niche with well
established suppliers from
the EU and New Zealand
that are able to dominate
retail shelf space.
Low level
attractiveness in retail.
Mackerel,
frozen 2,751
tonnes. 3% to 5% per annum. Norway and Japan’s
physical distribution
strengths and competitive
price points.
Low level
attractiveness in retail.
END OF REPORT