singaporean youth athletes author(s) koon teck koh, masato ...author(s) koon teck koh, masato...
TRANSCRIPT

Title The coaching behavior scale for sport: Factor structure examination for
Singaporean youth athletes Author(s) Koon Teck Koh, Masato Kawabata and Clifford J. Mallett Source International Journal of Sports Science and Coaching, 9(6), 1311-1324 Published by SAGE Publications Copyright © 2014 SAGE Publications This is the author’s accepted manuscript (post-print) of a work that was accepted for publication in the following source: Koh, K. T., Kawabata, M., & Mallett, C. J. (2014). The coaching behavior scale for sport: Factor structure examination for Singaporean youth athletes. International Journal of Sports Science and Coaching, 9(6), 1311-1324. http://dx.doi.org/10.1260/1747-9541.9.6.1311
Notice: Changes introduced as a result of publishing processes such as copy-editing and formatting may not be reflected in this document. The final, definitive version of this paper has been published in International Journal of Sports Science and Coaching, Volume 9, Issue 6, December 2014 by SAGE publishing. All rights reserved.

Running head: COACHING BEHAVIOR SCALE FOR SPORT 1
The Coaching Behavior Scale for Sport:
Factor Structure Examination for Singaporean Youth Athletes
Koon Teck Koh1, Masato Kawabata1,2, and Clifford J. Mallett2
1Nanyang Technological University,
National Institution of Education, Singapore 637616, Singapore
E-mail: [email protected]
2The University of Queensland,
School of Human Movement Studies, Brisbane QLD 4072, Australia

COACHING BEHAVIOR SCALE FOR SPORT 2
ABSTRACT
The Coaching Behavior Scale for Sport (CBS-S) is designed to evaluate coaches’
involvement in developing athletes, taking into considerations the complex training and
competition environment. Although CBS-S has been used in a number of empirical studies,
the factor structure of the instrument has not been examined rigorously. The present study
was, therefore, conducted to assess the factor structure of the CBS-S for Singaporean youth
athletes. A total of 519 participants completed the CBS-S, and their responses were examined
with confirmatory factor analysis (CFA) and recent exploratory structural equation modeling
(ESEM). Both seven-factor CFA and ESEM models fit to the sample data adequately. In
addition, the sizes of factor loadings on target factors were substantial and found comparable
between the CFA and ESEM solutions. The findings from this study supported the factorial
validity of the CBS-S for the present sample.
Keywords: Measurement, Coaching Effectiveness, Athletes’ Perception

INTRODUCTION
Coaching is a highly complex process and coaches are required to undertake a variety of
tasks such as in-depth planning of training and competition, organizational tasks, and
mentoring of athletes, which extend well beyond teaching skills and tactics.1 Coaches’ ability
to deliver these key expectations is likely to determine their coaching effectiveness. Effective
coaching is crucial to the development of athletic talent; however, the outcome of athletes’
performance (i.e., win or loss) has been the dominant method to evaluate coaches’ work and
effectiveness.2 Mallett and Côté2 argued that such an approach is problematic because it does
not take into account other important aspects of coaching (e.g., athlete-coach relationship),
which might influence performance results. Increasingly, researchers have suggested
evaluating coaches’ abilities and performances from a multidimensional perspective.1,2
Capturing the quality of coaches’ work is the key to the ongoing professional development of
coaches.2
Several conceptual frameworks and models have been developed to organize and
explain the meaning of coaching effectiveness from high performance and youth sport
coaching contexts.3 Some of the most influential and often cited models are: the Mediational
Model of Coaching Behaviors,4,5 the Multidimensional Model of Coach Leadership,6,7 the
Model of Coaching Effectiveness,8 and the Coaching Model.9 The four models used to
describe coaching effectiveness share the following assumptions: a) athletes’ development is
the key focus for coaches, b) coaches’ beliefs and values closely linked to coaching
effectiveness, and c) coaching behaviors must be adapted to meet the specific needs of
athletes in the specific coaching context.3 Because the role of the coach should be focused on
the holistic development of athletes),10 he or she has “a significant effect on athletes’
performance as well as their psychological or emotional well-being”.8 Therefore, having an

instrument to assess athletes’ perceptions and evaluation of coaches’ competencies in
coaching is important to the continued development and refinement of coaching effectiveness
models.11
A range of methodologies have been developed and used to measure coaches’
effectiveness. One of the methodologies is to observe what coaches do and how they behave
during training sessions and competitions. Several instruments have been used in empirical
research to systematically observe coaches’ behaviors (e.g., Coach Behavior Assessment
System;4 Coach Analysis and Intervention System),12 and to some extent, interaction with
athletes (State Space Grid Method by Erickson).13 In these studies, coaching behaviors are
systematically assessed by trained observers, which are based on criteria described in the
instrument.
Another methodology is to evaluate coaches’ behavior from the athletes’ perspective.
Several self-report instruments such as the Leadership Scale for Sport,7 the Coaching
Behaviour Assessment System,4 the Decision Style Questionnaire,14 and the Controlling
Coach Behavior Scale15 have been developed to assess athletes’ perceptions of coaching
behaviours (e.g., efficacy, decision-making, controlling, or social-support styles) associated
with athletes’ outcomes (e.g., satisfaction, motivation, and enjoyment). Other instruments
such as the Coaching Evaluation Questionnaire16 and the Coaching Behavior Questionnaire
(CBQ)17 are designed to assess athletes’ evaluative reactions to specific aspects of their
coach’s behavior such as personal qualities, professional relationships, and organizational
skills. However, these instruments, such as CBQ, only measure certain coaching behaviors
(e.g., negative activation and supportiveness, and emotional composure) and targeted
scenarios (e.g., competition against a top opponent) rather than a more holistic view of the
range of coaching behaviors, which has obvious limitations.18 On the other hand, the

Coaching Competency Scale,18 Coaching Competency Scale II – High School Teams,19 and
Coaching Success Questionniare-220 have provided evidence to support athletes’ evaluation
of their coach’s abilities to influence athletes’ learning outcomes (e.g., self-confidence) 20 and
performance, and predict athletes’ satisfaction with the coach.11 Nonetheless, more research
is warranted to investigate the utility of coaching competency and other well-defined
instruments within broader conceptions of coaching effectiveness to advance our knowledge
in this field of research.11 One such measure is the Coaching Behavior Scale for Sport (CBS-
S), developed by Côté and colleagues.10
Côté and colleagues9 developed the Coaching Model (CM) using an expert systems
approach to examine how expert coaches behaved. This model of coaching behaviors is
suitable for all forms of coaching, including participation and performance.9 Central to the
CM is the notion that expert coaches develop “mental models” that shape how coaches think
about the potential of players/teams and subsequently direct their behaviors in competition,
organization, and training. Consistent with Mageau and Vallerand’s motivational model,21 the
CM proposes that coaches’ behaviors are shaped by the interdependency between a coach’s
own characteristics, his/her perceptions of an athlete’s characteristics, and the context in
which coaching occurs (participation or performance). Athletes are key actors in the coach-
athlete relationship and their views of the quality of coaching they receive are central to
informing an understanding of that work.22 Coaches are performers in their own right and
athletes’ feedback about the quality of coaching they receive should complement other data
in making judgments about the performance of coaches.2 To collect data from athletes about
the coaching they received, Côté and colleagues10 developed the CBS-S based on the CM. A
key benefit of the CBS-S is that the instrument captures multidimensional aspects of coaches’
work (discrete behaviors) that can be measured.

The CBS-S measures seven dimensions of a coach’s consistent involvement with the
athletes in the complex training and competition coaching environments.2 They are Physical
Training and Planning (the coach’s involvement in the athlete’s physical training and
conditioning for training and competition), Technical Skills (the coach’s provisions of
feedback, demonstration, and cues), Goal Setting (the coach’s involvement in identifying,
developing, and monitoring the athlete’s goals), Mental Preparation (the coach’s involvement
in providing the athlete with advice on how to perform well under pressure), Competition
Strategies (the coach’s constructive interaction with the athlete in competition), Personal
Rapport (the coach’s approachability, availability, and understanding of the athlete), and
Negative Personal Rapport (the coach’s use of negative techniques such as fear and yelling
for coaching). Côté and colleagues10,23,24 examined the psychometric properties of the
original CBS-S that consisted of 44 items. The factor structure of the original CBS-S was
examined by conducting exploratory factor analysis on the data collected from 205 young
athletes (Mage = 19.6, SDage = 4.4) from seven sports (majorities were from rowing, track and
field, and rugby) and extracted the seven factors mentioned earlier.10 Baker and coworkers
examined predictive validity of the CBS-S responses on sport anxiety23 and coaching
satisfaction24 by conducting multiple regression analyses. In the studies, participants were 228
young athletes (Mage = 18.3, SDage = 3.8)23 from 15 sports (majorities were from swimming,
soccer, volleyball, and rowing) and 198 young athletes (Mage = 17.8, SDage = 4.0)24 from 14
sports including team and individual sports. While the scale has been used in a number of
empirical studies,23,24,25 its psychometric properties have not been assessed rigorously by
using more advanced multivariate statistics. Moreover, the CBS-S was developed from a
sample in Canada and has been used mainly for Caucasian adult athletes. Its psychometric
properties have not been examined on data from other cultures, contexts, and age groups, to

ensure that the instrument is robust, reliable and valid. Hence, this lack of empirical
examination might limit the generalization of research findings to other cultural, ethnic, and
age groups.
In Singapore, more than 200 championships over 29 sports are organized annually by
the Singapore School Sports Councils for primary and secondary schools, and approximately
55,000 student-athletes have competed in the National Sports Games.26 These figures show
that large amount of students (about one-tenth of Singaporean students) competed in the
games. Thus, it is critical for student’s positive participation in sports to have a valid and
reliable instrument for the assessment of a coach’s ability in developing athletes’ critical
outcomes (e.g., competence, confidence).
Although Mallett and Côté2 argued that the responses to the CBS-S provide a
comprehensive profile of coach behaviors that can be useful in assessing coaching
performances and competencies, such an argument is based on the premise that the
hypothesized factor structure of the CBS-S is valid. Given that developmental changes are
significant from childhood to early adulthood, the hypothesized factor structure that was
previously supported with young adults may not be tenable for children or adolescents. For
example, Marsh27 reported that the self-concepts of very young children tended to be
uniformly high across different domains and relatively less differentiated, whereas self-
concept became more differentiated during preadolescence. In the present study, therefore,
the factor structure of the latest version of the CBS-S was rigorously assessed for the data
collected from youth athletes using both confirmatory factor analysis (CFA) and exploratory
structural equation modeling (ESEM).

METHOD
PARTICIPANTS AND PROCEDURE
Participants were 519 Singaporean competitive basketball players (378 boys and 124 girls; 17
participants did not report their gender) who have competed for their schools in the
interschool competitions organized by the Ministry of Education (MOE), Singapore. They
were recruited from 21 schools in support of MOE across the all four school zones in
Singapore. Participants’ ages ranged from 11 to 18 years (97 primary school students, 379
secondary school students, and 43 junior college students). The study was approved by an
institutional review committee and adhered to the guidelines for ethical practice. Permission
for conducting the study was also from the MOE and school principals. Informed consent
was received from each participant’s parent, and participants were told that participation was
voluntary and they were free to withdraw from the study at any time. Surveys were conducted
during the post season for all the participants. Because bilingualism is a cornerstone of
Singapore’s educational system, students are taught in English at schools in Singapore.28 All
participants were fluent English speakers and therefore, the questionnaires written in English
were administered at the targeted schools. Participants were asked to think about the current
coach who was responsible for the entire season with them. The principal investigator was on
site to answer questions and collect the completed questionnaires.
MEASURES
Perceived Coaching Behavior. The Coaching Behavior Scale for Sport (CBS-S)10 is an
instrument that assesses coaching behaviors from athletes’ perspectives. It has been modified
and the current version of the CBS-S consists of 47 items,2 measuring seven dimensions of
coaching behaviors: Physical Training and Planning (7 items), Technical Skills (8 items),
Goal Setting (6 items), Mental Preparation (5 items), Competition Strategies (7 items),

Personal Rapport (6 items), and Negative Personal Rapport (8 items). Example items from
the CBS-S are “My coach provides me with structured training sessions” (Physical Training
and Planning), “My coach makes sure I understand the techniques and strategies I am being
taught” (Technical Skills), “My coach shows confidence in my ability during competitions”
(Competition Strategies), and “My coach shows understanding for me as a person” (Personal
Rapport). Respondents were asked to rate their coach’s behaviors by responding to each of
the items on a 7-point Likert scale, ranging from 1 (never) to 7 (always). One item about
ensuring competition facilities and equipment was excluded from the subscale of competition
strategies because of its irrelevance to the present sample’s sport (i.e., basketball). Therefore,
a 46-item revised version of the CBS-S was employed in this study.
Coaching Satisfaction. To evaluate concurrent validity of the CBS-S, athletes’
satisfaction with their coaches’ coaching behaviors was measured with the Leadership
subscale of the Satisfaction Scale that consists of two subscales (Leadership and Personal
Outcome).29 In the study by Chelladurai and colleagues29 with Canadian and Japanese
undergraduate male athletes, the internal consistency coefficient (Cronbach’s alpha) of the
Leadership scale was .95 and it was significantly correlated with leader behaviors perceived
by the athletes for both cultural samples. Example items from the subscale are “The
leadership provided by my coach” and “My coach’s ability to teach me.” Respondents
indicated the degree of their satisfaction with their coaches’ coaching behaviors by replying
to each of seven items on a 7-point Likert scale, ranging from 1 (dissatisfied) to 7 (very
satisfied).
DATA ANALYSES
CFA and ESEM were carried out using Mplus (Version 6.12)30 based on Mplus robust
maximum likelihood estimation (MLR). In typical CFA, each indicator is specified to load
onto only one factor (target factor) and no cross-loadings are allowed. This stringent
requirement, however, often causes poor fit of the hypothesized model to the data and leads
to major model modification to find a well-fitting model.31 Moreover, misspecification of
zero cross-loadings usually inflates factor correlations to some extent unless all non-target
loadings are almost zero.31,32,33 Marsh and colleagues32,33 demonstrated the usefulness of
ESEM, an integration of CFA and exploratory factor analysis to overcome these
methodological issues related to the traditional CFA approaches. They advised that,
“subsequent CFA studies routinely consider ESEM solutions as a viable alternative, even
when the fit of CFA solutions is apparently acceptable”.32 Therefore, both approaches are
employed to examine the factor structure of the CBS-S and their solutions were compared for
an accurate interpretation of individual parameters.34 In ESEM, all items are allowed to load
on every factor and all factor loadings are estimated in the ESEM model by imposing
appropriate restrictions on the factor loading matrix and the factor covariance matrix32,33 (see
also Asparouhov and Muthén31 for further details of the ESEM approach and identification
issues). In addition, an oblique geomin rotation was used because a) the factors measured by
the CBS-S are expected to covary and b) the geomin rotation criterion is the default in Mplus
and found the most effective criterion when the true factor loading structure is unknown.31
The Expectation Maximization Algorithm was used to treat missing data (less than 0.5%
missing responses for each scale). To assess overall model fit, several criteria were used: the
MLR chi-square statistic,35 the comparative fit index (CFI),36 the Tucker-Lewis index (TLI),
37 and the root mean square error of approximation (RMSEA),38 and the standard root mean
square residual (SRMR).39 Values on the CFI and TLI that are greater than .90 and .95 are
generally taken to reflect acceptable and close fits to the data. For the RMSEA, values of .05
or less indicate a close fit, and .08 or less indicate an adequate fit.40 Finally, values on the

SRMR that are less than .08 indicate an adequate fit.41 In a well-fitting model, this value
should be small—.05 or less.
RESULTS
PRELIMINARY ANALYSES
Descriptive Statistics. Descriptive statistics for the CBS-S subscale and item scores are
presented in Tables 1 and 2. Means and standard deviations of the 46 item scores ranged as
follows: from 2.44 to 6.03 for means and from 1.14 to 2.01 for standard deviations. The items
with the lowest and highest mean scores were from Negative Personal Rapport (“My coach
uses power to manipulate me”) and Technical Skills (“My coach provides visual examples to
show how a skill should be done”), respectively. CBS-S scores were also examined for their
normality. Univariate skewness and kurtosis of all item scores, except for Item 12, were less
than the acceptable limit of ±2.00.42 However, substantial multivariate kurtosis was observed
(Mardia’s normalized estimate = 115.11) and the CBS-S scores were considered non-
normally distributed. Thus, the MLR parameter estimator was appropriate for subsequent
data analyses (i.e., CFA and ESEM) because of its robust to non-normality.35
Multilevel Structure of Data. Because athletes were drawn from basketball teams
competing for their schools, the athletes’ responses were likely to be nested within their
teams/schools. Intraclass correlation coefficients (ICCs) of the observed variables were
examined to find out whether individual-level data (athletes’ responses) were non-
independent of the group-level factors (teams/schools). ICC values represent the ratio of
between-group variance to total variance and range from 0.0 to 1.0.43 Muthén44 stated that
data are considered hierarchically structured when group-level numbers exceed 15 and ICC
values are of .10 or larger. Individual-level ICCs ranged from .05 to .20 (M = .13), with 37 of

the 46 values being greater than .10 (see Table 2). These results indicated that athletes’
responses to the CBS-S were hierarchically structured and nested within teams/schools.
Because of the hierarchically structure of the data, multilevel modeling was considered
suitable to examine the factor structure of the CBS-S responses. However, multilevel CFA
models with MLR or weighted least square mean-adjusted estimation45 produced improper
solutions due to the small sample size (21 teams/schools) at the group level. Hox and Maas46
recommended that the group-level sample size should be about 100. Therefore, single-level
analyses focusing on the individual level were employed for the following analyses,
acknowledging that standard errors might be underestimated.47
CFA AND ESEM
Factor Structure. The CFA model provided a satisfactory fit to the data (MLRχ2 [968, N =
519] = 2146.69, p < .001; CFI = .911, TLI = .905, RMSEA = .048, SRMR = .059). Factor
loadings and latent factor correlations in the CFA solution are presented in Tables 2 and 3,
respectively. All factor loadings were statistically significant (range = .42–.90, M = .77) and
correlations among the seven factors ranged from -.10 to .81 (M = .70). The corresponding
ESEM also provided an acceptable fit to the data (MLRχ2 [734, N = 519] = 1941.11, p
< .001; CFI = .933, TLI = .906, RMSEA = .056, SRMR = .024). Factor loadings and latent
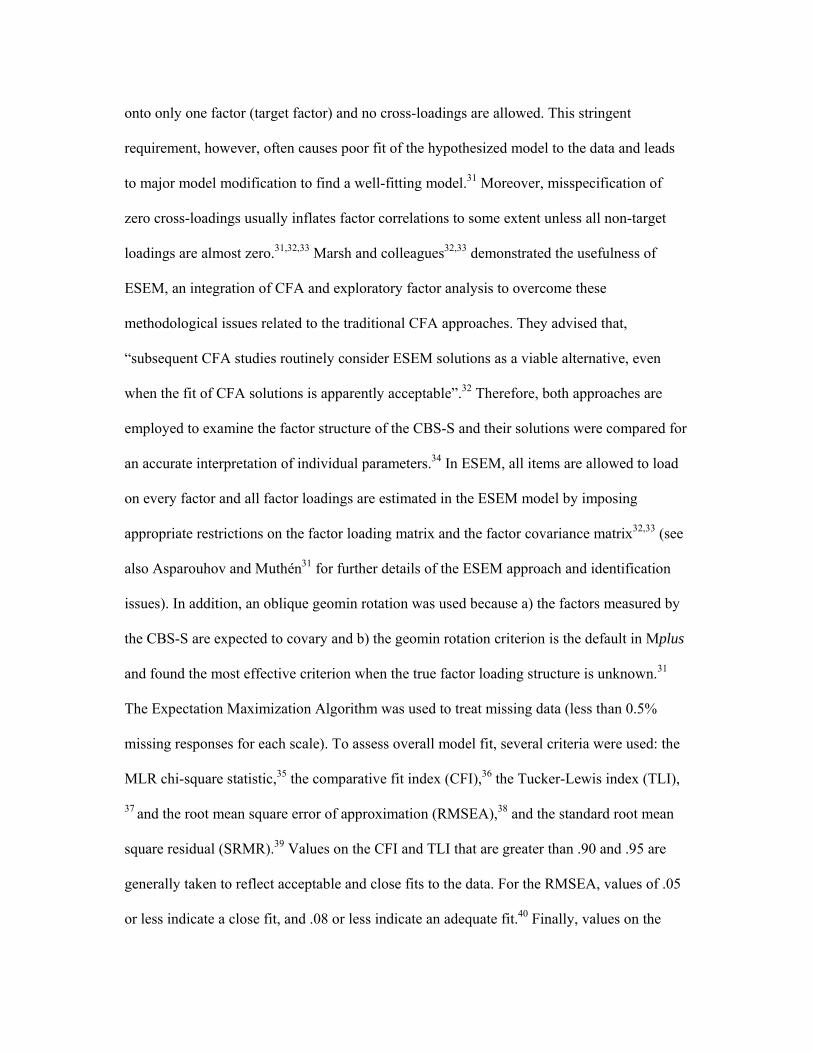
factor correlations in the ESEM solution are indicated in Tables 3 and 4, respectively. All
items loaded on their target factors more than non-target factors (the range of factor loadings
on target factors = .25–.89, M = .63), and latent factor correlations ranged from -.10 to .53 (M
= .35). In comparison with the ESEM solutions, the size of factor loadings and inter-factor
correlations was found inflated in the CFA solution by fixing all cross-loadings to be zero.
Since the hypothesized seven factors were tenable based on the CFA and ESEM solutions,

the internal consistency of the CBS-S factors was assessed with Cronbach’s alpha. As
presented in Table 4, the coefficients of the seven factors ranged from .82 to .93 (M = .90).
Concurrent Validity. Latent factor correlations between the CBS-S and the Coaching
Satisfaction Scale responses were examined to assess concurrent validity of the CBS-S
responses. As described earlier, the substantial bias was observed in the parameter estimates
in the CFA solution. Therefore, the CBS-S factors were specified as ESEM factors and the
Coaching Satisfaction factor was identified as a CFA factor. In this model, all CBS-S factors
were freely correlated with the Coaching Satisfaction factor. It was proposed that except for
Negative Personal Rapport, the CBS-S factors would correlate with Coaching Satisfaction in
a positive direction. Because 21 participants missed responding to all Coaching Satisfaction
items, their data were excluded from this analysis. Internal consistency coefficient for
Coaching Satisfaction was .96. The model provided an acceptable fit to the data (MLRχ2
[1063, N = 498] = 2626.83, p < .001, CFI = .929, TLI = .908, RMSEA = .054, SRMR = .024).
All latent correlations between the CBS-S and Coaching Satisfaction factors were significant,
ranging from -.16 to .62 (see Table 5). As expected, all CBS-S factors except for Negative
Personal Rapport were positively correlated with Coaching Satisfaction. These results
supported the concurrent validity of the CBS-S responses.
DISCUSSION
Quality coaching is central to the development of athletic talent; therefore, it is essential to
adequately assess the quality of coach’s work and effectiveness beyond the outcome of
athletes’ performance (i.e., win or loss). Although the CBS-S has been used in a number of
empirical studies and recommended as a useful instrument for assessing athlete’s perceptions
of coach behaviors,2 the factor structure has not been rigorously examined for youth athletes

using advanced statistical procedures. In order to resolve this gap in the literature, the factor
structure of the CBS-S was carefully examined in the present study for Singaporean youth
athletes by using CFA and ESEM approaches. The results from both approaches indicated
that the seven-factor structure model adequately represented the CBS-S responses. In addition
to model assessment as a whole, convergent and discriminant validity of the seven factors
was supported through the examination of individual parameter estimates. Internal
consistency estimates for the seven factors were also found to be satisfactory and indicated
that all subscales were internally consistent.
The other significant finding in the current study was that a comparison of the CFA
and ESEM solutions was useful to interpret individual parameters appropriately. The sizes of
factor loadings on target factors were substantial and found comparable between the CFA and
ESEM solutions. This finding indicated that the items were good indicators for their target
factors. Although ESEM is currently only available in the Mplus statistical package, it is
recommended considering ESEM solutions as a part of multivariate strategies for construct
validity assessment.
In interpreting the current results, there are several limitations, which should be
acknowledged. First, the data analyzed in the present study were hierarchically structured.
Due to the improper solutions caused by the small size at the group level, however, multilevel
analyses could not be completed and single-level analyses were employed instead. Therefore,
caution is warranted to interpret the findings from this study because standard errors might be
underestimated.47 Second, the findings are based on one sample consisting of basketball
players only. Although they were recruited from elite youth basketball teams at different
school levels, coaching behaviors for team sports might be different from those for individual
sports. Cross-validation studies are required to confirm the seven-factor structure of the CBS-

S is also valid for the samples consisting of the athletes playing more diverse sports. In
addition, the scale was originally developed with Canadian athletes and has been used in
Canada, the United States, and Australia.2,10 Cross-validation studies, therefore, should be
conducted with those English-speaking samples. Second, measurement invariance across
gender or school levels could not be examined due to sample size limitations (i.e., small
numbers of female athletes as well as primary school and junior college students). In fact, the
examination of measurement invariance across gender was attempted in the current study;
however, the seven-factor ESEM model did not provide an acceptable fit to girls’ data
because of its small sample size and could not proceed further to test measurement
equivalence. Given that measurement invariance is required to make appropriate group
comparison,48 invariance tests should be conducted for the CBS-S responses across common
comparison groups (e.g., gender, age, performance levels, or different sports). To illustrate
this issue, a 2 (gender) × 3 (school level) between-subjects multivariate analysis of variance
(MANOVA) was additionally conducted on the CBS-S 7-subscale scores. Main effects of
gender and school level were found significant (for gender: Pillai’s Trace = .04, F[7, 490] =
2.97, p < .01, partial η2 = .04; for school level: Pillai’s Trace = .22, F[14, 982] = 8.46, p
< .001, partial η2 = .11). However, these significant mean differences cannot be interpreted
appropriately until the measurement invariance is achieved across the groups at the unit
(factor loading) and origin (intercept) level.48
There are several practical implications from this study. First, the CBS-S has been
considered practically useful to provide feedback to coaches about their practice in team sport
settings.25 Moreover, the psychometric support found for this measure provides increased
confidence in using the instrument in a youth population for both future research and
professional practice. Second, data from the CBS-S could be used to facilitate reflection on

specific coaching behaviors and improve coaching practice. It could also be used as a
potential source for dialogue between the coach and other key stakeholders to complement
other performance data such as competition results. Third, collecting data from athletes about
coaching practice might show that the coach values their opinion, which has the potential to
enhance the coach-athlete relationship. The perceptions of athletes are an important source of
data that should be valued because coaching behavior impacts the quality of the sporting
experience and subsequent athlete outcomes.

REFERENCES
1. Lyle, J., Sports Coaching Concepts: A Framework for Coaches’ Behavior, Routledge,
London, 2002.
2. Mallett, C. and Côté, J., Beyond Winning and Losing: Guidelines for Evaluating High
Performance Coaches, The Sport Psychologist, 2006, 20(2), 213-221.
3. Gilbert, W. and Rangeon, S., Current Directions in Coaching Research. Revista
IberoAmericana de Psicologia del Deporte [Latin American Journal on Exercise and
Sport Psychology], 2011, 6(2), 217-236.
4. Smith, R.E. Smoll, F.L. and Hunt, B., A System for the Behavioral Assessment of
Athletic Coaches. Research Quarterly, 1977, 48(2), 401-407.
5. Smith, R.E. and Smoll, F.L., Social-Cognitive Approach to Coaching Behaviors, in:
Jowett, S. and Lavallee, D., ed., Social Psychology in Sport. Human Kinetics, Champaign,
IL, 2007, 75-90.
6. Chelladurai, P., Leadership in sports, in: Tenenbaum, G. and Eklund, R.C., ed., Handbook
of Sport Psychology, 3rd edn., John Wiley & Sons, New York, 2007, 113-135.
7. Chelladurai, P. and Saleh, S.D., Dimensions of Leadership Behavior in Sports:
Development of a Leadership Scale. Journal of Sport Psychology, 1980, 2(1), 34-45.
8. Horn, T.S., Coaching Effectiveness in the Sport Domain, in: Horn, T.S., ed., Advances in
Sport Psychology, 3rd edn., Human Kinetics, Champaign, IL, 2008, 239-267.
9. Côté, J. Samela, J. Trudel, P. Baria, A. and Russell, S., The Coaching Model: A
Grounded Assessment of Expert Gymnastic Coaches’ Knowledge. Journal of Sport &
Exercise Psychology, 1995, 17(1), 1-17.
10. Côté, J. Yardley, J. Hay, J. Sedgwick, W. and Baker, J.R., An Exploratory Examination
of the Coaching Behavior Scale for Sport. AVANTE, 1999, 5(3), 82-92.

Myers, N.D. and Jin, Y., Coaching Competency and Exploratory Structural Equation 11.
Modelling, in: Potrac, P. Gilbert, W. and Denison, J., ed., Routledge Handbook of Sports
Coaching, Routledge, London, 2013, 81-95.
12. Cushion, C. Harvey, S. Muir, B. and Nelson, L., Developing the Coach Analysis and
Intervention System (CAIS): Establishing Validity and Reliability of a Computerised
Systematic Observation Instrument. Journal of Sports Sciences, 2012, 30(2), 203-218.
13. Erickson, K. Côté, J. Hollenstein, T. and Deakin, J., Examining Coach-Athlete
Interactions Using State Space Grids: An Observational Analysis in Competitive Sport.
Psychology of Sport and Exercise, 2011, 12(6), 645-654.
14. Chelladurai, P. and Arnott, M., Decision Styles in Coaching: Preferences of Basketball
Players. Research Quarterly for Exercise and Sport, 1985, 56(1), 15-24.
15. Bartholomew, K.J. Ntoumanis, N. and Thøgersen-Ntoumani, C., The Controlling
Interpersonal Style in a Coaching Context: Development and Initial Validation of a
Psychometric Scale. Journal of Sport & Exercise Psychology, 2010, 32(2), 193-216.
16. Rushall, B.S. and Wiznuk, K., Athletes’ Assessment of the Coach: The Coach Evaluation
Questionnaire. Canadian Journal of Applied Sport Sciences, 1985, 10(3), 157-161.
17. Kenow, L.J. and Williams, J.M., Relationship between Anxiety, Self-Confidence, and
Evaluation of Coaching Behaviors. The Sport Psychologist, 1992, 6(4), 344-357.
18. Myers, N.D. Feltz, D.L., Maier, K.S. Wolke, E.W. and Reckase, M.D., Athletes’
Evaluation of Their Head Coach’s Coaching Competency. Research Quarterly for
Exercise and Sport, 2006, 77(1), 111-121.
19. Myers, N.D. Chase, M.A. Beauchamp, M.R. and Jackson, B., Athletes’ Perceptions of
Coaching Competency Scale II-High School Teams. Educational and Psychological
Measurement, 2010, 70(3), 477-494.

20. Gillham, A, Burton, D, and Gillham, E., Going Beyond Won-Loss Record to Identify
Successful Coaches: Development and Preliminary Validation of the Coaching Success
Questionnaire-2. International Journal of Sports Science & Coaching, 2013, 8(1), 115-138.
21. Mageau, G.A. and Vallerand, R.J., The Coach-Athlete Relationship: a Motivational
Model. Journal of Sports Sciences, 2003, 21(11), 883-904.
22. Arripe-Longueville, F.dʼ Fornier, J.F. and Dubois, A., The Perceived Effectiveness of
Interactions Between Expert French Judo Coaches and Their Athletes. The Sport
Psychologist, 1998, 12(3), 317-332.
23. Baker, J. Côté, J. and Hawes, R., The Relationship Between Coaching Behaviors and
Sport Anxiety in Athletes. Journal of Science and Medicine in Sport, 2000, 3(2), 110-119.
24. Baker, J. Yardley, J. and Côté, J., Coach Behaviors and Athlete Satisfaction in Team and
Individual Sports. International Journal of Sport Psychology, 2003, 34(3), 226-239.
25. Koh, K.T. Mallett, C.J. and Wang, C.K.J., Examining the Ecological Validity of the
Coaching Behavior Scale (Sport) for Basketball. International Journal of Sport Science &
Coaching, 2009, 4(2), 417-429.
26. Singapore Ministry of Education. Speech By Mr Heng Swee Keat at the Opening
Ceremony of the National School Games at the Jurong East Sports And Cultural Centre,
2012. Retrieved on 12 August 2013, from
http://www.moe.gov.sg/media/speeches/2013/02/01/speech-by-mr-heng-swee-at-the-
opening-ceremony-of-the-national-school-games.php
27. Marsh, H.W., Age and Sex Effects in Multiple Dimensions of Self-Concept:
Preadolescence to Adulthood. Journal of Educational Psychology, 1989, 81(3),417-430.
28. Singapore Ministry of Education, Curriculum Planning and Development Division,
English Language Syllabus 2010: Primary (Foundation) and Secondary (Normal

[Technical]), 2010. Retrieved from http://www.moe.gov.sg/education/syllabuses/english-
language-and-literature/files/english-primary-foundation-secondary-normal-technical.pdf
29. Chelladurai, P. Imamura, H. Yamaguchi, Y. Oinuma, Y. and Miyauchi, T., Sport
Leadership in a Cross-National Setting: The Case of Japanese and Canadian University
Athletes. Journal of Sport & Exercise Psychology, 1988, 10(4), 374-389.
30. Muthén, L. K. and Muthén, B., Mplus (Version 6.12). [Computor software]. Muthén &
Muthén, Los Angeles, CA, 2011.
31. Asparouhov, T. and Muthén, B., Exploratory Structural Equation Modeling. Structural
Equation Modeling, 2009, 16(3), 397-438.
32. Marsh, H.W. Muthén, B. Asparouhov, T. Lüdtke, O. Robitzsch, A. Morin, A.J.S. and
Trautwein, U., Exploratory Structural Equation Modeling, Integrating CFA and EFA:
Application to Students’ Evaluations of University Teaching. Structural Equation
Modeling, 2009, 16(3), 439-476.
33. Marsh, H.W. Lüdtke, O. Muthén, B. Asparouhov, T. Morin, A.J.S. Trautwein, U. and
Nagengast, B., A New Look at the Big-Five Factor Structure through Exploratory
Structural Equation Modeling. Psychological Assessment, 2010, 22(3), 471-491.
34. Kawabata, M. and Mallett, C.J., Examining Discriminant Validity Issues of the Sport
Motivation Scale-6. Journal of Sports Sciences, 2013, 31(2), 173-180.
35. Muthén, L. K. and Muthén, B., Mplus User’s Guide, 6th edn., Muthén & Muthén, Los
Angeles, CA, 1998-2011.
36. Bentler, P.M., Comparative Fit Indexes in Structural Models. Psychological Bulletin,
1990, 107(2), 238-246.
37. Tucker, L.R. and Lewis, C., A Reliability Coefficient for Maximum Likelihood Factor
Analysis. Psychometrika, 1973, 38(1), 1-10.

38. Steiger, J.H., Structural Model Evaluation and Modification: An Interval Estimation
Approach. Multivariate Behavioral Research, 1990, 25(2), 173-180.
39. Hu, L. and Bentler, P.M., Fit Indices in Covariance Structure Modeling: Sensitivity to
Underparameterized Model Misspecification. Psychological Methods, 1998, 3(4), 424-
453.
40. Browne, M.W. and Cudeck, R., Alternative Ways of Assessing Model Fit, in: Bollen,
K.A. and Long, J.S. eds., Testing Structural Equation Models, Sage, Newbury Park, CA,
1993, 445–455.
41. Hu, L. and Bentler, P.M., Cutoff Criteria for Fit Indexes in Covariance Structure
Analysis: Conventional Criteria versus New Alternatives. Structural Equation Modeling,
1999, 6(1), 1-55.
42. Tabachnick, B.G. and Fidell, L.S., Using Multivariate Statistics, 6th edn., Boston: Allyn
Bacon, 2013.
43. Byrne, B.M., Structural Equation Modeling With Mplus: Basic Concepts, Applications,
and Programming. New York: Routledge, 2012.
44. Muthén, B., Latent Variable Modeling of Longitudinal and Multilevel Data, in: Raftery,
A.E., ed., Sociological Methodology 1997. American Sociological Association,
Washington, DC, 1997, 453-481.
45. Asparouhov, T. and Muthén, B., Computationally Efficient Estimation of Multilevel
High-Dimensional Latent Variable Models. Proceedings of the Joint Statistical Meeting,
American Statistical Association Section on Biometrics, Salt Lake City, 2007, 2531-2535.
46. Hox, J.J. and Maas, C.J.M., The Accuracy of Multilevel Structural Equation Modeling
with Psuedobalanced Groups and Small Samples. Structural Equation Modeling, 2001,
8(2), 157-174.

47. Bovaird, J.A., Multilevel Structural Equation Models for Contextual Factors, in: Little,
T.D. Bovaird, J.A. and Card, N.A., eds., Modeling Contextual Effects in Longitudinal
Studies, Erlbaum, Mahwah, NJ, 2007, 149-182.
48. Chen, F.F. Sousa, K.H. and West, S.G., Testing Measurement Invariance of Second-
Order Factor Models. Structural Equation Modeling, 2005, 12(3), 471-492.

COACHING BEHAVIOR SCALE FOR SPORT 23
Table 1
Descriptive Statistics of the Subscales of the Coaching Behavior Scale
All (N = 519) Boy (n = 378) Girl (n = 124)
Variable M SD M SD M SD
Physical Training and Planning 5.38 1.00 5.38 1.00 5.40 .96
Technical Skills 5.79 .98 5.78 1.00 5.90 .94
Goal Setting 5.27 1.21 5.27 1.22 5.32 1.15
Mental Preparation 5.60 1.24 5.61 1.25 5.60 1.22
Competition Strategies 5.69 1.11 5.67 1.12 5.79 1.07
Personal Rapport 5.08 1.34 5.11 1.38 5.06 1.19
Negative Personal Rapport 2.73 1.53 2.94 1.59 2.01 1.06

COACHING BEHAVIOR SCALE FOR SPORT 24
Table 2
Descriptive Statistics of the Items of the Coaching Behavior Scale in Confirmatory Factor
Analysis (N = 519)
Item M SD Skewness Kurtosis FL R ICC
Physical Training and Planning
Item 01 5.50 1.23 -.490 -.322 .677 .542 .080
Item 02 5.72 1.24 -.759 .006 .766 .413 .120
Item 03 5.87 1.14 -.913 .445 .756 .428 .126
Item 04 5.40 1.36 -.928 .984 .603 .637 .096
Item 05 4.93 1.68 -.785 .081 .508 .742 .070
Item 06 5.31 1.39 -.672 .140 .687 .528 .185
Item 07 4.92 1.85 -.799 -.266 .418 .825 .049
Technical Skills
Item 08 5.96 1.27 -1.338 1.693 .830 .311 .093
Item 09 5.90 1.21 -1.045 .625 .864 .253 .103
Item 10 5.87 1.19 -.985 .558 .841 .292 .113
Item 11 5.93 1.17 -1.096 .882 .846 .284 .103
Item 12 6.03 1.19 -1.416 2.150 .732 .464 .131
Item 13 5.80 1.23 -1.116 1.412 .635 .597 .144
Item 14 5.75 1.28 -1.128 1.311 .723 .477 .092
Item 15 5.12 1.77 -.962 .127 .422 .822 .096
Goal Setting
Item 16 5.45 1.35 -.605 -.245 .883 .220 .149
Item 17 5.38 1.36 -.602 -.196 .904 .183 .191
Item 18 5.09 1.45 -.538 -.126 .728 .469 .171
Item 19 5.10 1.53 -.602 -.232 .801 .359 .121
Item 20 5.16 1.48 -.564 -.215 .758 .425 .148
Item 21 5.46 1.36 -.719 .129 .824 .321 .135

COACHING BEHAVIOR SCALE FOR SPORT 25
Table 2 (Continued)
Item M SD Skewness Kurtosis FL R ICC
Mental Preparation
Item 22 5.32 1.61 -.823 .031 .744 .446 .120
Item 23 5.58 1.43 -.964 .498 .839 .296 .111
Item 24 5.66 1.35 -.929 .368 .897 .195 .155
Item 25 5.64 1.39 -.976 .489 .893 .203 .139
Item 26 5.80 1.31 -1.151 1.083 .851 .276 .146
Competition Strategies
Item 27 5.74 1.32 -.982 .470 .859 .262 .153
Item 28 5.78 1.27 -1.059 .857 .844 .288 .156
Item 29 5.59 1.30 -.687 -.200 .784 .386 .140
Item 30 5.71 1.24 -.847 .373 .876 .232 .129
Item 31 5.74 1.26 -.906 .474 .846 .284 .143
Item 32 5.55 1.36 -.794 .242 .757 .427 .133
Personal Rapport
Item 33 5.52 1.41 -.772 .054 .840 .294 .119
Item 34 5.33 1.48 -.662 -.180 .872 .239 .172
Item 35 5.04 1.70 -.519 -.678 .847 .282 .177
Item 36 4.98 1.67 -.505 -.485 .773 .403 .162
Item 37 4.90 1.72 -.535 -.493 .725 .474 .108
Item 38 4.74 1.83 -.469 -.734 .609 .630 .079
Negative Personal Rapport
Item 39 2.86 1.93 .690 -.787 .680 .537 .078
Item 40 2.97 1.91 .639 -.747 .645 .584 .117
Item 41 2.64 1.80 .886 -.284 .797 .365 .155
Item 42 2.94 2.01 .636 -.916 .732 .464 .139
Item 43 2.60 1.90 .875 -.505 .873 .238 .145
Item 44 2.44 1.85 1.058 -.120 .898 .194 .158
Item 45 2.56 1.87 .929 -.425 .820 .327 .196
Item 46 2.85 1.99 .733 -.732 .722 .479 .160
Note. FL= factor loadings; R = residuals. ICC = Intraclass correlation coefficient. All factor
loadings are significant at p < .05.

COACHING BEHAVIOR SCALE FOR SPORT 26
Table 3
Factor Loadings and Residuals in Exploratory Structural Equation Modeling (N = 519)
Item F1 F2 F3 F4 F5 F6 F7 R
F1: Physical Training and Planning
Item 01 .304 .141 .151 .054 .158 .117 -.004 .601
Item 02 .382 .178 .113 .069 .158 .083 -.041 .535
Item 03 .418 .244 .118 .037 .089 .072 -.061 .519
Item 04 .650 .023 .006 .094 .038 -.044 -.071 .522
Item 05 .733 -.055 -.074 .021 .038 -.018 .071 .478
Item 06 .685 .000 .150 -.003 .027 .070 -.021 .402
Item 07 .647 -.037 -.026 -.003 -.058 .039 .136 .575
F2: Technical Skills
Item 08 .022 .725 .009 .076 .097 .084 .028 .277
Item 09 .023 .738 .058 .142 .030 .070 .011 .229
Item 10 .069 .600 .079 .075 .139 .139 .000 .296
Item 11 .015 .715 .024 .113 .076 .090 -.026 .260
Item 12 .160 .471 .160 .066 .108 .028 -.039 .463
Item 13 .112 .382 .152 .015 .179 .030 -.037 .585
Item 14 .115 .443 .144 .137 .138 -.004 -.069 .471
Item 15 .121 .245 .101 .024 -.011 .143 .041 .805
F3: Goal Setting
Item 16 .051 .119 .593 .140 .150 .083 .047 .235
Item 17 .078 .114 .685 .116 .098 .054 -.031 .180
Item 18 .081 -.016 .633 .084 .072 .033 .041 .436
Item 19 .046 -.011 .672 .077 .057 .144 .068 .319
Item 20 .020 .003 .584 .120 .096 .115 -.002 .416
Item 21 .094 .113 .562 .070 .130 .117 -.020 .321
COACHING BEHAVIOR SCALE FOR SPORT 27
Table 3 (Continued)
Item F1 F2 F3 F4 F5 F6 F7 R
F4: Mental Preparation
Item 22 -.010 -.016 .078 .623 .093 .100 .005 .438
Item 23 .082 .032 .065 .662 .119 .069 -.017 .303
Item 24 .035 .107 .097 .785 .022 .026 -.007 .170
Item 25 .032 .043 .075 .722 .111 .103 .006 .196
Item 26 .072 .131 .015 .617 .209 .015 -.035 .271
F5: Competition Strategies
Item 27 .042 .122 .147 .168 .569 .035 -.009 .271
Item 28 .053 .021 .056 .211 .617 .078 -.007 .288
Item 29 .042 .055 .150 .049 .610 .069 .020 .367
Item 30 .104 .052 .032 .114 .742 .031 -.006 .190
Item 31 .029 .103 .062 .127 .617 .124 .008 .283
Item 32 .038 .039 .192 .175 .406 .156 -.024 .424
F6: Personal Rapport
Item 33 .007 .183 .176 .076 .171 .495 -.072 .312
Item 34 .051 .123 .131 .067 .104 .619 -.066 .289
Item 35 -.002 .056 .077 .087 .047 .749 .025 .254
Item 36 .054 .033 .066 .040 .031 .733 -.017 .329
Item 37 .047 .017 -.007 .098 .045 .697 .050 .399
Item 38 .081 -.004 .049 .042 .044 .562 .090 .575
F7: Negative Personal Rapport
Item 39 .015 -.020 .019 -.030 .077 .072 .674 .527
Item 40 .021 .000 -.012 .010 .026 -.052 .647 .581
Item 41 .026 -.029 -.031 .027 -.012 -.032 .796 .358
Item 42 .086 -.061 .003 -.003 -.082 .003 .715 .450
Item 43 .010 .033 .016 .019 -.028 .083 .876 .221
Item 44 .013 -.005 .075 -.015 -.021 .010 .891 .192
Item 45 .042 -.062 .034 -.089 .028 -.005 .803 .322
Item 46 .007 -.033 -.058 -.094 -.060 -.045 .713 .430
Note. F= factor; R = residuals. Absolute factor-loading values above .02 are significant
at p < .05. Target factor loadings are presented in bold.

COACHING BEHAVIOR SCALE FOR SPORT 28
Table 4 1
Latent Factor Correlations in the CFA (Lower Diagonal) and ESEM (Upper Diagonal) 2
Solutions for the CBS-S (N = 519) 3
Subscale PTP TS GS MP CS PP NPP
Physical Training and Planning (PTP) (.82) .27 .29 .23 .29 .21 .07
Technical Skills (TS) .67 (.89) .36 .38 .42 .33 -.10
Goal Setting (GS) .67 .71 (.92) .41 .47 .41 .01
Mental Preparation (MP) .59 .70 .73 (.92) .53 .34 -.07
Competition Strategies (CS) .66 .75 .80 .81 (.93) .37 -.05
Personal Rapport (PP) .58 .68 .73 .65 .71 (.90) .02
Negative Personal Rapport (NPP) .02 -.10 .02 -.09 -.06 -.01 (.92)
Note. CFA = confirmatory factor analysis; ESEM = exploratory structural equation modeling; 4
CBS-S = Coaching Behavior Scale for Sport. Absolute correlation values above .07 and .03 5
are significant at p < .05 in the CFA and ESEM solutions, respectively. Coefficient alphas of 6
the CBS-S subscale scores are presented in parentheses along the diagonal.7

COACHING BEHAVIOR SCALE FOR SPORT 29
Table 5 1
Latent Factor Correlations Between the Coaching Behavior Scale for Sport (CBS-S) and 2
Coaching Satisfaction 3
Variable r
Physical Training and Planning .36
Technical Skills .54
Goal Setting .46
Mental Preparation .58
Competition Strategies .62
Personal Rapport .59
Negative Personal Rapport -.16
Note. Inter-factor correlations between the CBS-S and Coaching Satisfaction were based on 4
the data from 498 respondents. 5
View publication statsView publication stats