single minute exchange die approach for optimising setup
TRANSCRIPT
Journal of Engineering Science, Vol. 16(2), 35–56, 2020
© Penerbit Universiti Sains Malaysia, 2020. This work is licensed under the terms of the Creative Commons Attribution (CC BY) (http://creativecommons.org/licenses/by/4.0/).
Single Minute Exchange Die Approach for Optimising Setup Time in Labelling Printing Company
Nur Syazwani Abd Suki1, Elmi Abu Bakar2*, Emaad Iftekar Ansari2 and Mohammad Nishat Akhtar2
1School of Mechanical Engineering, Engineering Campus, Universiti Sains Malaysia, 14300 Nibong Tebal, Pulau Pinang, Malaysia
2School of Aerospace Engineering, Engineering Campus, Universiti Sains Malaysia, 14300 Nibong Tebal, Pulau Pinang, Malaysia
*Corresponding author: [email protected]
Published online: 10 December 2020To cite this article: Nur Syazwani Abd Suki, Elmi Abu Bakar, Emaad Iftekar Ansari and Mohammad Nishat Akhtar (2020). Single minute exchange die approach for optimising setup time in labelling printing company. Journal of Engineering Science, 16(2), 35–56, https://doi.org/10.21315/jes2020.16.2.2.To link to this article: https://doi.org/10.21315/jes2020.16.2.2
Abstract: The concept of “make-to-order” (MTO) type companies is to produce the products just-in-time and improve the customer satisfaction. These types of company produce a high variety with low volume requiring a frequent setup operation. The shorter setup time will reduce the manufacturing lead time and hence increase the productivity. Unfortunately, most of the MTO type companies suffer with high setup time. Thus, single minute exchange die (SMED) concept is developed which consist of four stages: internal and external setup are not distinguished, separating internal and external setup, converting internal into external setup and streamlining all aspects of the setup operations. The main objective of using SMED concept is to accomplish setup time in less than 10 min. In this case study, the SMED concept being applied to convert internal setup to external setup which involves the activities of ink preparation and test printing. In the stage three of SMED concept, feasible solutions has been applied to fulfilled the objective. The result of implementing SMED concept in MTO type companies is the improvement in the productivity and reduction in the setup time. The improvement of productivity for this case study was 29.15%.
Keywords: make-to-order, just-in-time, single minute exchange die, setup time, productivity

Single Minute Exchange Die Approach 36
1. INTRODUCTION
Labelling industry is trending to become more competitive and has made great strides over the past decade. This industry which mainly process customised products, commonly have to compete in terms of price, quality and delivery time. Most of the labelling industry is “make-to-order” (MTO) companies because it is a high variety low volume type of production style.1 In the MTO environment, the company will start the processing the material for and components of the products after receives an order from the customer and follow the required design from the customer. Mostly, the designs are based on types of paper use, colours and shape in labelling industry. With the enhancement of technology, supposedly these labelling companies should have a very good production with high productivity achievement. Unfortunately, most of the company failed to fully utilise their capacity hence unable them to satisfy the customer demand. Consequently, they will lose market share and the customer tend to loss their trust to the company and lead them to minimisation of company’s profit. Due to lack of engineering knowledge in proper improvement plan, most of labelling company tends to solve this productivity problem by adopting a “quick fix” technique such as purchasing a new machine or hiring more workers, which is not a cost effective solution. A strategic improvement approach should be considered as a method towards sustainable improvement, where solving the root cause of the main problems.
There are a lot of reasons which can contribute to this low productivity problems and one of them is unutilised resources such as poor job assignment and idling machines. The causes of machine idling can divide into two types which are normal causes and abnormal causes. These normal causes inherent in very situation such as the interval between one job another, the setup time for machine and normal fatigue. Meanwhile, the abnormal causes occur because of some unexpected reasons like lack of co-ordination, power failure, machines breakdown and non-availability raw material. Most of the management more concerned on abnormal causes because it is more visible compare to the normal cause. The behaviour of management team which considering normal causes as part of the production make this causes become more invisible day by day and continuously causing lost to the company.
In general, setup time can be defined as the period required preparing a device, machine, process, or system for it to be ready to function or accept a job. In labelling industry, setup activities may include cleaning, ink preparation, tool installation, test printing and transportation. These activities are important before

Journal of Engineering Science, Vol. 16(2), 35–56, 2020 37
starting the production to make sure the machine is capable to perform process manufacturing properly. A proper machining setup could improve the availability and performance of the machine. Hence, it will able to produce high quality product and satisfies customer requirements. For high variety and low volumes company, the setup activities required are regular thus causes high setup time. High setup time will lower the productivity of the production and definitely bring to lost profit to the company.
Nowadays, targets of an increased productivity, operational availability and better overall efficiency of the production time are the most important goals for all MTO types manufacturing company. One of the general approaches that have been successful in these efforts is lean manufacturing. Principles of lean thinking have been broadly accepted by many manufacturing operations and have been applied successfully across many disciplines.2 Lean is a manufacturing philosophy that shortens the lead time between a customer order the shipment of the products or parts through the elimination of all forms of waste.3 These approaches focus on cost reduction by removing non-value added activities. It is derived from the Toyota Production System (TPS) were consist many tools and technique such as just-in-time (JIT), cellular manufacturing, total productive maintenance (TPM) and setup time reduction.4 A very brief description of the most common lean tools is as follows.5,6,7 The purpose of applying this concept is to increase productivity, reduce lead time and cost and get improved quality.8 In order to achieve improvement in market demand and compete with others MTO companies, it is necessary for labelling section to improve productivity while ensuring low cost but high quality.
Table 1: The percentage of manufacturing approach in United States (US).9
Approach Percentages
Lean manufacturing 42
6 Sigma 14
Lean 6 Sigma manufacturing 11
The percentage of manufacturing approach from Table 1 shows lean manufacturing are widely used in development country. Every manufacturing process has a lead time and it is an increasingly important attribute of production. Generally, it can be defined as the total time required to complete one item of a product or service. Dumaine10 and Hammond11 argue that a company with faster response can simultaneously increase prices and reduce production cost. A model that formally ties operations advantages to these strategic results.12

Single Minute Exchange Die Approach 38
There are four purposes of lead time analysis which is to document all steps in process, to measure the time and distance for each process, to recognise where value is being added into process and to understand how non-value-added activities cost in a process.13 These all analysis will help the company to reduce lead time. There are various operational improvements to reduce lead time such as better scheduling, redesigning the process, bottleneck analysis, project management and flexible manufacturing systems. Lead times affect both revenue and cost. Lead time is important for four reasons from cost perspective.14 Firstly, it can be major investments for a company because lead time is proportional to work-in-process inventory. Secondly, lead time forces the company to forecast needs and to hold safety stock of materials and finished goods because the company cannot produce instantaneously. Thirdly, short lead time may be favorably related with operations costs that are time related. Fourth, the agency costs also will be reduced if the lead time short.
Furthermore, most of the customer wants short delivery and high delivery reliability. The most convenient way to achieve this is to have short lead time in production.15 The steps for reducing lead time are listed as follows:13
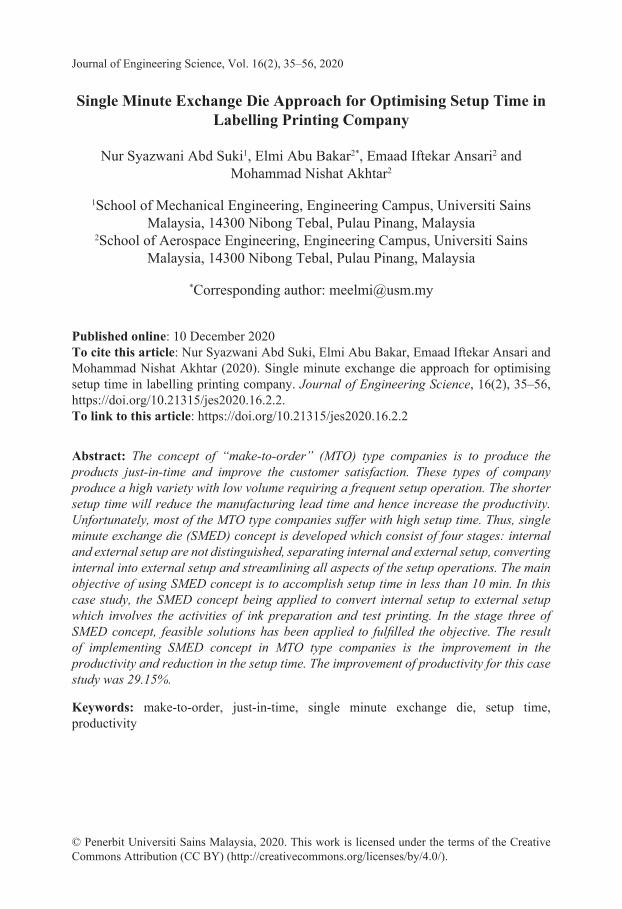
1. Identify the product service provided.2. List all setups required to complete the product from start to finish.3. Identify time required to complete each step.4. Identify steps that add values to the product.5. Graph the process as in Figure 1(a).6. Analyse and eliminate time required for non-value added (NVA) steps.7. Analyse and reduce the time needed for value added (VA) steps.8. Graph this process as in Figure 1(b).9. Identify the “ideal” process which minimise the time involved in VA and
remove NVA steps.10. Graph the ideal process to work with and to achieve as in Figure 1(c).
There are several reasons of high lead time in manufacturing process such as poor scheduling, unacceptable quality, insufficient work flows, inflated inventories and supplier difficulties. There are several components that affected this problem. Processing times is one of the components of lead time that will affect the production. The estimation of the processing time in the manufacturing of a product is an important task in any manufacturing industry.16 There are several input variables, such as dimensions of the product, the material and the speed of the machine that will affected the processing time of a machine.
Journal of Engineering Science, Vol. 16(2), 35–56, 2020 39
(a)
Current
8
7
6
5
4
3
2
1
(b)
Future
8
7
65
4
3
21
(c)
Ideal
8
6
4
3
1
Figure 1: (a) Lead time for current process, (b) after using lean principle and (c) lead time for ideal process.13
Another component is transfer or transportation time for material and finish goods. Mostly, it is depends on the production layout because it will determine the arrangement of the machine and material thus affect the lead time. Lead time may be increase if the position of the material is far from the machine because the operator takes much time to get the material before starting the production. Besides that, changeover or setup time is an important indicator of lead time. There is a direct correlation between setup time and lead time which are high setup time increase lead time while shorter setup time reduces lead time.13 Most company that is effective in reducing setup time discovers big advantage in lead time reduction and increased customer responsive. There are several output due to high setup time in manufacturing.17 It is very important to reduce machine setup time during the implementation of lean manufacturing because this time has a significant impact on manufacturing cost due to decreasing sizes of series orders.18 Therefore, setup time reduction is an important feature of the continuous improvement program of any manufacturing or service organisation. In addition, machine utilisation and equipment went up with the reduced setup time.19
The shorter setup time will cause smaller lot size.20 Thus, it is possible to introduce a MTO company type. The shorter setup times give the following impacts to any different type of production system such as reduce scrap, decrease labour cost, the production system will be more flexible, product lead time will decrease, increase the productivity and utilisation of assets and reduce manufacturing cost.21

Single Minute Exchange Die Approach 40
There are different reasons for shortened setup times have been fall into three main groups.22 First, the flexibility was due to increasing number of products offers to the customer and a decrease of the corresponding order quantities, hence the company able to react quickly. The shortened setup time is needed to produce small lot sizes.23 Second, bottleneck capacities which setup reduce setup times of bottleneck machine ensure higher throughput. Third, cost minimisation since production cost are directly relate to the machine performance. The effect of setup reduction on overall machine performance can be shown from the calculation an overall equipment effectiveness (OEE).24 The applications of reducing setup time can be found in various production, service and information processing systems. For example, in printing industry, the setup time required to prepare the machine such as cleaning and tools installation. It is depends on the colours and design of the product following customer requirements. In a textile industry, setup time for weaving and dying operations depends on job sequence. In a bottle industry, setup time relies on the sizes and shapes of the bottle.
There are several reviews and researches available on how setup time can be reduced. Basically, all the approaches are derived from single minute exchange die (SMED) methods. The SMED methodology was developed to reduce and simplify or reducing setup time during changeover.23 The objective of SMED is to accomplish setup times in less than 10 min. SMED theory states that the actual downtime caused machinery specification changes can be greatly reduced even if the frequency of the setups cannot be reduced, thus providing an increase in available production capacity.23 Therefore, Shingo pronounce that “SMED can be applied in any factory, to any machine and that the first stage of implementation is separating internal and external setup”.23
Thus, the first step in implementing of SMED is to separate the setup operation into two parts:
1. Internal setup or on line activities which are performed when the machine is shut down and thus the production is not running. For example, remove or install the dies and tools.
2. External setup or off line activities which take place when the machine is running. These can be performed either before or after the machine is shut down. For example, getting the tools or equipment ready for the setup operation can be done before the machine is shut down.
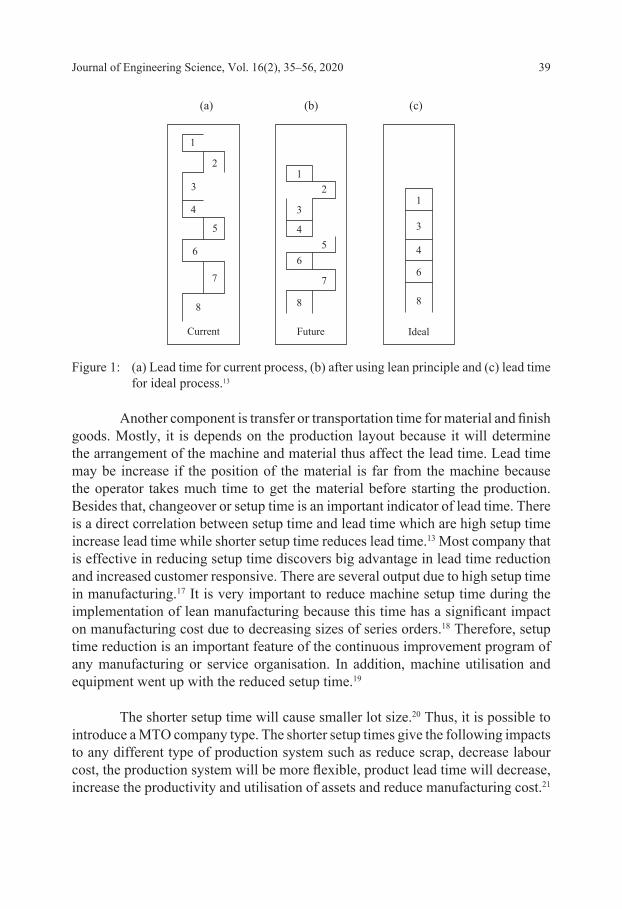
SMED should be implemented in four different stages according to Shingo.23 This traditional stance of Shingo’s method is illustrated in Figure 2.
Journal of Engineering Science, Vol. 16(2), 35–56, 2020 41
Preliminary Stage
Internal and external set-up not distinguished
Stage 1
Separating internal and external set-up
Stage 2
Converting internal to external set-up
Stage 3
Streamlining all aspects of the set-up operation
External set-upInternal set-up
Figure 2: SMED conceptual stages.23
By considering an improvement method should help this company from continuing producing lost every single day due to high setup time. There are tremendous varieties of improvement methods such as TPM, Poka Yoke, value stream mapping (VSM), Kanban and SMED to solve the problem regarding the setup time to compete with other small medium enterprise (SME)’s company for the benefit in term of profit and productivity of the company. For this study, SMED will be used as an improvement method in reducing high setup time because the objective of this concept to accomplish setup times in less than 10 min.
2. METHODOLOGY
This section will discuss about the methodology used in this project to study the problems and to make improvement in the labelling section. The proper steps and analysis has to be done in order to solve the problem. The purpose methodologies which base on the process flow have been divided into six phases. Each phase will be discussed further. Figure 3 shows the overall process flow which the steps taken for the finding out the best way to solve the problem in labelling industry. Each phase has its own data and criteria to generate the feasible solution.

Single Minute Exchange Die Approach 42
Start
End
Data analysis and problem identification
Root cause identification
Generate feasible solution(s)
Implementation/experimentation
Data collection
Continuous improvement
Solution verified?
Yes
Yes
PHASE I
PHASE V
PHASE III
PHASE IV
PHASE II
No
No
Figure 3: Overall process flow.
2.1 Phase I: Data Collection
Data collection is very important to understand what is the process manufacturing involves and how it operates before define the existing problems. The first step in data collection is deciding what should be measured. The activities data gathering strategic include:
1. Observing and recording well defined events (e.g., take the operation time for each process).
2. Obtaining relevant data from management.3. Administering surveys with closed-ended question (e.g., interviews the
operator and supervisor, questionnaires through email).

Journal of Engineering Science, Vol. 16(2), 35–56, 2020 43
2.2 Phase II: Data Analysis and Problem Identification
The process analysis is concerned with interpreting the results from data collection and developing more detailed on the process operates and what is wrong with it. The problem can be identified based on the data analysis.
2.3 Phase III: Root Cause Identification
Root cause analysis attempts to identify the significant factors that affect process performance. The root cause can be analysed by using Five Whys tools to give a clear view of the problem of this case study.
2.4 Phase IV: Generate Feasible Solution
After the root cause has been identified, the feasible solutions were generated to make an improvement. As discuss in above section, SMED method were applied to solve the problem. Before going through deeply discussion of the SMED methodology, there are several classification can be used to distinguish the types of setup operations such as: (1) prepare, adjust and check (new materials or tools), (2) remove old tooling and install new tooling on the machine, (3) measure, set and calibrate (fixture, tools and tooling) and (4) produce initial parts (production trials) and adjust the machine. These activities occur for any setup whether they are significant or not and the relative proportion of time required for each setup operation can be vary significantly.
2.5 Phase V: SMED Approach
Basically SMED consist of “Preliminary Stage” and “Continuous Improvement”. Preliminary stage consists of studying the current setup process because simply put “what is unknown cannot be improved”. Normally as the first stage, this process is really important to be defined thoroughly in order to understand the setup operation and the causes of the problem occur. All setup operations are recorded accurately by using stop watch or video camera. Then, the time taken for each action is measured.
2.5.1 Stage 1: Separating internal and external setup
The goal for this stage is to separate the setup operations according to the given definition in section 2.4 before. In this stage it is very crucial to distinguish between the external and internal setup which are differed in terms of machine operated.

Single Minute Exchange Die Approach 44
Therefore, in applying SMED, three steps that need to be done are:1. Checklist.2. Function checks.3. Improved transport of dies and other parts.
These steps need to be applied in order to reduce setup time of manufacturing process in labelling section.
2.5.2 Stage 2: Converting internal setup to external setup
The significant reason of converting internal setup to external setup is to minimise total setup time when the machine is not running. The two important aspects for this stage are:
1. The internal setup operation need to be rechecked to ensure those operation were considered erroneously as internal.
2. Find all the possible ways to change the whole or in part of internal setup to external setup.
This aspect can be supported by three feasible techniques: (1) preparing operating conditions in advance, (2) function standardisation and (3) using intermediary jigs.
2.5.3 Stage 3: Streamlining all aspects of the setup process
This stages tries to improve all the setup operations both internal and external setup by reducing their setup time. This stage can be support by using functional clamps, eliminating adjustment and mechanisation techniques. As per solution being achieved by applying SMED in order to reduce setup time, a continuous improvement of SMED should be sustained continuously to increase productivity in manufacturing industry.
3. RESULTS AND DISCUSSIONS
This section will discuss mainly on the outcomes of the entire study. As explained in previous section before, the outcomes are obtained by following the five phases of new framework. This chapter will discuss on where the case study was carried out and the observation at the case study. Data collection is the first step need to be done in order to identify a problem after make some analysis. Afterwards, root cause analysis of the main problem has been done to generate feasible solution.

Journal of Engineering Science, Vol. 16(2), 35–56, 2020 45
Some experiment also has been done to validate the feasible solutions which are workable in labelling section.
3.1 Case Study on Labelling Printing Company
In applying the SMED method, a case study was conducted in Company A Sdn. Bhd. located in Pulau Pinang. It is SME companies which consist of two production sections which are packaging section and labelling section. It is incorporates as manufacturer and exporter of plastic corrugated sheets, boxes, stickers and provision of customised packaging solutions and trading of ESD related products to electronic firms, automotive firms and signage industries. This project carried out in labelling section which is produces various types of label and sticker such as computer labels, offset and silkscreen stickers and bar code labels. Their vision is to establish their unique identities by providing creative graphic design services and high quality products. Labelling industry is trending to become more advance and competitive in meeting customer requirement and deliver the product in the shortest time to build up the confident relationship between the supplier and customer. While striving to meet the shortest manufacturing lead time, productivity of the production floor play an important role. Productivity in labelling industry is totally affected by the productions setup time.
In this study, the company is trying to grow as a high competitive company but low productivity is the main problem which is due to the high internal setup time. Study on the labelling section has been done and it shows the overall setup process times occupy approximately 50% of the total production time which means the productive time is only 50%. This means that the machine is only running 4 h every day assuming there is eight working hours per day. In other word, half of the day is productive and another half of the day non-productive due to setup. It is concluded that the machine is not fully utilised because the machine is idling during the setup since the machine is part of setup. Besides that, the company also faces a high wastage problem. The high wastage of material contributes to the messiness of the production area and leads to the low profit. High wastage comes from the sticker during the test printing process while the amount of sticker used by the test printing process is determined by the accuracy of the setup process.
3.1.1 Data collection
As explained in previous section, the first step before any improvement can be made is data collection. Data collected are products, capacities of the company, capabilities of the machines, layout, process flow and process mapping. These data collections were getting from interviewing, observation and recording. The product

Single Minute Exchange Die Approach 46
in the labelling section is only sticker and it can be divide into standard quality and high quality which can be seen in Figure 4. The main difference between them is the type of ink used. Ultraviolet ink used for high quality was dried during the printing process while printing ink used for standard quality was needed time to dry before it is pack to avoid smearing of the ink. This division of product is based on attributes that can be found in Table 2.
Standard quality High quality
Labelling sticker
Figure 4: Types of sticker in labelling section.
Table 2: The differences between standard quality and high quality sticker.
Attributes Standard quality High quality
Types of ink used Printing ink UV ink
Types of machine used Machine A Machines B and C
Types of paper used Paper based, film based Paper based, film based and Paper Portable Network Graphics (PPNG)
Topwhite (a type of film-based)
Number of colours Less than four Less than five
Time to dry Needed Not needed
Width of sticker 70 mm to 100 mm Intermittent: 70 mm to 250 mm Semi-lottery: 70 mm to 90 mm
Printing type Wording only Solid and wording
3.1.2 Process layout and process flow
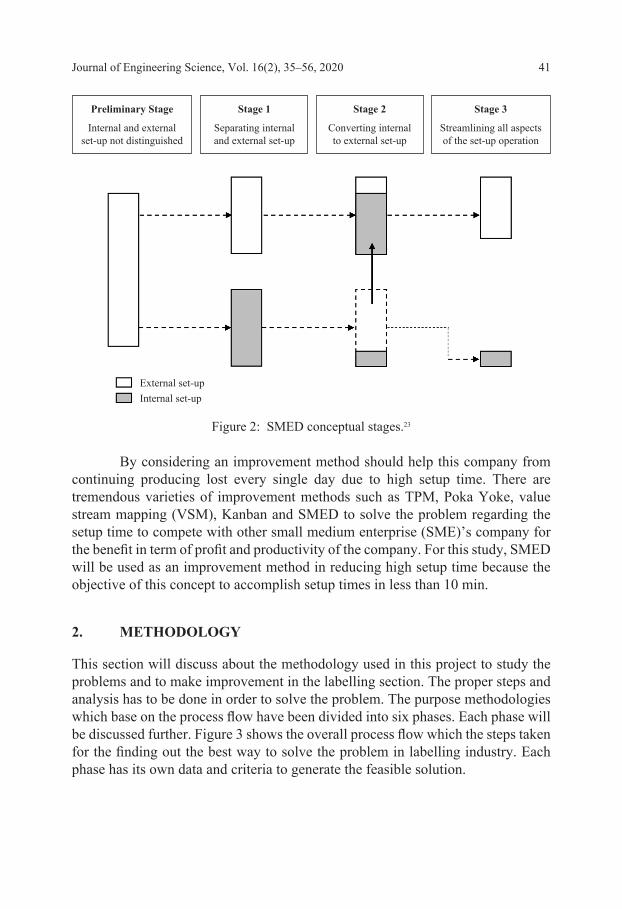
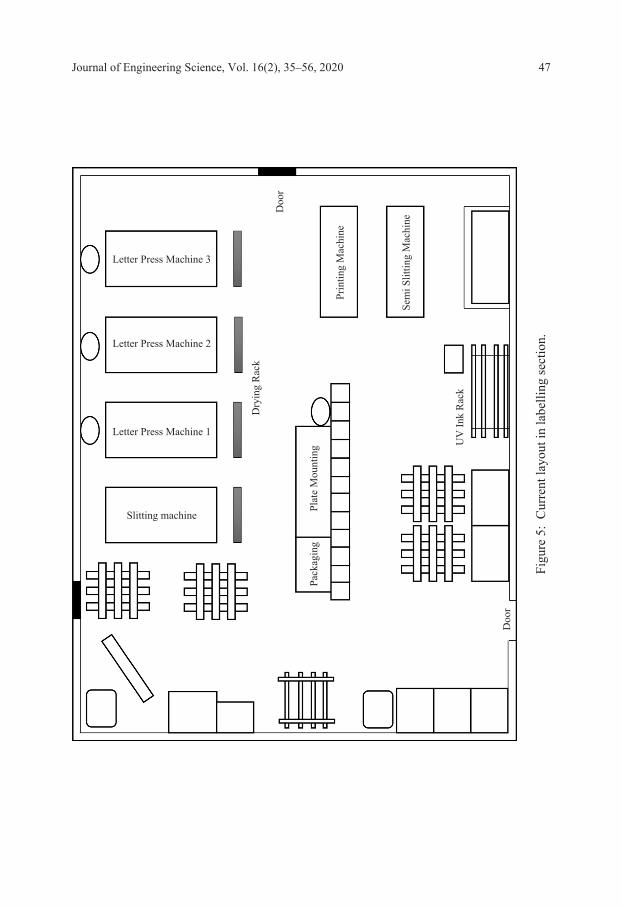
Figure 5 below shows the current layout of machine, raw material and finish goods in labelling section. The information for process flow is collected based on the verbal explanation of the supervisor and operator because there is no standard operation procedure (SOP) and it is verified by observing the process. The process flow is shown in Figures 6 and 7. After that, it will be easier to measure the cycle time of each process and do the process mapping.
Journal of Engineering Science, Vol. 16(2), 35–56, 2020 47
Slitting machine
Dry
ing
Rac
k
Doo
r
Pack
agin
gPl
ate
Mou
ntin
g
Prin
ting
Mac
hine
UV
Ink
Rac
k
Doo
r
Letter Press Machine 1
Letter Press Machine 2
Letter Press Machine 3
Sem
i Slit
ting
Mac
hine
Figu
re 5
: C
urre
nt la
yout
in la
belli
ng se
ctio
n.
Single Minute Exchange Die Approach 48
Start
End
Receive customer order
Setup film
Printing
Order die cut mould
Order stickers Receive stickers
Receive die cut mold
Code die cut mould
Make printing film
Use previous film
Stickers available?
Is this a new order?
Enough quantity?
No
Yes
No
Yes
Yes
Yes
No
Issue material note
Die cut mould available?
Place sticker on pallet
Schedule the job
Clean the workstation
Setup sticker, die cut mold, ink
Place sticker on drying rack
Send sticker for packaging
Pack the sticker
Place sticker on pallet
Deliver to customer
No
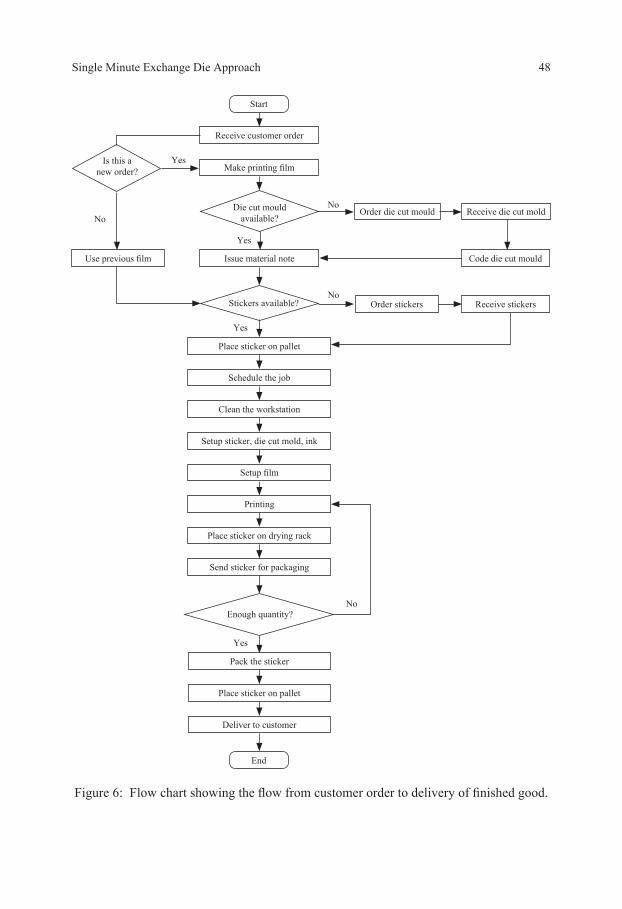
Figure 6: Flow chart showing the flow from customer order to delivery of finished good.

Journal of Engineering Science, Vol. 16(2), 35–56, 2020 49
3.2 Phase II: Data Analysis and Problem Identification
This phase is concerned with interpreting the results from data collection and developing more detailed on the process operates and identified the problem from the data analysis. Based on the following Figure 7, the current production output is approximately 50% of the actual production capabilities of the letter press machine and the intermittent machine. The current production output is calculated based on the average impression/h of each machine for the year 2011. This Figure 7 shows that the label printing section is only printing at the rate of half its capabilities, which means that the printing machine is idling half of the time instead of printing. Machine idling is due to the time taken for setup.
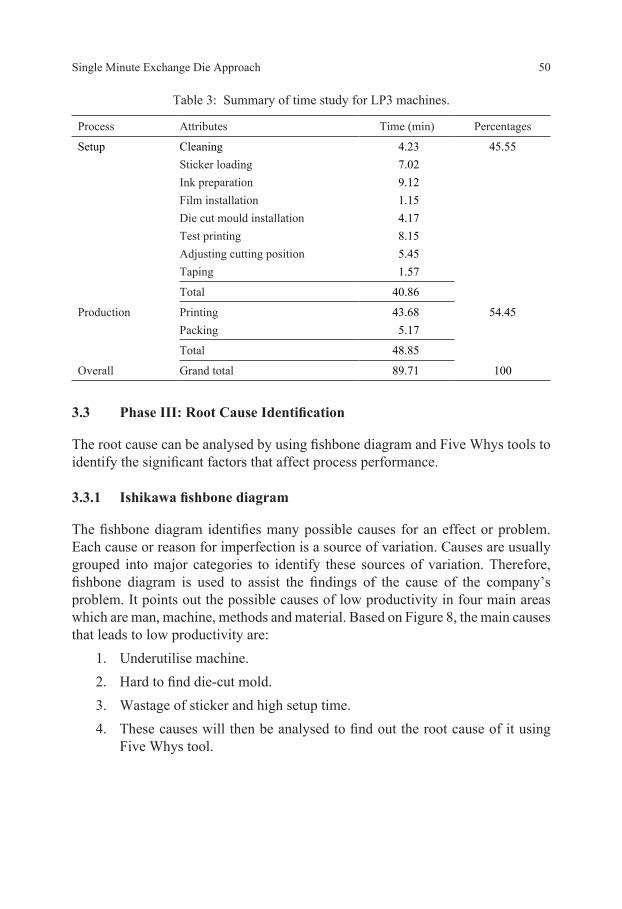
The summary of the process mapping in Table 3 shows that the time taken for the setup process is around 40.86 min per job order. This means that on average for a job order which requires 40.86 min for setup only needs another 48.85 min to finish job order. This clearly shows that low productivity is the main problem in the label printing section.
Actual production capabilities
Current production output
SANKI
Machines
SRLP3LP2LP1
6,000
5,000
4,000
3,000
2,000
1,000
0
Impr
essi
ons/
h
Figure 7: Comparison between actual and current output capacities of line printing (LP).
Single Minute Exchange Die Approach 50
Table 3: Summary of time study for LP3 machines.
Process Attributes Time (min) Percentages
Setup Cleaning 4.23 45.55Sticker loading 7.02Ink preparation 9.12Film installation 1.15Die cut mould installation 4.17Test printing 8.15Adjusting cutting position 5.45Taping 1.57
Total 40.86
Production Printing 43.68 54.45Packing 5.17
Total 48.85
Overall Grand total 89.71 100
3.3 Phase III: Root Cause Identification
The root cause can be analysed by using fishbone diagram and Five Whys tools to identify the significant factors that affect process performance.
3.3.1 Ishikawa fishbone diagram
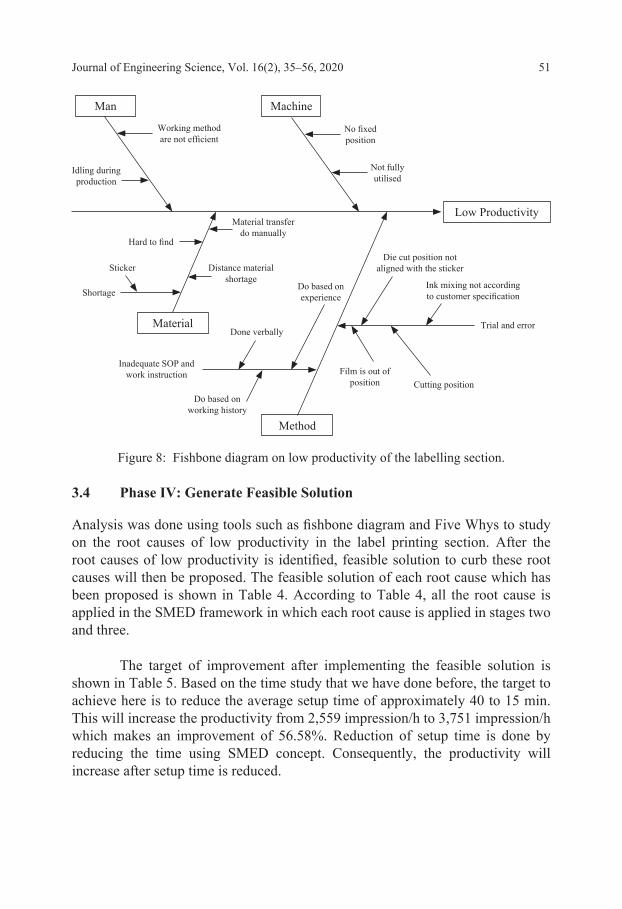
The fishbone diagram identifies many possible causes for an effect or problem. Each cause or reason for imperfection is a source of variation. Causes are usually grouped into major categories to identify these sources of variation. Therefore, fishbone diagram is used to assist the findings of the cause of the company’s problem. It points out the possible causes of low productivity in four main areas which are man, machine, methods and material. Based on Figure 8, the main causes that leads to low productivity are:
1. Underutilise machine.2. Hard to find die-cut mold.3. Wastage of sticker and high setup time.4. These causes will then be analysed to find out the root cause of it using
Five Whys tool.
Journal of Engineering Science, Vol. 16(2), 35–56, 2020 51
No fixed position
Working method are not efficient
Ink mixing not according to customer specification
Trial and error
Do based on working history
Do based on experience
Done verbally
Shortage
Film is out of position Cutting position
Die cut position not aligned with the stickerDistance material
shortage
Inadequate SOP and work instruction
Hard to find
Material transfer do manually
Idling during production
Machine
Method
Material
Low Productivity
Man
Not fully utilised
Sticker
Figure 8: Fishbone diagram on low productivity of the labelling section.
3.4 Phase IV: Generate Feasible Solution
Analysis was done using tools such as fishbone diagram and Five Whys to study on the root causes of low productivity in the label printing section. After the root causes of low productivity is identified, feasible solution to curb these root causes will then be proposed. The feasible solution of each root cause which has been proposed is shown in Table 4. According to Table 4, all the root cause is applied in the SMED framework in which each root cause is applied in stages two and three.
The target of improvement after implementing the feasible solution is shown in Table 5. Based on the time study that we have done before, the target to achieve here is to reduce the average setup time of approximately 40 to 15 min. This will increase the productivity from 2,559 impression/h to 3,751 impression/h which makes an improvement of 56.58%. Reduction of setup time is done by reducing the time using SMED concept. Consequently, the productivity will increase after setup time is reduced.

Single Minute Exchange Die Approach 52
Table 4: The root cause of low productivity and the feasible solution to curb the root cause.
Root cause Feasible solution
Setup is internal of production Converting internal setup onto external setup operation.
There is no proper slot to keep the die-cut mold and ink
Design a sustainable and ergonomic rack to keep the die-cut mold and ink so that it is easier to find and keep reducing the time of finding it.
Does not have a proper SOP for setup
Reducing the current time for setup by making a proper SOP for setup so that the operator will do things right the first time.
Table 5: The project goal’s after applying the feasible solution on each letter press machine in labelling section.
Attributes Current Target
Actual production capabilities (impression/h) 5,142 5,142
Current production output (impression/h) 2,559 3,751
Average setup time (min/job order) 40.86 15
Average production time (min/job order) 40.47 40.47
Percentage of improvement (impression/h) – 46.58 %
3.5 Phase V: SMED Concept to Reduce Setup Time
SMED should be implemented into four different stages as discusses in the previous section.25
The internal and external setup operations are not distinguished in this stage. The analysis of the current setup in labelling section is doing by interviewing operators and supervisor, observing and recording. The results obtained in this phase are important for subsequent assessment of the impact of the feasible solutions. Thus, the purpose of this analysis was to collect all the information possible regarding the setup, such as the setup activities involves on labelling section, the timing of the setup activities, the sequence of tools, raw material and finish goods in labelling section.
Journal of Engineering Science, Vol. 16(2), 35–56, 2020 53
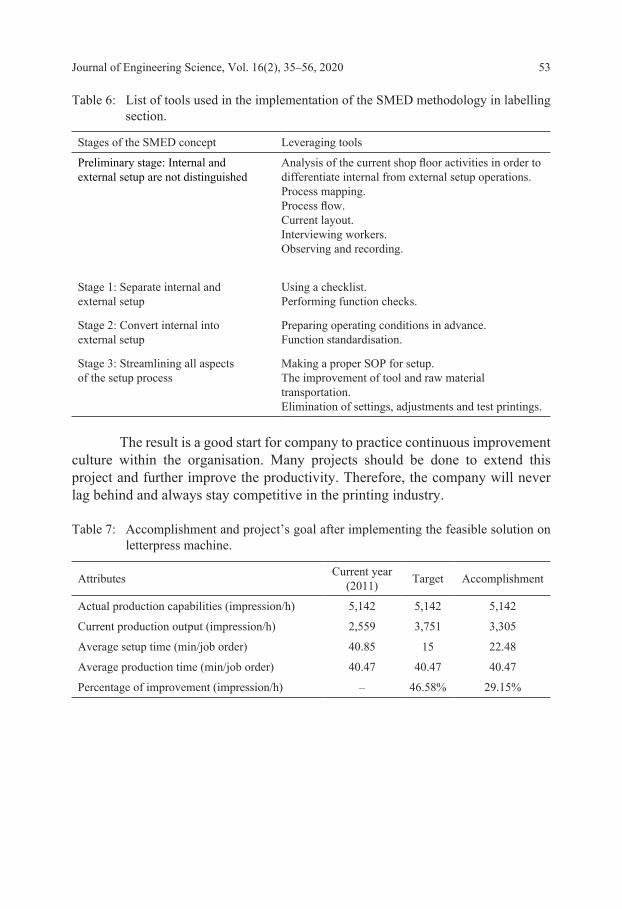
Table 6: List of tools used in the implementation of the SMED methodology in labelling section.
Stages of the SMED concept Leveraging tools
Preliminary stage: Internal and external setup are not distinguished
Analysis of the current shop floor activities in order to differentiate internal from external setup operations.Process mapping.Process flow.Current layout.Interviewing workers.Observing and recording.
Stage 1: Separate internal and external setup
Using a checklist.Performing function checks.
Stage 2: Convert internal into external setup
Preparing operating conditions in advance.Function standardisation.
Stage 3: Streamlining all aspects of the setup process
Making a proper SOP for setup.The improvement of tool and raw material transportation.Elimination of settings, adjustments and test printings.
The result is a good start for company to practice continuous improvement culture within the organisation. Many projects should be done to extend this project and further improve the productivity. Therefore, the company will never lag behind and always stay competitive in the printing industry.
Table 7: Accomplishment and project’s goal after implementing the feasible solution on letterpress machine.
Attributes Current year (2011) Target Accomplishment
Actual production capabilities (impression/h) 5,142 5,142 5,142
Current production output (impression/h) 2,559 3,751 3,305
Average setup time (min/job order) 40.85 15 22.48
Average production time (min/job order) 40.47 40.47 40.47
Percentage of improvement (impression/h) – 46.58% 29.15%
Single Minute Exchange Die Approach 54
4. CONCLUSION
Through this case study, the main problem is high setup time. The higher setup time, lead to low productivity in labelling section. Thus a methodology flow is developed in order to solve this problem. There are five phases in the methodology flow. Each phase has its own objective to be achieved. Phase I is data collection in which the first step need to be done in order to identify a problem in Phase II after make some analysis. Afterwards, root cause analysis of the main problem has been done in Phase III to generate feasible solution. In the Phase IV, the SMED concept is applied in which consist of four stages. The main purpose of using SMED is to segregate the internal and external setup operations.
The improvement evidence as shown in previous result of applying SMED concept in labelling section. The improvement of the productivity is 29.15%. Actually, the company’s goal is to improve the production output from 2,559 impression/h to 3,200 impression/h but this project is able to achieve better result of 3,305 impression/h. For future work, instead of using SMED in setup operations, SMED also can be use in changeover operation. In the changeover operation, the same concept of practicing SMED can be applied to overcome the problem in changeover operations. Hence, jig and fixture can be developed further in order to overcome the problem involving changeover operations. Thus, this will lead to the reduction of lead time and improve the lean manufacturing in the whole manufacturing operations.
5. REFERENCES
1. Hendry, L. C. (1998). Applying world class manufacturing make-to-order companies: problems and solutions. Int. J. Oper. Prod. Manag., 18(11), 1086–100, https://doi.org/10.1108/01443579810231679.
2. Allahverdi, A. & Soroush, H. M. (2008). The significance of reducing setup times/setup costs. European Journal of Operational Research, 187(3), 978–984, https://doi.org/10.1016/j.ejor.2006.09.010
3. Moreira, A. C. & Pais, G. C. S. (2011). Single minute exchange of die: A case study implementation. J. Technol. Manag. Innov., 6(1), 129–146, https://doi.org/10.4067/s0718-27242011000100011.
4. Abdulmalek, F. A. & Rajgopal, J. (2007). Analyzing the benefits of lean manufacturing and value stream mapping via simulation: A process sector case study. Int. J. Prod. Econ., 107(1), 223–236, https://doi.org/10.1016/ j.ijpe.2006.09.009.

Journal of Engineering Science, Vol. 16(2), 35–56, 2020 55
5. Monden, Y. (1998). Toyota production system: An integrated approach to just-in-time. 3rd Ed. Norcross, Georgia: Engineering and Management Press.
6. Feld, W. M. (2000). Lean manufacturing: Tools, techniques and how to use them. London: The St. Lucie Press.
7. Nahmias, S. (2001). Production and operation analysis. 4th Ed. New York: McGraw Hill.
8. Karlsson, C. & Ahlstrom, P. (1996). Assessing changes towards lean production. Int. J. Oper. Prod. Manag., 16(2), 24–41, https://doi.org/10 .1108/01443579610109820.
9. Ferdousi, F. (2009). An investigation of manufacturing performance improvement through lean production: A study on Bangladeshi garment firms. International Journal of Business and Management, 4(9), 106–116, https://doi.org/10.5539/ijbm.v4n9p106.
10. Dumaine, B. (1989). How managers can succeed through speed. Fortune, 13 February, 54–59.
11. Hammond, J. H. (1990). Quick response in the apparel industry. Harvard Business School background note 690–038, February. Boston, MA: Harvard Business School.
12. Lederer, P. J. & Li, L. (1993). Pricing, production and scheduling decisions. Simon School working paper. Burnaby, Canada: Simon Fraser University.
13. Barot, R. S., Beravala, H. S. & Patel, B. S. (2011). Reducing set-up times: A foundation for lean manufacturing. In National conference on recent trends in engineering and techology. Gujarat: BVM Engineering College.
14. Lederer, P. J. & Rhee, S. K. (1996). Considering agency costs. Simon School working paper. Burnaby, Canada: Simon Fraser University.
15. Dillon, A. P. & Shingo, S. (1985). A revolution in manufacturing: The SMED system. Insert Cleveland, OH: CRC Press.
16. Herrmann, J. W. & Chincholkar, M. M. (2001). Reducing throughput time during product design. J. Manuf. Syst., 20(6), 416–428, https://doi .org/10.1016/S0278-6125(01)80061-3.
17. Karmarkar, U. S. (1983). Lot sizes, lead times and in-process inventories. Manage. Sci., 33(3), 409– 419, https://doi.org/10.1287/mnsc.33.3.409.
18. Van Goubergen, D. & Van Landeghem, H. (2002). Rules for integrating fast changeover capabilities into new equipment design. Robot. Comput. Integr. Manuf., 18(3/4), 205–214, https://doi.org/10.1016/s0736 -5845(02)00011-x.
19. Ulutas, B. (2011). An application of SMED methodology. International Journal of Mechanical, Aerospace, Industrial, Mechatronic and Manufacturing Engineering, 5(7), 1194–1197.
Single Minute Exchange Die Approach 56
20. Cakmakci, M. (2009). Process improvement: Performance analysis of the setup time reduction: SMED in the automobile industry. Int. J. Adv. Manuf. Technol., 41(1–2), 168–179, https://doi.org/10.1007/s00170-008 -1434-4.
21. Pannesei, R. T. (1995). Lead time competitiveness on make-to-order manufacturing firm. IJPR, 3(6), 150–163.
22. Van Goubergen, D. (2000). Set-up reduction as an organization-wide problem. In Proceedings of solutions 2000 conference. Norcross, GA: Institute of Industrial Engineers.
23. Shingo, S. (1985). The SMED system “videotape”. Portland, Oregon: Productivity Press Inc.
24. Nakajima, S. (1988). Introduction to TPM. Portland, Oregon: Productivity Press Inc.